Preprint
Article

Identification of molecular diagnostic markers in sepsis-induced acute lung injury

Altmetrics

Downloads

142

Views

58

Comments

0

Submitted:

21 July 2023

Posted:

01 August 2023

You are already at the latest version

Alerts
Abstract
Background: Sepsis-induced acute lung injury (ALI) is characterized by disruption of the epithelial barrier and activation of alveolar macrophages (AMs), which leads to uncontrolled pulmonary inflammation. However, effective treatments for ALI are unavailable. This study aimed to discover potential diagnostic molecular biomarkers based on bioinformatics, which will benefit the diagnosis and treatment of sepsis-induced ALI. Methods: GSE10474 was analyzed for differentially expressed genes (DEGs) in sepsis patients with ALI (sepsis + ALI) compared with sepsis patients without ALI. Functional enrichment analysis and protein-protein interaction (PPI) network were performed. on the DEGs via R package “clusterProfiler”, and visualized via Cytoscape. Prediction analysis of microarrays (PAM) was performed to identify diagnostic biomarkers and the diagnostic ability of diagnostic biomarkers was accessed via receiver operating characteristic (ROC) curves. Moreover, interactions among diagnostic biomarkers were analyzed via GeneMANIA. We also analyzed the function of diagnostic biomarkers and predicted their corresponding drugs via Cytoscape plugin BiNGO and web tool DGIdb. At last, we analyzed the transcriptional regulation of the diagnostic biomarkers via the web tool miRNet. Results: 71 genes were found to be differentially expressed in the sepsis + ALI group, mainly involved in immune-related biological processes and pathways. STRING database indicated 31 DEGs have protein-protein interactions. In addition, the PAM identified 6 diagnostic biomarkers, including HIST1H4H, CDKN1A, HMOX1, NQO2, RHOB, and TREM1, from these 31 DEGs. Conclusion: In conclusion, through bioinformatics analyses, we identified 6 potential diagnostic biomarkers and targets for sepsis-induced ALI.
Keywords: 
Subject: Medicine and Pharmacology  -   Emergency Medicine

1. Introduction

Looking back over the past few decades, sepsis, one of the most studied acute and critical diseases has been defined as a life-threatening organ dysfunction caused by systemic inflammation and dysregulation of the host's immune response to infection[1]. To date, although progress has been made in the understanding and management of clinical sepsis, its morbidity and mortality remain high. Has been one of the leading causes of death in hospitals[2]. Sepsis-induced injury, shock, and multiple organ dysfunction remain the leading causes of death in patients with sepsis and are necessary to understand the pathogenesis of COVID-19 virus sepsis[3]. The lungs are particularly vulnerable to damage during sepsis, 50% of the time. The main risk factor for acute lung injury in patients is attributed to sepsis[4]. From the molecular basis of pathogenicity and host response, the continuous exploration of the mechanism and pathogenic factors of sepsis-induced lung injury, and a large number of research results have guided new definitions and new treatment methods[5,6].
ALI and acute respiratory distress syndrome (ARDS) are common complications leading to acute lung failure, sepsis, and death worldwide, with high morbidity and mortality[7]. Macrophages recruited and activated by lipopolysaccharide (LPS) and existing alveolar macrophages can release proinflammatory cytokines, induce neutrophil infiltration, further aggravate inflammation, endothelial barrier destruction, pulmonary microcirculation obstruction, and aggravate lung injury, leading to high mortality in patients with sepsis-induced lung injury[8]. As an epidemic disease worldwide, it can lead to acute lung failure, pneumonia, interstitial edema, sepsis, and death[9]. At present, there is no specific treatment process or accurate clinical diagnostic indicators for acute lung injury. It is very difficult to diagnose and treat acute lung injury in clinical practice, which greatly endangers the clinical treatment prognosis and life safety of patients.
This study attempted to use bioinformatics analysis to improve the clinical diagnostic criteria of sepsis patients with ALI. Since the lung is an organ at the highest risk for sepsis involvement, we used gene expression analysis to identify differential genes for ARDS/ALI in a cohort of patients with sepsis. We classified patients as sepsis or sepsis-induced ALI based on whether they had sepsis-induced lung injury, and compared gene expression profiles in each group to identify unique gene molecules that could distinguish the two groups. We use bioinformatics analysis, trying to distinguish based on the differences of gene expression of lung injury caused by sepsis patients and the study of pure sepsis patients search for genetic markers of lung injury caused by sepsis, expect to extract the lung injury induced by sepsis clinical markers, help in the clinical diagnosis of sepsis lung injury and further research in the future.

2. Materials and methods

2.1. Data acquisition

Microarray data of the GSE10474 dataset based on platform GPL571 (Affymetrix Human Genome U133A 2.0 Array) was downloaded from the Gene expression Omnibus (GEO) database (https://www.ncbi.nlm.nih.gov/geo/)[10], which contained expression profiles of peripheral whole blood from 21 patients with sepsis alone and 13 sepsis patients accompanied with ALI (sepsis + ALI) [11], thus, we divided all samples into sepsis (21 samples) and sepsis +ALI (13 samples) groups.
Ethical information approved by the Ethics Committee of Xinhua Hospital Affiliated to Shanghai Jiao Tong University School of Medicine (Approval No. XHEC-D-2023-138).

2.2. Identification of differentially expressed genes (DEGs)

The R package “limma”[12] was used to screen out DEGs between sepsis and sepsis + ALI samples in the GSE10474 dataset, and P-value < 0.05 and |log2 (fold change)| > 1 were defined as the threshold for DEGs screening. The expression of the DEGs was visualized by a volcano map and heat map.

2.3. Functional enrichment analysis

Gene Ontology (GO) and Kyoto Encyclopedia of Genes and Genomes (KEGG) pathway enrichment analyses were performed by using the R package “ClusterProfiler” [13] to reveal the underlying biological processes (BP), molecular functions (MF), cellular components (CC), and signaling pathways related to DEGs. The enrichment results were considered statistically significant if the p-adjust value < 0.05. The top 10 GO terms and KEGG pathways were visualized with the R package “ggplot2”.

2.4. Protein-protein interaction (PPI) analysis

The Search Tool for the Retrieval of Interacting Genes (STRING) (http://www.string-db.org/) database was used to investigate the interactions of DEGs, a combined score > 0.4 was set as the cut-off value. Cytoscape was used to visualize the protein-protein interaction (PPI) network[14].

2.5. Identification and assessment of the diagnostic biomarkers

Prediction analysis of microarrays (PAM) was performed to identify diagnostic biomarkers via the R package “pamr”. PAM is a statistical technique for class prediction from gene expression data using the nearest shrunken centroids [15]. This method identifies subsets of genes that best characterize each class. Samples in the GSE10474 dataset were randomly divided into a training set and a testing set (7:3, greater than 0.5 taken as 1 sample), which included 24 and 10 samples, respectively. PAM was performed in the training dataset to get the diagnostic biomarkers.
To validate the performance of the diagnostic biomarkers, Wilcoxon rank-sum test was used to analyze the expression level of diagnostic biomarkers between the sepsis and sepsis + ALI samples in the GSE10474 dataset. A p-value < 0.05 is statistically significant. Furthermore, the diagnostic biomarkers were selected for logistic regression analysis in the training and testing set, respectively. The receiver operating characteristic (ROC) curves of the logistic regression models were plotted using the R package “pROC”, the area under the curve (AUC) was calculated to measure the predictive ability of the diagnostic biomarkers.

2.6. Single-gene gene set enrichment analysis (GSEA)

The samples from the training set were sorted by the expression level of each diagnostic biomarker, respectively. Then, GSEA was conducted to detect the potential biological functions and signaling pathways of each gene set. Briefly, in the “GSE10474” dataset, the spearman correlation coefficients between the average expression level of a diagnostic biomarker from the PAM analysis and the average expression level of every other gene in the “GSE10474” dataset were calculated, then a GSEA was performed on the genes which have a good correlation with the diagnostic biomarker to identify the enriched ontology (GO) biological processes and Kyoto Encyclopedia of Genes and Genomes (KEGG) pathways. The R package “cluster profile” and genome-wide annotation for the human package “org.Hs.eg.DB” were used to conduct the single-gene GSEA[16]. A p-adjust value < 0.05 was considered statistically significant.

2.7. Gene interaction and gene function analysis

GeneMANIA (http://www.genemania.org) is a web tool that provides information on physical interactions, pathways, co-expression, colocalization, and shared protein domain similarity of submitted genes [17]. We generated an interaction network using GeneMANIA to analyze the interaction links between the diagnostic biomarkers, including co-expressions, physical interactions, and co-localizations. The Biological Networks Gene Ontology tool (BiNGO) is a Cytoscape plugin to determine which Gene Ontology (GO) terms are significantly overrepresented in a set of genes [18]. We performed GO enrichment analysis on the diagnostic biomarkers to predict their potential role in sepsis + ALI. A p-value < 0.05 was considered statistically significant.

2.8. Drug prediction

Potential targeting drugs of the diagnostic biomarkers were predicted using the Drug Gene Interaction Database (DGIdb, https://dgidb.org).

2.9. Transcriptional regulation analysis

Transcription factors (TFs) and microRNAs (miRNAs) are two key regulators of gene expression. TFs promote or inhibit gene expression by binding to the promoter or enhancer sequence of the DNA. miRNAs can cause gene silencing by binding to 3′ UTR, 5′ UTR, and coding sequence, and can induce transcription by binding to the promoter region [19]. A miRNA-centric network visual analytics platform (miRNet, https://www.mirnet.ca) was used to predict the TFs associated with the diagnostic biomarkers and miRNAs associated with the diagnostic biomarkers and TFs. Then, a gene-TF-miRNA network was constructed using these interactions.

3. Results

3.1. Differentially expressed genes (DEGs) between sepsis and sepsis + ALI

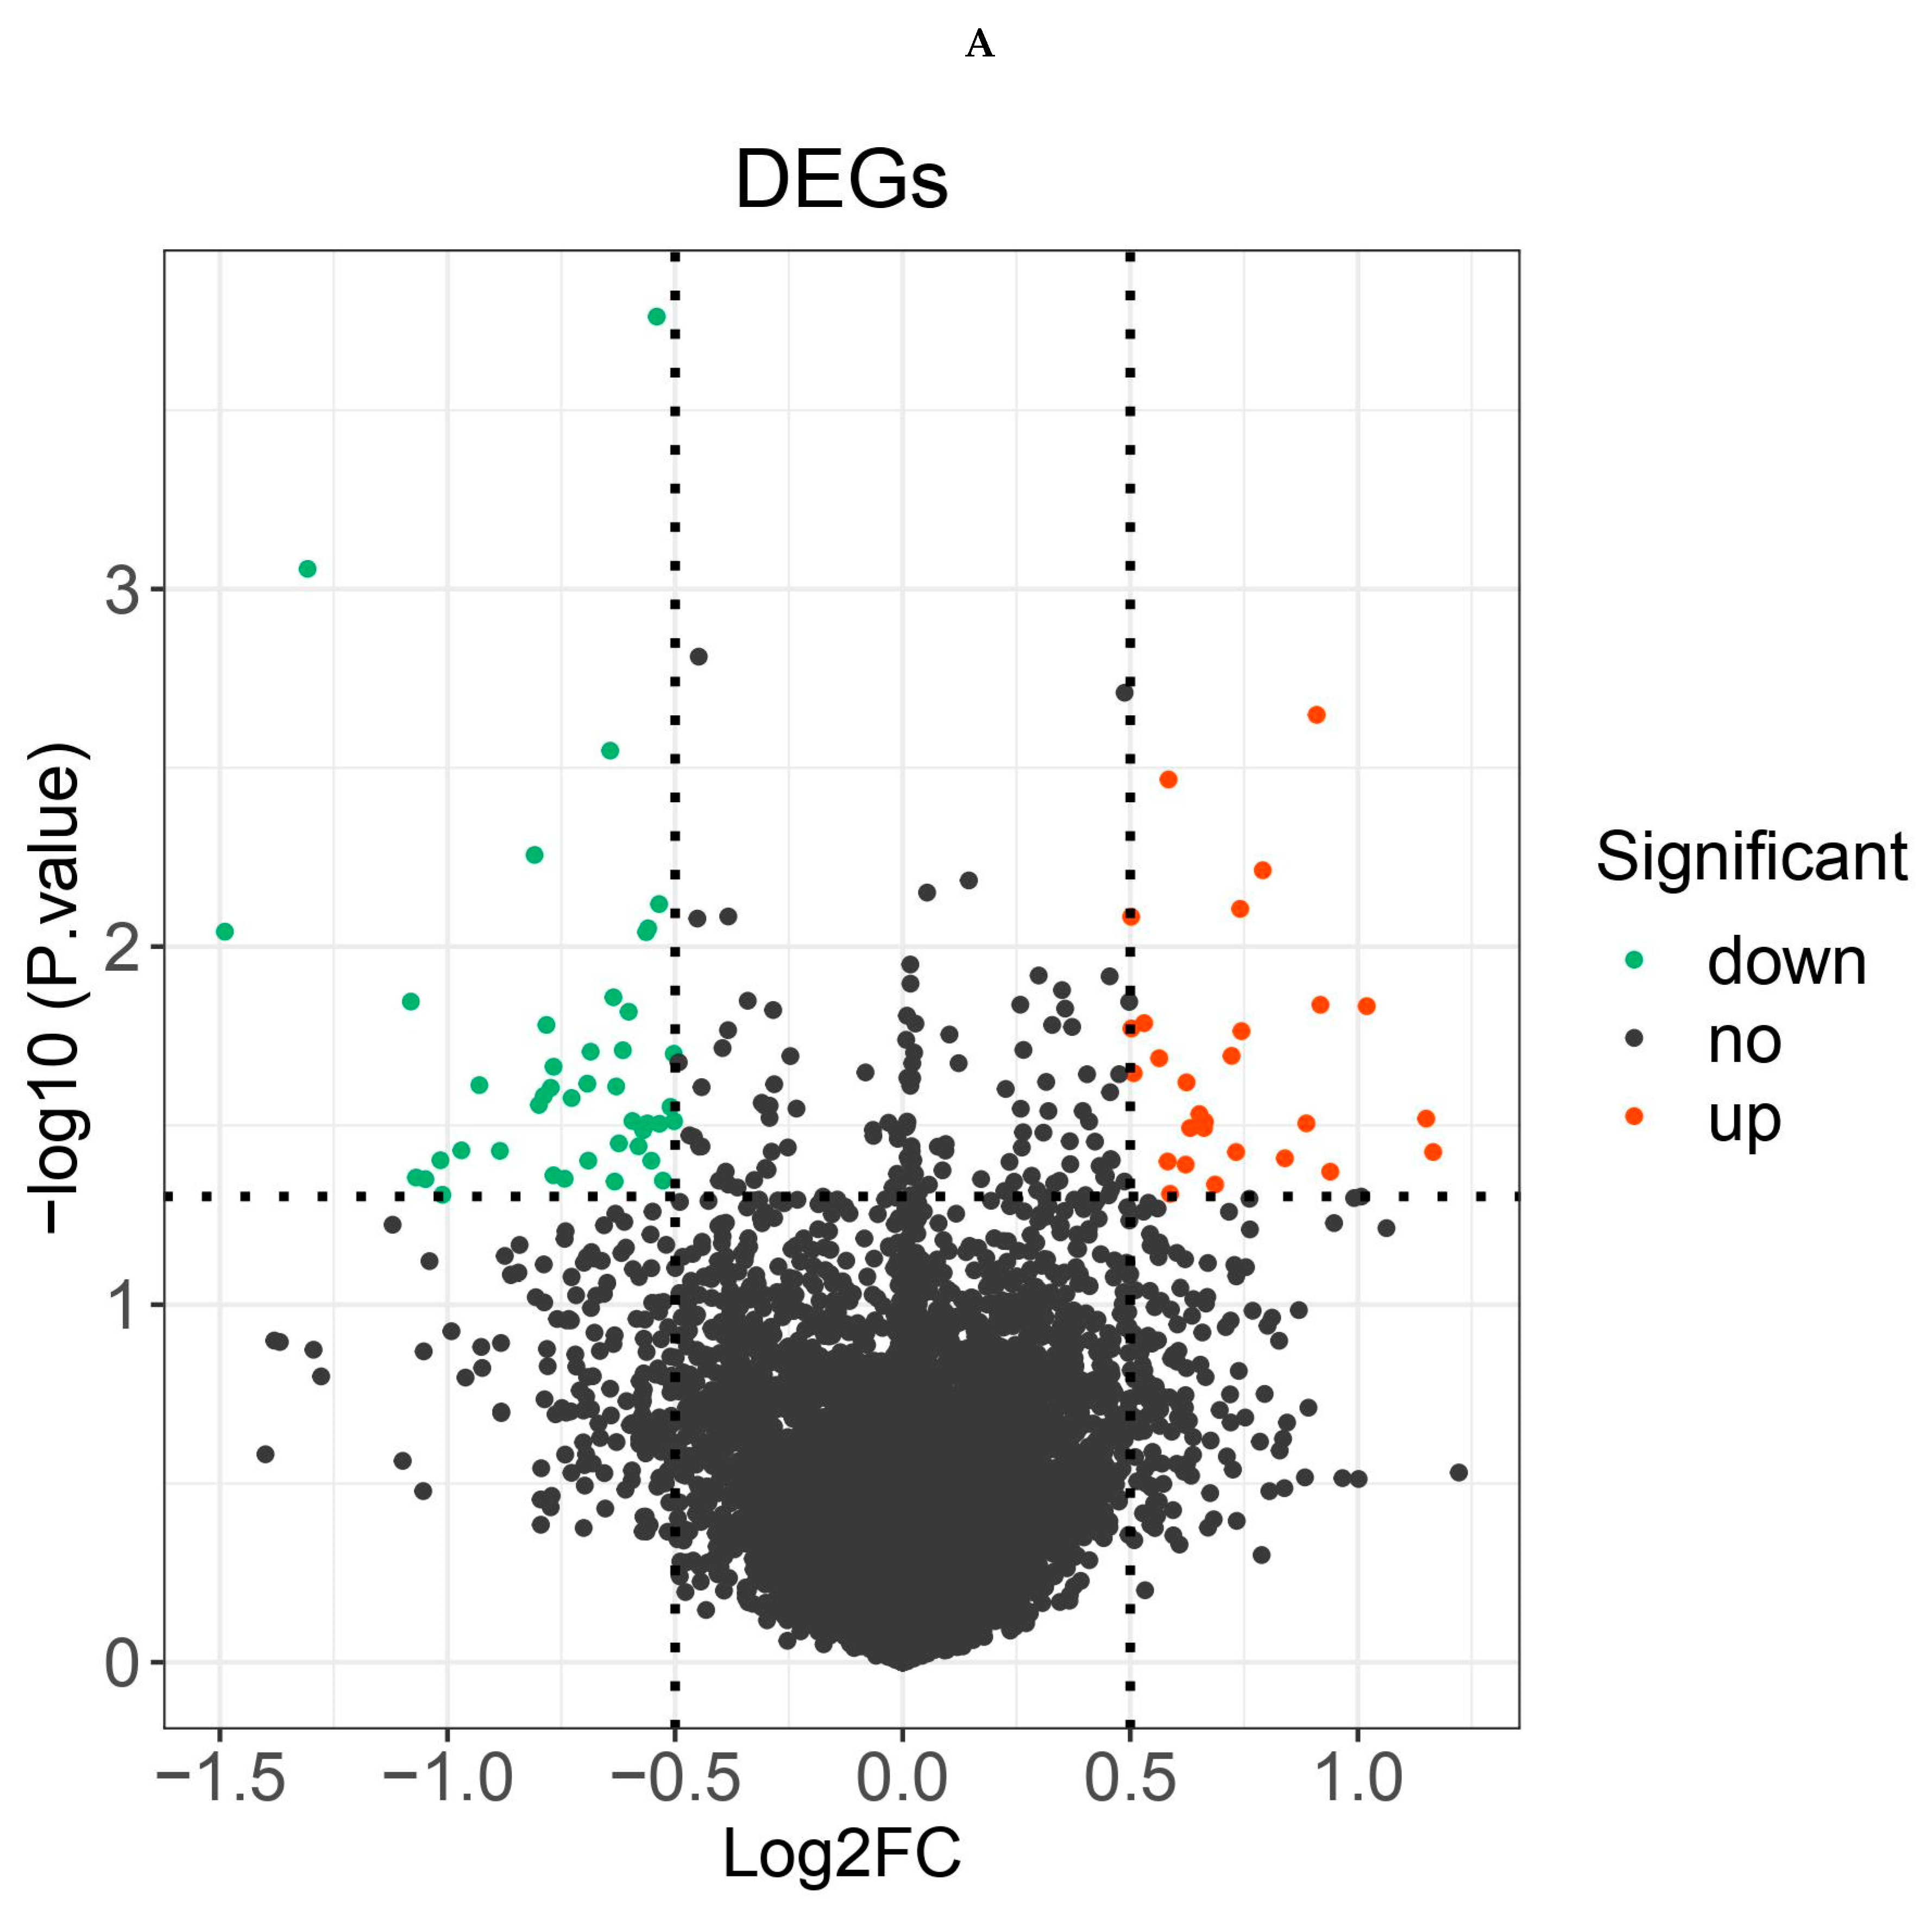
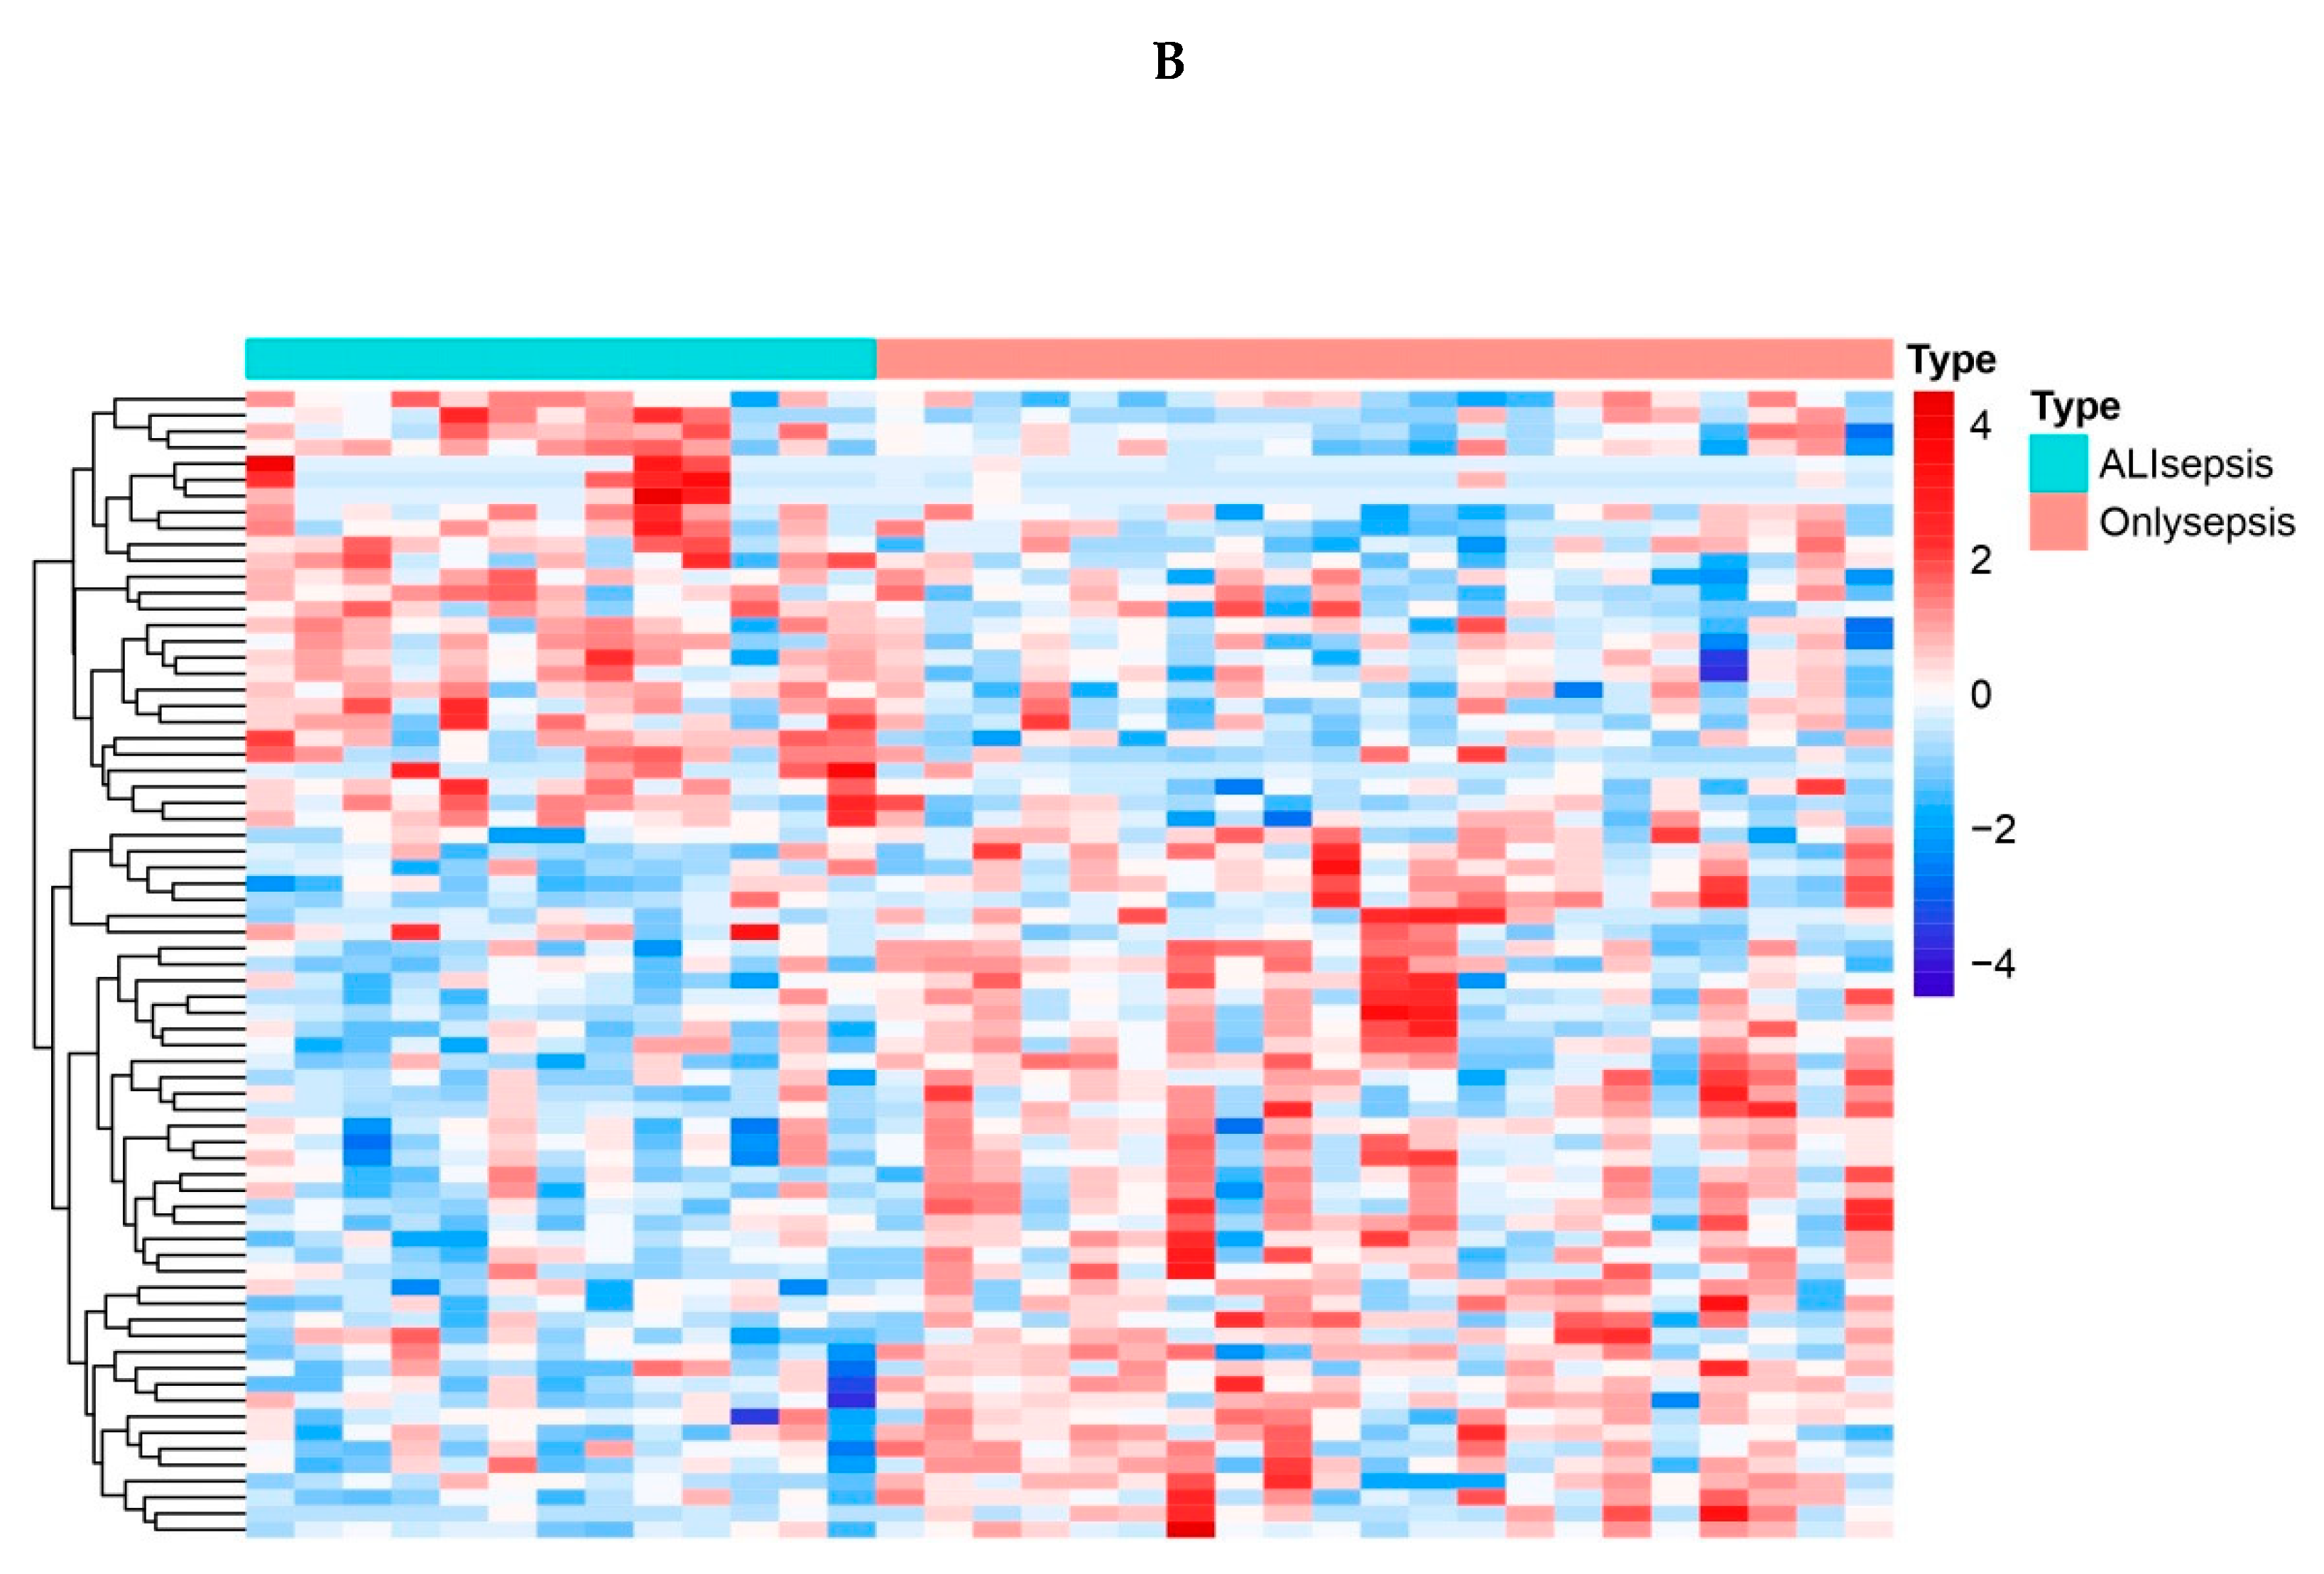
Differential expression analysis was carried out by the R package “limma” to identify differentially expressed genes in the sepsis + ALI group compared with the sepsis group. A total of 71 DEGs were identified, among which 28 genes were up-regulated and 43 genes were down-regulated (Supplementary Table 1). The expression of DEGs was shown in the volcano map (Figure 1A) and heat map (Figure 1B).

3.2. Functional enrichment analysis

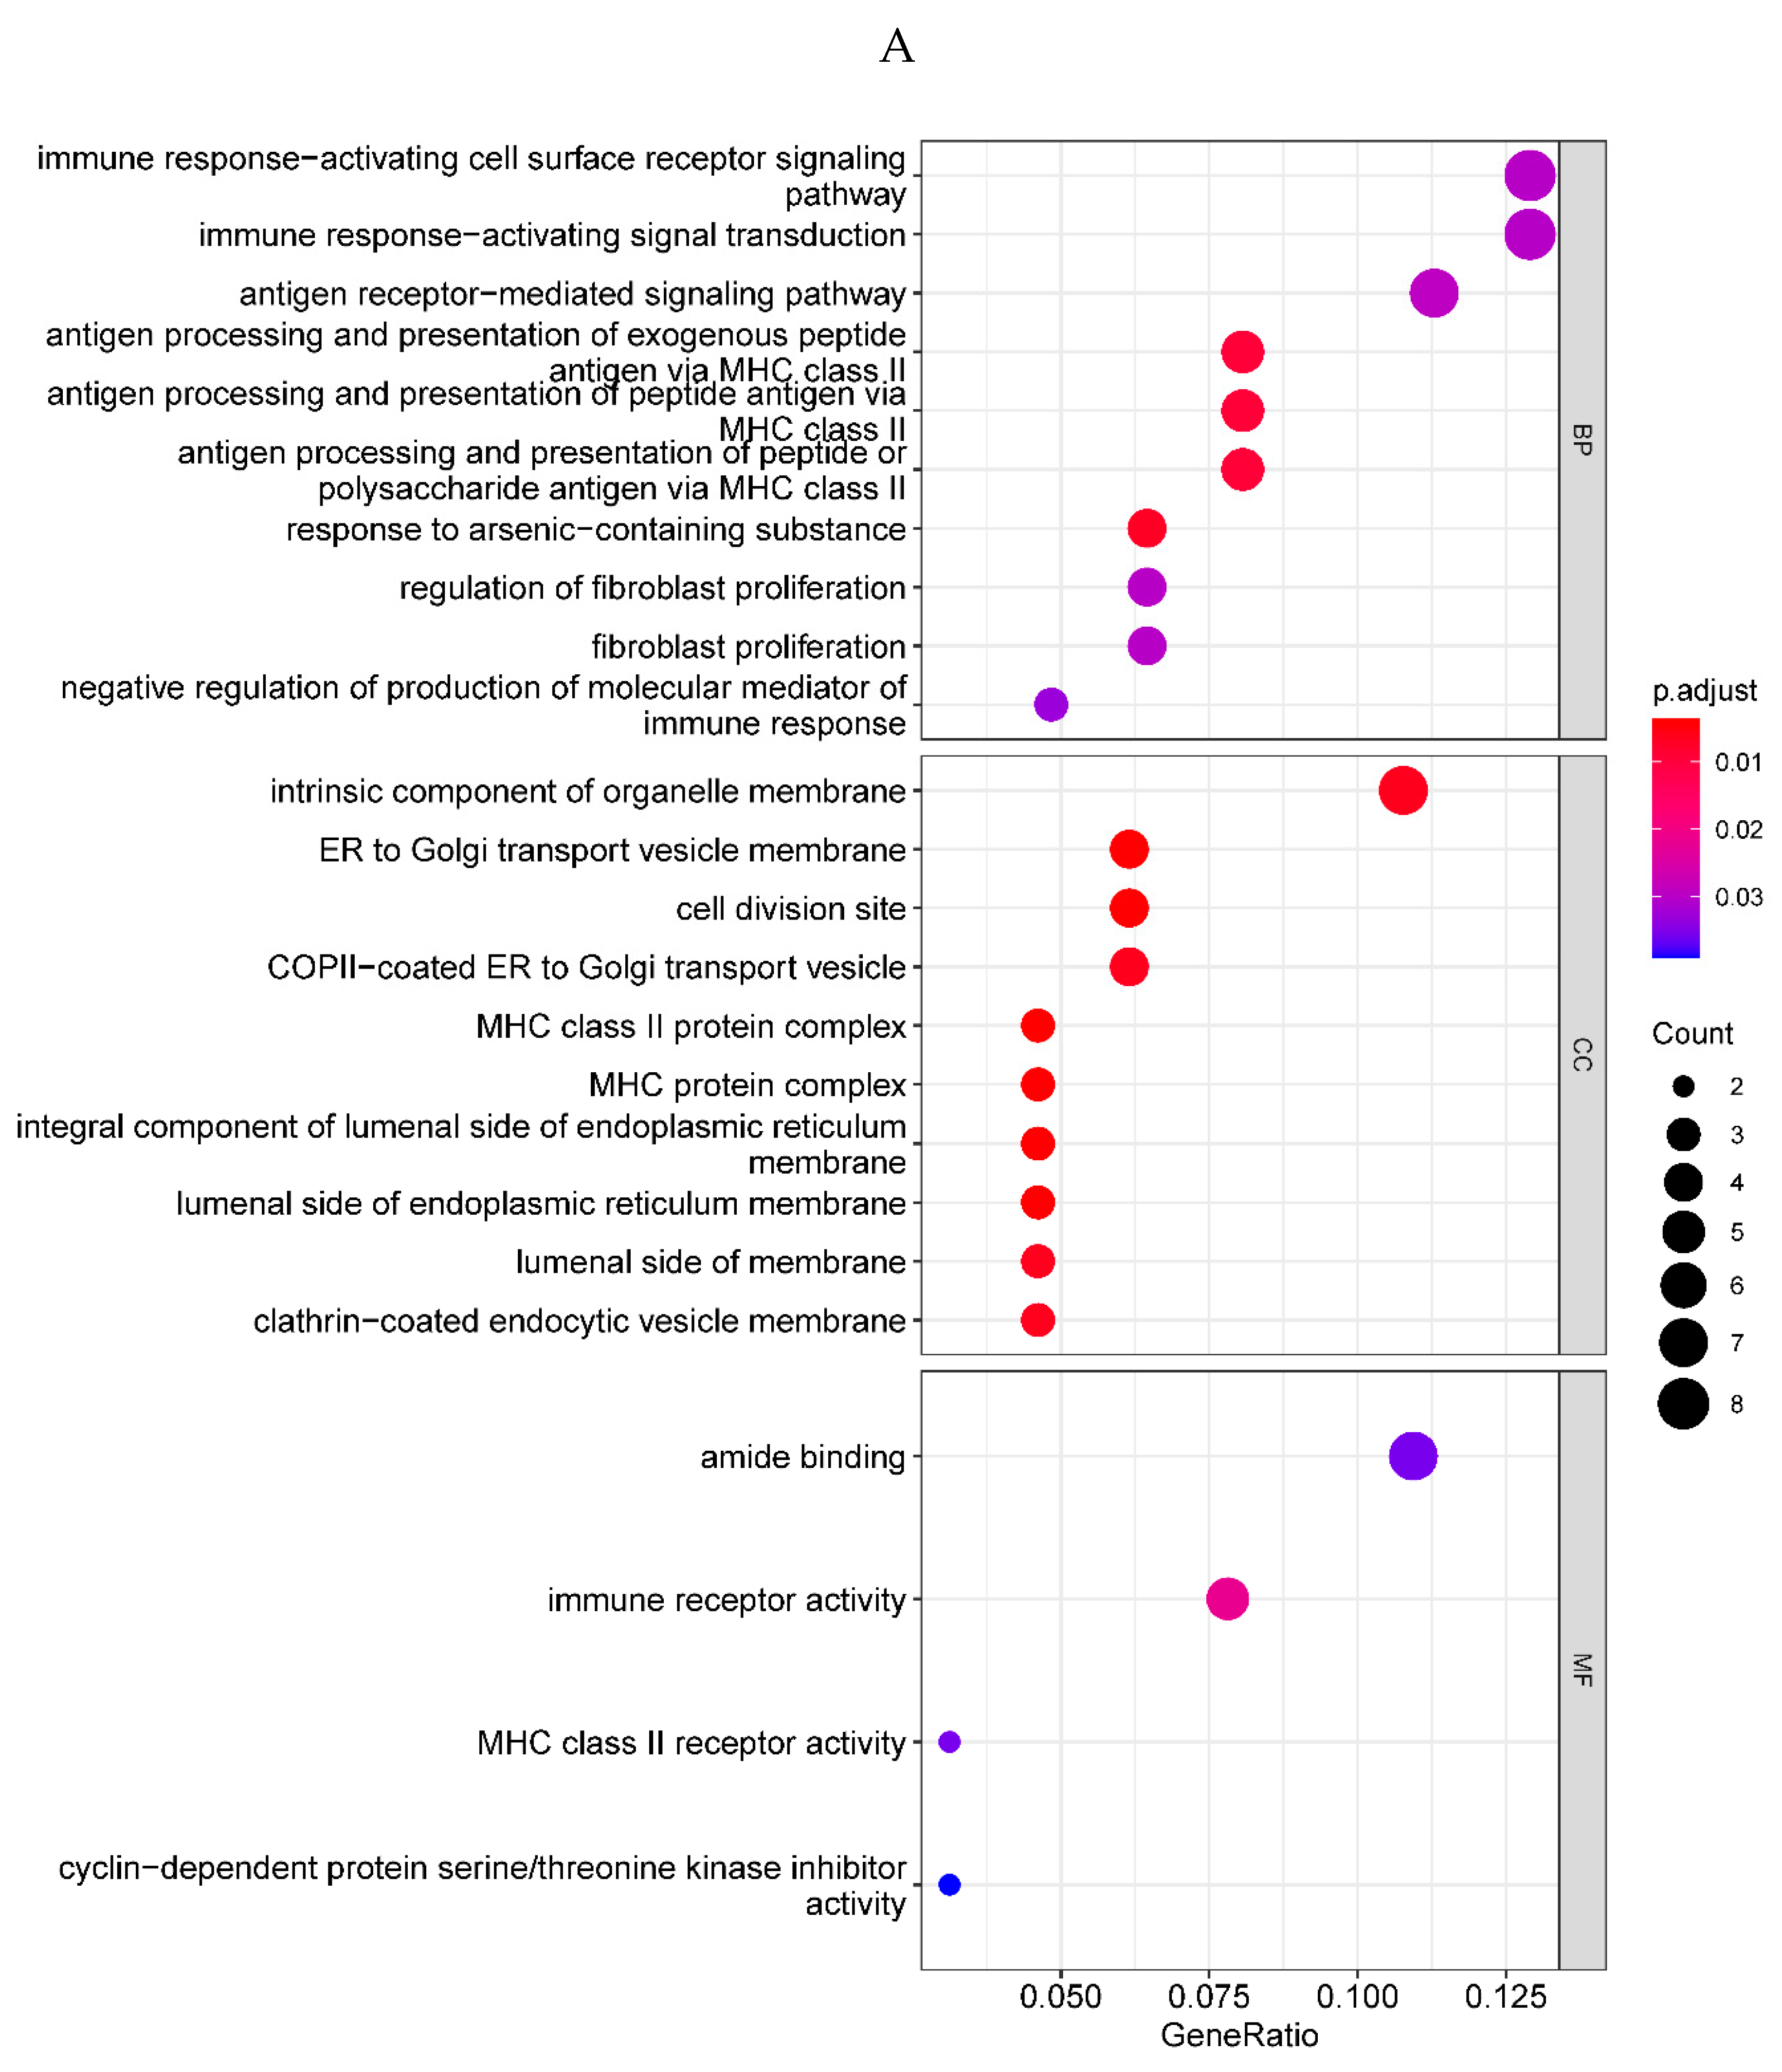
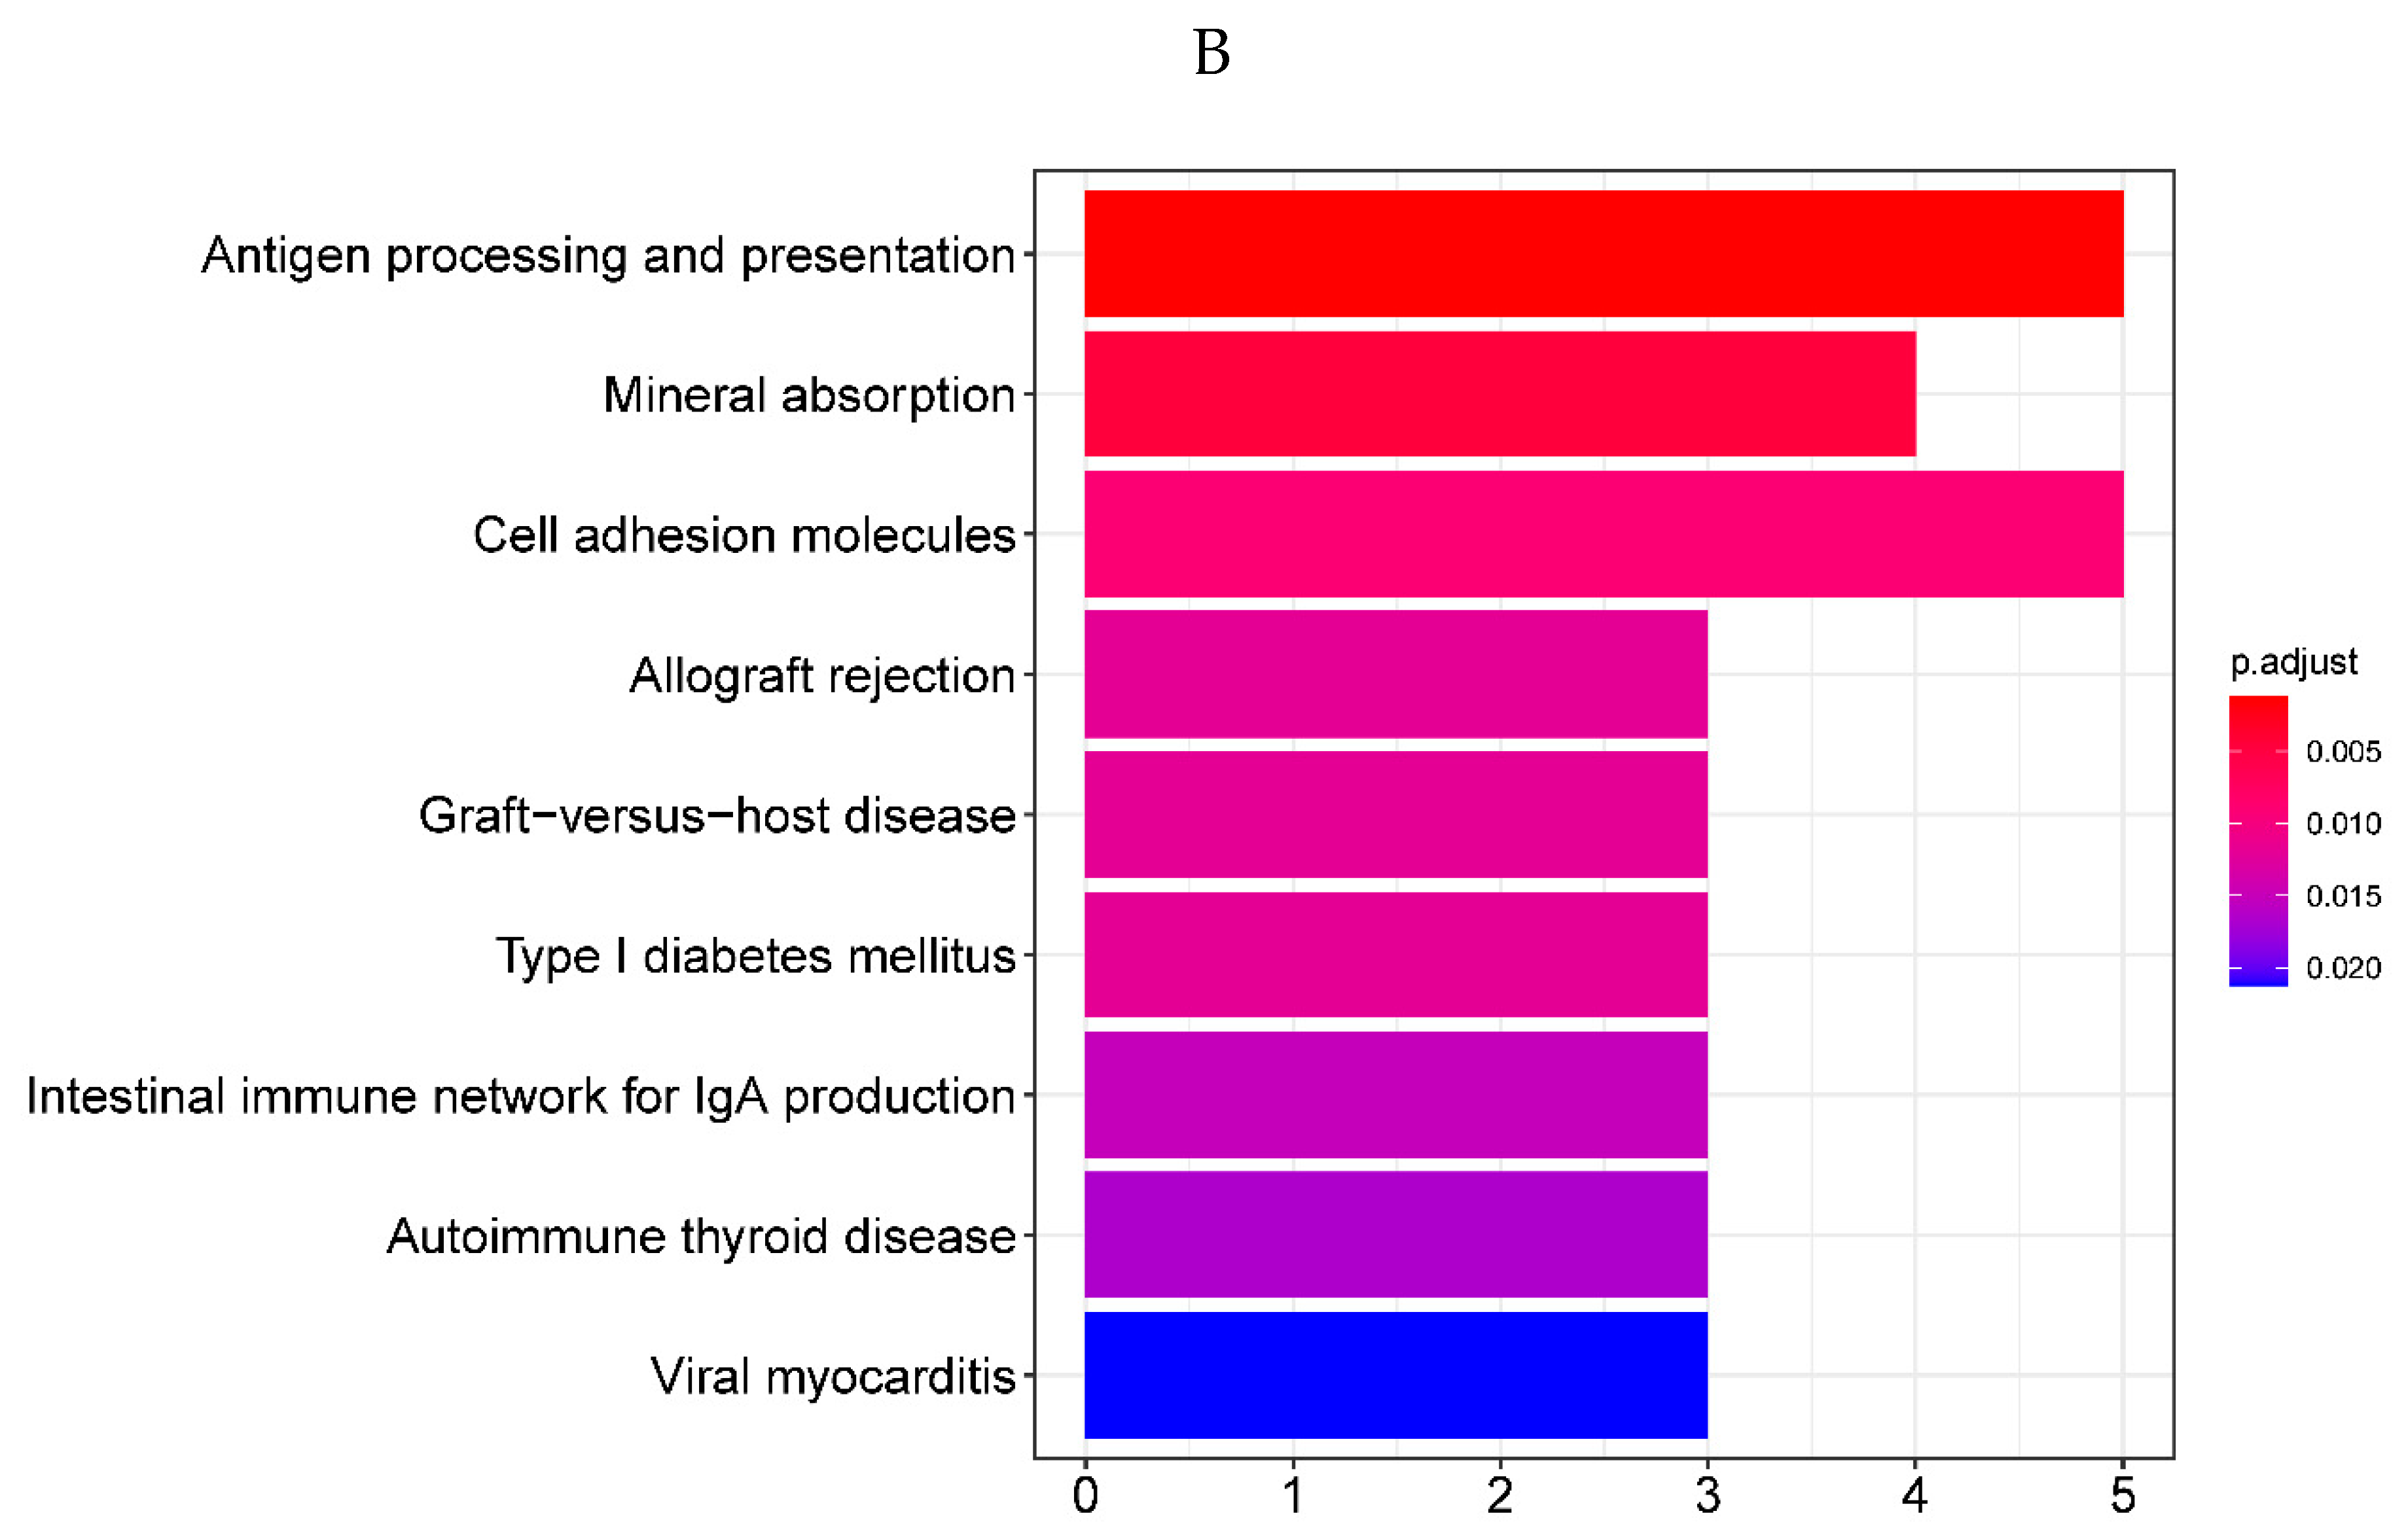
To reveal the underlying mechanism which might contribute to the ALI in sepsis, GO and KEGG enrichment analysis was performed on the 71 DEGs. By setting the p-value < 0.05, we obtained 91 significantly enriched GO terms and 9 significantly enriched KEGG pathways. The GO enrichment analysis revealed that the 71 DEGs were mainly involved in immune response-activating cell surface receptor signaling pathway and immune response-activating signal transduction in biological processes, located in the intrinsic component of organelle membrane in cellular components, and associated with amide binding in molecular functions. The bubble plot of the top 10 GO terms in each field is shown in Figure 2A (Supplementary Table 2). The KEGG pathway enrichment analysis revealed that the 71 DEGs mainly took part in antigen processing and presentation. The bar plot of the 9 significantly enriched KEGG pathways are shown in Figure 2B (Supplementary Table 2).a

3.3. Protein-protein interaction (PPI) analysis

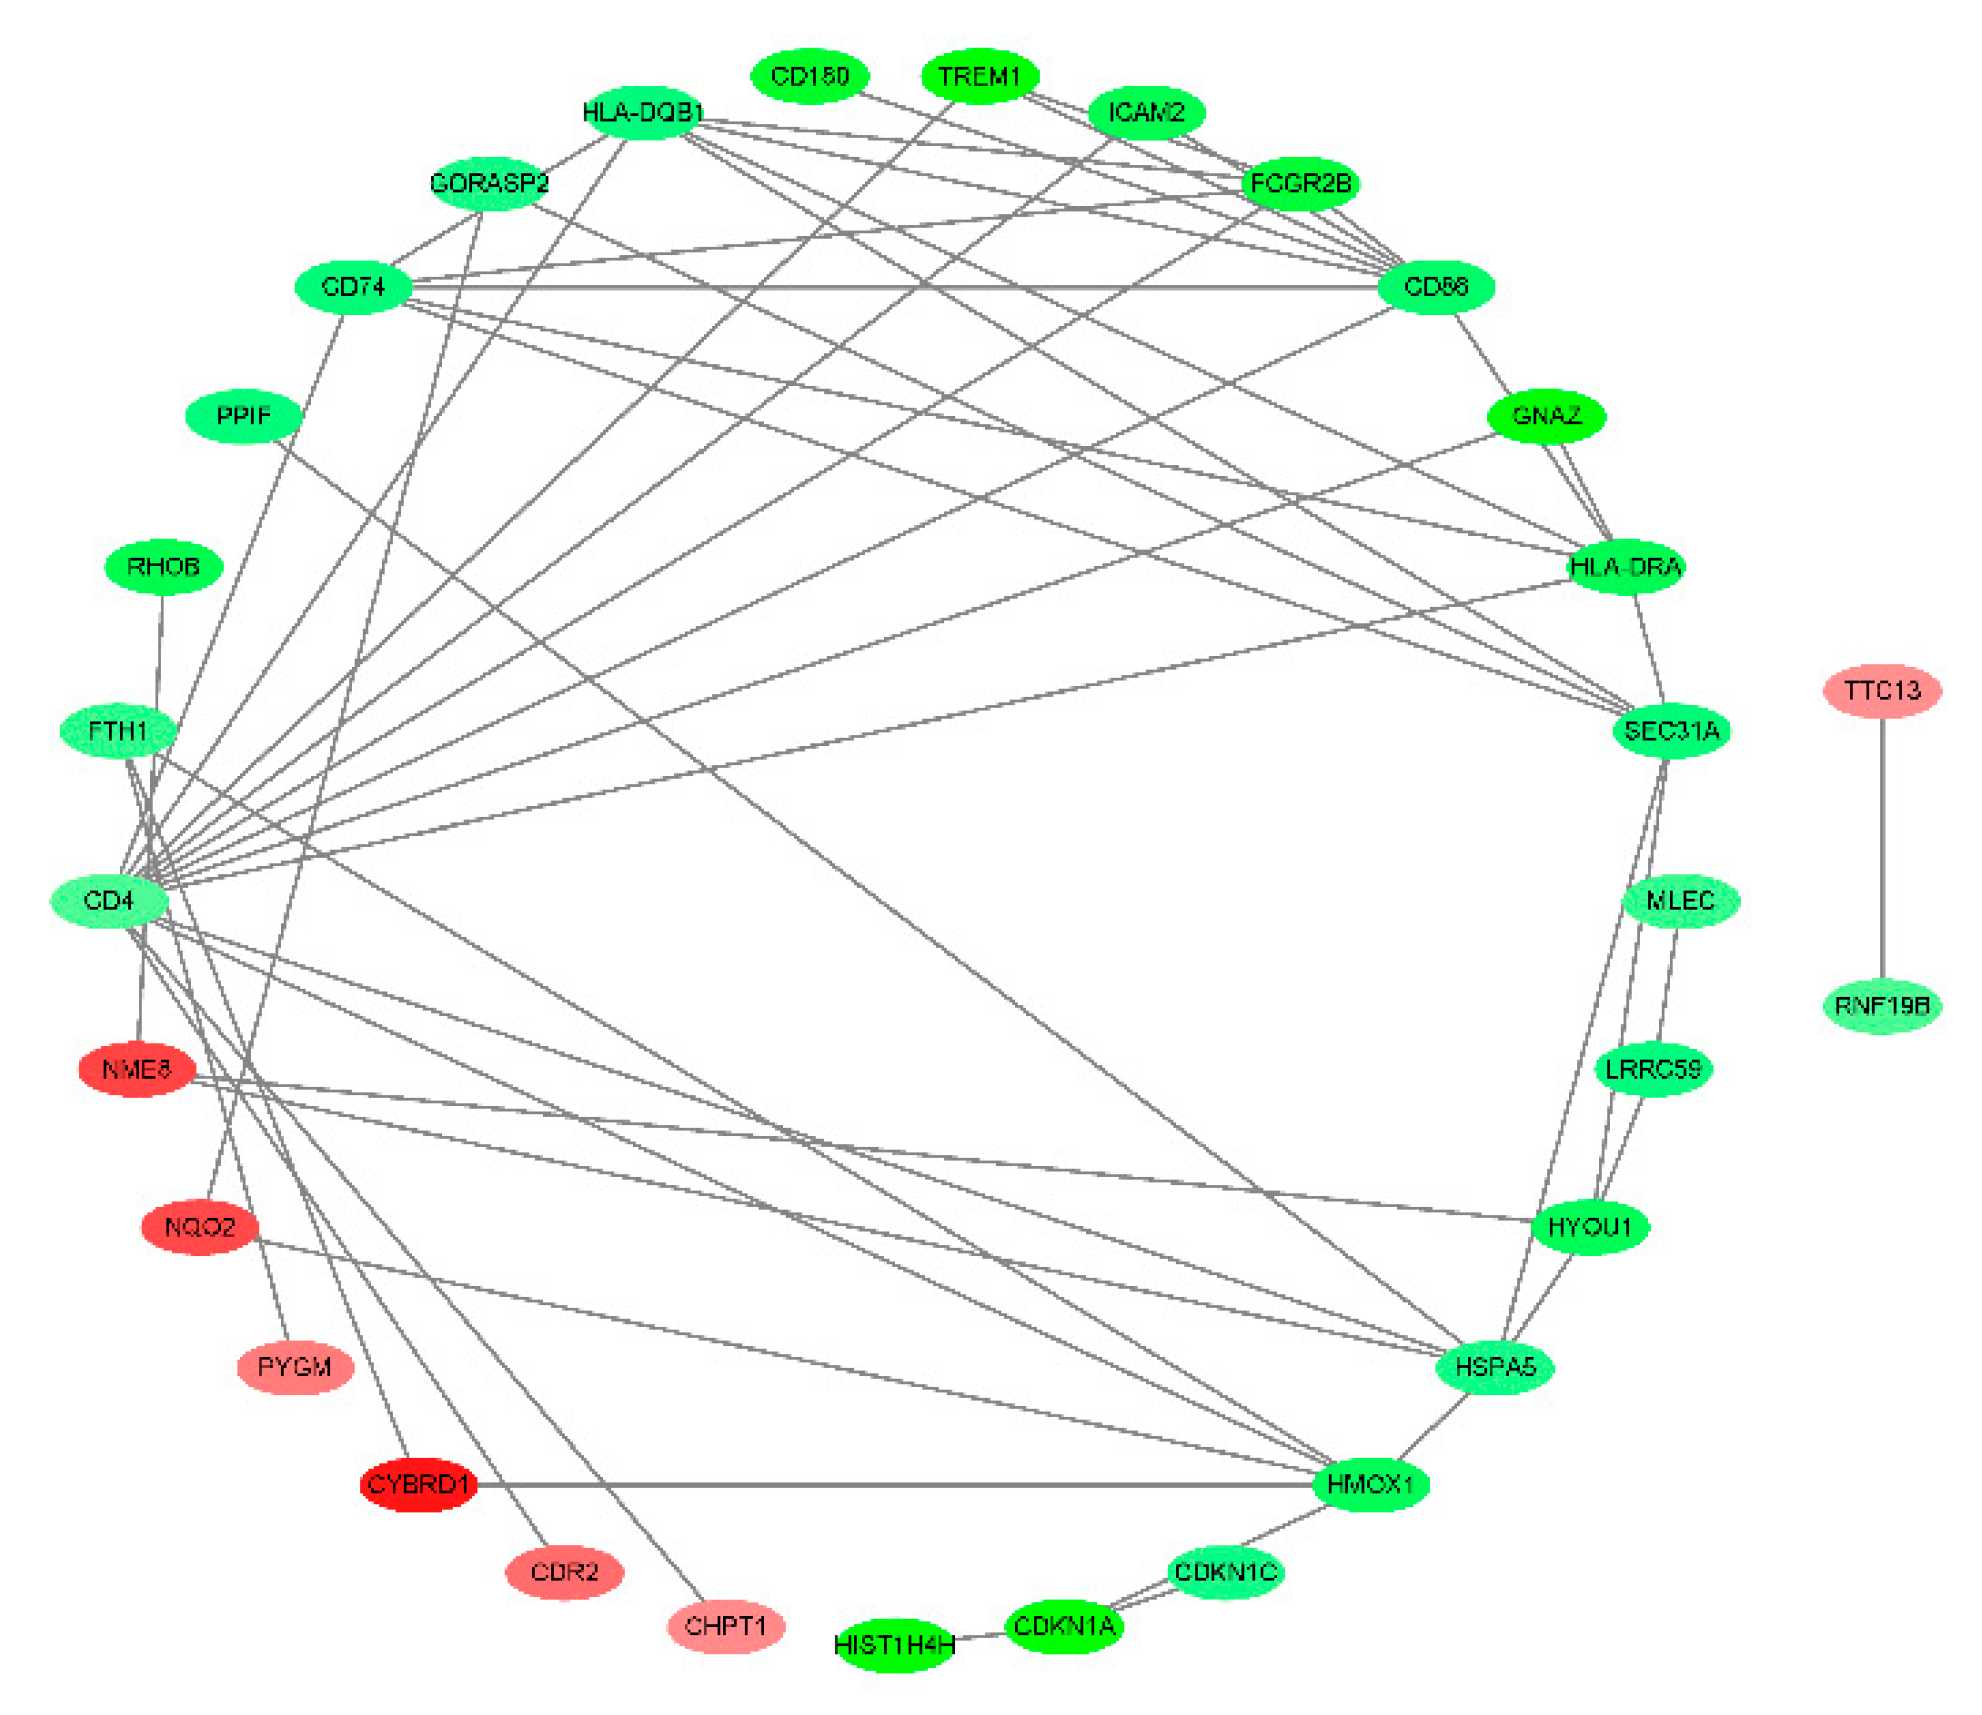
The PPI of the 71 DEGs was analyzed by the STRING and a network of PPI was constructed by using the Cytoscape. The node in the net represents DEGs, the edges represent PPIs. The network contained 31DEGs and 50 PPIs (Figure 3).

3.4. Identification of the diagnostic biomarkers

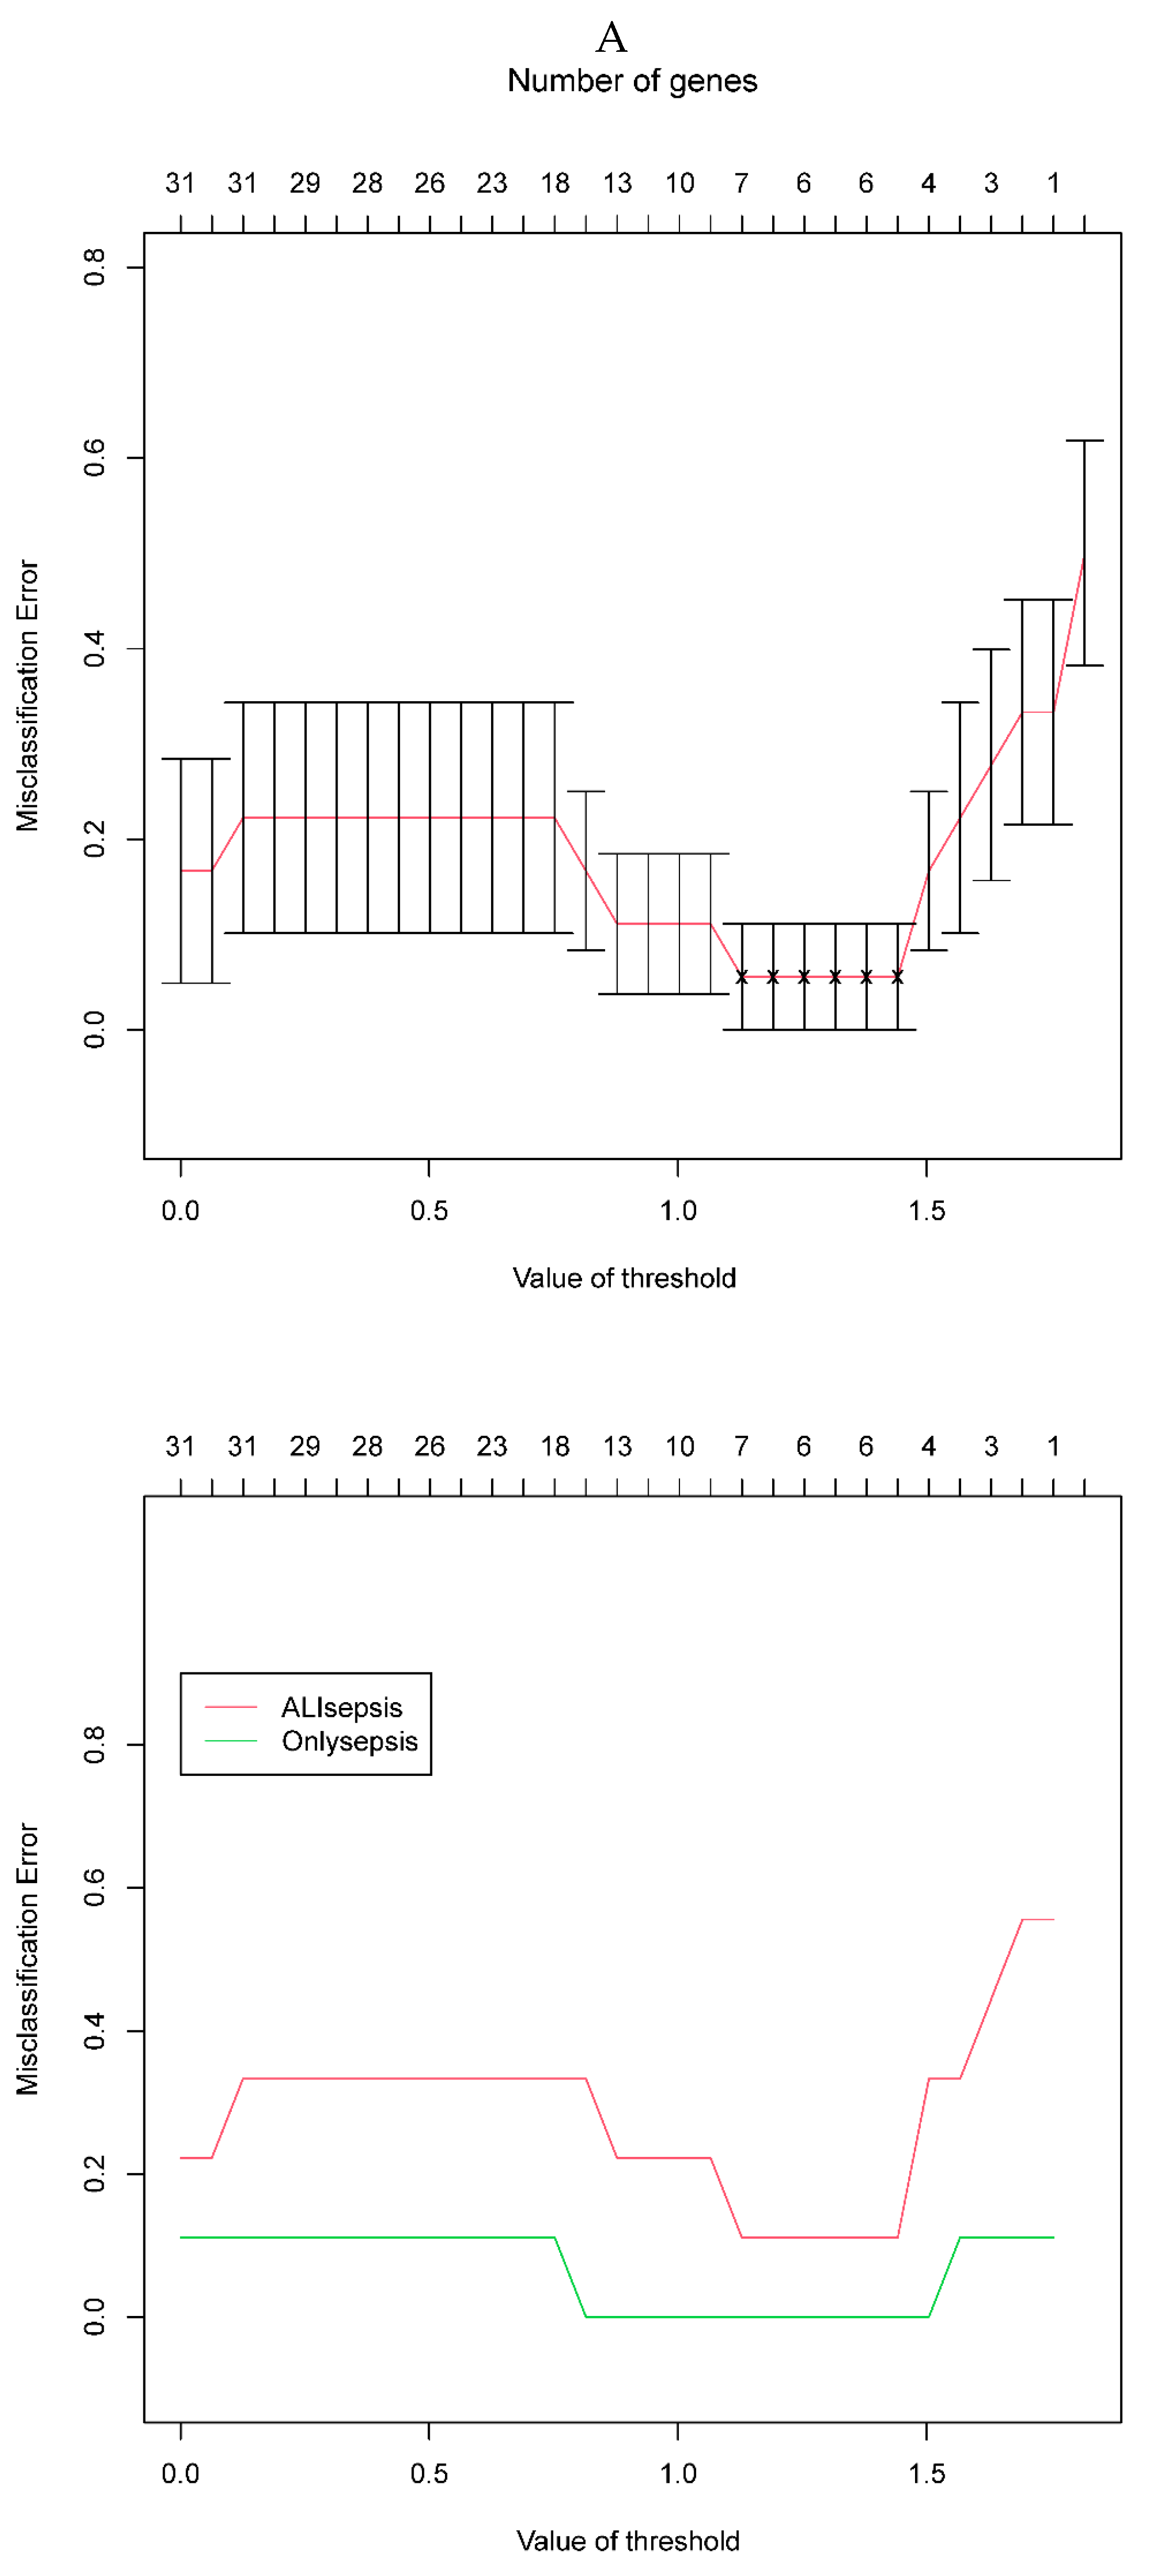
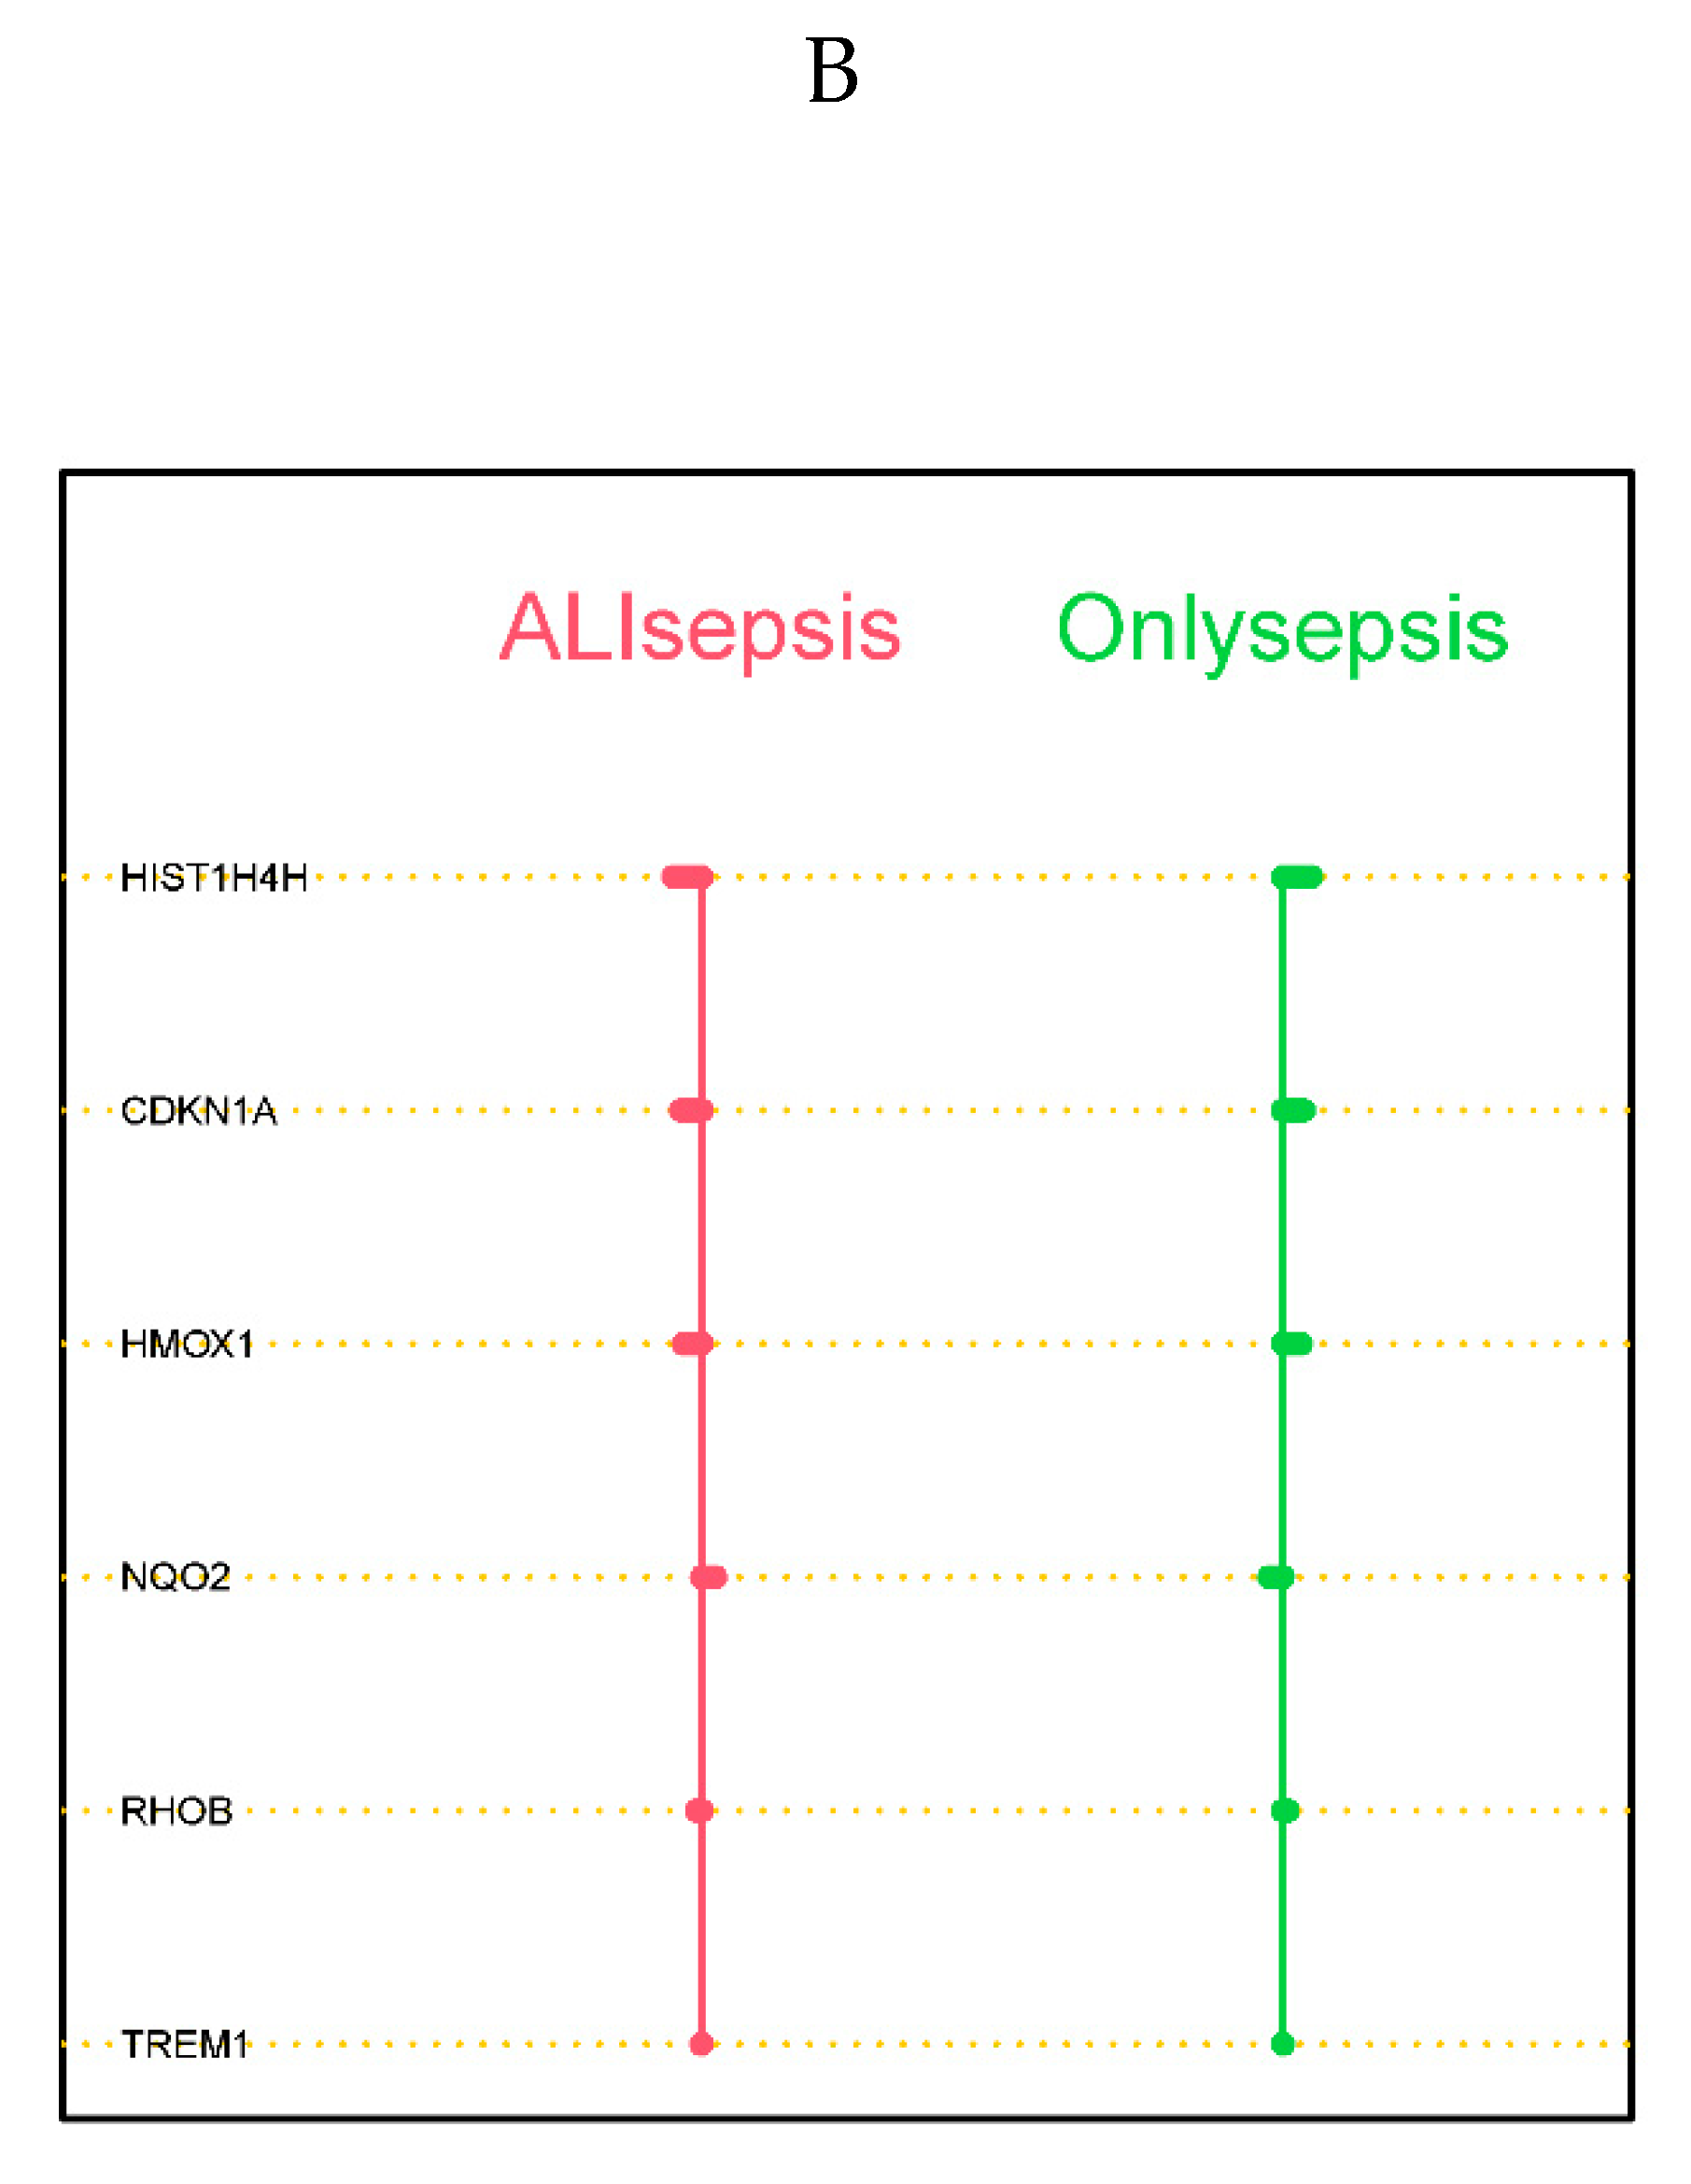
The PAM was performed on the 31 DEGs identified by the PPI analysis to determine characteristic genes between sepsis and sepsis + ALI. According to the misclassification error of the cross-validation, six genes with the minimum misclassification values were identified as diagnostic biomarkers, including HIST1H4H, CDKN1A, HMOX1, NQO2, RHOB, and TREM1 (Figure 4A). Shrunk differences between the 6 genes are shown in Figure 4B, which indicated that the genes with non-zero components in the two classes are mutually exclusive (Figure 4B).

3.5. Assessment of the diagnostic biomarkers

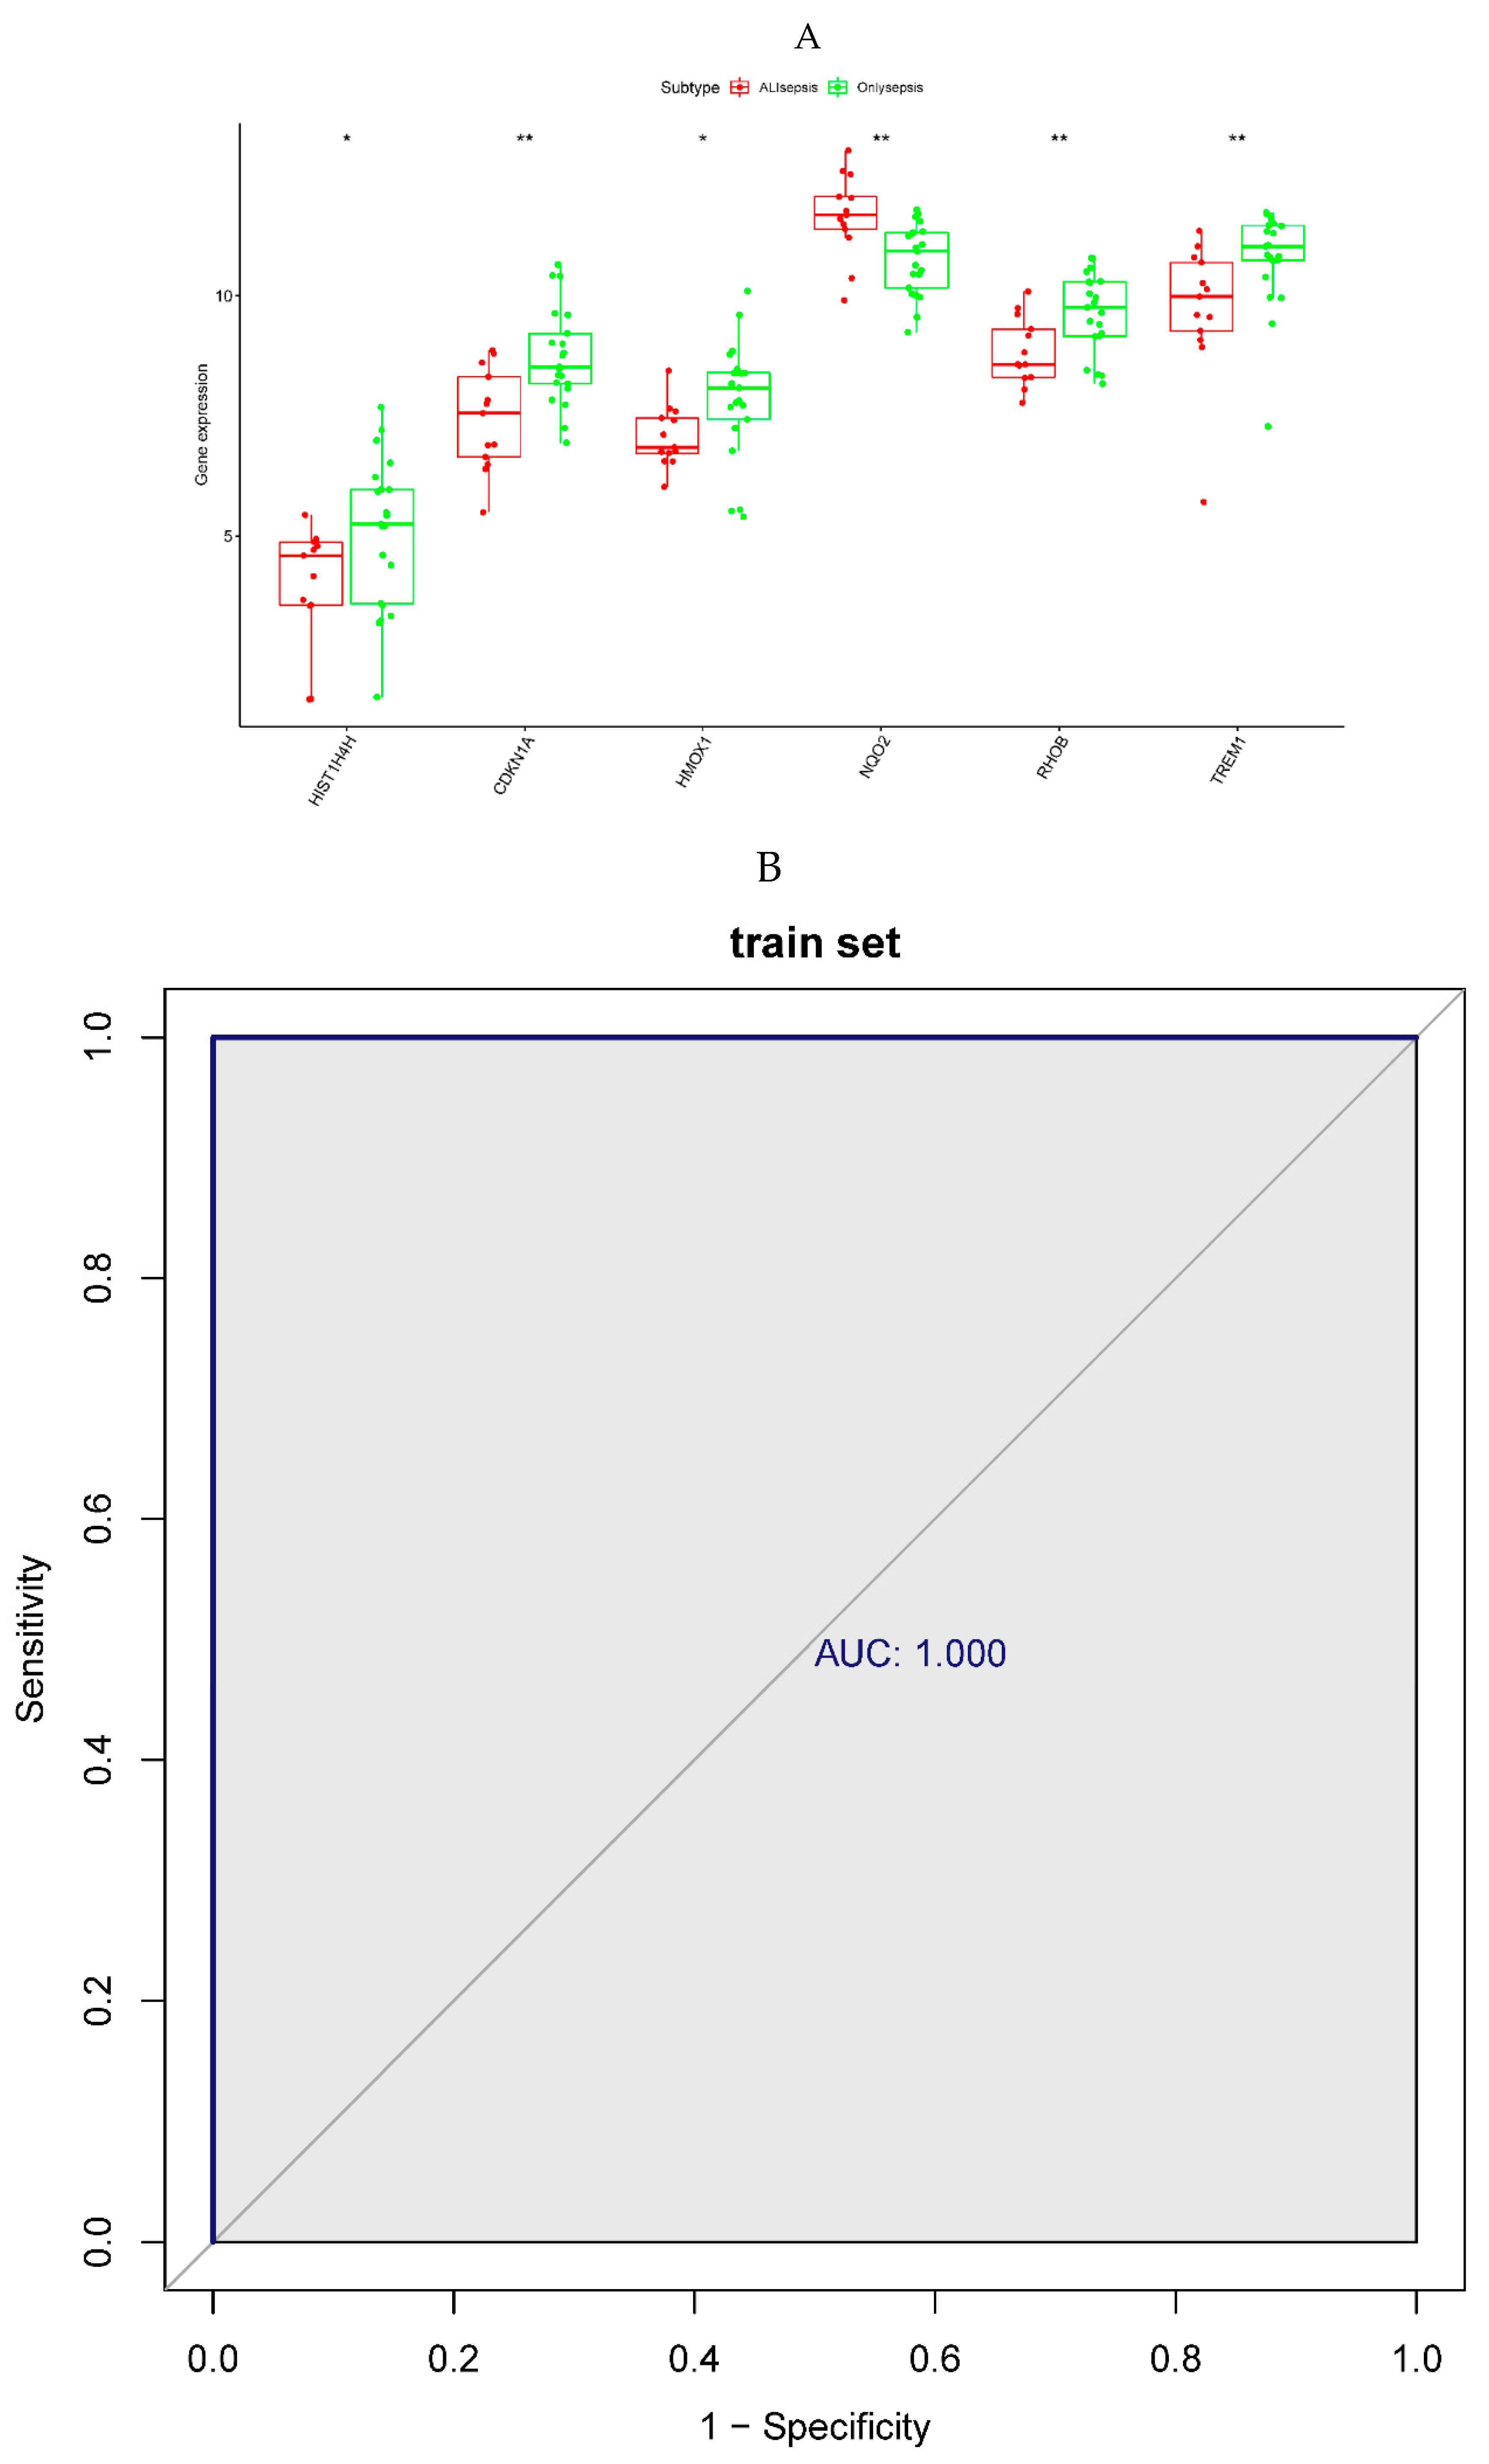
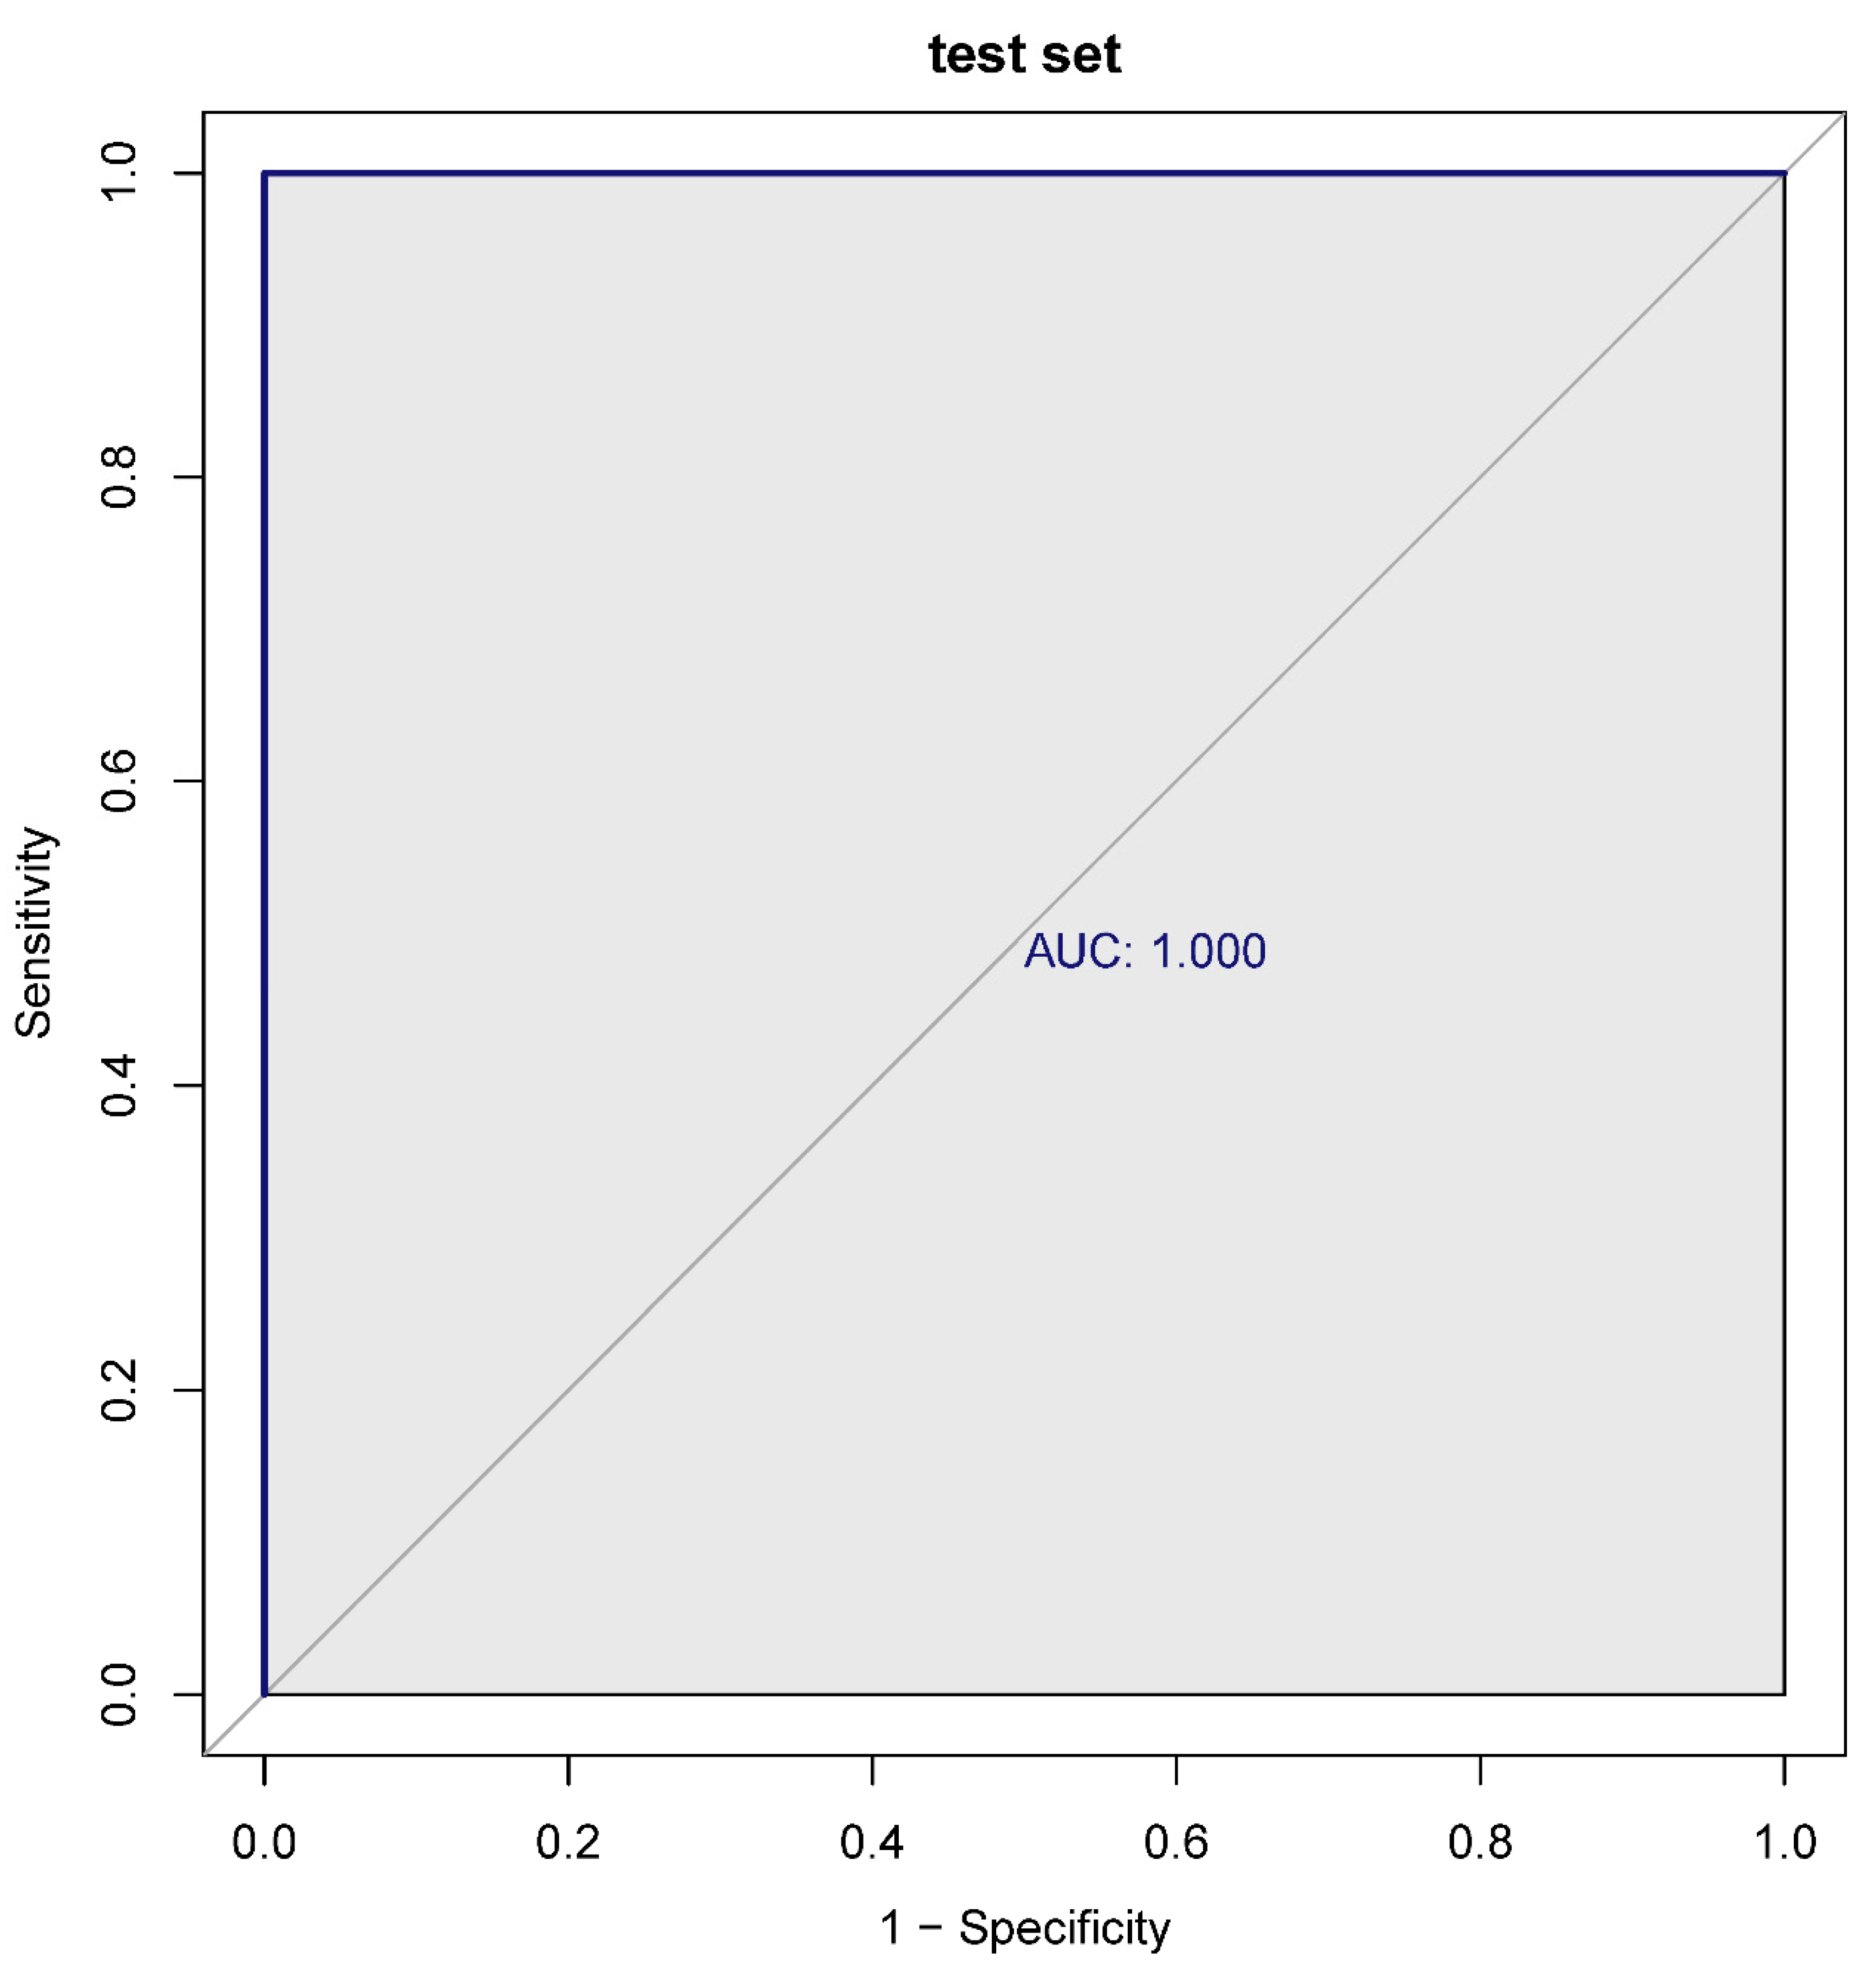
To assess the predictive ability of the 6 diagnostic biomarkers, we first analyzed the expression level of the diagnostic biomarkers between the sepsis and sepsis + ALI groups. Wilcoxon rank-sum test revealed that the expression level of the HISTIH4H, CDKN1A, HMOX1, RHOB, and TREM1 was significantly higher in the sepsis group. Meanwhile, the expression level of the NQO2 was significantly lower in the sepsis group when compared with the sepsis + ALI group (p < 0.05, Figure 5A). The ROC curves of an individual biomarker in the training and validation sets were shown in Supplementary Figure 1. Next, the 6 diagnostic biomarkers were selected for logistic regression analysis in the training and testing set. The ROC curves indicated that the 6 diagnostic biomarkers had excellent performance in distinguishing sepsis patients from sepsis + ALI patients both in the training (AUC = 1) and testing set (AUC = 1) (Figure 5B).

3.6. Gene set enrichment analysis (GSEA)

The samples from the training set were sorted by the expression level of HIST1H4H, CDKN1A, HMOX1, NQO2, RHOB, and TREM1, respectively. Subsequently, GSEA was conducted to detect the gene sets that were enriched in the gene rank in each group for identifying potential biological functions and signaling pathways.
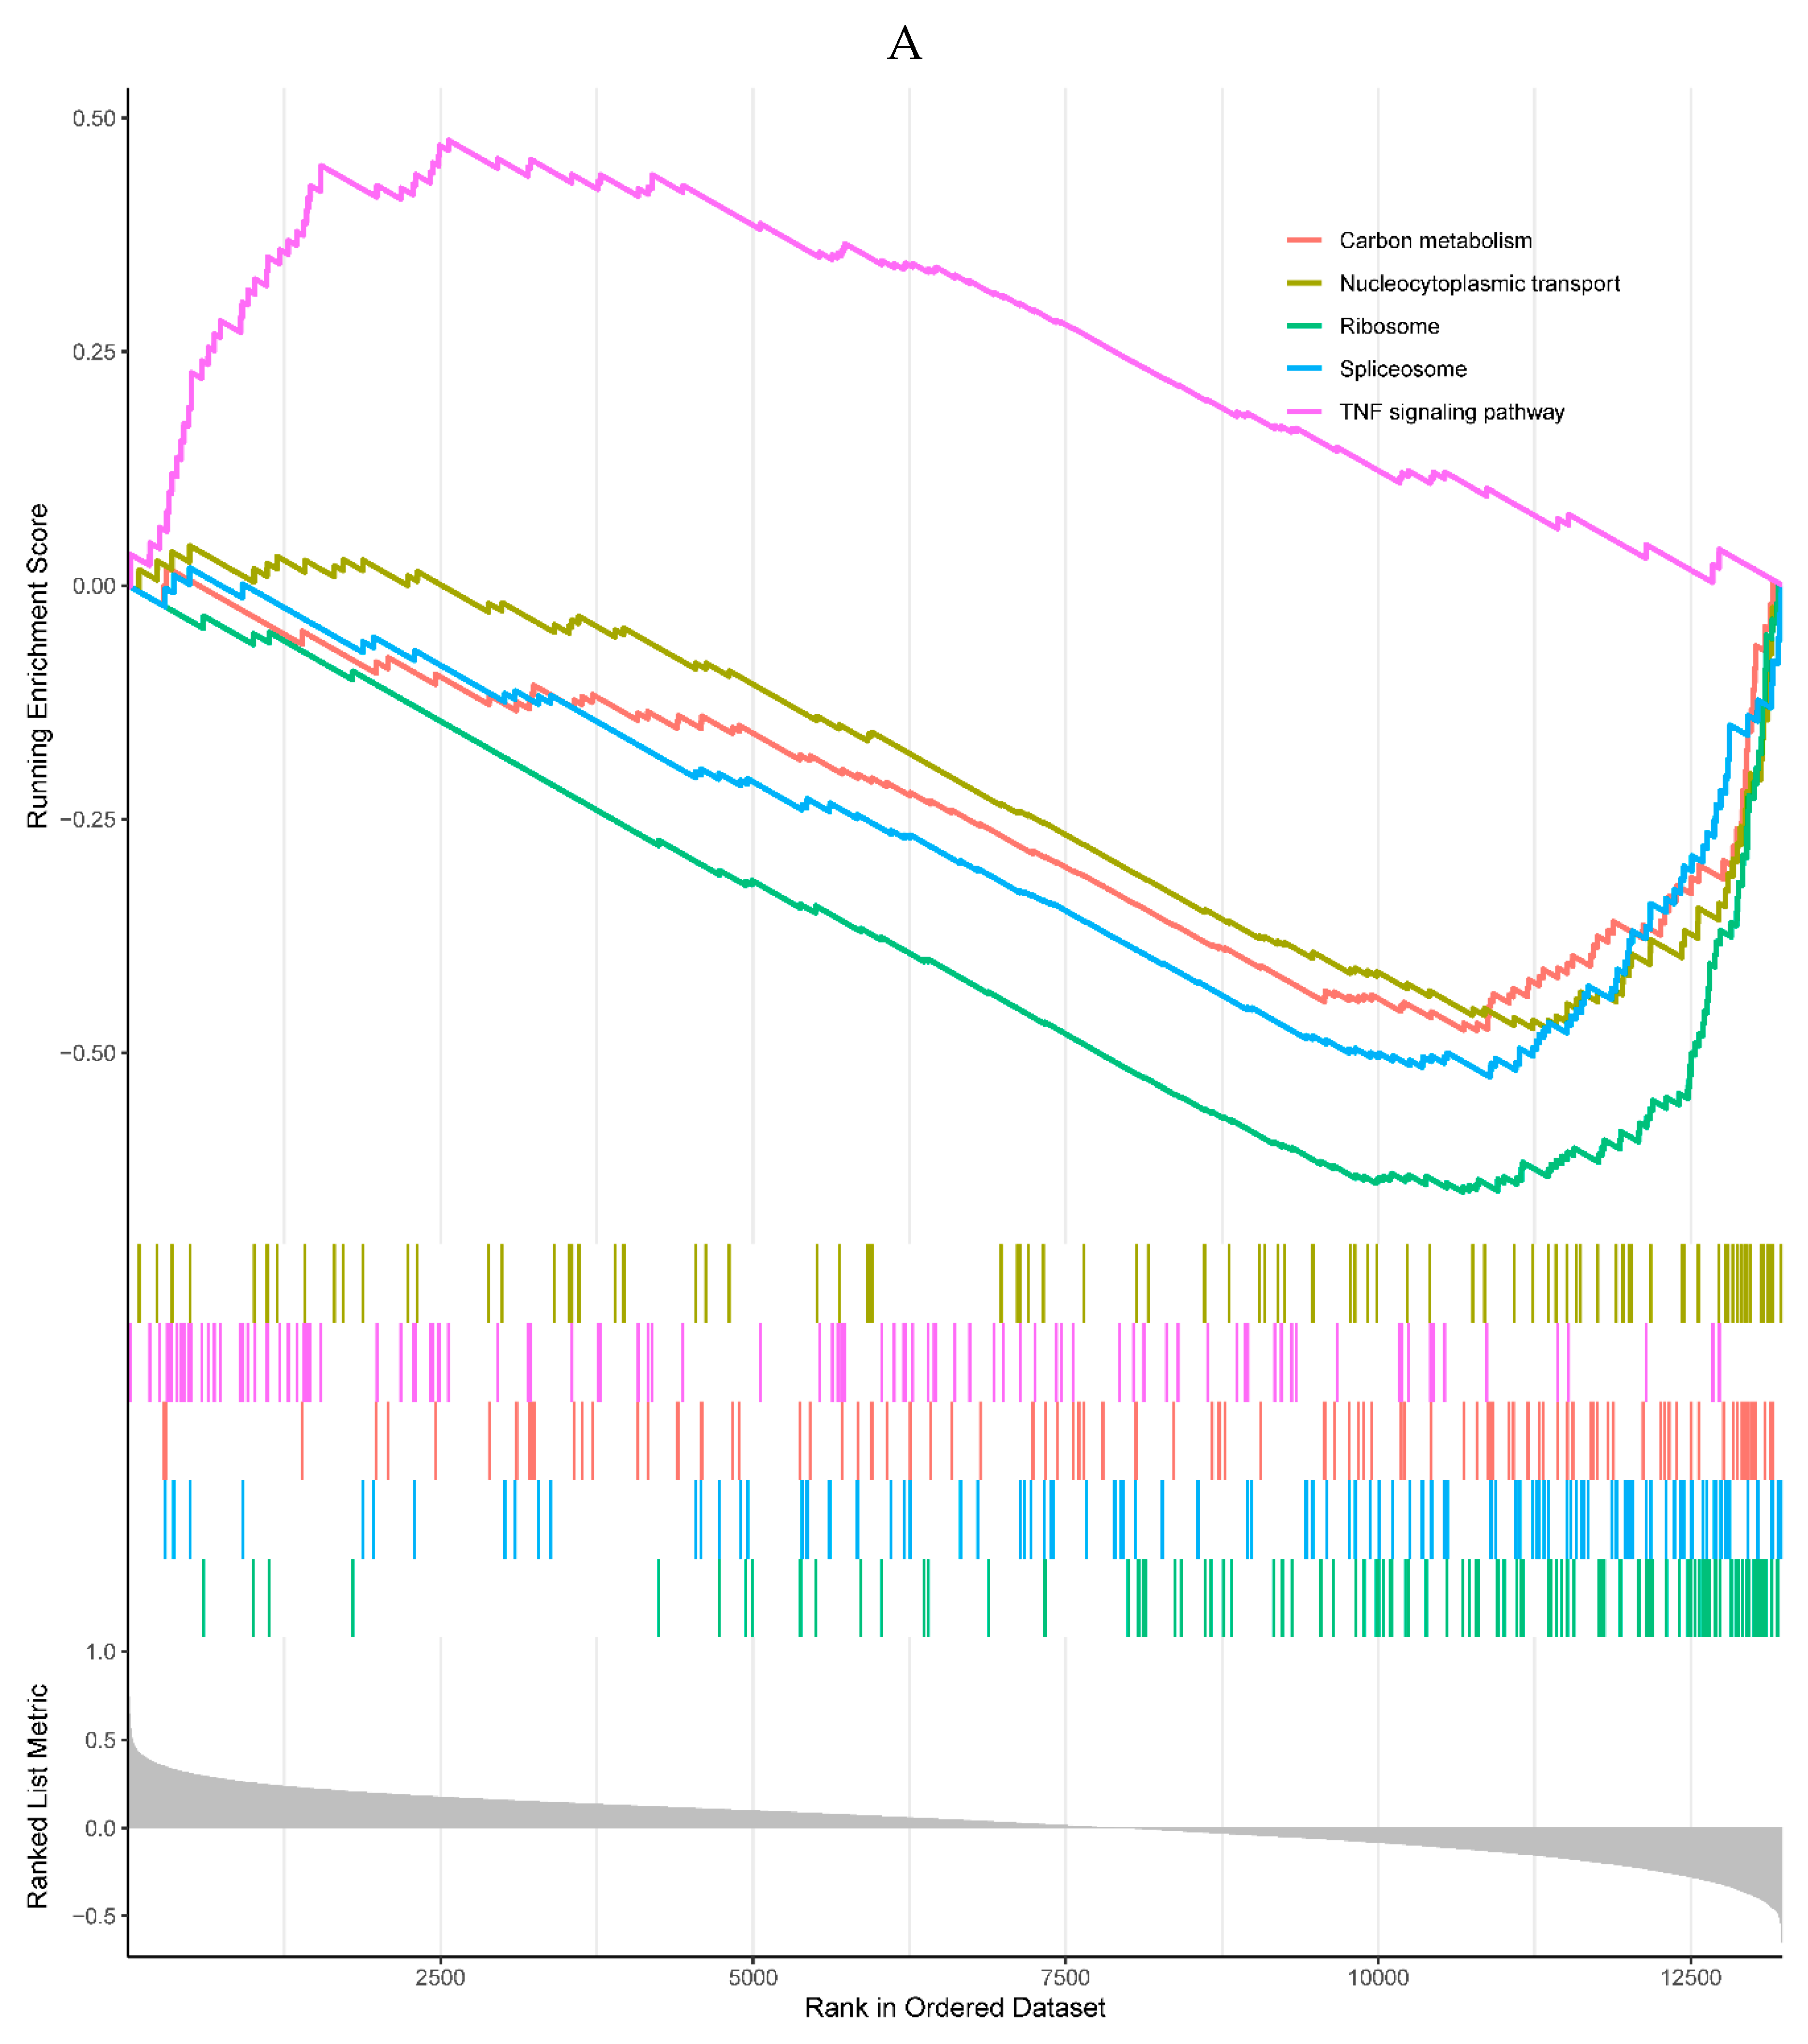
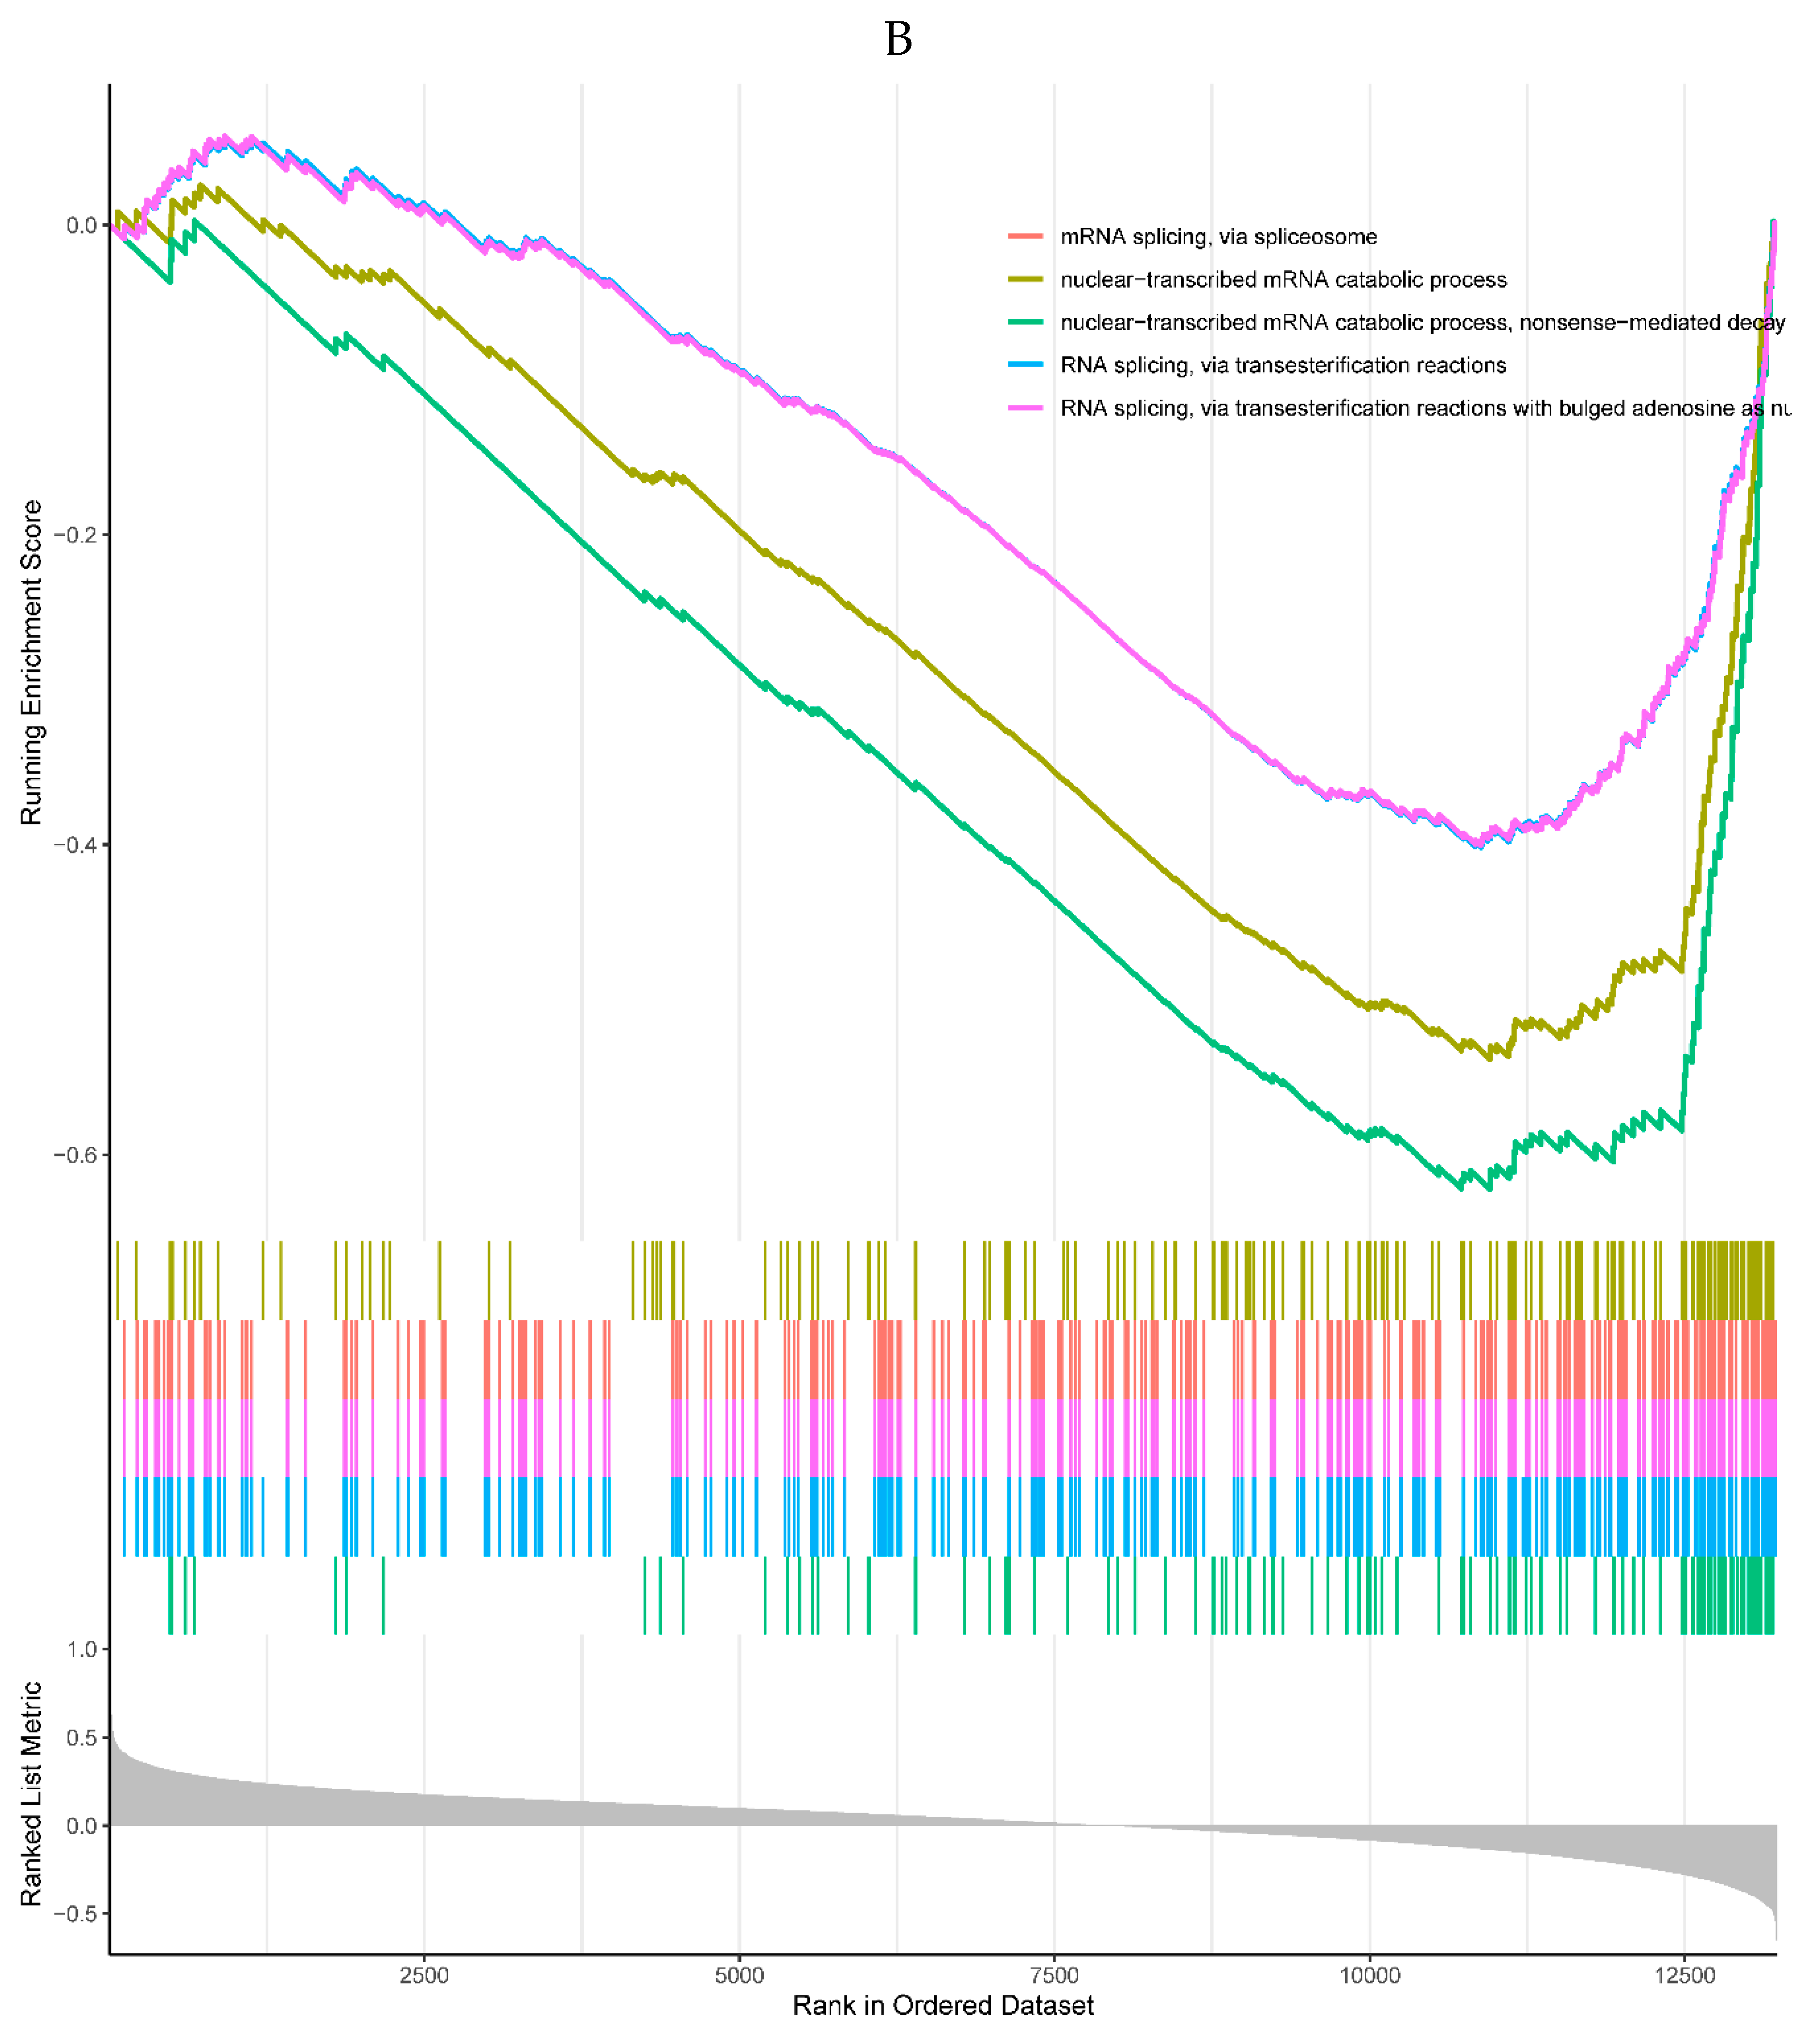
The results revealed that 1 of the top 5 enriched KEGG pathways was positively correlated with the expression of the HIST1H4H, which was the TNF signaling pathway. Meanwhile, 4 KEGG pathways were negatively correlated with the expression of the HIST1H4H, including carbon metabolism, nucleocytoplasmic transport, ribosome, and spliceosome pathways (Figure 6A). The top 5 enriched GO processes were all negatively correlated with the expression of the HIST1H4H, mainly involved in RNA splicing (Figure 6B).
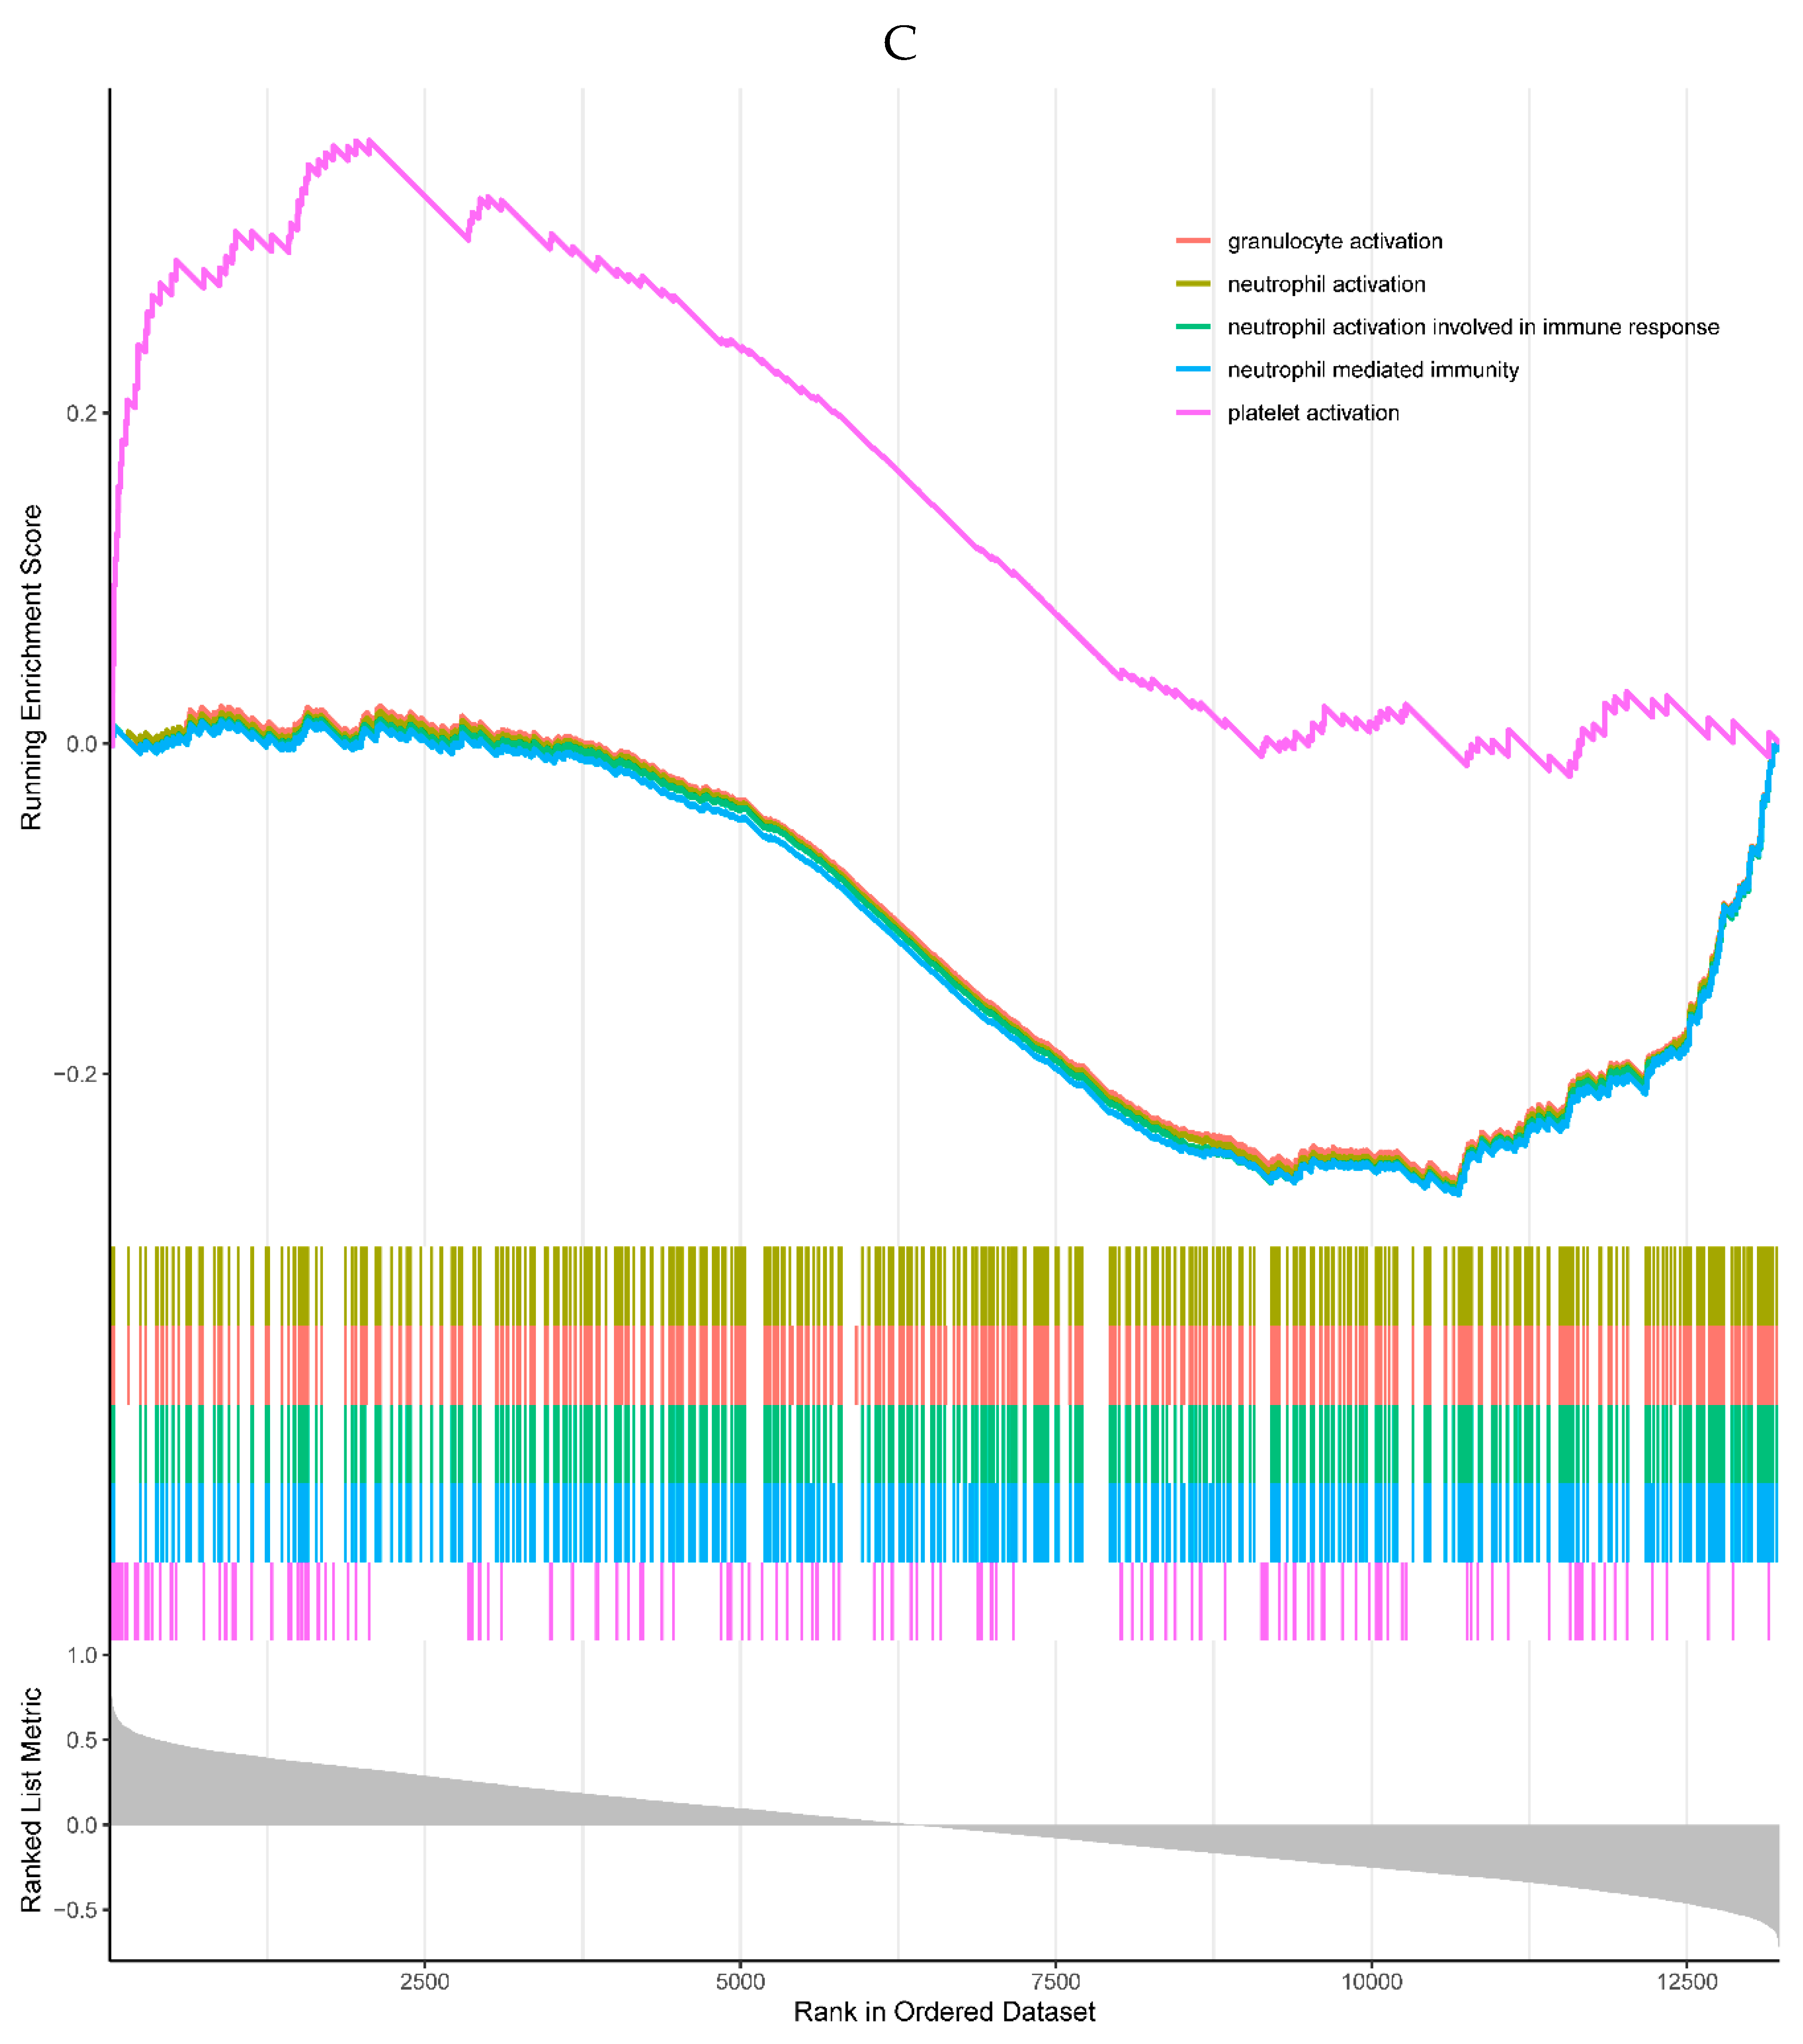
1 of the top 5 enriched GO processes was positively correlated with the expression of CDKN1A, which was the platelet activation, and the remaining 4 were negatively correlated with the CDKN1A, mainly involved in immune cell activation (Figure 6C). No KEGG pathway was significantly enriched in the single-gene GSEA of the CDKN1A.
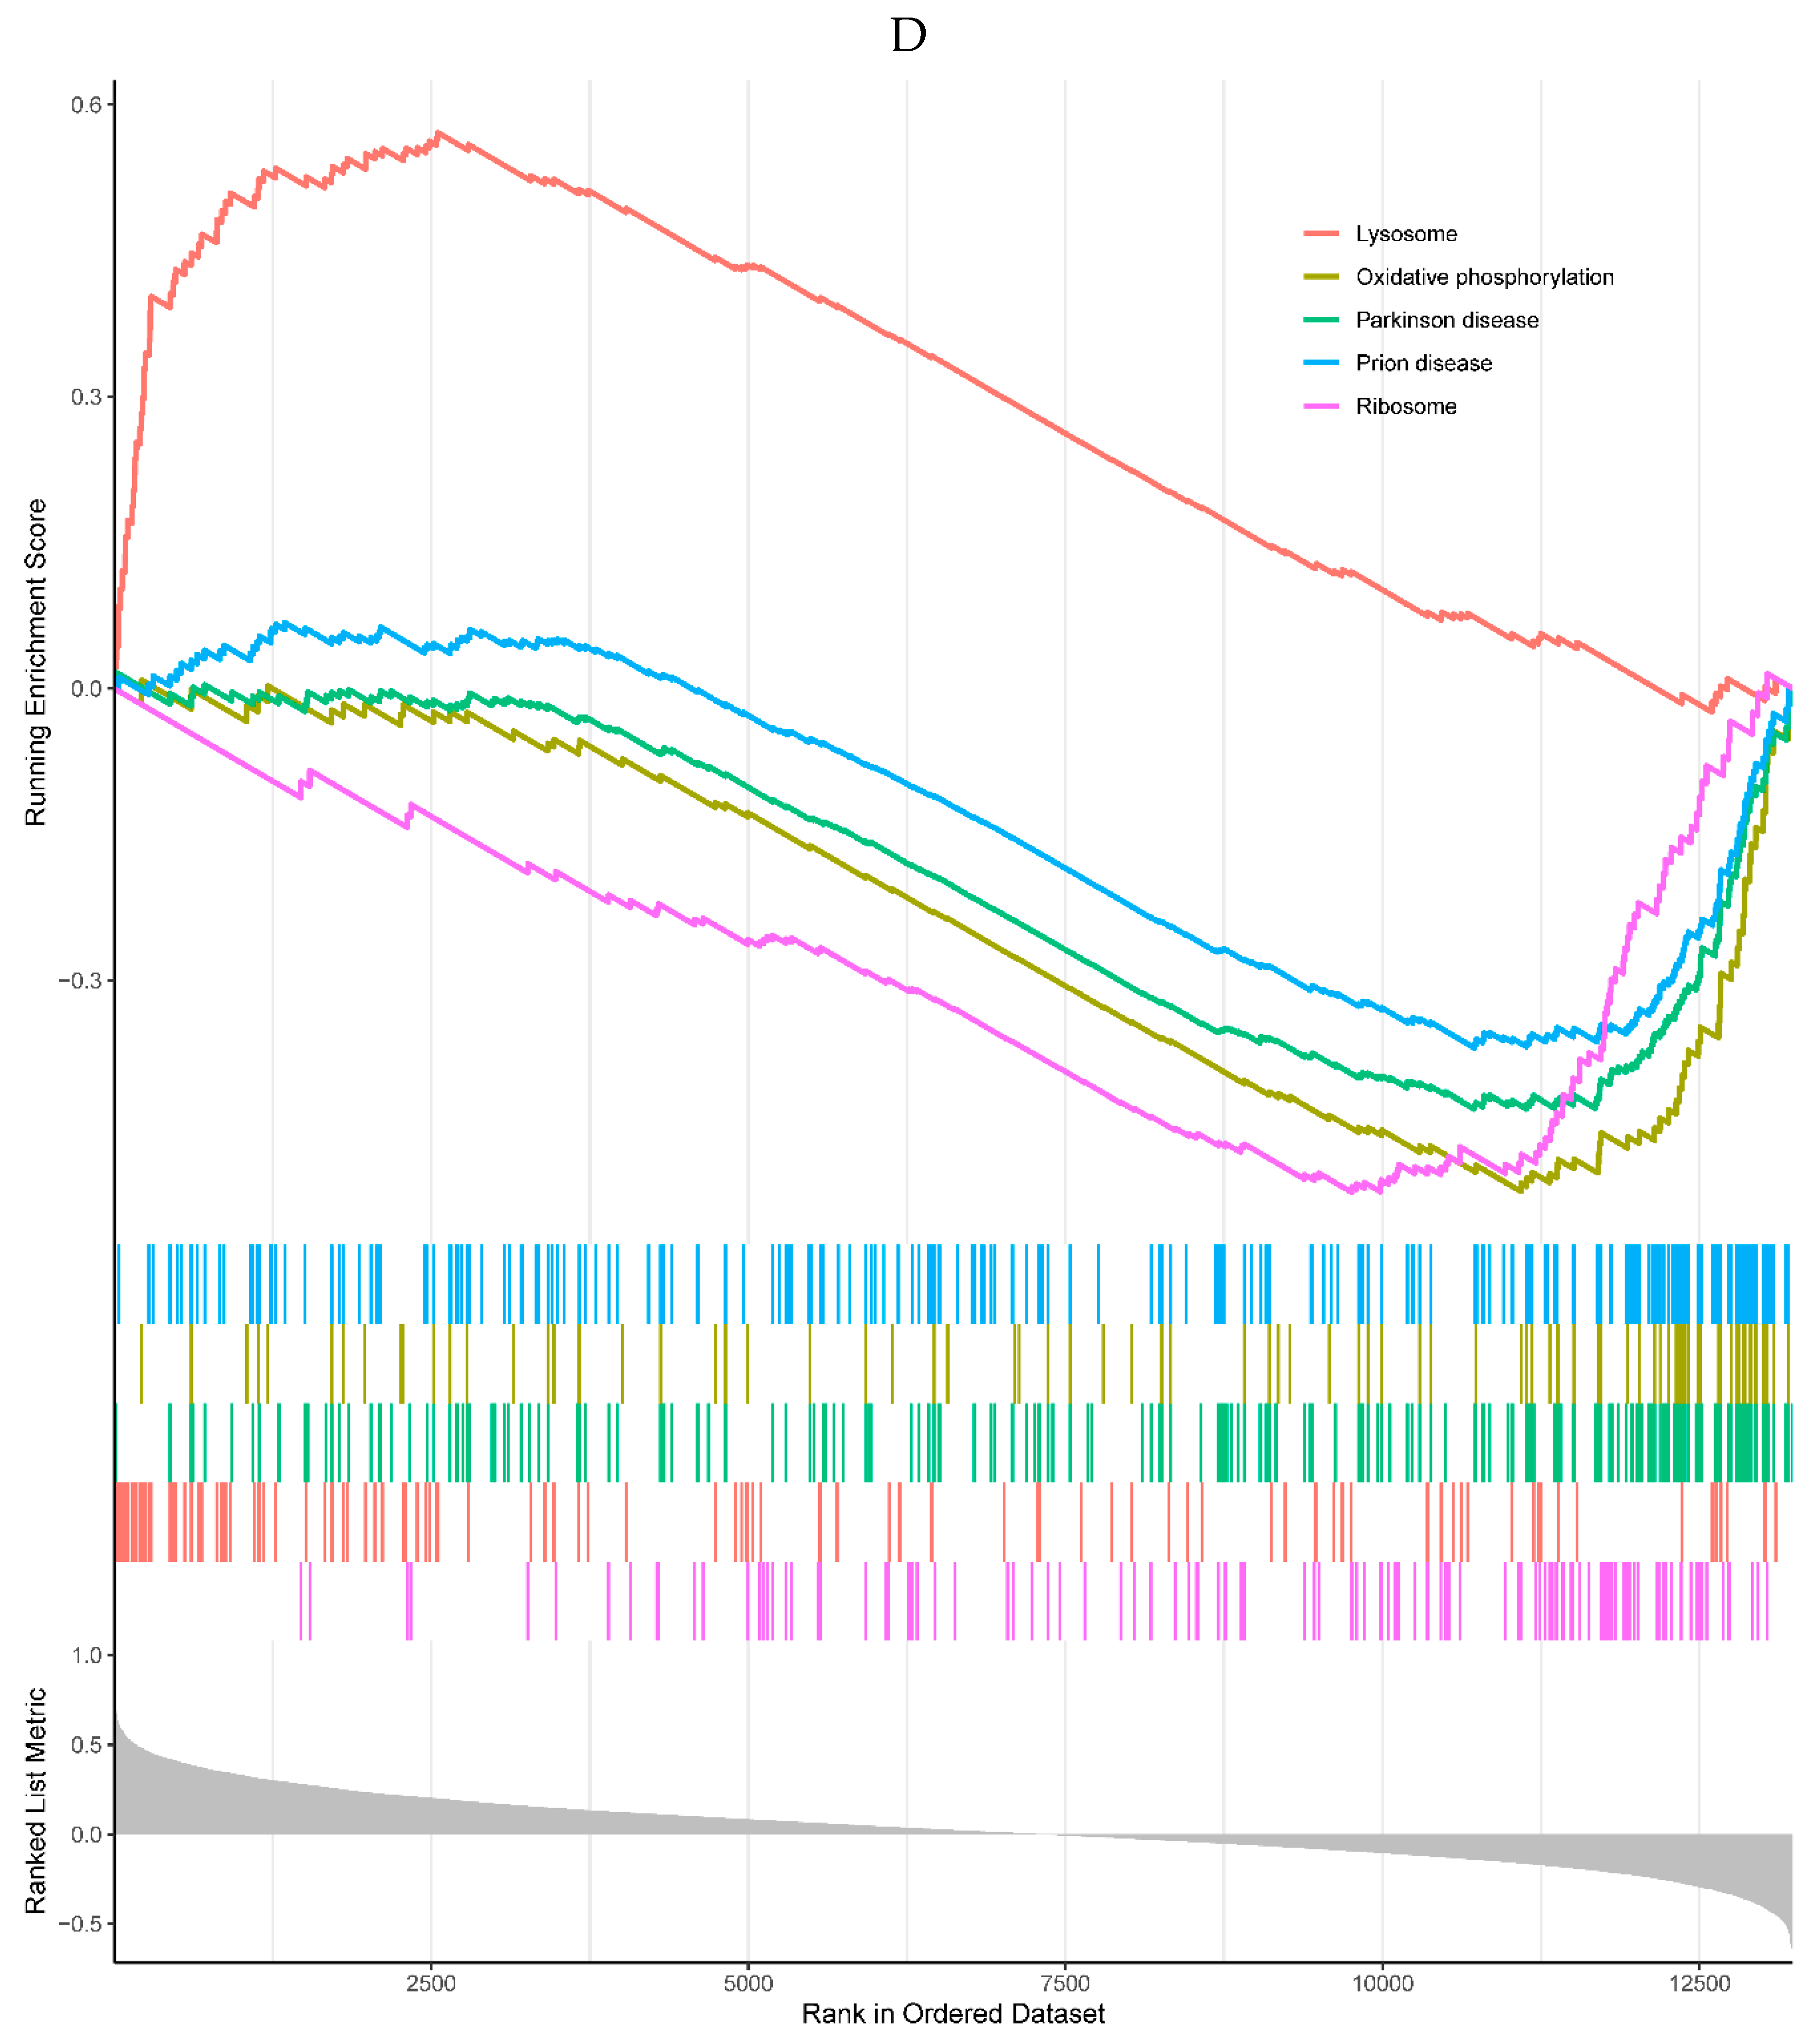
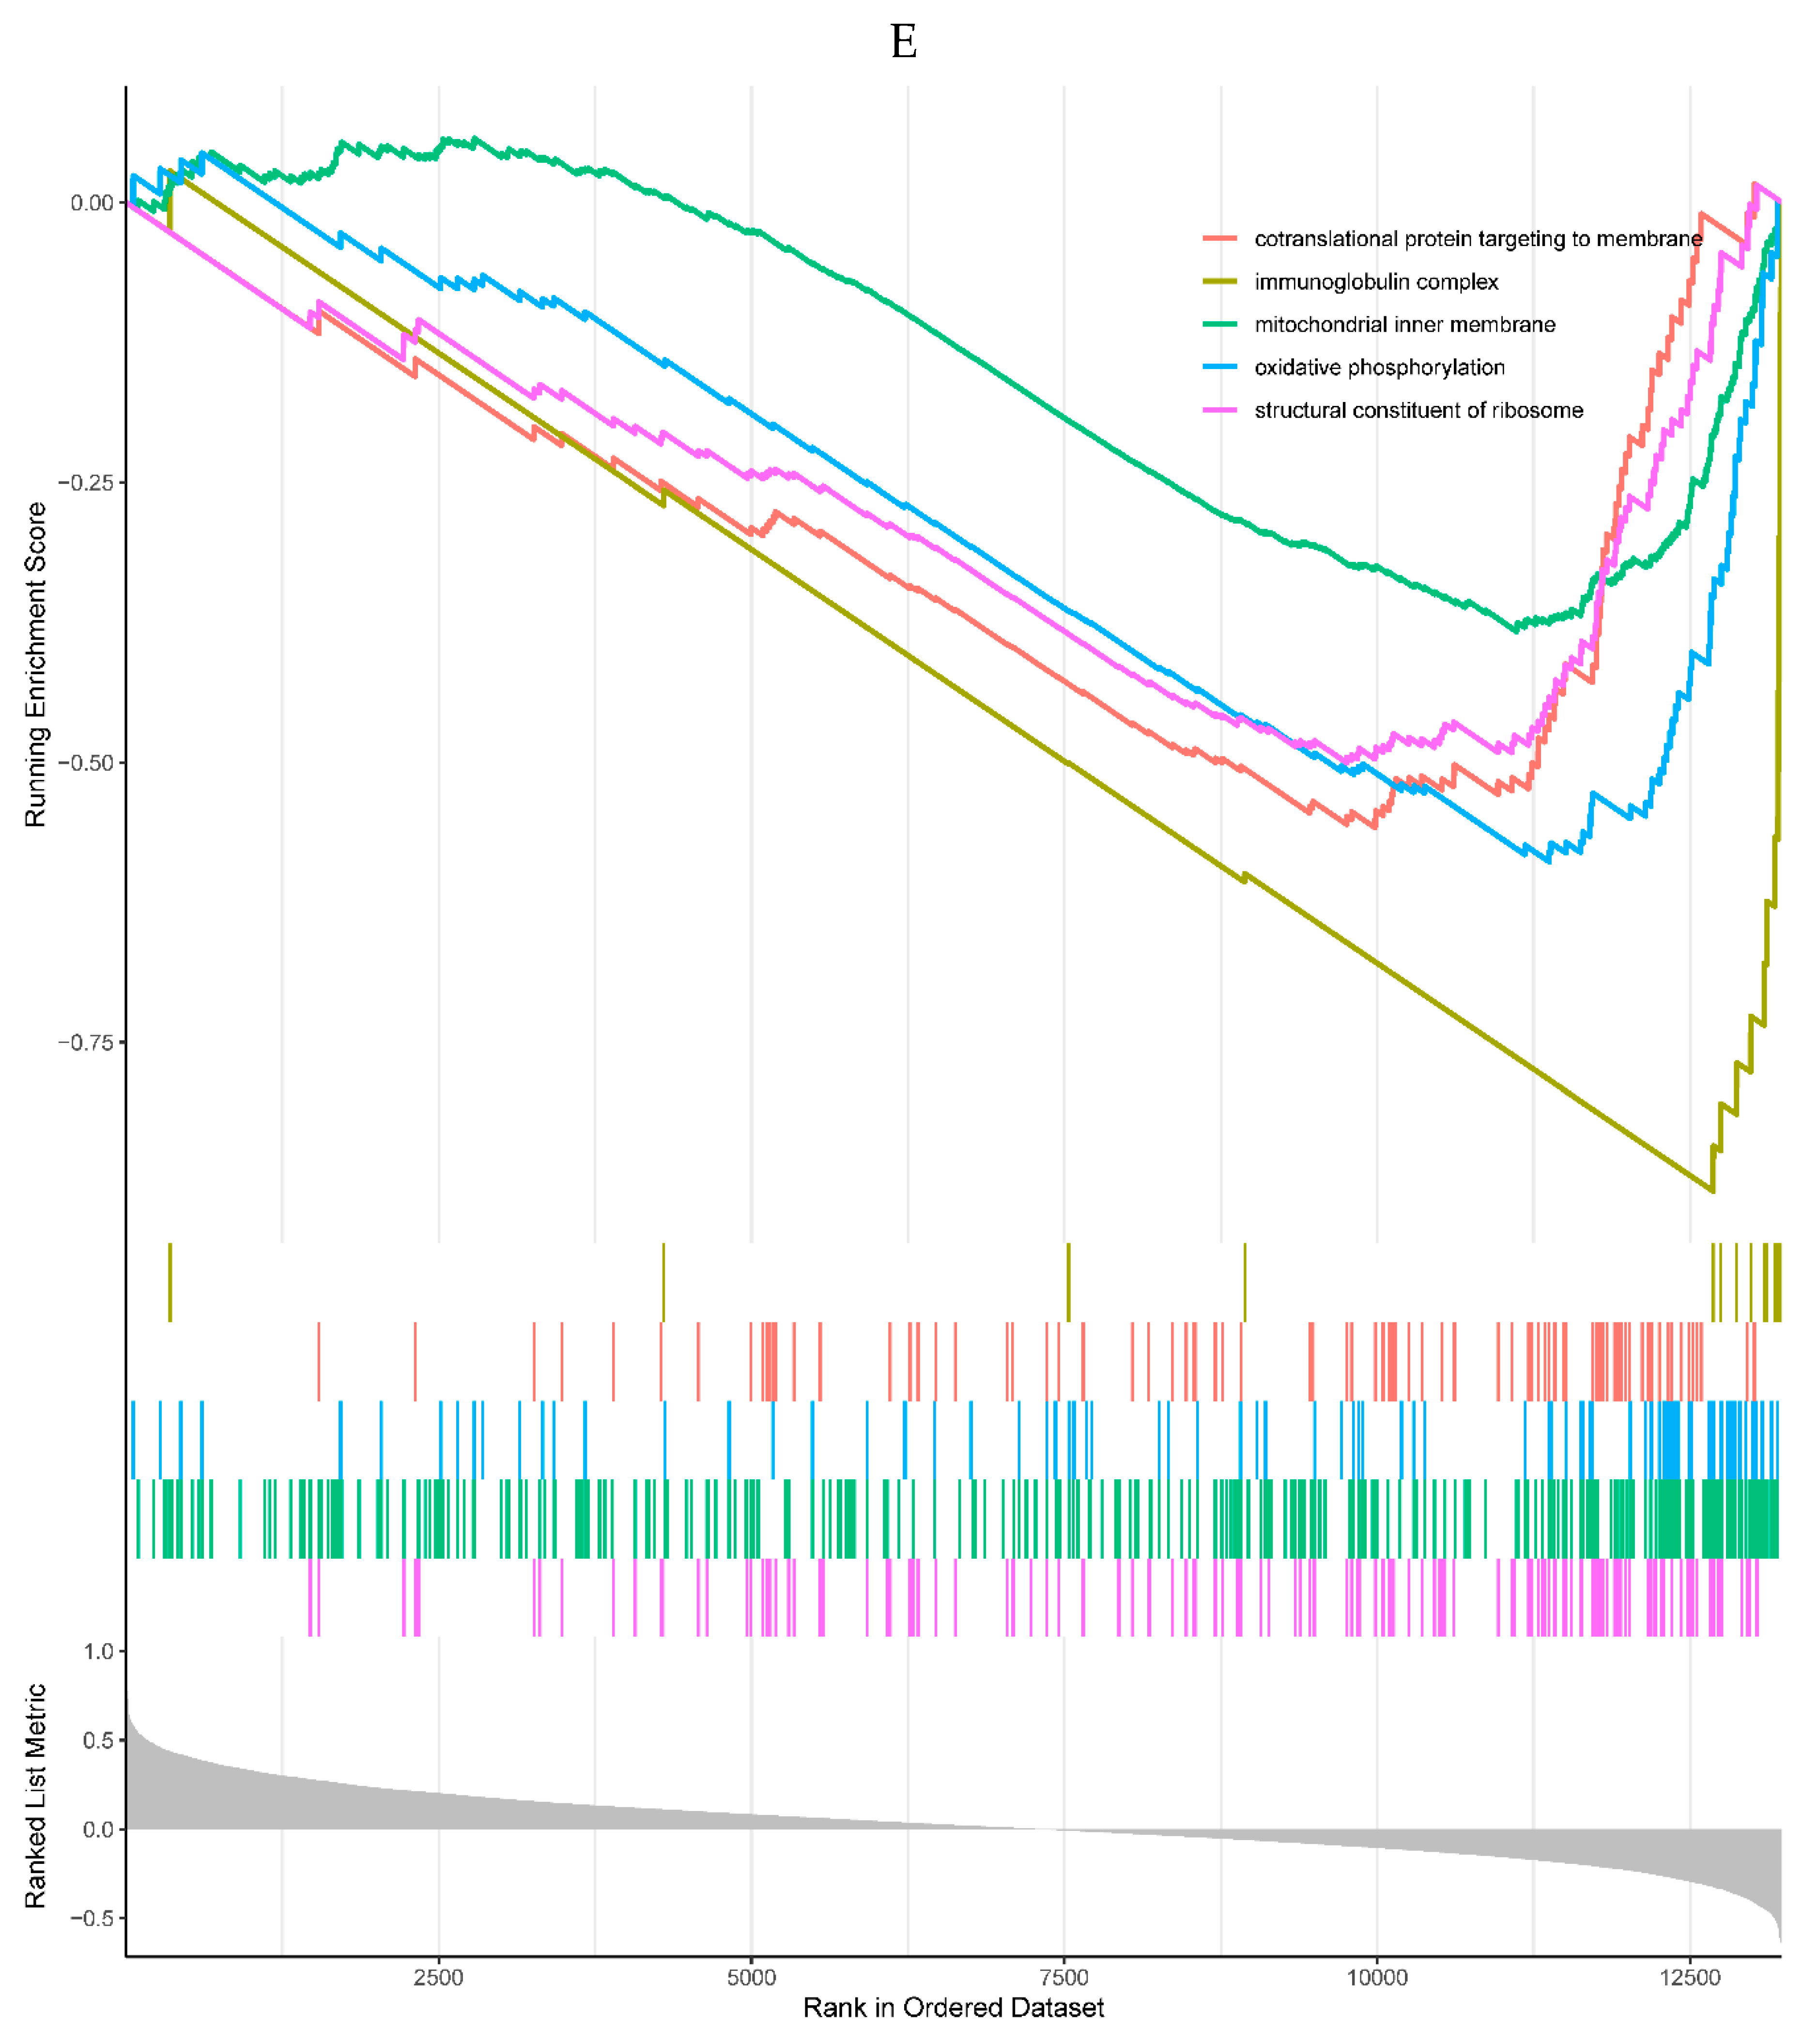
1 of the top 5 enriched KEGG pathways was positively correlated with the expression of the HMOX1, which was the lysosome pathway. The 4 KEGG pathways negatively correlated with the expression of HMOX1 were involved in oxidative phosphorylation, Parkinson’s disease, prion disease, and ribosome pathways (Figure 6D). All the top 5 enriched GO processes in the single-gene GSEA of the HMOX1 were negatively correlated with the HMOX1, including cotranslational protein targeting to membrane, immunoglobulin complex, mitochondrial inner membrane, oxidative phosphorylation, and structural constituent of ribosome (Figure 6E).
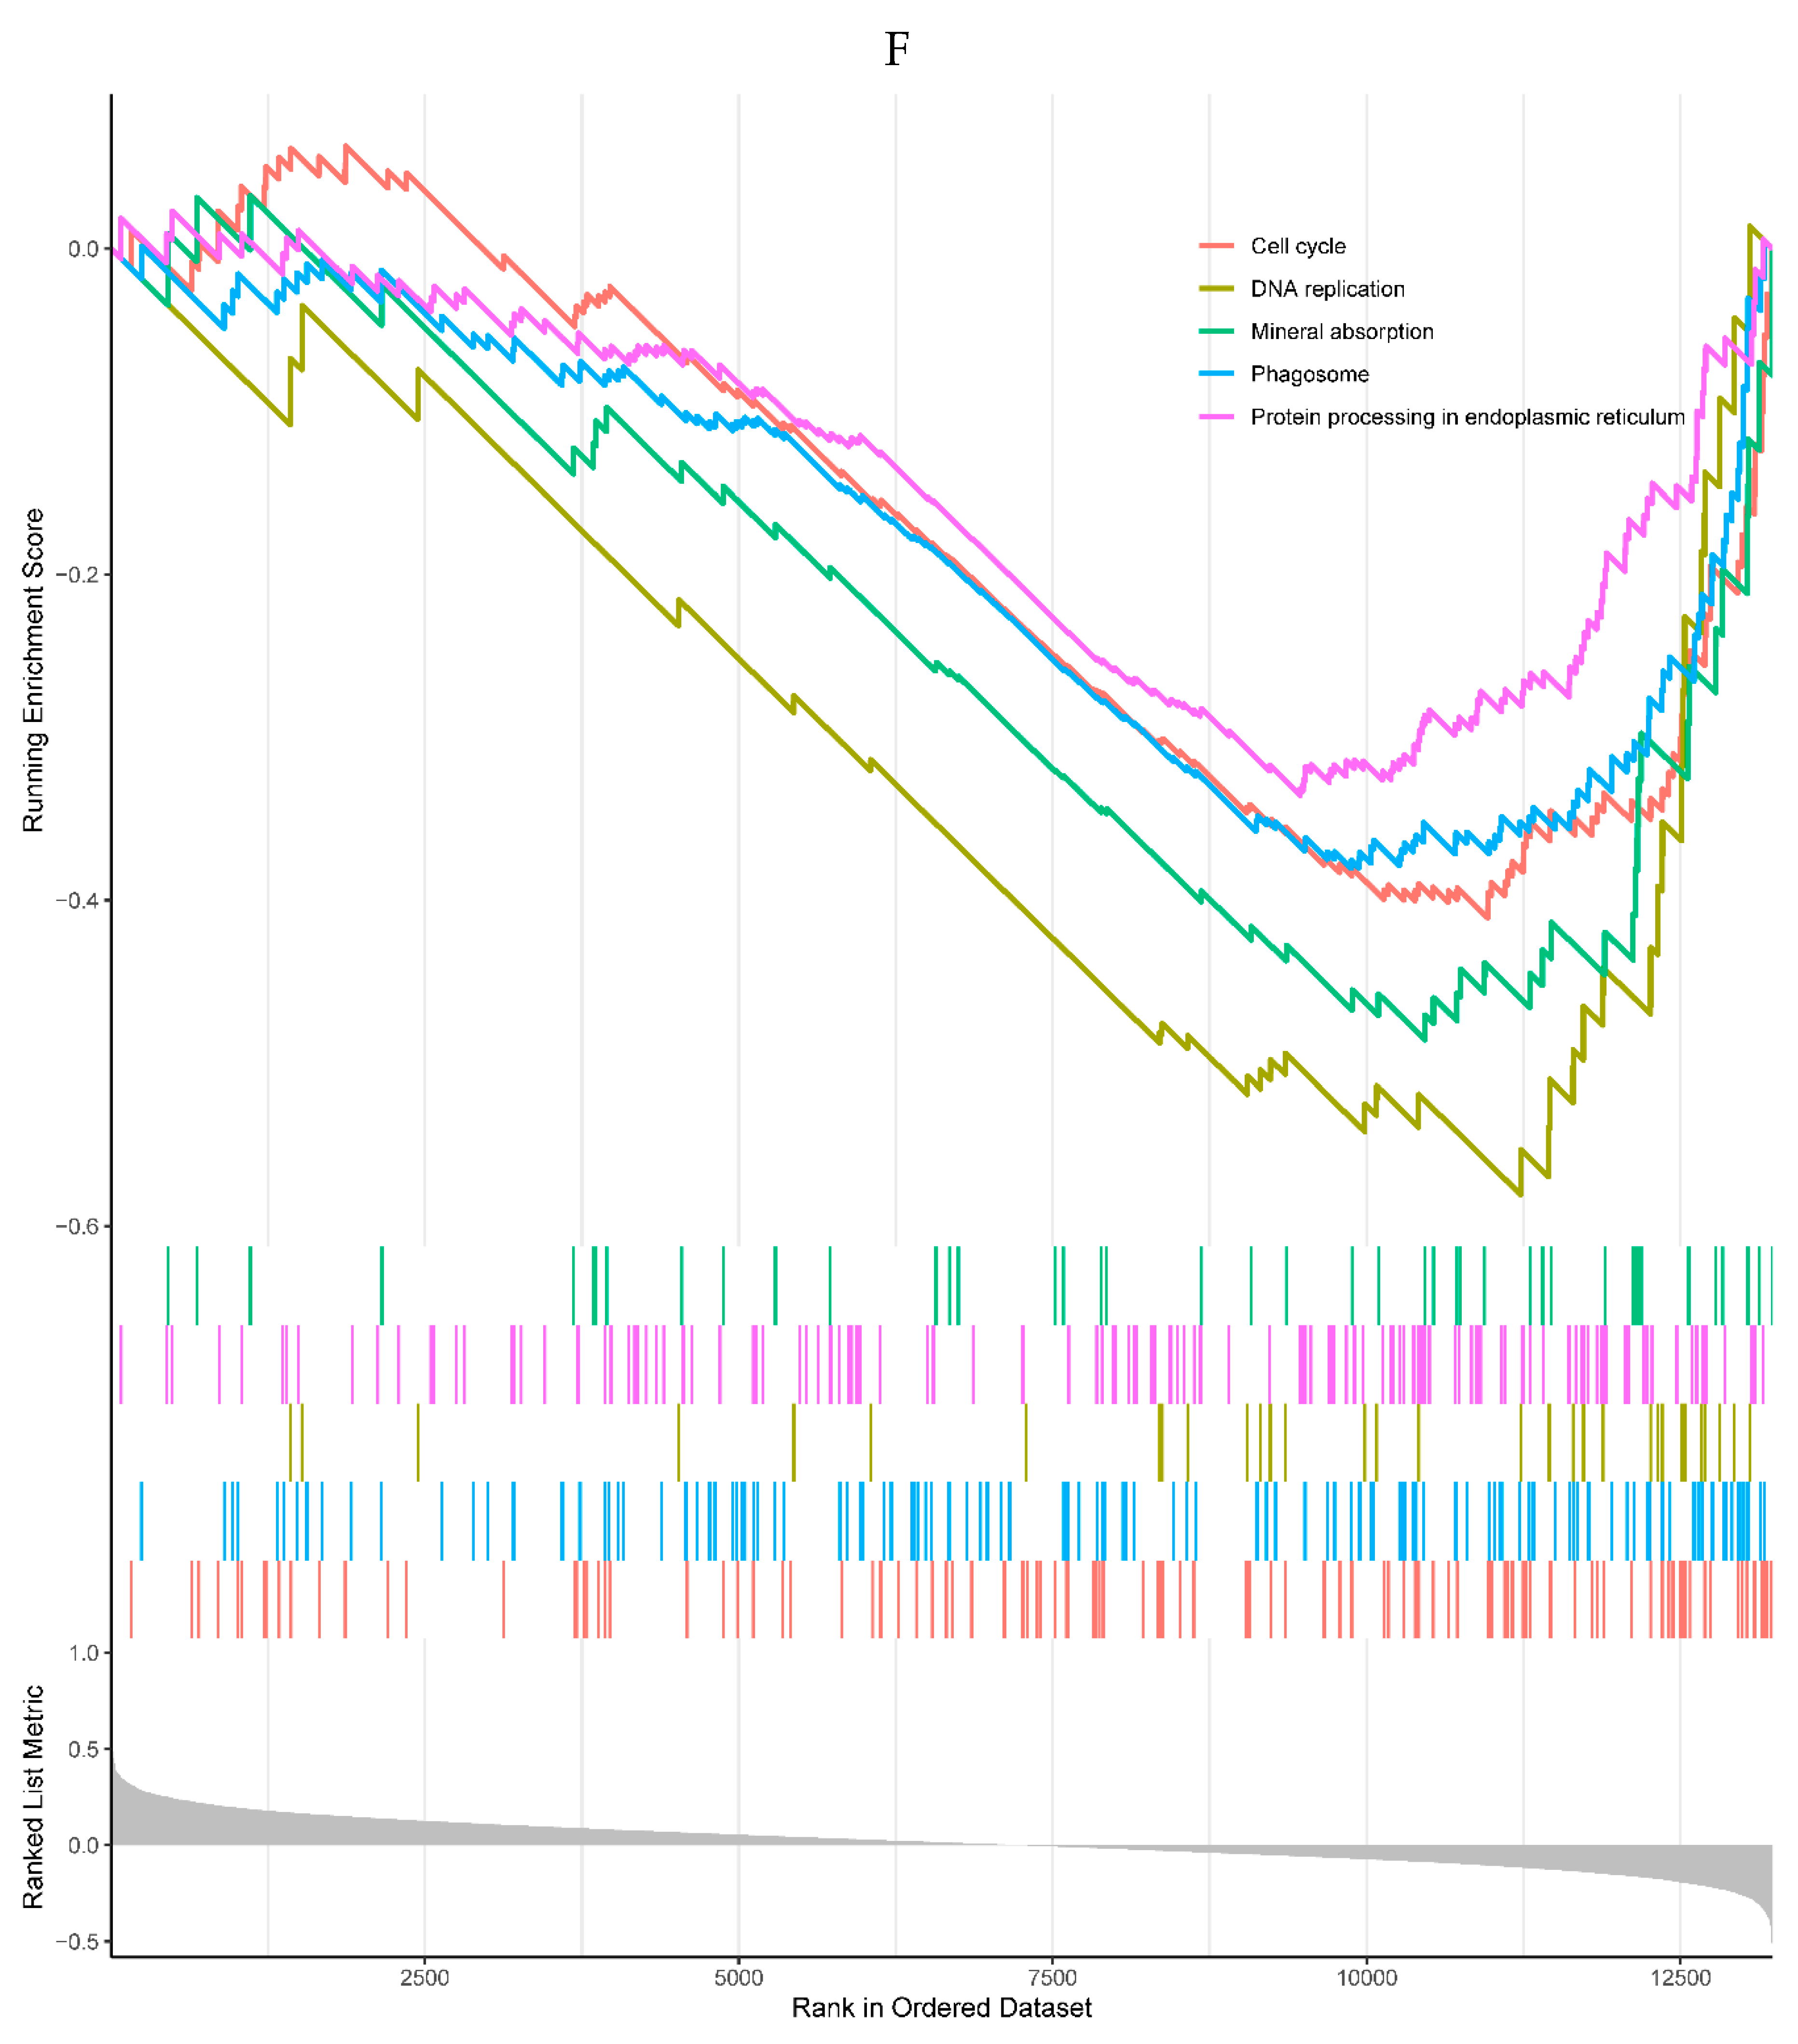
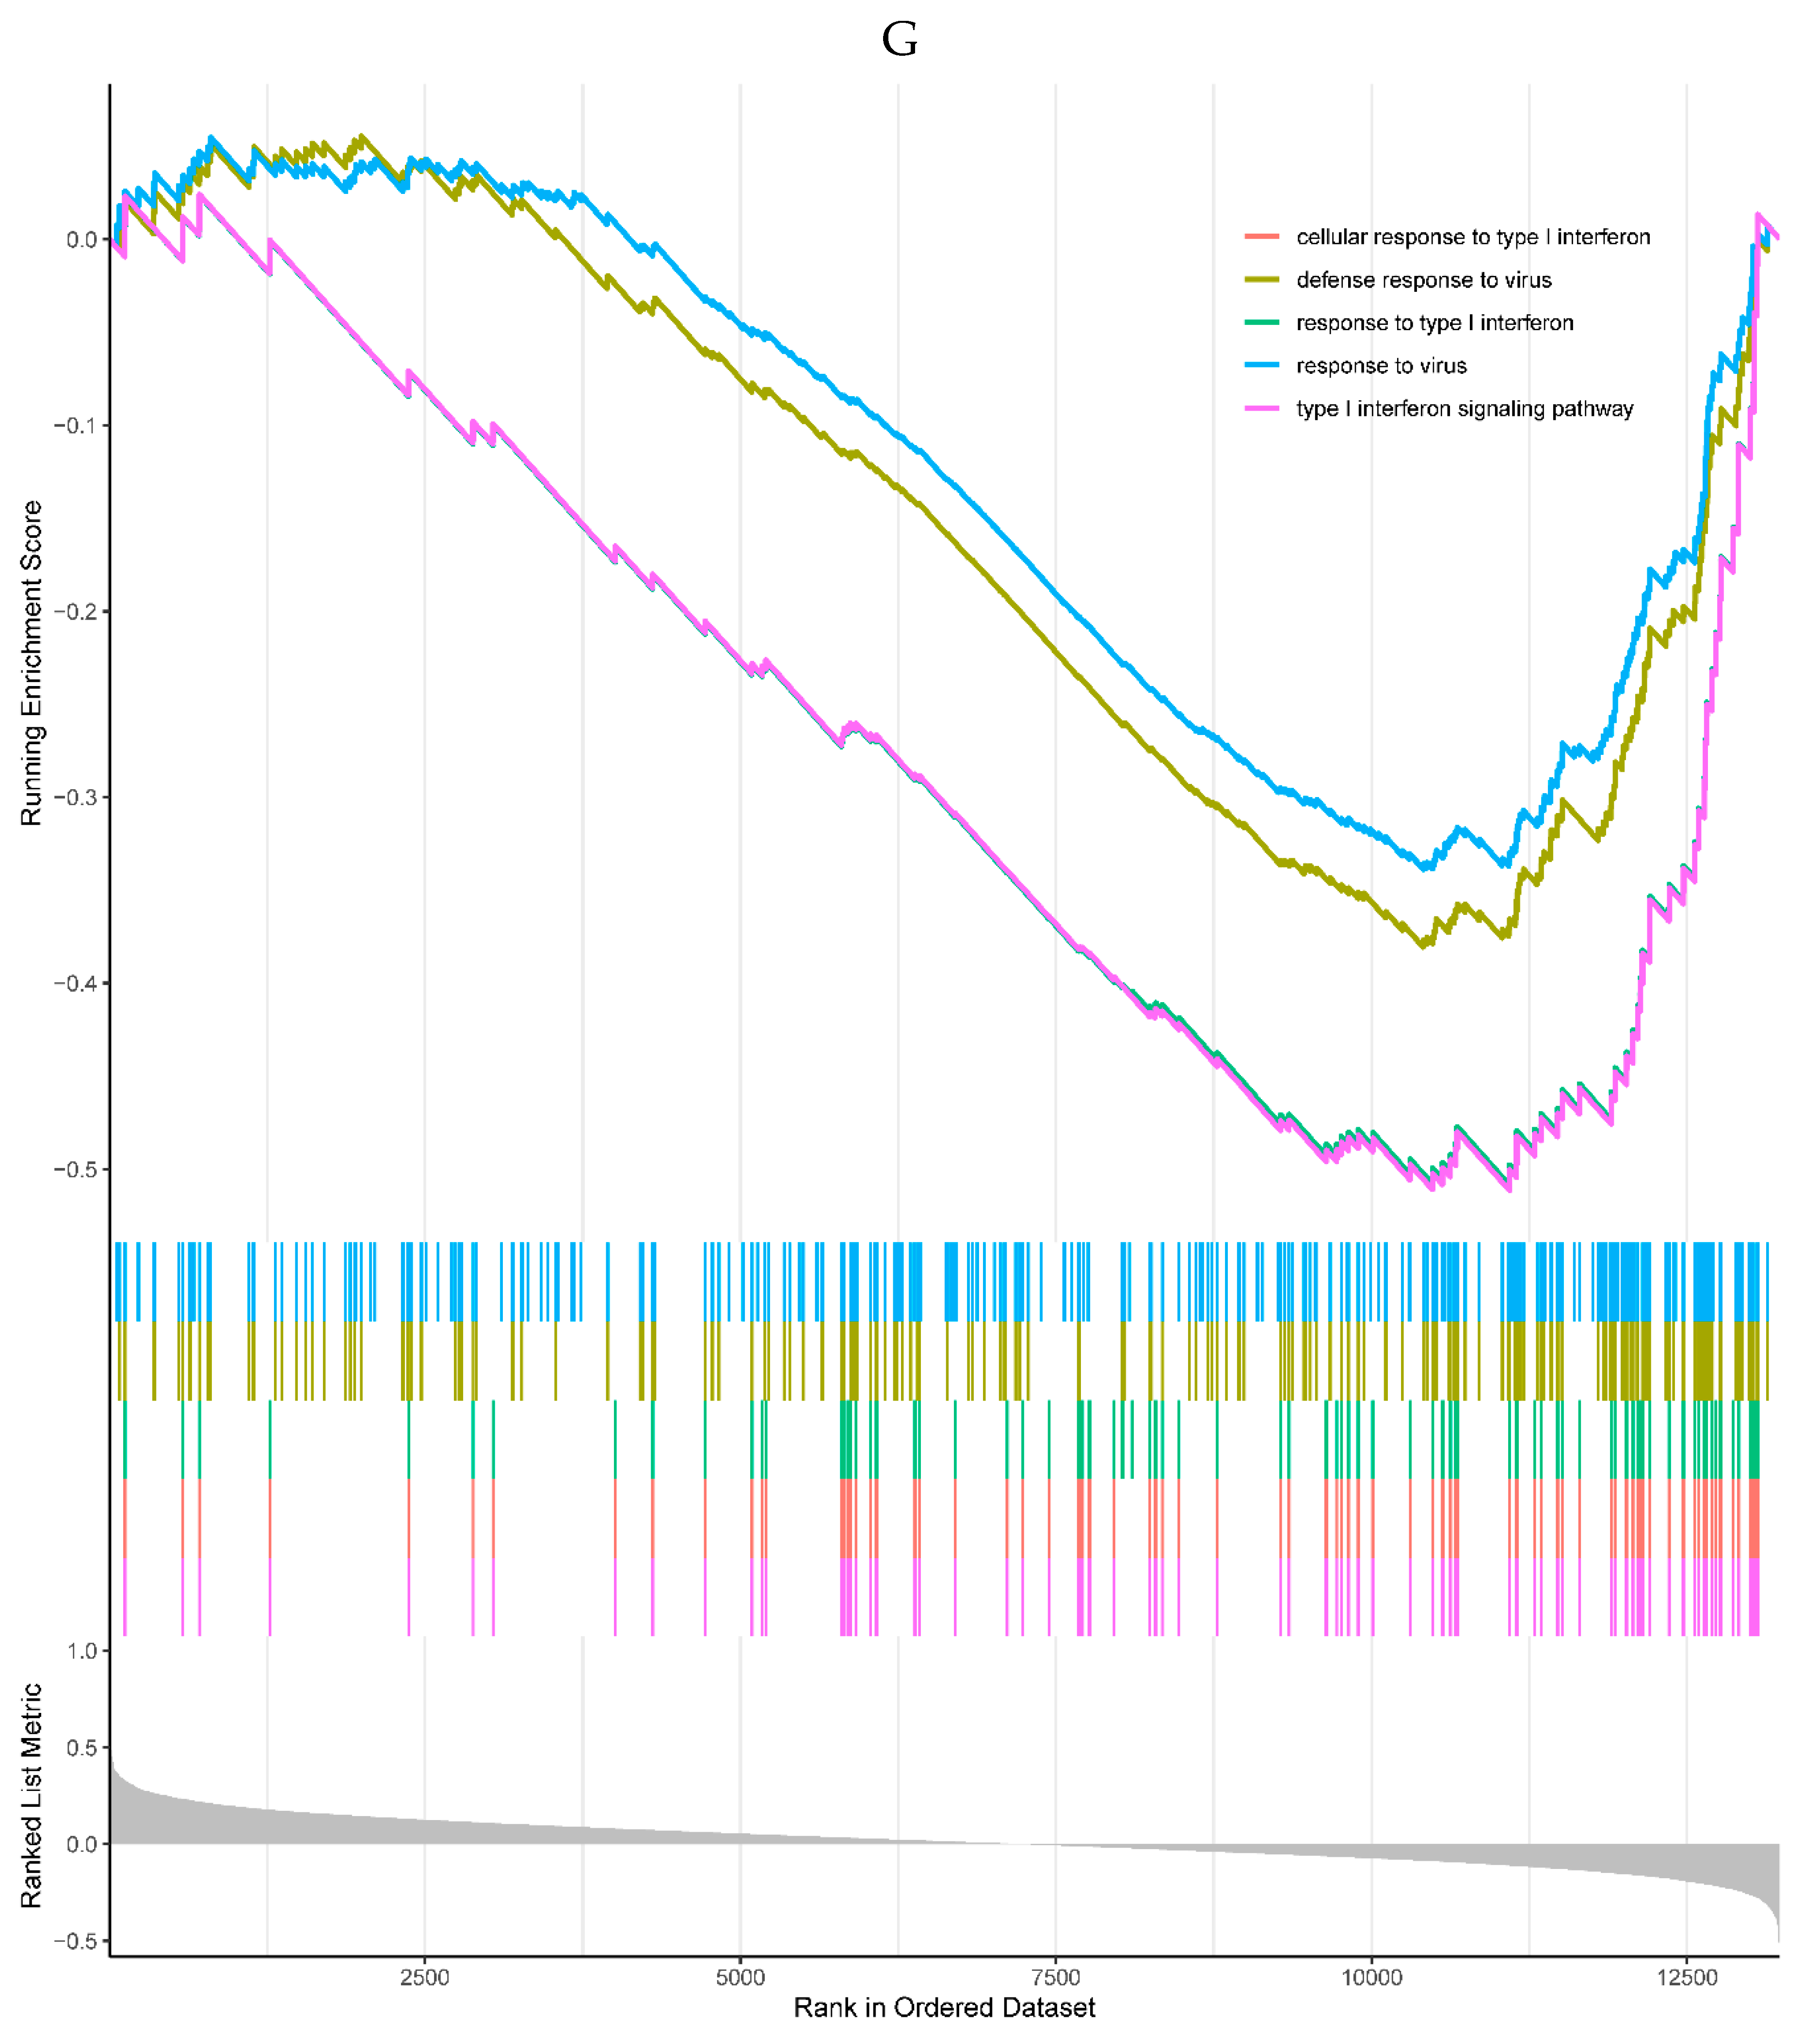
All the top 5 enriched KEGG pathways were negatively correlated with the expression of the NQO2, including cell cycle, DNA replication, mineral absorption, phagosome, and protein processing in endoplasmic reticulum pathways (Figure 6F). All the top 5 enriched GO processes in the single-gene GSEA of the NQO2 were also negatively correlated with the expression of the NQO2, mainly involved in responses to the virus (Figure 6G).
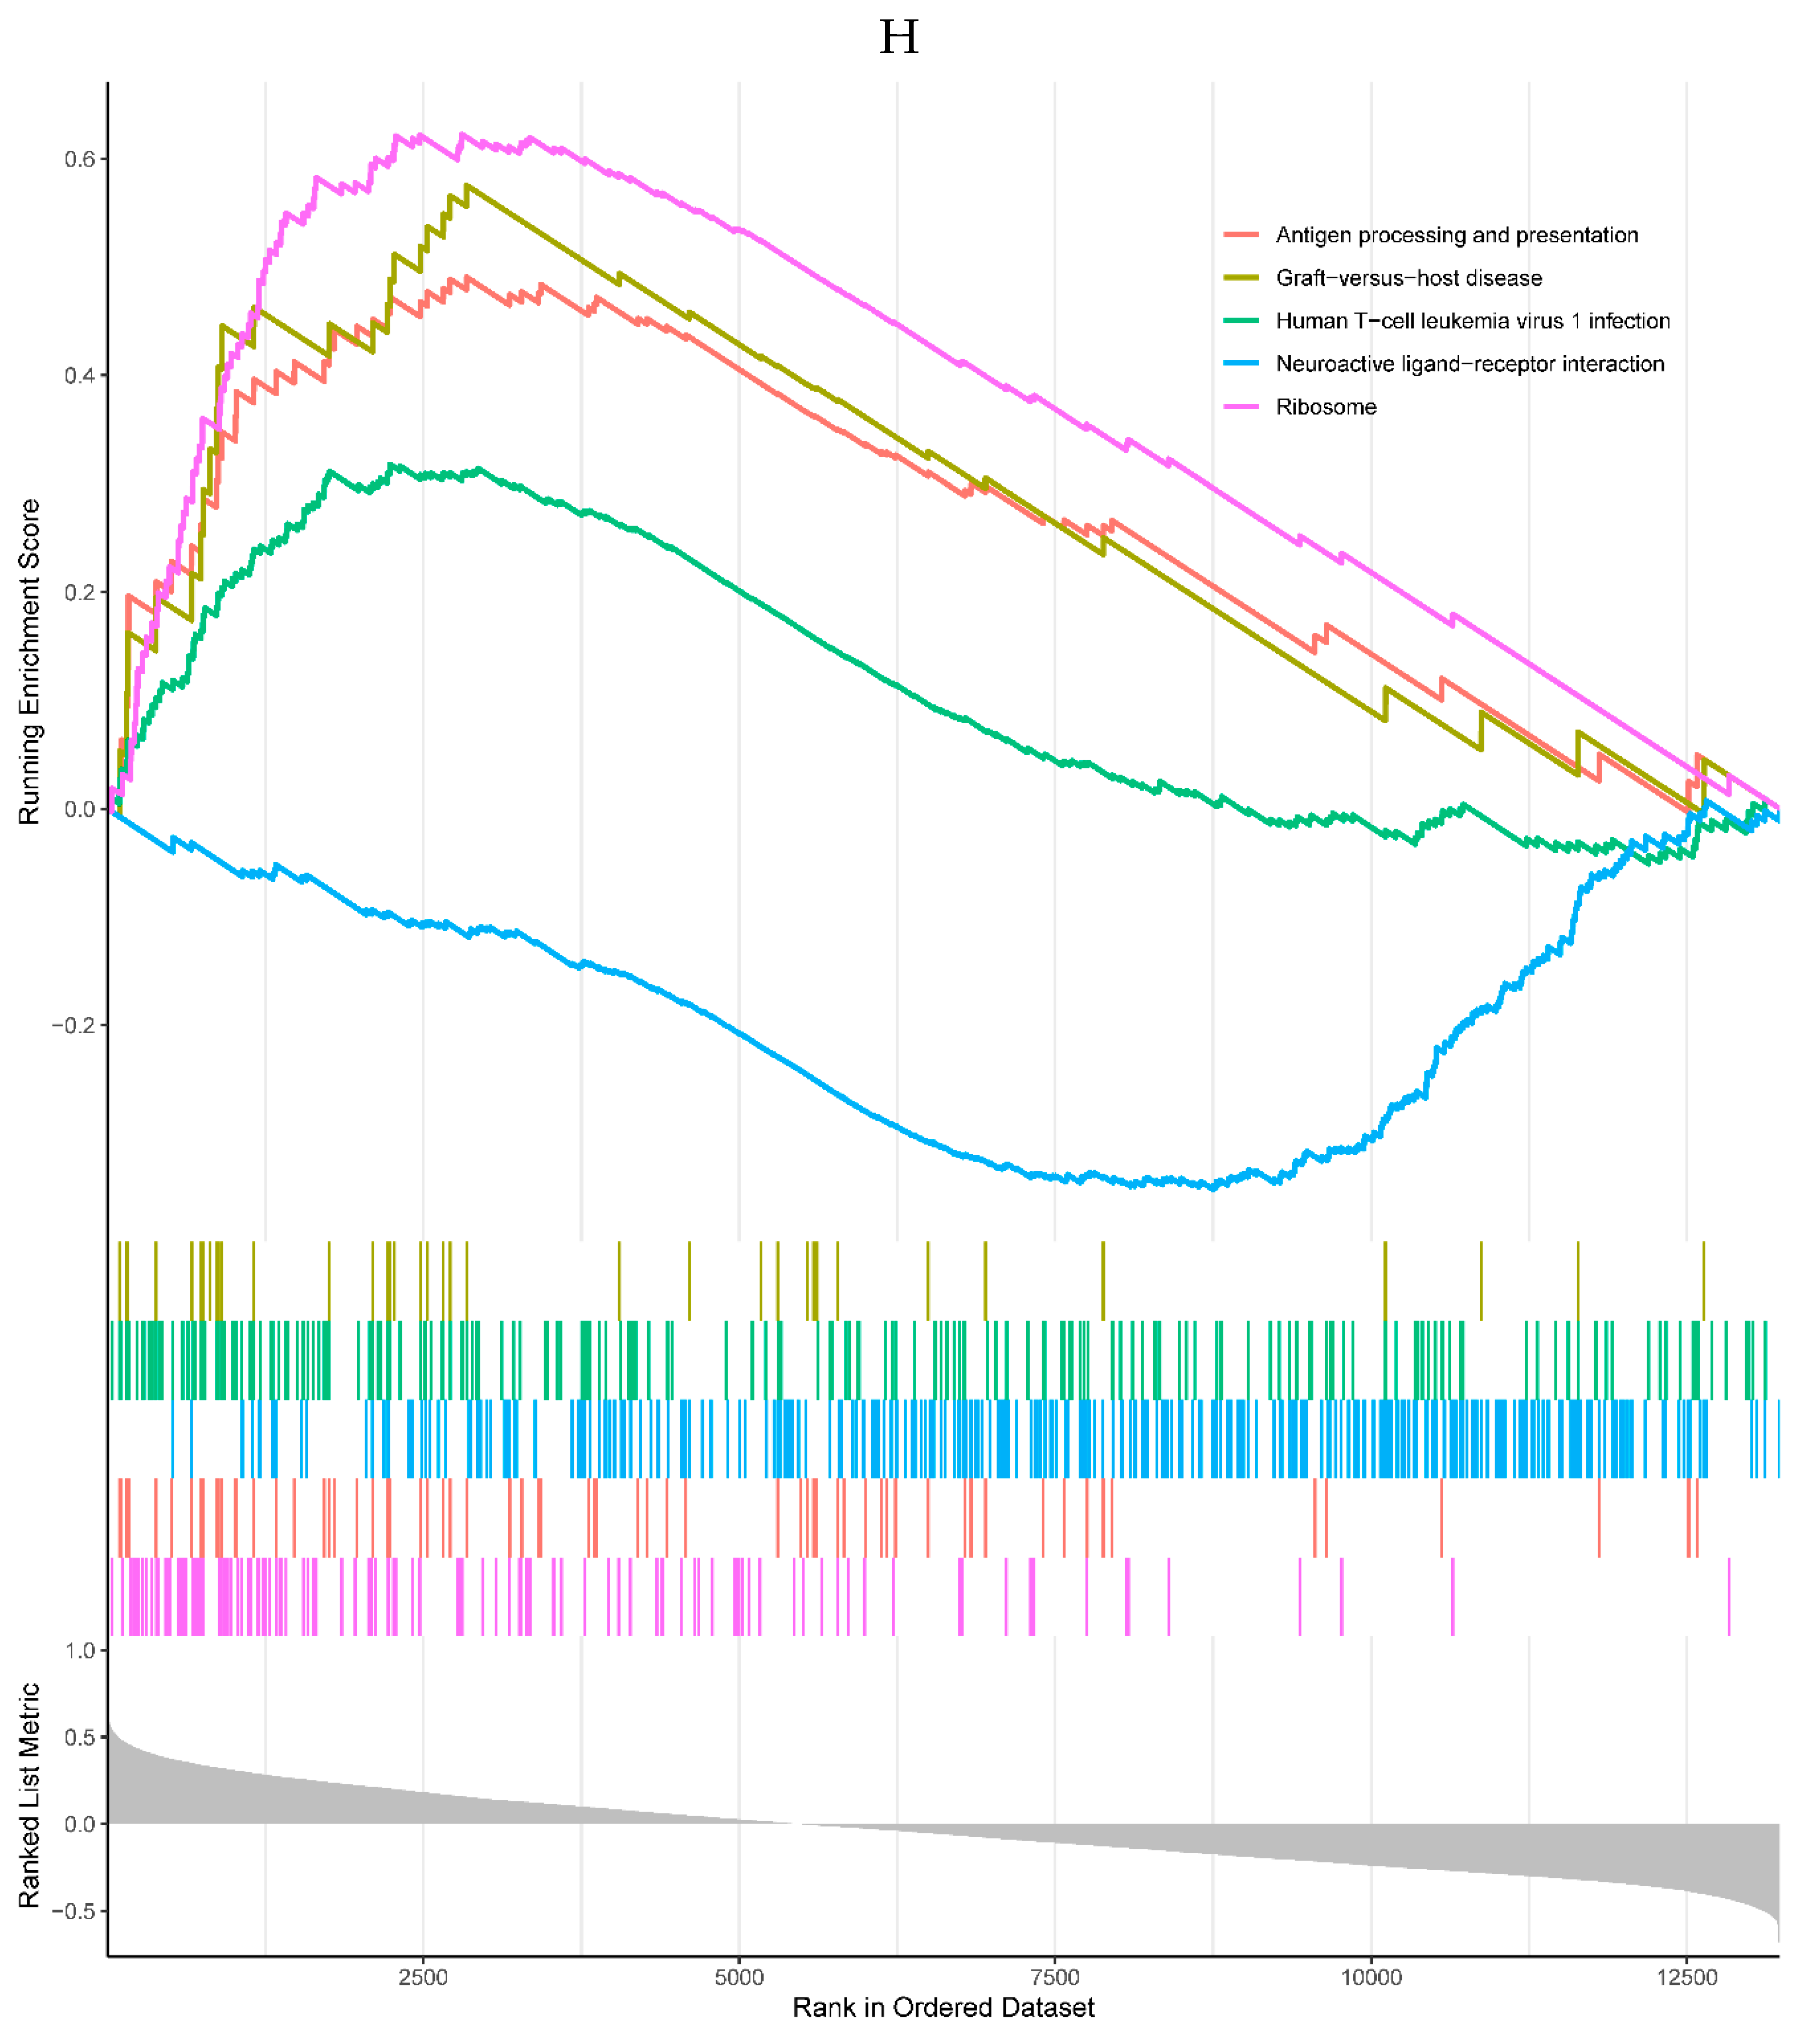
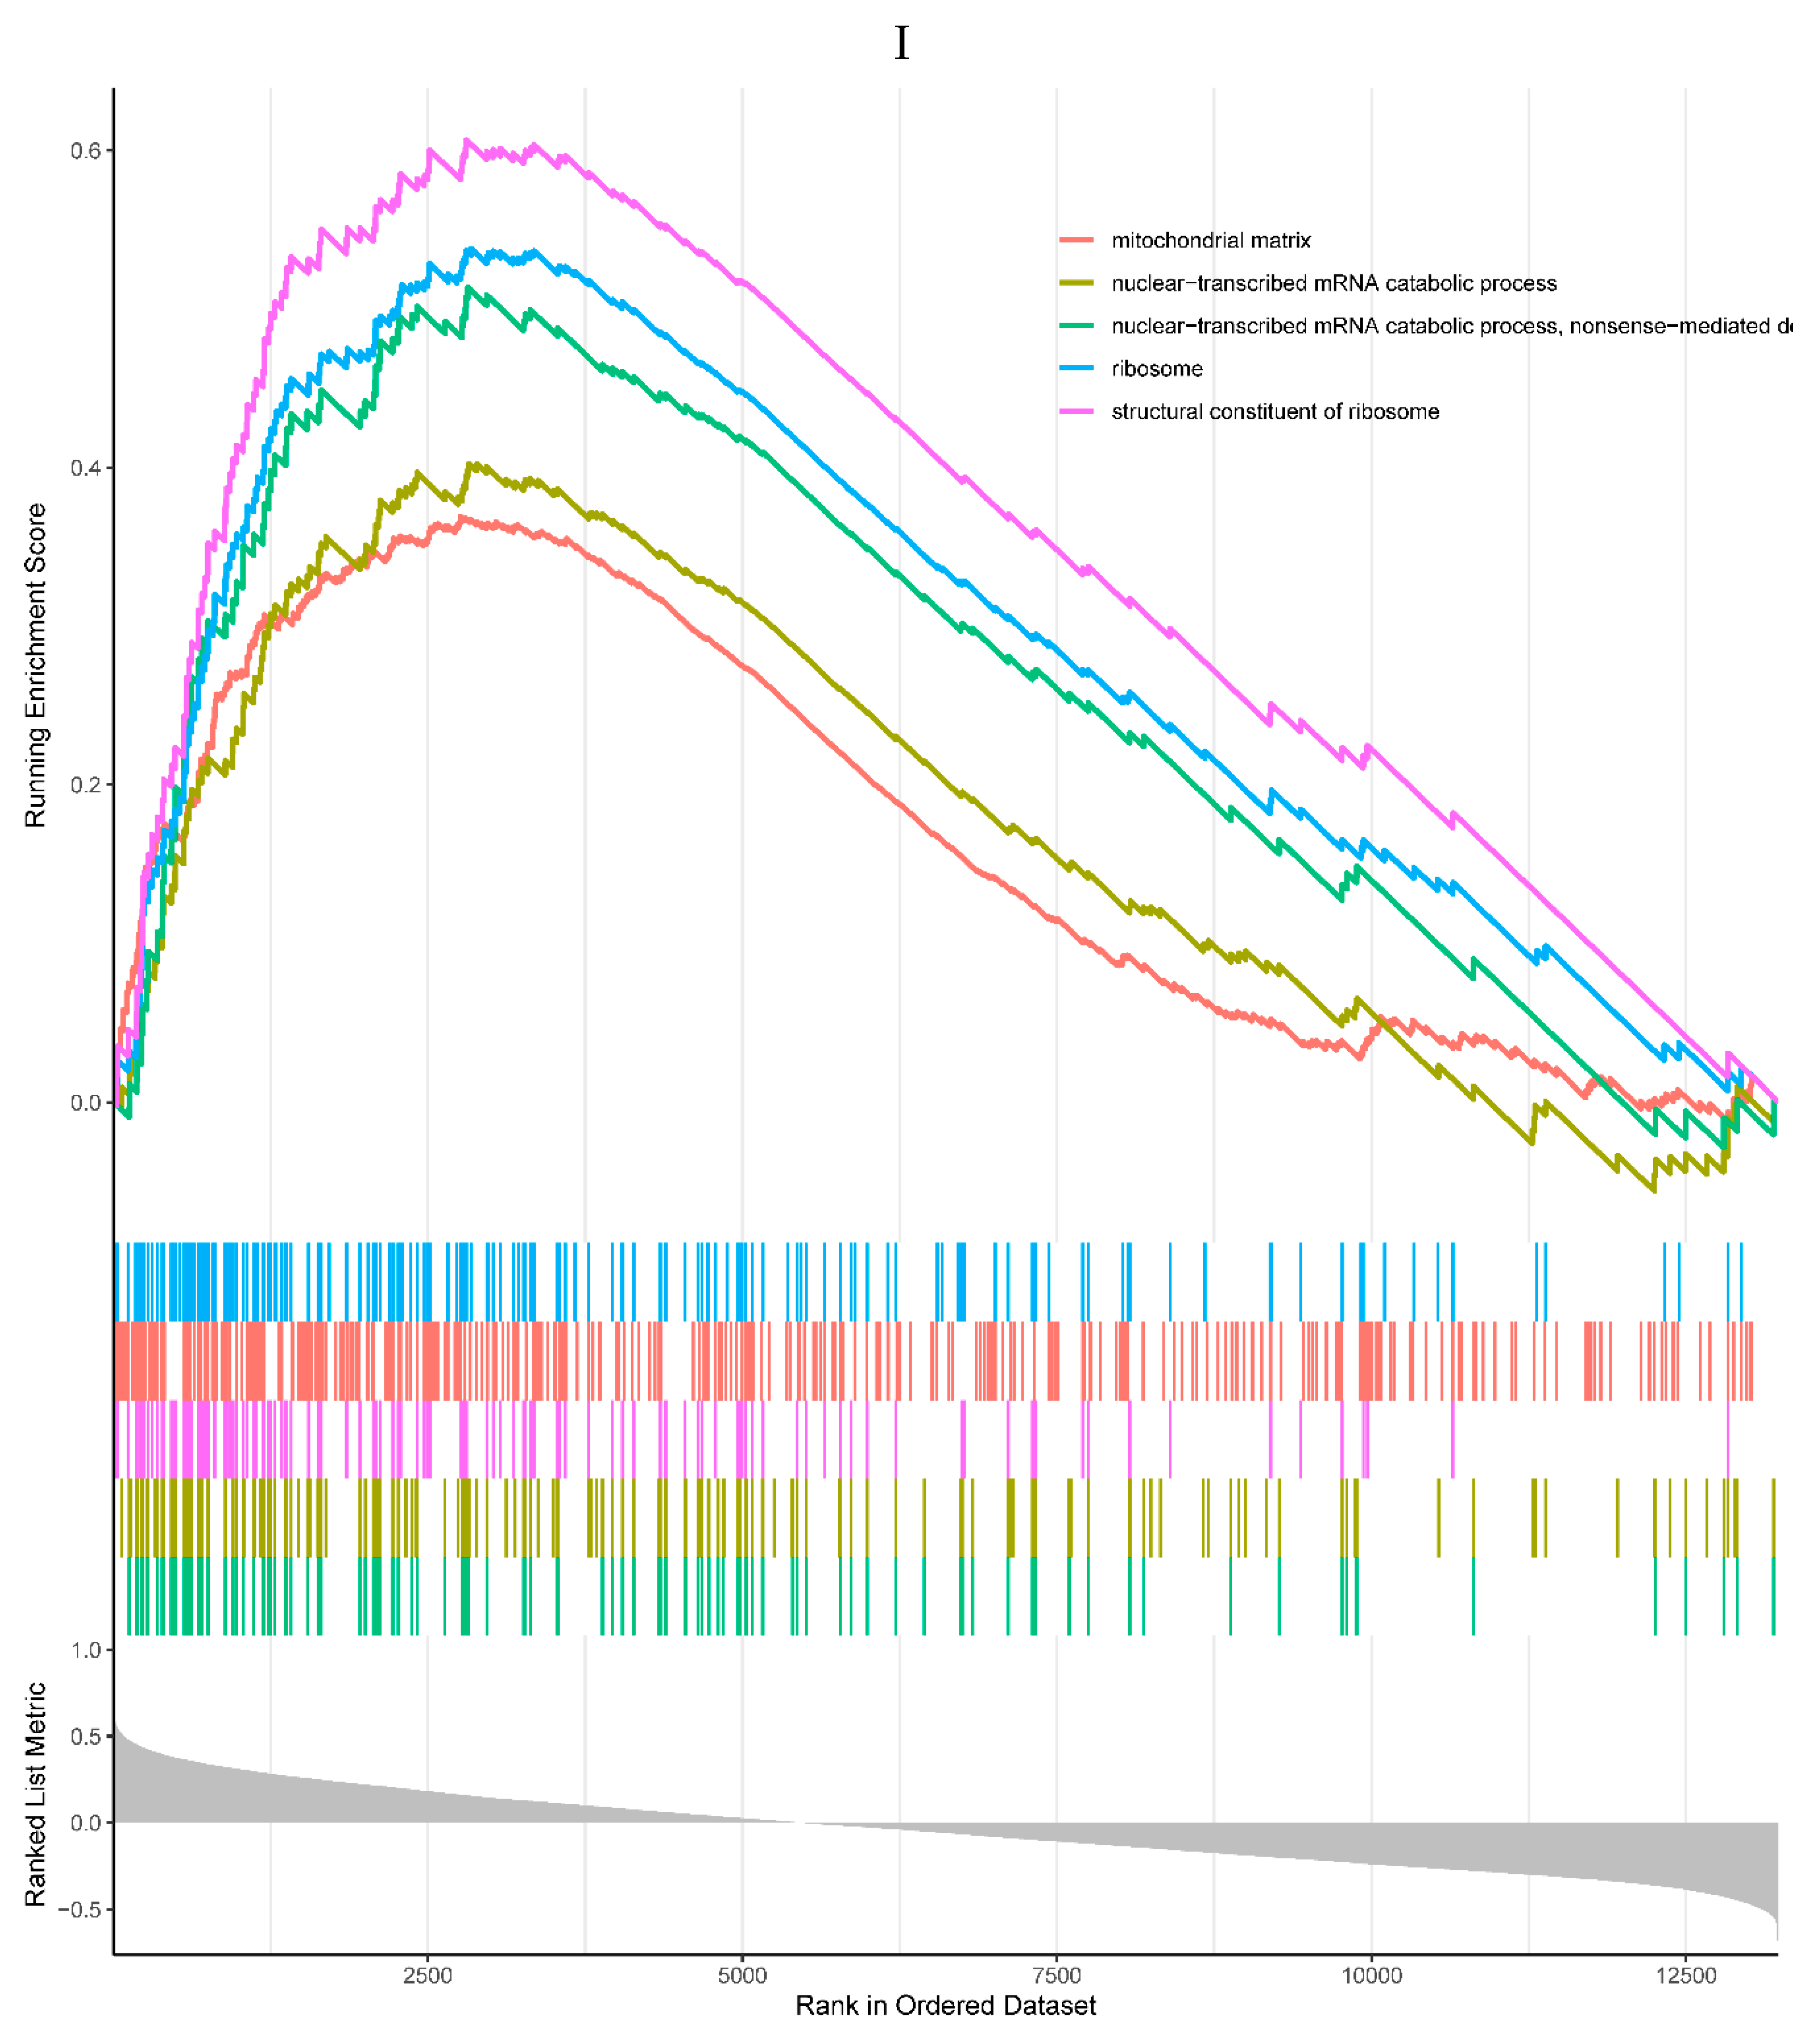
4 of the top 5 enriched KEGG pathways were positively correlated with the expression of RHOB, including antigen processing and presentation, graft-versus-host disease, human T-cell leukemia virus 1 infection, and ribosome pathways. One negatively correlated KEGG pathway was neuroactive ligand-receptor interaction (Figure 6H). All the top 5 enriched GO processes in the single-gene GSEA of the RHOB were positively correlated with the expression of the RHOB, mainly involved in the mitochondrial matrix, mRNA catabolic processes, and ribosome (Figure 6I).
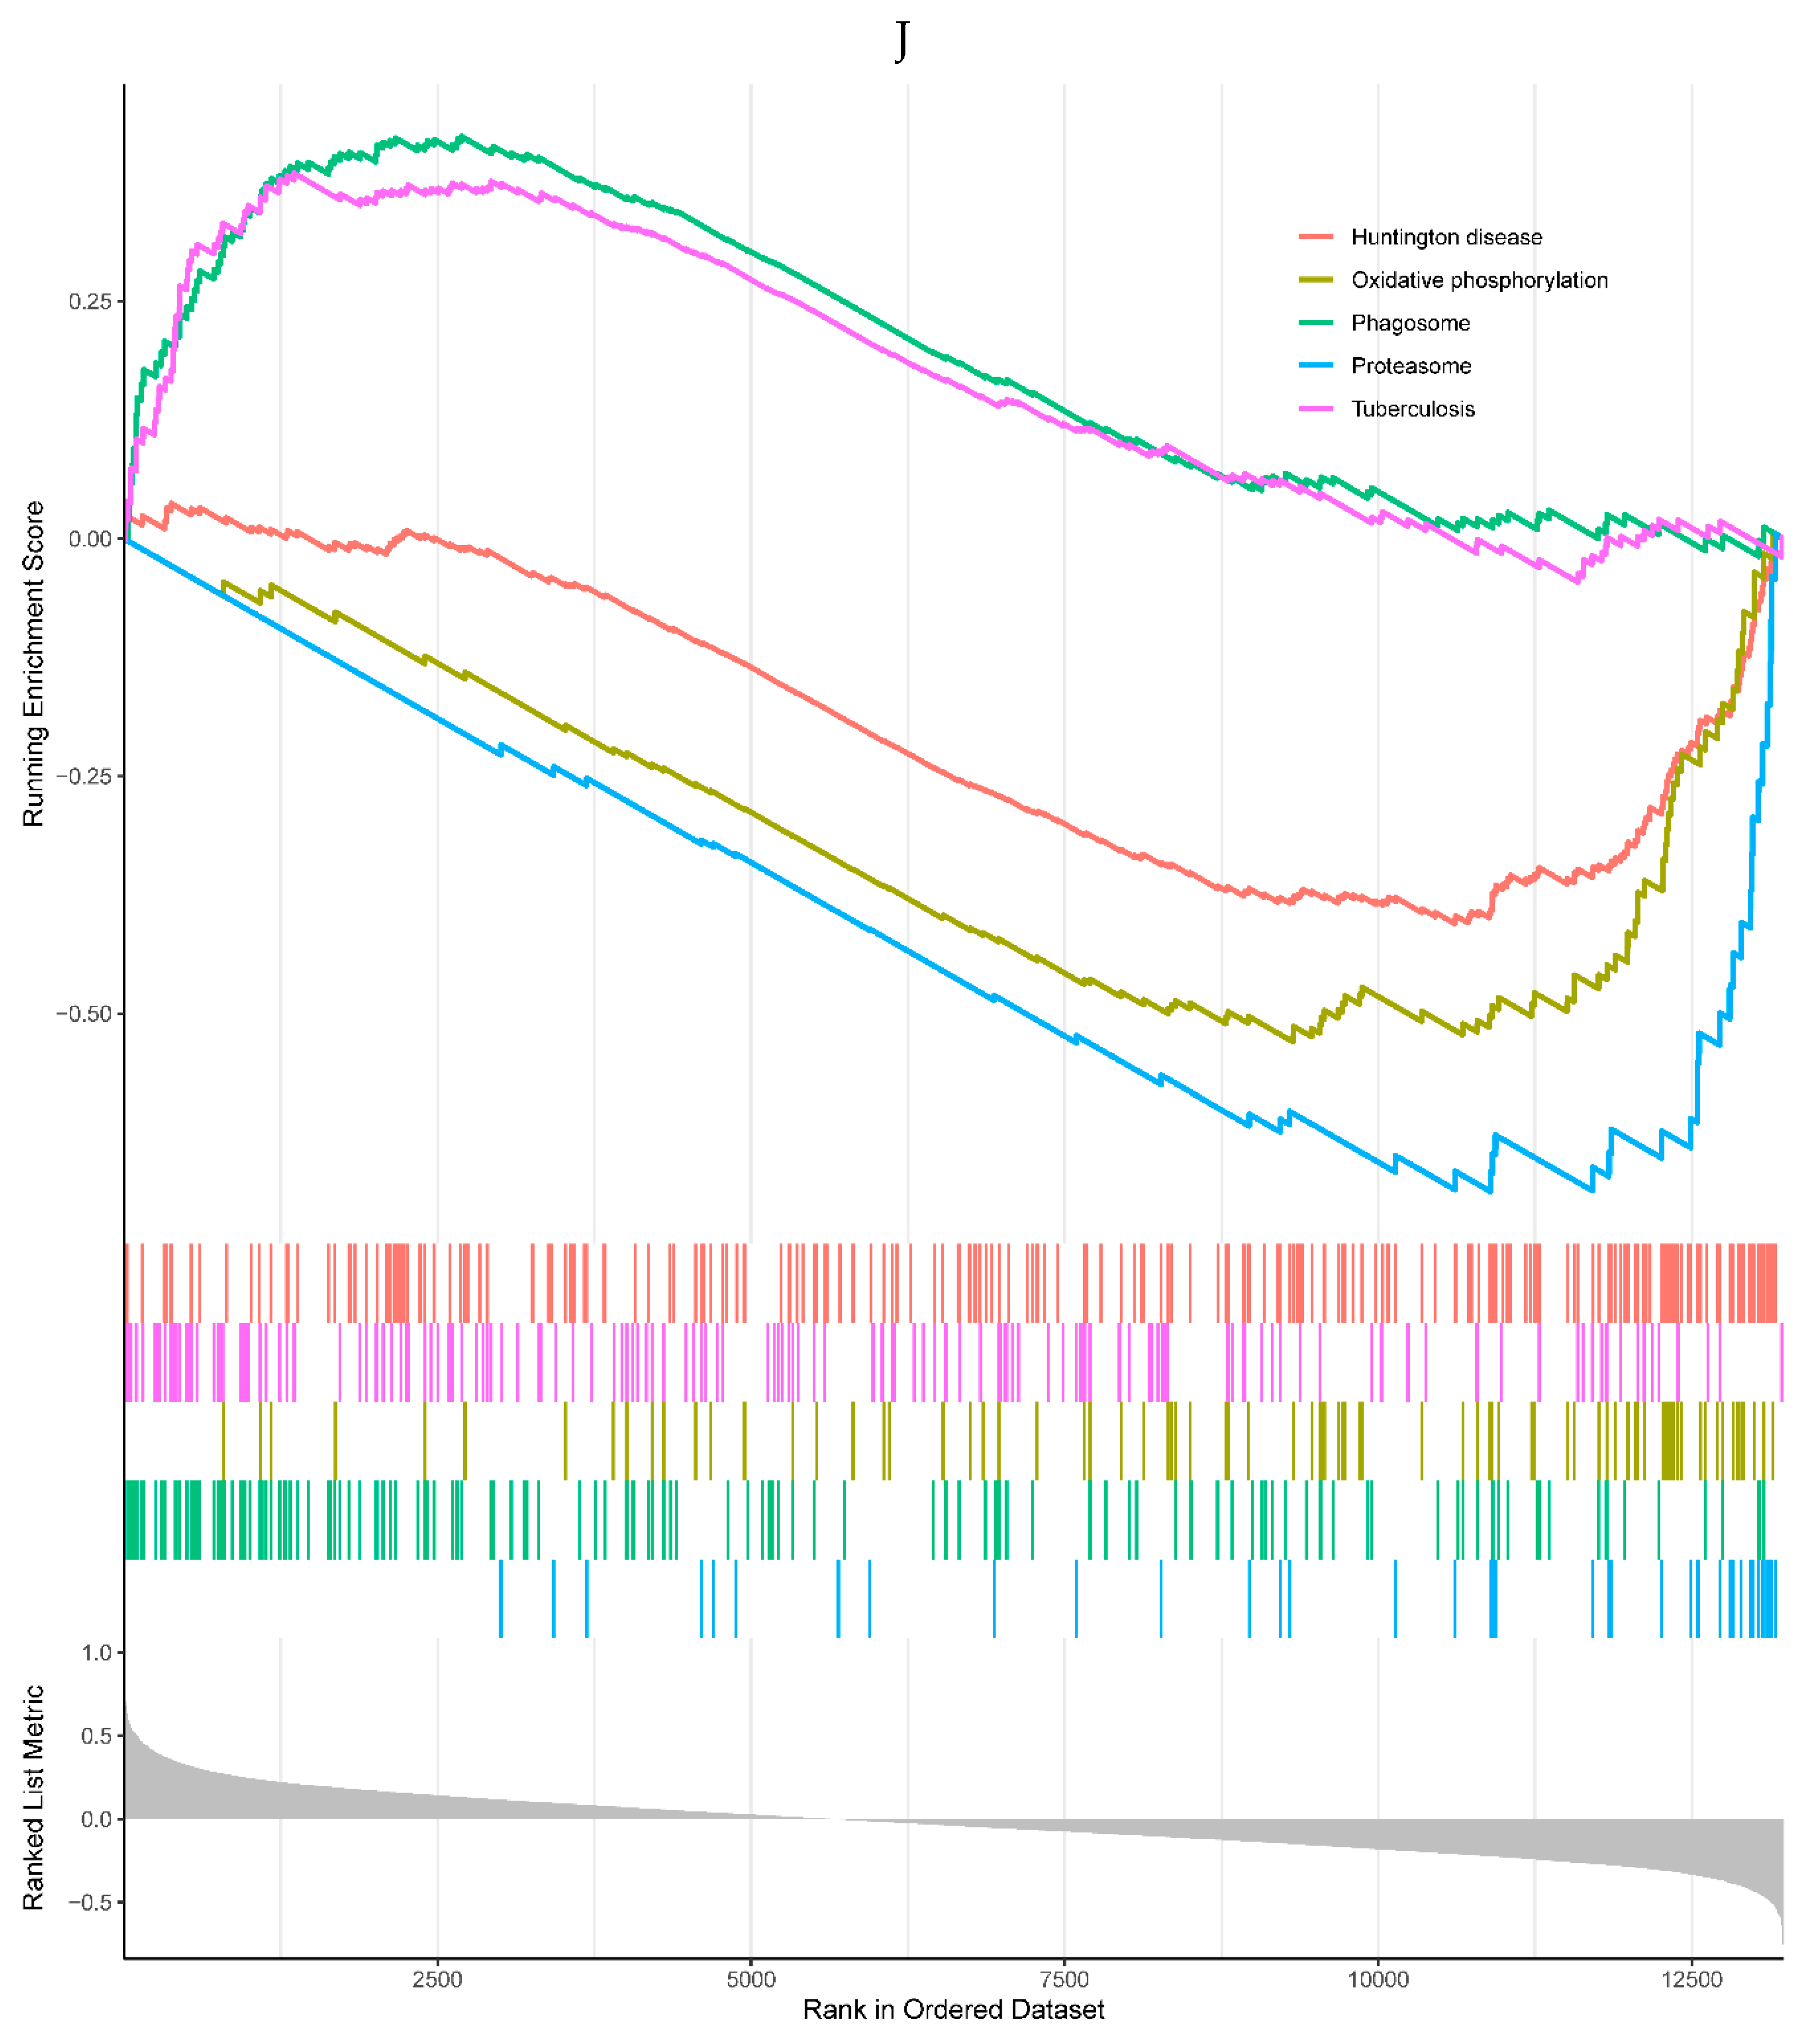
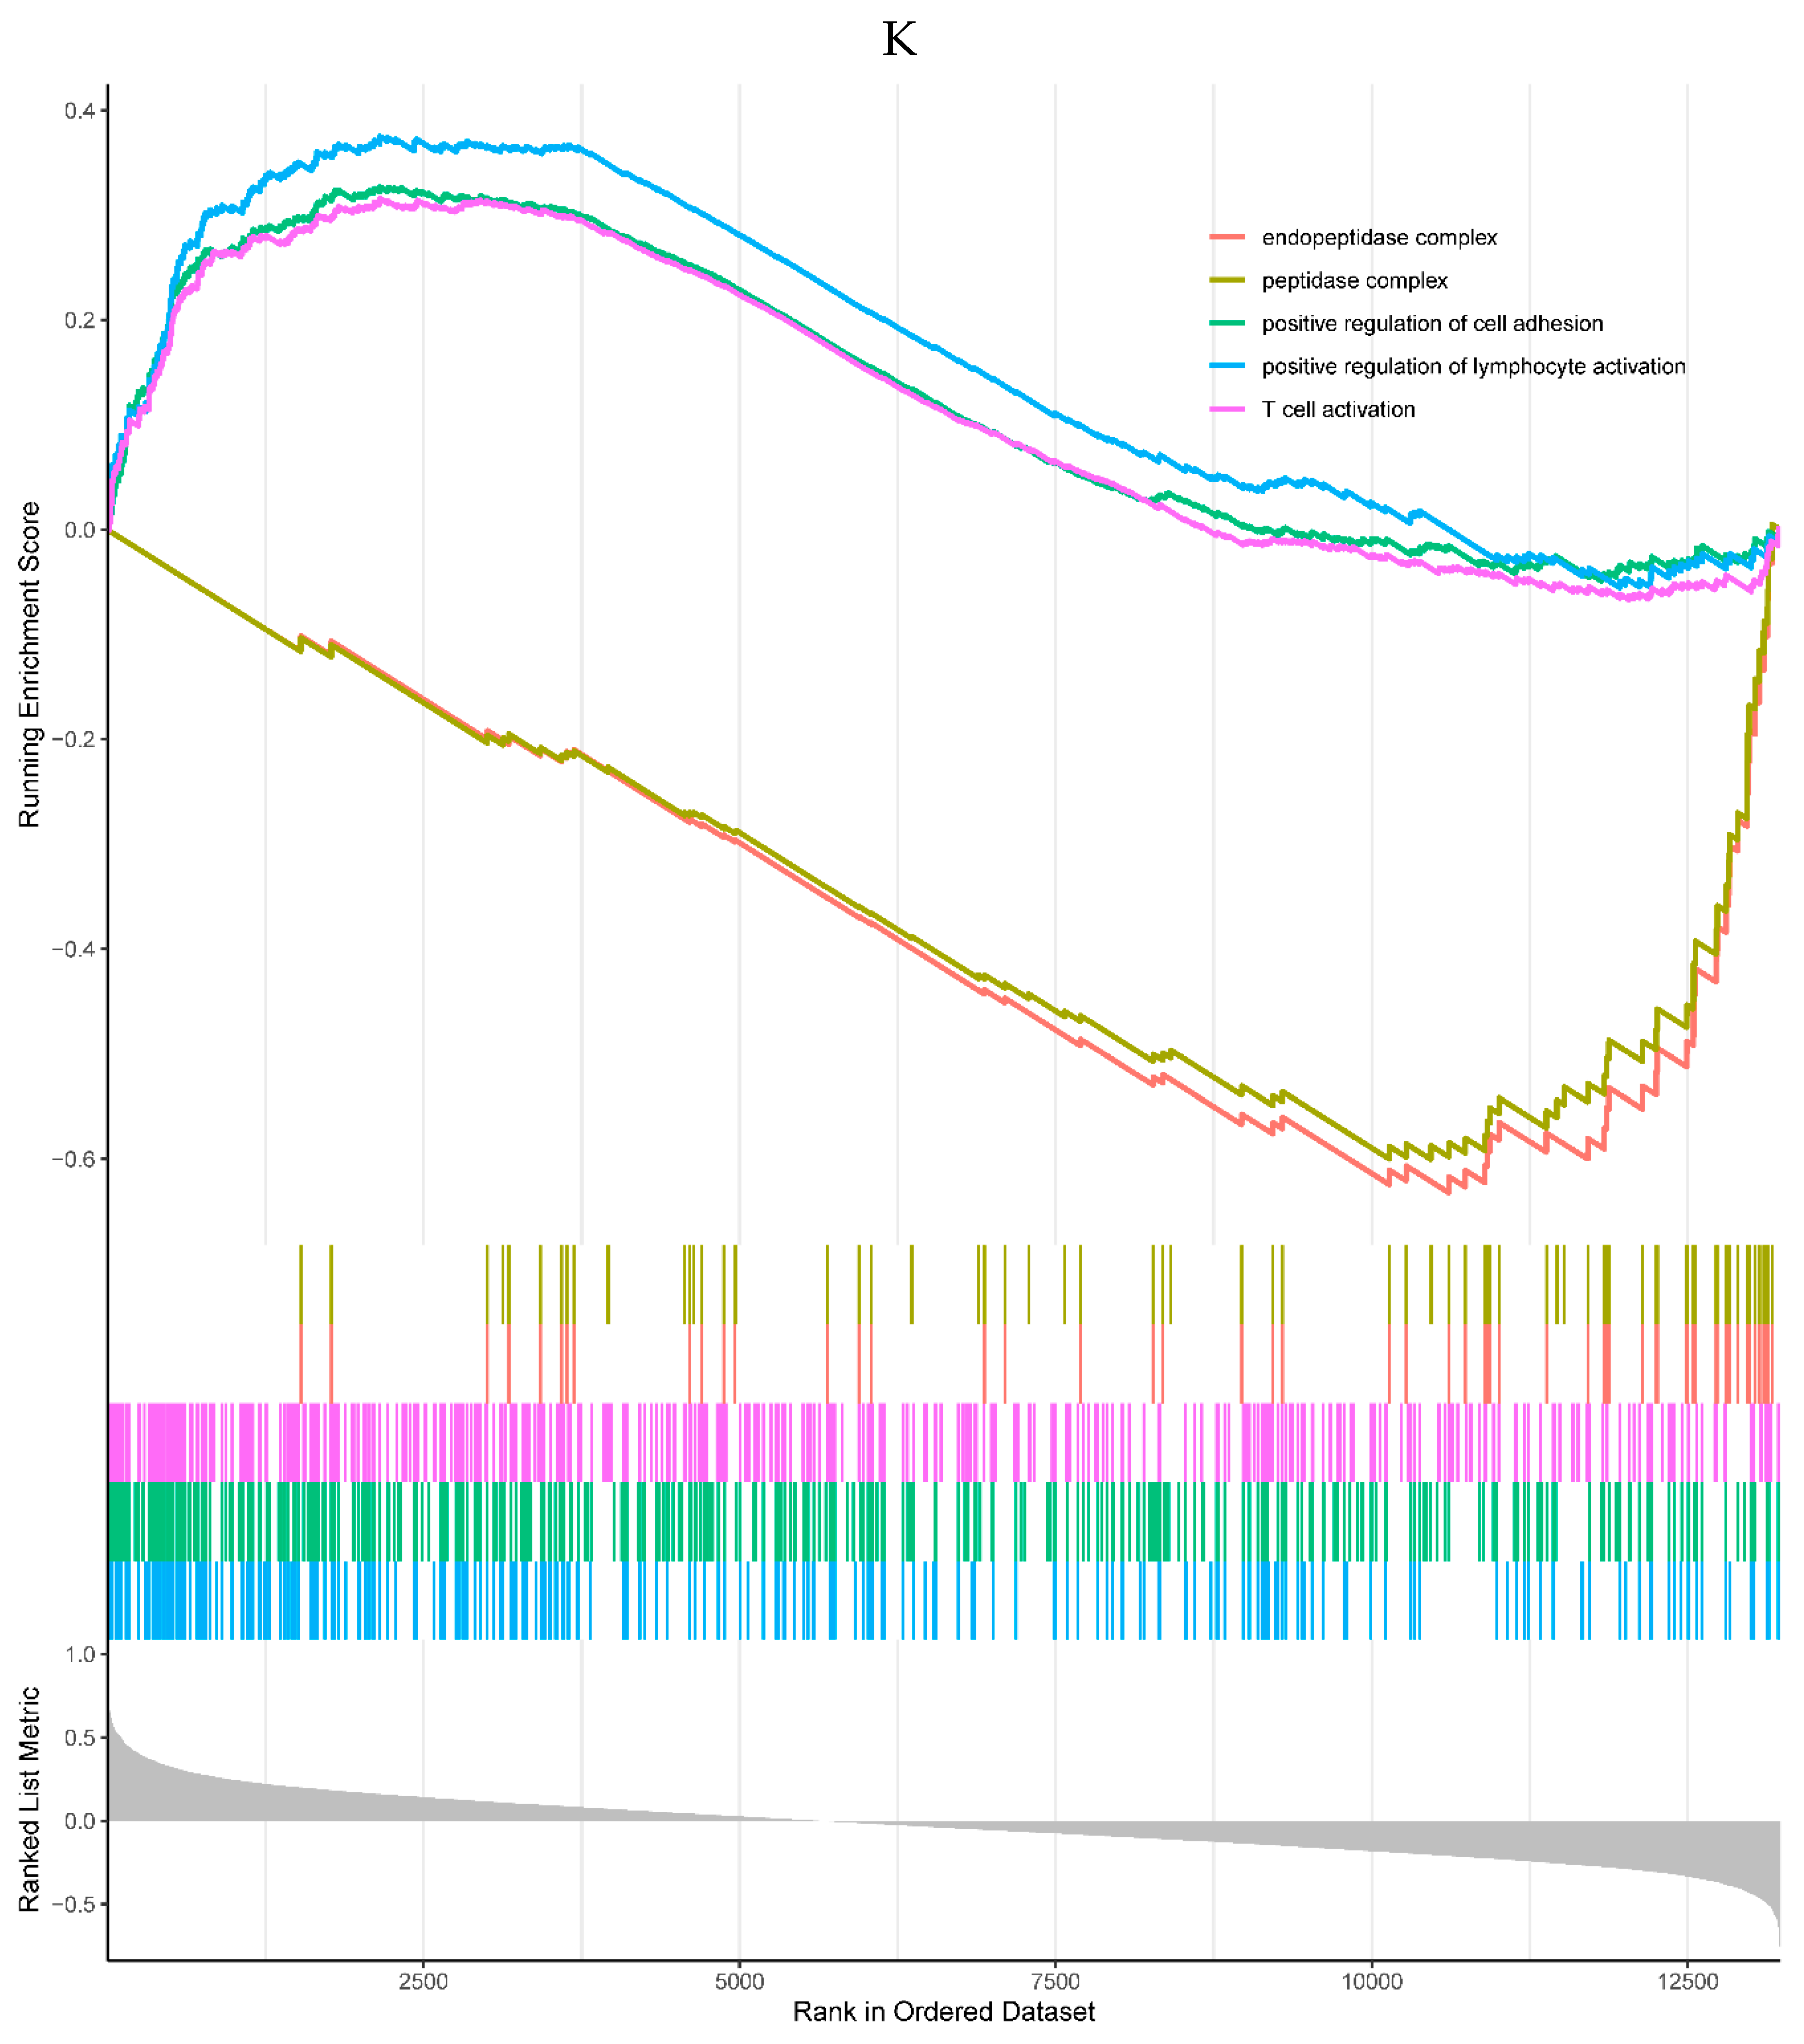
2 of the top 5 enriched KEGG pathways were positively correlated with the expression of TREM1, including phagosome and tuberculosis pathways. 3 pathways were negatively correlated with the TREM1, including Huntington's disease, oxidative phosphorylation, and proteasome pathways (Figure 6J). 3 of the top 5 GO processes were positively correlated with the expression of the TREM1, including positive regulation of cell adhesion, positive regulation of lymphocyte activation, and T cell activation. 2 GO processes were negatively correlated with the TREM1, including peptide complex and endopeptidase complex (Figure 6K).

3.7. Gene interaction network and gene function analysis

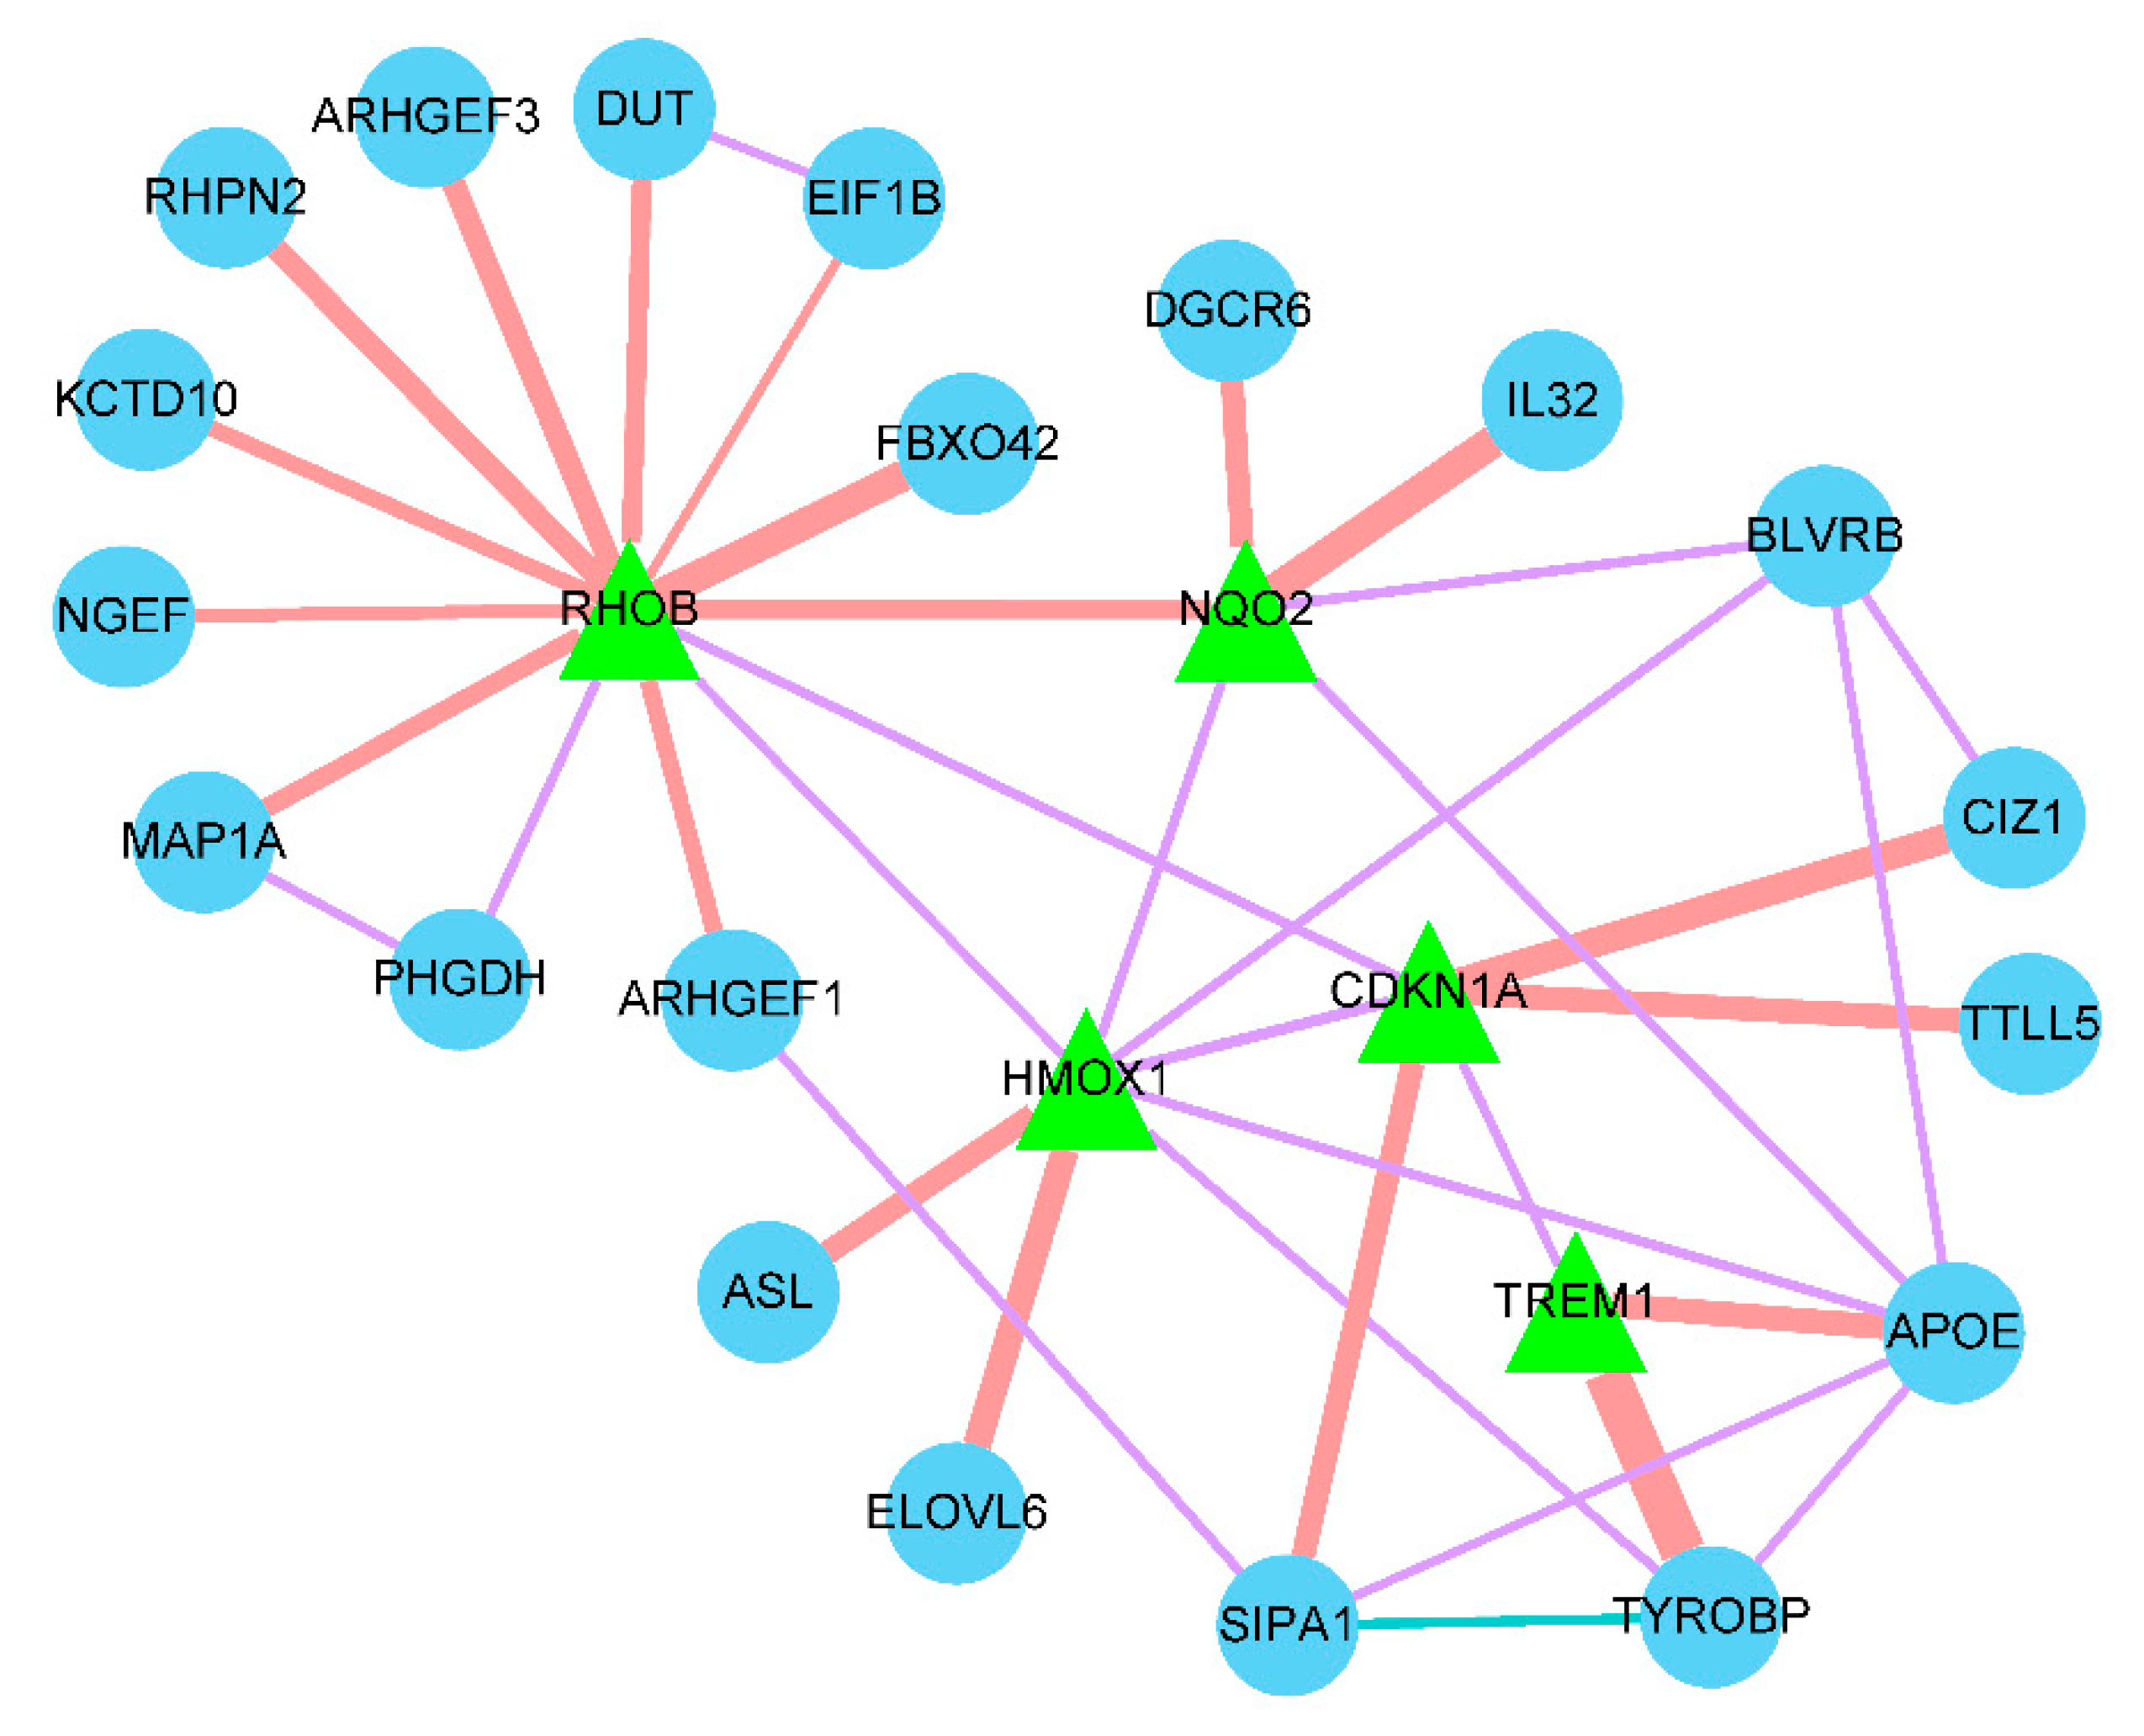
To evaluate the relationship between the 6 diagnostic biomarkers, GeneMANIA was used to analyze their interactions among each other and other related genes. The results showed that the RHOB had a direct co-expression link with HMOX1 and CDKN1A, HMOX1 had a direct co-expression link with NQO2 and CDKN1A, CDKN1A had a direct co-expression link with TREM1, and RHOB had a direct physical interaction link with NQO2. No diagnostic biomarker was found to have any type of direct interaction with HIST1H4H (Figure 7).
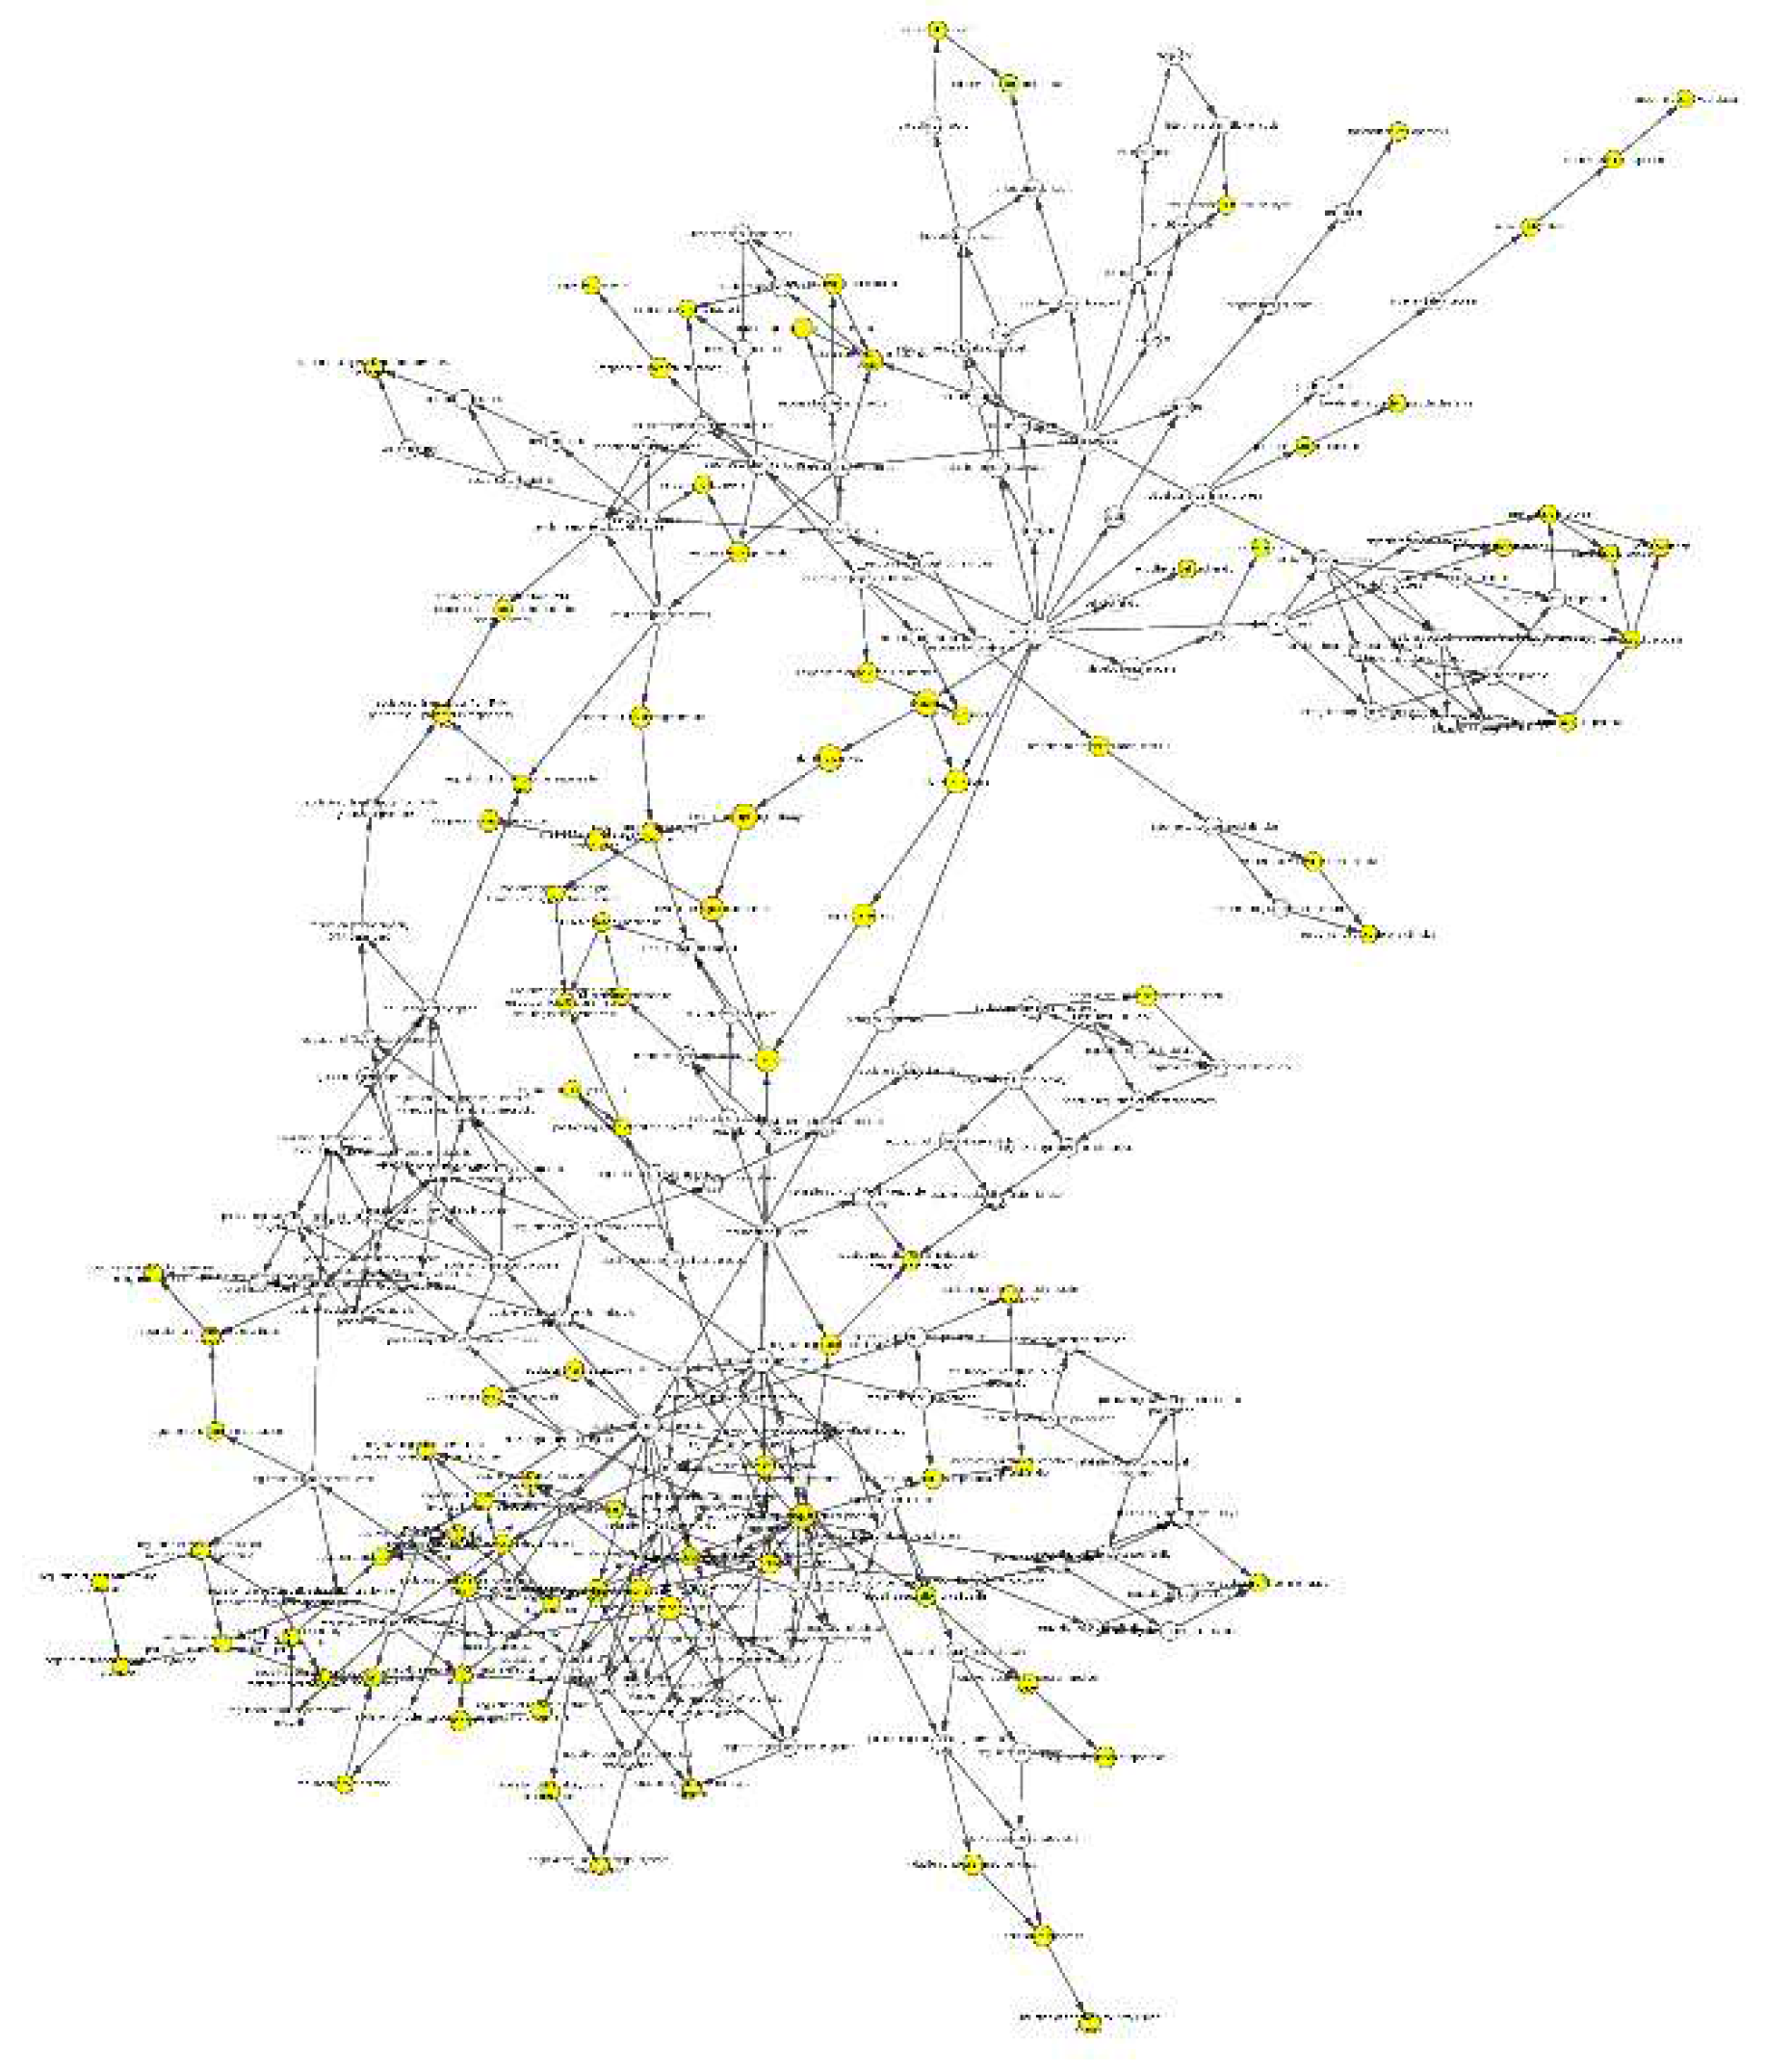
To predict the function of the diagnostic biomarkers, GO enrichment was conducted using the Cytoscape plugin “BiNGO”. According to the results, the most correlated biological GO functions include intracellular signaling pathway, positive regulation of anti-apoptosis, regulation of anti-apoptosis, and intracellular signal transduction. The hierarchy of the significantly enriched biological functions is shown in Figure 8.

3.8. Drug-gene interactions

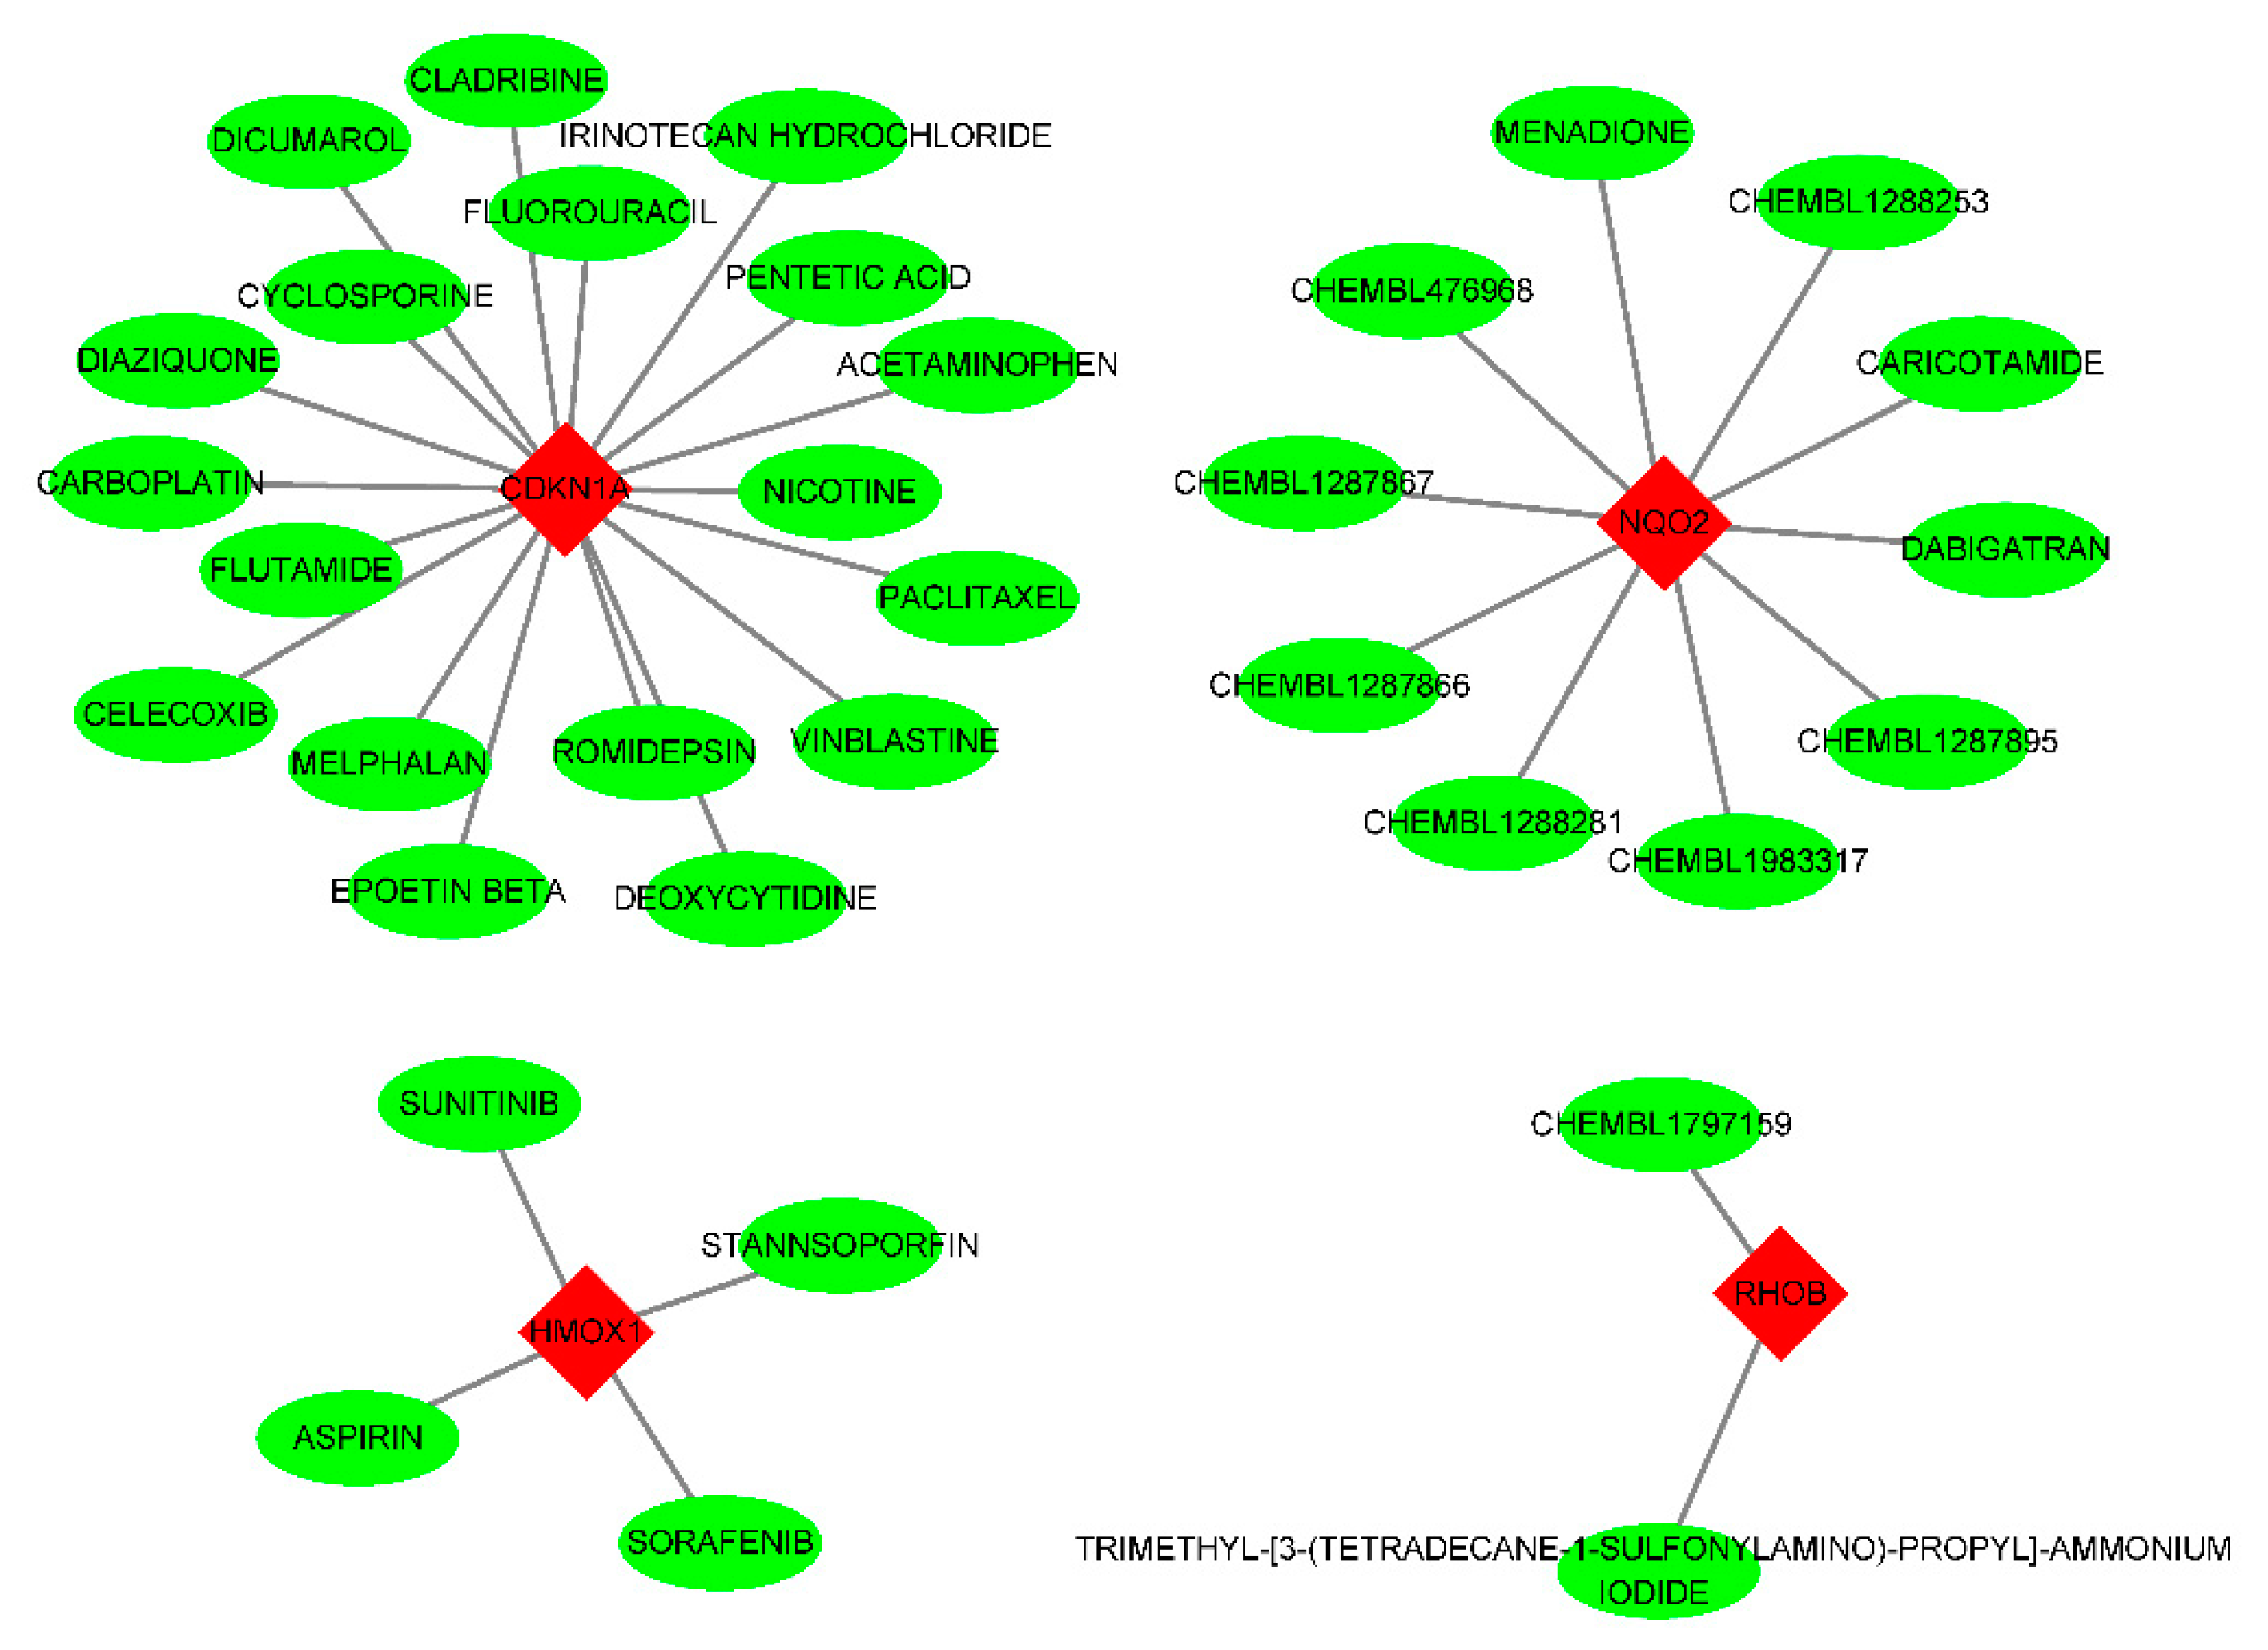
Using the DGIdb database, 34 potential drugs were obtained as candidate drugs for the 6 diagnostic biomarkers. Among these the CDKN1A had the highest number of targeted drugs (18 drugs). The NQO2 had 10, HMOX1 had 4, and RHOB had 2 targeting drugs. The HIST1H4H and TREM1 had no corresponding targeting drugs (Figure 9).

3.9. Gene-TF-miRNA network

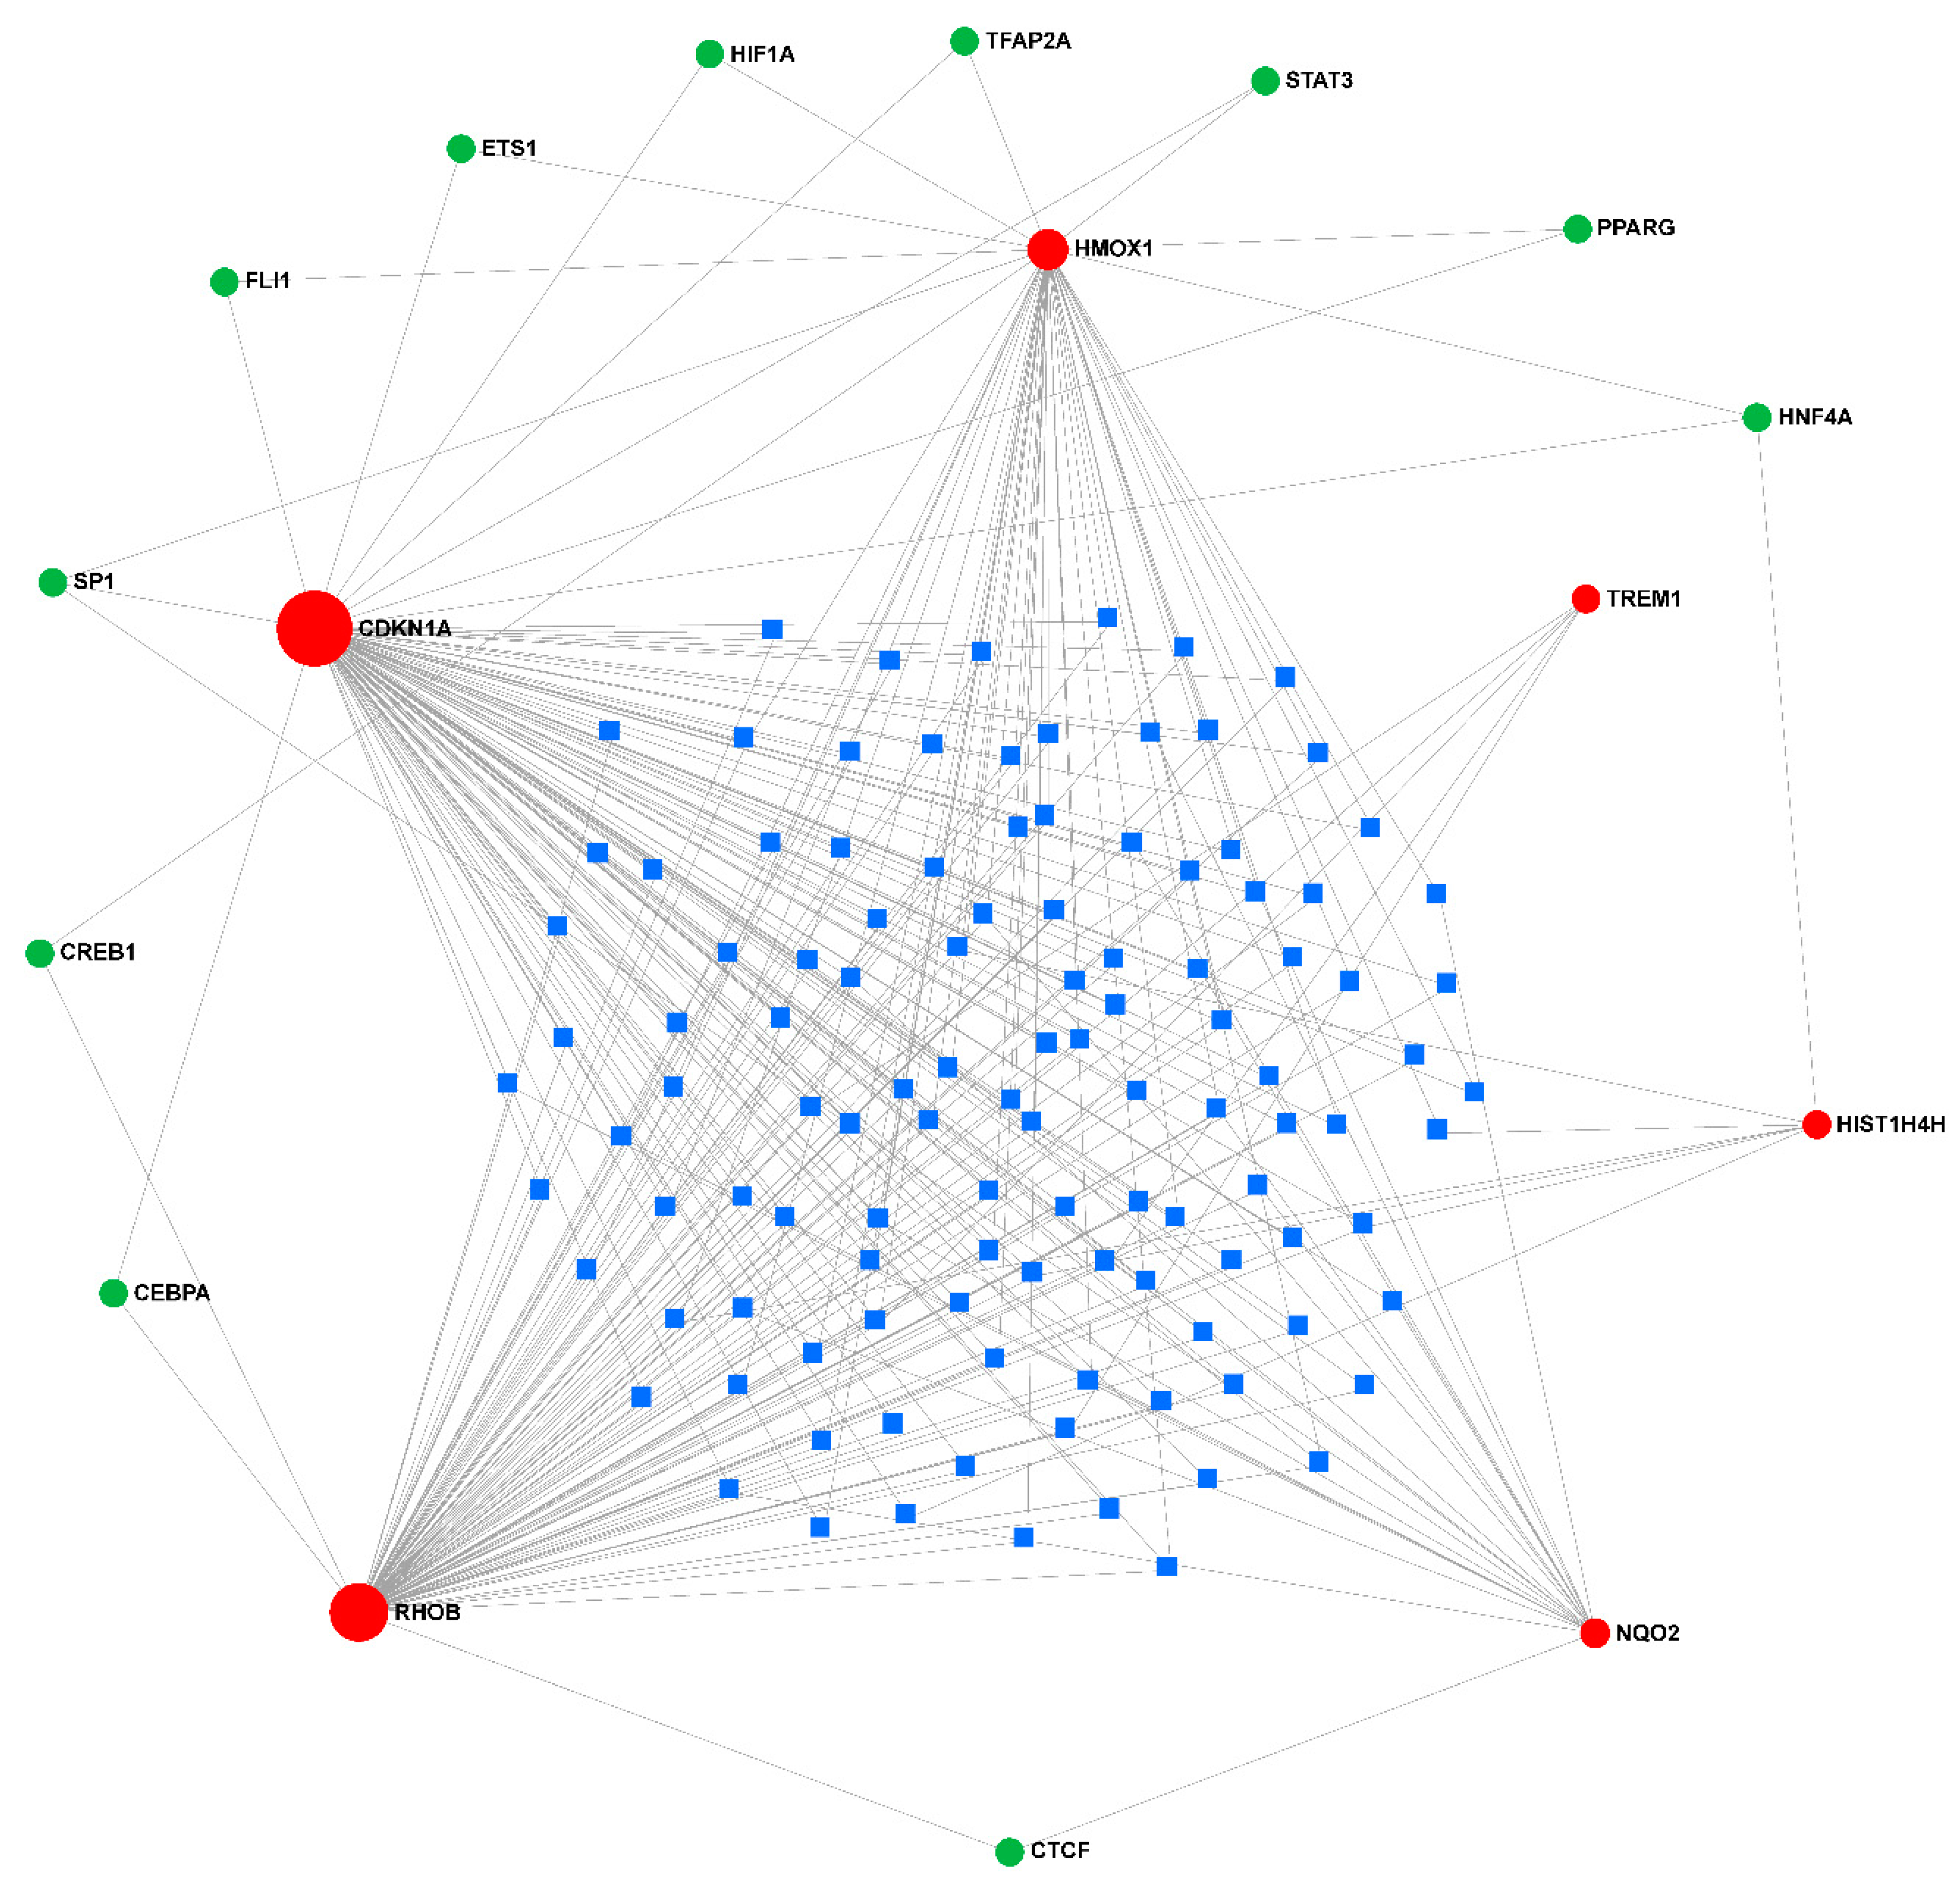
TFs associated with the diagnostic biomarkers and miRNAs that can regulate the diagnostic biomarkers and TFs were identified, and the gene-TF-miRNA network was constructed using miRNet. 11 TFs and 114 miRNAs were identified with a degree cutoff = 1 (Figure 10).

3. Discussion

The World Health Organization has identified sepsis as a global health priority, characterized by an overreaction to infection. Acute respiratory distress syndrome (ARDS) is the most common severe manifestation of multiple organ dysfunction syndromes, which is an important factor leading to the morbidity and mortality of sepsis[4,20]. Key loci play a crucial role in the pathogenesis of sepsis-associated acute lung injury (ALI) or ARDS[11]. Biomarkers describe measurable indicators of a patient's clinical condition that can be measured accurately and reproducibly. For diagnosis, prognosis, early disease recognition, risk stratification, appropriate treatment (therapeutics), and judgment of trial-enriched biomarkers in patients with sepsis or suspected sepsis[21]. Early diagnosis is the key to the prevention and control of the disease. Early identification of acute lung injury has always been a difficult point in treatment. More and more markers with high clinical value have been widely used. The development of new diagnostic markers has the role of early identification of diseases, evaluation of diseases, and guidance of clinical treatment, and has a positive impact on the prognosis of patients[22].
In our study, six potential diagnostic biomarkers and targets for sepsis-induced ALI were screened from the database by bioinformatics analysis. With the development of modern medicine, the early detection and prevention of diseases have become the focus of people's attention. In the development of personalized medicine gene detection, if patients with these six genes can be identified early as disease prevention targets, it will greatly improve the prognosis of patients.
We used GSE10474 to analyze differentially expressed genes (DEGs) between patients with sepsis (sepsis + ALI) and patients without ALI. GSE10474 has been widely used in the analysis of disease markers[23]. The R package "cluster profile" was used for the functional enrichment analysis of DEGs. Interacting Genes and proteins interaction networks were constructed in the Search Tool for the Retrieval of Interacting Genes and Proteins Interaction (PPI) and visualized by Cytoscape. Predictive analysis of microarray (PAM) was performed by R package "PAMR" to identify diagnostic biomarkers, and the diagnostic ability of diagnostic biomarkers was evaluated by the receiver operating characteristic (ROC) curve. In addition, the interaction between diagnostic biomarkers was analyzed by GeneMANIA. We also analyzed the functions of diagnostic biomarkers and predicted their corresponding drugs using Cytoscape plugin BiNGO and Web tool DGIdb. Finally, we analyzed the transcriptional regulation of these diagnostic biomarkers using miRNet, a web-based tool. Sepsis has 71 genes differentially expressed + ALI group, mainly involved in the immune-related biological processes and approaches. The STRING database showed that 31 DEGs had protein-protein interactions. In addition, PAM identified six diagnostic biomarkers from these 31 DEGs, including HIST1H4H, CDKN1A, HMOX1, NQO2, RHOB, and TREM1. ROC curve showed that the diagnostic biomarkers had the good diagnostic ability for sepsis and sepsis + ALI patients. GeneMANIA analysis revealed that many of them share common expressions or interact physically with each other. BiNGO analysis revealed the function of this diagnostic biomarker, which is mainly involved in immune-related biological processes. The DGIdb database showed that CDKN1A had the largest number of targeted drugs. A total of 114 mins and 11 transcription factors that may be involved in regulating the expression of diagnostic genes were obtained. Finally, six potential diagnostic biomarkers and targets for septicemia-induced ALI were identified.
In our final screening HIST1H4H, CDKN1A, HMOX1, NQO2, RHOB, and TREM1. Previous studies have shown that HIST1H4H is involved in the pathogenesis of liver tumors[24]. CDKN1A has been studied more broadly, involving growth, development, and genetics[25,26]. HMOX1 is a molecule that has attracted extensive attention in cancer research[27]. NQO2 has been extensively studied in biochemical and environmental contexts[28]. RHOB is a gene that encodes human cancers[29]. TREM1 has been studied extensively in atherosclerotic disease[30]. These six molecules have been studied in other diseases or biological fields, which are also related to the pathophysiology of sepsis itself. Our study further suggested that among many biomarkers and molecules, these six biomarkers have a closer relationship with sepsis, which is worthy of further study. Previous studies will also help us to carry out subsequent molecular biology experiments, laying a certain foundation for further verification of the relationship between the six biomarkers and sepsis-induced lung injury[31,32,33].
Accurate, early, disease diagnosis is helpful and important to the prognosis of patients. At present, in the articles on sepsis-induced organ damage, more studies focus on finding biomarkers in sepsis-related renal injury[34,35]. In contrast, the studies on sepsis-induced lung injury are more focused on pathogenesis, and the studies on biomarkers are relatively less updated and iterative[36,37]. Our research hopes to further continue and fill the gap in this area. At present, machine learning is also one of the research hotspots in disease diagnosis. Through deeper learning and interpretation of patient data, machine learning can better understand clinical patient characteristics, and thereby continuously improve treatment options[38,39]. Furthermore, personalized treatment plans can be further customized by in-depth analysis of individual patient data. Personalized treatment, for each patient's gene expression, is different, there will be different treatment focus[40]. Combined with the development of artificial intelligence, it is believed that more accurate and forward-looking diagnostic indicators will emerge in near future. Early and complete diagnosis, treatment, and prognosis judgment processes for patients with sepsis lung injury will emerge, which will greatly improve the survival expectation and quality of life of patients. It can be seen that the functional analysis results of different genes are different, mainly in the two directions of immunity and infection, which are related to the basic pathophysiology of sepsis. Moreover, there were co-expression links between genes, suggesting that there may be unknown and common links between genes and known signaling pathways. For example, there is a link between CDKN1A and p53-p21-RB signaling[41], etc., which awaits further exploration by our subsequent experiments.
Our study has some limitations. Due to the small size of the initial study population and validation cohort, the conclusions that may be drawn from this study are limited. The specific relevance of miRNAs and transcription factors to disease biology and development should be further verified in a larger number of subjects. Our results and findings need to be confirmed by subsequent studies and verified by more relevant experiments. In the following, we will further carry out follow-up studies on the selected biomarkers.
Conclusion
In this study, six potential diagnostic biomarkers and targets of sepsis-induced ALI were selected from the database through bioinformatics analysis, to have a positive impact and significance on the diagnosis and treatment of sepsis-induced lung injury.

Author Contributions

Yingying Huang and Jiameng Chen designed the current study, performed certain data collection and analysis, and revised the manuscript. Wenjie Li and Shaowei Jiang conducted data collection and analysis and wrote the manuscript. Chengjin Gao and Yuxin Leng raised funds and supervised the research. All authors read and approved the final manuscript. All authors have approved the submitted version and have agreed on both to be personally accountable for the author’s contributions and to ensure that questions related to the accuracy or integrity of any part of the work, even ones in which the author was not personally involved, are appropriately investigated, resolved, and the resolution documented in the literature. All authors read and approved the final manuscript.

Funding

This work was supported by the National Natural Science Foundation of China (82172138 and 81873947), the Special Medical Innovation Project of Shanghai Science and Technology Committee (No.21Y11902400), Excellent Academic Leader Program of Shanghai Science and Technology Committee (21XD1402200).

Institutional Review Board Statement

The study was approved by the Ethics Committee of Xinhua Hospital Affiliated to Shanghai Jiao Tong University School of Medicine (Approval No. XHEC-D-2023-138 and date of approval July 21, 2023).

Informed Consent Statement

Informed consent was obtained from all subjects involved in the study.

Data Availability Statement

The datasets used and/or analyzed during the current study are available from the corresponding author upon reasonable request.

Conflicts of Interest

The authors declare no conflict of interest.

Abbreviations

acute lung injury (ALI); alveolar macrophages (AMs); differentially expressed genes (DEGs); protein-protein interaction (PPI); Prediction analysis of microarrays (PAM); receiver operating; characteristic (ROC) curves; acute respiratory distress syndrome (ARDS); lipopolysaccharide (LPS); Gene expression Omnibus (GEO); Kyoto Encyclopedia of Genes and Genomes (KEGG); biological processes (BP); molecular functions (MF); cellular components (CC); the Search Tool for the Retrieval of Interacting Genes (STRING); area under the curve (AUC); Single-gene gene set enrichment analysis (GSEA); Biological Networks Gene Ontology tool (BiNGO); Gene Ontology (GO); Drug Gene Interaction Database (DGIdb); Transcription factors (TFs); microRNAs (miRNAs)

References

  1. Evans L, Rhodes A, Alhazzani W, et al. Surviving sepsis campaign: international guidelines for management of sepsis and septic shock 2021 [J]. Intensive Care Med, 2021, 47(11): 1181-247. [CrossRef]
  2. Barichello T, Generoso J S, Singer M, et al. Biomarkers for sepsis: more than just fever and leukocytosis-a narrative review [J]. Crit Care, 2022, 26(1): 14. [CrossRef]
  3. Li H, Liu L, Zhang D, et al. SARS-CoV-2 and viral sepsis: observations and hypotheses [J]. The Lancet, 2020, 395(10235): 1517-20. [CrossRef]
  4. Li W, Li D, Chen Y, et al. Classic Signaling Pathways in Alveolar Injury and Repair Involved in Sepsis-Induced ALI/ARDS: New Research Progress and Prospect [J]. Dis Markers, 2022, 2022: 6362344. [CrossRef]
  5. Spadaro S, Park M, Turrini C, et al. Biomarkers for Acute Respiratory Distress syndrome and prospects for personalised medicine [J]. J Inflamm (Lond), 2019, 16: 1. [CrossRef]
  6. Mehaffey J H, Charles E J, Schubert S, et al. In vivo lung perfusion rehabilitates sepsis-induced lung injury [J]. The Journal of Thoracic and Cardiovascular Surgery, 2018, 155(1): 440-8.e2. [CrossRef]
  7. Zhao H, Chen H, Xiaoyin M, et al. Autophagy Activation Improves Lung Injury and Inflammation in Sepsis [J]. Inflammation, 2019, 42(2): 426-39. [CrossRef]
  8. Zhang H B, Sun L C, Zhi L D, et al. Astilbin alleviates sepsis-induced acute lung injury by inhibiting the expression of macrophage inhibitory factor in rats [J]. Arch Pharm Res, 2017, 40(10): 1176-85. [CrossRef]
  9. Luan G, Pan F, Bu L, et al. Butorphanol Promotes Macrophage Phenotypic Transition to Inhibit Inflammatory Lung Injury via κ Receptors [J]. Frontiers in Immunology, 2021, 12. [CrossRef]
  10. Zhao J, Lv T, Quan J, et al. Identification of target genes in cardiomyopathy with fibrosis and cardiac remodeling [J]. J Biomed Sci, 2018, 25(1): 63. [CrossRef]
  11. Howrylak J A, Dolinay T, Lucht L, et al. Discovery of the gene signature for acute lung injury in patients with sepsis [J]. Physiol Genomics, 2009, 37(2): 133-9. [CrossRef]
  12. Ritchie M E, Phipson B, Wu D, et al. limma powers differential expression analyses for RNA-sequencing and microarray studies [J]. Nucleic Acids Res, 2015, 43(7): e47.
  13. Yu G, Wang L G, Han Y, et al. clusterProfiler: an R package for comparing biological themes among gene clusters [J]. OMICS, 2012, 16(5): 284-7. [CrossRef]
  14. Koes D R, Camacho C J. PocketQuery: protein-protein interaction inhibitor starting points from protein-protein interaction structure [J]. Nucleic Acids Res, 2012, 40(Web Server issue): W387-92. [CrossRef]
  15. Tibshirani R, Hastie T, Narasimhan B, et al. Diagnosis of multiple cancer types by shrunken centroids of gene expression [J]. Proc Natl Acad Sci U S A, 2002, 99(10): 6567-72. [CrossRef]
  16. Subramanian A T P, Mootha Vk, Et Al. Gene set enrichment analysis: a knowledge-based approach for interpreting genome-wide expression profiles [J]. Proc Natl Acad Sci U S A, 2005, 102(43): 15545-50. [CrossRef]
  17. Warde-Farley D, Donaldson S L, Comes O, et al. The GeneMANIA prediction server: biological network integration for gene prioritization and predicting gene function [J]. Nucleic Acids Res, 2010, 38(Web Server issue): W214-20. [CrossRef]
  18. Maere S, Heymans K, Kuiper M. BiNGO: a Cytoscape plugin to assess overrepresentation of gene ontology categories in biological networks [J]. Bioinformatics, 2005, 21(16): 3448-9. [CrossRef]
  19. O'brien J, Hayder H, Zayed Y, et al. Overview of MicroRNA Biogenesis, Mechanisms of Actions, and Circulation [J]. Front Endocrinol (Lausanne), 2018, 9: 402. [CrossRef]
  20. Sekulic A D, Trpkovic S V, Pavlovic A P, et al. Scoring Systems in Assessing Survival of Critically Ill ICU Patients [J]. Med Sci Monit, 2015, 21: 2621-9. [CrossRef]
  21. Wang H, Huang J, Liao W, et al. Prognostic Value of the Red Cell Distribution Width in Patients with Sepsis-Induced Acute Respiratory Distress Syndrome: A Retrospective Cohort Study [J]. Dis Markers, 2021, 2021: 5543822. [CrossRef]
  22. Baradaran Rahimi V, Rakhshandeh H, Raucci F, et al. Anti-Inflammatory and Anti-Oxidant Activity of Portulaca oleracea Extract on LPS-Induced Rat Lung Injury [J]. Molecules, 2019, 24(1). [CrossRef]
  23. Chen Y S J, Pan Xf, Feng J, Zhao H. DNA microarray-based screening of differentially expressed genes related to acute lung injury and functional analysis [J]. Eur Rev Med Pharmacol Sci, 2013, 17(8): 1044-50.
  24. Zhu G, Wang F, Li H, et al. N-Myristoylation by NMT1 Is POTEE-Dependent to Stimulate Liver Tumorigenesis via Differentially Regulating Ubiquitination of Targets [J]. Front Oncol, 2021, 11: 681366. [CrossRef]
  25. Sturmlechner I, Zhang C, Sine C C, et al. p21 produces a bioactive secretome that places stressed cells under immunosurveillance [J]. Science, 2021, 374(6567): eabb3420. [CrossRef]
  26. Koltowska K, Okuda K S, Gloger M, et al. The RNA helicase Ddx21 controls Vegfc-driven developmental lymphangiogenesis by balancing endothelial cell ribosome biogenesis and p53 function [J]. Nat Cell Biol, 2021, 23(11): 1136-47. [CrossRef]
  27. Song H, Liu D, Wang L, et al. Methyltransferase like 7B is a potential therapeutic target for reversing EGFR-TKIs resistance in lung adenocarcinoma [J]. Mol Cancer, 2022, 21(1): 43. [CrossRef]
  28. Rashid M H, Babu D, Siraki A G. Interactions of the antioxidant enzymes NAD(P)H: Quinone oxidoreductase 1 (NQO1) and NRH: Quinone oxidoreductase 2 (NQO2) with pharmacological agents, endogenous biochemicals and environmental contaminants [J]. Chem Biol Interact, 2021, 345: 109574. [CrossRef]
  29. Saliani M, Mirzaiebadizi A, Mosaddeghzadeh N, et al. RHO GTPase-Related Long Noncoding RNAs in Human Cancers [J]. Cancers (Basel), 2021, 13(21). [CrossRef]
  30. Panagopoulos A, Samant S, Bakhos J J, et al. Triggering receptor expressed on myeloid cells-1 (TREM-1) inhibition in atherosclerosis [J]. Pharmacol Ther, 2022, 238: 108182. [CrossRef]
  31. Zhang X, Cui Y, Ding X, et al. Analysis of mRNAlncRNA and mRNAlncRNA-pathway coexpression networks based on WGCNA in developing pediatric sepsis [J]. Bioengineered, 2021, 12(1): 1457-70. [CrossRef]
  32. Ahmed M M, Zaki A, Alhazmi A, et al. Identification and Validation of Pathogenic Genes in Sepsis and Associated Diseases by Integrated Bioinformatics Approach [J]. Genes (Basel), 2022, 13(2). [CrossRef]
  33. Seymour C W, Kennedy J N, Wang S, et al. Derivation, Validation, and Potential Treatment Implications of Novel Clinical Phenotypes for Sepsis [J]. JAMA, 2019, 321(20): 2003-17. [CrossRef]
  34. Lal Gupta C, Kumar Tiwari R, Cytryn E. Platforms for elucidating antibiotic resistance in single genomes and complex metagenomes [J]. Environ Int, 2020, 138: 105667. [CrossRef]
  35. Komorowski M, Celi L A, Badawi O, et al. The Artificial Intelligence Clinician learns optimal treatment strategies for sepsis in intensive care [J]. Nat Med, 2018, 24(11): 1716-20. [CrossRef]
  36. Cinar I, Sirin B, Aydin P, et al. Ameliorative effect of gossypin against acute lung injury in experimental sepsis model of rats [J]. Life Sci, 2019, 221: 327-34. [CrossRef]
  37. Wang H R, Guo X Y, Liu X Y, et al. Down-regulation of lncRNA CASC9 aggravates sepsis-induced acute lung injury by regulating miR-195-5p/PDK4 axis [J]. Inflamm Res, 2020, 69(6): 559-68. [CrossRef]
  38. Sinha P, Churpek M M, Calfee C S. Machine Learning Classifier Models Can Identify Acute Respiratory Distress Syndrome Phenotypes Using Readily Available Clinical Data [J]. Am J Respir Crit Care Med, 2020, 202(7): 996-1004. [CrossRef]
  39. Fleuren L M, Klausch T L T, Zwager C L, et al. Machine learning for the prediction of sepsis: a systematic review and meta-analysis of diagnostic test accuracy [J]. Intensive Care Med, 2020, 46(3): 383-400. [CrossRef]
  40. Kyriazopoulou E, Giamarellos-Bourboulis E J. Monitoring immunomodulation in patients with sepsis [J]. Expert Rev Mol Diagn, 2021, 21(1): 17-29. [CrossRef]
  41. Engeland, K. Cell cycle regulation: p53-p21-RB signaling [J]. Cell Death Differ, 2022, 29(5): 946-60. [CrossRef]
Figure 1. A. Vocano map of the expression of differentially expressed genes (DEGs) in GSE44074. The abscissa shows the multiple of difference (ALIsepsis /Onlysepsis, logarithm). The ordinate represents -log10(Pvalue). Each dot in the figure represents a gene, with green and red dots representing significantly differentially expressed genes. The red dots indicate up-regulated gene expression (ALIsepsis relative to Onlysepsis), the green dots indicate down-regulated gene expression (ALIsepsis relative to Onlysepsis), and the gray dots indicate that there is no significant difference between these genes. B. Heat map of the expression of differentially expressed genes (DEGs) in GSE44074. Each small square represents each gene, and its color indicates the expression level of the gene. The higher the expression level, the darker the color will be (red is high expression, blue is low expression). The first row represents the sample grouping, blue-green represents the ALIsepsis sample, and red represents the Onlysepsis sample. Each row represents the expression level of each gene in different samples, and each column represents the expression level of all differentially expressed genes in each tissue. The dendrogram on the left shows the results of the clustering analysis of different genes from different samples.
Preprints 80170 g001aPreprints 80170 g001b
Figure 2. A. Bubble plot of the top 10 GO terms in each field. A total of 91 GO terms were enriched for differentially expressed genes. The top 10 significantly enriched GO terms of various types showed that they were mainly enriched in immune regulatory biological processes such as immune activation and antigen response, as well as MHC protein complex and organelle membrane related cell components. B. Bar plot of the 9 KEGG pathways. Nine KEGG pathways were enriched, mainly for antigen processing and mineral absorption, etc.
Preprints 80170 g002aPreprints 80170 g002b
Figure 3. PPI analysis on the 71 DEGs. Fill the node color according to the logFC value. Green indicates a negative logFC value, red indicates a positive logFC value, darker green indicates a smaller logFC, and darker red indicates a larger logFC value.
Preprints 80170 g003
Figure 4. A. Misclassification error of the cross-validation. B. Shrunk differences of the prognostic genes. The horizontal line (which looks like a dot because of its small value ) represents the score value, the vertical line is the value of 0. The score value less than 0 is on the left side of the vertical line while the value greater than 0 is on the right side of the vertical line, the larger the absolute value of the score value the longer the horizontal line. To get the most reliable genes with the lowest error rate. At this time, the threshold was 1.4, and six genes were screened, which were defined as diagnostic genes, namely HIST1H4H (H4C8), CDKN1A, HMOX1, NQO2,RHOB and TREM1.
Preprints 80170 g004aPreprints 80170 g004b
Figure 5. A. Expression level of the prognostic genes in the sepsis and sepsis + ALI groups. The abscissa represents the diagnostic gene, the ordinate represents the expression level of the gene, the red represents the ALIsepsis sample, the green represents the Onlysepsis sample, and the "*" represents P<0.05, "**" denotes P<0.01, "***" means P<0.001, "ns" means no difference. B. ROC curves of the training and testing set. As can be seen from the figure, the AUC values of the diagnostic genes in both the training and test sets were 1, indicating that the diagnostic genes can accurately distinguish ALIsepsis and Onlysepsis samples.
Preprints 80170 g005aPreprints 80170 g005b
Figure 6. A, B. HIST1H4 related KEGG pathways and GO processes. . C. CDKN1A related GO processes. The KEGG pathway was not enriched. D, E. HMOX1 related KEGG pathways and GO processes. F, G. NQO2 related KEGG pathways and GO processes. . H, I. RHOB related KEGG pathways and GO processes. J, K. TREM1 related KEGG pathways and GO processes.
Preprints 80170 g006aPreprints 80170 g006bPreprints 80170 g006cPreprints 80170 g006dPreprints 80170 g006ePreprints 80170 g006fPreprints 80170 g006gPreprints 80170 g006hPreprints 80170 g006iPreprints 80170 g006jPreprints 80170 g006k
Figure 7. Interaction of the prognostic genes. The green triangle represents the diagnostic gene, the blue dot represents the other genes related to the diagnostic gene, the orange line represents the physical interaction relationship, the purple line represents the co-expression relationship, the green line represents the co-localization relationship, and the line thickness represents the relationship weight, the larger the weight, the thicker the line.
Preprints 80170 g007
Figure 8. Hierarchy of the biological functions. Sort by 'Corr p-val' from smallest to largest. The top 10 significantly enriched biological processes were intracellular signaling pathway, anti-apoptotic regulation, intracellular signal transduction, GTP-mediated signal transduction, intracellular signal induction of apoptosis, mast cell activation involved in the negative regulation of immune response, mast cell and leukocyte degranulation negative regulation of immune response.
Preprints 80170 g008
Figure 9. Drug-gene interactions. Through our online website https://dgidb.genome.wustl.edu/ gene diagnosis, predicting the corresponding drug molecules, in its HIST1H4H TREM1 did not predict to related drugs.
Preprints 80170 g009
Figure 10. Gene-TF-miRNA network. Red dots represent diagnostic genes, green dots represent TFs, blue squares represent mirnas, and the size of the dots indicates connectivity.
Preprints 80170 g010
Disclaimer/Publisher’s Note: The statements, opinions and data contained in all publications are solely those of the individual author(s) and contributor(s) and not of MDPI and/or the editor(s). MDPI and/or the editor(s) disclaim responsibility for any injury to people or property resulting from any ideas, methods, instructions or products referred to in the content.
Copyright: This open access article is published under a Creative Commons CC BY 4.0 license, which permit the free download, distribution, and reuse, provided that the author and preprint are cited in any reuse.
Prerpints.org logo

Preprints.org is a free preprint server supported by MDPI in Basel, Switzerland.

Subscribe

© 2024 MDPI (Basel, Switzerland) unless otherwise stated