4.1. CMF effects on the silicon melt convection
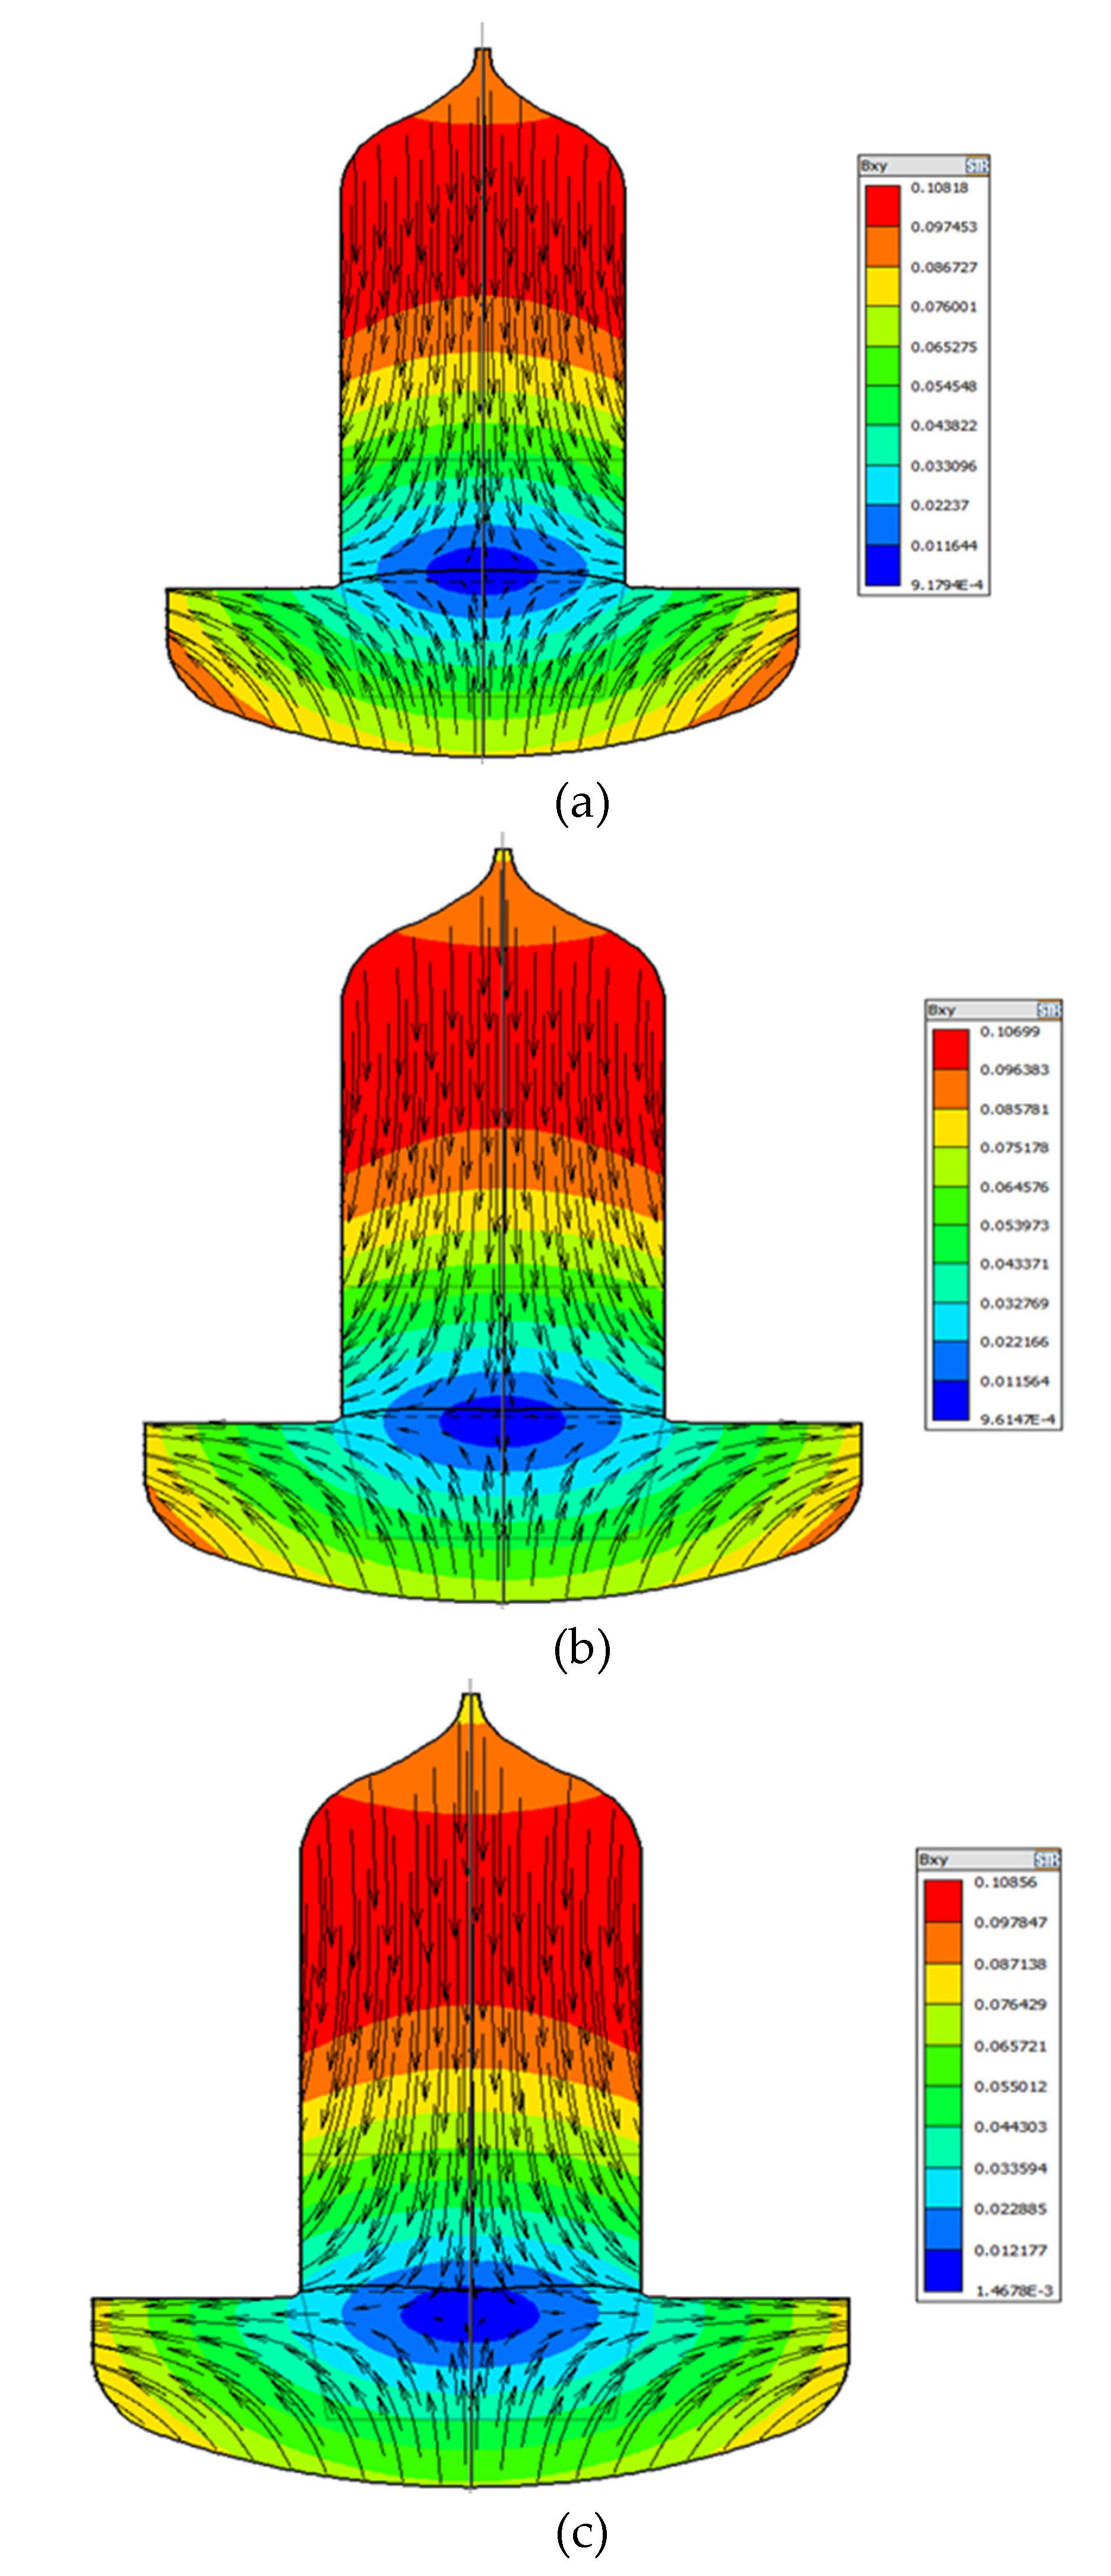
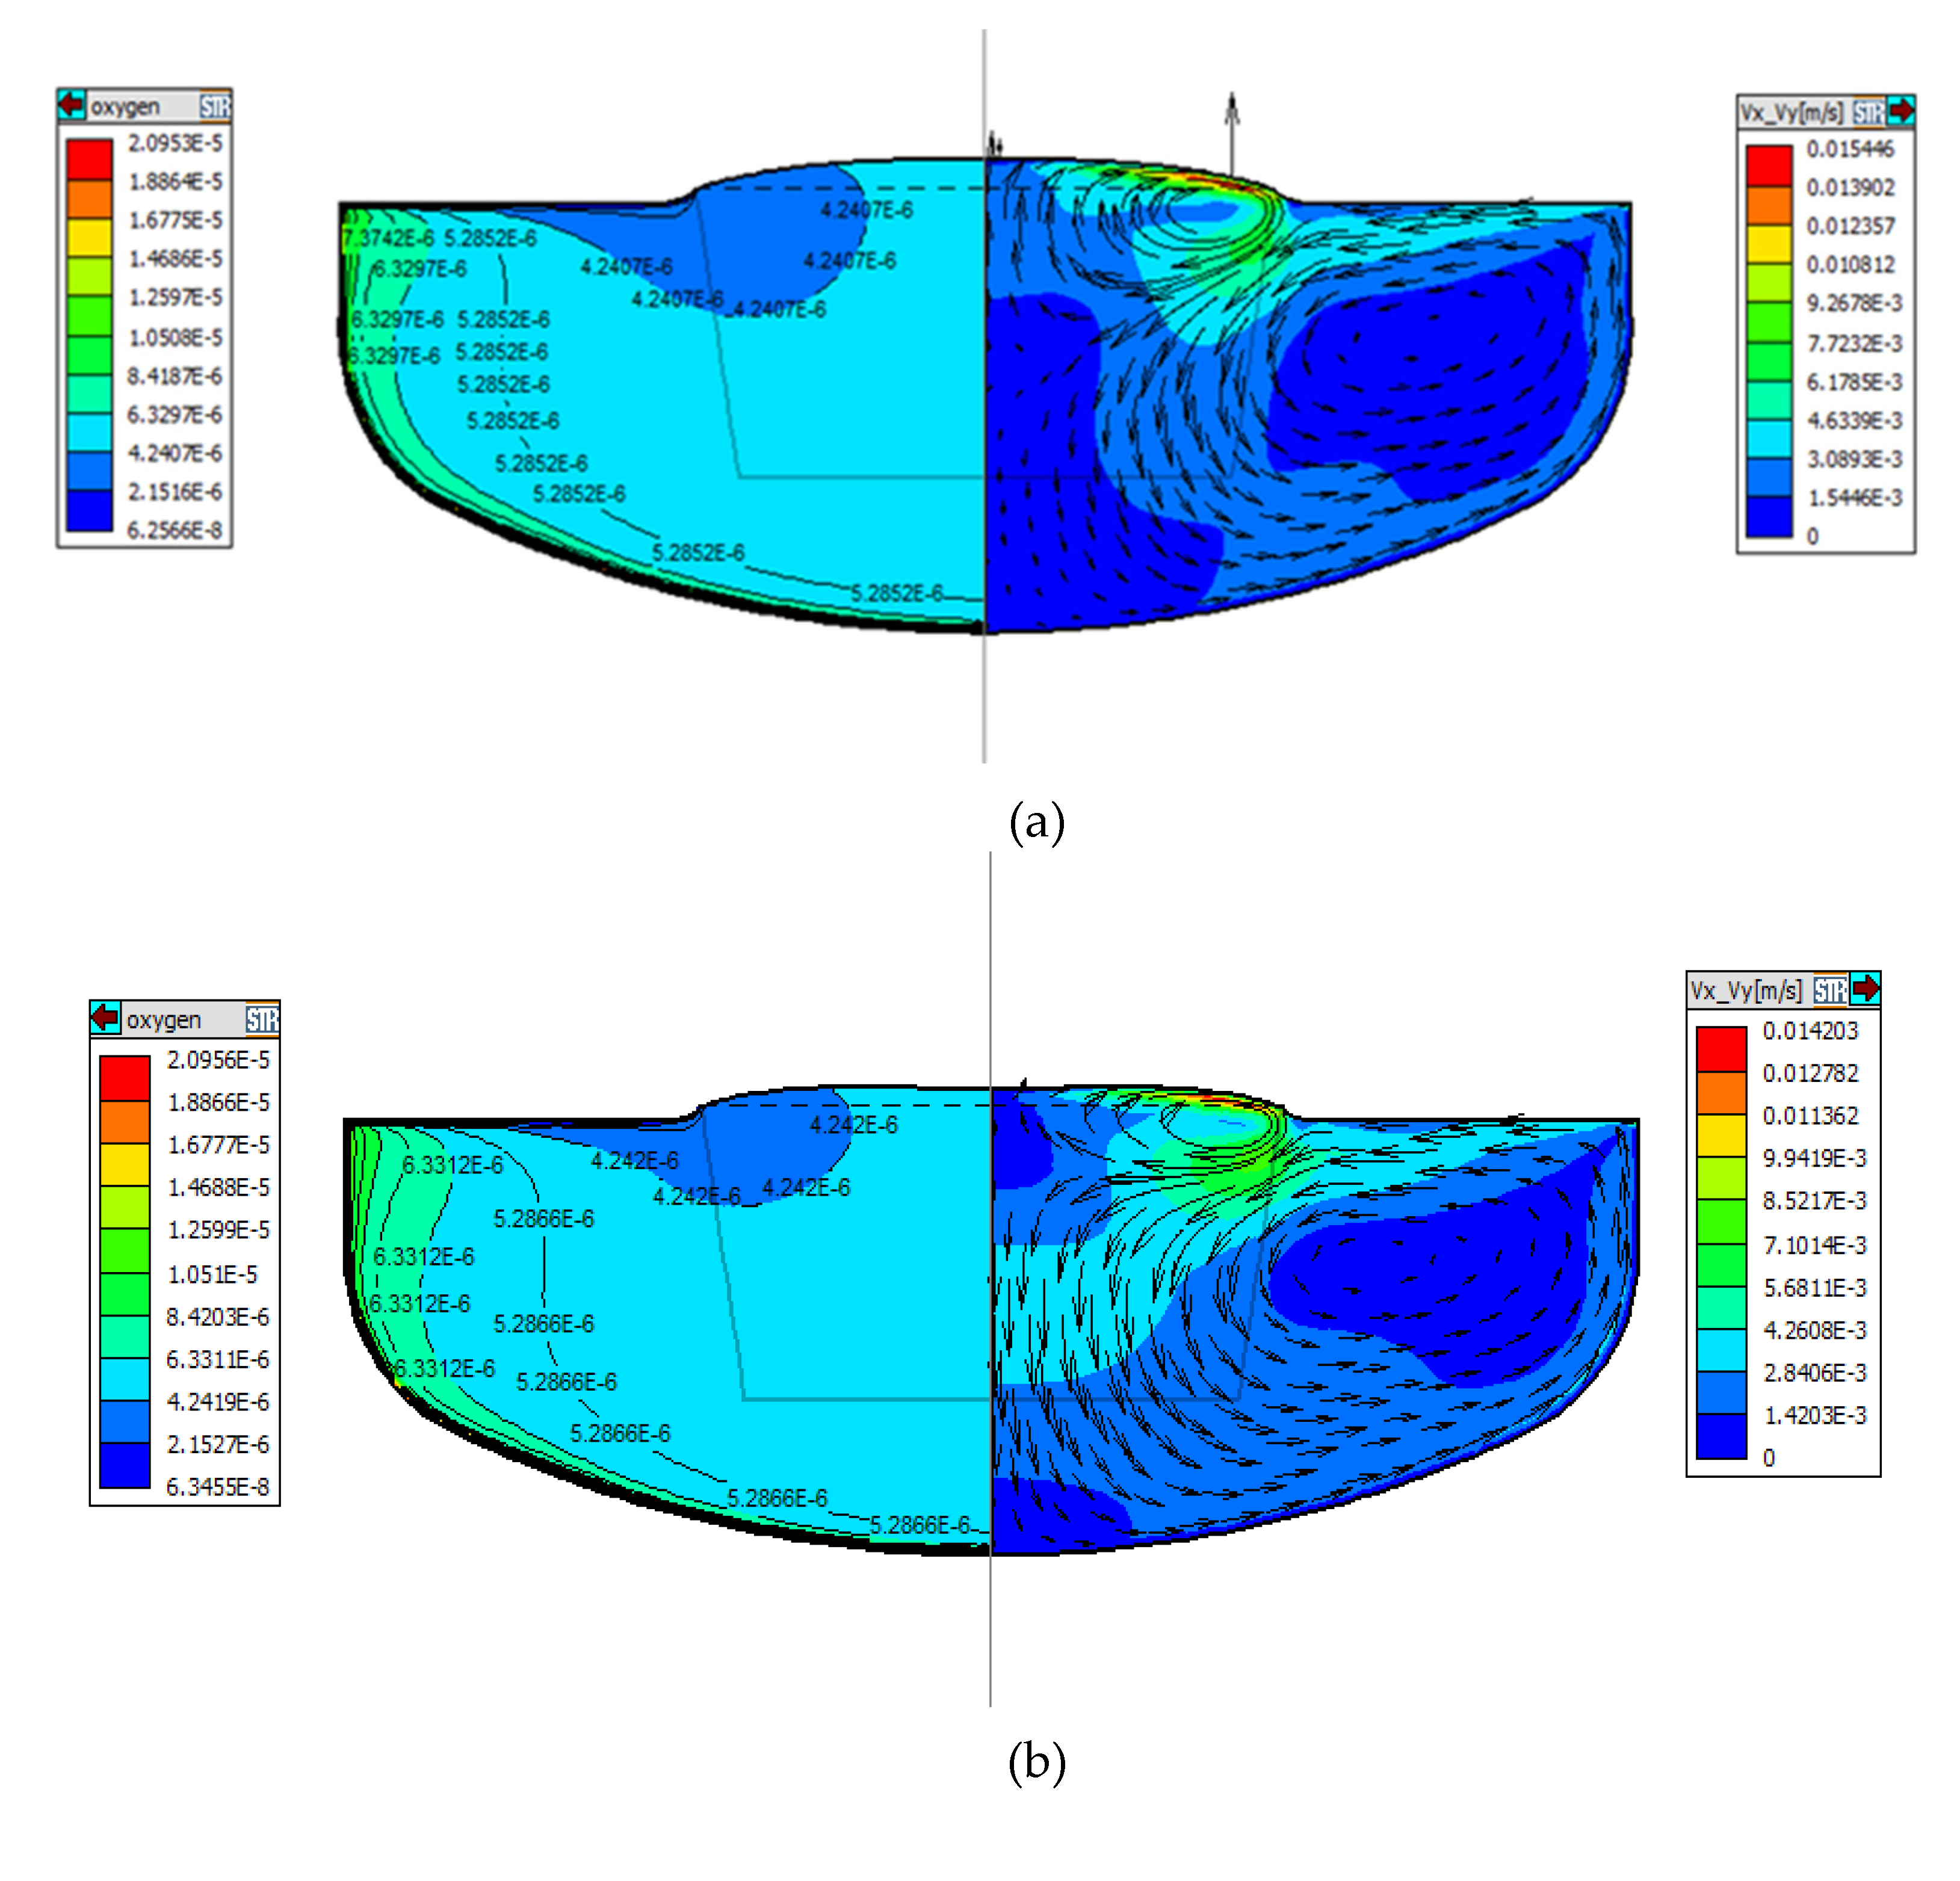
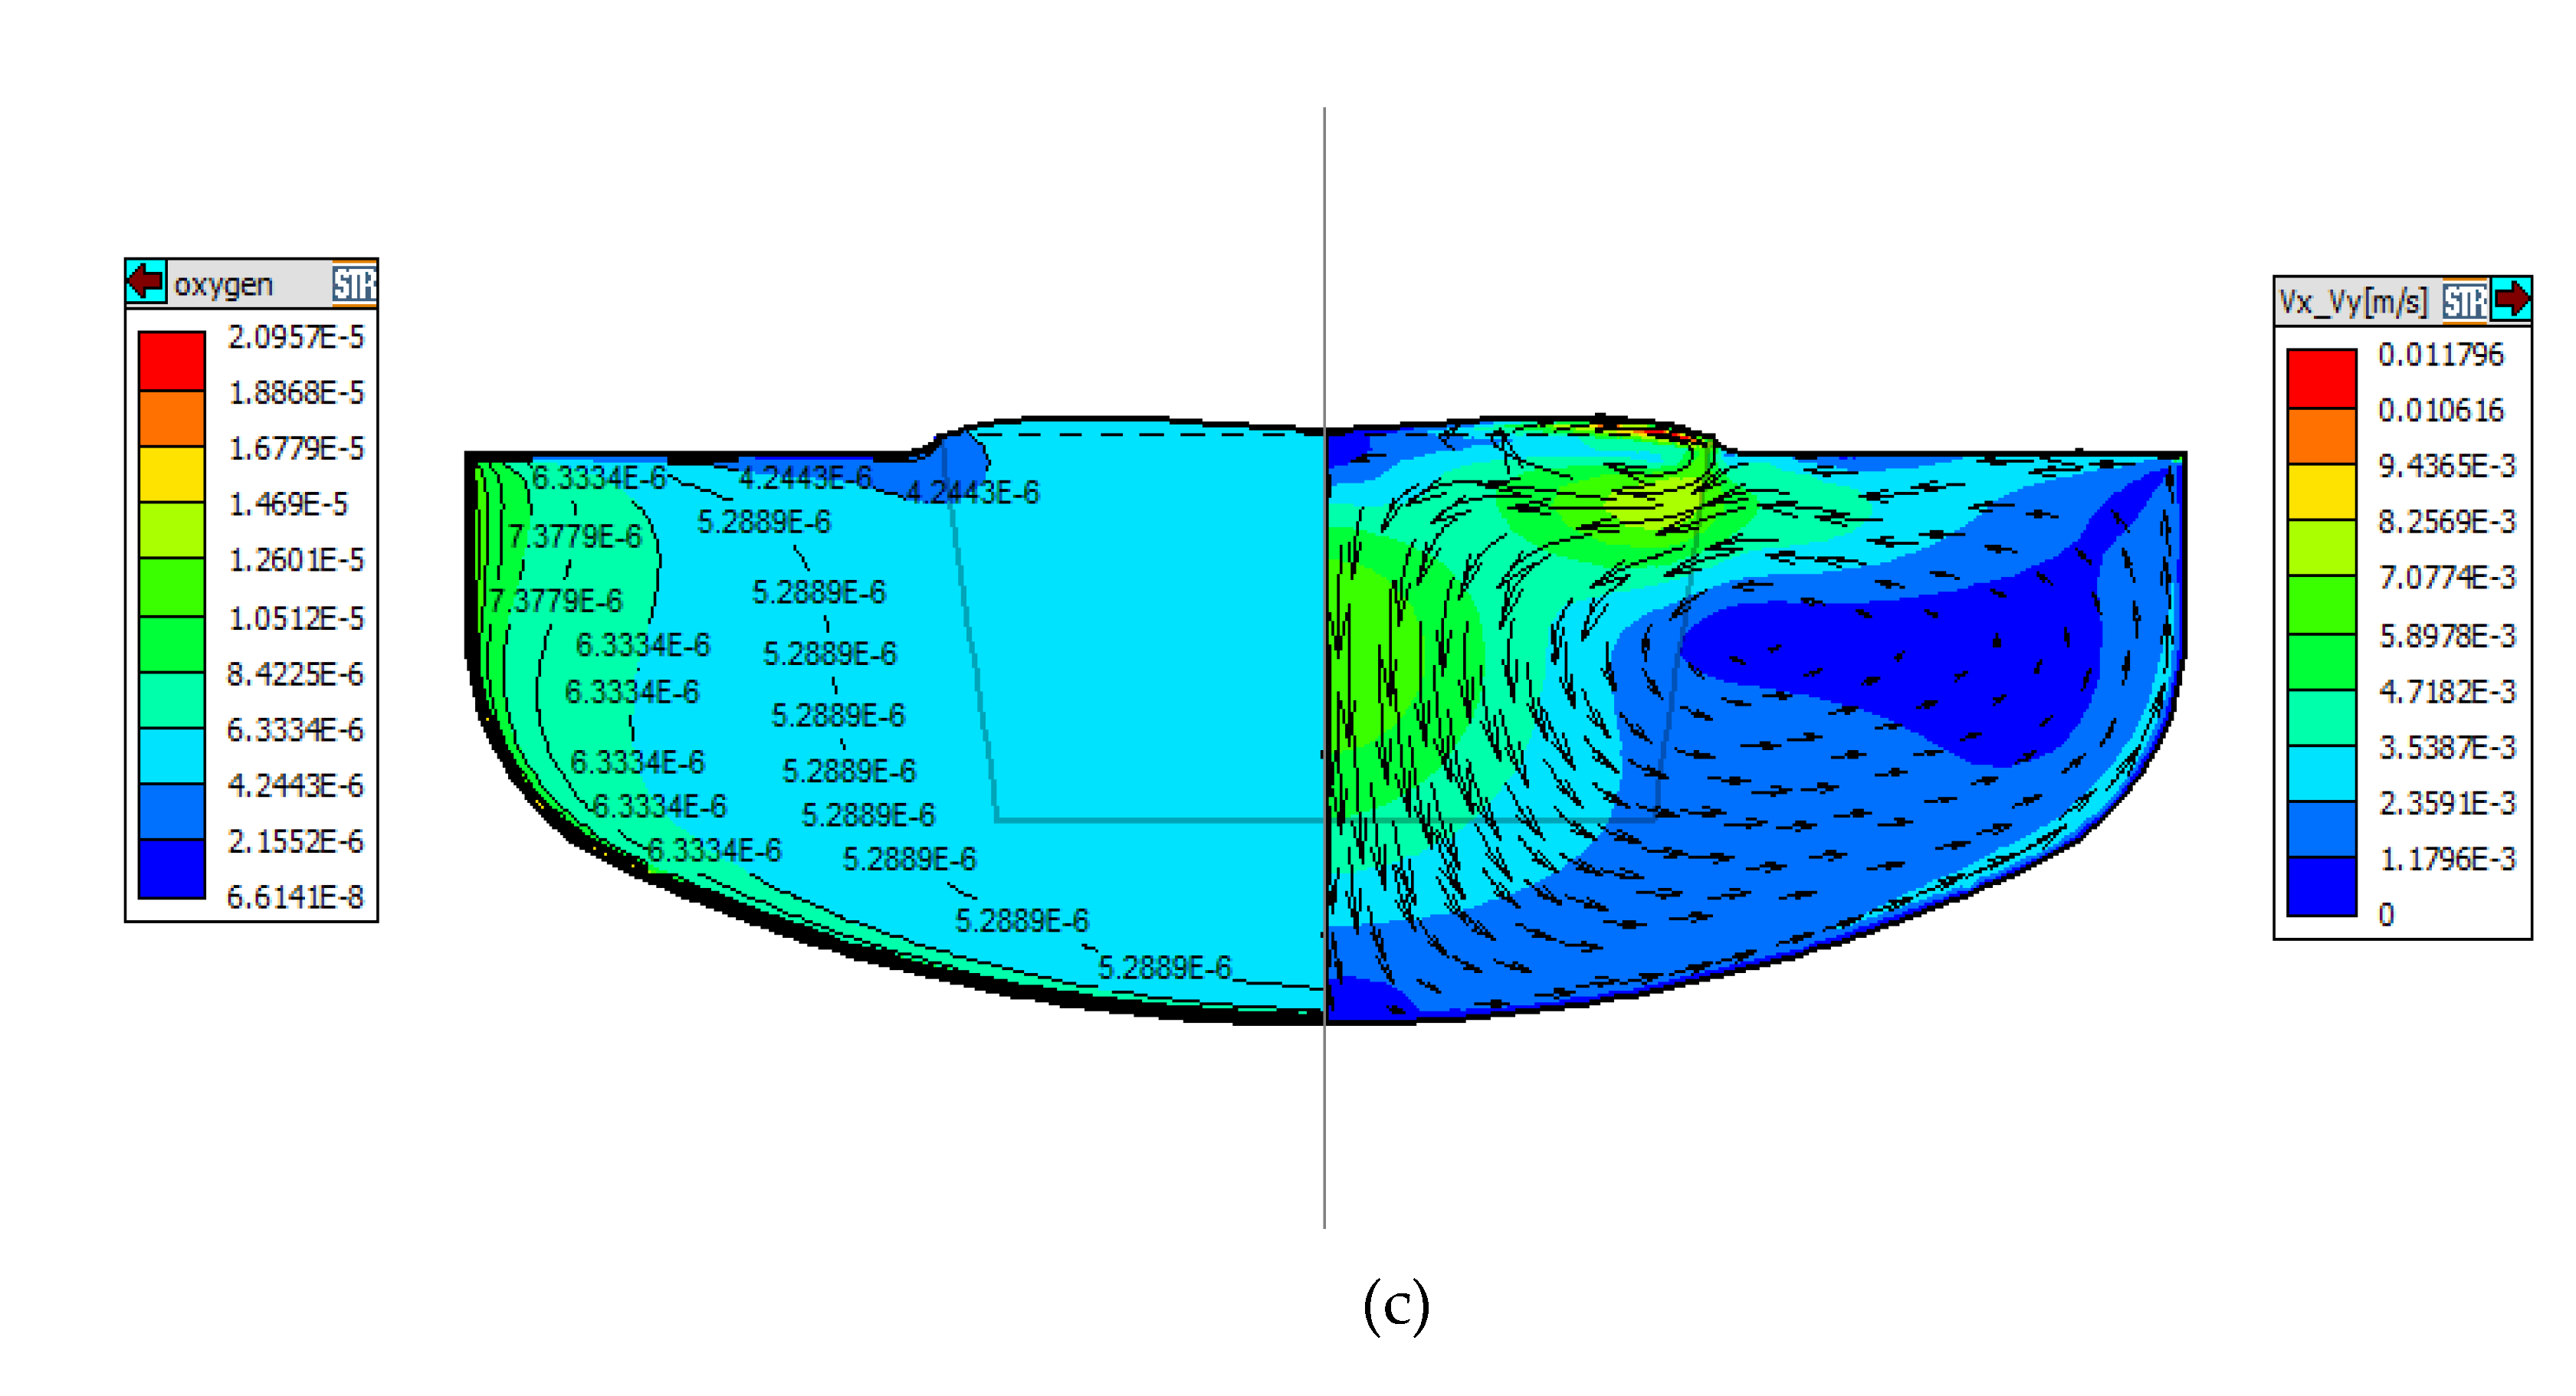
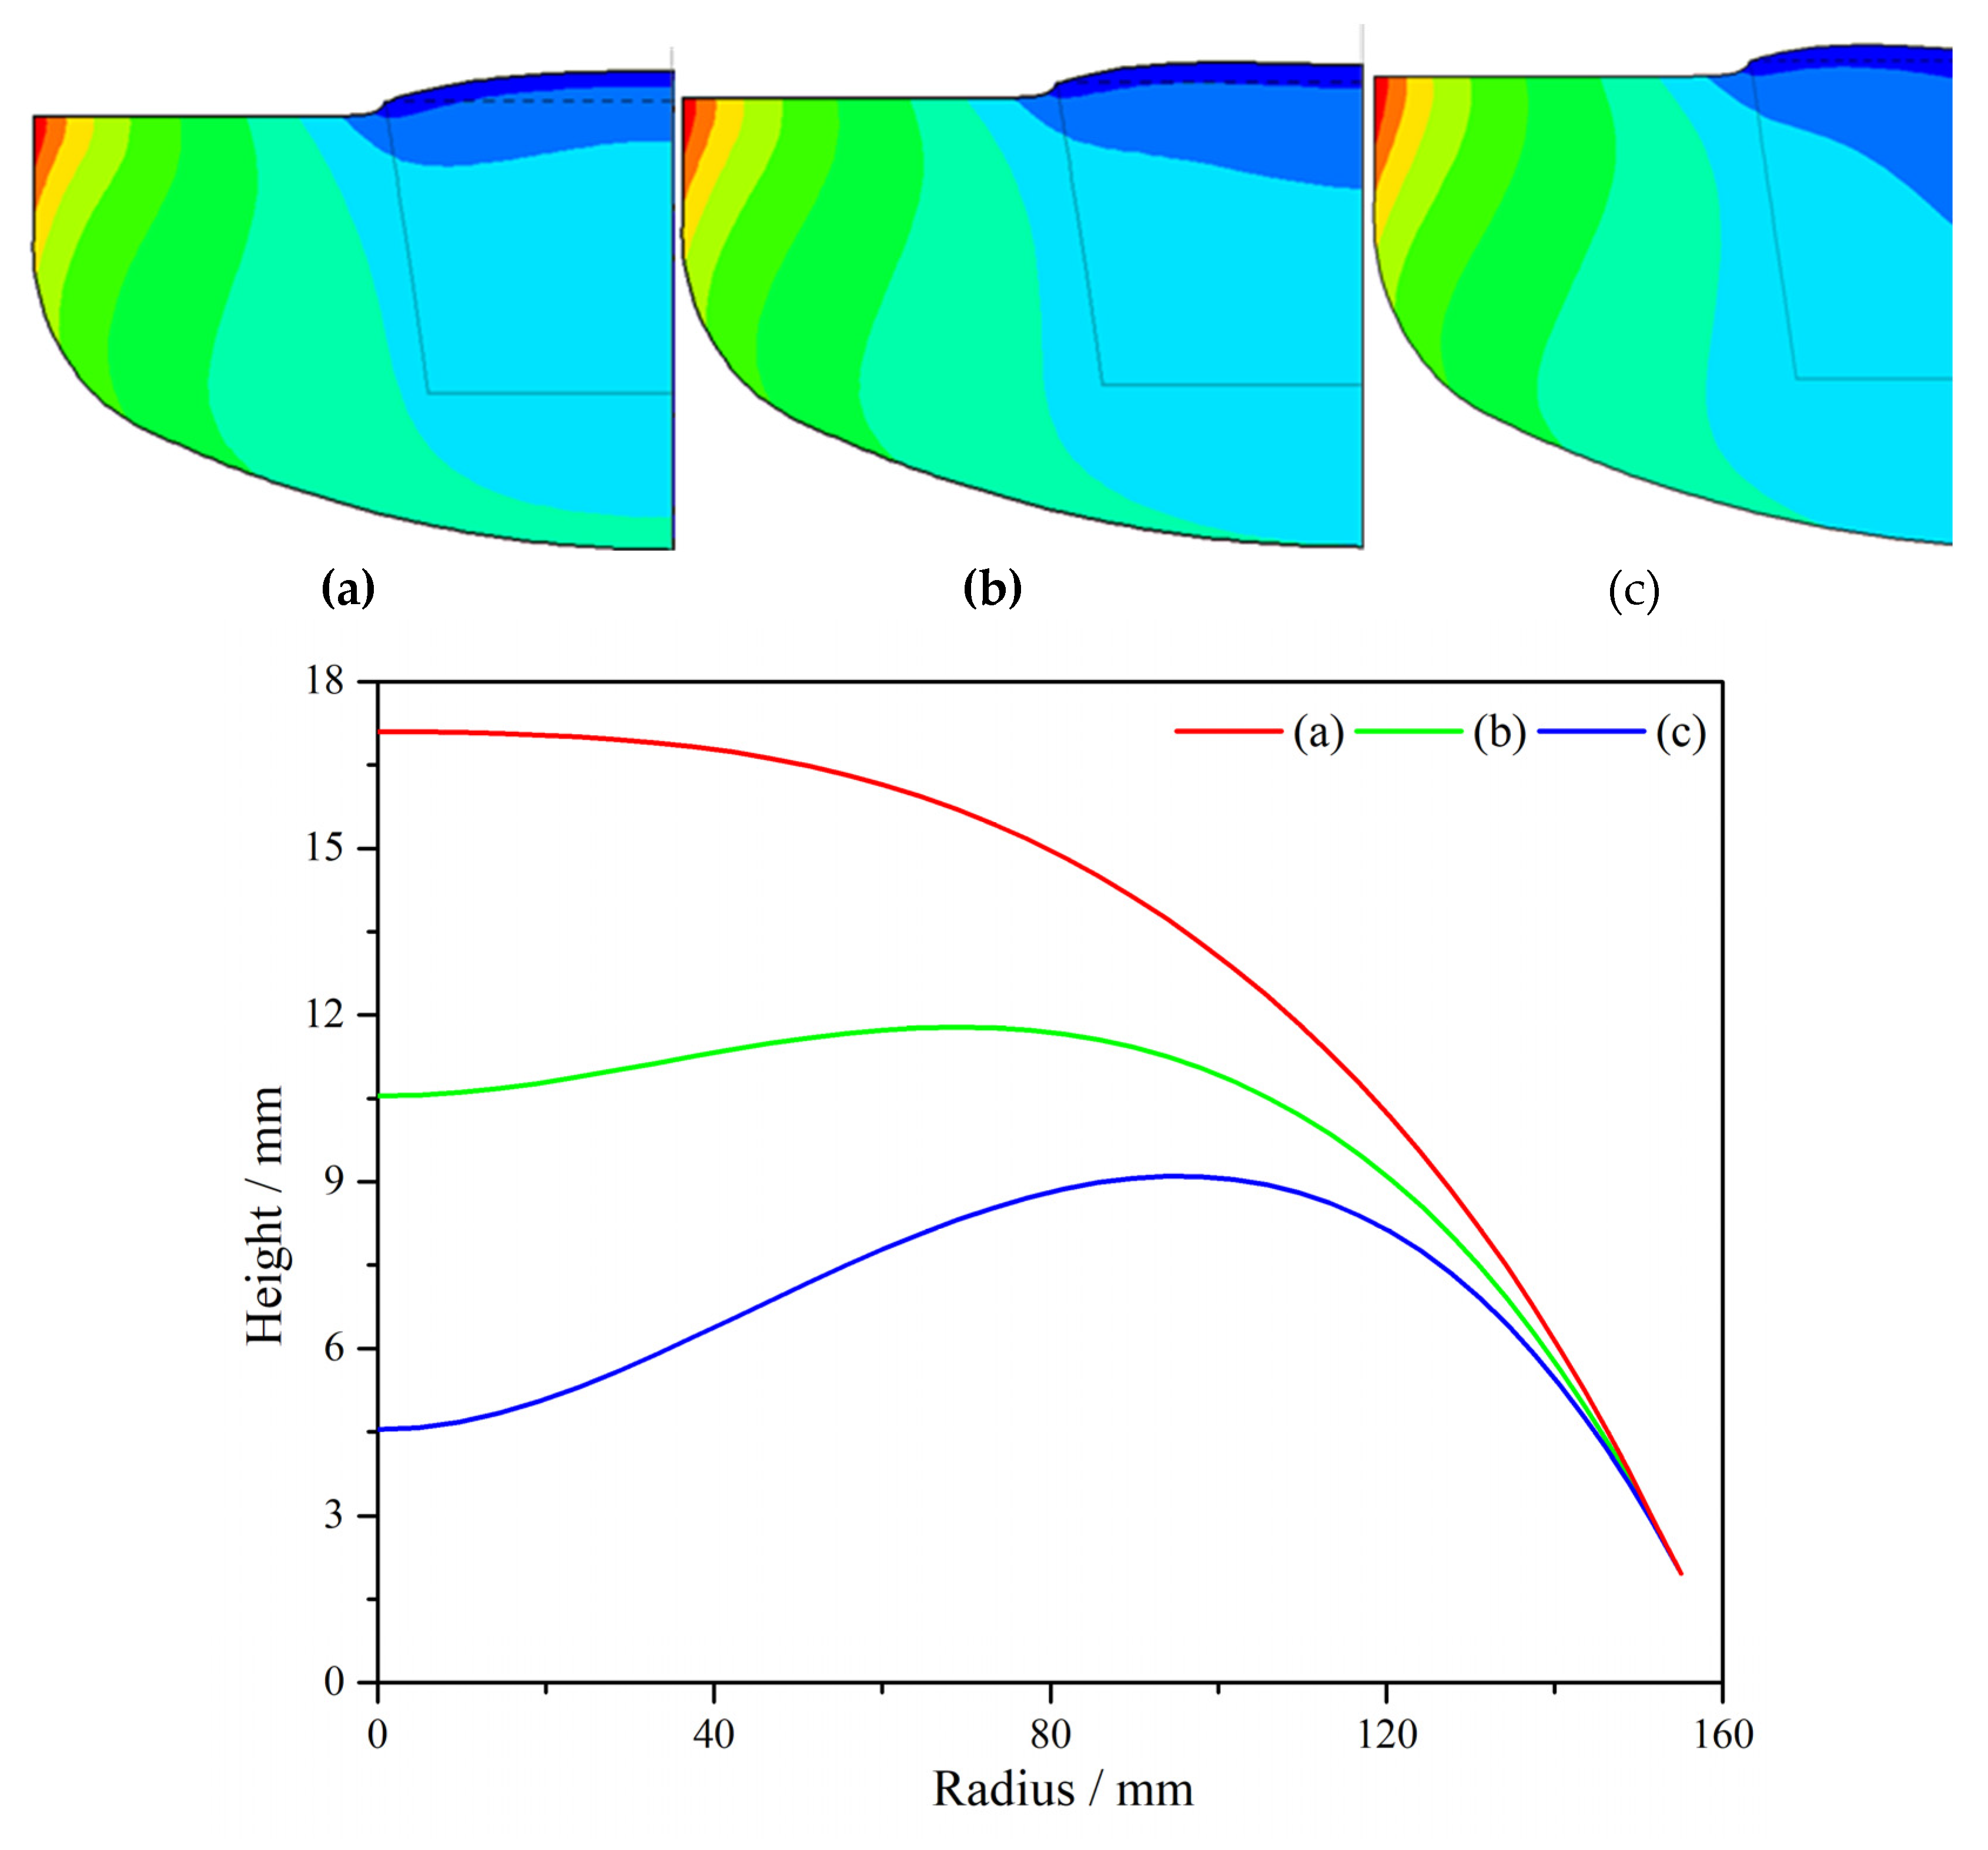
Figure 3 compares the influence of magnetic field intensity and distribution on flow structure under different CMF conditions. As can be seen from
Figure 3 that the structure of melt under different CMF conditions consists of two parts, one forming a Taylor-Proudman unit (1) under the ingot and the other forming a buoyancy unit (2) along the crucible wall [
10]. Among them, cell (1) is mainly caused by the rotation of the crystal and crucible, and cell (2) is mainly formed by convection driven by buoyancy. Obviously, under the three ZGP models, the distribution area and strength of the two kinds of circulation have obvious changes.
It can be seen from
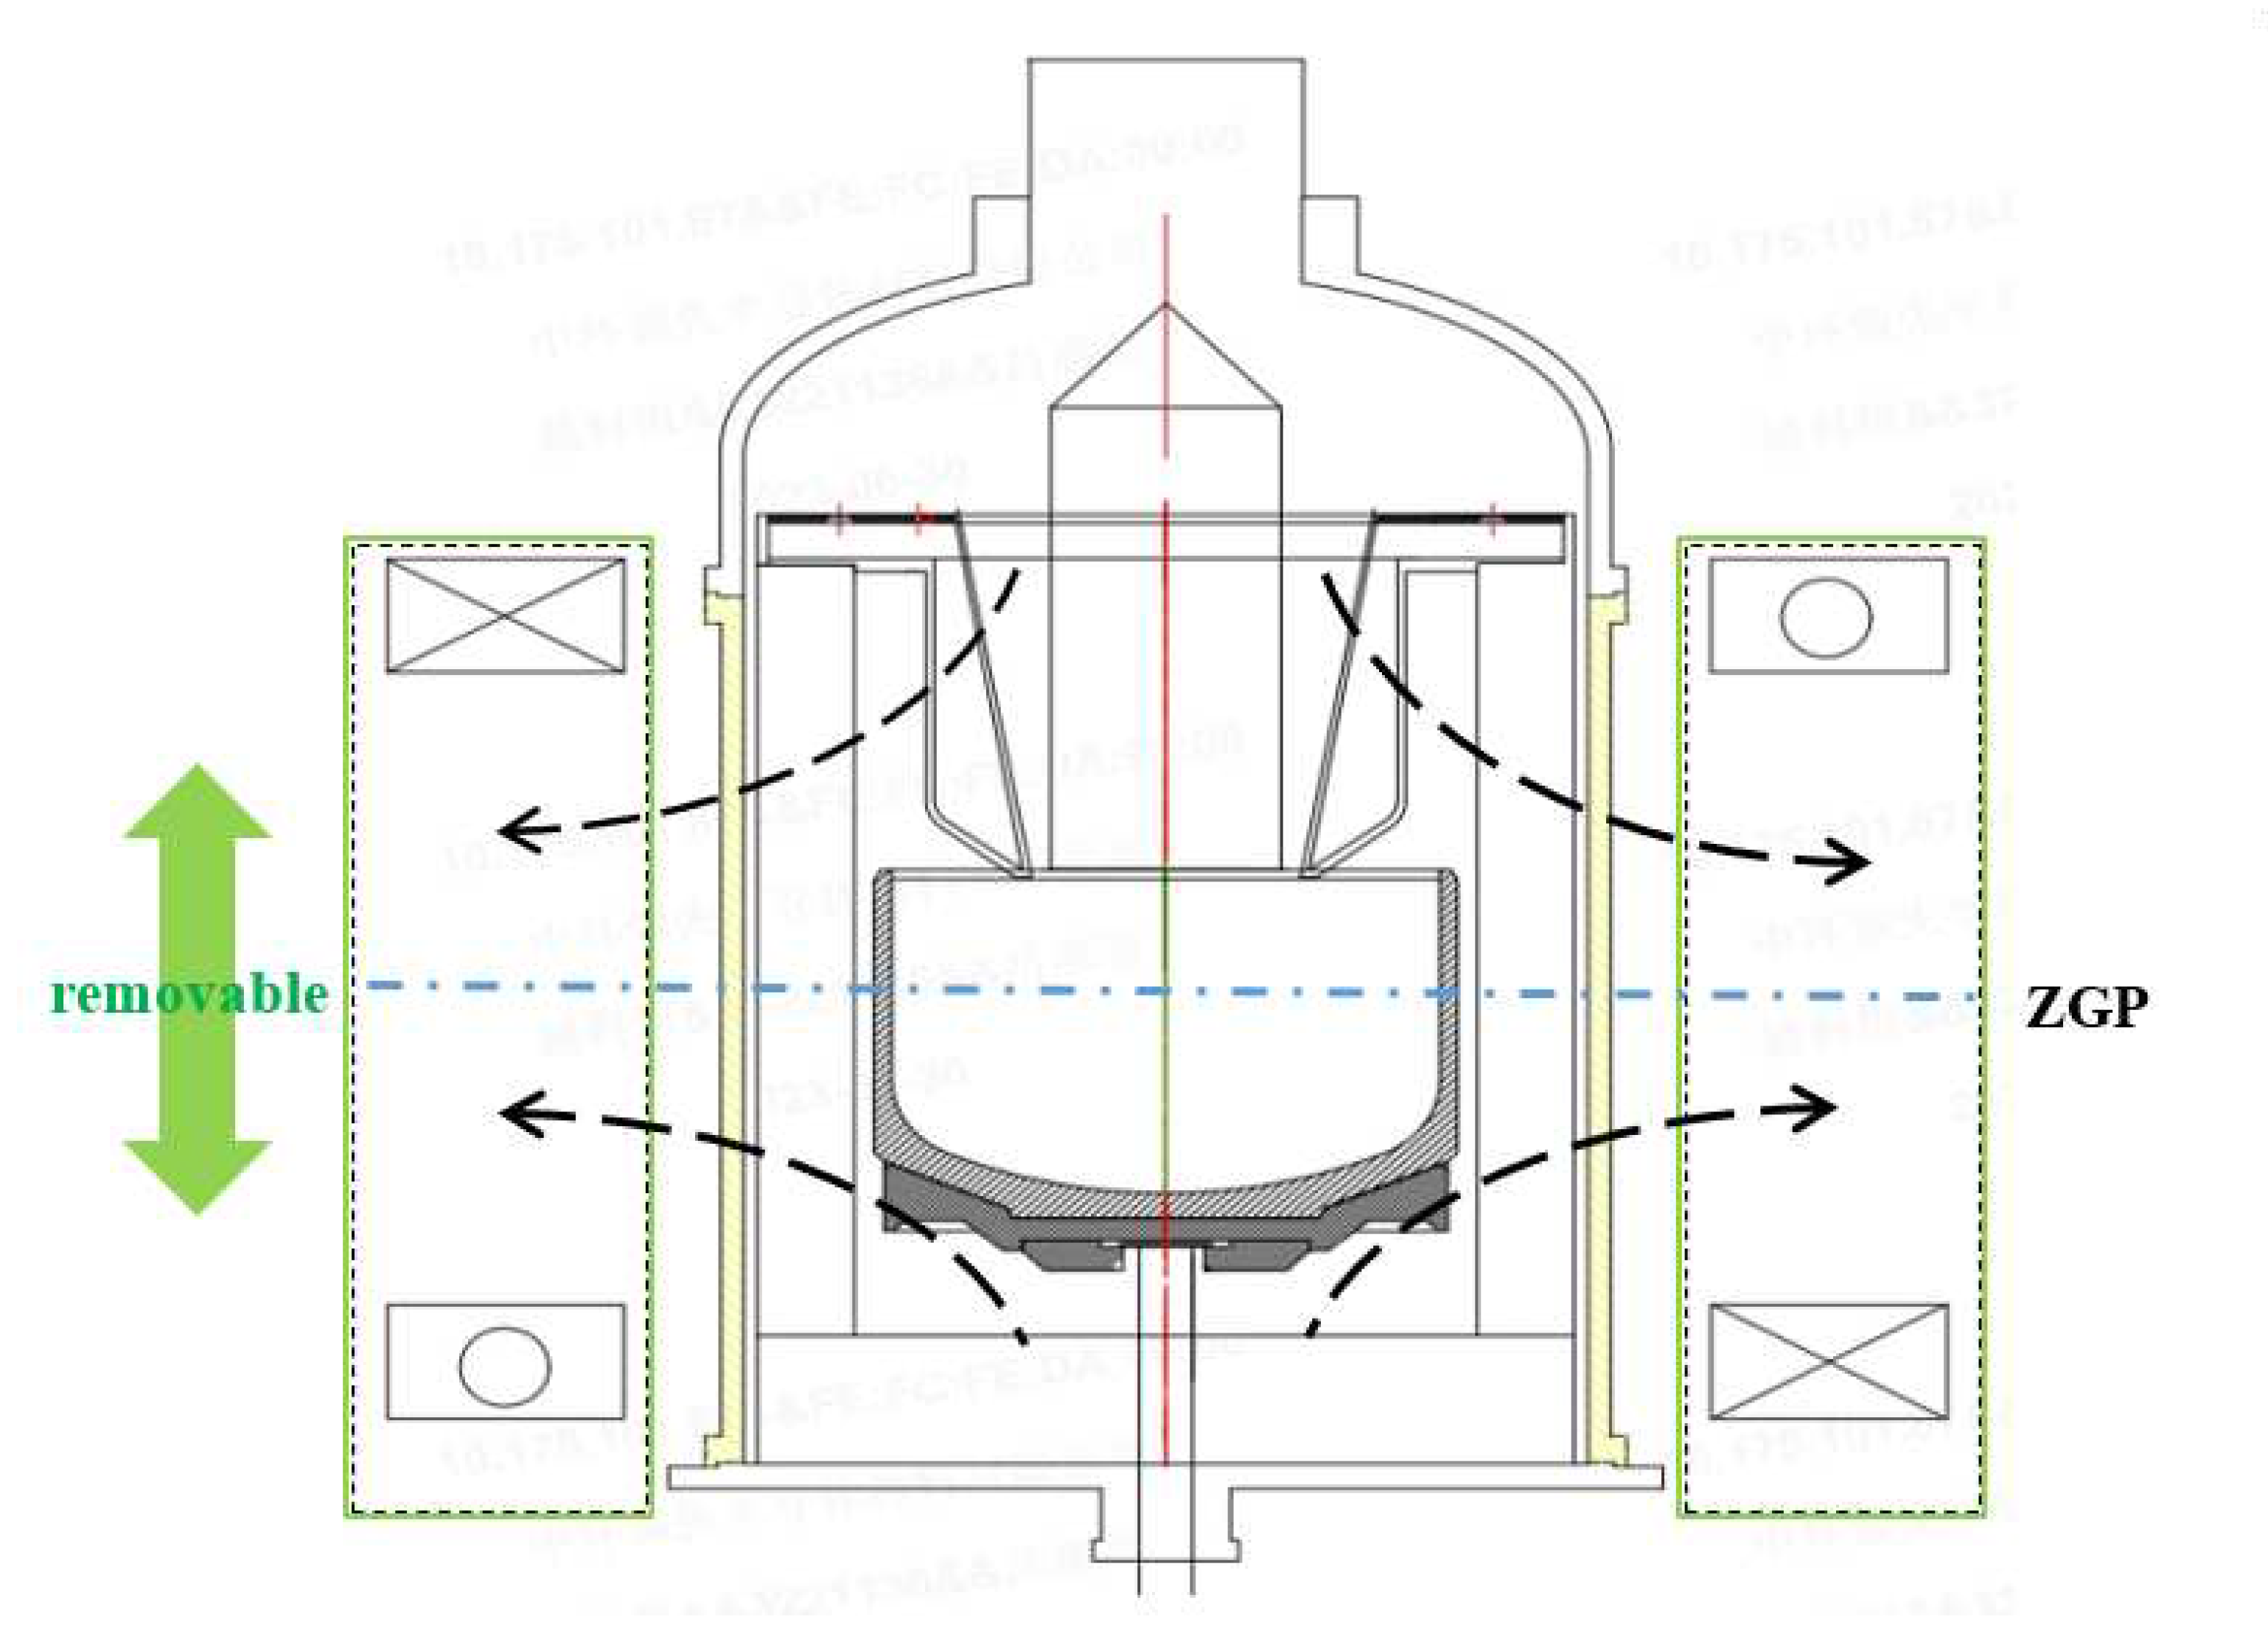
Figure 3 that the Taylor-Proudman vortex (1) is a counter-clockwise flow cycle. As the position of the zero magnetic surface moves down, the horizontal magnetic field near the growth interface gradually increases and dominates, because this direction is contrary to the Taylor-Proudman vortex (1), inhibits the counter-clockwise cell (1) in the crystallization zone. On the contrary, as the zero magnetic surface moved upward, the horizontal magnetic force weakened, and the flow area of the Taylor-Proudman vortex (1) gradually increased. When the ZGP at 20 mm above the m-g interface, the CMF suppresses the buoyancy convection near the crucible wall, a region of high magnetic field intensity. The cell (1) extends from the central part to the outer region of the melt and the flow area is the largest, thus preventing the diffusion of oxygen from the bottom of the crucible wall into the solid-liquid interface, as shown in
Figure 3a.
In addition, moving the center of the ZGP above the m-g interface increases the vertical component of the CMF in the direction opposite to the buoyancy cell (2). Especially for ZGP located 20 mm above the m-g interface, this results in a weakening of the cell (2). Moreover, it can be seen from the magnetic induction intensity distribution in
Figure 3c that the magnetic induction intensity of the melt at the bottom of the crucible wall is the weakest in this case, so the buoyancy cell (2) is enhanced, and the Taylor-Proudman cell (1) is weakened, resulting in more high oxygen melt at the bottom entering the crystal. Meanwhile, the distribution of the two kinds of flow circulations leads to a W-shaped growth interface geometry in
Figure 3c, which is known as a source of dislocation generation [
11], which is unfavorable to the single crystal growth process.
4.2. CMF effects on the oxygen transport
It is assumed that oxygen diffusion at all surfaces is of dissolution and volatilization rate Determinants, in the case of steady growth, can establish a simple relationship:
where, [O]
S, [O]
m and [O]
a are respectively the number of oxygen atoms from unit time entering the crystal, melting from the quartz crucible and evaporating from the free surface of the melt.
where, A
R is the cross-sectional area of the crystal rod, A
c is the contact area between quartz crucible and silicon melt, A
m is the contact area between silicon melt and external atmosphere, v is the pulling speed, k
e is the equilibrium segregation coefficient of oxygen, C
m is the concentration of oxygen in melt. C
c is the concentration of oxygen on the surface of quartz crucible, C
a is the concentration of oxygen in the peripheral atmosphere,
δc is the thickness of the diffusion boundary layer between quartz crucible and silicon melt,
δm is the thickness of the diffusion boundary layer between silicon melt and the peripheral atmosphere, and D is the diffusion coefficient.
Based on the above discussion, under the certain crystal growth parameters, the oxygen concentration in the crystal depends on the thickness of the two diffusion boundary layers. However, convection in the melt will affect the thickness of the diffusion boundary layer, change the transport of oxygen content, and thus affect the distribution of oxygen content, so it is significant to study the convection in the melt. The theoretical calculation of the thickness of the boundary layer is easily derived. In the previous research, the boundary layer at the crucible wall was discussed [
12], there is a substantial theory and calculation method. The habitual force expression of the unit is
,
is proportional to U/l (U is the velocity at the outer edge of the boundary layer), therefore
,the expression of friction force of monolith volume is
. Suppose that under the condition of stratified flow, its expression is
, since the magnitude of the velocity ladder perpendicular to the wall is equal to the magnitude of the accumulated friction force of the mono site, the lower relation formula can be obtained as follows,
The correlation formula of boundary layer thickness is obtained, below:
The scale factor is 5, taking the length as 1 as the reference length, so can be calculated as follows,
The common formula of the deduced boundary layer is as follows,
It can be concluded from formula (6) that the boundary layer is inversely proportional to the axial flow velocity, where is the thickness of the boundary layer, Re is the Reynolds number, and U = V(x,y) is the longitudinal velocity.
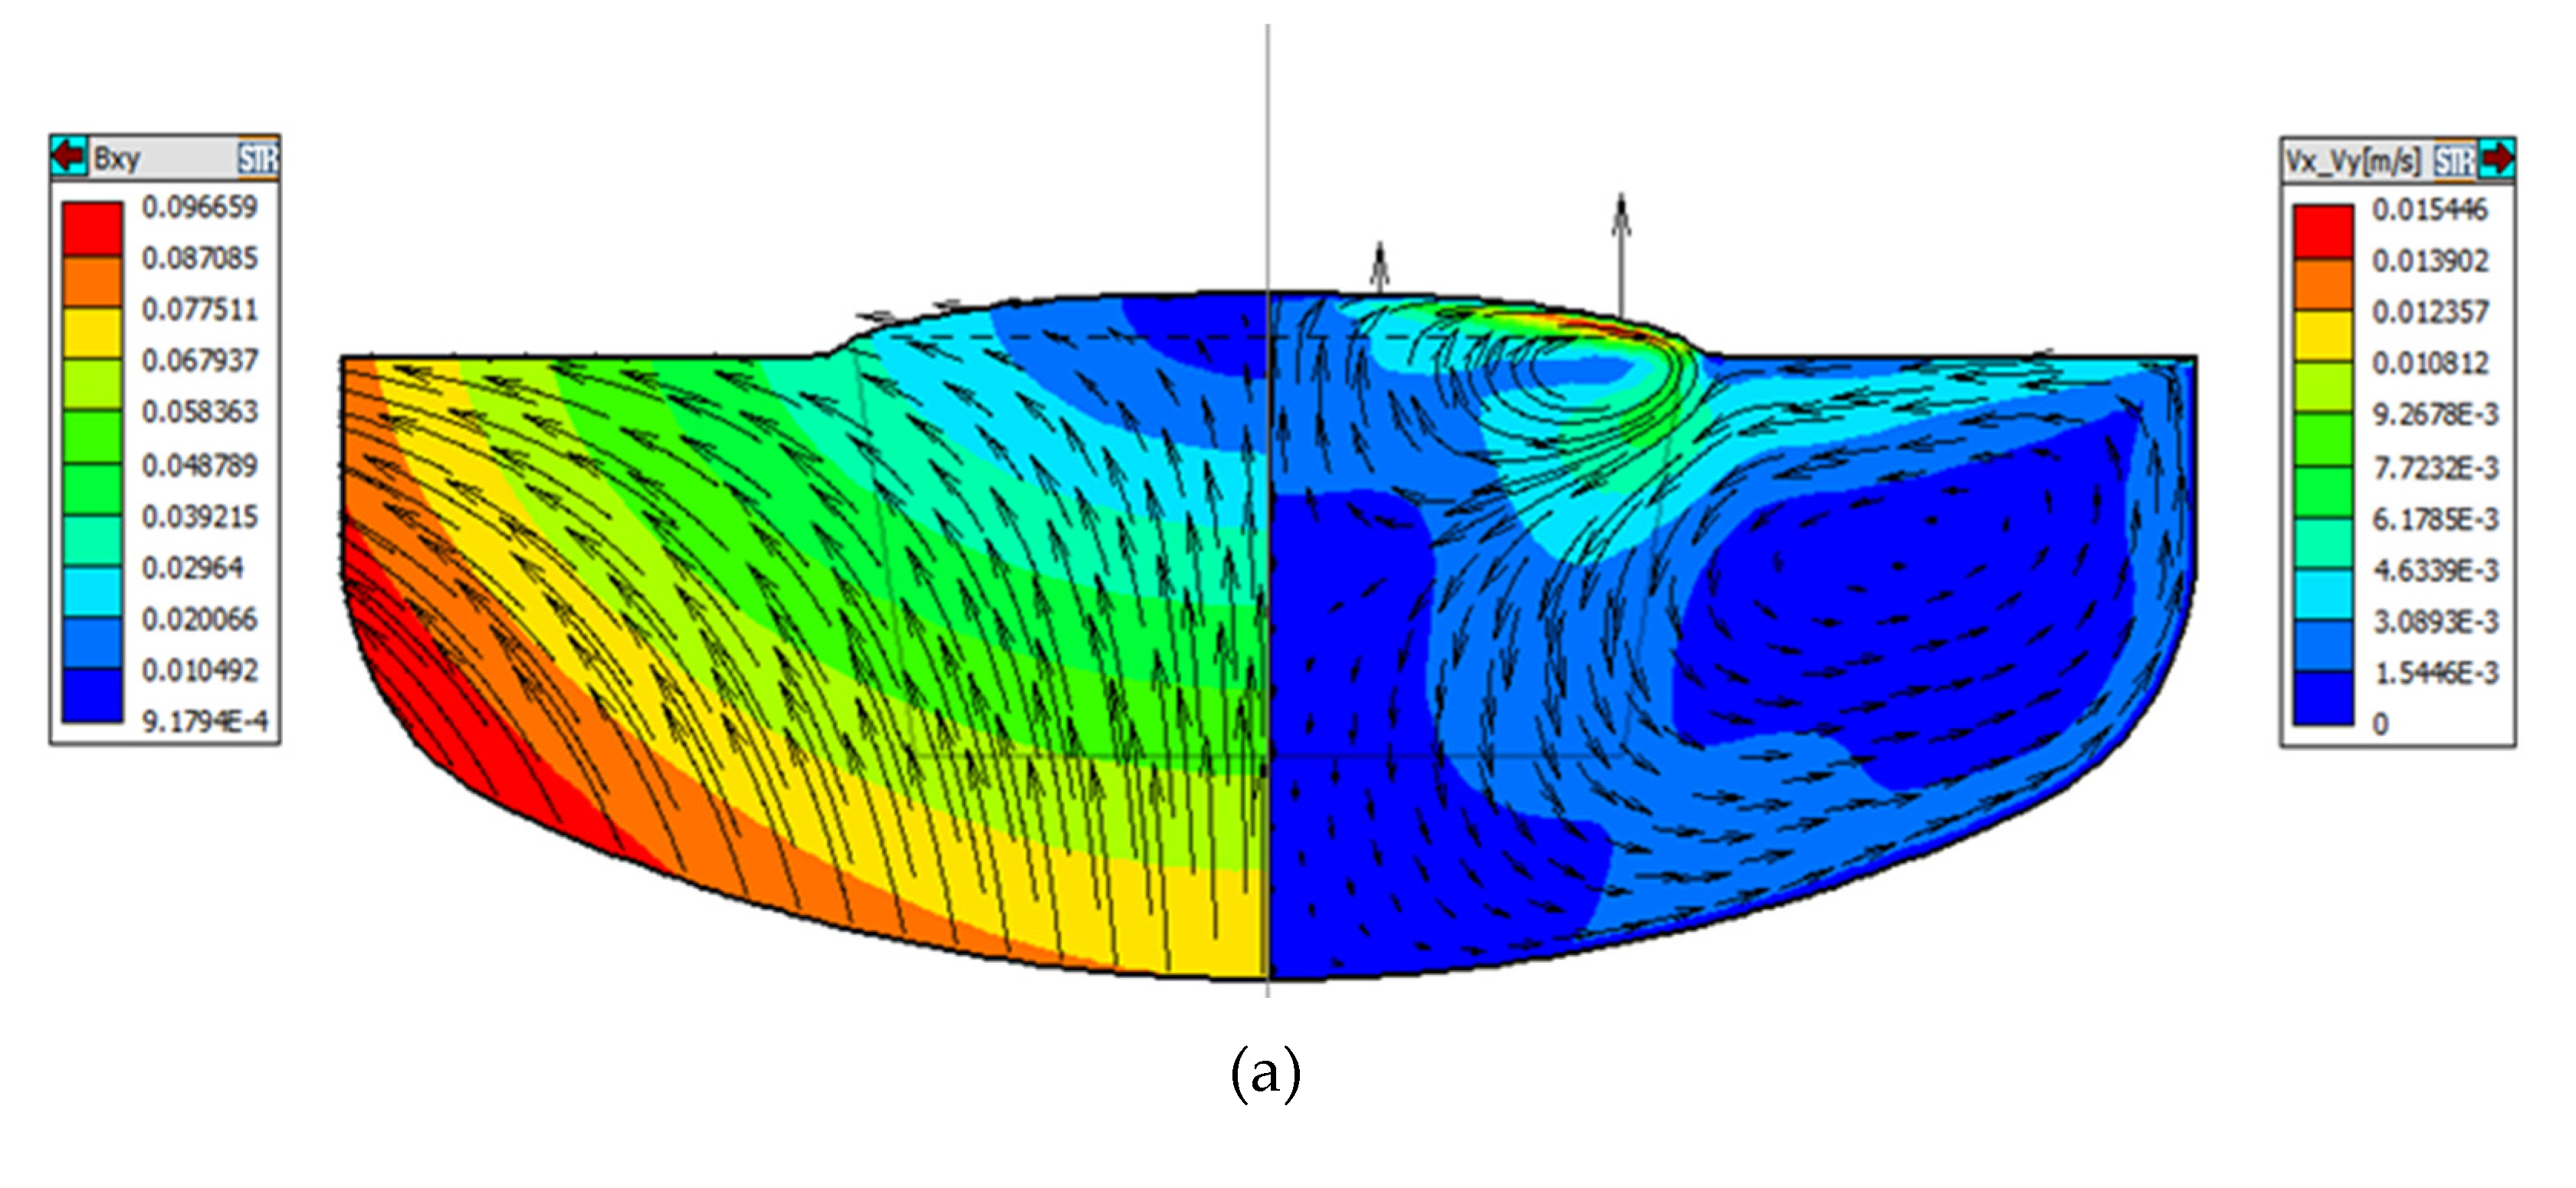
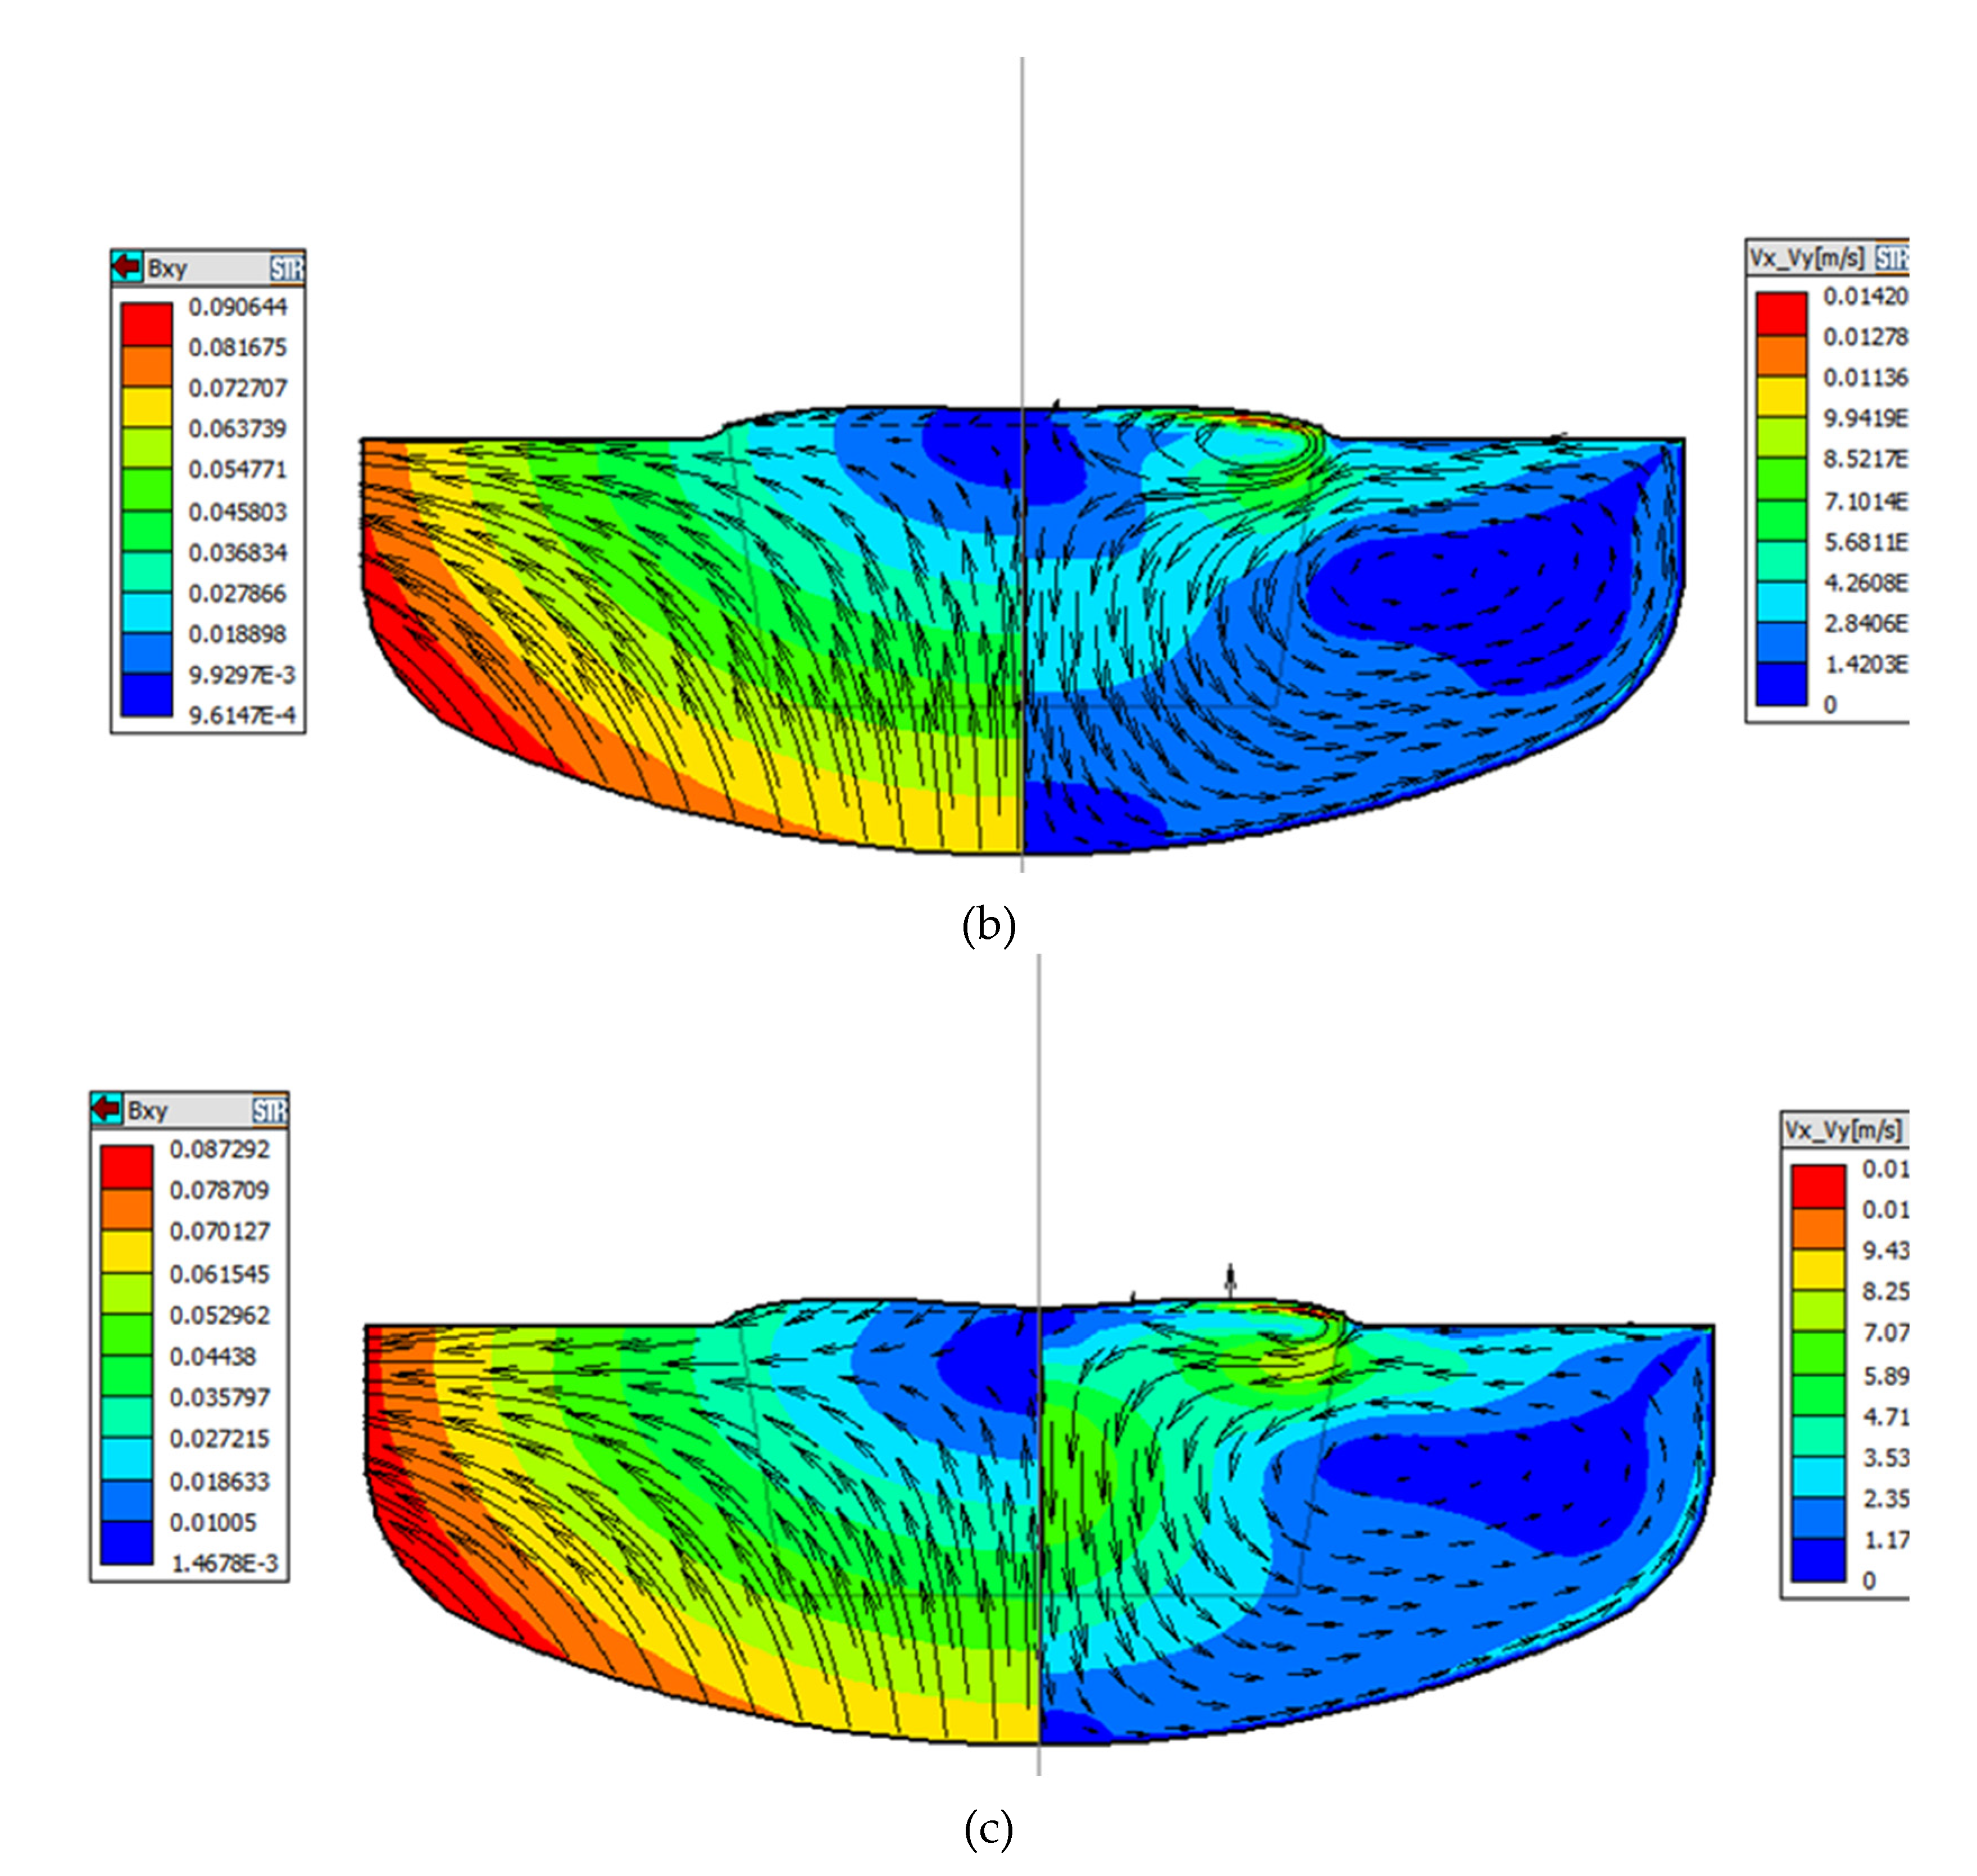
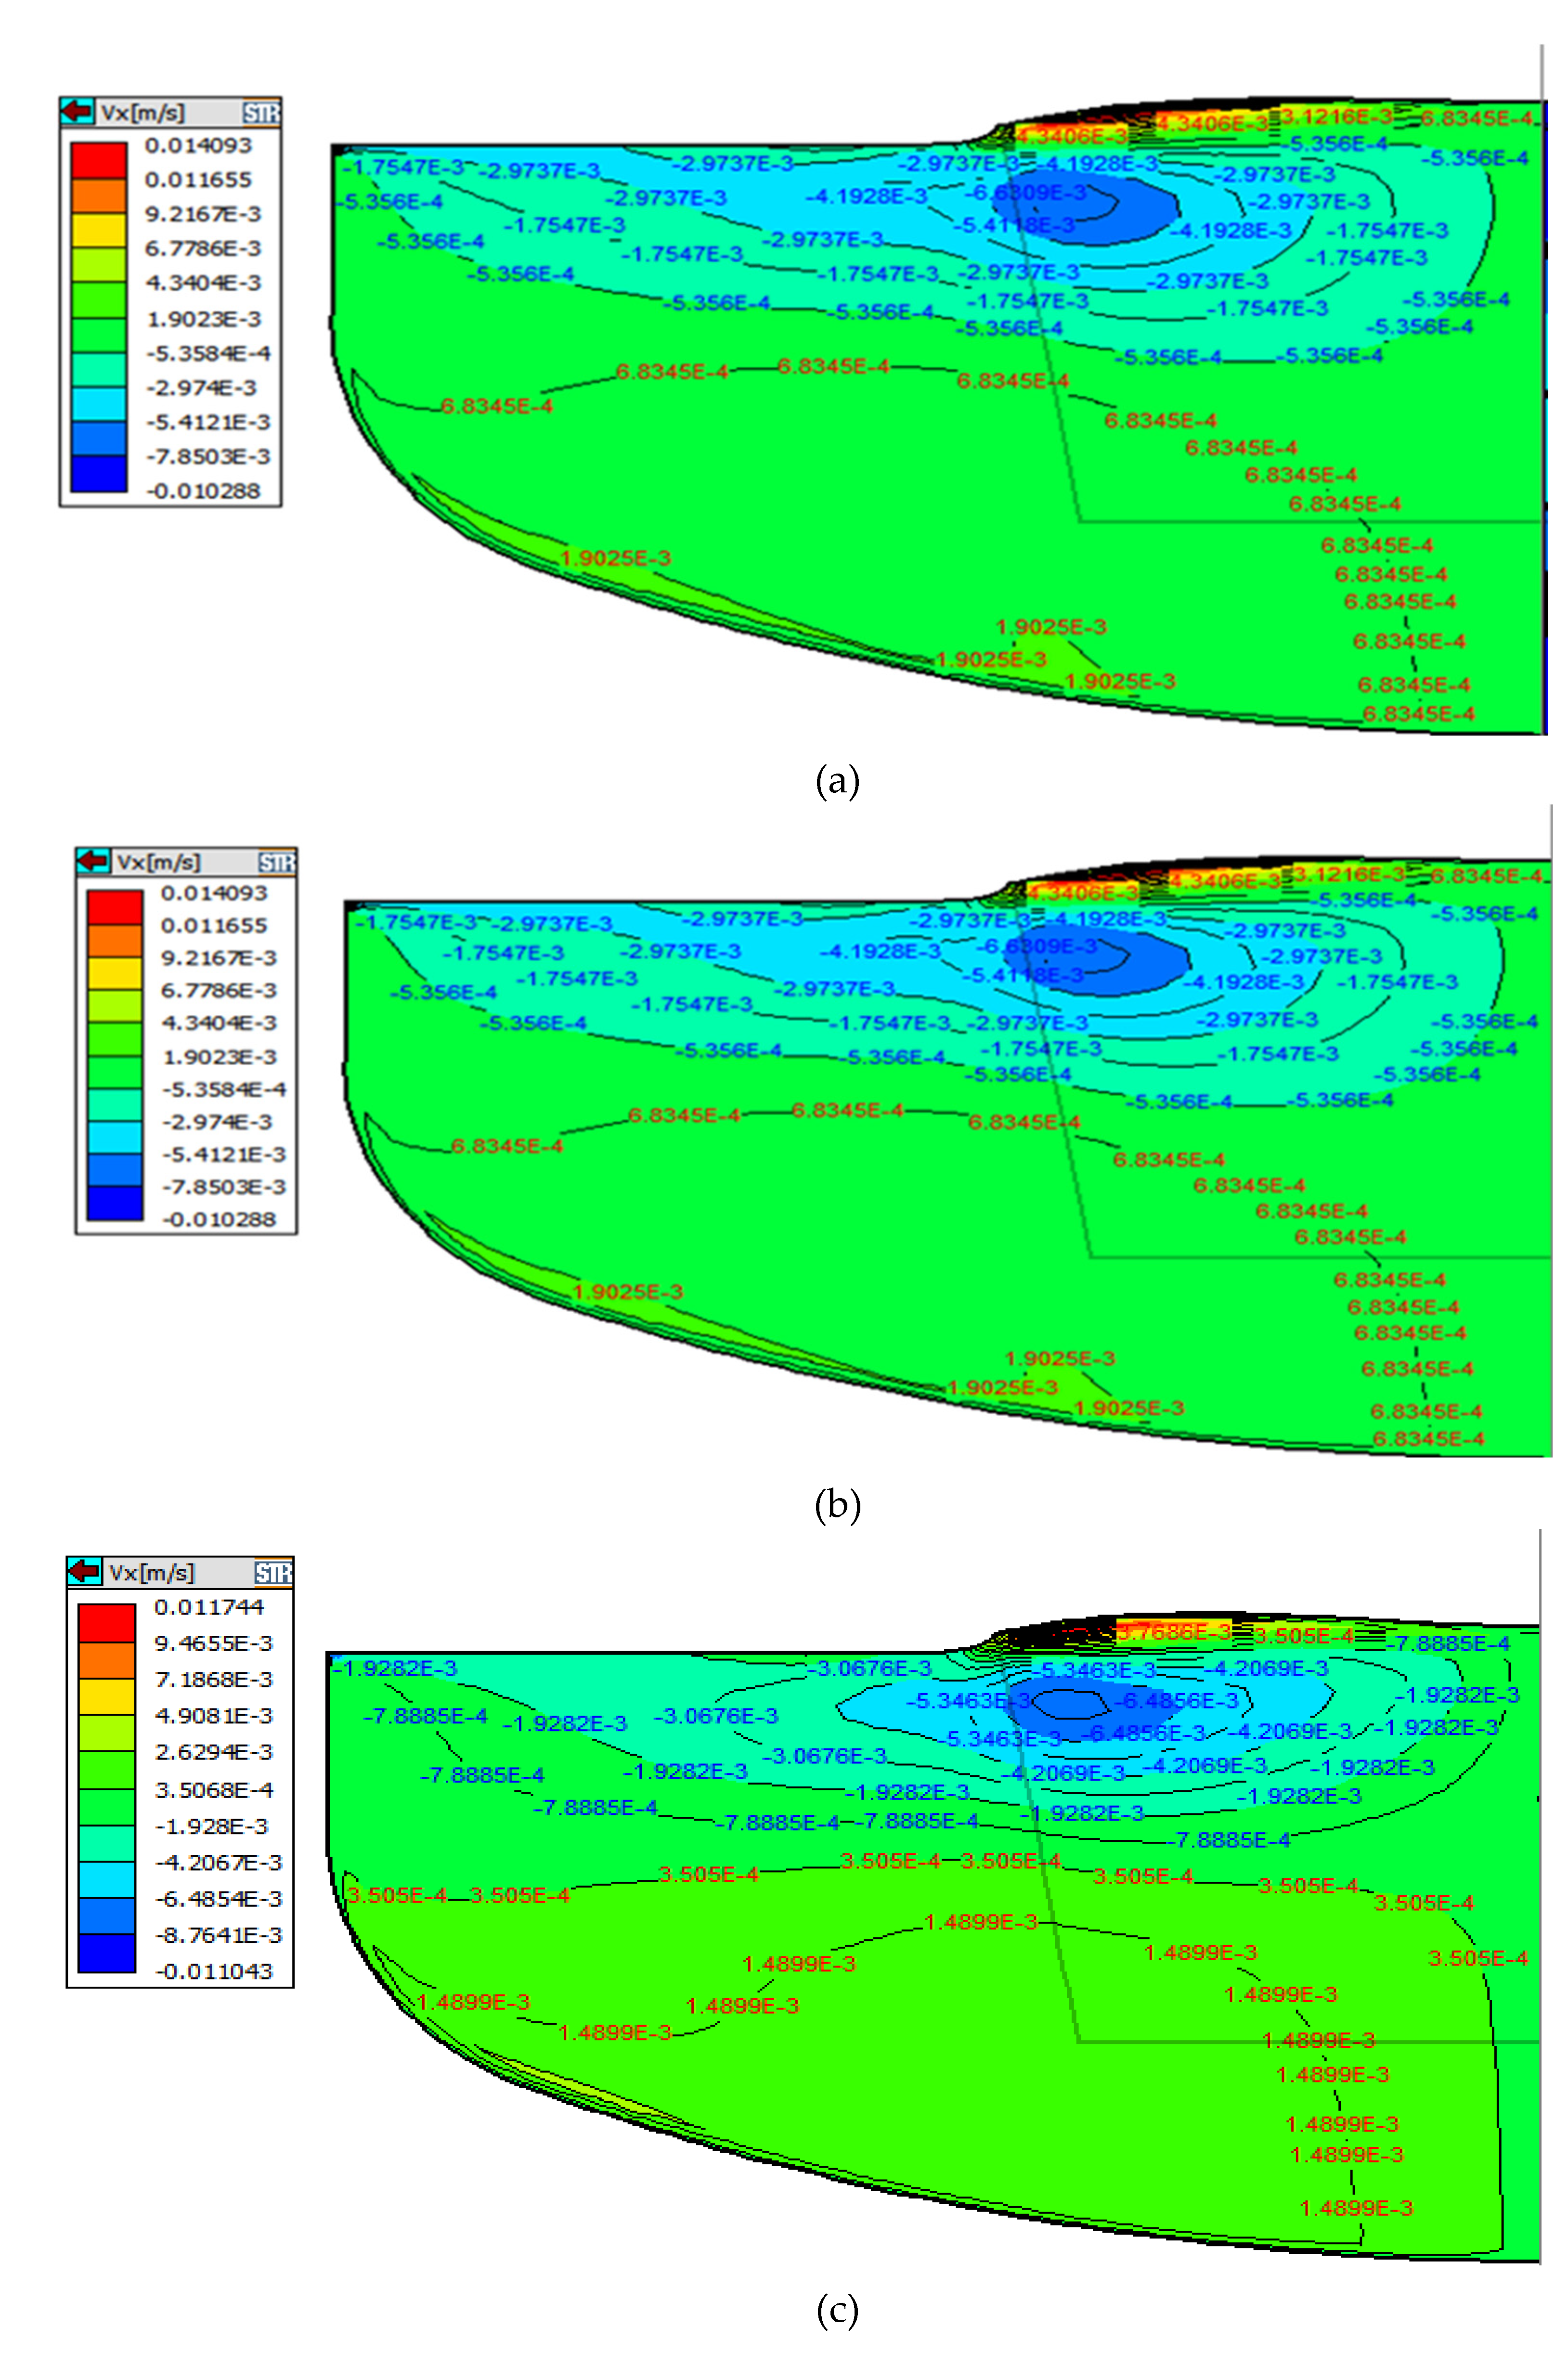
Consequently, to clearly explain the effect on oxygen concentration under the three magnetic field models, we will focus on the convection at the crucible wall, crucible bottom, and free interface. As can be seen from the convection distribution on the right of
Figure 3, under the action of buoyancy unit (2), the convection at the crucible wall is dominated by the longitudinal direction, while the convection at the bottom of the crucible and the free interface is radial and opposite. As can be seen from the description of the first section, the convection under different magnetic field conditions is different. In order to clearly explain the oxygen concentration under the three magnetic field models, we show a typical example of the distributions of radial velocity component in the melt, as shown in
Figure 4a-c.
It is generally known that the oxygen in the melt comes from the oxygen dissolution, which occurs at the interface between the silicon melt and crucible. The oxygen is mainly dissolved at the bottom of the crucible and then transferred to the vicinity of solid-liquid interface through the thermal convection. According to previous studies and formula (6), the thickness of the boundary layer is inversely proportional to the velocity at this position. As can be seen in
Figure 4a-c, the horizontal velocity at the bottom of the crucible and at Angle R gradually increases as the position of ZGP moves down, and the horizontal convective flow rate of melt near the bottom of the crucible is the largest at -20mm position. Therefore, the diffusion boundary layer between the quartz crucible and the silicon melt at this position is thin, the washing of the crucible wall is more intense, resulting in more oxygen impurities entering the melt, and finally a part of the oxygen in the melt is integrated into the crystal. The oxygen concentration distribution in the three cases are displayed in
Figure 5a-c, through the comparison of the results of oxygen concentration, the oxygen concentration near the bottom of the crucible gradually increases as the position of the ZGP moves down, and it is again verified that the decomposition of the crucible wall is inversely proportional related to the strength of the convection flow (that is the thickness of the boundary layer).
The influence of different CMF configurations on the flow pattern has been studied above and the initial oxygen concentration distribution in the three cases are displayed in
Figure 5a-c. In the CMF, most of the oxygen is carried to the free surface evaporates. Only a small amount is transported to the crystallization zone. A small gradient of oxygen concentration is found in the core region of the melt due to the Taylor–Proudman flow.
For the case that ZGP is located 20 mm above the m-g interface, according to the above discussion and V
X-V
y overall analysis, the flow rate near to the crucible wall is slow due to the inhibition of melt convection near to the crucible wall, which results in the decrease of dissolved oxygen concentration in the crucible wall and slow corrosion rate of the crucible. Moreover, with the melt convection of cell (2), oxygen in the area near to the crucible wall is transported to the free interface and volatilized. Less oxygen is delivered to the core region of the melt, less and less oxygen diffuse into crystal, so the low-oxygen zone below the solid-liquid interface is larger, as shown in
Figure 5a.
For the case that ZGP is located on the m-g interface, at a given magnetic field strength, the zero magnetic surface enhances the flow of dissolved oxygen from the crucible into the melt, then bring into the crystal. However, the decrease of the axial magnetic intensity in the crystallization zone causes the radial distribution of oxygen on the growth interface to become uniform.
In the ZGP is located 20mm below the m-g interface cases, With the change of the position of the zero magnetic surface, the strength and weakness of the convection flow near the crucible wall changed with it. Under the action of strong convection, the melt convection brushing near the wall of the quartz crucible is stronger, which can also be proved by the melt convection intensity distribution oxygen concentration at the growth interface is increased, greater than the positive of 20 mm above.
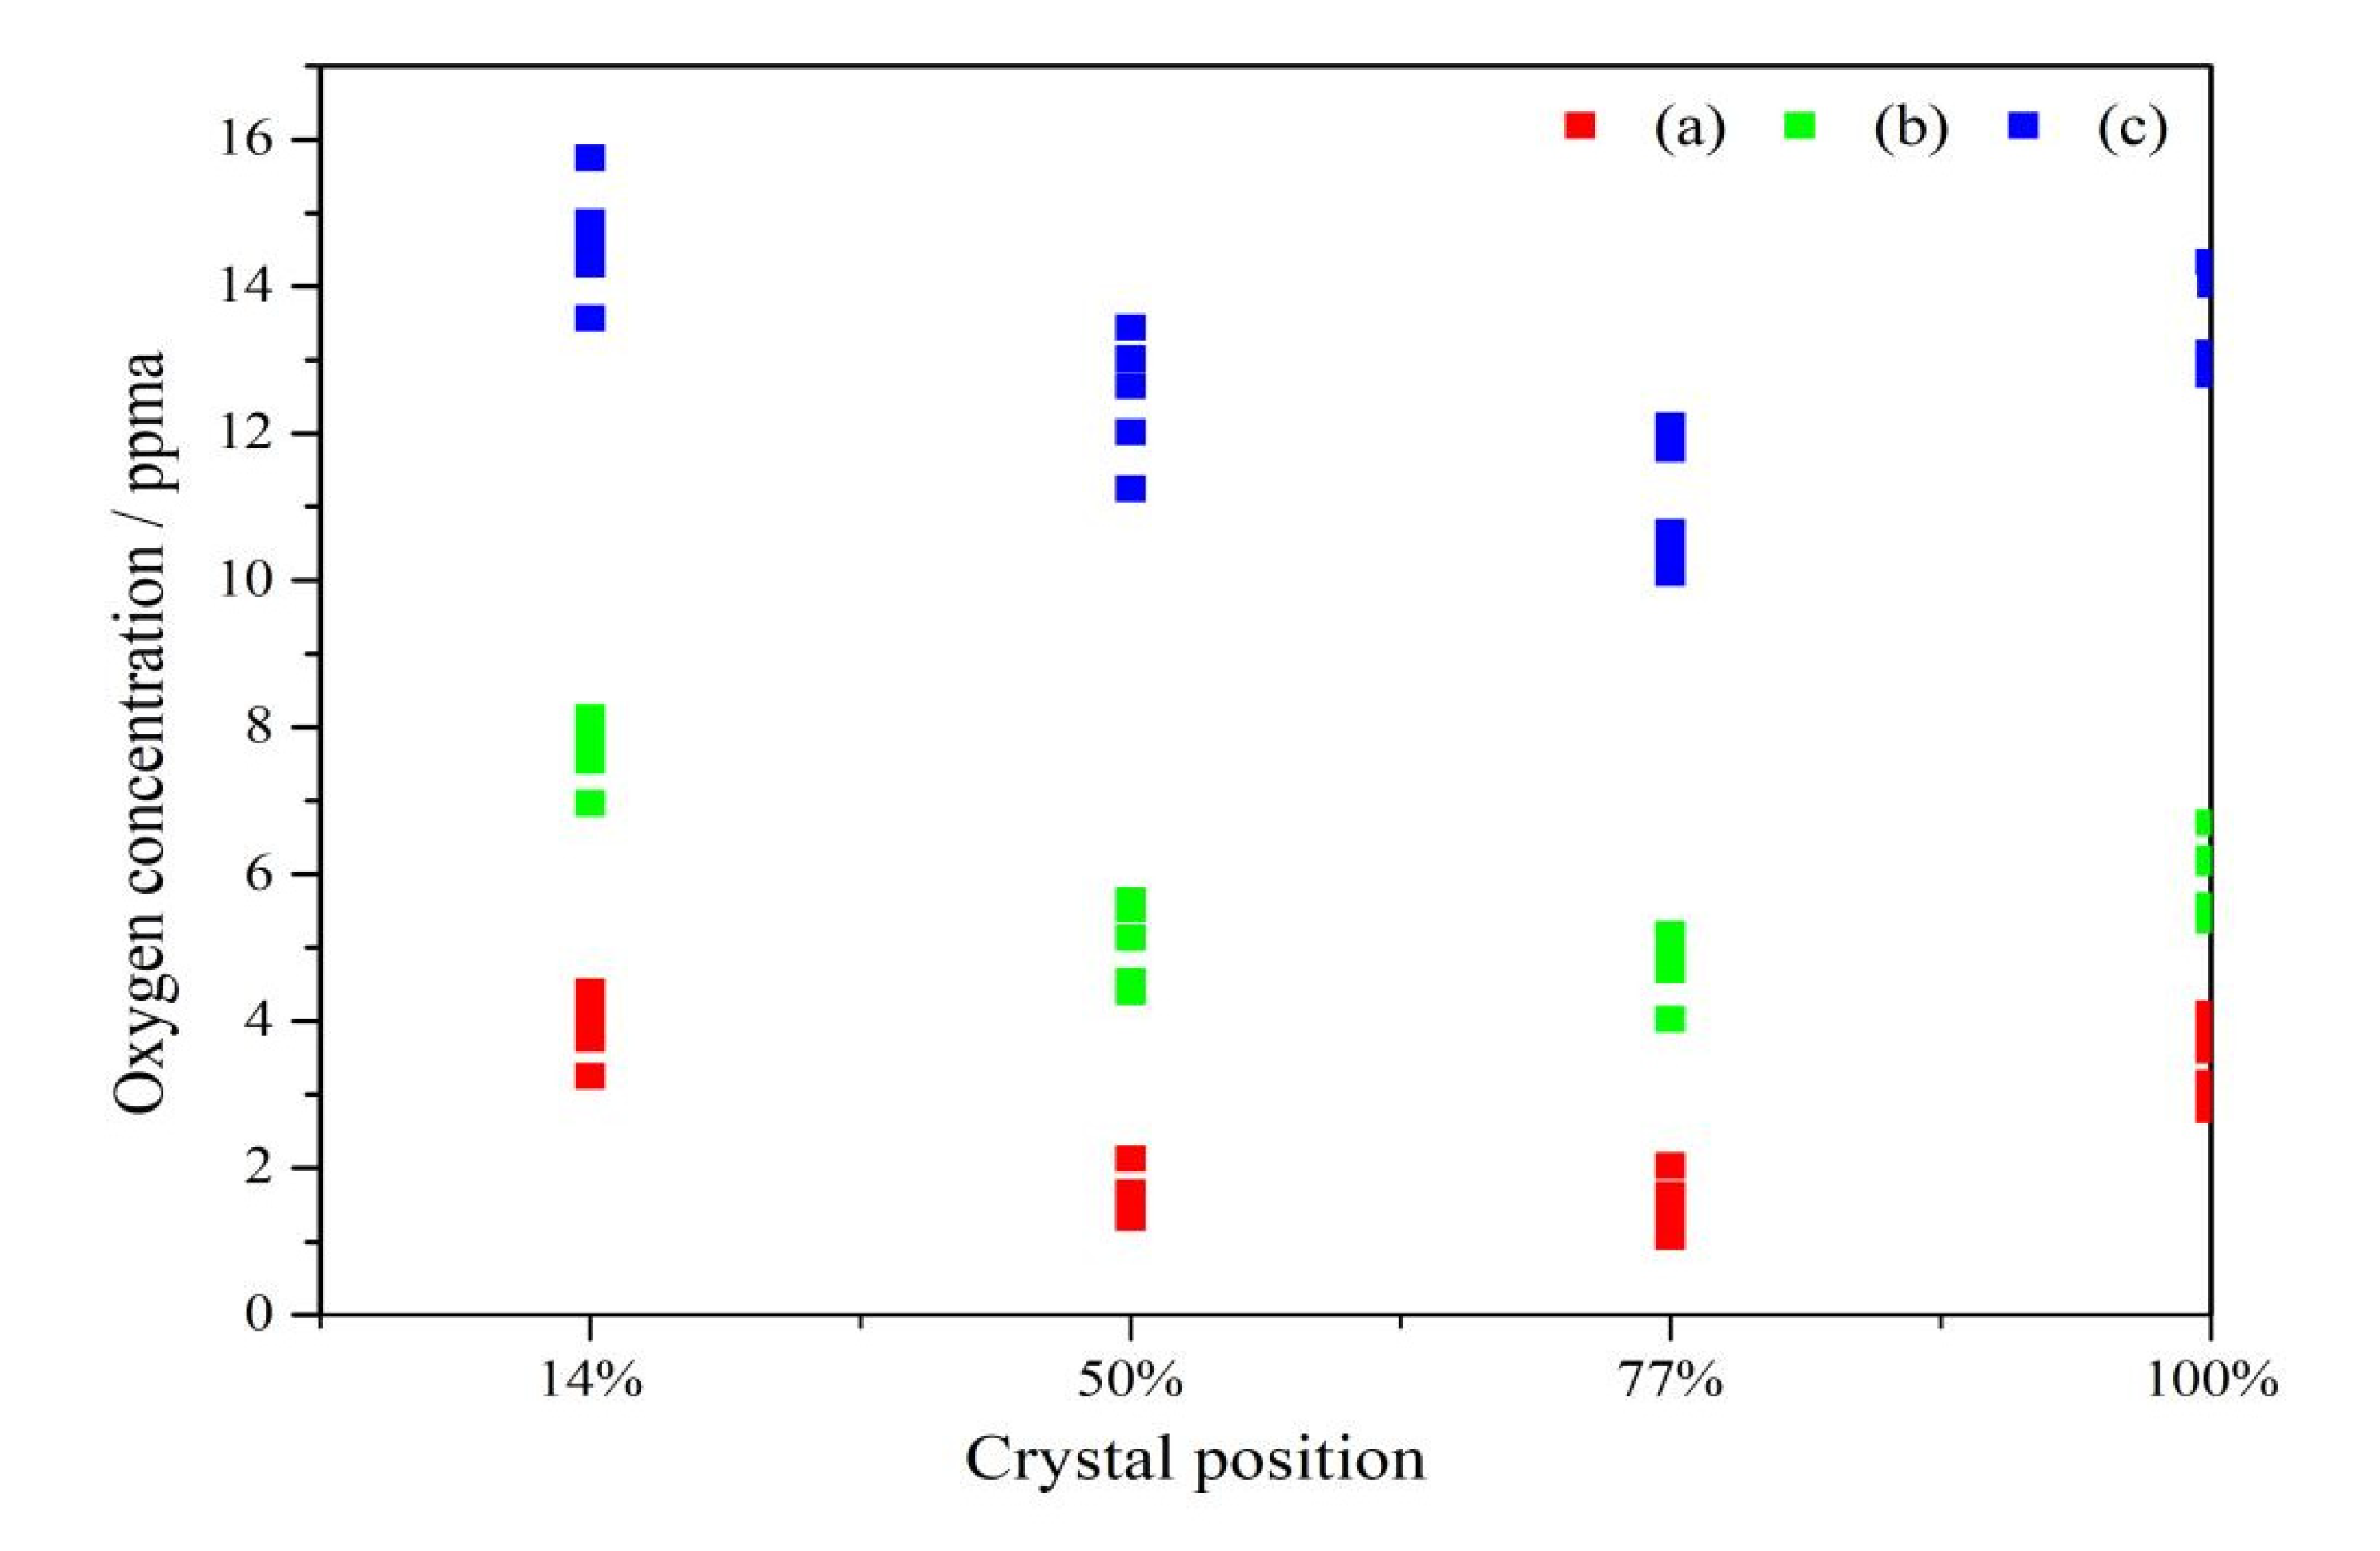
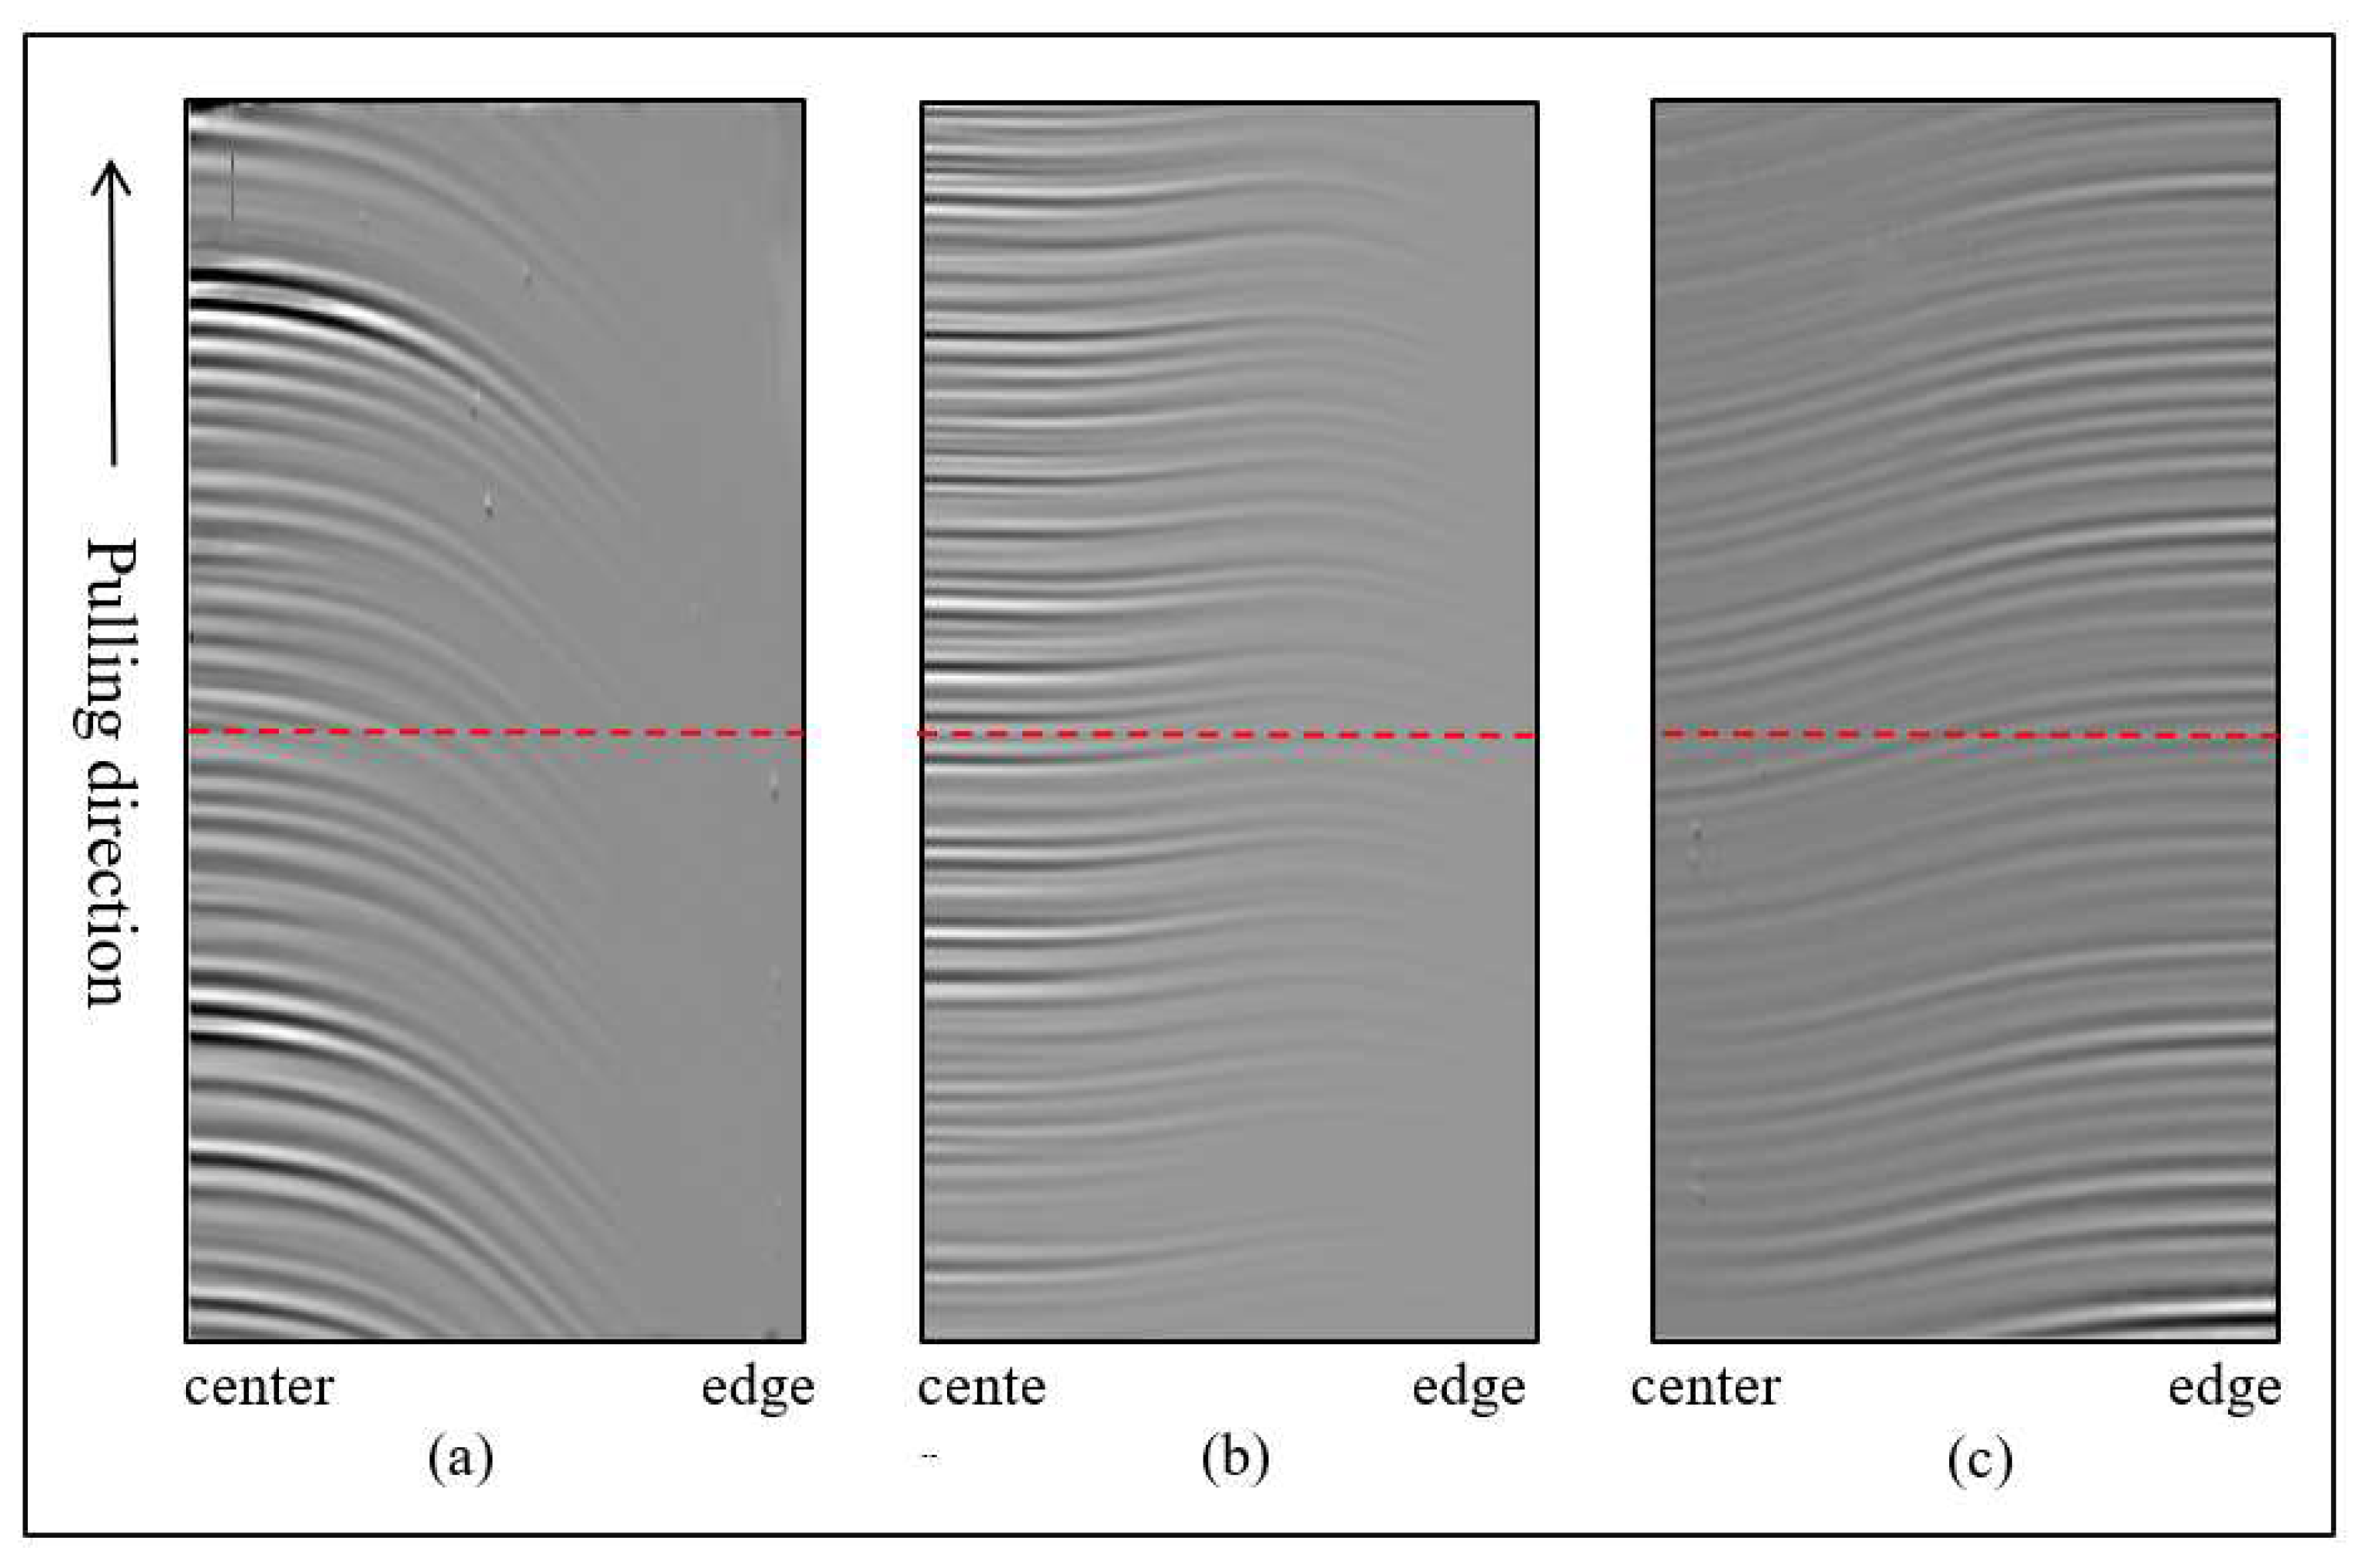
In the above mentioned, the single crystal growth parameters (experiments are carried out with fixed rotation rates for the crucible and crystal), we carried out the actual industrial single crystal pulling process, and the whole single crystal is segmented to test the central oxygen concentration at the head and tail of each crystal segment. The results are shown in the
Figure 6. The figure displays the difference of oxygen concentration in the center of the interface at the crystal segment with the crystal length. When the ZGP is located 20 mm above the m-g interface, the overall oxygen concentration shows the lowest level. At the former part of crystal lengths, the axial oxygen concentration decreases slowly as the crystal length increases until it reaches a minimum, the lowest value in the three groups was 1.02 ppma. Then increases continuously as the crystal length increases further. Therefore, the largest oxygen concentration appears in the initial and final stages of the whole crystal growth process. The experimental results and simulation results show the same trend, which further confirms the discussion under numerical simulation in this paper.
