1. Introduction
Atmospheric-pressure plasmas (APPs) are a favorable alternative to vacuum plasmas as they do not require an expensive vacuum pump and chamber. As an APP is not limited by the dimensions of a vacuum chamber, it enables flexible processing with various substrate sizes [
1]. APPs can be used for various applications including surface cleaning, altering surface physical and chemical properties, modifying surface topography, and depositing materials [
2,
3]. A nitrogen APP can be used for nitrogen doping of materials [
4,
5].
Supercapacitors (SCs) have attracted much interest because they afford advantages including high power density, rapid charging and discharging rates, and exceptional cycling stability [
6]. In SCs, electric double-layer capacitance (EDLC) and pseudocapacitance (PC) can be used as energy storage mechanisms. An SC in which both EDLC and PC mechanisms are used simultaneously is called a hybrid supercapacitor (HSC) [
7,
8,
9]. Flexible HSCs can be fabricated by using flexible substrates and flexible electrode materials. Flexible HSCs can be applied in fields such as wearable devices and foldable displays, where they provide greater freedom and flexibility in the manufacturing and integration of electronic devices [
10,
11,
12]. Adding reduced graphene oxide (rGO), a flexible electrode material renowned for its high conductivity and flexibility, can enhance the overall performance of HSCs by providing a porous structure that offers a greater surface area for charge storage [
13,
14,
15,
16,
17]. Carbon cloth, as a flexible substrate, has a highly porous 3D structure formed by the interlaced arrangement of fibers; this facilitates rapid electron and ion transport for HSC devices. This porous structure provides a larger surface area, enabling more efficient charge storage and release. Additionally, the interwoven fiber arrangement enhances the mechanical strength and flexibility, making carbon cloth an ideal substrate material for fabricating flexible HSCs [
18]. Adding lithium ions in the electrolyte can enhance the electrochemical stability and specific capacitance of the HSC, because lithium ions have a higher migration rate and can undergo fast and reversible ion insertion/extraction reactions on the electrode material surface. This enhances the charge storage capacity and cycle life of the HSC [
19]. For flexible HSCs, gel electrolytes offer mechanical flexibility with ion transport capability. Additionally, they can reduce or eliminate the risk of electrolyte leakage. The controllable gel state ensures a stable and confined electrolyte system. These factors make gel electrolytes advantageous in specific applications where reliable ion conductivity and minimal leakage risk are desired [
20,
21,
22].
This study focuses on the ultrafast (<300 s) fabrication of HSCs with rGO-LiMnOx nanocomposite electrodes by using a nitrogen atmospheric-pressure-plasma jet (APPJ). HSCs with three different gel electrolytes, H2SO4, LiCl, and Li2SO4, are evaluated and compared.
2. Experimental
2.1. Preparation of rGO-LiCl-Mn(NO3)2·4H2O pastes
RGO-LiCl-Mn(NO
3)
2·4H
2O pastes were prepared by mixing 0.05 g of rGO (thickness: <5 nm, sheet size: 0.1–5 μm; Golden Innovation Business Co., Ltd.), 0.04 g of LiCl (lithium chloride, anhydrous, 99%, Alfa Aesar), 0.3 g of Mn(NO
3)
2·4H
2O (manganese (II) nitrated tetrahydrate, 98%, Alfa Aesar), 3.245 g of terpineol (anhydrous, #86480, Aldrich), 1.5 g of ethanol, 1.75 g of ethyl cellulose (#46070, Sigma), and 2.25 g of ethyl cellulose (#46080, Sigma) [
23]. The mixture was stirred at 850 rpm for 24 h by using a magnetic stirrer and then condensed using a rotatory evaporator at 55°C for 6 min to obtain the pastes.
2.2. Fabrication of HSCs
RGO-LiCl-Mn(NO
3)
2·4H
2O pastes were screen-printed onto carbon cloth three times, and they finally covered an area of 1.5 cm × 2 cm. After screen-printing, the pastes were dried in an oven at 100°C for 10 min [
24]. Next, the carbon cloth was treated with a nitrogen APPJ for 180 and 300 s. The temperature of the substrate reached approximately 620°C (nitrogen flow rate = 46 slm) during the APPJ process [
4]. The APPJ treatment process burned out the ethyl cellulose and modified the materials in the selected area [
25]. After APPJ processing, rGO-LiMnO
x nanocomposites were formed on the carbon cloth. Three types of gel electrolytes were used in the HSCs: H
2SO
4, LiCl, and Li
2SO
4. For H
2SO
4 gel electrolyte, 1.5 g of polyvinyl alcohol (PVA; 99+% hydrolyzed, Aldrich) and 15 ml of 1 M H
2SO
4 were mixed using a magnetic stirrer at a rotation speed of 200 rpm in a water bath at 80°C until the solution became clear without any sediment. Then, the mixture was stirred at room temperature at 850 rpm for 1 h. Similarly, to prepare LiCl gel electrolyte, 1.5 g of PVA and 15 ml of 1 M LiCl were mixed at 90°C until the solution became clear, and then, it was stirred at room temperature for 1 h [
26]. For Li
2SO
4 gel electrolyte, two solutions were prepared: 1.5 g of PVA and 10 ml of DI water were mixed at 90°C until the solution became clear, and 3 g of BMIMCl (1-butyl-3-methylimidazolium chloride, 98%, Sigma), 1.65 g of Li
2SO
4 (lithium sulfate, anhydrous, 99%, Alfa Aesar), and 5 ml of DI water were mixed at 90°C until the solution became clear. The two solutions were mixed at 90°C and then freeze-dried for 24 h [
27].
For HCs with H
2SO
4 and LiCl gel electrolytes, 0.5 ml of the gel electrolyte was spread on rGO-LiMnO
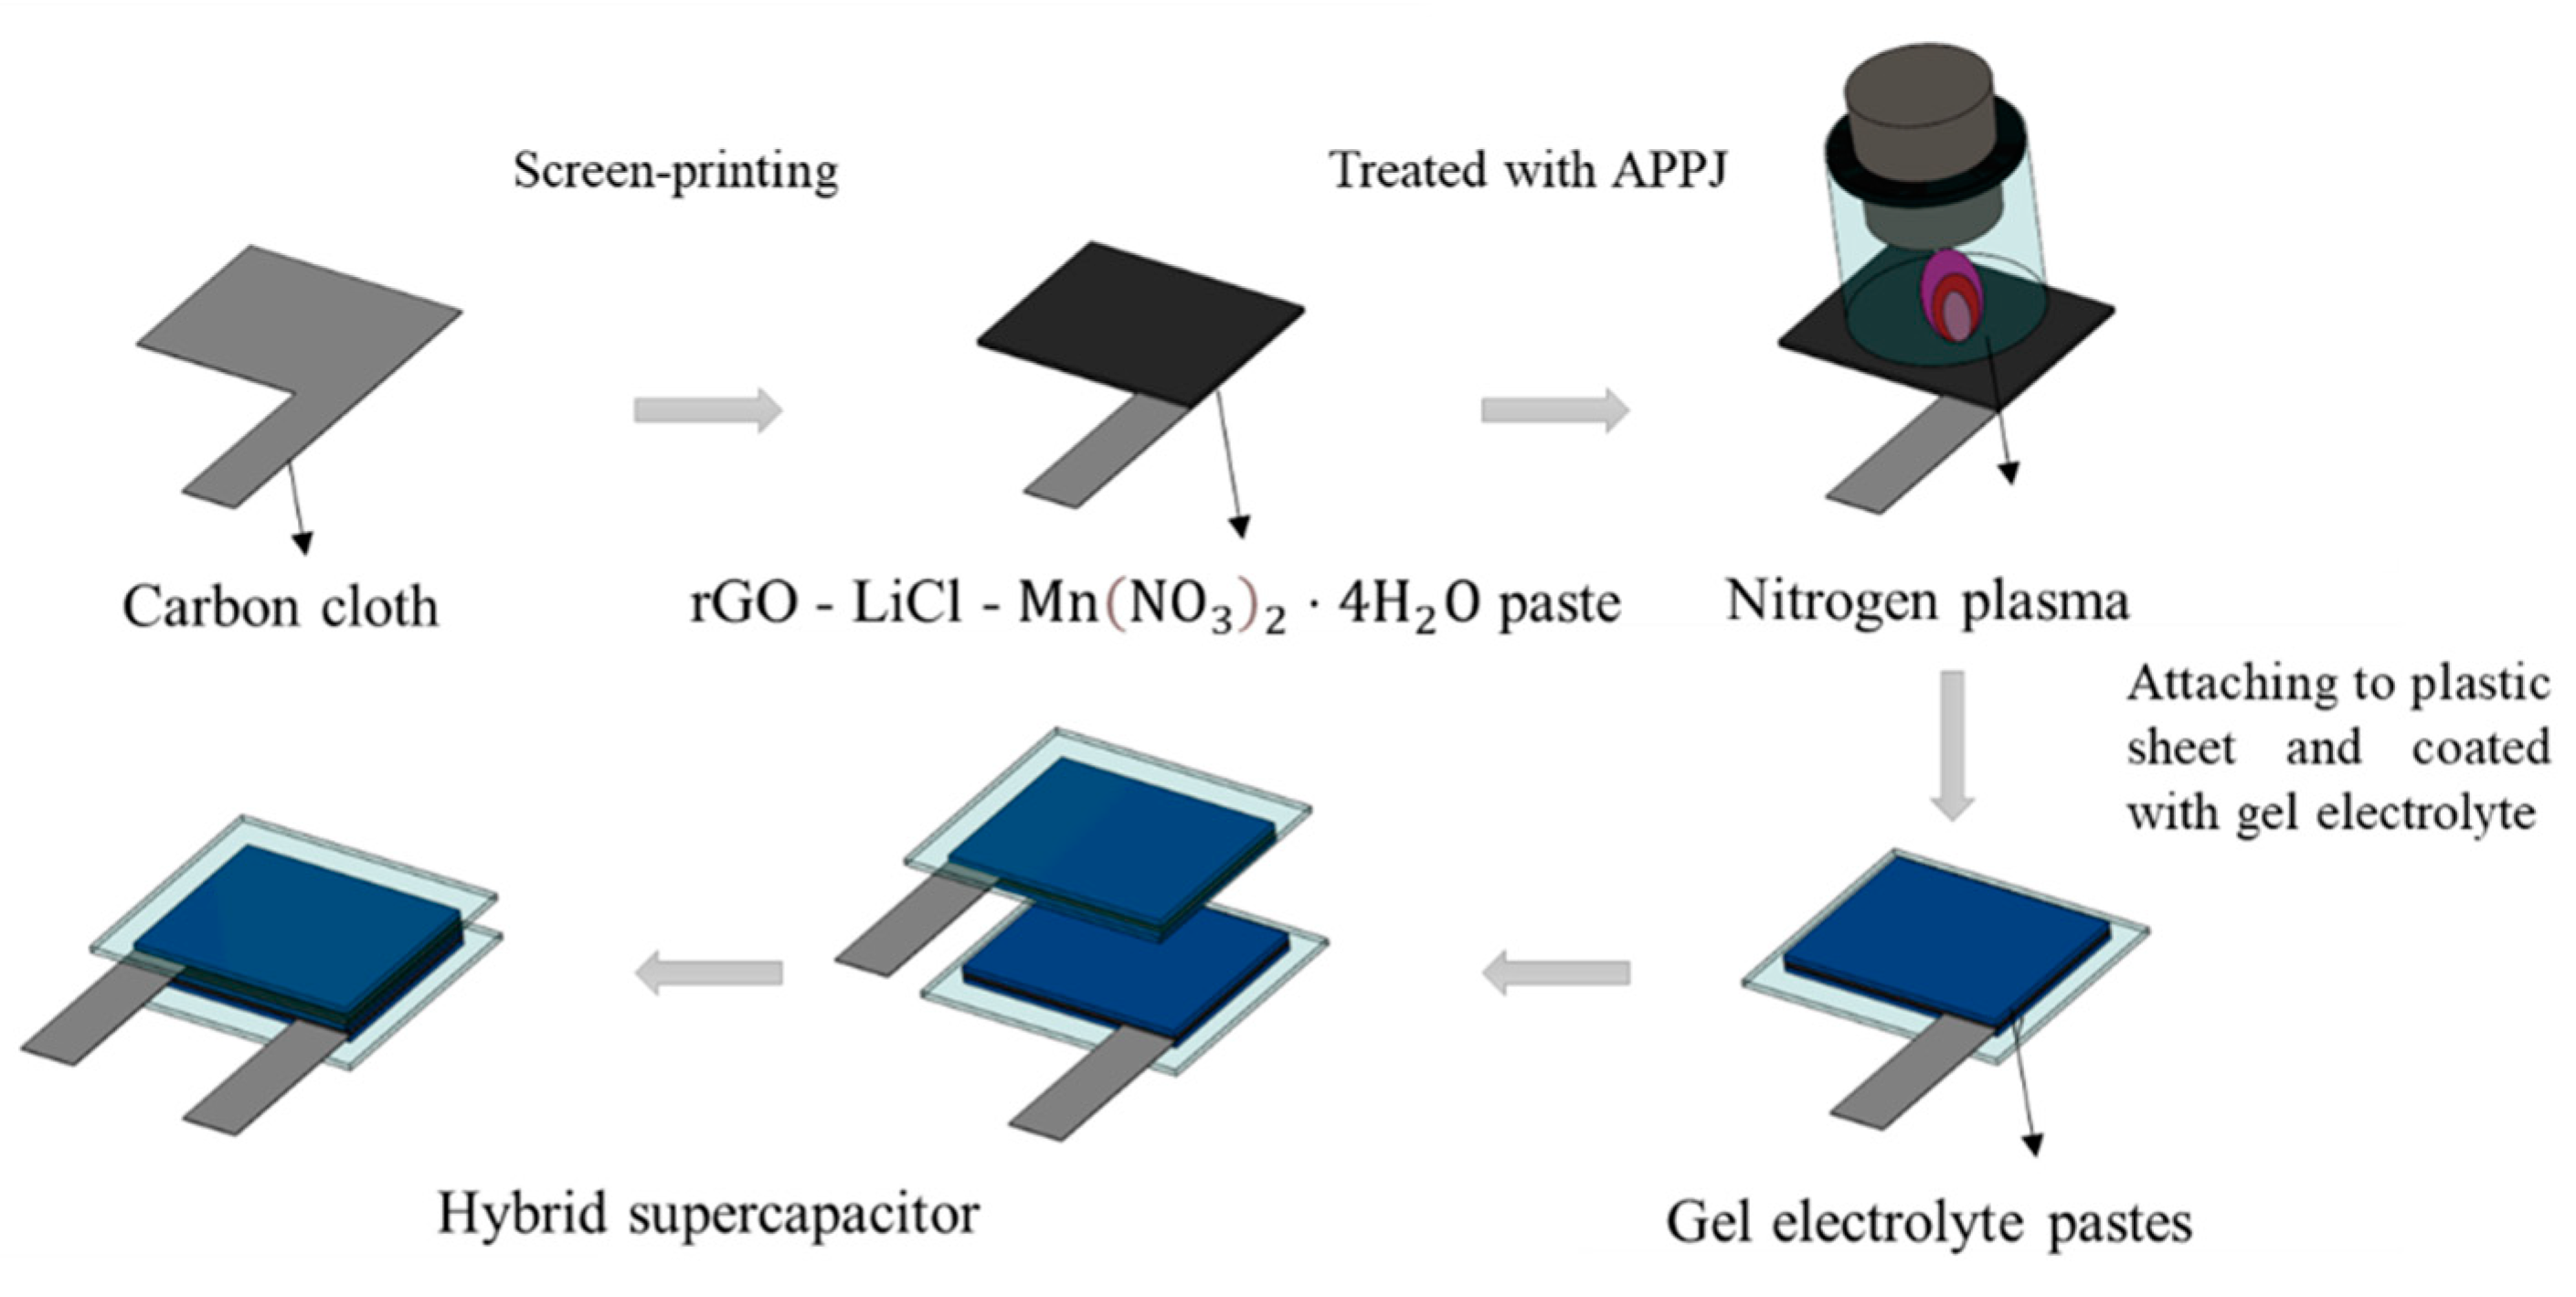
x carbon cloth electrode and left to dry at room temperature for 24 h. This process was repeated three times. Finally, two electrodes coated with the gel electrolyte were placed together with the gel sides facing each other to create a sandwich-type HSC. The fabrication process of the gel electrolyte HSCs is shown in
Figure 1. For Li
2SO
4 gel electrolyte HSCs, Li
2SO
4 gel electrolyte was deposited on a rGO-LiMnO
x carbon cloth electrode before freezing it for 24 h. Next, another layer of mixed solution was dropped and covered with the frozen solution. Finally, two pieces of samples were combined and frozen again for another 24 h.
2.3. Characterization of rGO-LiMnOx and HSCs
After APPJ treatment, the electrode material transformed into rGO-LiMnOx. The structure of rGO-LiMnOx was analyzed using scanning electron microscopy (SEM, JSM-7800F Prime, JEOL). The water contact angle of rGO-LiMnOx on carbon cloth was measured using a goniometer (Model 100SB, Sindetake). X-ray photoelectron spectroscopy (XPS, Sigma Probe, Thermo VG Scientific) analysis was conducted using an Al-Kα source (1486.6 eV) to investigate the surface chemical bonding state.
Cyclic voltammetry (CV; potential window: 0−0.8 V, potential scan speed: 2−200 mV s-1), galvanostatic charging/discharging (GCD; potential window: 0−0.8 V, constant current: 4, 2, 1, 0.5, and 0.25 mA), and electrochemical impedance spectroscopy (EIS; 0.1–100,000 Hz) experiments were performed for HSCs with H2SO4, LiCl, and Li2SO4 gel electrolytes by using an electrochemical workstation (PGSTAT204, Metrohm Autolab).
3. Results and discussion
3.1. SEM inspection
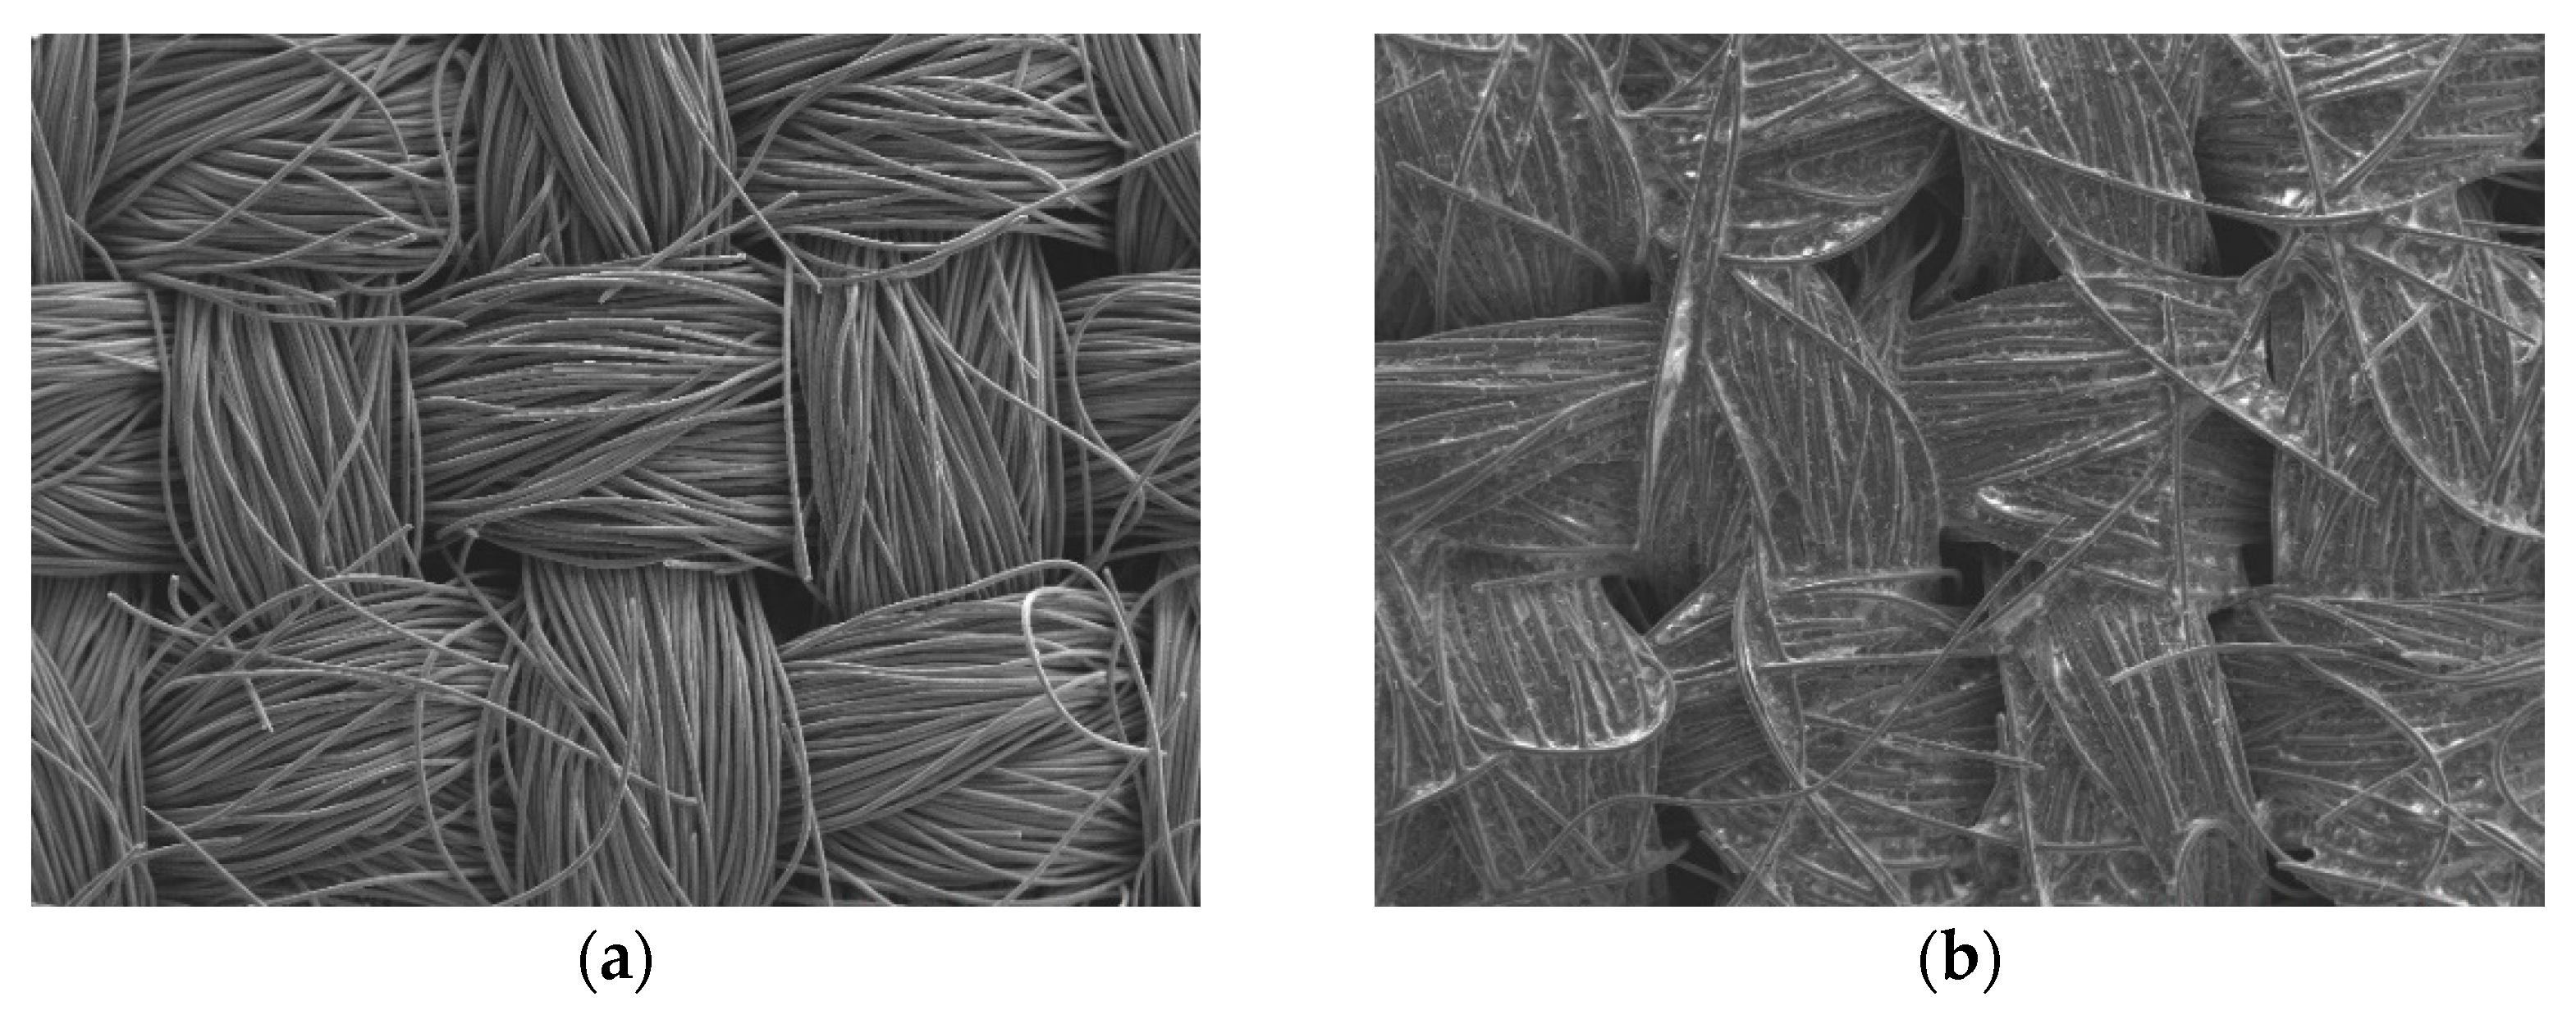
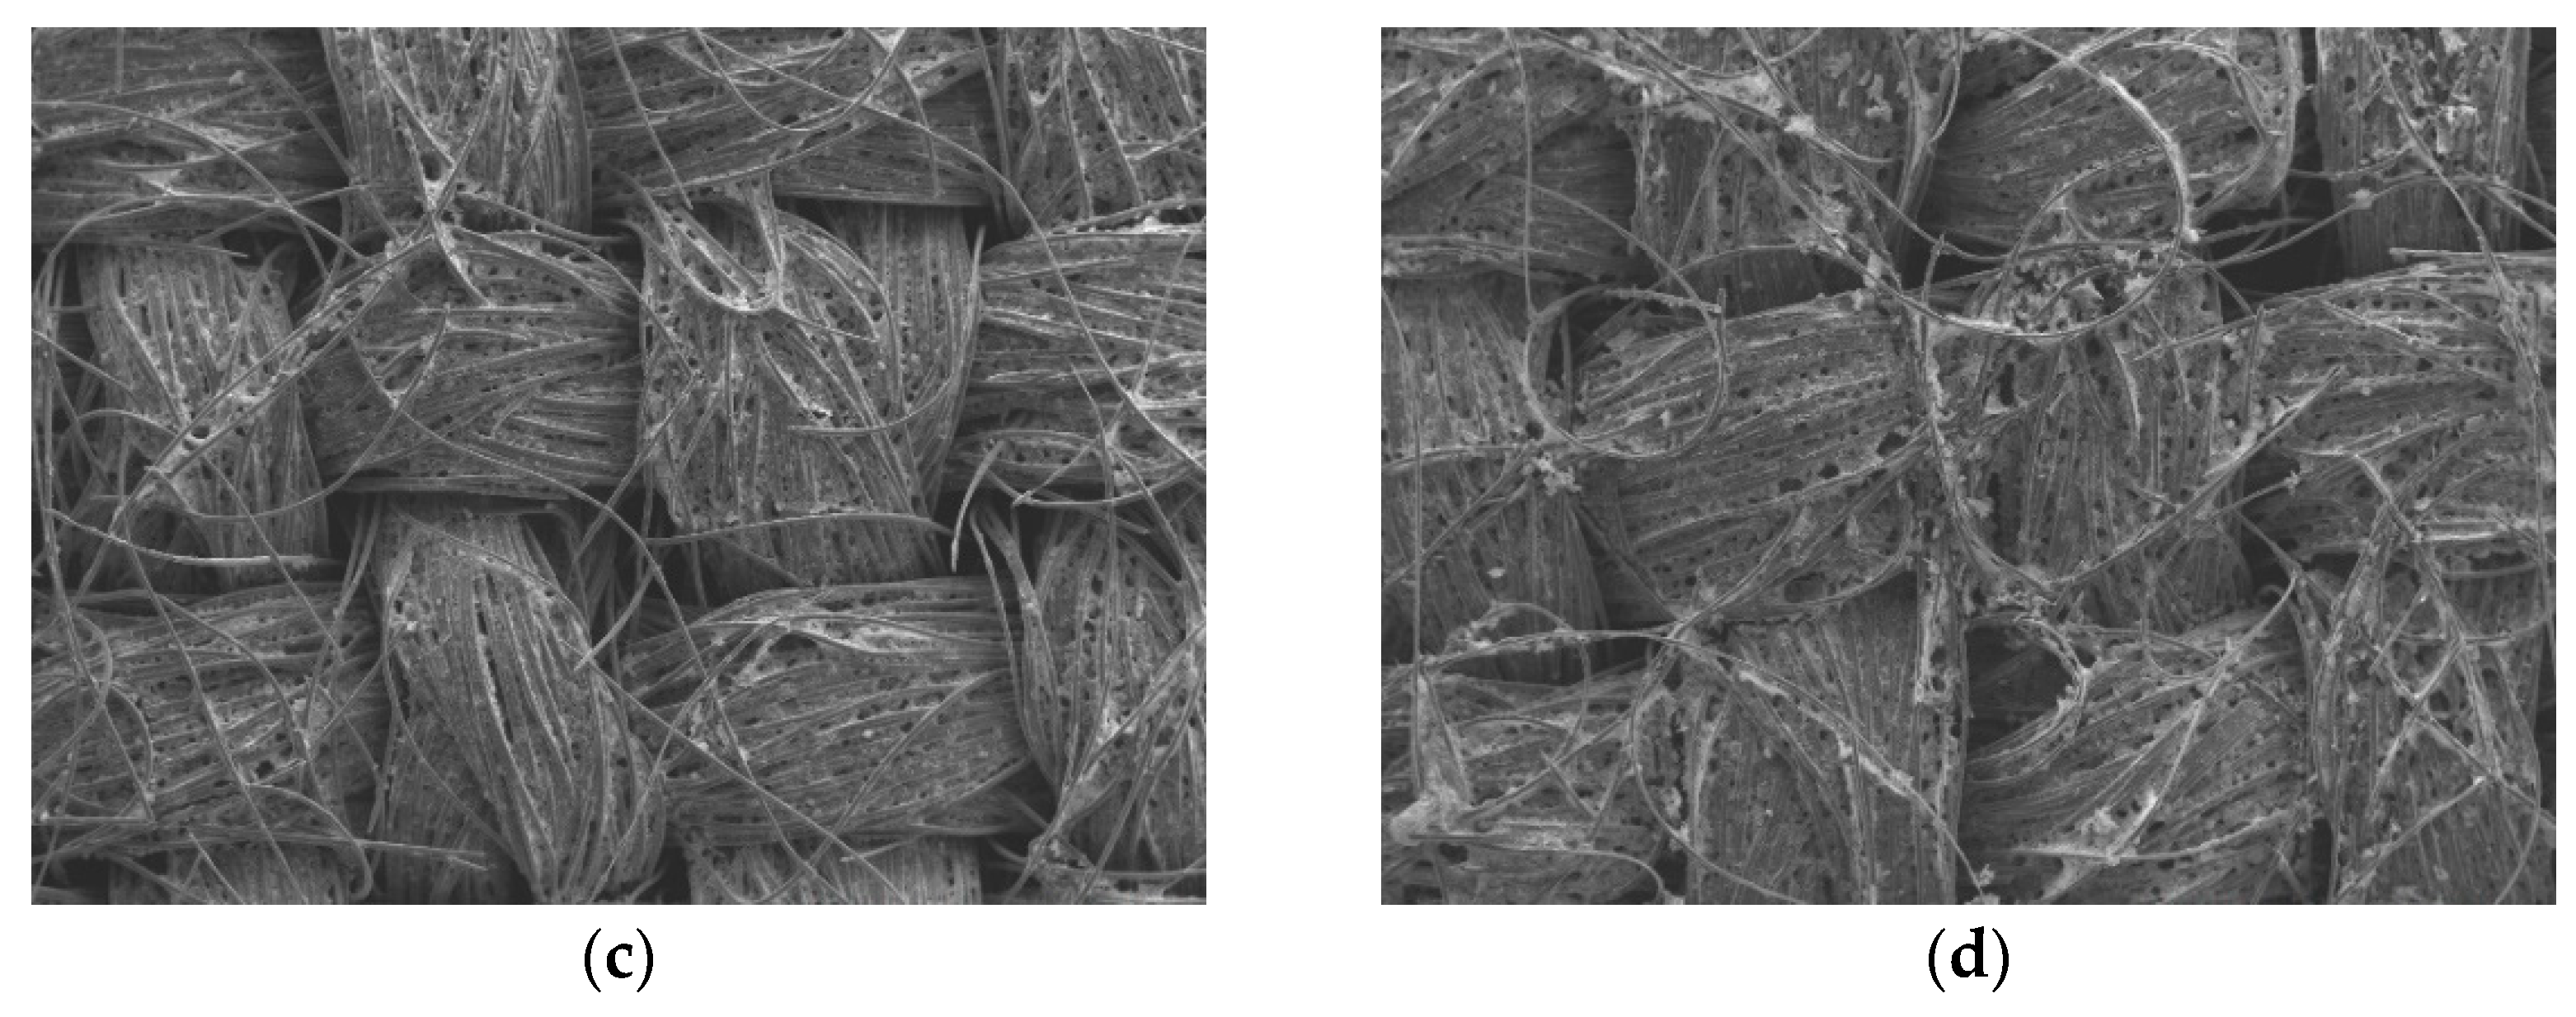
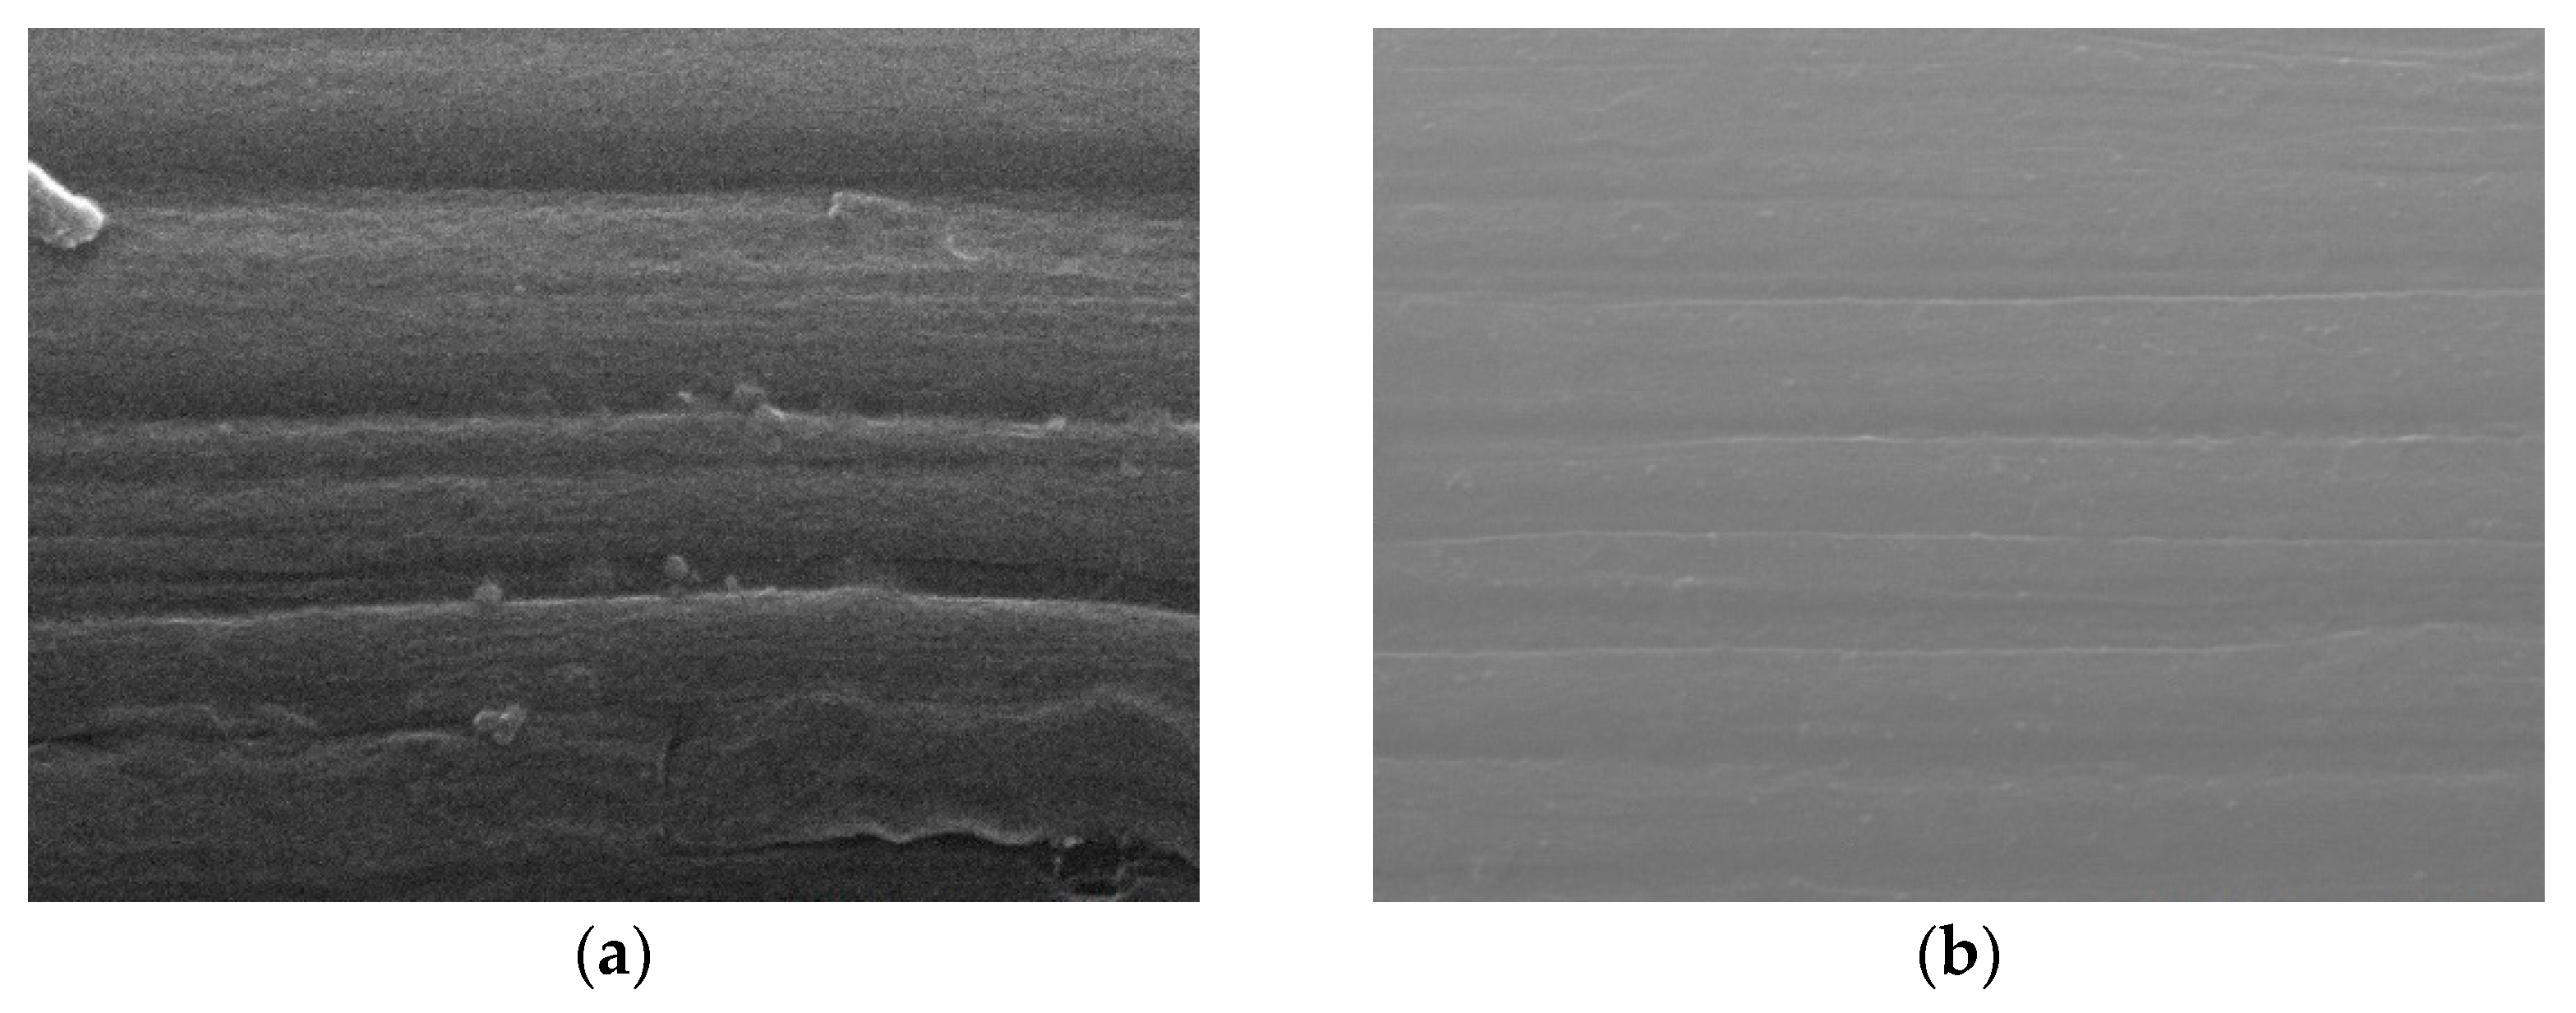
Figure 2 shows SEM images (magnification: 80×) of the bare carbon cloth, untreated pastes, and APPJ-treated pastes. After screen-printing the pastes, the space between the carbon fibers was filled with the pastes. The SEM images in
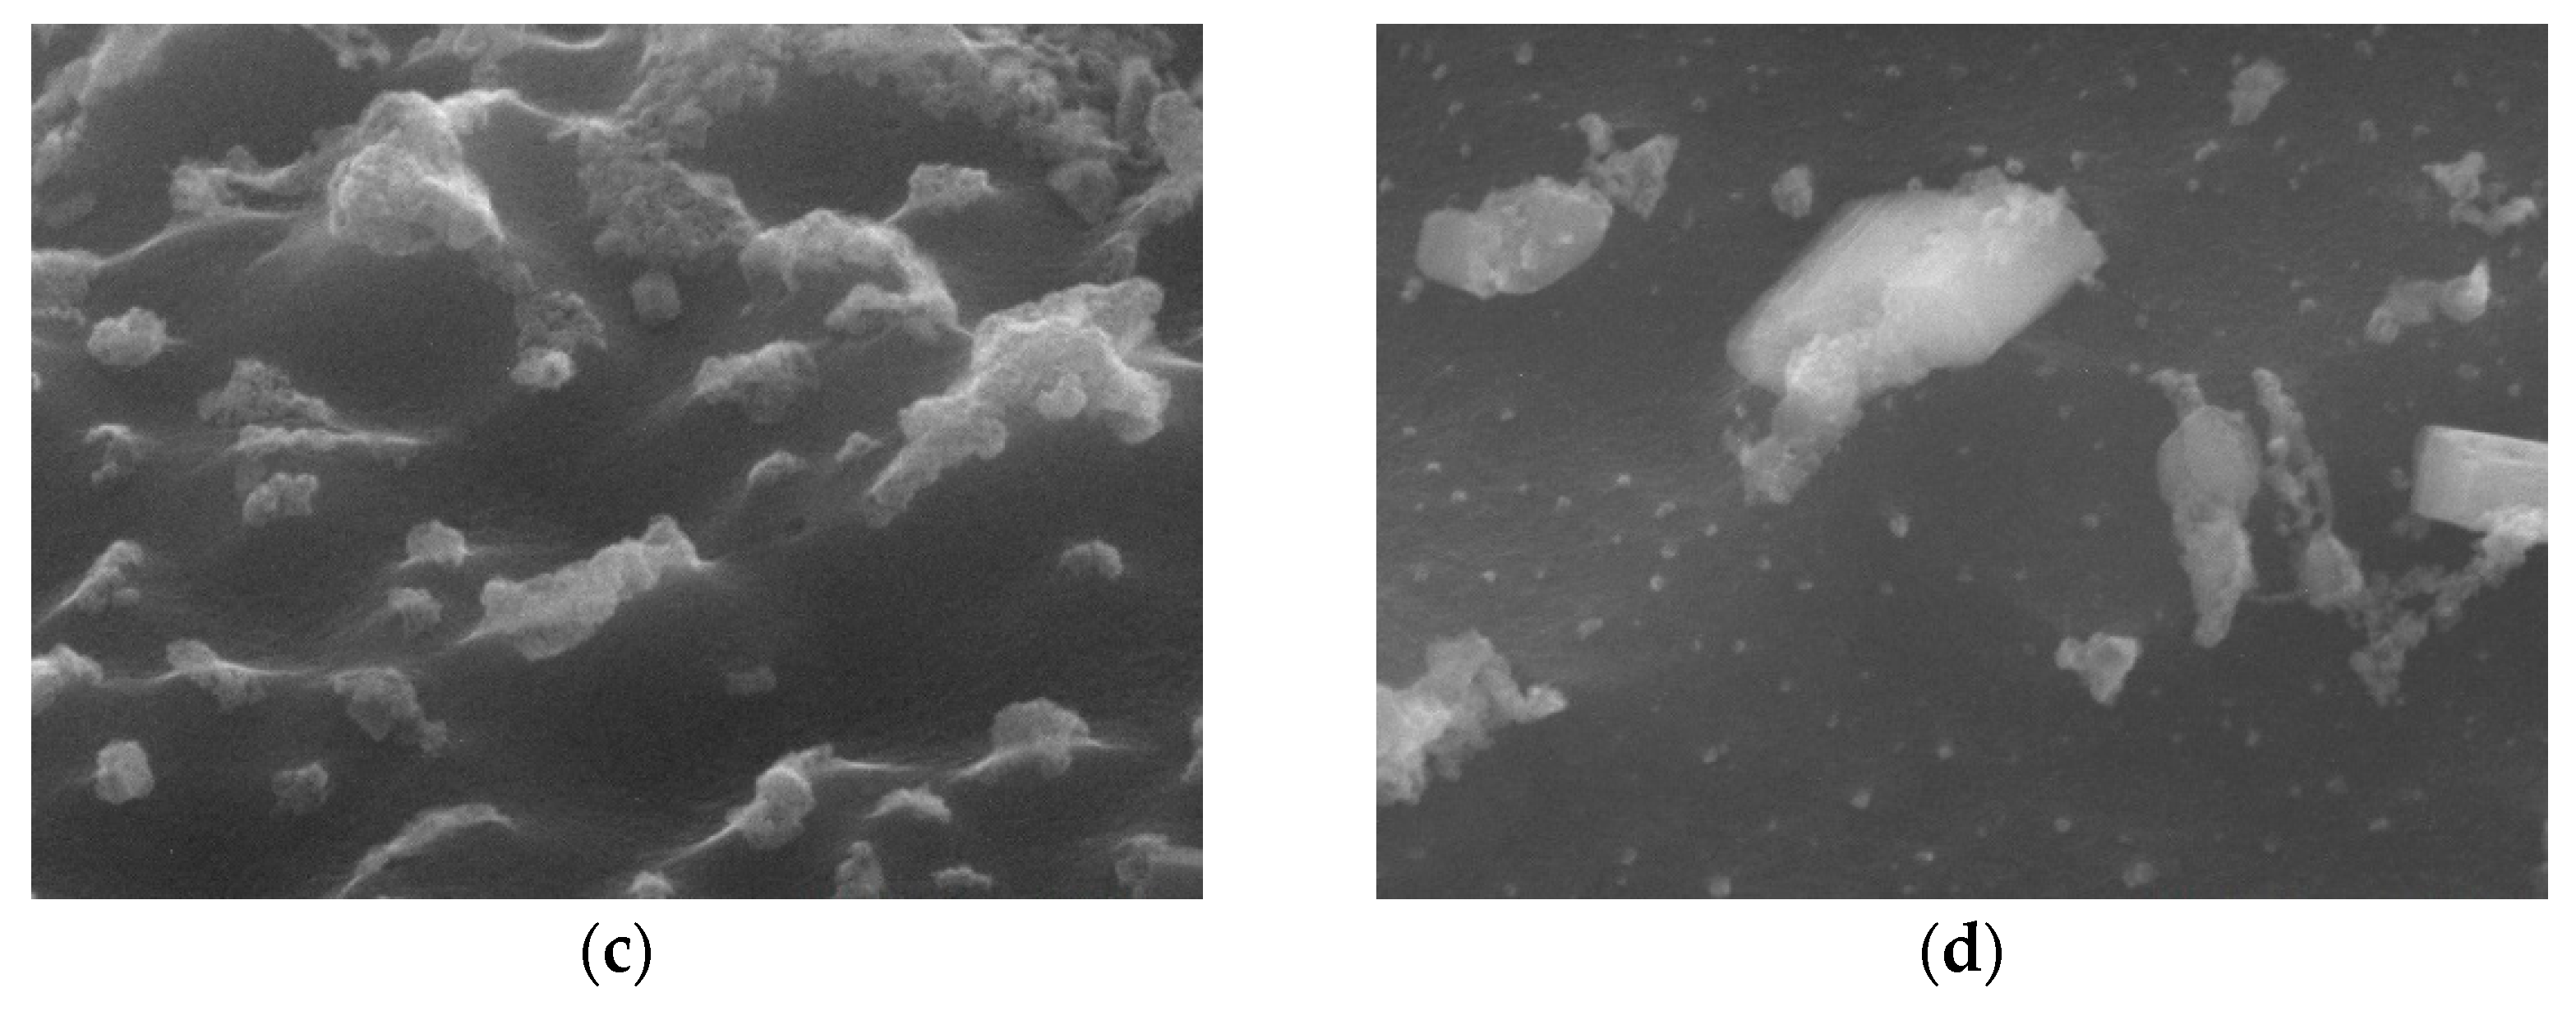
Figure 3 (magnification: 5000×) show that after APPJ treatment, most of the ethyl cellulose was burned off, and the pastes were converted into rGO-LiMnO
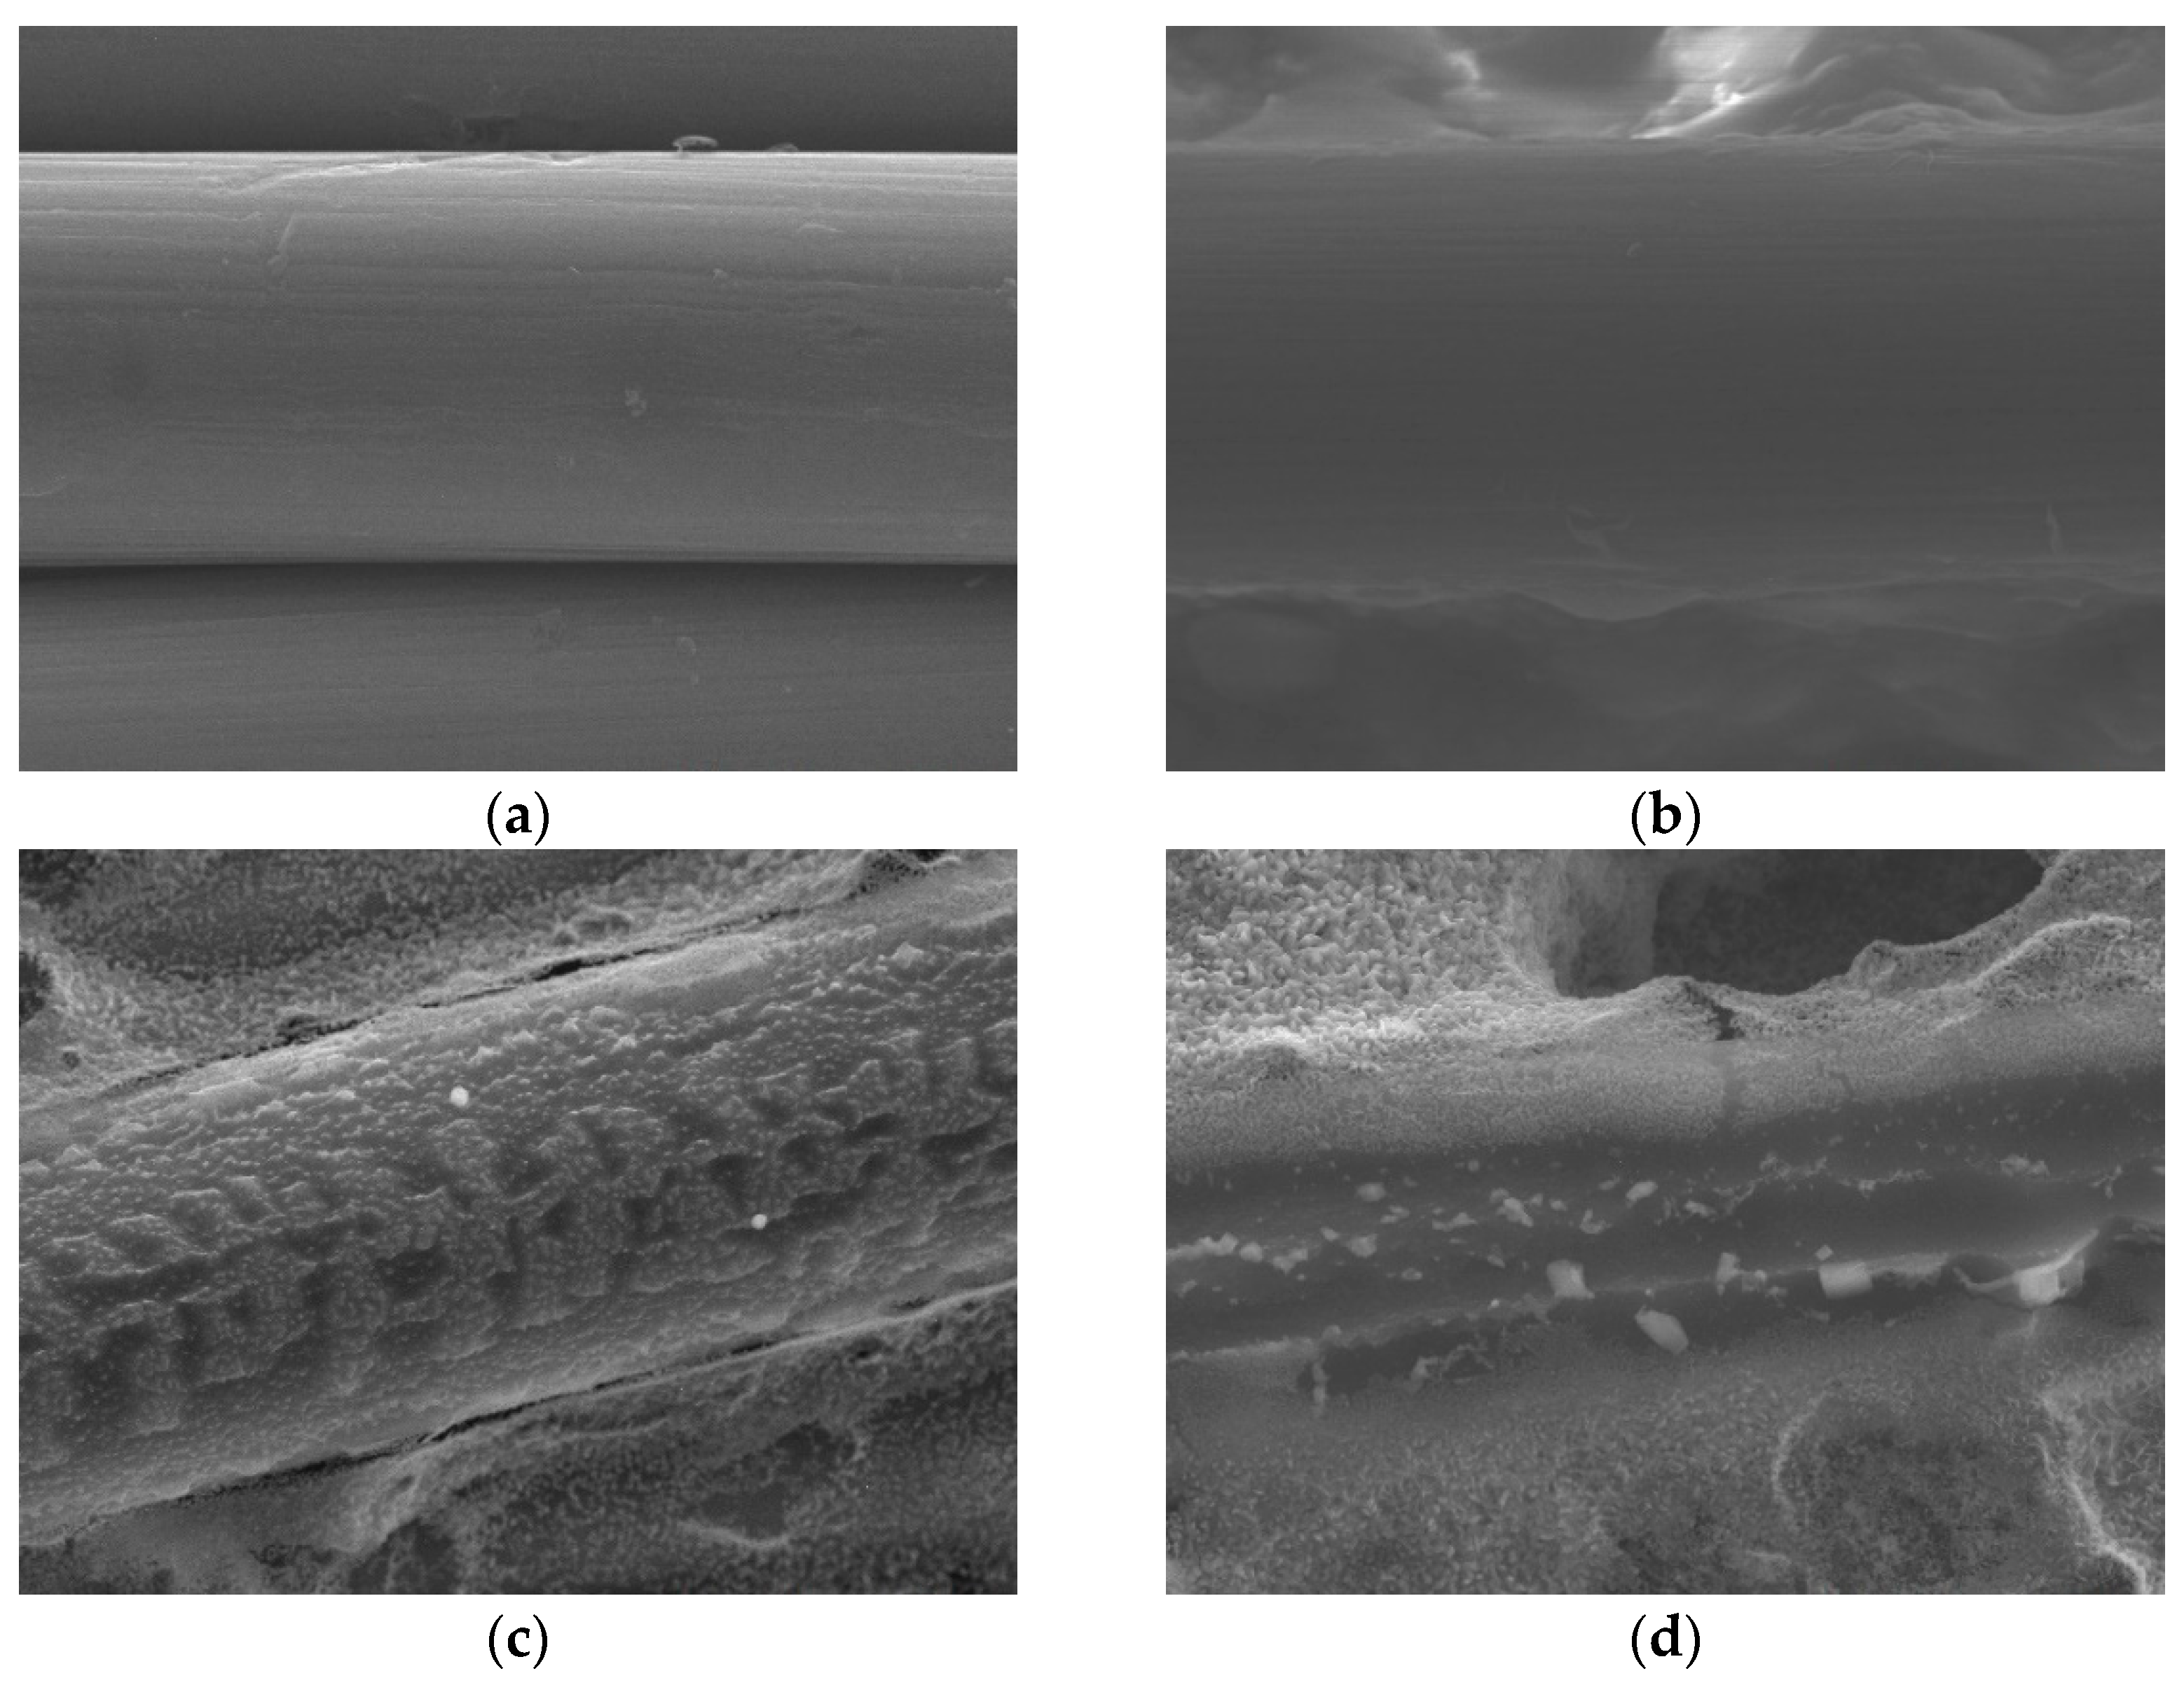
x. The SEM images in
Figure 4. (magnification: 50000×) show that surface particles tend to aggregate after APPJ processing.
3.2. Water contact angles of rGO-LiMnOx
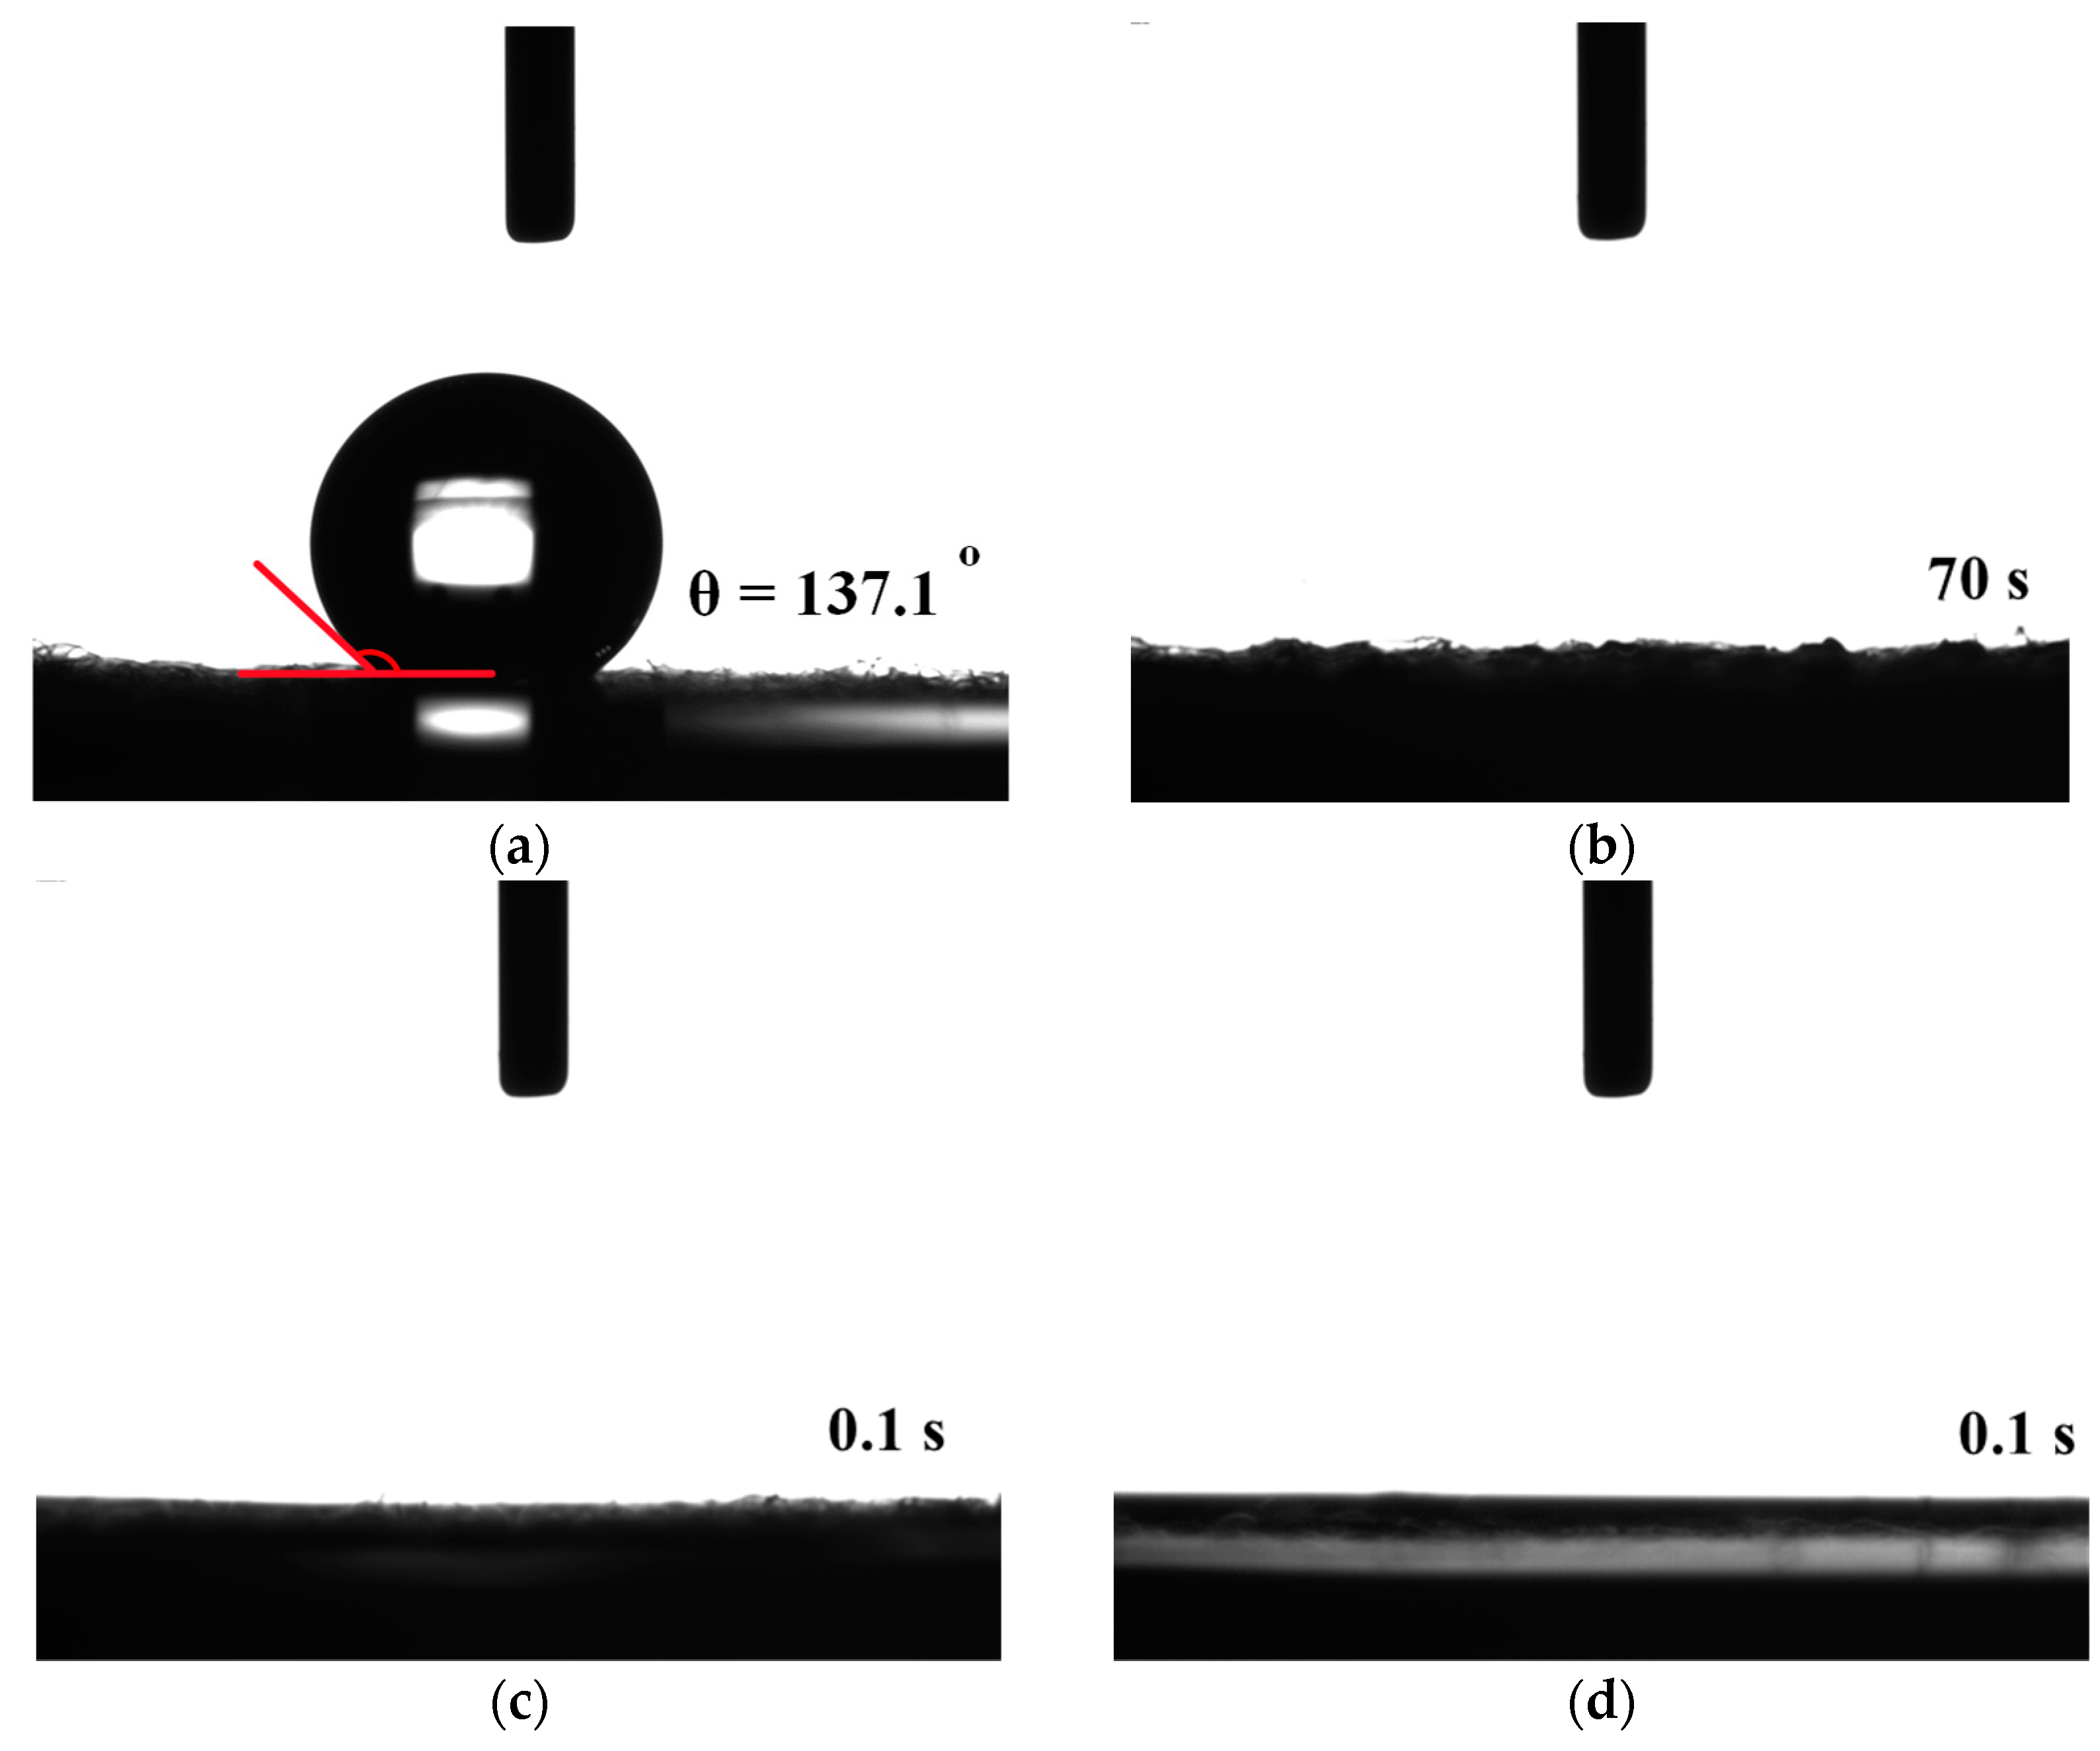
Figure 5 shows the water contact angle results for the screen-printed pastes and rGO-LiMnO
x after APPJ treatment. The pristine carbon cloth exhibits a high water contact angle of 137.1°, indicating that it is hydrophobic. A previous study suggested that pure rGO exhibits hydrophobic characteristics [
28]. In contrast, the as-deposited and APPJ-treated samples exhibited hydrophilic behavior, with water droplets completely penetrating the substrates during testing [
29,
30]. The difference in hydrophilicity can be discerned by observing the droplet penetration time. For as-deposited pastes on carbon cloth, the droplet takes approximately 70 s to penetrate the substrate; for APPJ-treated samples, the droplet immediately penetrates the substrate. These results indicate that the precursors of lithium manganese oxides are hydrophilic. The reactive plasma species generated by the APPJ can penetrate the porous structure of the carbon cloth, leading to more thorough surface modification. This, in turn, results in long-lasting hydrophilicity of the carbon cloth [
31].
3.3. XPS results of rGO-LiMnOx
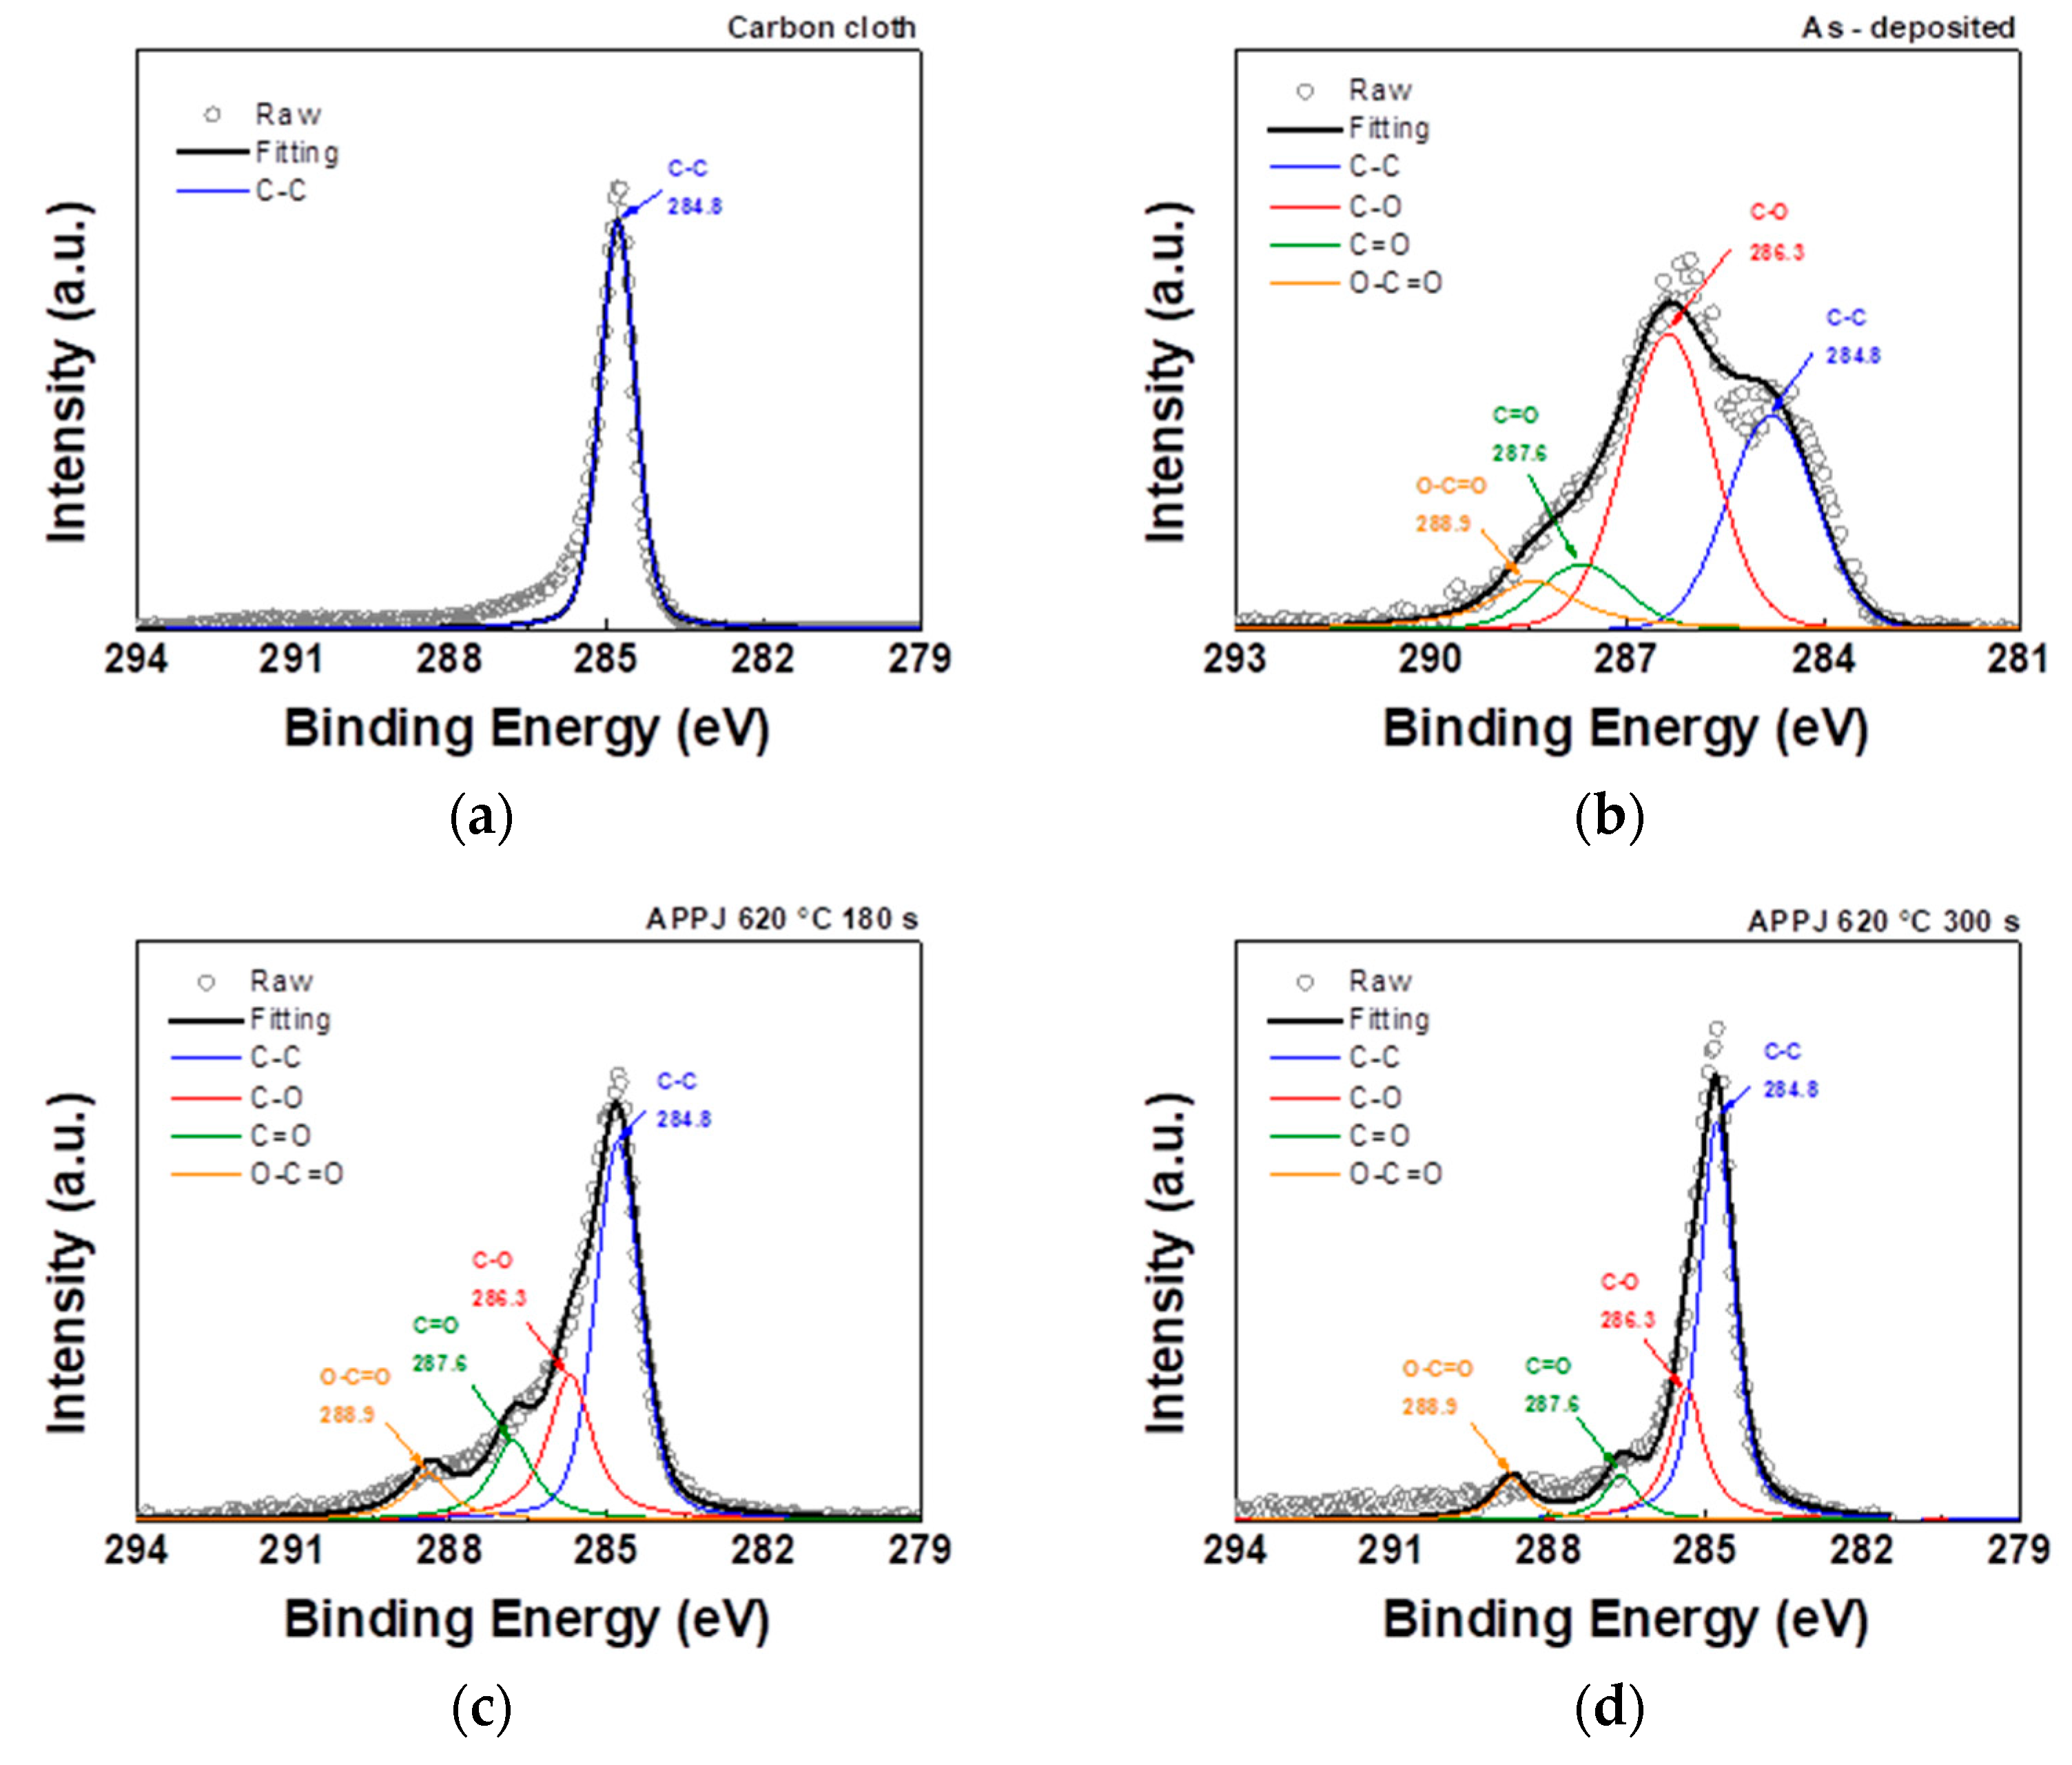
The C1s spectrum can be resolved into four peaks representing different chemical bonds: C–C, C–O, C=O, and O–C=O at binding energies of 284.8, 286.3, 287.6, and 288.9 eV, respectively [
32,
33]. The analysis of the C1s peak in
Figure 6 and
Table 1 showed that in addition to the C-C bond of the carbon cloth, the deposited carbon cloth shows peaks related to the C-O, C=O, and O-C=O bonds. Furthermore, after nitrogen APPJ treatment, the oxygen content decreased, especially in the form of the C–O bond, and the main peak reverted to the C–C bond, indicating the presence of ethyl cellulose and the oxidation and evaporation caused by the APPJ treatment [
34].
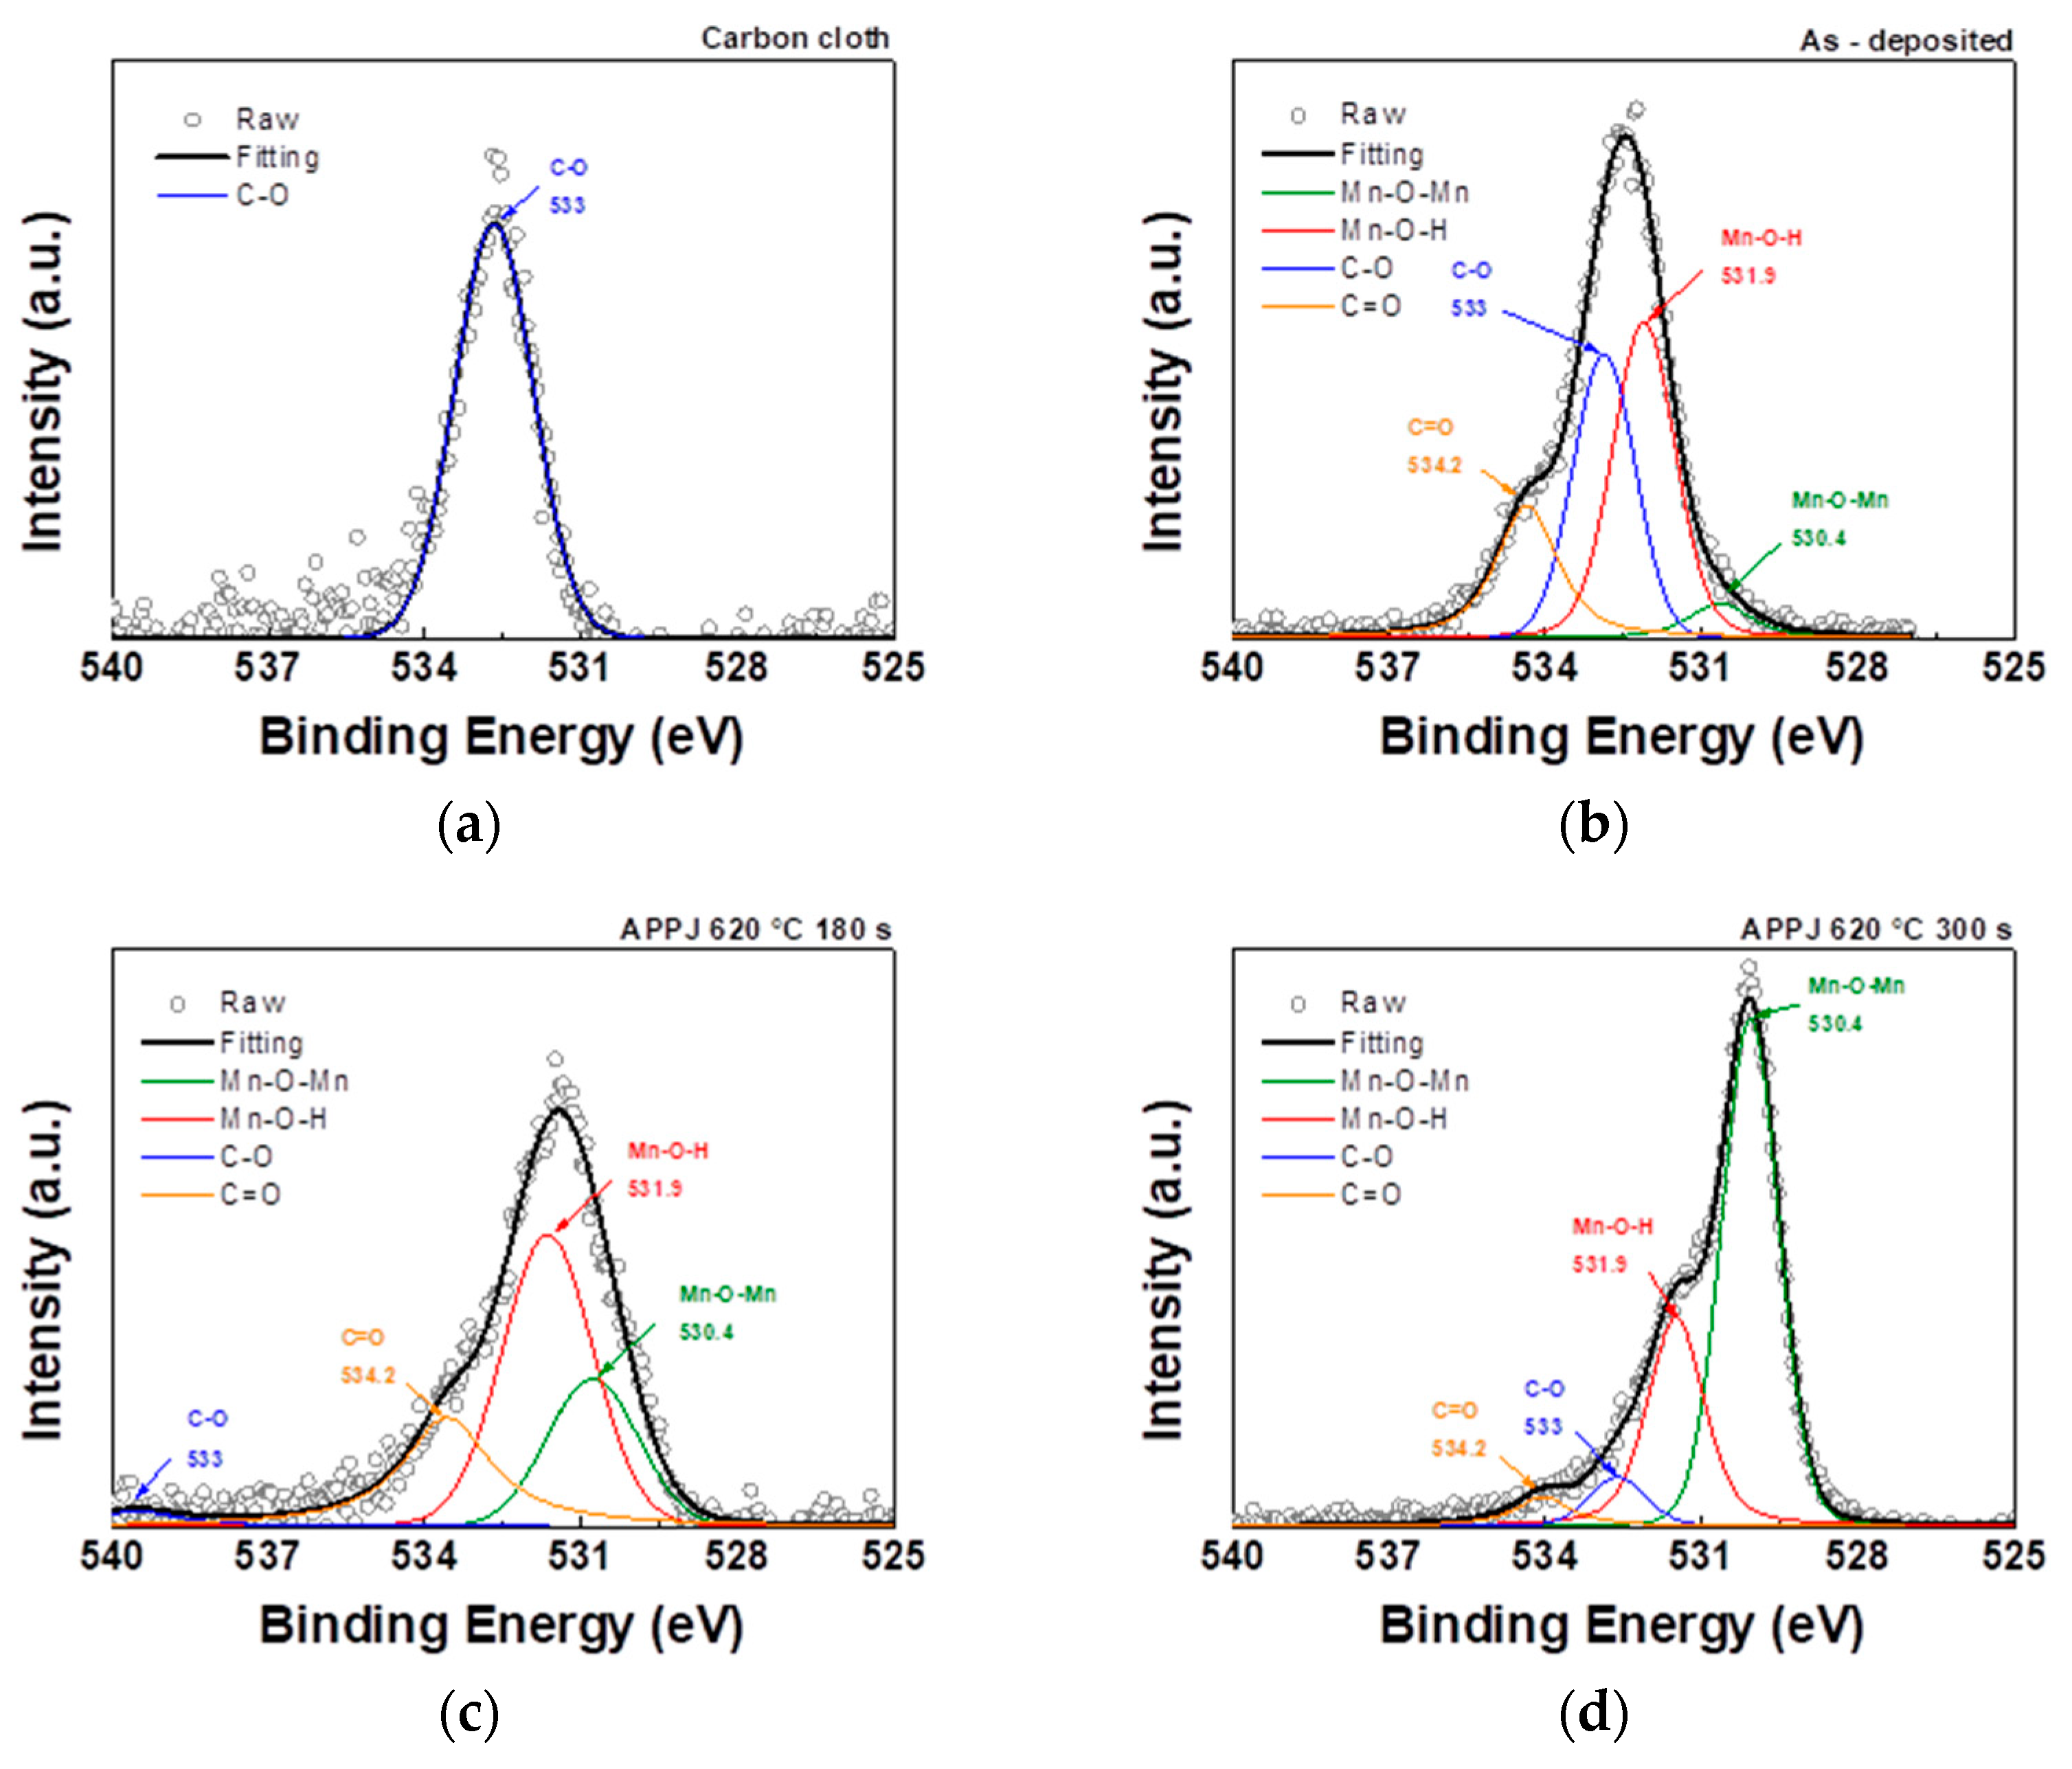
The O1s spectrum can be resolved into four peaks representing different chemical bonds: Mn-O-Mn, Mn-O-H, C–O, and C=O at binding energies of 530.4, 531.9, 533, and 534.2 eV, respectively [
35]. At elevated temperature, structural water is released, and the deposited manganese oxide is dehydrated. As shown in
Figure 7 and
Table 2, as the APPJ treatment temperature increased to 620°C, the presence of Mn-O-H bonds decreased. This results in a significant reduction in the hydroxide composition, with anhydrous Mn-O-Mn becoming the dominant oxide species [
36].
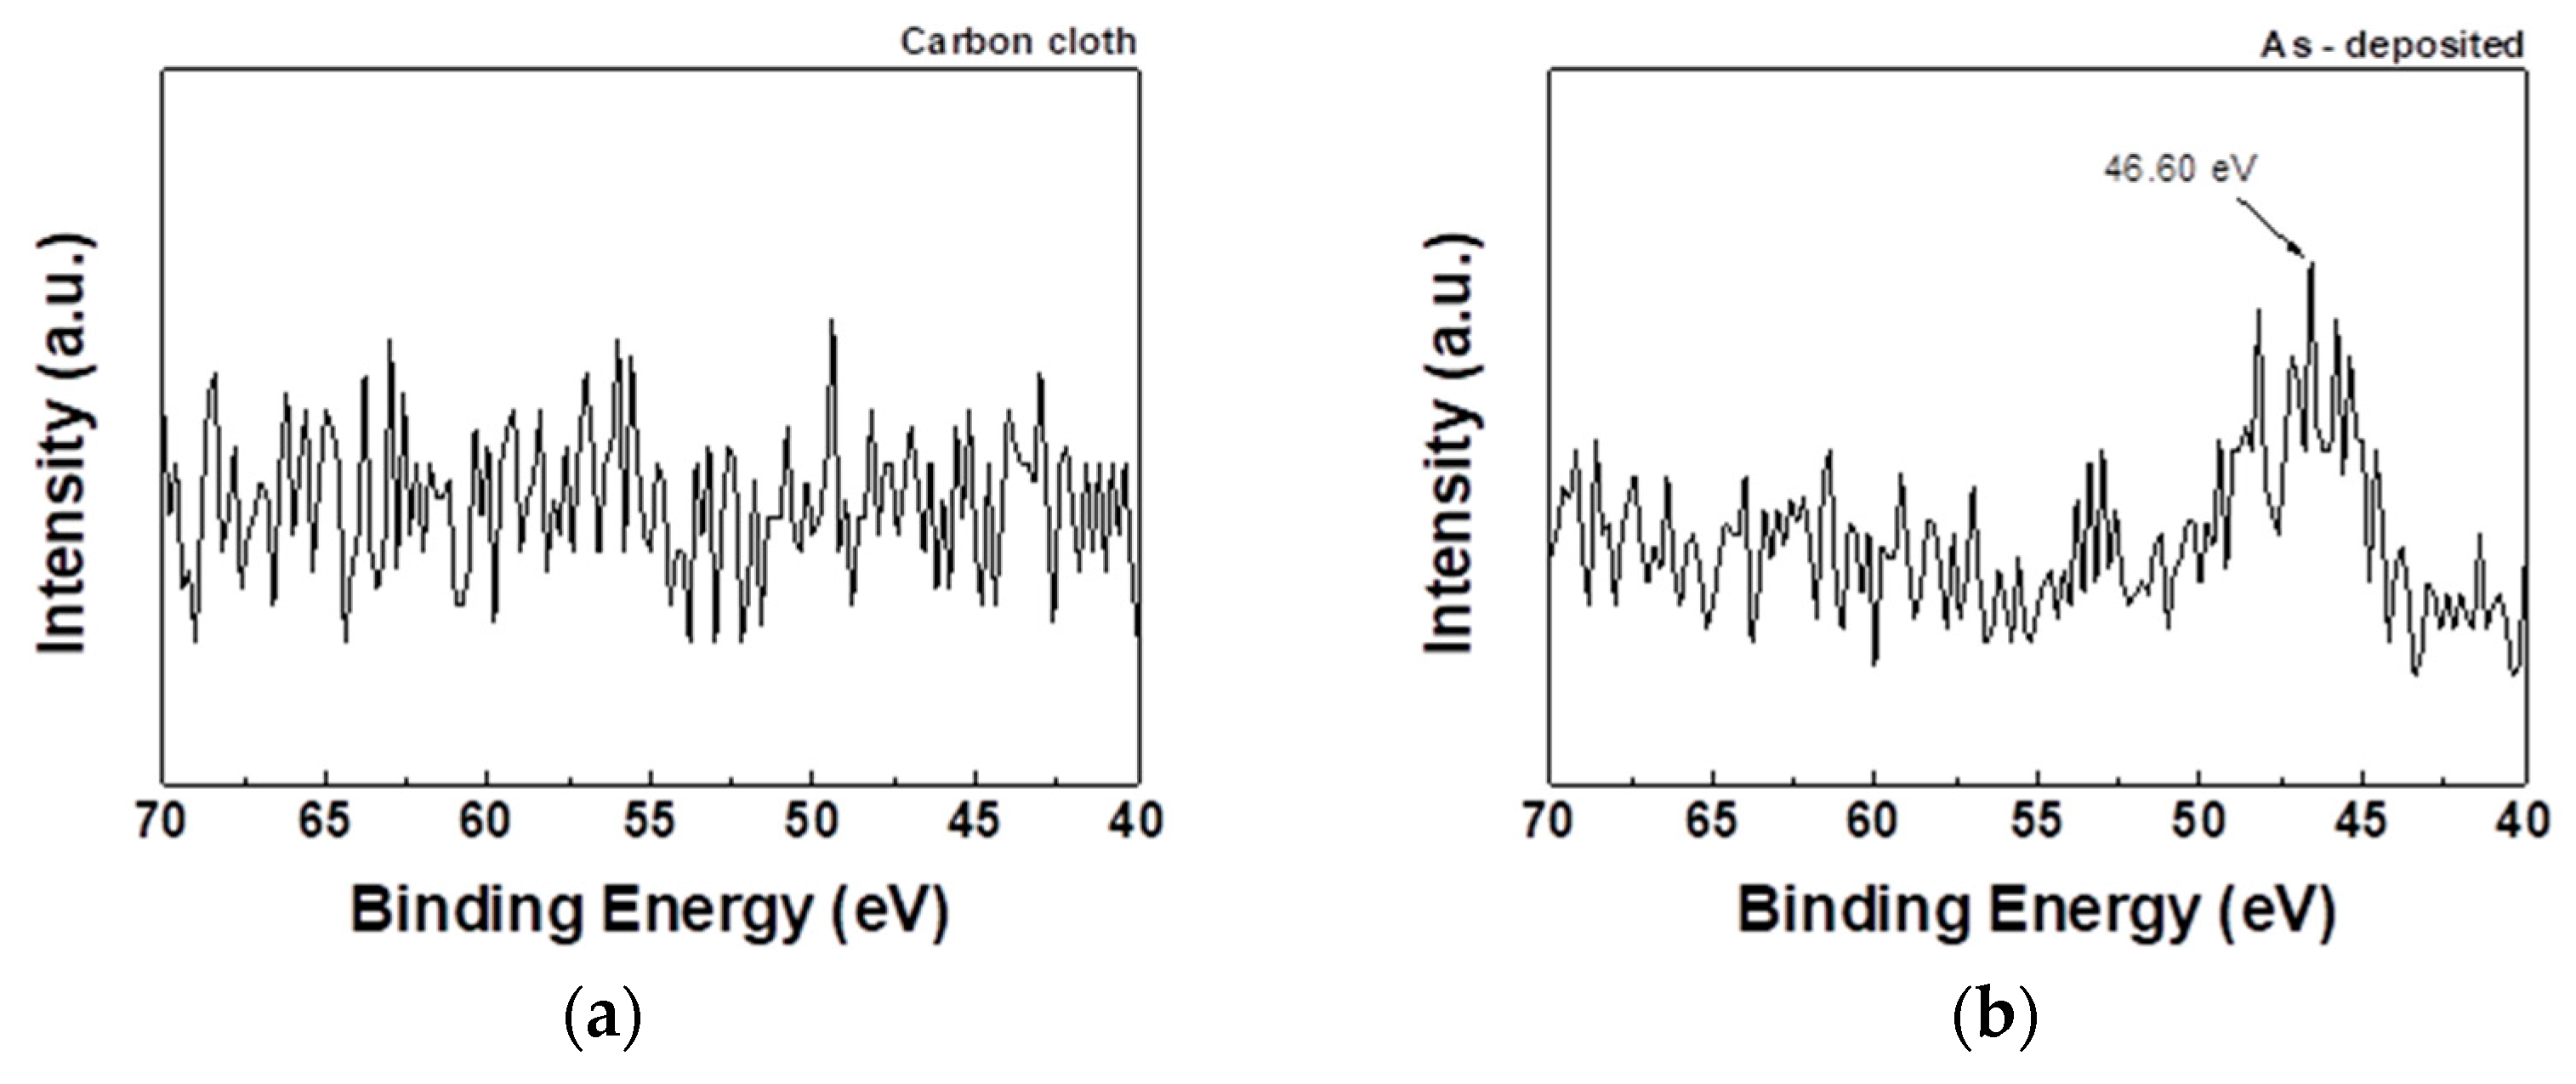
Figure 8 shows that the paste exhibits obvious Li1s peaks before and after APPJ treatment. After APPJ treatment, the increased binding energy, which is better at a treatment time of 300 s than at that of 180 s, indicates the stronger interaction between Li atoms and the HSC electrode material. This enhanced interaction enables more efficient charge adsorption and storage in the material, thereby increasing the energy density and charge storage capacitance of the HSC.
As shown in
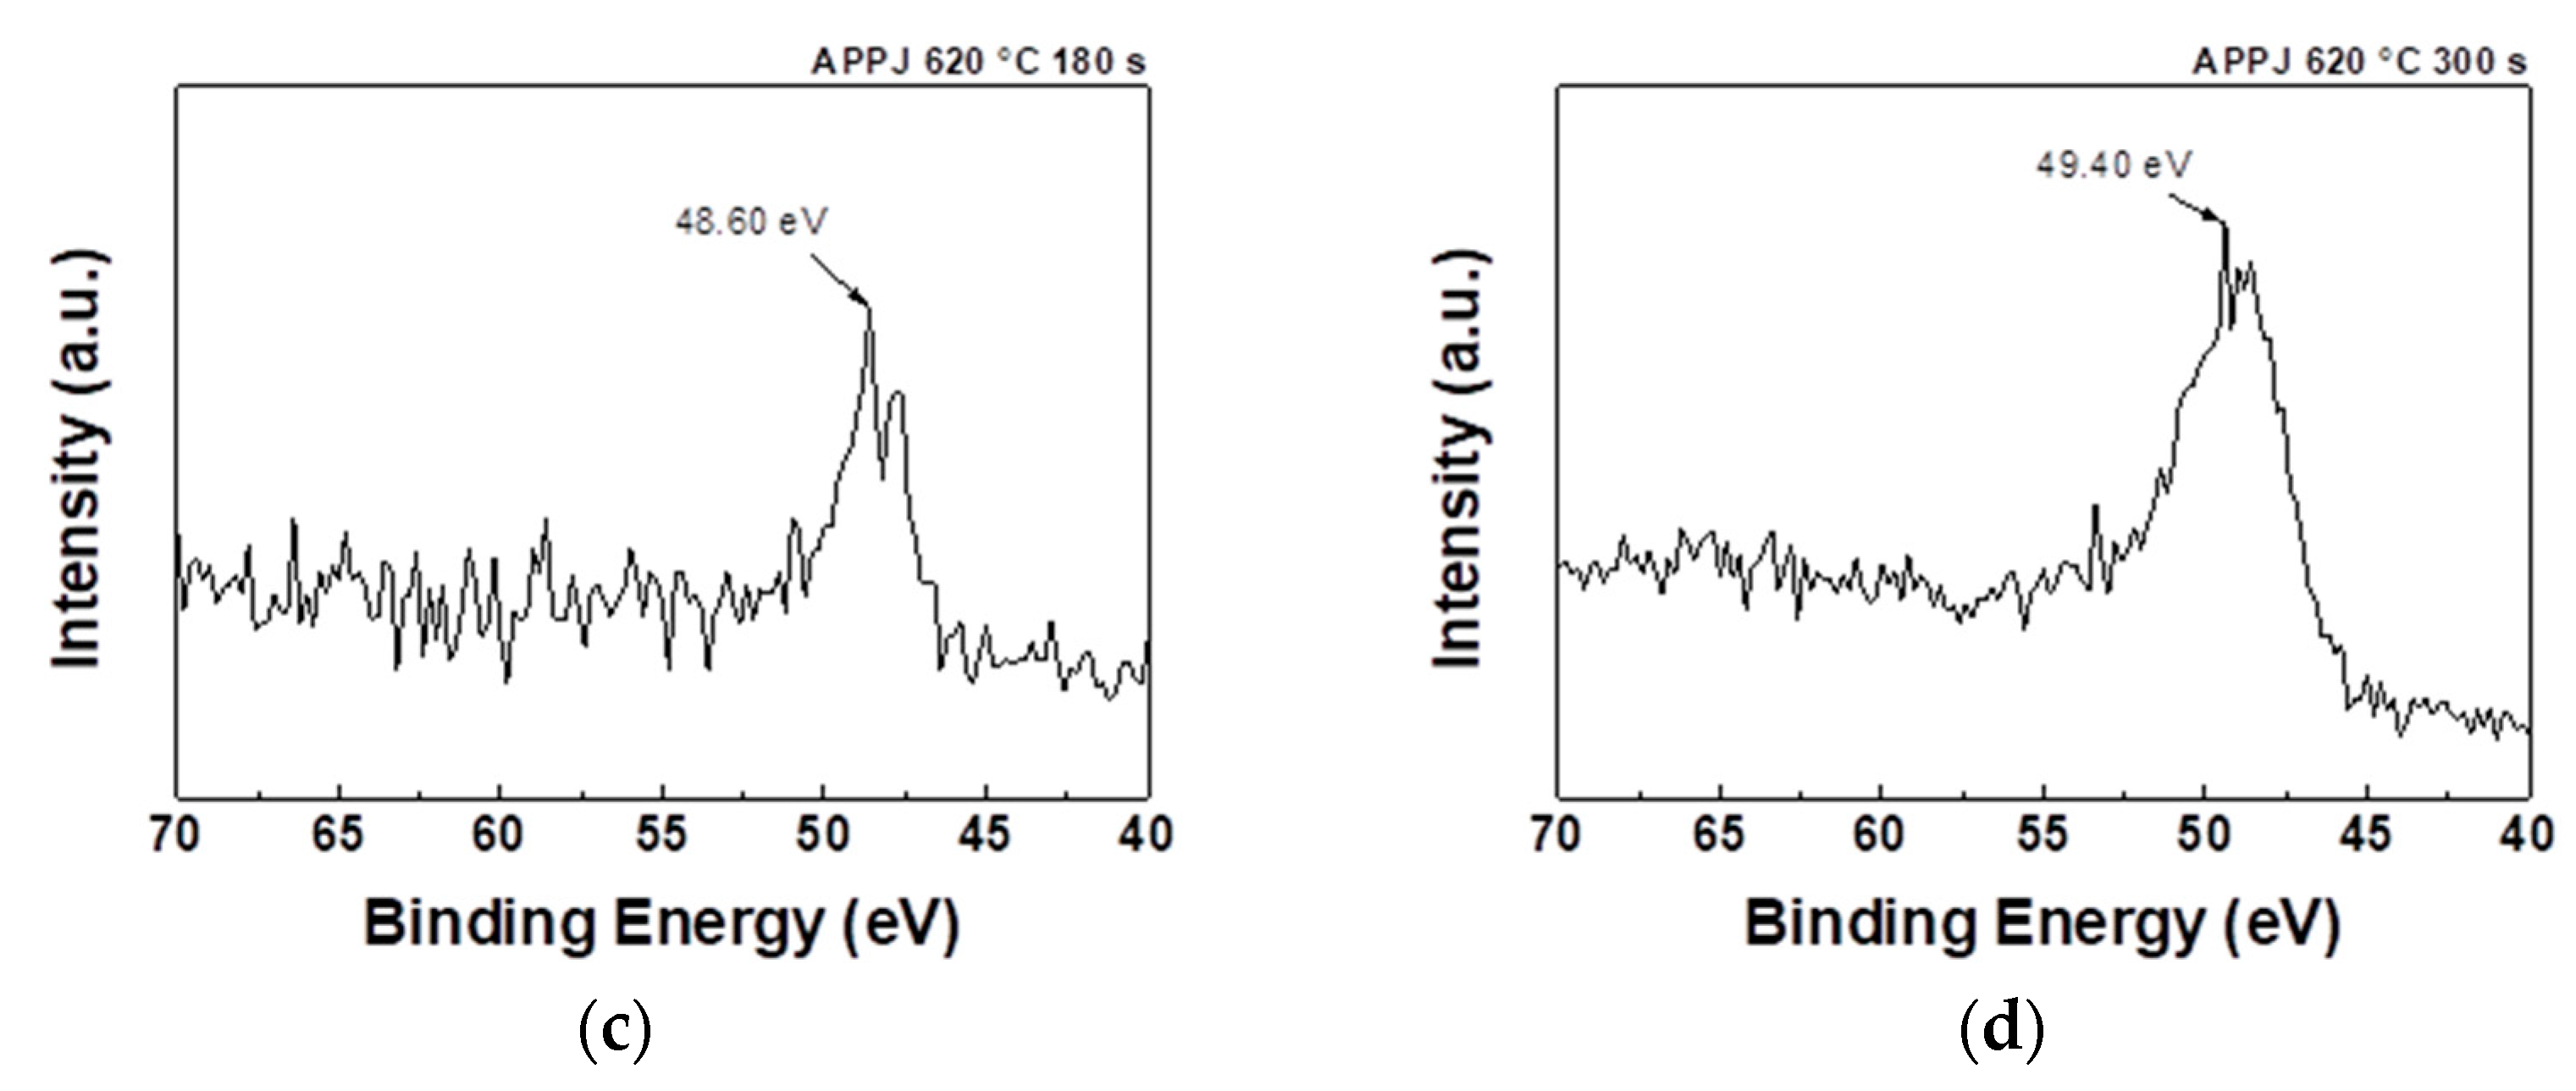
Figure 9, the Mn3s spectrum exhibits a doublet pattern, with a high-spin state (2p3/2) observed at a lower binding energy and a low-spin state (2p1/2) observed at a higher binding energy. According to the conventional linear equation (
), the average Mn valences are 3.946 for the as-deposited sample, 2.597 for that treated with APPJ for 180 s, and 2.785 for that treated with APPJ for 300 s, as shown in
Table 3 [
37]. According to the analysis results of O1s, the APPJ treatment caused the oxidation state adjustment of the manganese oxide surface, in which the Mn-O-H bonding decreased and the lattice oxygen (Mn-O-Mn) increased. These changes indicate that the degree of oxidation of manganese ions changed from a high oxidation state (Mn
4+) to a low oxidation state (Mn
3+). Samples treated with an APPJ for 300 s showed a higher average valence than that of samples treated with an APPJ for 180 s, suggesting that manganese was in a higher oxidation state, having lost more electrons and formed more bonds with oxygen atoms. This indicates a relatively higher degree of oxidation.
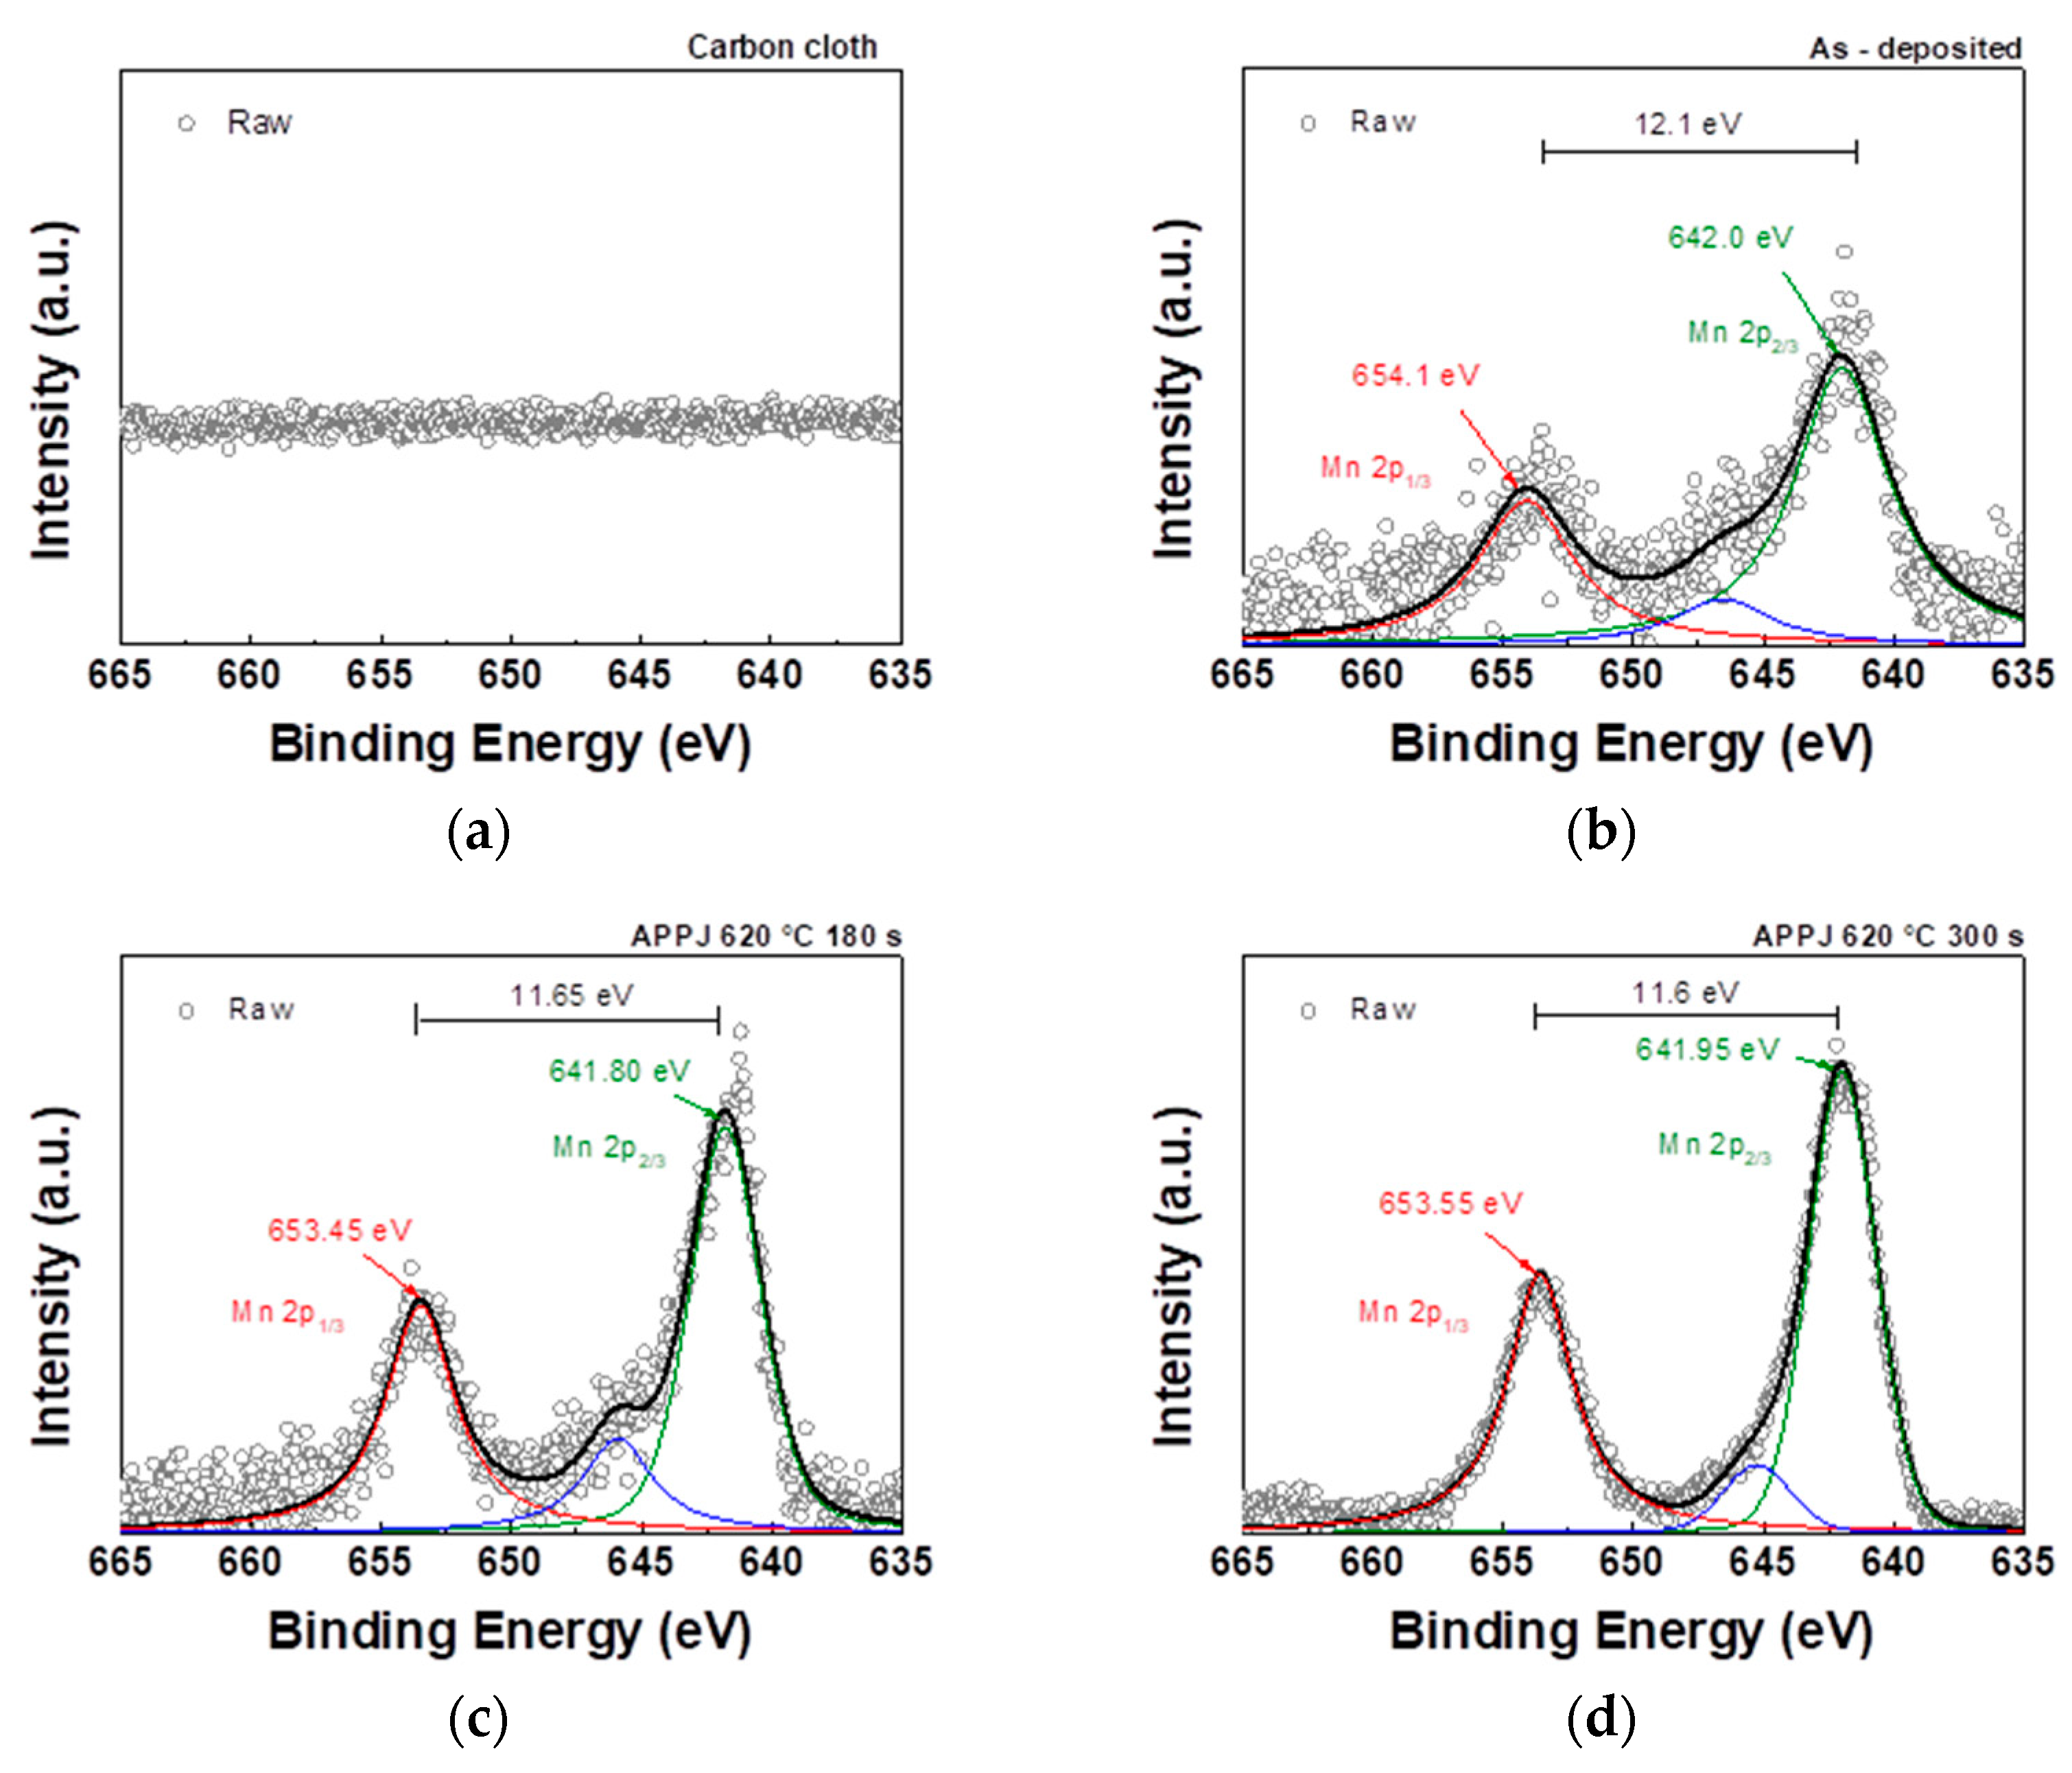
As shown in
Figure 10, the Mn 2p core-level spectrum contains two distinct peaks:
and
. The binding energy values of these two peaks can be used to calculate the spin-orbital splitting value. The
binding energy in the sample falls within the range of binding energies observed in Mn
2O
3 (641.6 eV) and MnO
2 (642.6 eV). This finding suggests the concurrent presence of both
and
species in the sample [
38].
3.4. CV of HSCs
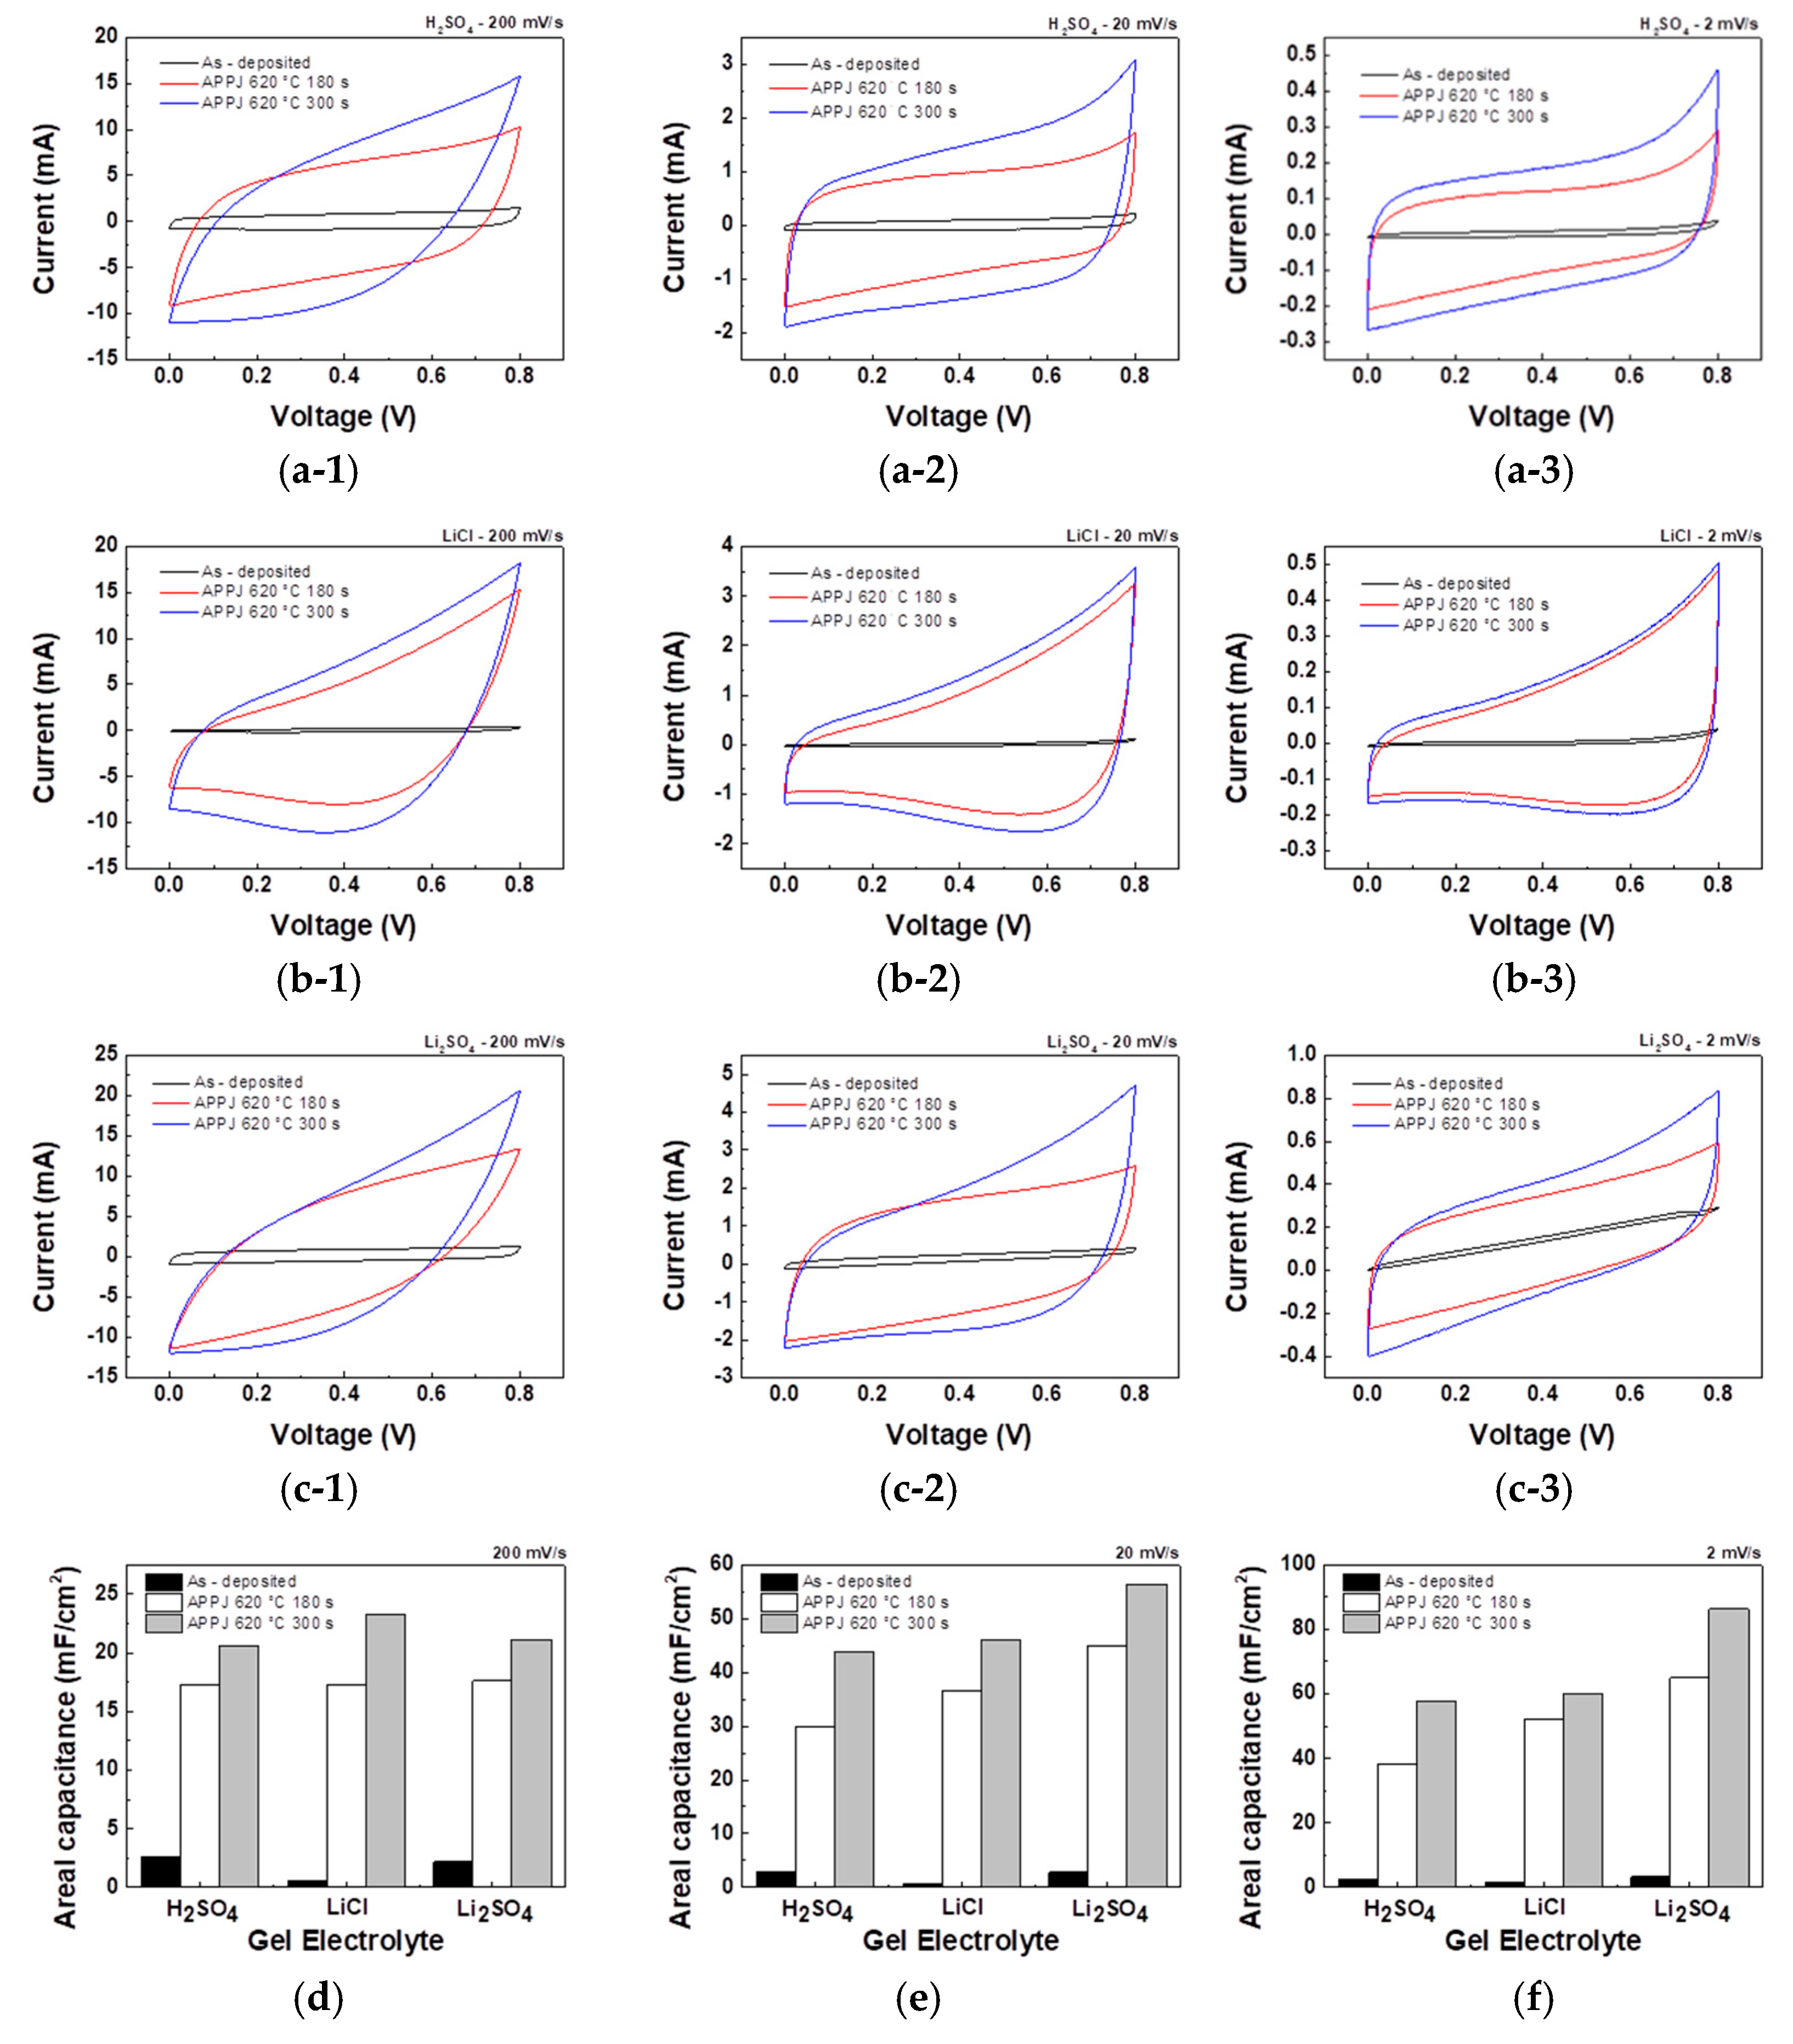
CV measurements provided insights into the electrochemical behavior and capacitance performance of the HSCs. As shown in
Figure 11, the CV curves obtained for each HSC under different gel electrolytes and fabrication processes were analyzed and compared. The areal capacitance, C
A, is calculated as
by integrating the current (I) with respect to the potential (V) over the potential range and dividing it by the potential scan rate (
v) and effective electrode area (A) [
39].
Table 4,
Table 5 and
Table 6 sequentially represent the areal capacitance of HSCs fabricated using H
2SO
4, LiCl, and Li
2SO
4 gel electrolytes at different scan rates. The areal capacitance increased with decreasing scan rate and improved significantly after APPJ treatment. The best areal capacitance was achieved when using Li
2SO
4 gel electrolyte, and the largest area under the CV curve was observed with APPJ treatment at 620°C for 180 s. When scanned at a rate of 2 mV/s, it results in an areal capacitance of 86.42 mF/cm
2. The increase in capacitance at lower scan rates is attributed to two main factors. First, at lower scan rates, ions are given sufficient time to engage in the redox reaction, thus contributing to PC. Second, ions have more time to adsorb/desorb on the electrode surface, thus contributing to EDLC.
Figure S1 and
Table S1 show the capacitance contribution ratio calculated using the Trasatti analysis method [
40]. The enhanced capacitance and energy density following surface modification primarily arises from the improved wettability of the electrode material, leading to an increased number of accessible sites for the formation of the electric double layer (EDL) [
41]. Overall, the Li
2SO
4 gel electrolyte HSC treated with an APPJ at 620°C for 180 s shows the highest areal capacitance, demonstrating the effectiveness of these factors in enhancing the electrochemical performance of the system.
3.5. GCD of HSCs
The electrochemical performance of HSCs was evaluated using GCD analysis under five constant currents. The areal capacitance, C
A, is calculated as
where
is the charging/discharging current;
, the discharging time; A, the electrode area; and ΔV, the potential scan window [
40]. The discharge curve can be segmented into three regions: an abrupt potential drop caused by the HSC’s internal resistance, a rapid potential decrease attributed to the EDLC effect, and a gradual potential decay region resulting from PC behavior [
42,
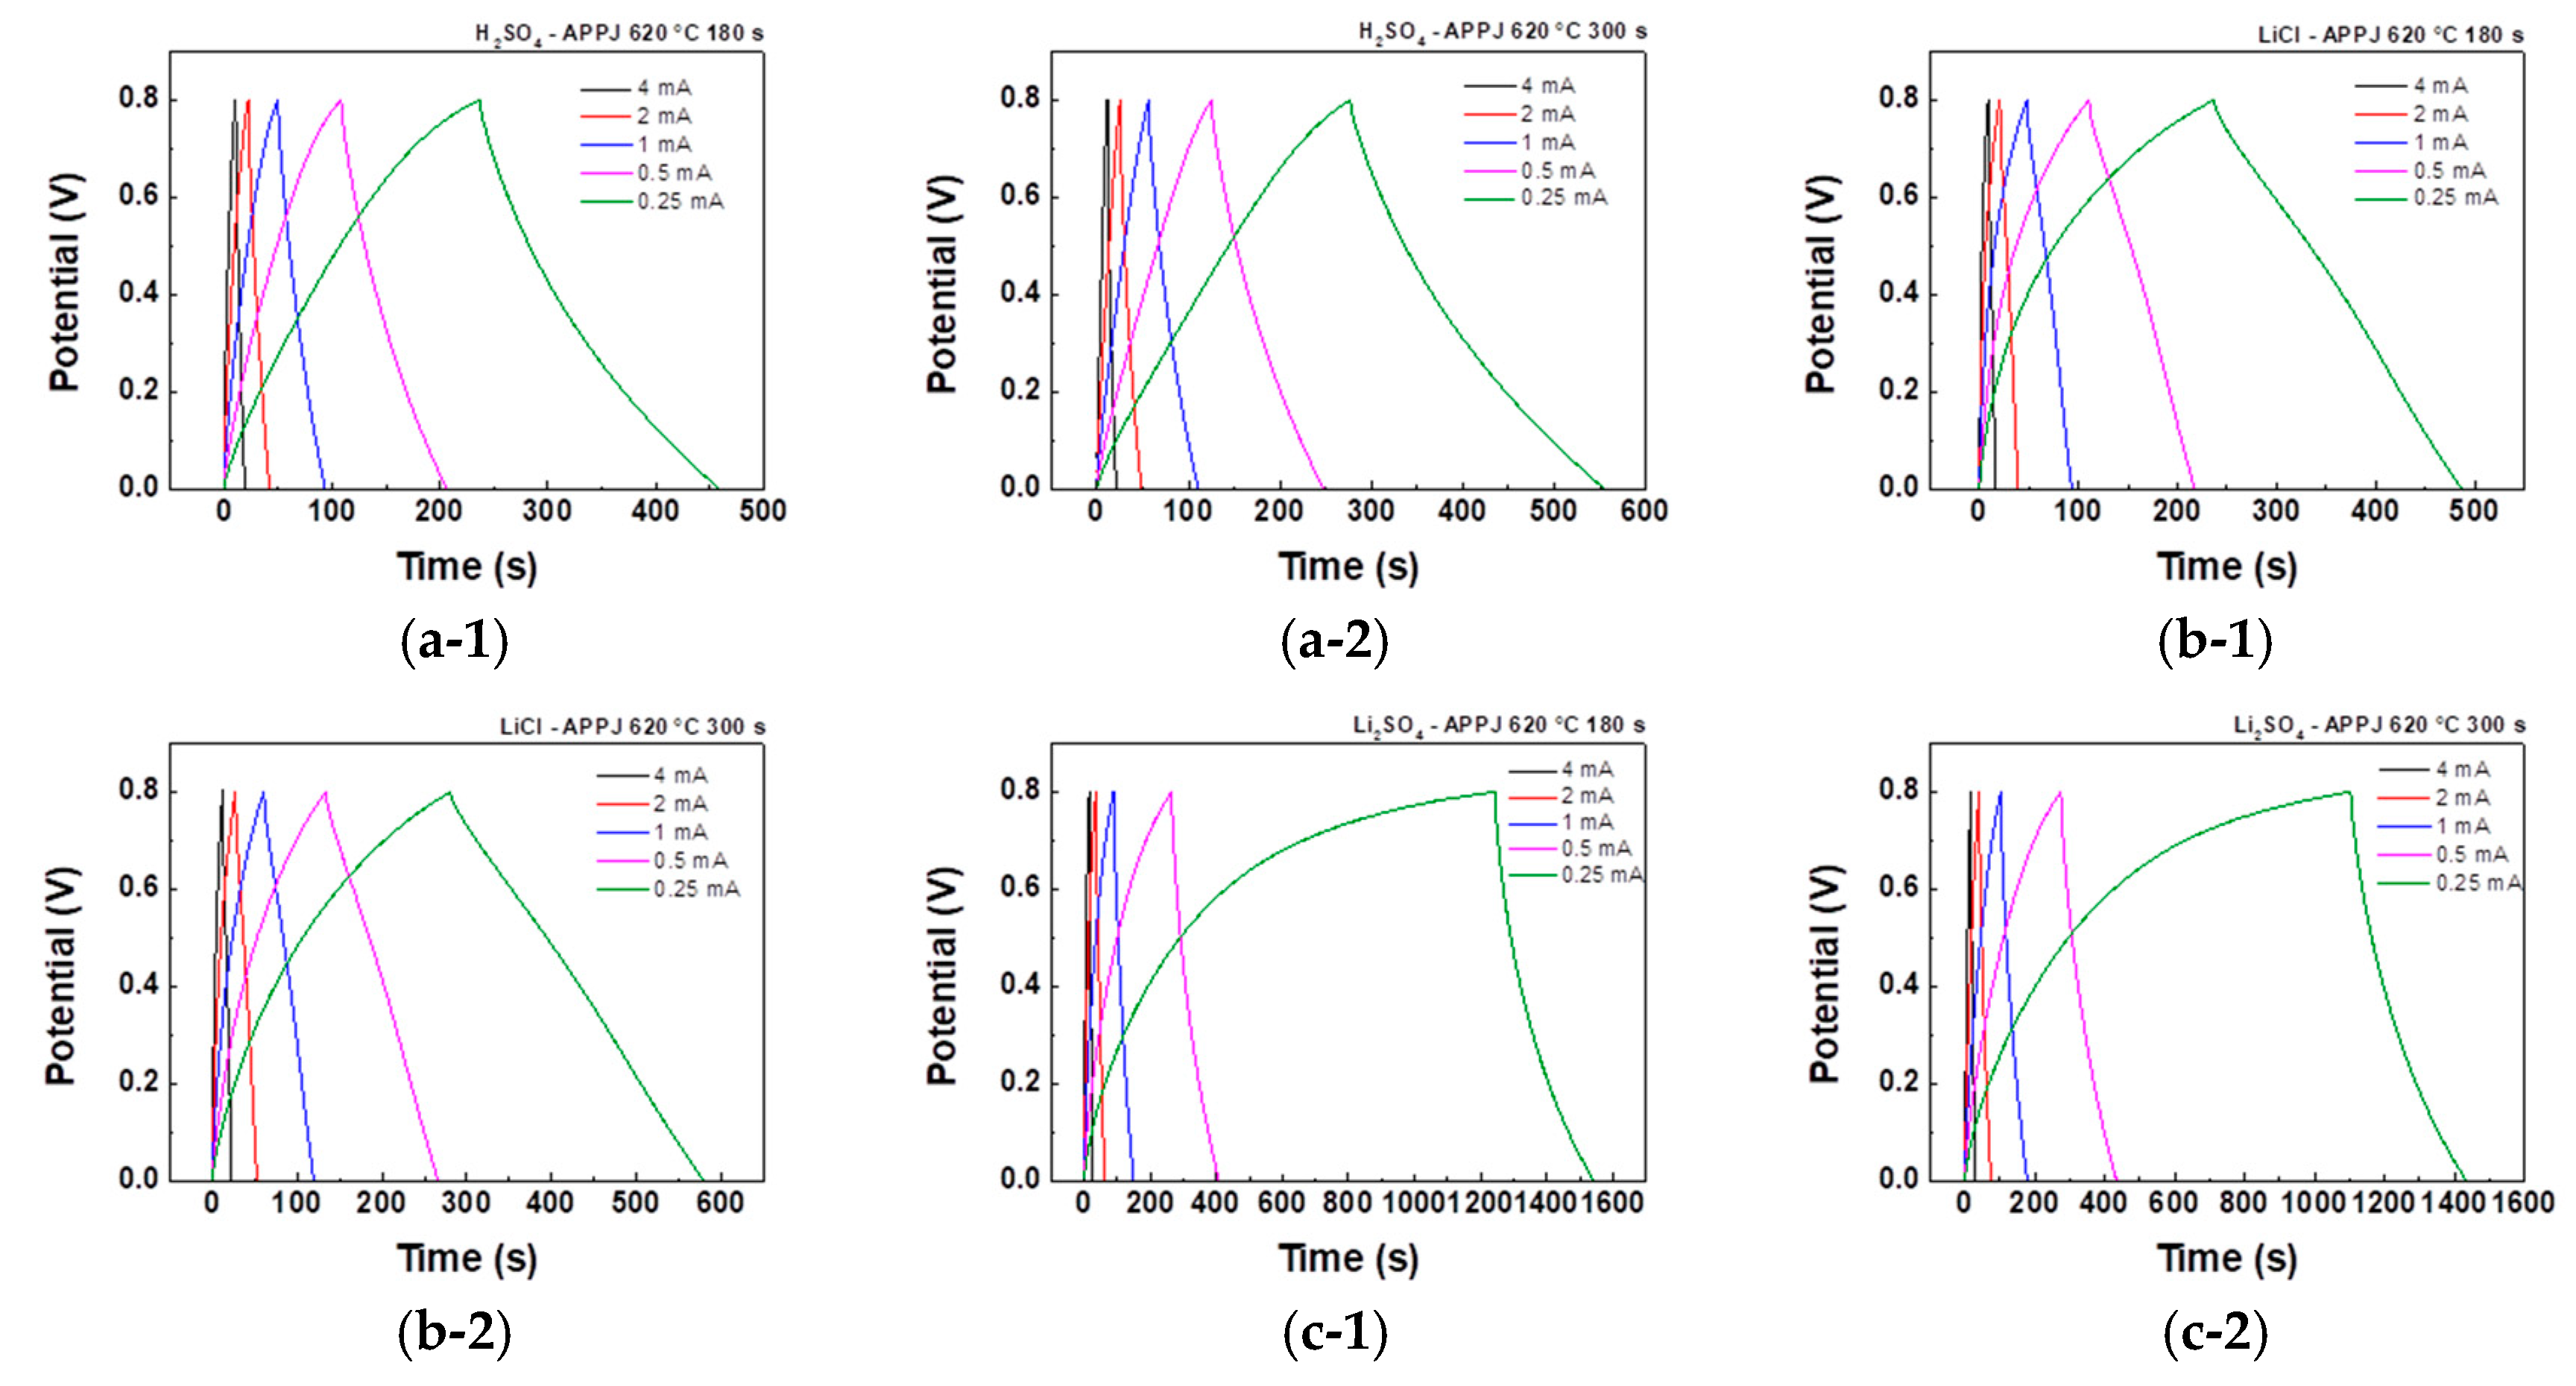
43]. As shown in
Figure 12, the GCD curves obtained for HSCs using different gel electrolytes and fabrication processes were analyzed and compared. A charge-discharge curve with an isosceles triangle shape is characteristic of EDLC. However, the figures suggest that the charge storage mechanism involves surface redox reactions rather than pure EDLC [
44]. This confirms the results obtained from the CV analysis. As shown in
Figure 12(c-1), (c-2), when using Li
2SO
4 gel electrolyte, the charging curve exhibits a smaller slope, indicating a more significant presence of oxidation-reduction reactions and slower reaction rates during charging.
Table 7,
Table 8 and
Table 9 present the areal capacitance values obtained from the calculations using GCD results. The HSC using Li
2SO
4 gel electrolyte with APPJ treatment at 620°C for 300 s exhibits the highest performance, with an areal capacitance of 69.16 mF/cm
2 when discharged at a current of 0.25 mA. A lower charging/discharging current implies that the HSC’s charging/discharging process is slower. This allows reactions to occur for a longer duration on the electrode surface, resulting in more charge transfer and electrochemical reactions. The ions in the electrolyte can undergo more complete adsorption and desorption on the electrode surface, thereby increasing the available surface area of the electrode and resulting in an increased calculated areal capacitance. These results as well as those of the previous CV analysis indicate that the Li
2SO
4 gel electrolyte HSC exhibits better performance compared to that of HSCs with the other two gel electrolytes; however, it does not provide an optimal areal capacitance at a scan rate of 200 mV/s. This suggests that the HSC with the Li
2SO
4 gel electrolyte may have a lower ion conductivity, leading to incomplete reactions at higher scan rates and resulting in a smaller areal capacitance [
45].
3.6. Ragone plot
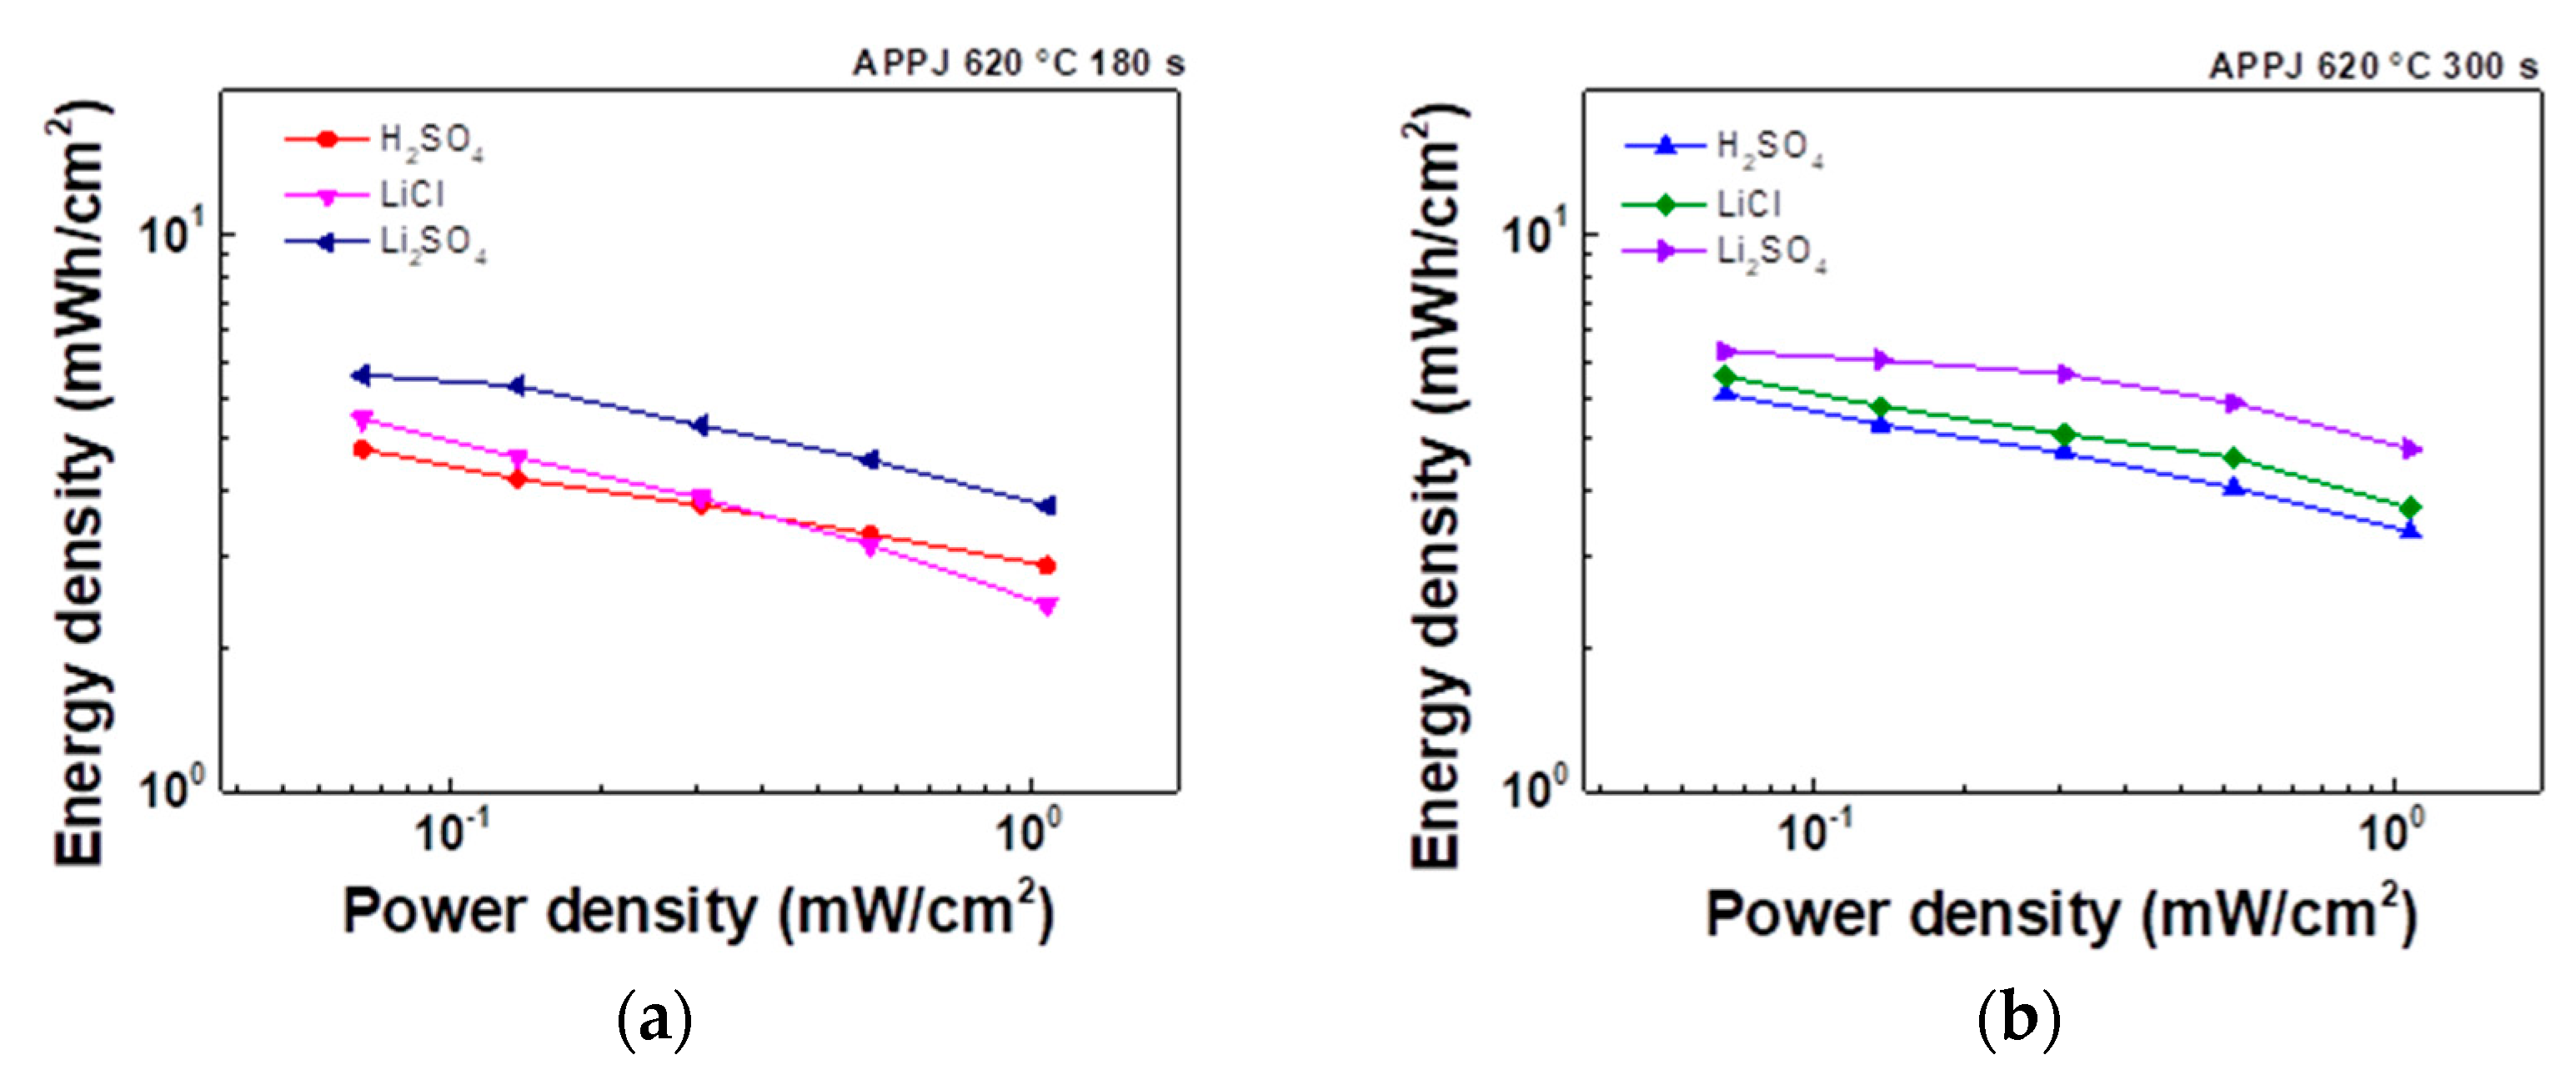
The Ragone plot shown in
Figure 13 was analyzed based on the GCD measurement results. The energy density and power density were respectively calculated using Equations (3) and (4) as
where
is the energy density;
, the areal capacitance calculated using the GCD method;
, the potential scan window;
, the power density; and T, the discharging time [
46]. As shown in
Table 10, the HSC using Li
2SO
4 gel electrolyte with APPJ treatment at 620°C for 300 s has the highest performance, with an energy density of 6.15 μWh/cm
2 when discharged at a current of 0.25 mA. Under a discharging current of 4 mA, the highest power density of 1.07 mW/cm
2 was achieved.
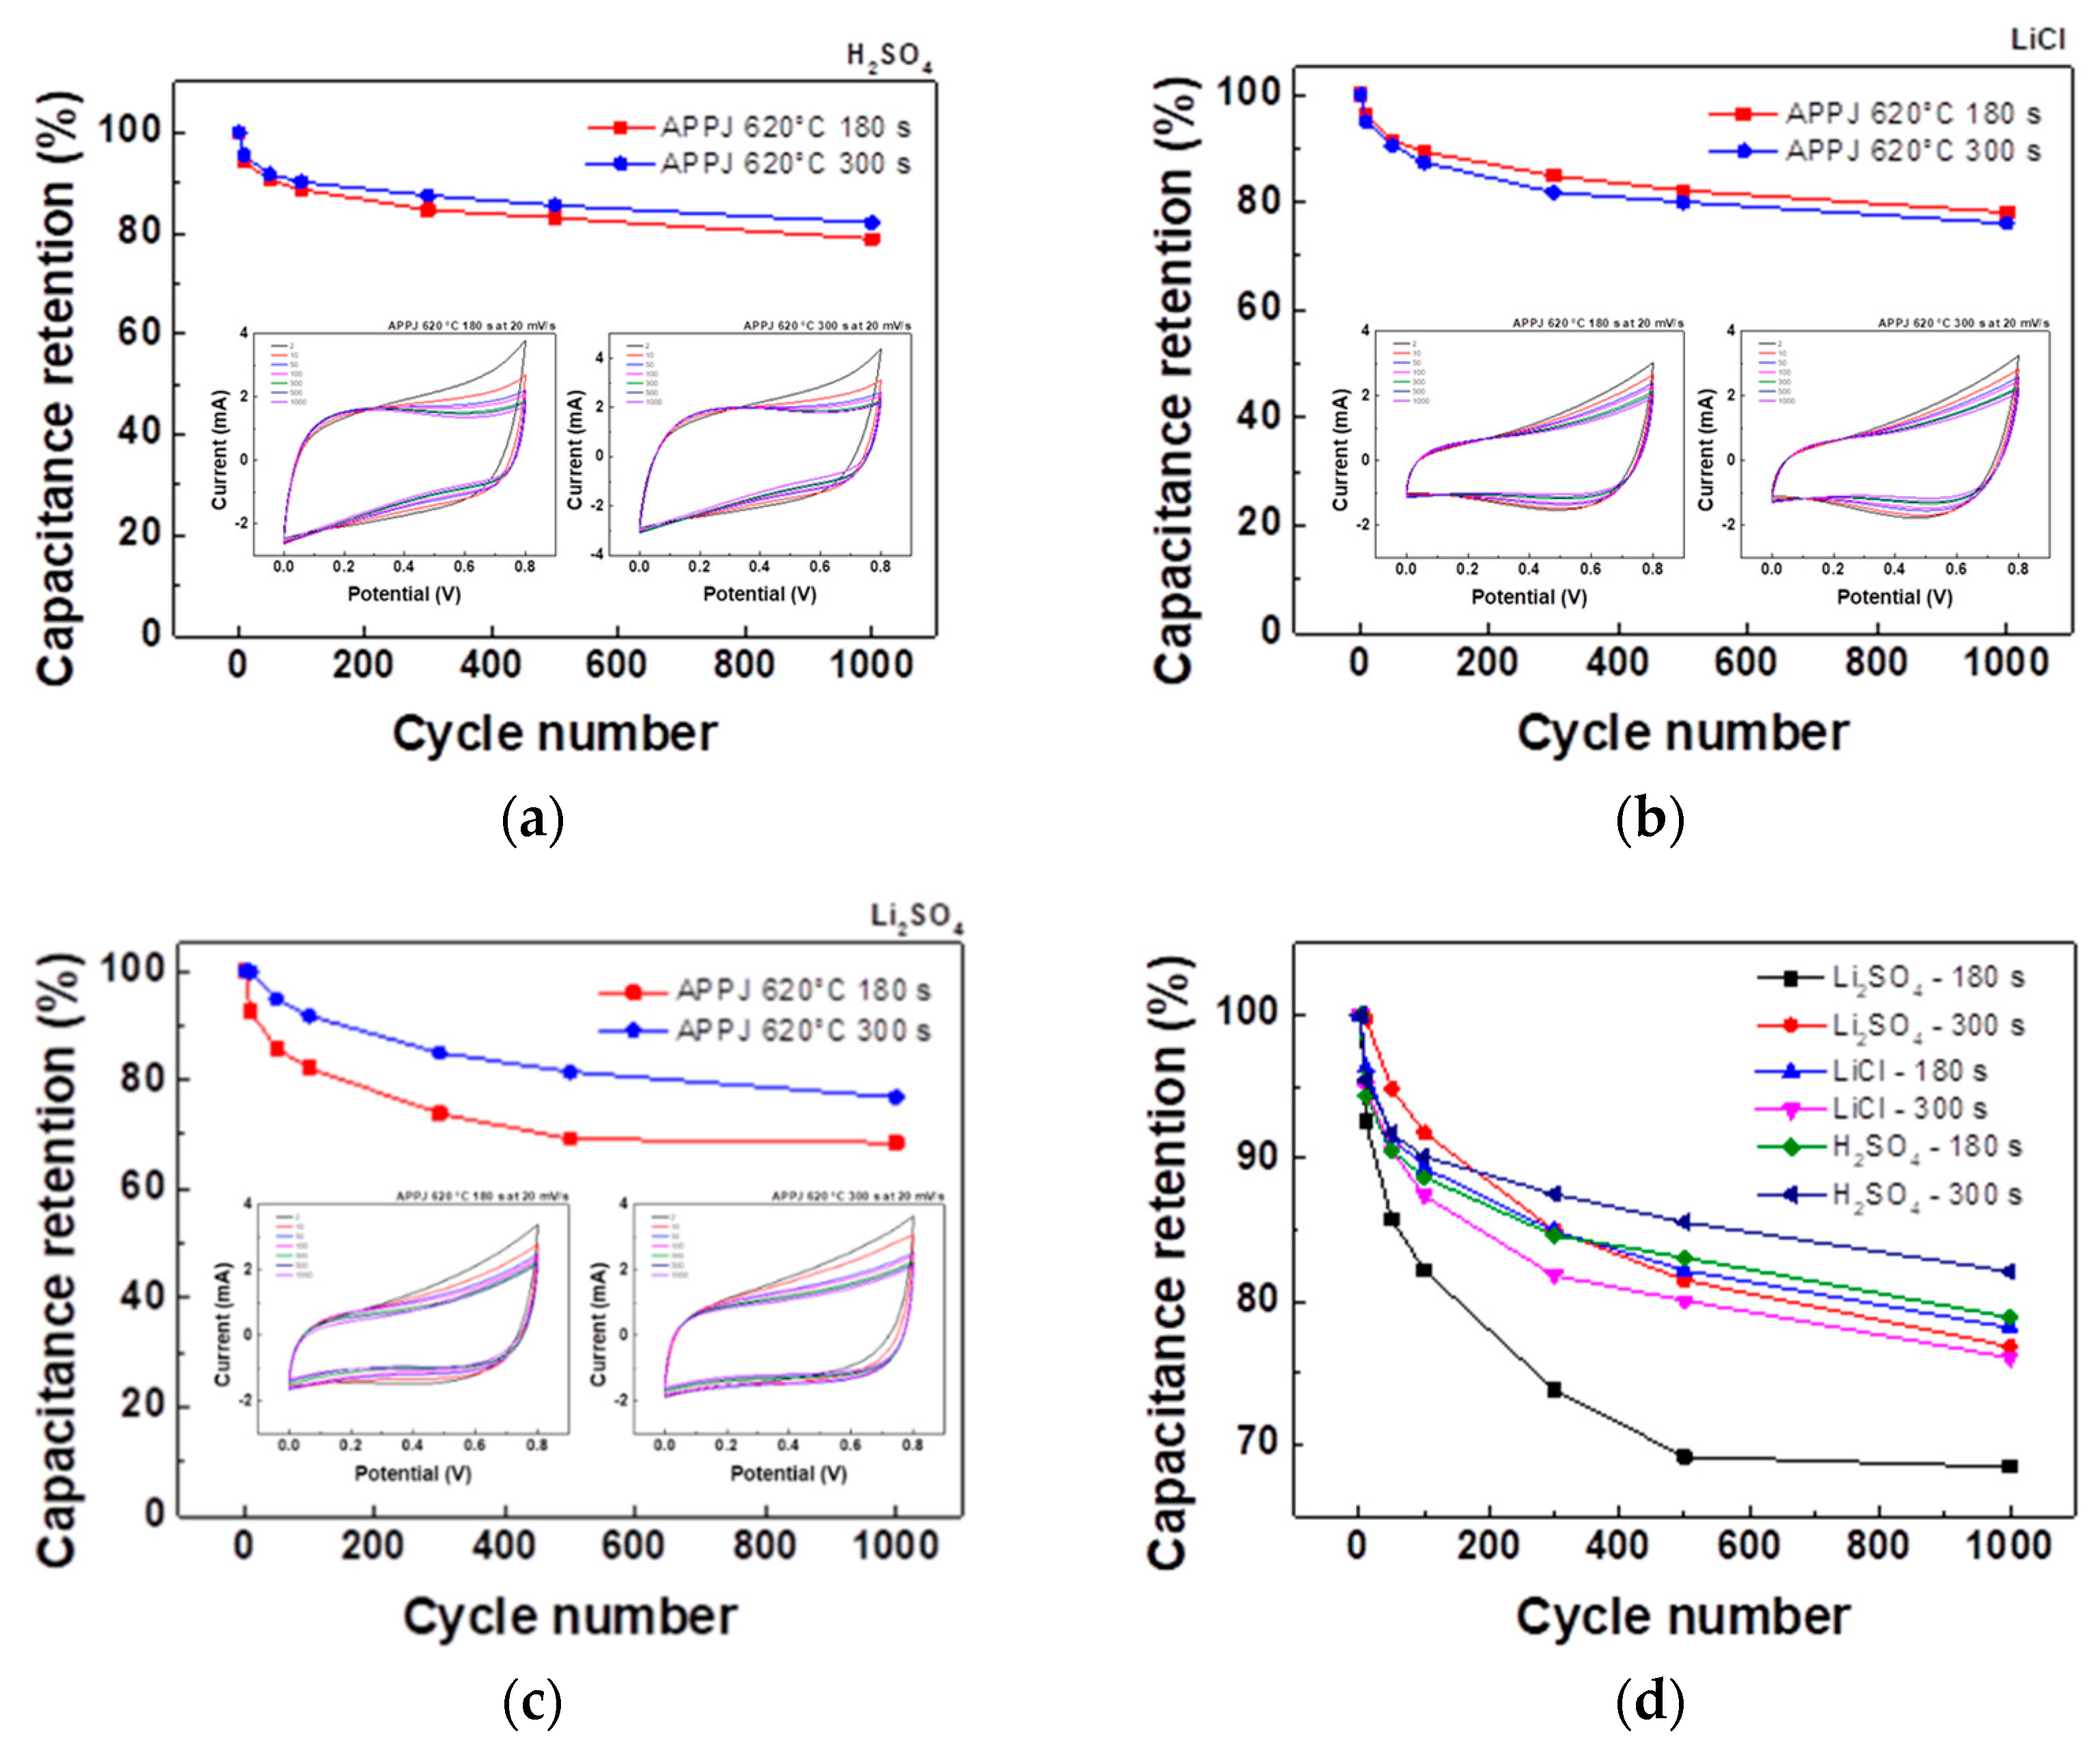
3.7. Stability of HSCs
The stability of HSCs was evaluated through a 1000-cycle CV test with a potential scan rate of 20 mV/s. As shown in
Figure 14, the HSC with H
2SO
4 gel electrolyte and APPJ treatment at 620°C for 300 s exhibits the highest capacitance retention rate of 82.1% after 1000 cycles. With LiCl and Li
2SO
4 gel electrolytes, the capacitance retention rate was approximately 70% or higher. The rate of decay decreased and then leveled off as the number of cycles increased.
As shown in the Supplementary video, the fabricated HSC was charged to power an LED and thereby demonstrate its energy storage capability.
4. Conclusions
We demonstrate that it is feasible to fabricate electrodes of HSCs by screen printing pastes containing rGO and LiCl-Mn(NO3)2·4H2O onto a carbon cloth substrate, followed by treatment with a nitrogen APPJ. H2SO4, LiCl, and Li2SO4 gel electrolyte HSC were successfully fabricated using APPJ-processed rGO-LiMnOx electrodes. Electrochemical testing revealed that the areal capacitance of the HSC increased after APPJ treatment, and both energy density and cycling stability improved with longer APPJ treatment times. Among those HSCs, the one with Li2SO4 gel electrolyte exhibited the highest areal capacitance and energy density. However, it showed relatively poor stability in stability testing. By contrast, the HSC with H2SO4 gel electrolyte exhibited a lower areal capacitance and energy density but better capacitance retention rate.
Supplementary Materials
The following supporting information can be downloaded at the website of this paper posted on
Preprints.org, Figure S1: Trasatti plots generated for HSCs using 1 M (a) H
2SO
4, (b) LiCl, and (c) Li
2SO
4 gel electrolytes. Plots of (a-1, b-1, c-1)
vs.
and (a-2, b-2, c-2)
vs.
. (d) Capacitance contributions ratio of PC/EDLC.; Table S1: Capacitance contributions of HSCs.; Video S1: Demonstration of lighting up LED with a charged HSC.
Author Contributions
Conceptualization, C.C.H., I.C.C., and J.Z.C.; methodology, P.L.L, I.C.N., C.I.W, C.C.H.; software, P.L.L.; validation, P.L.L., I.C.N. and J.Z.C.; formal analysis, P.L.L. and I.C.N.; investigation, P.L.L. and I.C.N.; resources, C.I.W., C.C.H., I.C.C., and J.Z.C.; data curation, P.L.L.; writing—original draft preparation, P.L.L. and J.Z.C.; writing—review and editing, P.L.L. and J.Z.C.; visualization, P.L.L.; supervision, C.C.H., I.C.C., and J.Z.C.; project administration, J.Z.C.; funding acquisition, J.Z.C All authors have read and agreed to the published version of the manuscript.
Funding
This work was financially supported by the “Advanced Research Center for Green Materials Science and Technology” from the Featured Area Research Center Program within the framework of the Higher Education Sprout Project by the Ministry of Education (MOE) in Taiwan (112L9006). The authors gratefully acknowledge the funding support from the National Science and Technology Council in Taiwan (NSTC) under grant nos. NSTC 111-2221-E-002-088-MY3 and NSTC 112-2218-E-002-050.
Data Availability Statement
Not applicable.
Acknowledgments
This work was financially supported by the “Advanced Research Center for Green Materials Science and Technology” from the Featured Area Research Center Program within the framework of the Higher Education Sprout Project by the Ministry of Education (MOE) in Taiwan (112L9006). The authors gratefully acknowledge the funding support from the National Science and Technology Council in Taiwan (NSTC) under grant nos. NSTC 111-2221-E-002-088-MY3 and NSTC 112-2218-E-002-050.
Conflicts of Interest
The authors declare no conflict of interest.
References
- Schutze, A.; Jeong, J.Y.; Babayan, S.E.; Jaeyoung, P.; Selwyn, G.S.; Hicks, R.F. The atmospheric-pressure plasma jet: a review and comparison to other plasma sources. IEEE Transactions on Plasma Science 1998, 26, 1685–1694. [Google Scholar] [CrossRef]
- Shenton, M.J.; Stevens, G.C. Surface modification of polymer surfaces: atmospheric plasma versus vacuum plasma treatments. Journal of Physics D: Applied Physics 2001, 34, 2761. [Google Scholar] [CrossRef]
- Zhang, M.; Dai, Y.; Wen, L.; Wang, H.; Chu, J. Maskless Surface Modification of Polyurethane Films by an Atmospheric Pressure He/O2 Plasma Microjet for Gelatin Immobilization. Micromachines 2018, 9, 195. [Google Scholar] [CrossRef] [PubMed]
- Lai, J.-Y.; Hsu, C.-C.; Chen, J.-Z. Comparison between atmospheric-pressure-plasma-jet-processed and furnace-calcined rGO-MnOx nanocomposite electrodes for gel-electrolyte supercapacitors. Journal of Alloys and Compounds 2022, 911, 165006. [Google Scholar] [CrossRef]
- Kou, Y.; Xu, Y.; Guo, Z.; Jiang, D. Supercapacitive energy storage and electric power supply using an aza-fused π-Conjugated microporous framework. Angewandte Chemie - International Edition 2011, 50, 8753–8757. [Google Scholar] [CrossRef]
- Raza, W.; Ali, F.; Raza, N.; Luo, Y.; Kim, K.-H.; Yang, J.; Kumar, S.; Mehmood, A.; Kwon, E.E. Recent advancements in supercapacitor technology. Nano Energy 2018, 52, 441–473. [Google Scholar] [CrossRef]
- Muzaffar, A.; Ahamed, M.B.; Deshmukh, K.; Thirumalai, J. A review on recent advances in hybrid supercapacitors: Design, fabrication and applications. Renewable and Sustainable Energy Reviews 2019, 101, 123–145. [Google Scholar] [CrossRef]
- Chen, G.Z. Supercapacitor and supercapattery as emerging electrochemical energy stores. International Materials Reviews 2017, 62, 173–202. [Google Scholar] [CrossRef]
- Sung, J.; Shin, C. Recent Studies on Supercapacitors with Next-Generation Structures. Micromachines 2020, 11, 1125. [Google Scholar] [CrossRef]
- Liu, X.; Wu, D.; Wang, H.; Wang, Q. Self-Recovering Tough Gel Electrolyte with Adjustable Supercapacitor Performance. Advanced Materials 2014, 26, 4370–4375. [Google Scholar] [CrossRef]
- Dubal, D.P.; Kim, J.G.; Kim, Y.; Holze, R.; Lokhande, C.D.; Kim, W.B. Supercapacitors Based on Flexible Substrates: An Overview. Energy Technology 2014, 2, 325–341. [Google Scholar] [CrossRef]
- Shown, I.; Ganguly, A.; Chen, L.-C.; Chen, K.-H. Conducting polymer-based flexible supercapacitor. Energy Science & Engineering 2015, 3, 2–26. [Google Scholar] [CrossRef]
- Wang, Y.; Wu, X.; Han, Y.; Li, T. Flexible supercapacitor: Overview and outlooks. Journal of Energy Storage 2021, 42, 103053. [Google Scholar] [CrossRef]
- Jayachandiran, J.; Yesuraj, J.; Arivanandhan, M.; Raja, A.; Suthanthiraraj, S.A.; Jayavel, R.; Nedumaran, D. Synthesis and Electrochemical Studies of rGO/ZnO Nanocomposite for Supercapacitor Application. Journal of Inorganic and Organometallic Polymers and Materials 2018, 28, 2046–2055. [Google Scholar] [CrossRef]
- Cai, X.; Shen, X.; Ma, L.; Ji, Z.; Xu, C.; Yuan, A. Solvothermal synthesis of NiCo-layered double hydroxide nanosheets decorated on RGO sheets for high performance supercapacitor. Chemical Engineering Journal 2015, 268, 251–259. [Google Scholar] [CrossRef]
- Alipoori, S.; Mazinani, S.; Aboutalebi, S.H.; Sharif, F. Review of PVA-based gel polymer electrolytes in flexible solid-state supercapacitors: Opportunities and challenges. Journal of Energy Storage 2020, 27, 101072. [Google Scholar] [CrossRef]
- Kamran, U.; Heo, Y.-J.; Lee, J.W.; Park, S.-J. Functionalized Carbon Materials for Electronic Devices: A Review. Micromachines 2019, 10, 234. [Google Scholar] [CrossRef]
- Xinping, H.; Bo, G.; Guibao, W.; Jiatong, W.; Chun, Z. A new nanocomposite: Carbon cloth based polyaniline for an electrochemical supercapacitor. Electrochimica Acta 2013, 111, 210–215. [Google Scholar] [CrossRef]
- Murayama, I.; Yoshimoto, N.; Egashira, M.; Morita, M.; Kobayashi, Y.; Ishikawa, M. Characteristics of Electric Double Layer Capacitors with an Ionic Liquid Electrolyte Containing Li Ion. Electrochemistry 2005, 73, 600–602. [Google Scholar] [CrossRef]
- Ogasawara, T.; Klein, L.C. Sol-gel electrolytes in lithium batteries. Journal of Sol-Gel Science and Technology 1994, 2, 611–613. [Google Scholar] [CrossRef]
- Chen, Z.; Zhang, L.Z.; West, R.; Amine, K. Gel electrolyte for lithium-ion batteries. Electrochimica Acta 2008, 53, 3262–3266. [Google Scholar] [CrossRef]
- Badawi, N.M.; Batoo, K.M.; Subramaniam, R.; Kasi, R.; Hussain, S.; Imran, A.; Muthuramamoorthy, M. Highly Conductive and Reusable Cellulose Hydrogels for Supercapacitor Applications. Micromachines 2023, 14, 1461. [Google Scholar] [CrossRef] [PubMed]
- Chen, H.-K.; Ni, I.C.; Wu, C.-I.; Cheng, I.C.; Chen, J.-Z. Low-Pressure Argon/Hydrogen/Oxygen Plasma Treatment on LiMn2O4 Li-Ion Hybrid Supercapacitors. ECS Journal of Solid State Science and Technology 2023, 12, 043002. [Google Scholar] [CrossRef]
- Vangari, M.; Pryor, T.; Jiang, L. Supercapacitors: Review of Materials and Fabrication Methods. Journal of Energy Engineering 2013, 139, 72–79. [Google Scholar] [CrossRef]
- Kostov, K.G.; Nishime, T.M.C.; Castro, A.H.R.; Toth, A.; Hein, L.R.O. Surface modification of polymeric materials by cold atmospheric plasma jet. Applied Surface Science 2014, 314, 367–375. [Google Scholar] [CrossRef]
- Wang, G.; Lu, X.; Ling, Y.; Zhai, T.; Wang, H.; Tong, Y.; Li, Y. LiCl/PVA Gel Electrolyte Stabilizes Vanadium Oxide Nanowire Electrodes for Pseudocapacitors. ACS Nano 2012, 6, 10296–10302. [Google Scholar] [CrossRef]
- Tu, Q.-M.; Fan, L.-Q.; Pan, F.; Huang, J.-L.; Gu, Y.; Lin, J.-M.; Huang, M.-L.; Huang, Y.-F.; Wu, J.-H. Design of a novel redox-active gel polymer electrolyte with a dual-role ionic liquid for flexible supercapacitors. Electrochimica Acta 2018, 268, 562–568. [Google Scholar] [CrossRef]
- Liu, C.; Hung, C.-W.; Cheng, I.C.; Hsu, C.-C.; Cheng, I.C.; Chen, J.-Z. Dielectric Barrier Discharge Plasma Jet (DBDjet) Processed Reduced Graphene Oxide/Polypyrrole/Chitosan Nanocomposite Supercapacitors. Polymers 2021, 13. [Google Scholar] [CrossRef]
- Chang, J.-H.; Lin, M.-F.; Kuo, Y.-L.; Yang, C.-R.; Chen, J.-Z. Flexible rGO-SnO2 supercapacitors converted from pastes containing SnCl2 liquid precursor using atmospheric-pressure plasma jet. Ceramics International 2021, 47, 1651–1659. [Google Scholar] [CrossRef]
- Ji, B.; Wang, T.; Li, M.; Shi, L.; You, X.; Sun, F.; Luan, H. Localized Surface Hydrophilicity Tailoring of Polyimide Film for Flexible Electronics Manufacturing Using an Atmospheric Pressure Ar/H2O Microplasma Jet. Micromachines 2022, 13, 1853. [Google Scholar] [CrossRef]
- Tseng, C.-H.; Hsin, J.-C.; Tsai, J.-H.; Chen, J.-Z. Dielectric-Barrier-Discharge Jet Treated Flexible Supercapacitors with Carbon Cloth Current Collectors of Long-Lasting Hydrophilicity. Journal of The Electrochemical Society 2020, 167, 116511. [Google Scholar] [CrossRef]
- Lai, J.-Y.; Chen, H.-K.; Hsu, C.-C.; Chen, J.-Z. LiMn2O4 Li-ion hybrid supercapacitors processed by nitrogen atmospheric-pressure plasma jet. Ceramics International 2023, 49, 11067–11075. [Google Scholar] [CrossRef]
- Min, C.; Liu, D.; Qian, J.; He, Z.; Jia, W.; Song, H.; Guo, L. High mechanical and tribological performance polyimide nanocomposites using amine-functionalized graphene nanosheets. Tribology International 2019, 131, 1–10. [Google Scholar] [CrossRef]
- Kuok, F.H.; Chien, H.H.; Lee, C.C.; Hao, Y.C.; Yu, I.S.; Hsu, C.C.; Cheng, I.C.; Chen, J.Z. Atmospheric-pressure-plasma-jet processed carbon nanotube (CNT)-reduced graphene oxide (rGO) nanocomposites for gel-electrolyte supercapacitors. RSC Adv 2018, 8, 2851–2857. [Google Scholar] [CrossRef]
- Wu, H.; He, D.; Wang, Y. Facile one-step process synthesized reduced graphene oxide/Mn3O4 nanocomposite for a symmetric supercapacitor. Materials Letters 2020, 268, 127613. [Google Scholar] [CrossRef]
- Chang, J.-K.; Chen, Y.-L.; Tsai, W.-T. Effect of heat treatment on material characteristics and pseudo-capacitive properties of manganese oxide prepared by anodic deposition. Journal of Power Sources 2004, 135, 344–353. [Google Scholar] [CrossRef]
- Haruna, A.B.; Mwonga, P.; Barrett, D.; Rodella, C.B.; Forbes, R.P.; Venter, A.; Sentsho, Z.; Fletcher, P.J.; Marken, F.; Ozoemena, K.I. Defect-Engineered β-MnO2−δ Precursors Control the Structure–Property Relationships in High-Voltage Spinel LiMn1.5Ni0.5O4−δ. ACS Omega 2021, 6, 25562–25573. [Google Scholar] [CrossRef]
- Vu, N.H.; Dao, V.-D.; Vu, H.H.T.; Van Noi, N.; Tran, D.T.; Ha, M.N.; Pham, T.-D. Hydrothermal Synthesis of Li2MnO3-Stabilized LiMnO2 as a Cathode Material for Li-Ion Battery. Journal of Nanomaterials 2021, 2021, 9312358. [Google Scholar] [CrossRef]
- Gund, G.S.; Dubal, D.P.; Chodankar, N.R.; Cho, J.Y.; Gomez-Romero, P.; Park, C.; Lokhande, C.D. Low-cost flexible supercapacitors with high-energy density based on nanostructured MnO2 and Fe2O3 thin films directly fabricated onto stainless steel. Sci Rep 2015, 5, 12454. [Google Scholar] [CrossRef]
- Chang, J.-H.; Chen, S.-Y.; Kuo, Y.-L.; Yang, C.-R.; Chen, J.-Z. Carbon Dioxide Tornado-Type Atmospheric-Pressure-Plasma-Jet-Processed rGO-SnO2 Nanocomposites for Symmetric Supercapacitors. Materials 2021, 14, 2777. [Google Scholar] [CrossRef]
- Fang, B.; Binder, L. A Novel Carbon Electrode Material for Highly Improved EDLC Performance. The Journal of Physical Chemistry B 2006, 110, 7877–7882. [Google Scholar] [CrossRef] [PubMed]
- Gund, G.S.; Dubal, D.P.; Patil, B.H.; Shinde, S.S.; Lokhande, C.D. Enhanced activity of chemically synthesized hybrid graphene oxide/Mn3O4 composite for high performance supercapacitors. Electrochimica Acta 2013, 92, 205–215. [Google Scholar] [CrossRef]
- Gaire, M.; Subedi, B.; Adireddy, S.; Chrisey, D. Ultra-long cycle life and binder-free manganese-cobalt oxide supercapacitor electrodes through photonic nanostructuring. RSC Advances 2020, 10, 40234–40243. [Google Scholar] [CrossRef] [PubMed]
- Chodankar, N.R.; Pham, H.D.; Nanjundan, A.K.; Fernando, J.F.S.; Jayaramulu, K.; Golberg, D.; Han, Y.-K.; Dubal, D.P. True Meaning of Pseudocapacitors and Their Performance Metrics: Asymmetric versus Hybrid Supercapacitors. Small 2020, 16, 2002806. [Google Scholar] [CrossRef] [PubMed]
- Fuertes, A.B.; Sevilla, M. Superior Capacitive Performance of Hydrochar-Based Porous Carbons in Aqueous Electrolytes. ChemSusChem 2015, 8, 1049–1057. [Google Scholar] [CrossRef]
- Zhang, Y.; Liu, Y.; Bai, Y.; Liu, Y.; Xie, E. Boosting the electrochemical properties of carbon materials as bipolar electrodes by introducing oxygen functional groups. RSC Advances 2020, 10, 35295–35301. [Google Scholar] [CrossRef]
Figure 1.
Fabrication process of gel electrolyte HSC.
Figure 1.
Fabrication process of gel electrolyte HSC.
Figure 2.
SEM images (magnification: 80×) of (a) carbon cloth and (b) untreated pastes on carbon cloth and rGO-LiMnOx after APPJ treatment for (c) 180 s and (d) 300 s.
Figure 2.
SEM images (magnification: 80×) of (a) carbon cloth and (b) untreated pastes on carbon cloth and rGO-LiMnOx after APPJ treatment for (c) 180 s and (d) 300 s.
Figure 3.
SEM images (magnification: 5000×) of (a) carbon cloth and (b) untreated pastes on carbon cloth and rGO-LiMnOx after APPJ treatment for (c) 180 s and (d) 300 s.
Figure 3.
SEM images (magnification: 5000×) of (a) carbon cloth and (b) untreated pastes on carbon cloth and rGO-LiMnOx after APPJ treatment for (c) 180 s and (d) 300 s.
Figure 4.
SEM images (magnification: 50000×) of (a) carbon cloth and (b) untreated pastes on carbon cloth and rGO-LiMnOx after APPJ treatment for (c) 180 s and (d) 300 s.
Figure 4.
SEM images (magnification: 50000×) of (a) carbon cloth and (b) untreated pastes on carbon cloth and rGO-LiMnOx after APPJ treatment for (c) 180 s and (d) 300 s.
Figure 5.
Water contact angles of (a) carbon cloth and (b) untreated pastes on carbon cloth and after APPJ treatment for (c) 180 s and (d) 300 s.
Figure 5.
Water contact angles of (a) carbon cloth and (b) untreated pastes on carbon cloth and after APPJ treatment for (c) 180 s and (d) 300 s.
Figure 6.
XPS C1s spectra of (a) carbon cloth and (b) untreated pastes on carbon cloth and APPJ-treated samples for (c) 180 s and (d) 300 s.
Figure 6.
XPS C1s spectra of (a) carbon cloth and (b) untreated pastes on carbon cloth and APPJ-treated samples for (c) 180 s and (d) 300 s.
Figure 7.
XPS O1s spectra of (a) carbon cloth and (b) untreated pastes on carbon cloth and APPJ-treated samples for (c) 180 s and (d) 300 s.
Figure 7.
XPS O1s spectra of (a) carbon cloth and (b) untreated pastes on carbon cloth and APPJ-treated samples for (c) 180 s and (d) 300 s.
Figure 8.
XPS Li1s spectra of (a) carbon cloth and (b) untreated pastes on carbon cloth and APPJ-treated samples for (c) 180 s and (d) 300 s.
Figure 8.
XPS Li1s spectra of (a) carbon cloth and (b) untreated pastes on carbon cloth and APPJ-treated samples for (c) 180 s and (d) 300 s.
Figure 9.
XPS Mn3s spectra of (a) carbon cloth and (b) untreated pastes on carbon cloth and APPJ-treated samples for (c) 180 s and (d) 300 s.
Figure 9.
XPS Mn3s spectra of (a) carbon cloth and (b) untreated pastes on carbon cloth and APPJ-treated samples for (c) 180 s and (d) 300 s.
Figure 10.
XPS Mn2p spectra of (a) carbon cloth and (b) untreated pastes on carbon cloth and APPJ-treated samples for (c) 180 s and (d) 300 s.
Figure 10.
XPS Mn2p spectra of (a) carbon cloth and (b) untreated pastes on carbon cloth and APPJ-treated samples for (c) 180 s and (d) 300 s.
Figure 11.
CV curves obtained for HSCs using 1 M (a) H2SO4, (b) LiCl, and (c) Li2SO4 gel electrolytes. Comparison of areal capacitance at different potential scan rates of (d) 200 mV/s, (e) 20 mV/s, and (f) 2 mV/s.
Figure 11.
CV curves obtained for HSCs using 1 M (a) H2SO4, (b) LiCl, and (c) Li2SO4 gel electrolytes. Comparison of areal capacitance at different potential scan rates of (d) 200 mV/s, (e) 20 mV/s, and (f) 2 mV/s.
Figure 12.
GCD curves obtained for HSCs using 1 M (a) H2SO4, (b) LiCl, and (c) Li2SO4 gel electrolytes under five constant currents: 4 mA, 2 mA, 1 mA, 0.5 mA, and 0.25 mA.
Figure 12.
GCD curves obtained for HSCs using 1 M (a) H2SO4, (b) LiCl, and (c) Li2SO4 gel electrolytes under five constant currents: 4 mA, 2 mA, 1 mA, 0.5 mA, and 0.25 mA.
Figure 13.
Comparison of Ragone plots for H2SO4, LiCl, and Li2SO4 gel electrolyte HSCs treated with APPJ for (a) 180 s and (b) 300 s.
Figure 13.
Comparison of Ragone plots for H2SO4, LiCl, and Li2SO4 gel electrolyte HSCs treated with APPJ for (a) 180 s and (b) 300 s.
Figure 14.
Cycling CV test with a potential scan rate of 20 mV/s using 1 M (a) H2SO4, (b) LiCl, and (c) Li2SO4 gel electrolytes. (d) Capacitance retention for 1000-cycle CV stability test.
Figure 14.
Cycling CV test with a potential scan rate of 20 mV/s using 1 M (a) H2SO4, (b) LiCl, and (c) Li2SO4 gel electrolytes. (d) Capacitance retention for 1000-cycle CV stability test.
Table 1.
XPS analysis of the C1s spectra in
Figure 6, providing the atomic ratio of carbon bonding states.
Table 1.
XPS analysis of the C1s spectra in
Figure 6, providing the atomic ratio of carbon bonding states.
| |
C-C (at%) |
C-O (at%) |
C=O (at%) |
O-C=O (at%) |
| Carbon cloth |
100 |
- |
- |
- |
| As-deposited |
32.28 |
46.59 |
10.33 |
10.80 |
| APPJ - 180 s |
52.88 |
24.75 |
14.08 |
8.29 |
| APPJ - 300 s |
61.02 |
23.43 |
8.08 |
7.47 |
Table 2.
XPS analysis of the O1s spectra in
Figure 7, providing the atomic ratio of carbon bonding states.
Table 2.
XPS analysis of the O1s spectra in
Figure 7, providing the atomic ratio of carbon bonding states.
| |
Lattice oxygen Mn-O-Mn (at%) |
Mn-O-H (at%) |
C-O (at%) |
C=O (at%) |
| Carbon cloth |
- |
- |
100 |
- |
| As-deposited |
6.73 |
50.76 |
42.49 |
0.02 |
| APPJ - 180 s |
23.41 |
47.55 |
3.60\ |
25.43 |
| APPJ - 300 s |
60.11 |
28.49 |
6.35 |
5.05 |
Table 3.
Average valence of Mn based on the XPS analysis of the Mn 3s spectra shown in
Figure 9.
Table 3.
Average valence of Mn based on the XPS analysis of the Mn 3s spectra shown in
Figure 9.
| |
Mn-O-H (at%) |
C-O (at%) |
C=O (at%) |
|
(eV) |
4.4 |
5.81 |
5.7 |
| Average valence of Mn |
3.946 |
2.597 |
2.785 |
Table 4.
Areal capacitance of HSCs using H2SO4 gel electrolyte, calculated based on CV results.
Table 4.
Areal capacitance of HSCs using H2SO4 gel electrolyte, calculated based on CV results.
|
) |
|---|
| APPJ treatment |
Potential scan rate (mV/s) |
| 200 mV/s |
20 mV/s |
2 mV/s |
| As-deposited |
2.55 |
2.81 |
2.32 |
| APPJ - 180 s |
17.32 |
29.92 |
38.26 |
| APPJ - 300 s |
20.60 |
43.91 |
57.76 |
Table 5.
Areal capacitance of HSCs using LiCl gel electrolyte, calculated based on CV results.
Table 5.
Areal capacitance of HSCs using LiCl gel electrolyte, calculated based on CV results.
|
) |
|---|
| APPJ treatment |
Potential scan rate (mV/s) |
| 200 mV/s |
20 mV/s |
2 mV/s |
| As-deposited |
0.53 |
0.74 |
1.34 |
| APPJ - 180 s |
17.26 |
36.52 |
51.96 |
| APPJ - 300 s |
23.33 |
46.04 |
59.95 |
Table 6.
Areal capacitance of HSCs using Li2SO4 gel electrolyte, calculated based on CV results.
Table 6.
Areal capacitance of HSCs using Li2SO4 gel electrolyte, calculated based on CV results.
|
) |
|---|
| APPJ treatment |
Potential scan rate (mV/s) |
| 200 mV/s |
20 mV/s |
2 mV/s |
| As-deposited |
2.22 |
2.81 |
3.37 |
| APPJ - 180 s |
17.60 |
44.92 |
65.13 |
| APPJ - 300 s |
21.15 |
56.47 |
86.42 |
Table 7.
Areal capacitance of HSCs using H2SO4 gel electrolyte, calculated based on GCD results.
Table 7.
Areal capacitance of HSCs using H2SO4 gel electrolyte, calculated based on GCD results.
|
) |
|---|
| APPJ treatment |
Discharging current |
| 4 mA |
2 mA |
1 mA |
0.5 mA |
0.25 mA |
| APPJ - 180 s |
28.56 |
32.46 |
36.62 |
40.86 |
46.28 |
| APPJ - 300 s |
32.81 |
39.42 |
45.42 |
51.23 |
58.09 |
Table 8.
Areal capacitance of HSCs using LiCl gel electrolyte, calculated based on GCD results.
Table 8.
Areal capacitance of HSCs using LiCl gel electrolyte, calculated based on GCD results.
|
) |
|---|
| APPJ treatment |
Discharging current |
| 4 mA |
2 mA |
1 mA |
0.5 mA |
0.25 mA |
| APPJ - 180 s |
24.28 |
31.19 |
37.85 |
44.62 |
52.28 |
| APPJ - 300 s |
36.27 |
44.70 |
49.16 |
55.22 |
62.27 |
Table 9.
Areal capacitance of HSCs using Li2SO4 gel electrolyte, calculated based on GCD results.
Table 9.
Areal capacitance of HSCs using Li2SO4 gel electrolyte, calculated based on GCD results.
|
) |
|---|
| APPJ treatment |
Discharging current |
| 4 mA |
2 mA |
1 mA |
0.5 mA |
0.25 mA |
| APPJ - 180 s |
36.55 |
44.16 |
51.00 |
60.05 |
62.76 |
| APPJ - 300 s |
46.25 |
55.96 |
62.96 |
66.82 |
69.16 |
Table 10.
Energy density of HSCs using H2SO4, LiCl, and Li2SO4 gel electrolytes, calculated based on GCD results.
Table 10.
Energy density of HSCs using H2SO4, LiCl, and Li2SO4 gel electrolytes, calculated based on GCD results.
|
) |
|---|
| |
Discharging current |
| 4 mA |
2 mA |
1 mA |
0.5 mA |
0.25 mA |
| H2SO4
|
APPJ - 180 s |
2.54 |
2.89 |
3.26 |
3.63 |
4.11 |
| APPJ - 300 s |
2.92 |
3.50 |
4.04 |
4.55 |
5.16 |
| LiCl |
APPJ - 180 s |
2.16 |
2.77 |
3.36 |
3.97 |
4.65 |
| APPJ - 300 s |
3.22 |
3.97 |
4.37 |
4.91 |
5.54 |
| Li2SO4
|
APPJ - 180 s |
3.25 |
3.93 |
4.53 |
5.34 |
5.58 |
| APPJ - 300 s |
4.11 |
4.97 |
5.60 |
5.94 |
6.15 |
|
Disclaimer/Publisher’s Note: The statements, opinions and data contained in all publications are solely those of the individual author(s) and contributor(s) and not of MDPI and/or the editor(s). MDPI and/or the editor(s) disclaim responsibility for any injury to people or property resulting from any ideas, methods, instructions or products referred to in the content. |
© 2023 by the authors. Licensee MDPI, Basel, Switzerland. This article is an open access article distributed under the terms and conditions of the Creative Commons Attribution (CC BY) license (http://creativecommons.org/licenses/by/4.0/).
