Submitted:
31 July 2023
Posted:
02 August 2023
You are already at the latest version
Abstract
Keywords:
Introduction
Materials and Methods
Chemicals and Reagents
Sample preparation
Extraction
Instrumental
Results and Discussion
Conclusions
Supplementary Materials
Author Contributions
Funding
Data Availability Statement
Acknowledgments
Conflicts of Interest
References
- Whitfield, F.B.; Last, J.H. Vegetables; 2017. ISBN 9781351405355.
- Bunkar, D.S.; Anand, A.; Kumar, K.; Meena, M.; Goyal, S.K.; Paswan, V.K. Development of production technology for preparation of beetroot powder using different drying methods. Ann. Phytomedicine An Int. J. 2020, 9. [Google Scholar] [CrossRef]
- Brzezińska-rojek, J.; Rutkowska, M.; Brzezicha, J.; Konieczka, P.; Prokopowicz, M.; Grembecka, M. Mineral composition of dietary supplements-analytical and chemometric approach. Nutrients 2022, 14, 1–27. [Google Scholar] [CrossRef] [PubMed]
- Chhikara, N.; Kushwaha, K.; Sharma, P.; Gat, Y.; Panghal, A. Bioactive compounds of beetroot and utilization in food processing industry: A critical review. Food Chem. 2019, 272, 192–200. [Google Scholar] [CrossRef] [PubMed]
- Revised, S. August 2013 Slightly Revised, November 2013. 2013.
- Giampaoli, O.; Sciubba, F.; Conta, G.; Capuani, G.; Tomassini, A.; Giorgi, G.; Brasili, E.; Aureli, W.; Miccheli, A. Red Beetroot’s NMR-Based Metabolomics: Phytochemical Profile Related to Development Time and Production Year. Foods 2021, 10, 1–12. [Google Scholar] [CrossRef]
- Pedreño, M.A.; Escribano, J. Correlation between antiradical activity and stability of betanine from Beta vulgaris L roots under different pH, temperature and light conditions. J. Sci. Food Agric. 2001, 81, 627–631. [Google Scholar] [CrossRef]
- Kujala, T.S.; Loponen, J.M.; Klika, K.D.; Pihlaja, K. Phenolics and betacyanins in red beetroot (Beta vulgaris) root: Distribution and effect of cold storage on the content of total phenolics and three individual compounds. J. Agric. Food Chem. 2000, 48, 5338–5342. [Google Scholar] [CrossRef]
- Guenther, B.D.; Christensen, C.R.; Upatnieks, J. Coherent Optical Processing: Another Approach. IEEE J. Quantum Electron. 1979, 15, 1348–1362. [Google Scholar] [CrossRef]
- Jessie Szalay, What are flavonoids? 20 October 2015. Available online: https://www.livescience.com/52524-flavonoids.html.
- Boo, Y.C. p-coumaric acid as an active ingredient in cosmetics: A review focusing on its antimelanogenic effects. Antioxidants 2019, 8. [Google Scholar] [CrossRef]
- Cai, Y.Z.; Sun, M.; Corke, H. Characterization and application of betalain pigments from plants of the Amaranthaceae. Trends Food Sci. Technol. 2005, 16, 370–376. [Google Scholar] [CrossRef]
- Mateo Anson, N.; van den Berg, R.; Havenaar, R.; Bast, A.; Haenen, G.R.M.M. Bioavailability of ferulic acid is determined by its bioaccessibility. J. Cereal Sci. 2009, 49, 296–300. [Google Scholar] [CrossRef]
- Dongowski, G. Enzymatic degradation studies of pectin and cellulose from red beets. Nahrung - Food 2001, 45, 324–331. [Google Scholar] [CrossRef] [PubMed]
- Lovegrove, A.; Edwards, C.H.; De Noni, I.; Patel, H.; El, S.N.; Grassby, T.; Zielke, C.; Ulmius, M.; Nilsson, L.; Butterworth, P.J.; et al. Role of polysaccharides in food, digestion, and health. Crit. Rev. Food Sci. Nutr. 2017, 57, 237–253. [Google Scholar] [CrossRef] [PubMed]
- Blanco-Pérez, F.; Steigerwald, H.; Schülke, S.; Vieths, S.; Toda, M.; Scheurer, S. The Dietary Fiber Pectin: Health Benefits and Potential for the Treatment of Allergies by Modulation of Gut Microbiota. Curr. Allergy Asthma Rep. 2021, 21. [Google Scholar] [CrossRef]
- Fu, Y.; Shi, J.; Xie, S.Y.; Zhang, T.Y.; Soladoye, O.P.; Aluko, R.E. Red Beetroot Betalains: Perspectives on Extraction, Processing, and Potential Health Benefits. J. Agric. Food Chem. 2020, 68, 11595–11611. [Google Scholar] [CrossRef]
- Ibrahim, K.O.O.; Adepoju, G.F.; Owoeye, J.F.A.; Abdulmajeed, A.A.; Folaranmi, O.O. Orbital Mesenchymal Chondrosarcoma : Report of a Rare Tumor in a Nigerian Girl. Ann. Trop. Pathol. 2020, 11, 20–23. [Google Scholar]
- Ivrea, M.A.A.L. Distribution of Betalain Pigments in Red Blood Cells after Consumption of Cactus Pear Fruits and Increased Resistance of the Cells to ex Vivo Induced Oxidative Hemolysis in Humans. 2005, 1266–1270.
- Sadowska-Bartosz, I.; Bartosz, G. Biological properties and applications of betalains. Molecules 2021, 26, 1–36. [Google Scholar] [CrossRef]
- Khan, M.I. Plant Betalains: Safety, Antioxidant Activity, Clinical Efficacy, and Bioavailability. Compr. Rev. Food Sci. Food Saf. 2016, 15, 316–330. [Google Scholar] [CrossRef]
- Farag, M.A.; Sharaf El-Din, M.G.; Selim, M.A.; Owis, A.I.; Abouzid, S.F.; Porzel, A.; Wessjohann, L.A.; Otify, A. Nuclear magnetic resonance metabolomics approach for the analysis of major legume sprouts coupled to chemometrics. Molecules 2021, 26, 1–28. [Google Scholar] [CrossRef]
- Gokhale, S. V; Lele, S.S. Dehydration of Red Beet Root ( Beta vulgaris ) by Hot Air Drying : Process Optimization and Mathematical Modeling. 2011, 20, 955–964. [Google Scholar] [CrossRef]
- Hadaruga, D.I.; Hadaruga, N.G.; Hermenean, A.; Rivis, A.; Paslaru, V.; Codina, G. Bionanomaterials: Thermal stability of the oleic acid / α- and β-cyclodextrin complexes. Rev. Chim. 2008, 59, 994–998. [Google Scholar] [CrossRef]
- Thrippleton, M.J.; Keeler, J. Elimination of zero-quantum interference in two-dimensional NMR spectra. Angew. Chemie - Int. Ed. 2003, 42, 3938–3941. [Google Scholar] [CrossRef] [PubMed]
- Aue, W.P.; Karhan, J.; Ernst, R.R. Homonuclear broad band decoupling and two-dimensional J-resolved NMR spectroscopy. J. Chem. Phys. 1976, 64, 4226–4227. [Google Scholar] [CrossRef]
- Ad Bax, Donald G Davis,MLEV-17-based two-dimensional homonuclear magnetization transfer spectroscopy,Journal of Magnetic Resonance (1969),Volume 65, Issue 2,1985,Pages 355-360,ISSN 0022-2364. [CrossRef]
- Arthur G Palmer, John Cavanagh, Peter E Wright, Mark Rance,Sensitivity improvement in proton-detected two-dimensional heteronuclear correlation NMR spectroscopy,Journal of Magnetic Resonance (1969),Volume 93, Issue 1,1991,Pages 151-170,ISSN 0022-2364.
- Available online: https://bmrb.io/metabolomics/mol_summary/show_data.php?id=bmse000119.
- Brown, G.D.; Bauer, J.; Osborn, H.M.I.; Kuemmerle, R. A Solution NMR Approach to Determine the Chemical Structures of Carbohydrates Using the Hydroxyl Groups as Starting Points. ACS Omega 2018, 3, 17957–17975. [Google Scholar] [CrossRef]
- H. , V. Unravelling Glycobiology by NMR Spectroscopy. Glycosylation 2012. [Google Scholar] [CrossRef]
- U. S. Department of Agriculture, A.R.S. USDA National Nutrient Database for Standard Reference, Release 26. Nutrient Data Laboratory Home Page. United States Dep. Agric. 2013, 28. [Google Scholar]
- Ritota, M.; Marini, F.; Sequi, P.; Valentini, M. Metabolomic characterization of italian sweet pepper (Capsicum annum L.) by means of HRMAS-NMR spectroscopy and multivariate analysis. J. Agric. Food Chem. 2010, 58, 9675–9684. [Google Scholar] [CrossRef]
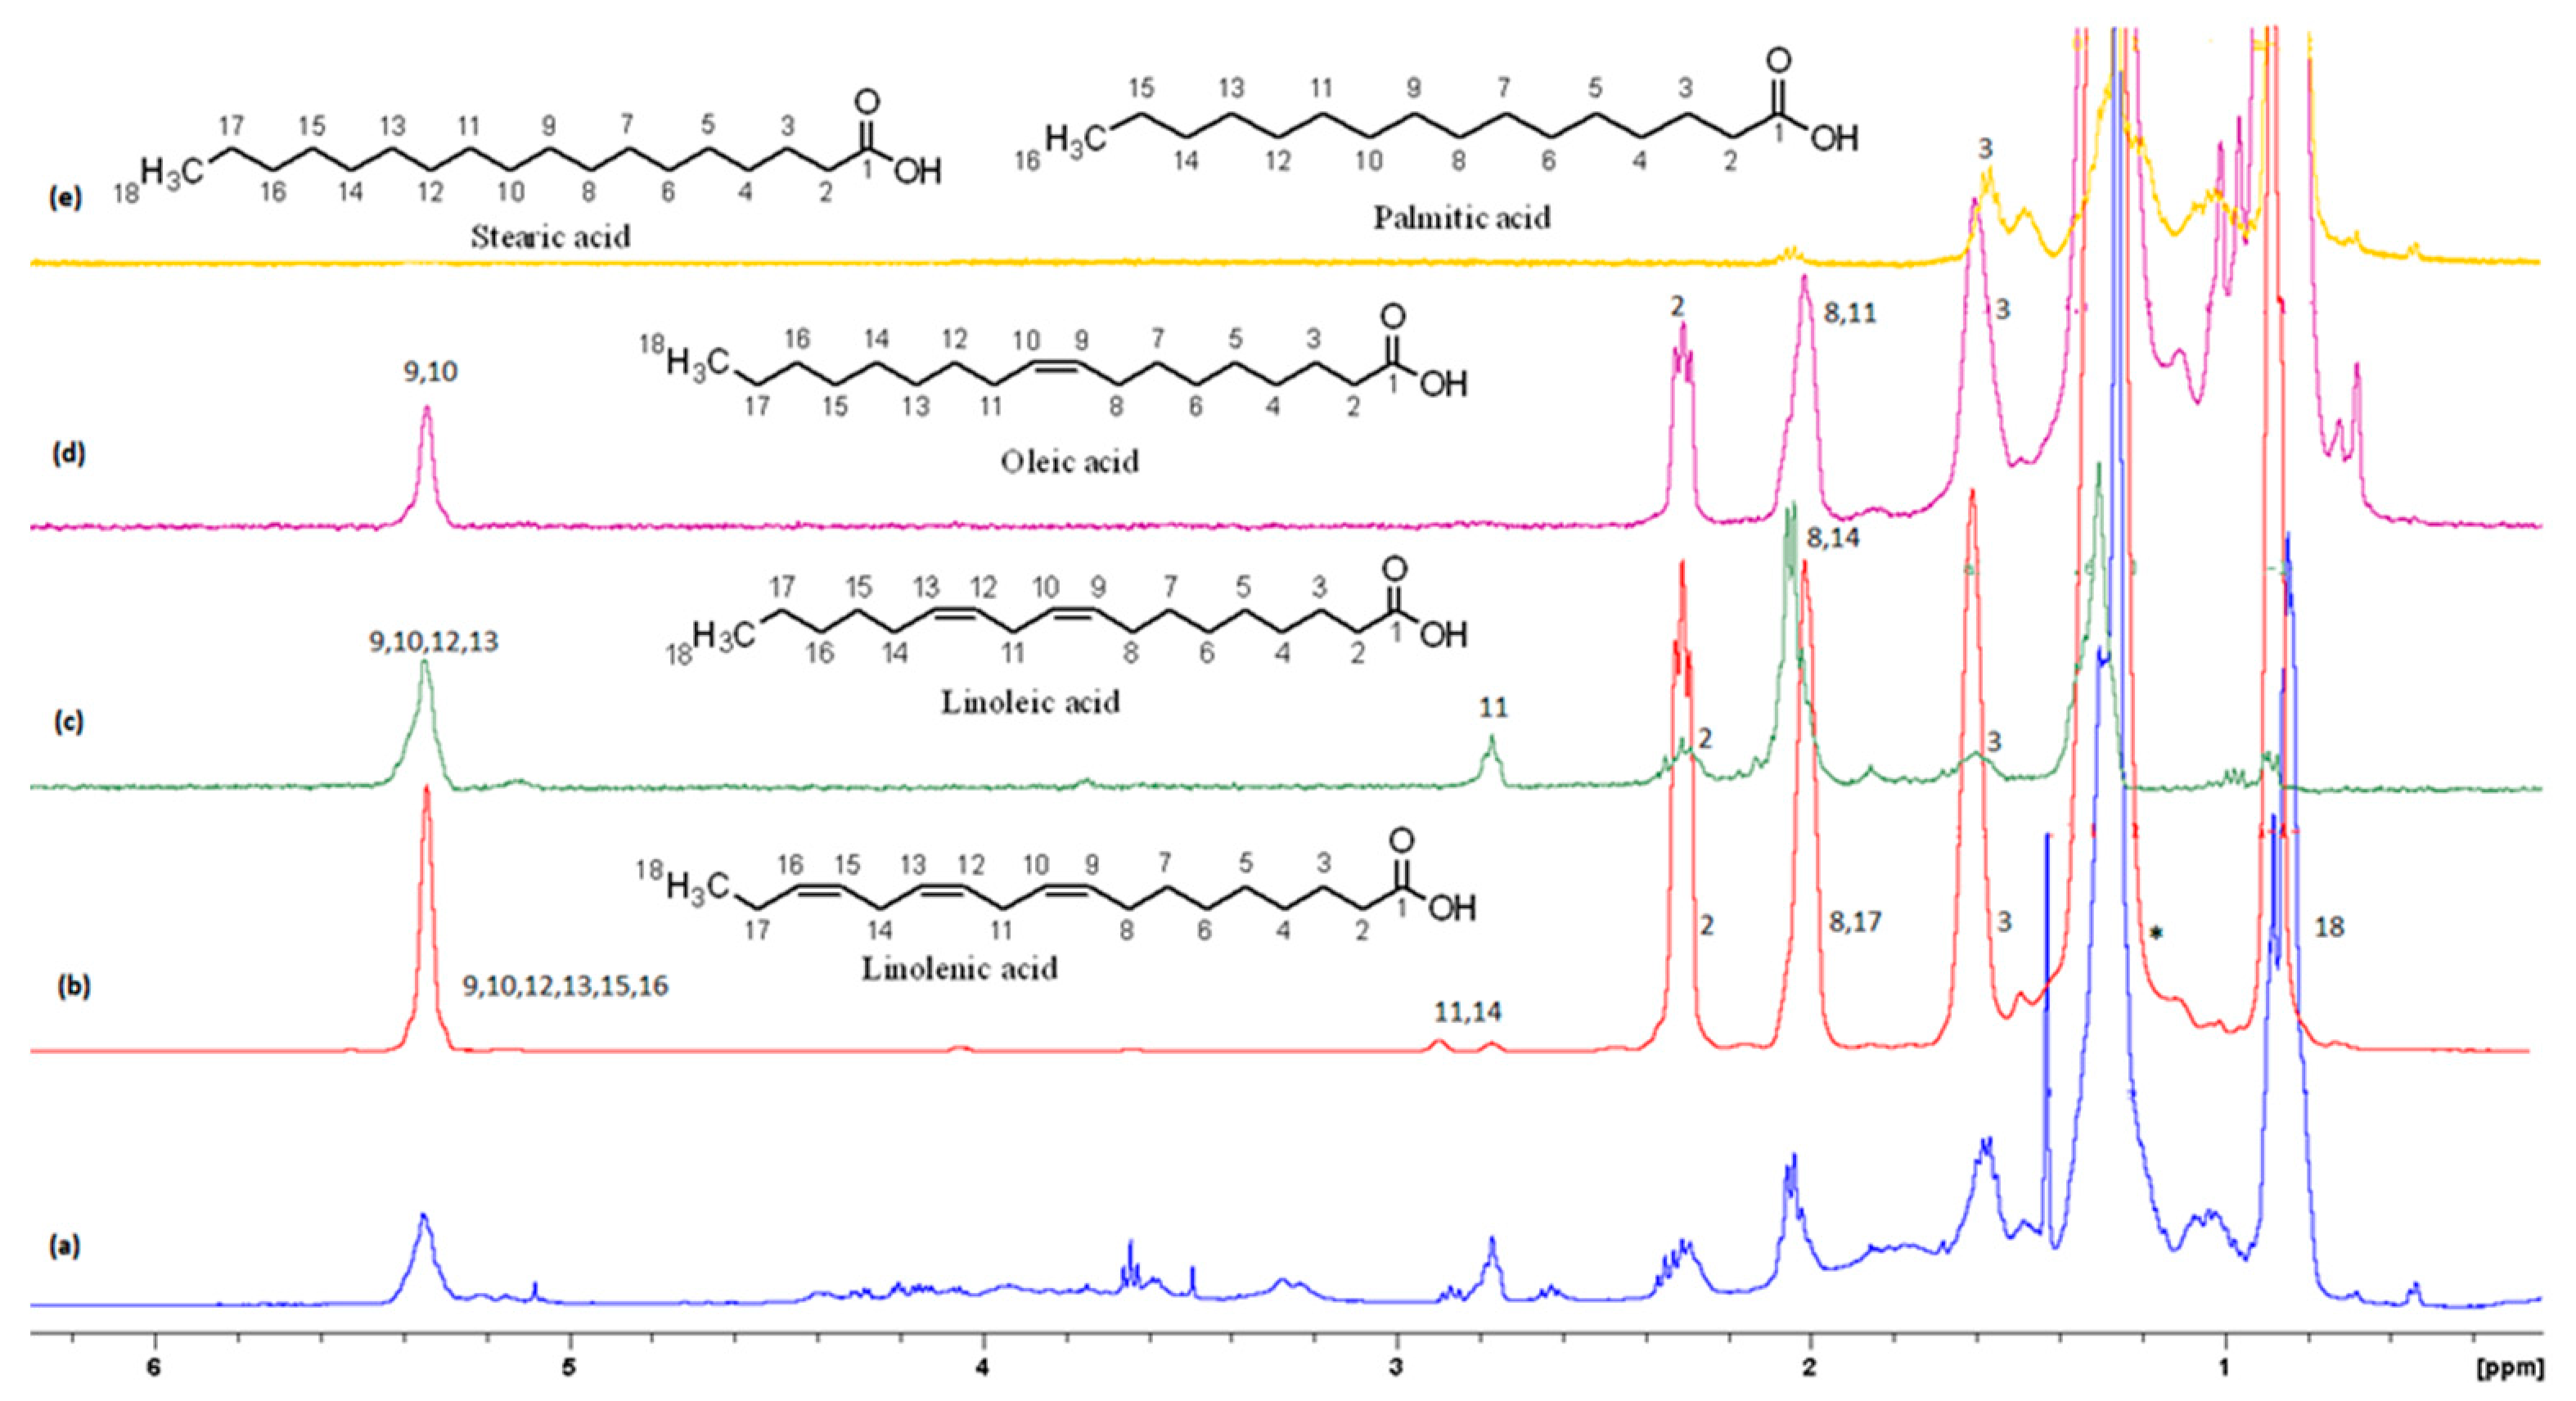
- Magritek Characterizing Fatty Acids with advanced multinuclear NMR methods. Magritek-Spin Solve 2018, 6.
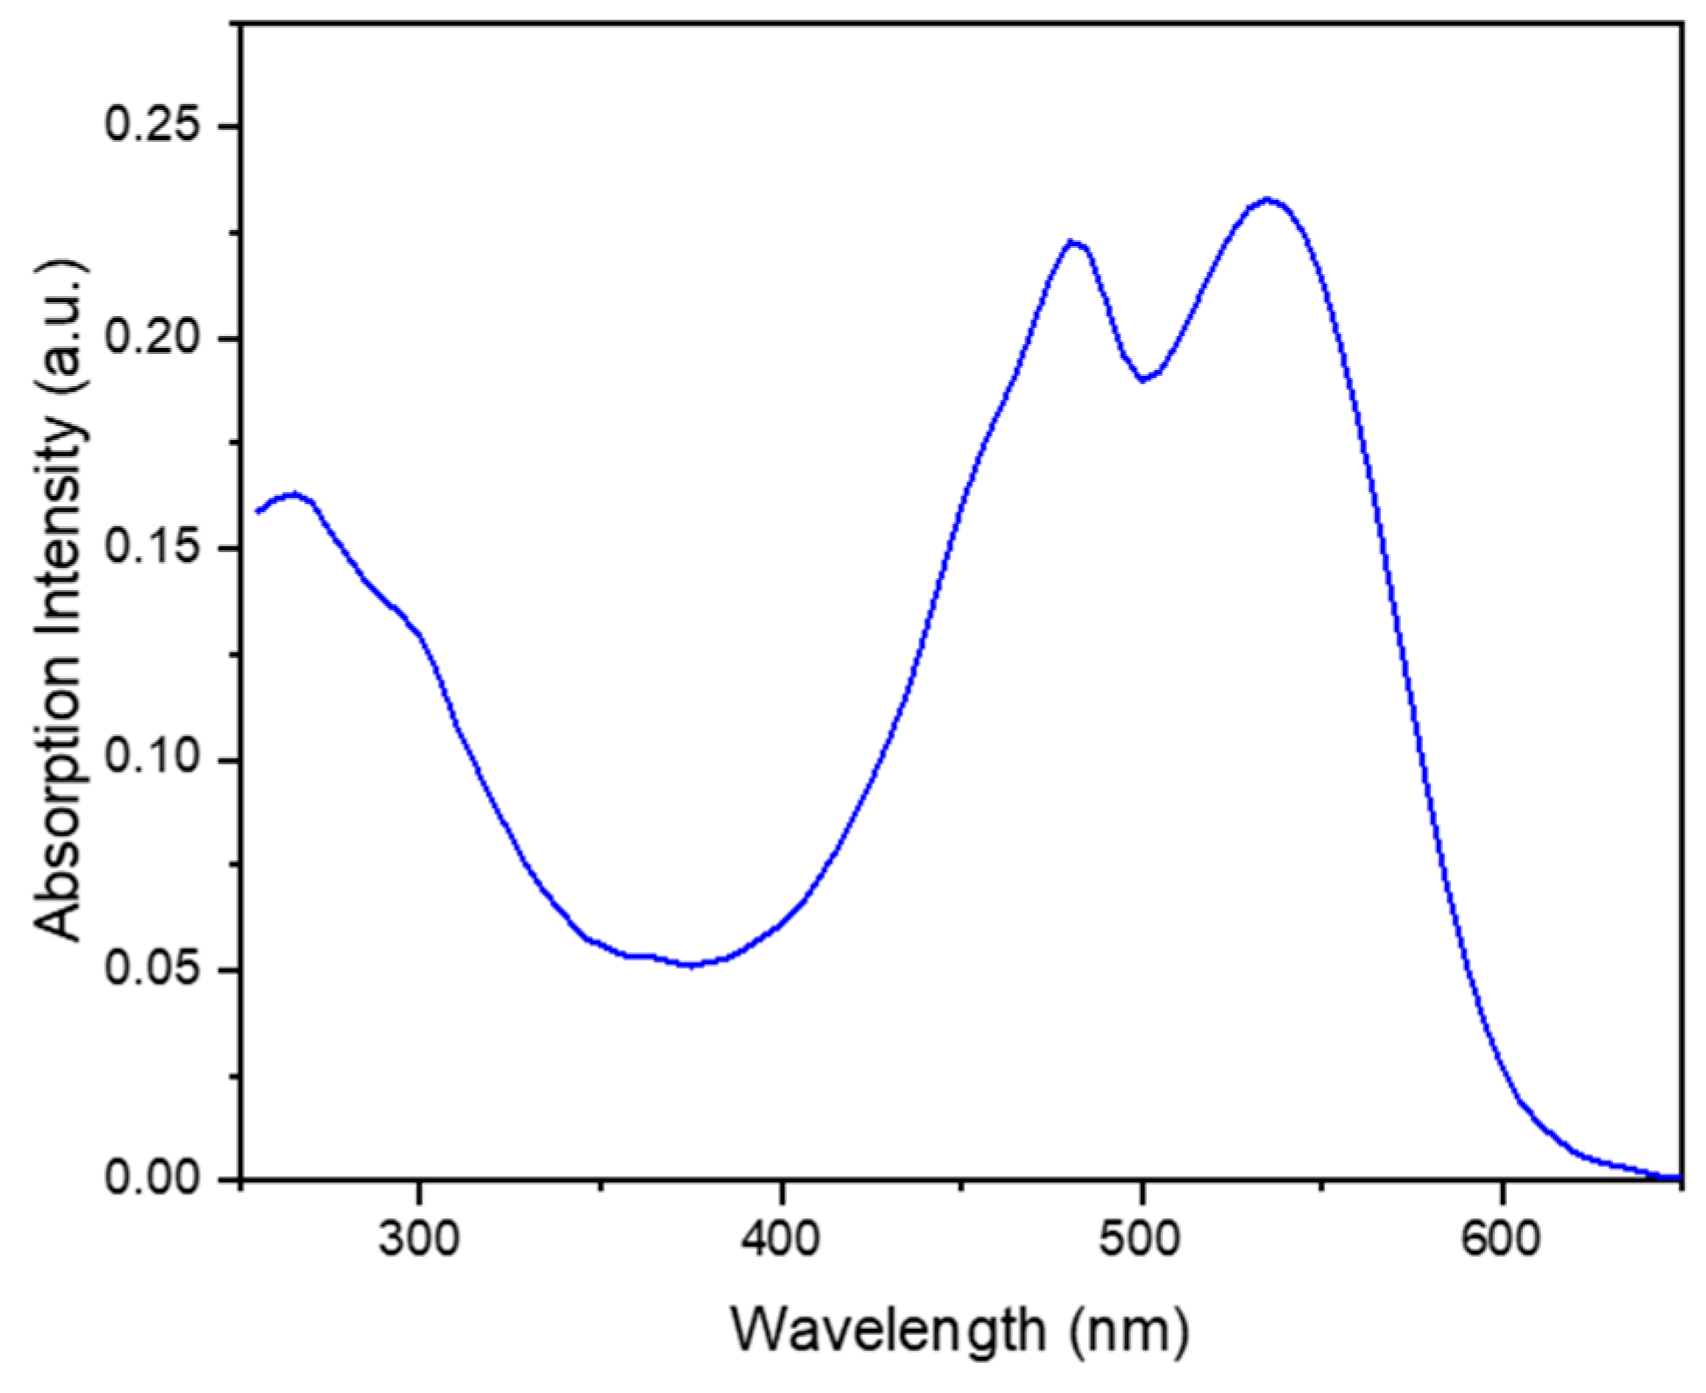
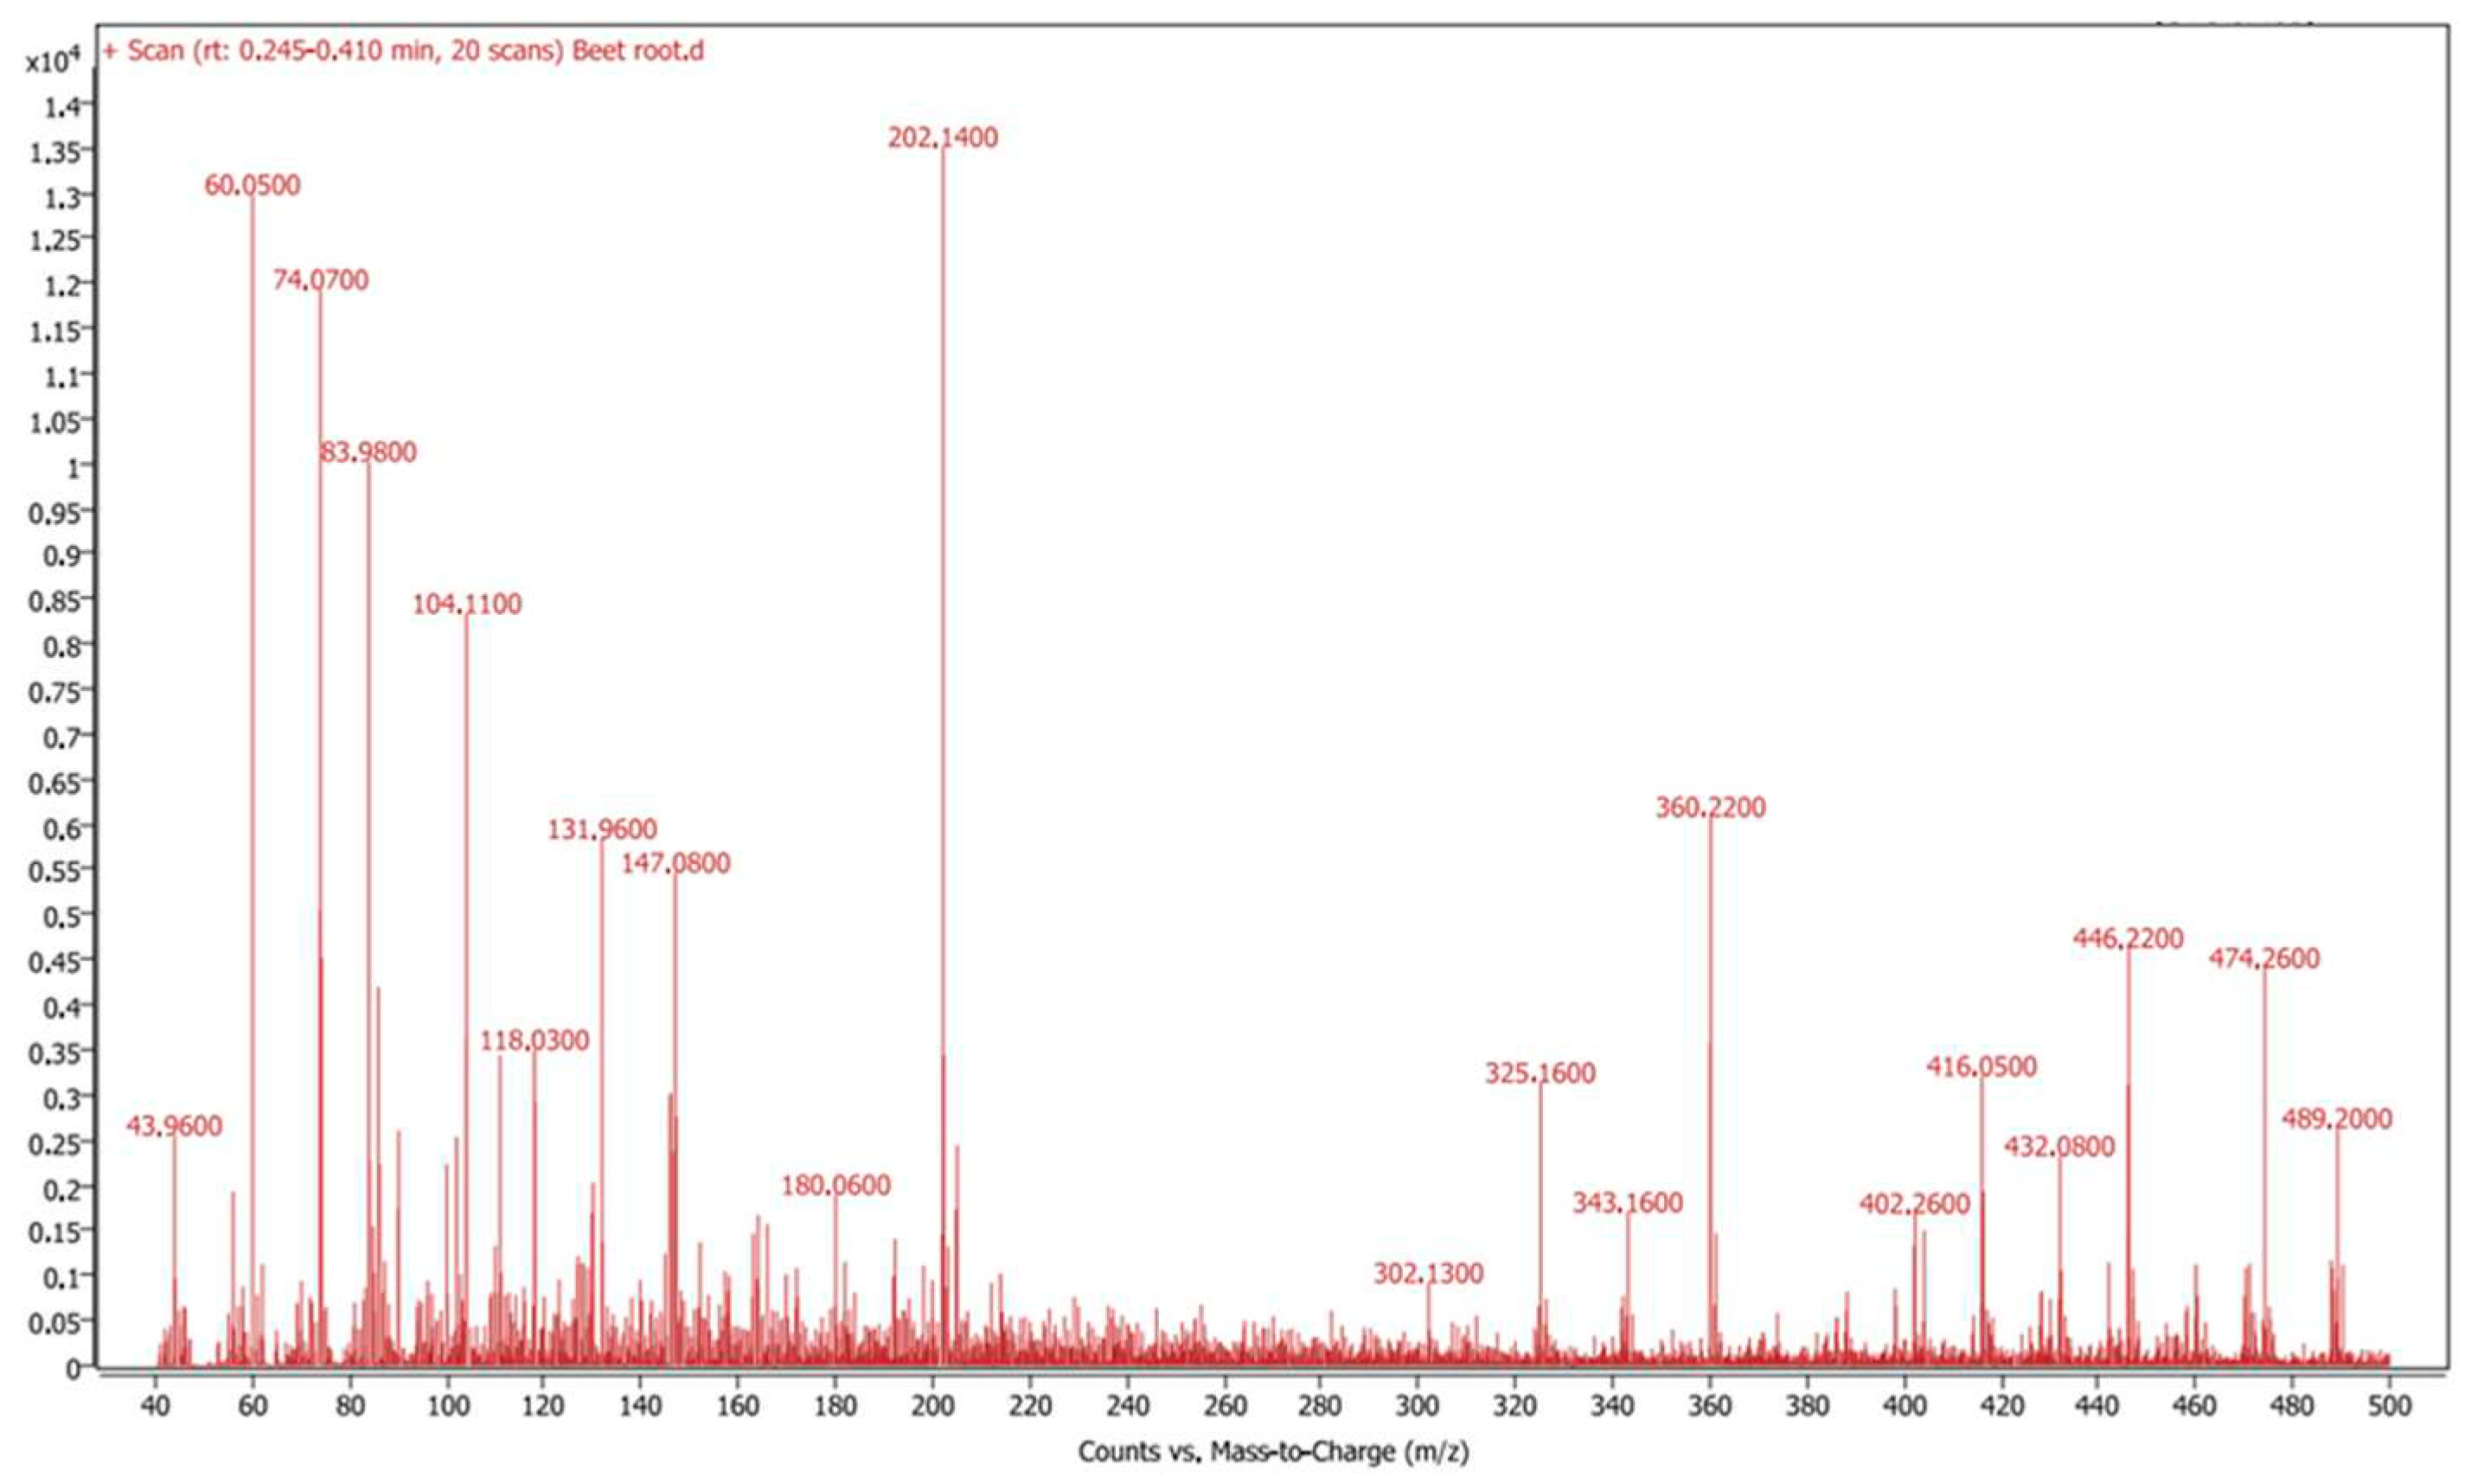
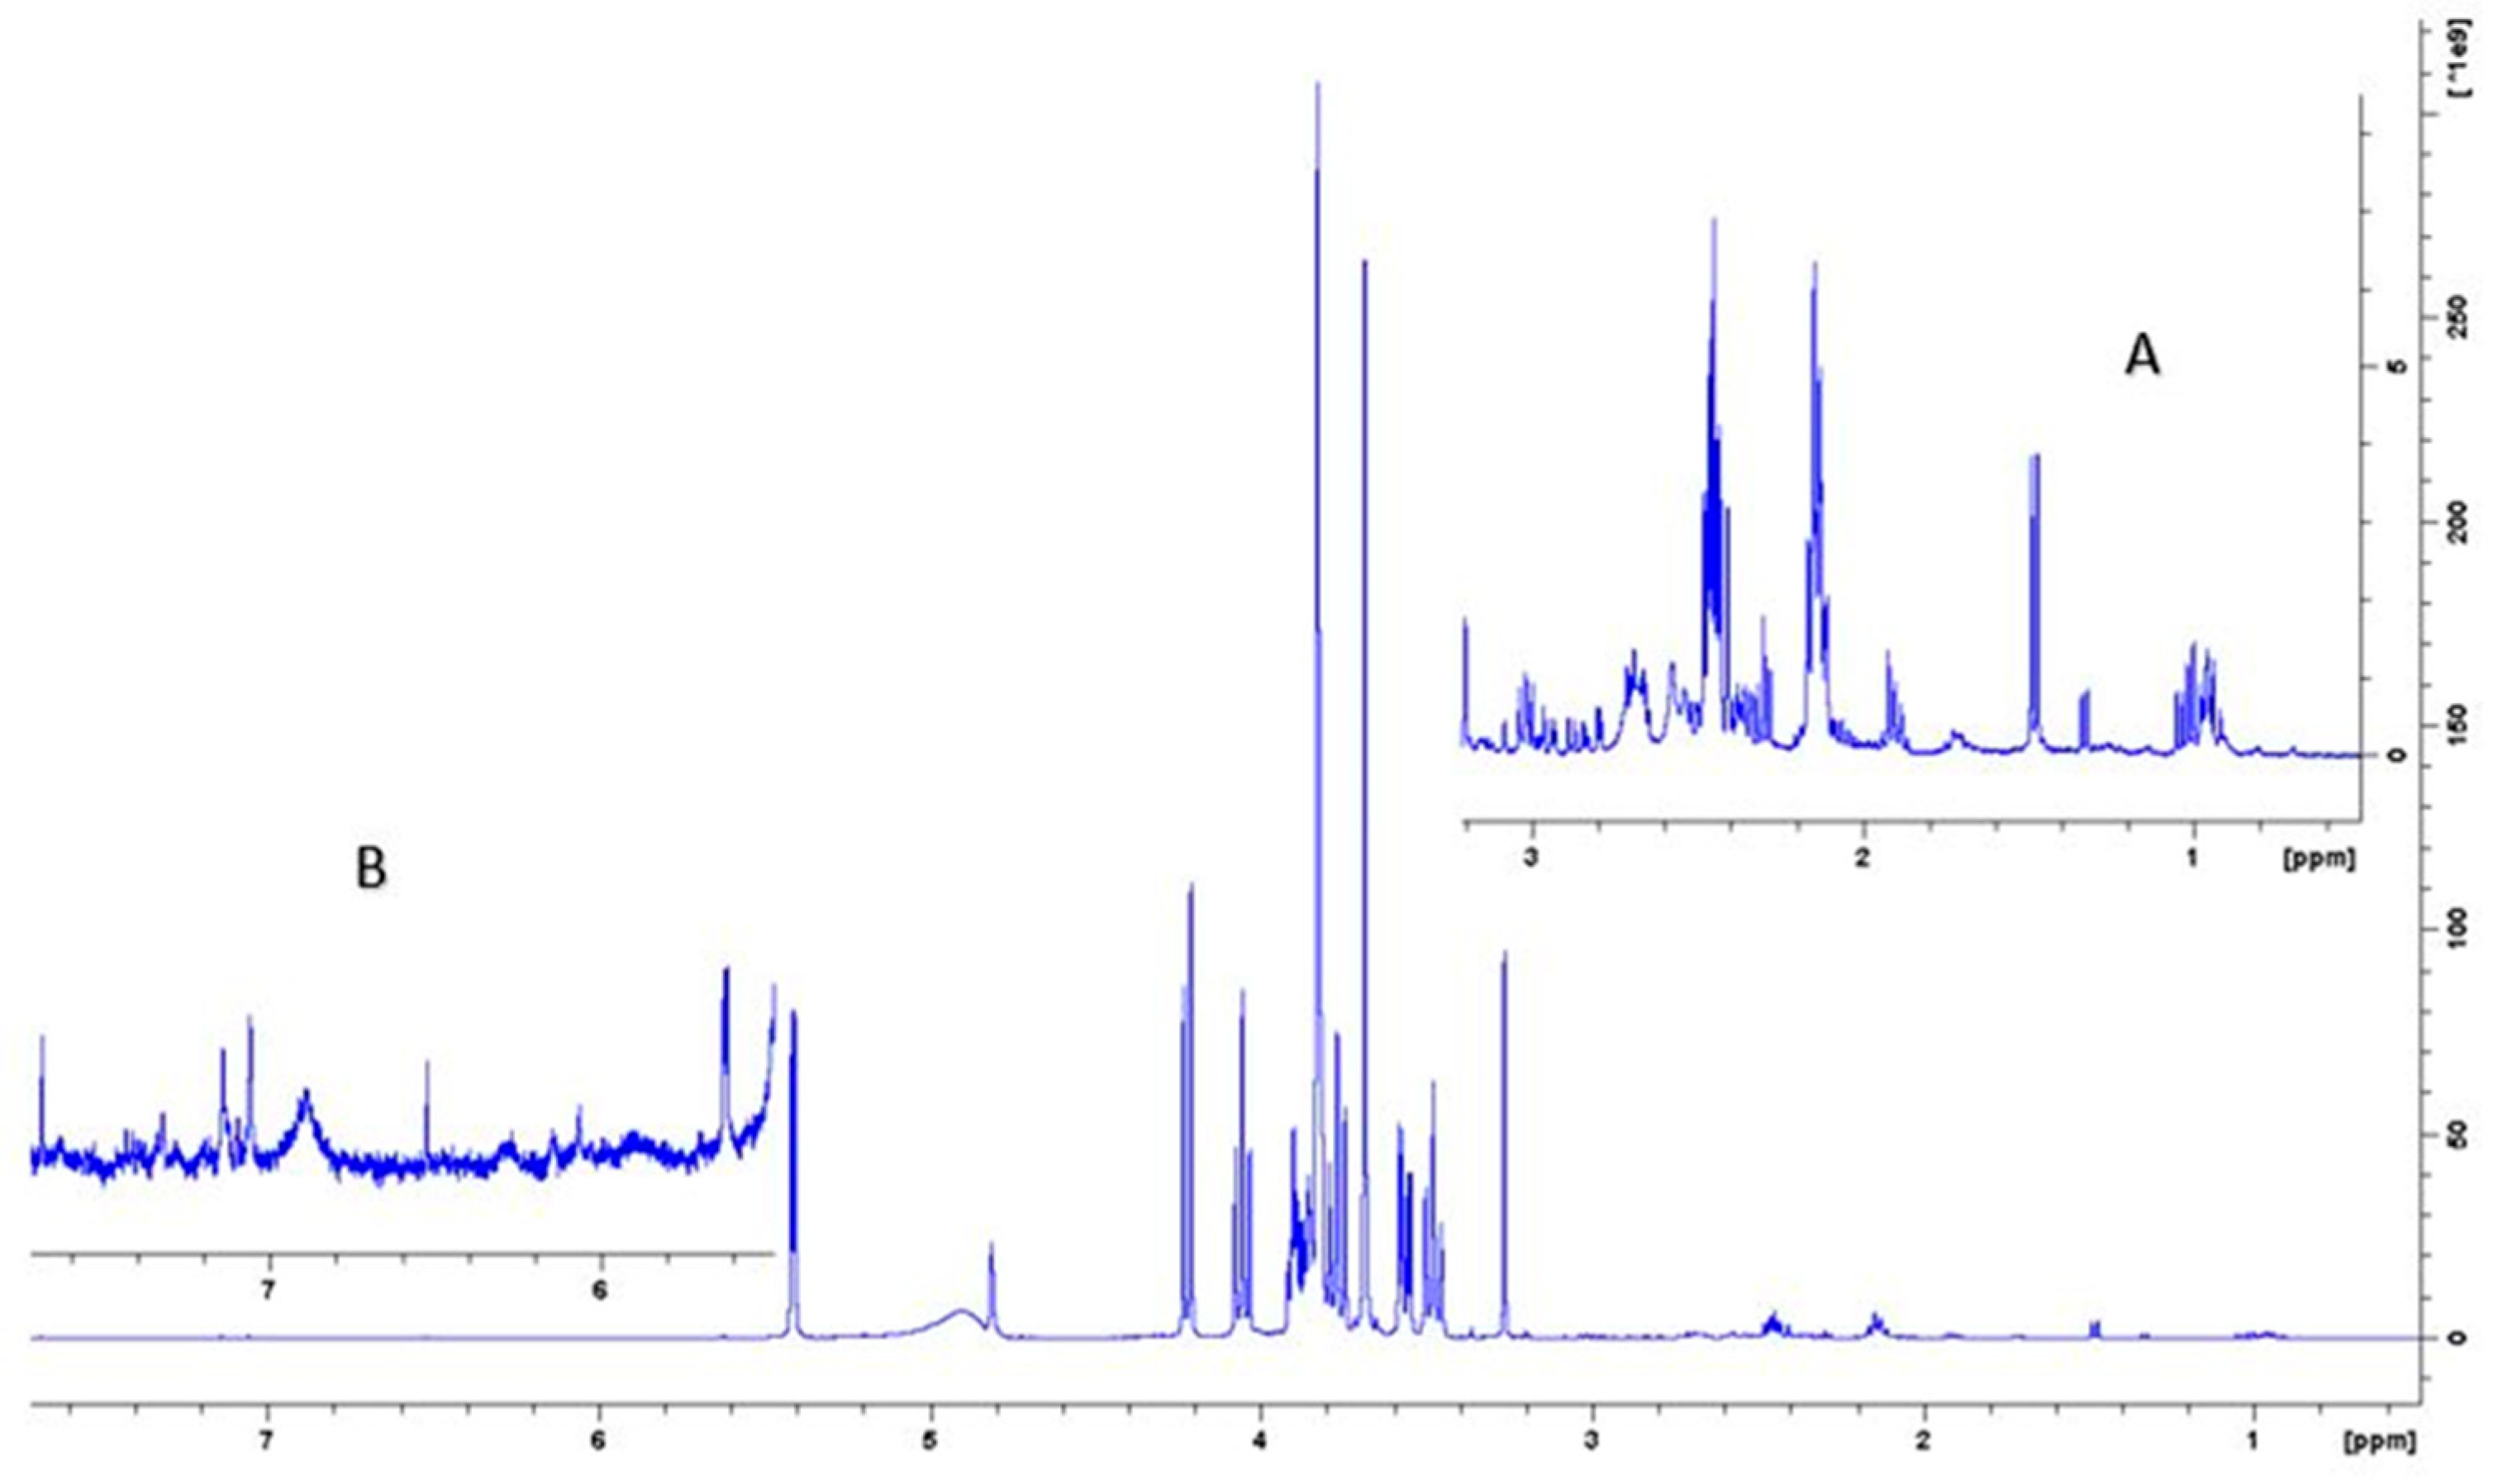
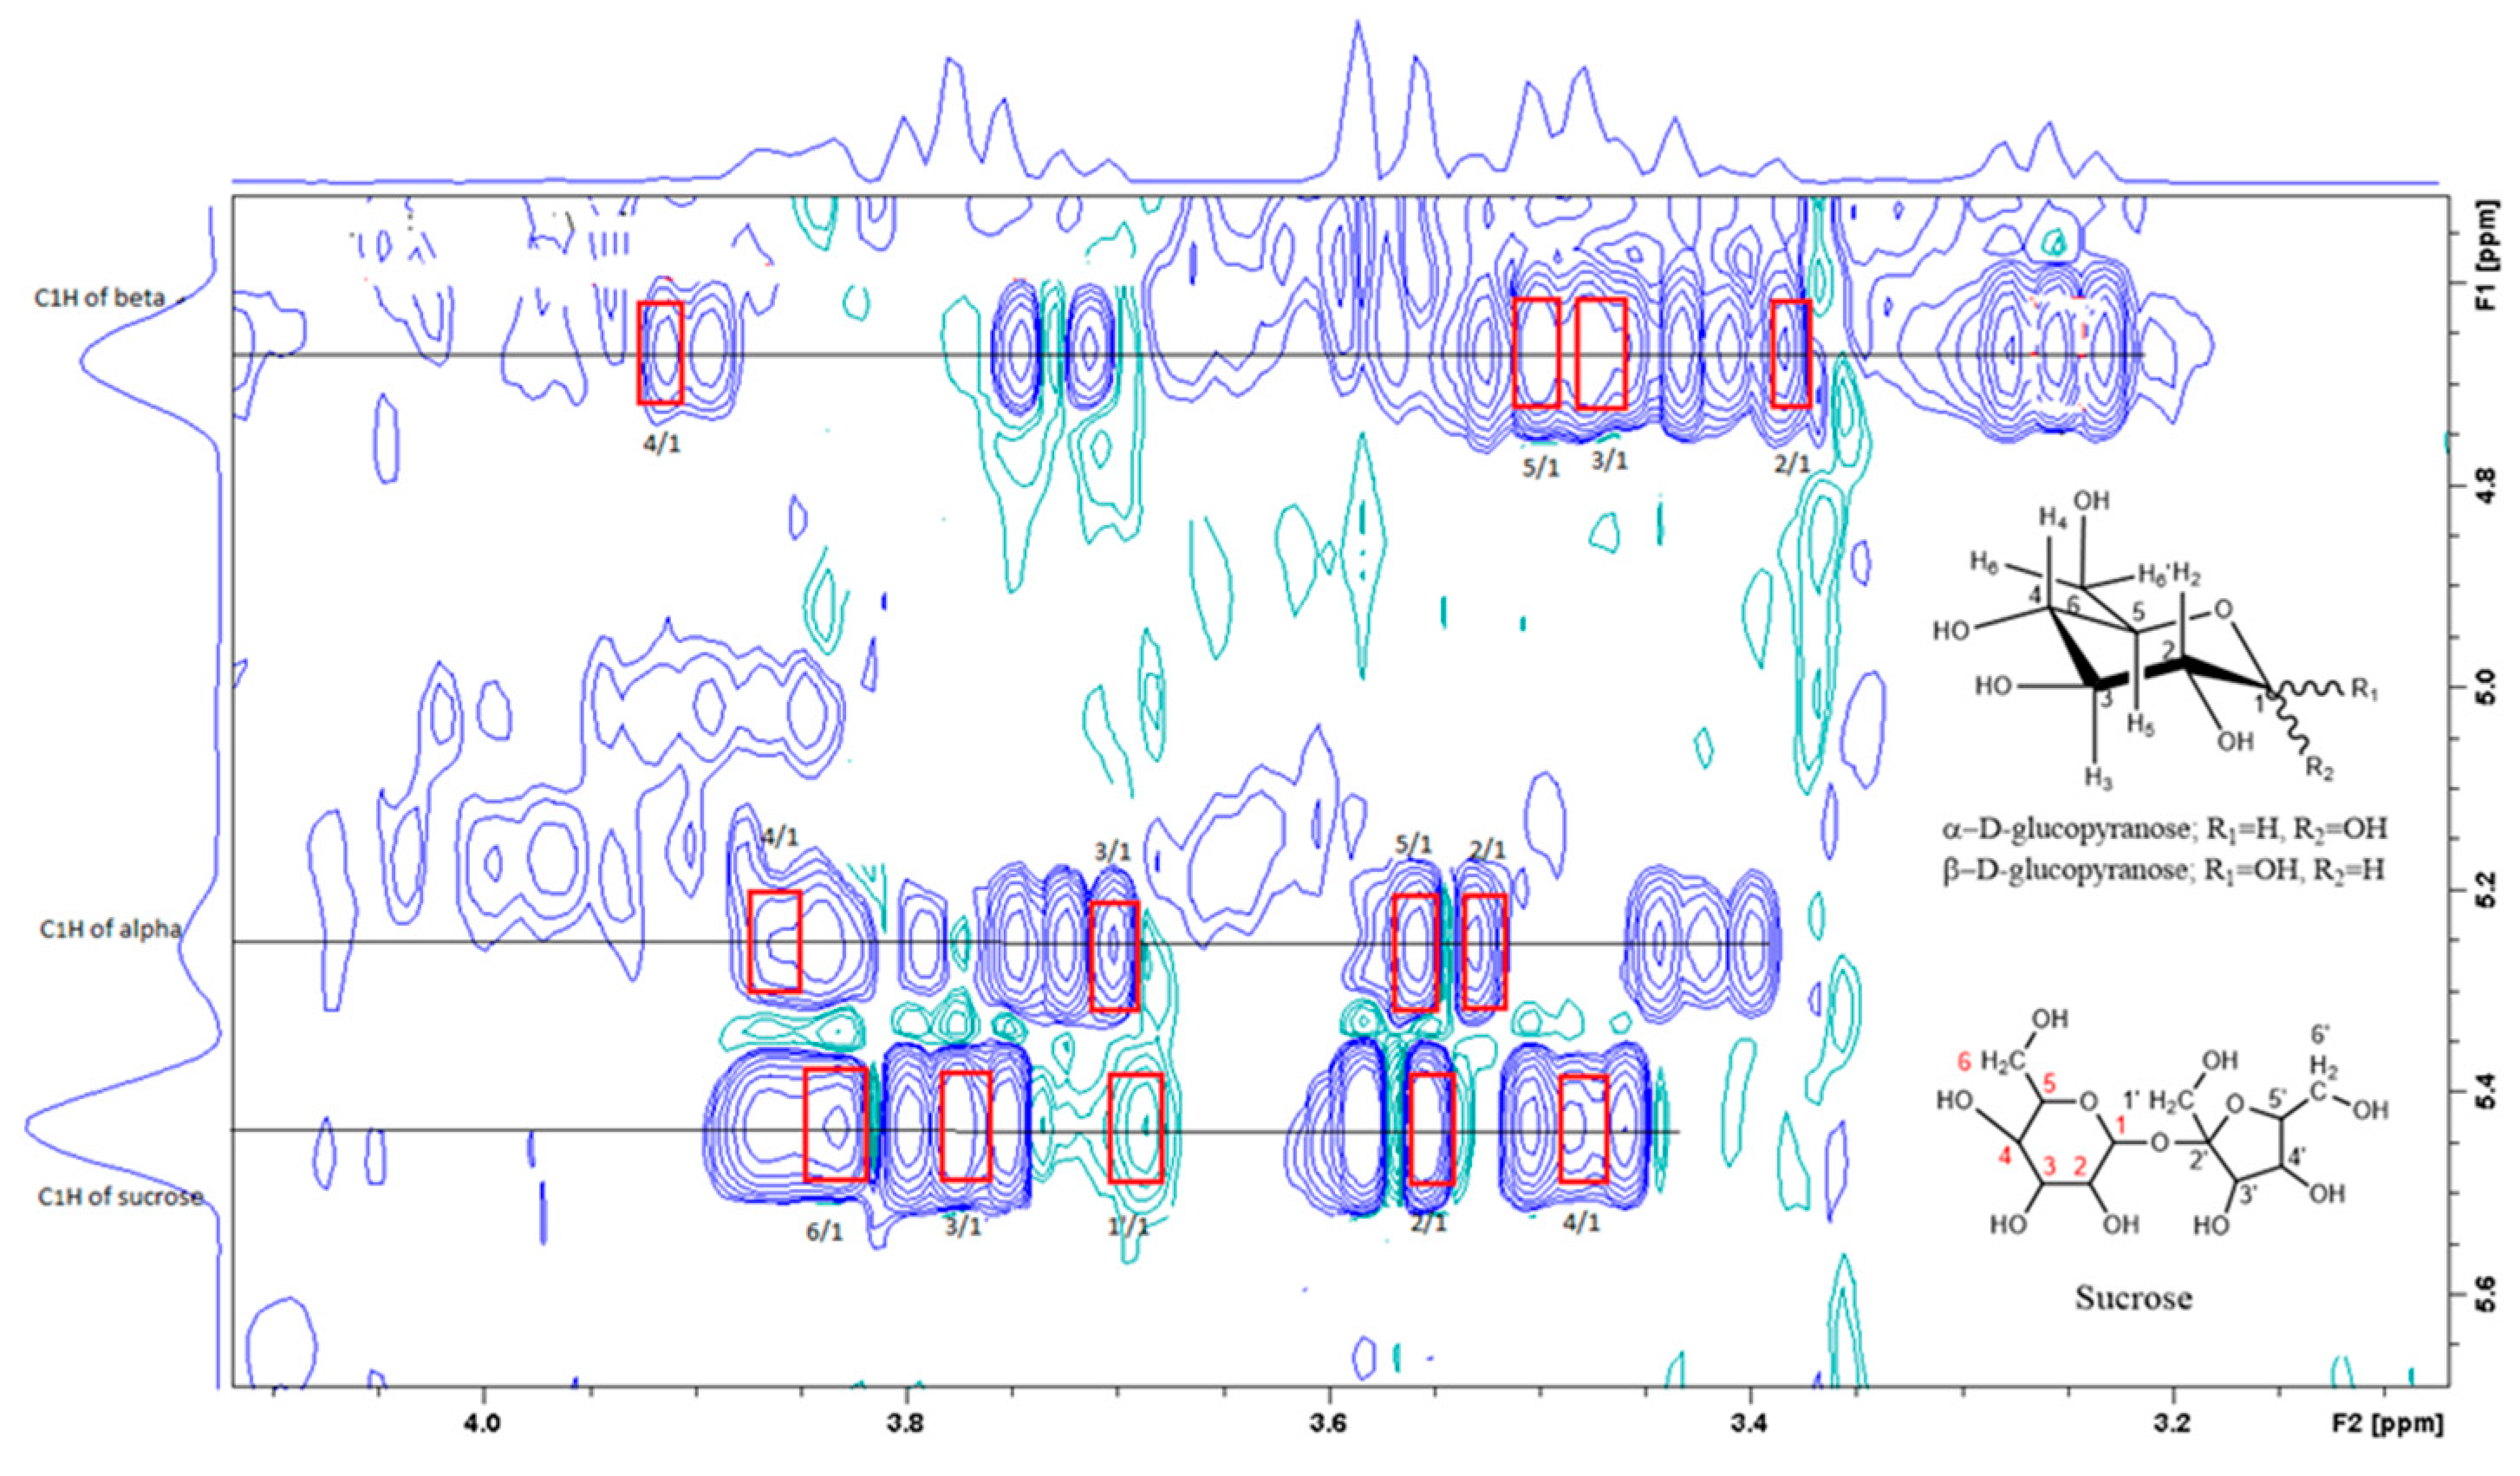
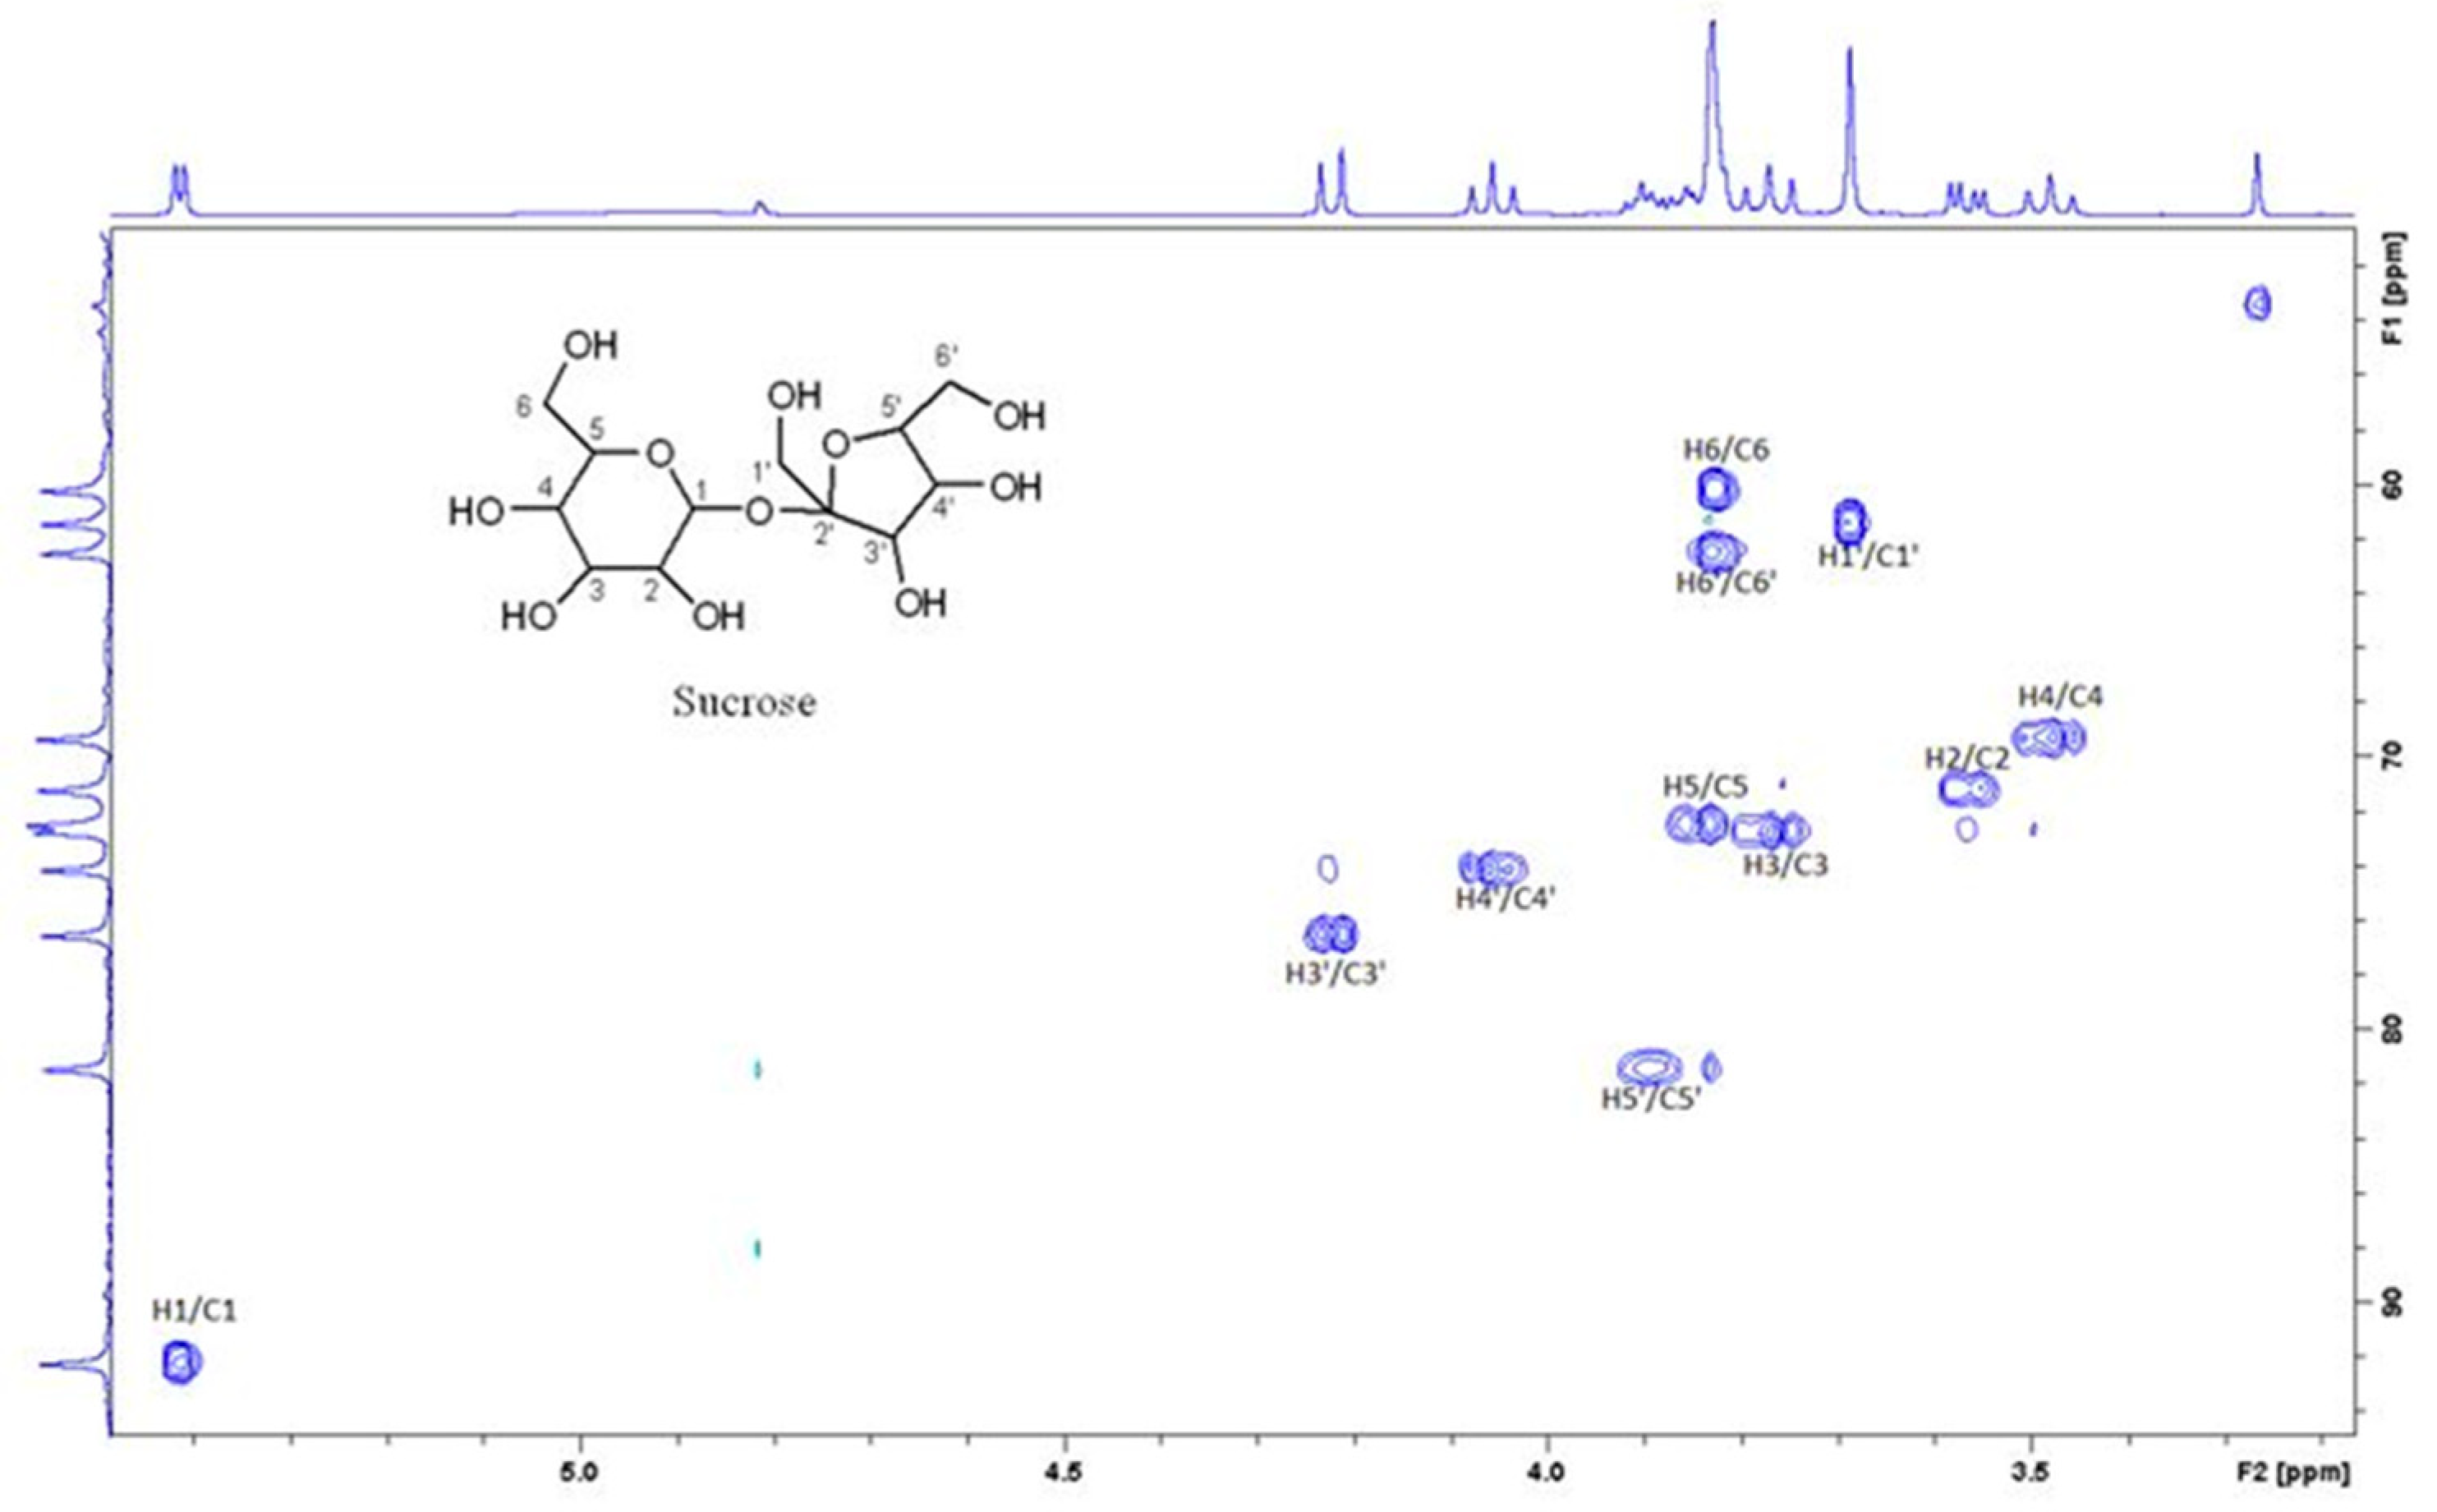
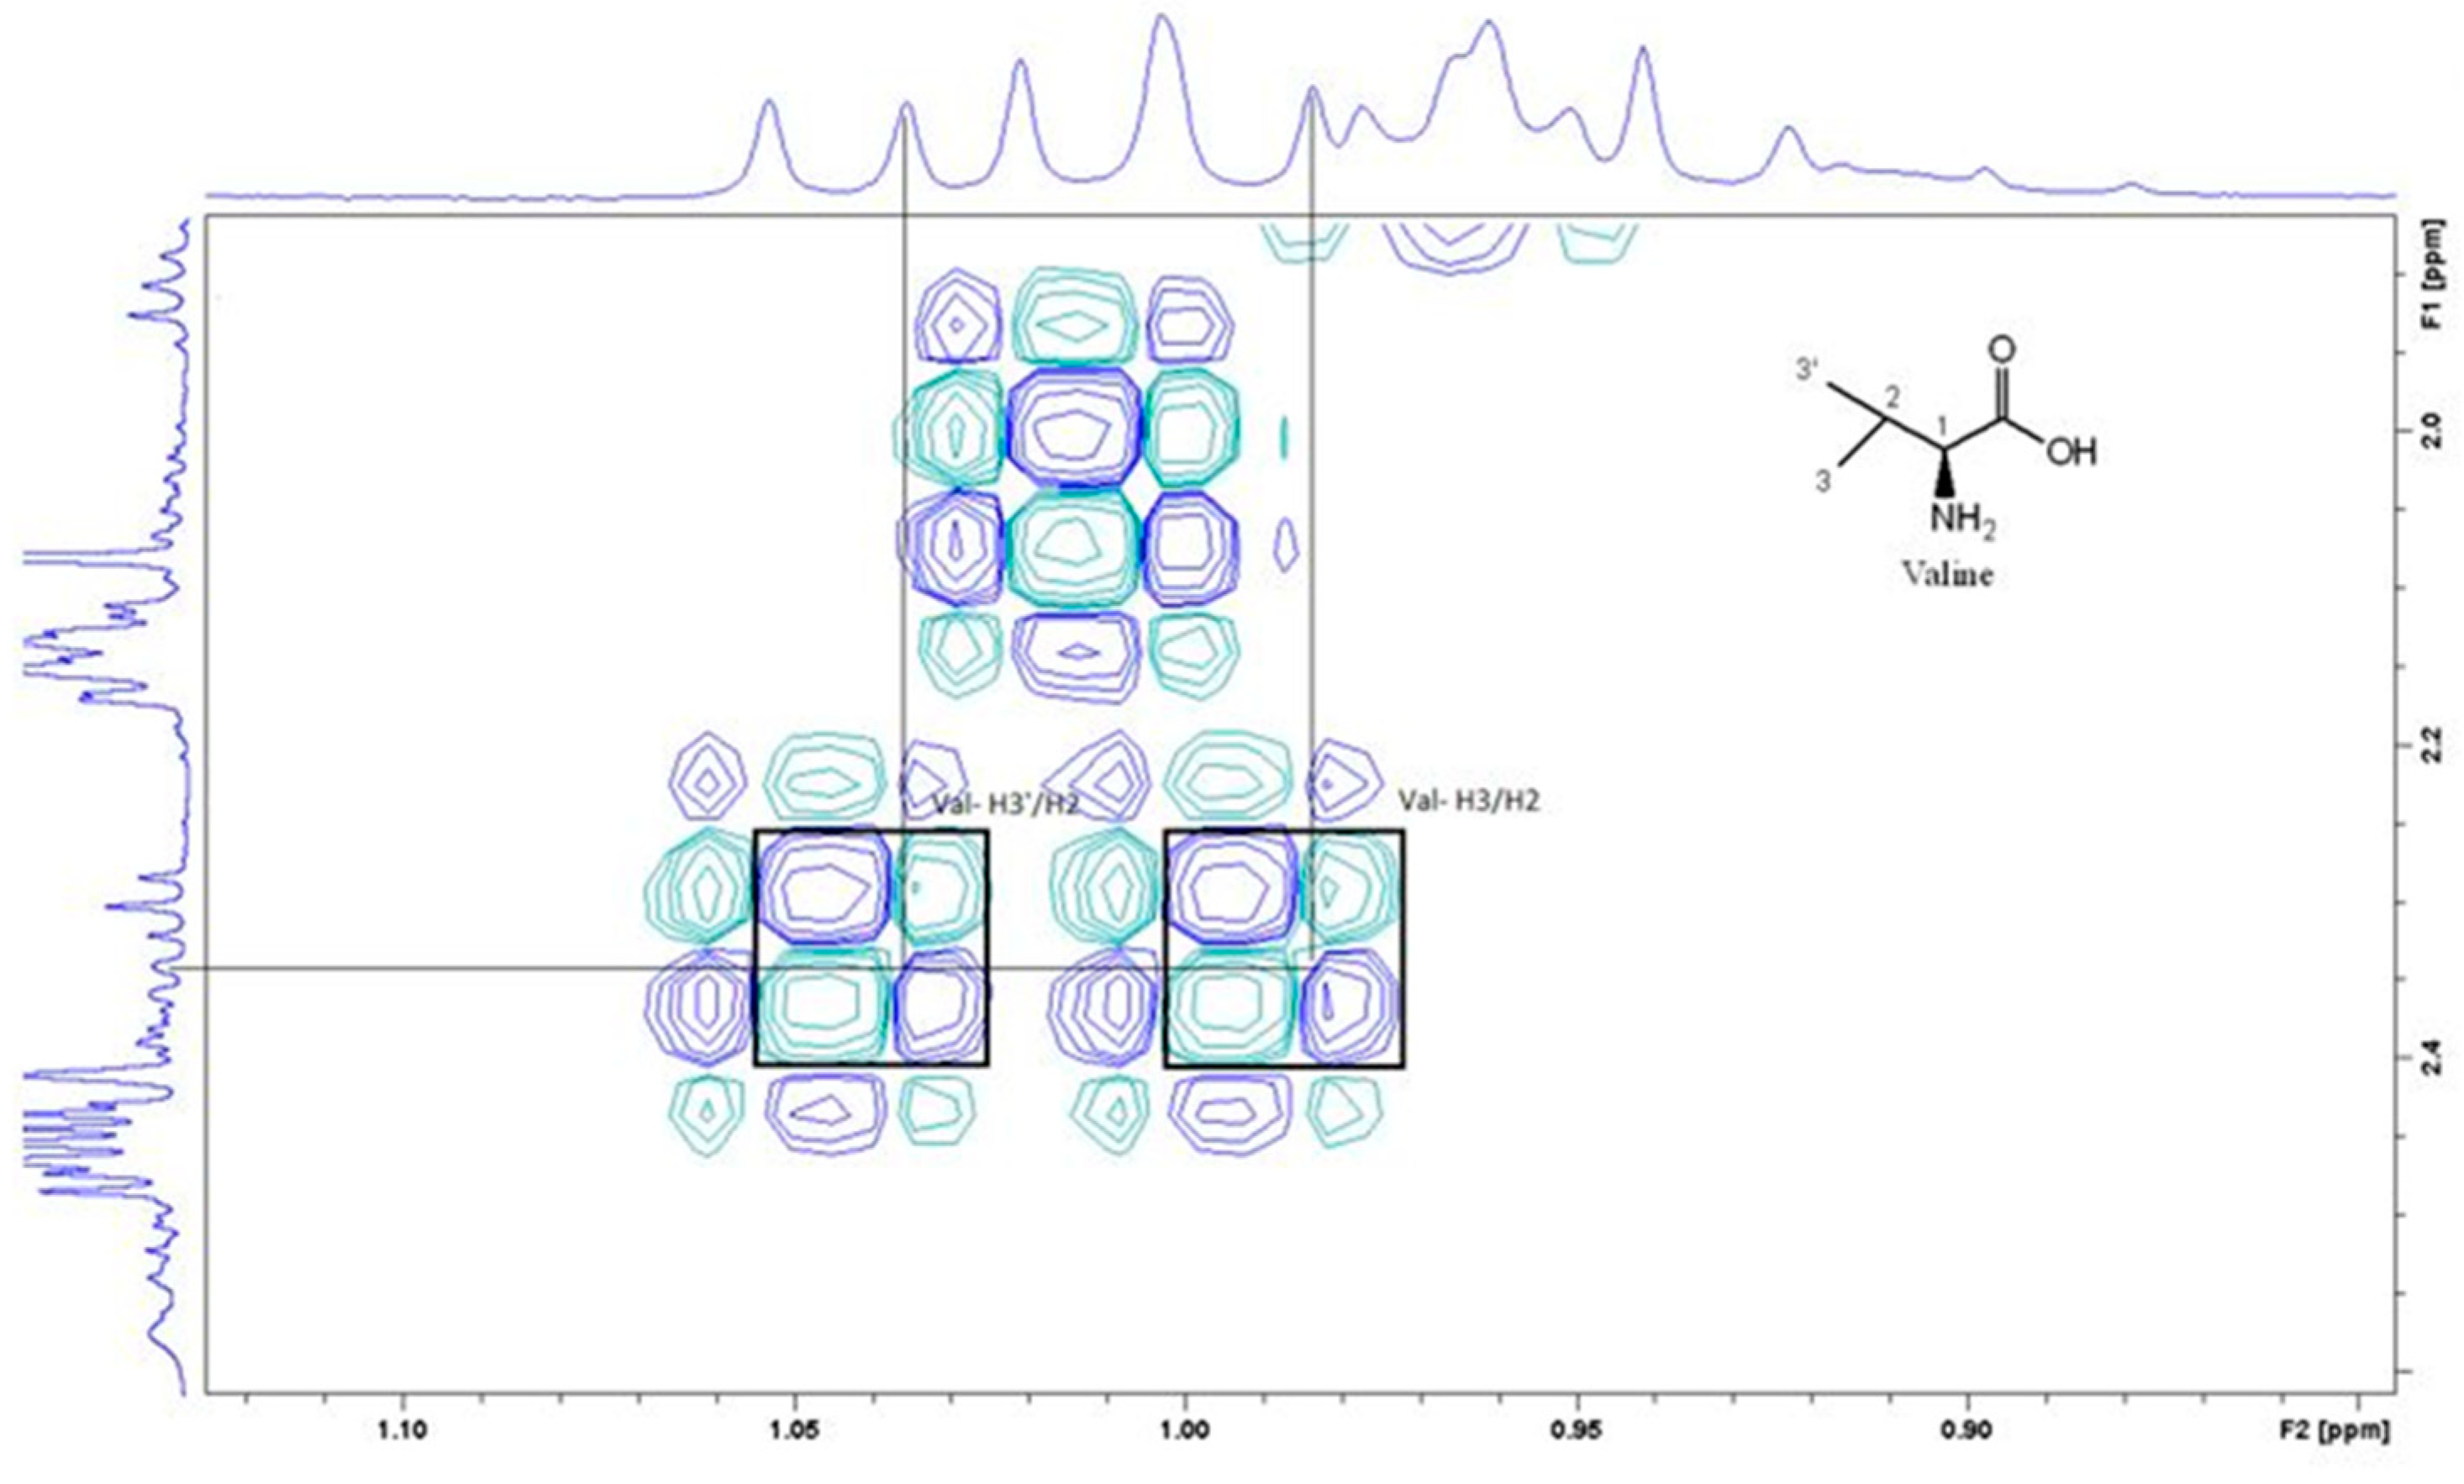
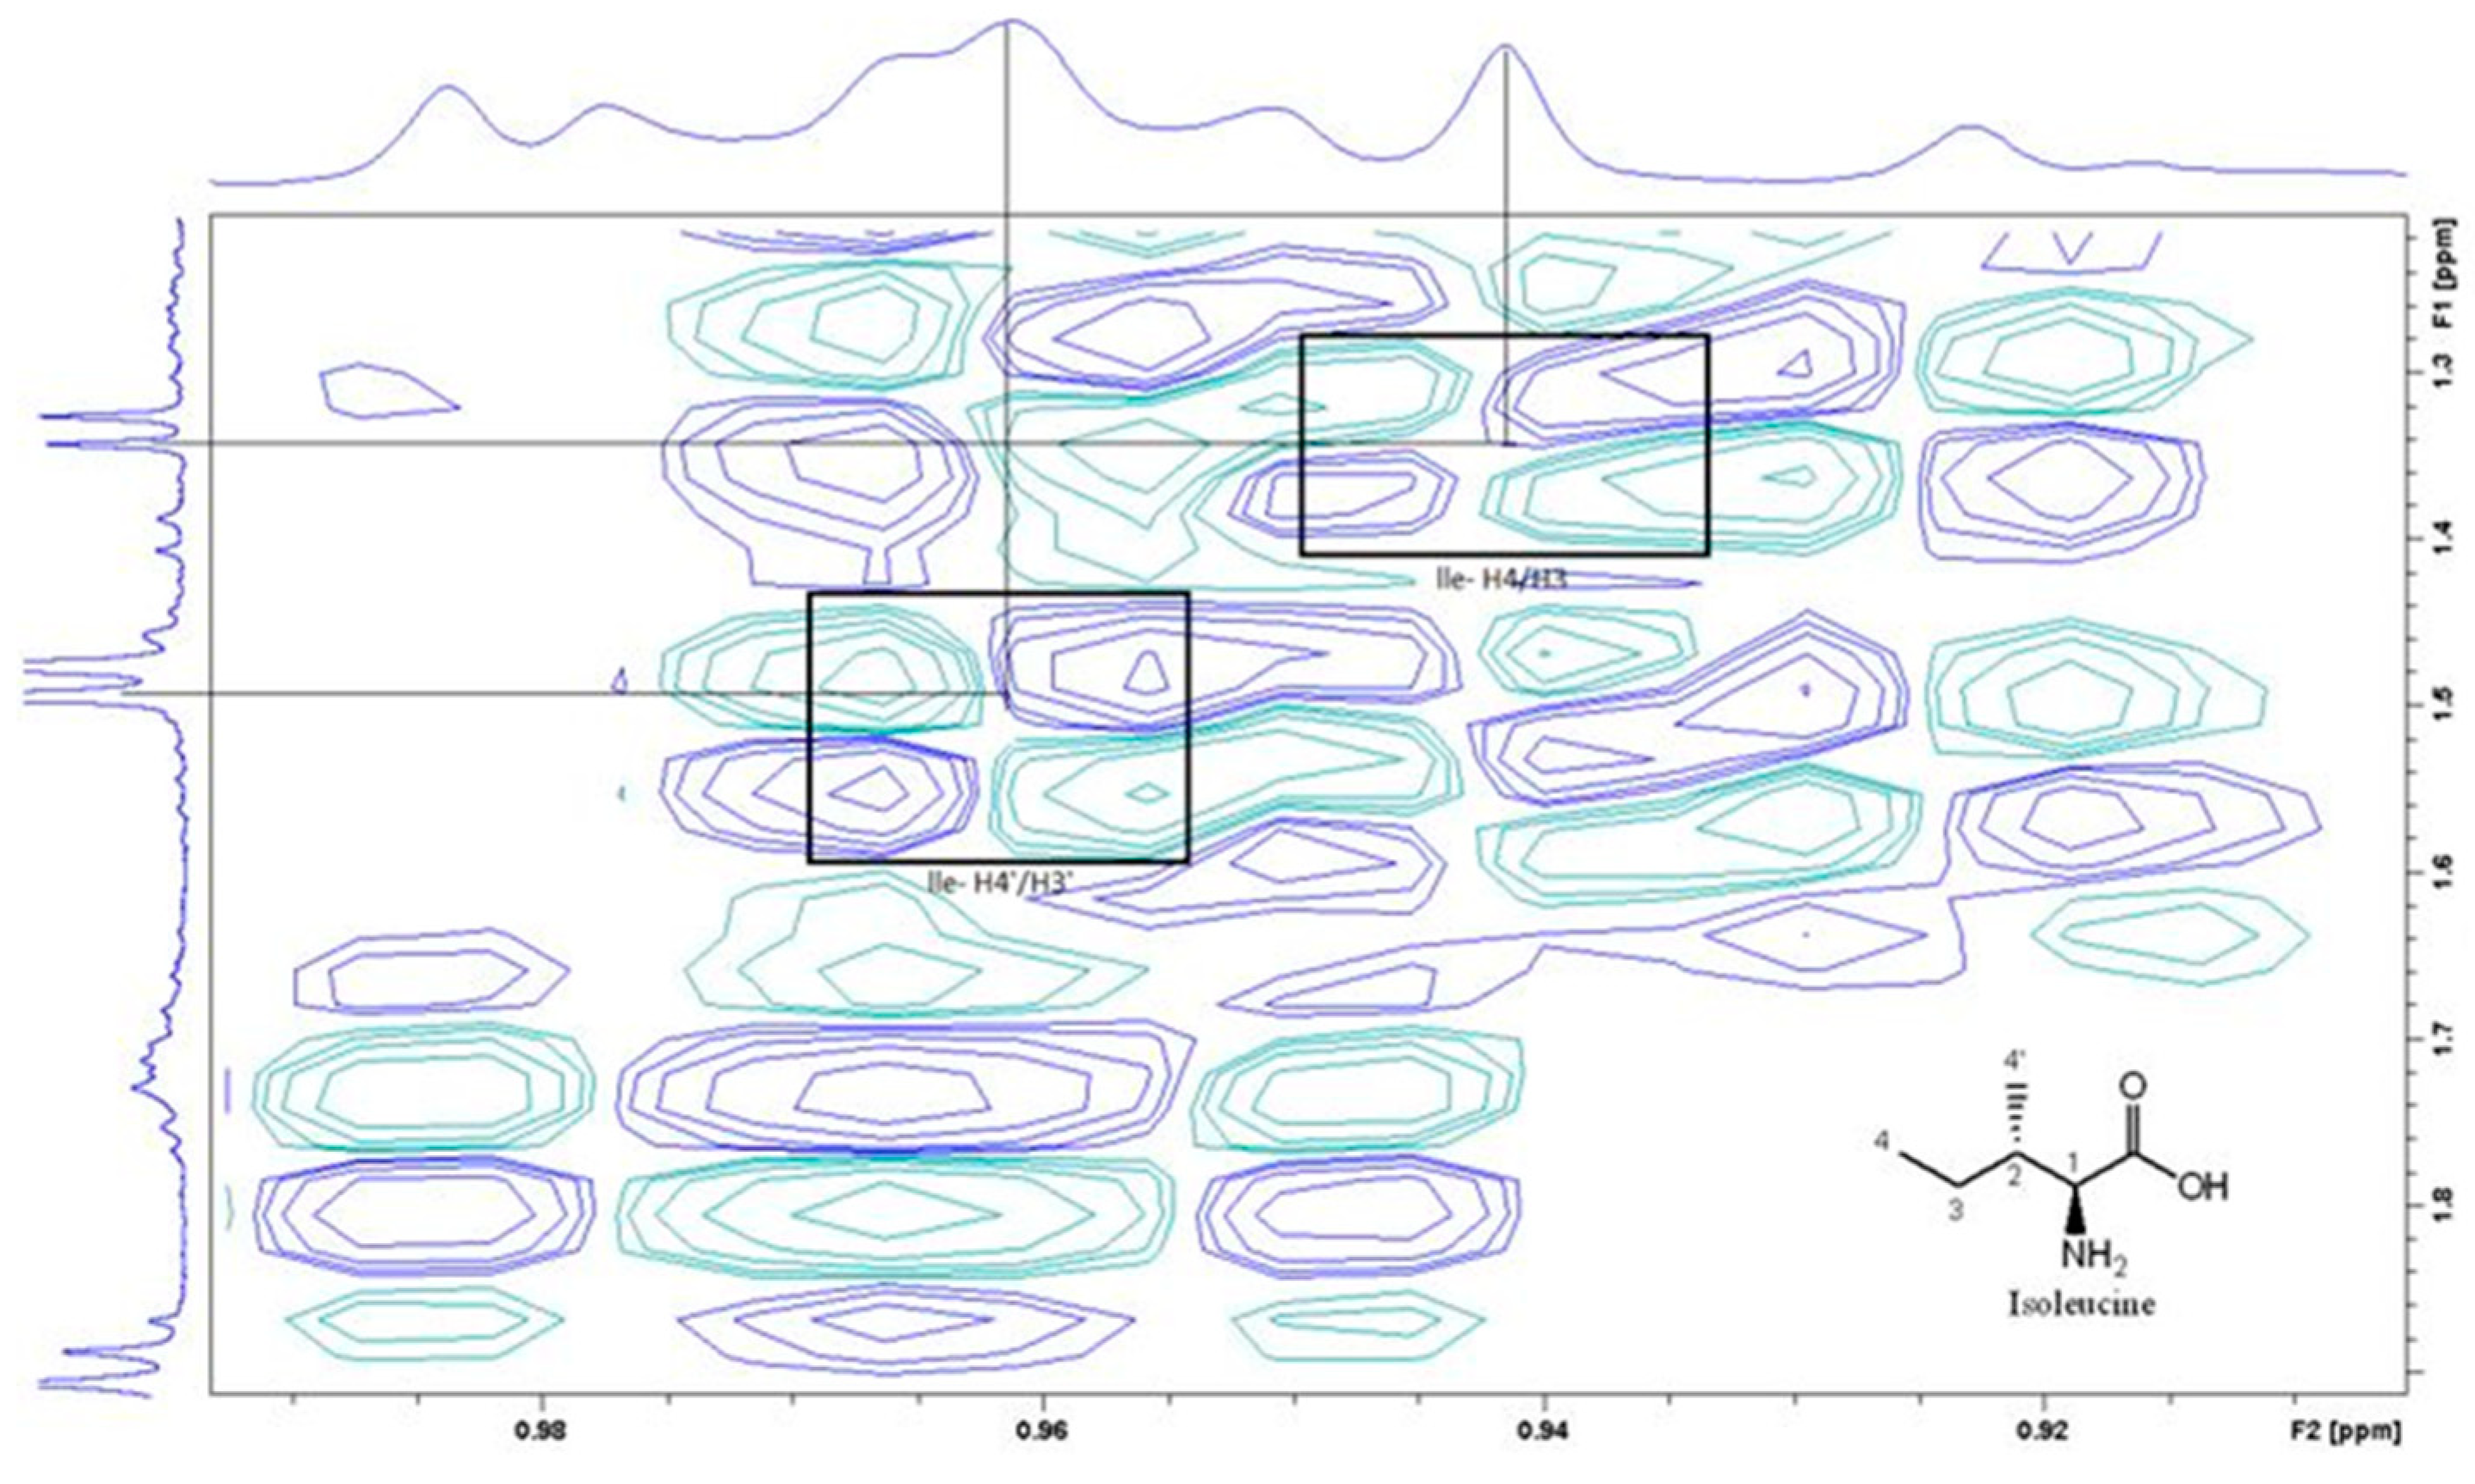
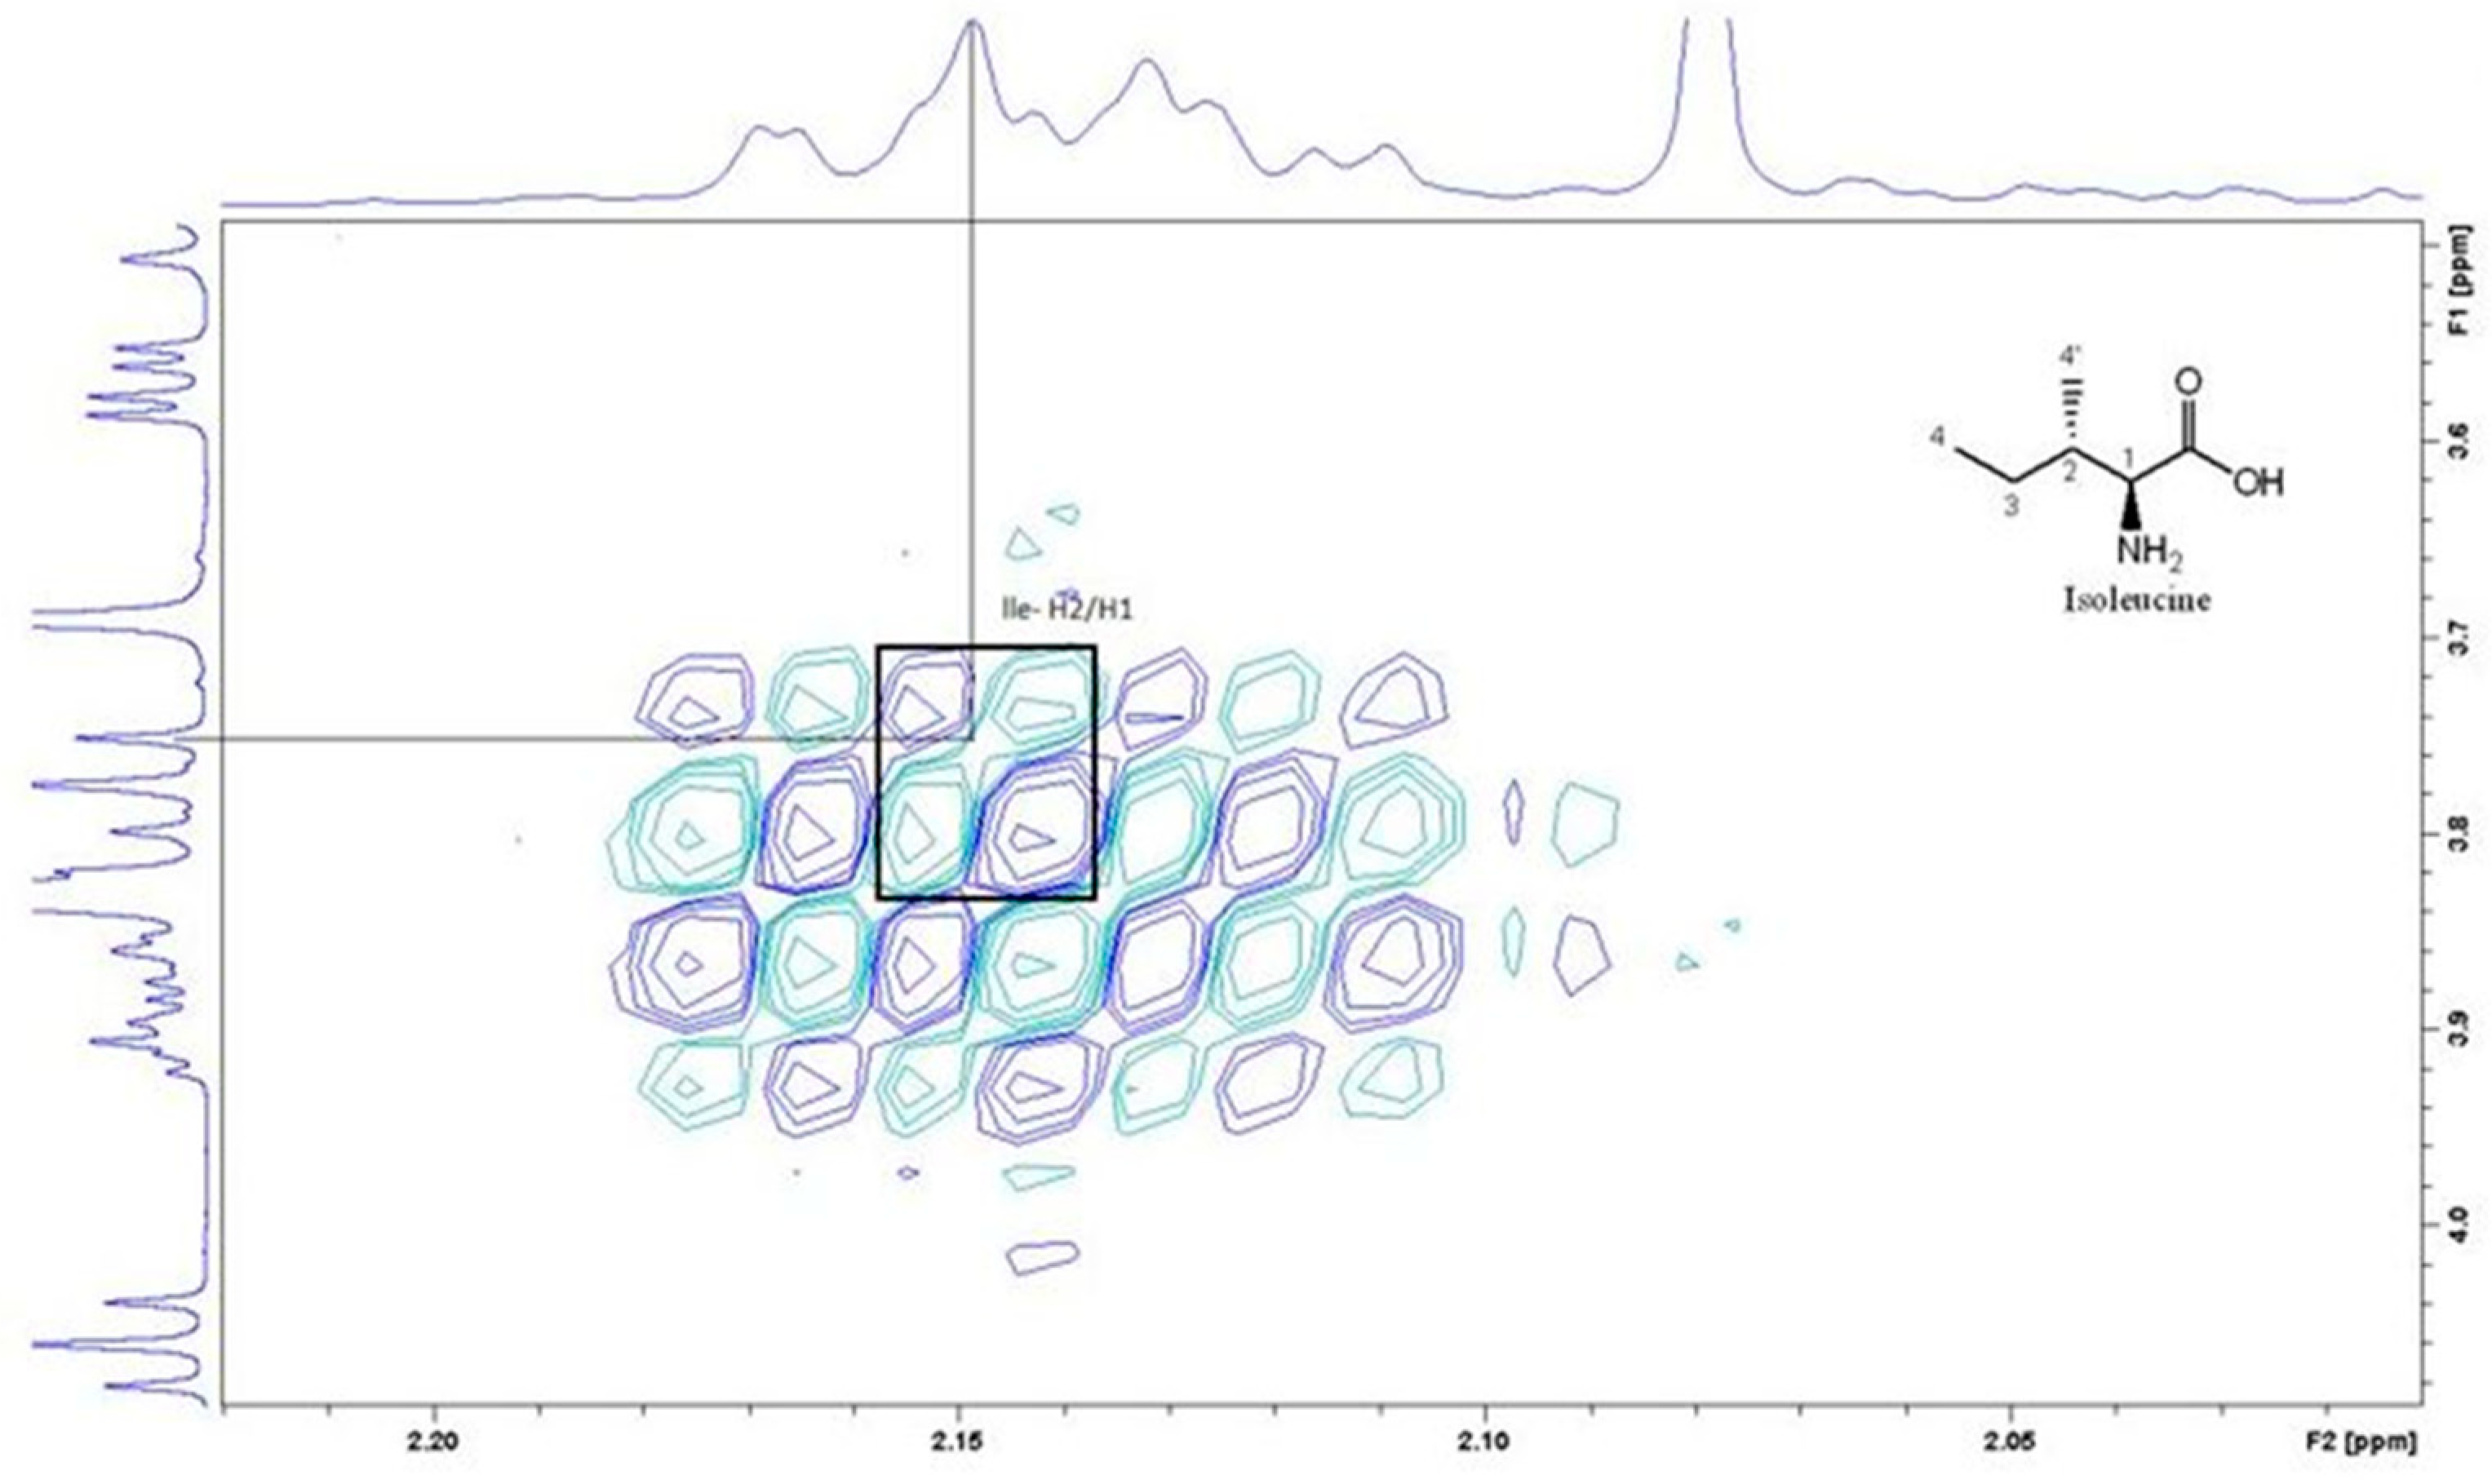
| Compound | Molecular formula | Measured [M+H]+(m/z) | Measured Rt (min) | Standard [M+H]+(m/z) | Rt (min) of standard | Confirmed by NMR |
|---|---|---|---|---|---|---|
| Lysine | C6H14N2O2 | 147.1131 | 0.58 | 147.1126 | NA | No |
| Histidine | C6H9N3O2 | 156.0771 | 0.61 | 156.0765 | 0.61 | No |
| Arginine | C6H14N4O2 | 175.1193 | 0.64 | N/A | NA | No |
| Threonine | C4H9NO3 | 120.0659 | 0.68 | N/A | NA | No |
| Glutamic acid | C5H9NO4 | 148.0606 | 0.68 | N/A | NA | No |
| Valine | C5H11NO2 | 118.0867 | 0.71 | N/A | NA | Yes |
| Proline | C5H9NO2 | 116.0710 | 0.77 | N/A | NA | No |
| Sucrose | C12H22O11 | 343.1239 | 0.98 | 343.1229 | 0.98 | Yes |
| Glucose | C6H12O6 | 181.0710 | 0.77 | N/A | NA | Yes |
| Methionine | C5H11NO2S | 150.0587 | 1.25 | N/A | NA | No |
| Leucine | C6H13NO2 | 132.1022 | 2.53 | 132.1018 | 2.49 | Yes |
| Isoleucine | C6H13NO2 | 132.1023 | 2.68 | N/A | NA | Yes |
| Tyrosine | C9H11NO3 | 182.0816 | 2.68 | N/A | NA | No |
| Betacyanin | C24H26N2O13 | 551.1520 | 2.96 | N/A | NA | Yes |
| Phenylalanine | C9H11NO2 | 166.0867 | 3.02 | 166.0860 | 3.02 | No |
| Tryptophan | C11H12N2O2 | 205.0975 | 3.48 | N/A | NA | No |
| Riboflavin | C17H20N4O6 | 377.1442 | 3.85 | N/A | NA | No |
| Betaxanthin | C18H18N2O6 | 359.1247 | 4.11 | N/A | NA | Yes |
| Theanine | C7H14N2O3 | 175.1078 | 13.82 | N/A | NA | No |
| 13C/1H Atom label (sucrose) | Measured chemical shift, δ (ppm) | Literature chemical shift, δ (ppm) [29] | 1H Atom label (α-D-glucopyranose/β-D-glucopyranose) | Measured chemical shift, δ (ppm) of (α-D-glucopyranose/β-D-glucopyranose) |
Literature chemical shift, δ (ppm) [30] |
|---|---|---|---|---|---|
| C1/H1 | 92.15/5.41 | 92.15/5.40 | H1 | 5.25/4.68 | 5.35/4.74 |
| C2/H2 | 71.13/3.56 | 71.08/3.55 | H2 | 3.53/3.39 | 3.64/3.37 |
| C3/H3 | 72.65/3.77 | 72.65/3.75 | H3 | 3.70/3.48 | 3.81/3.60 |
| C4/H4 | 69.26/3.48 | 69.26/3.46 | H4 | 3.56/3.91 | 3.52/3.92 |
| C5/H5 | 72.09/3.85 | 72.10/3.82 | H5 | 3.85/3.51 | 3.98/3.50 |
| C6/H6 | 60.15/3.81 | 60.15/3.82 | |||
| C’1/H’1 | 61.36/3.68 | 61.40/3.67 | |||
| C’3H’3 | 76.45/4.22 | 76.50/4.21 | |||
| C’4/H’4 | 74.05/4.06 | 74.10/4.04 | |||
| C’5/H’5 | 81.35/3.90 | 81.39/3.89 | |||
| C’6/H’6 | 62.43/3.83 | 62.50/3.82 |
| Amino acid | 1H Chemical shifts, δ (ppm) | 1H Chemical shifts, δ (ppm) Literature values[33] |
|---|---|---|
| Leucine | δ-CH3-0.978 ɣ-CH, β-CH2-1.765 α-CH-3.779 |
δ-CH3-0.948 ɣ-CH, β-CH2-1.700 α-CH-3.722 |
| Isoleucine | ɣ-CH3-0.942 δ-CH3-0.962 ɣ-CH-1.343 ɣ1-CH-1.493 β-CH-2.149 α-CH-3.749 |
ɣ-CH3-0.926 δ-CH3-0.997 ɣ-CH-1.248 ɣ1-CH-1.457 β-CH-1.968 α-CH-3.660 |
| Valine | α-CH-3.689 β-CH-2.284 ɣ1-CH3-1.036 ɣ-CH3-0.984 |
α-CH-3.601 β-CH-2.262 ɣ1-CH3-1.029 ɣ-CH3-0.976 |
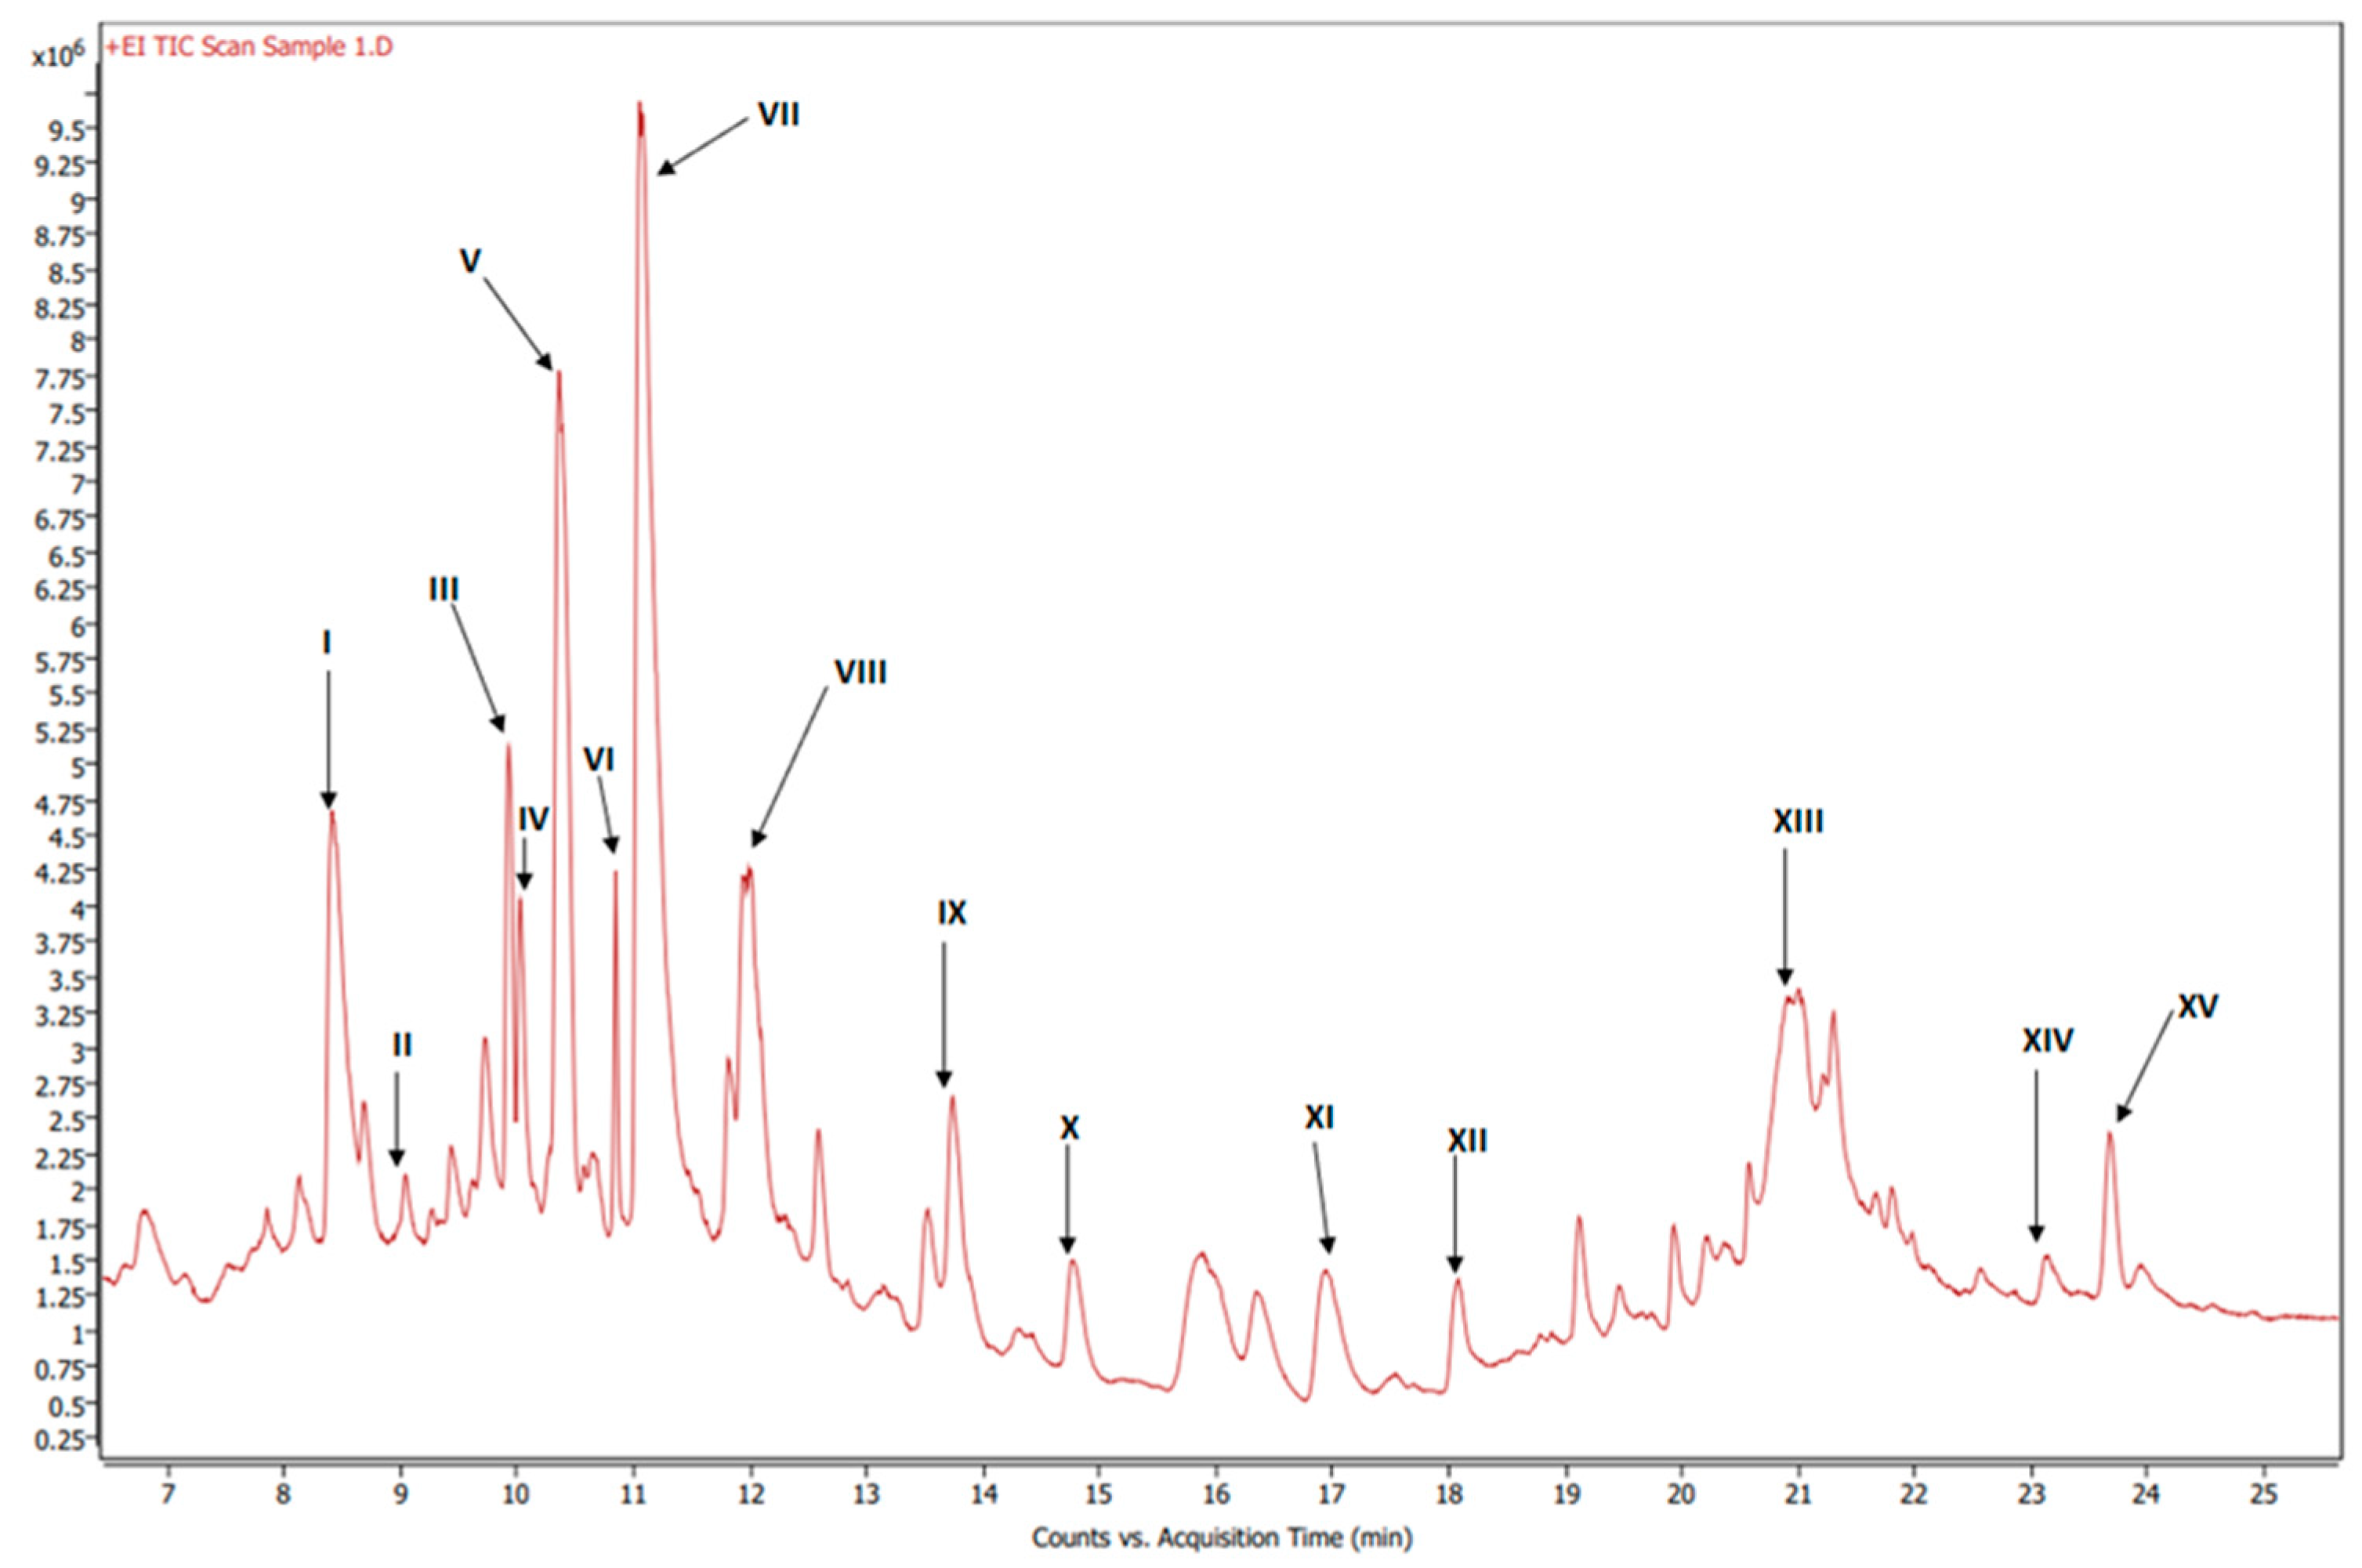
| Label | RT (min) | Base Peak S/N Ratio | Base Peak Area | Compound Name | Formula | Match/ Similarity score (%) |
|---|---|---|---|---|---|---|
| I | 8.41 | 9.73E+02 | 6.15E+06 | Hexadecanoic acid, methyl ester | C17H34O2 | 93.9 |
| II | 9.33 | 3.88E+01 | 2.69E+05 | 3-Methylbenzoic acid, 2,5-dichlorophenyl ester | C14H10Cl2O2 | 88.7 |
| III | 9.93 | 1.06E+03 | 2.69E+06 | Methyl stearate | C19H38O2 | 96.5 |
| IV | 10.03 | 2.35E+02 | 7.04E+05 | 9-Octadecenoic acid, methyl ester, (E)- | C19H36O2 | 90.7 |
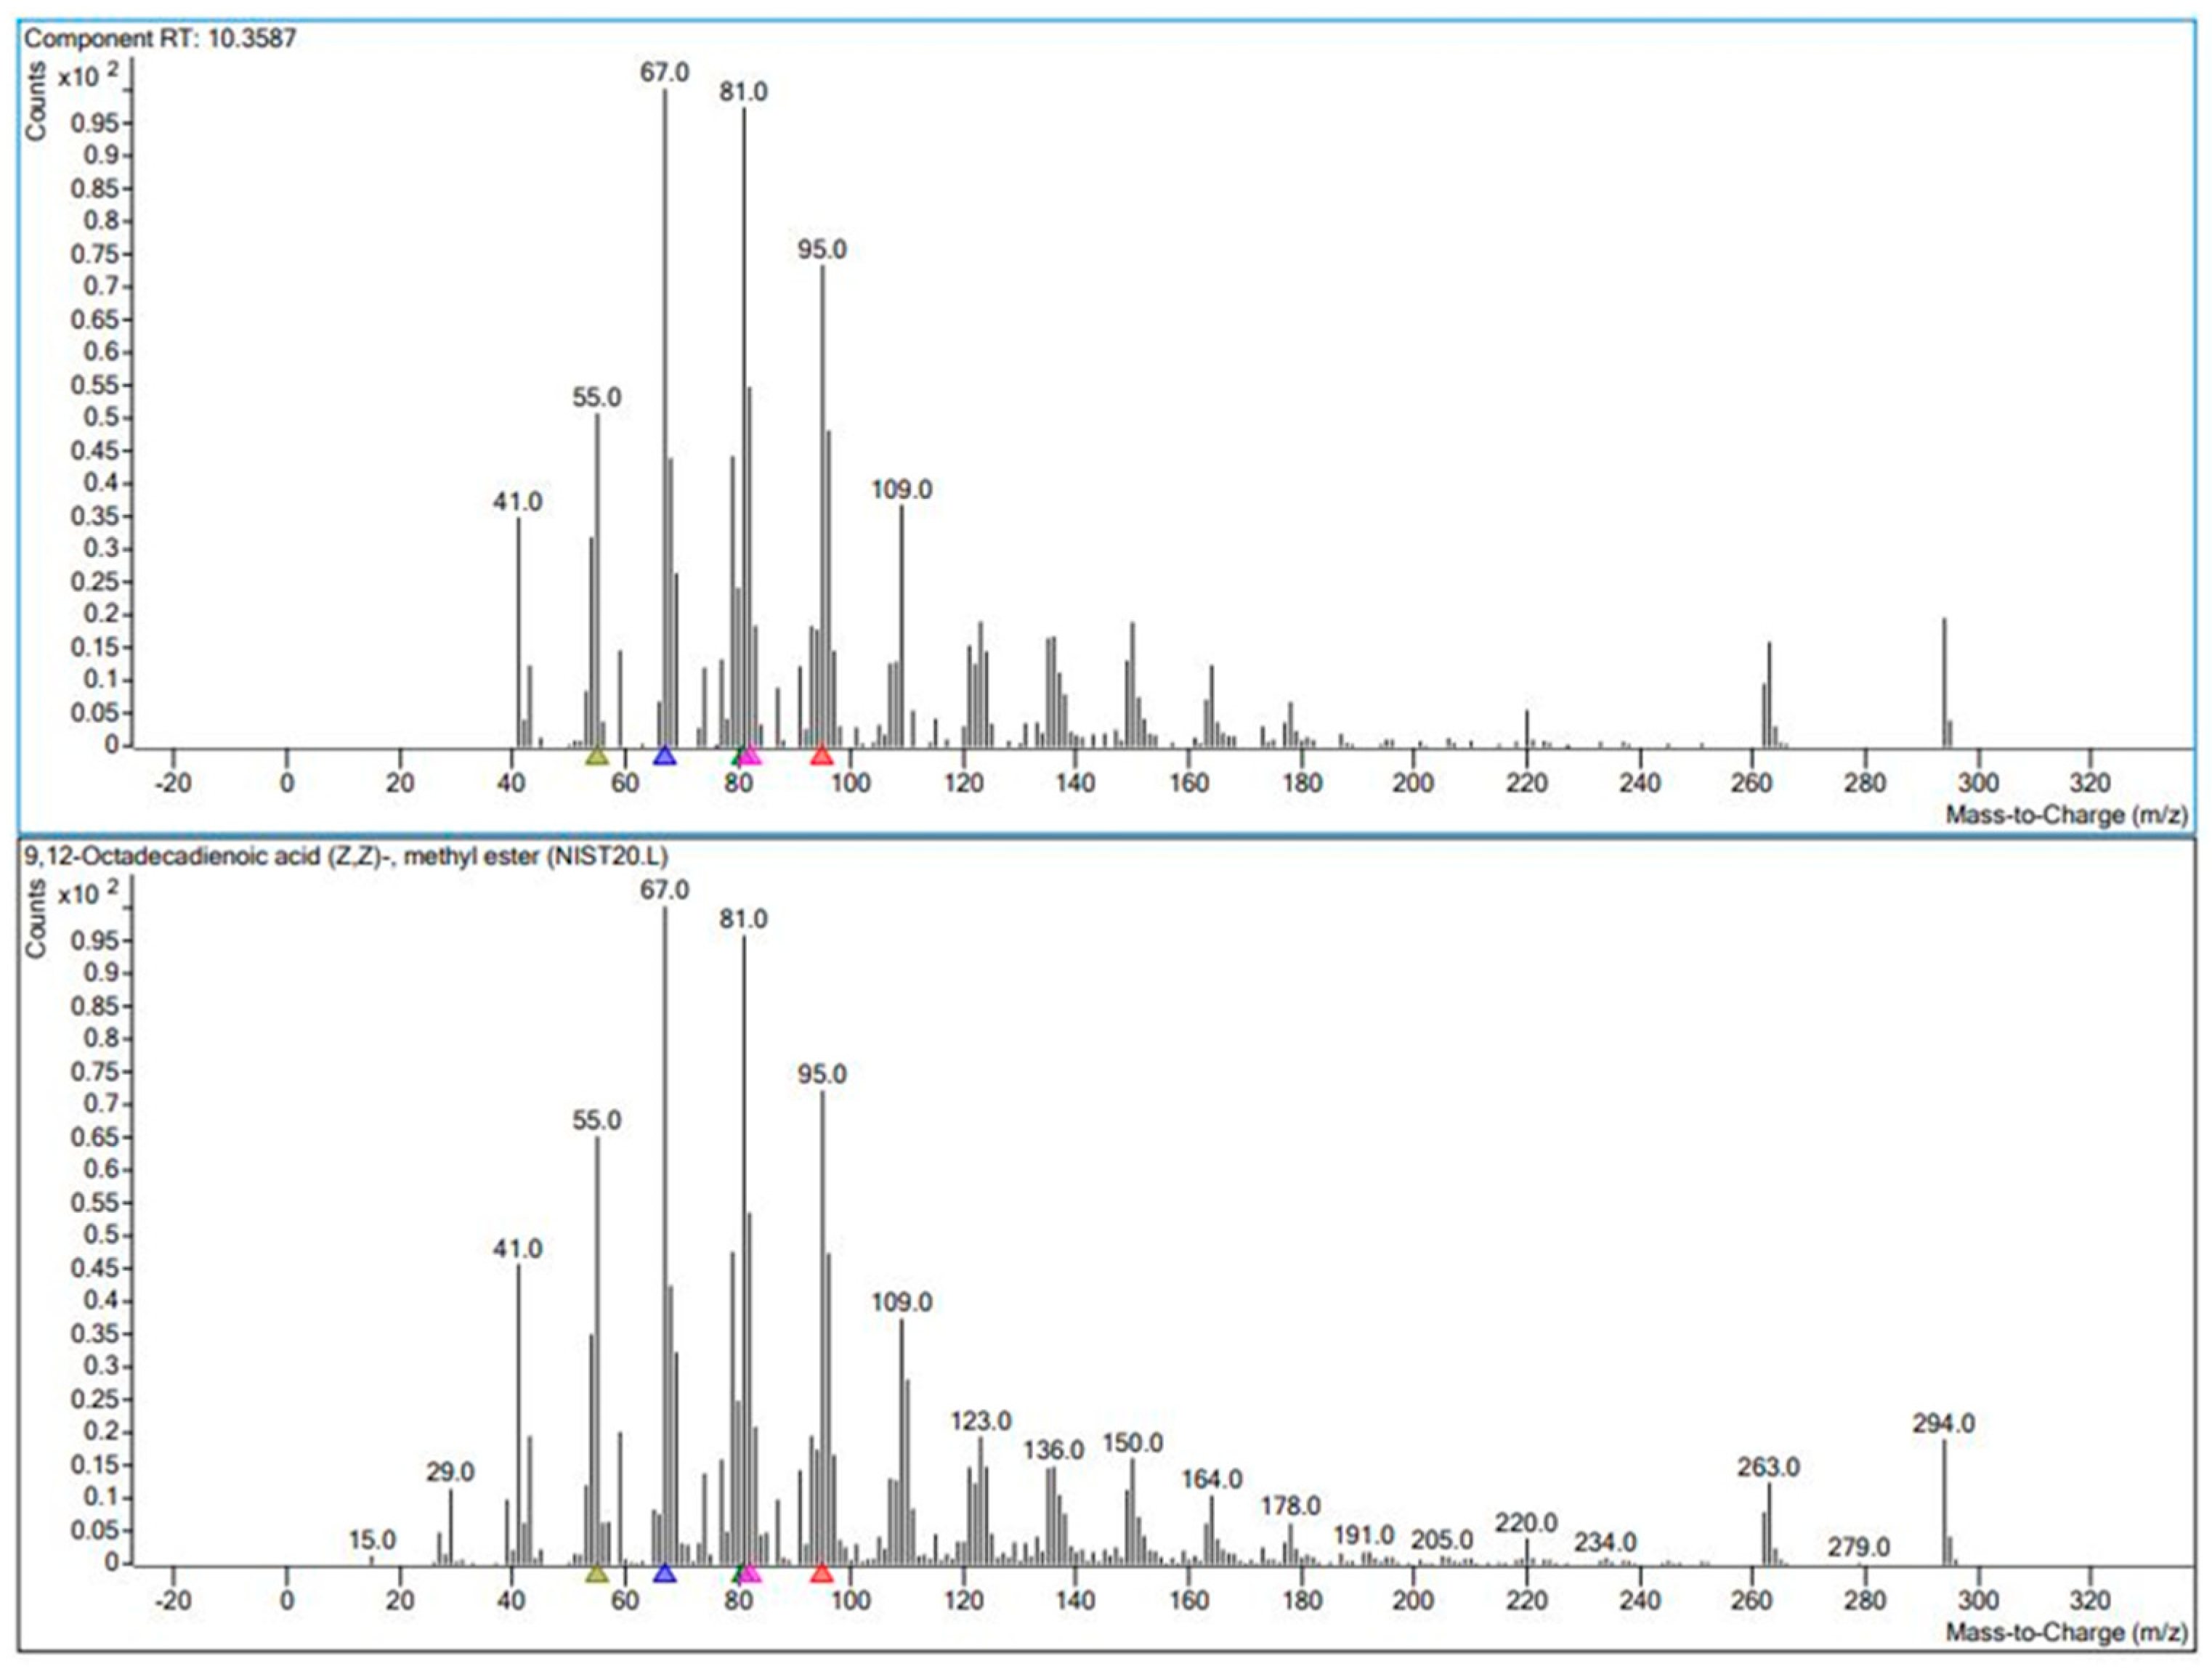
| V | 10.36 | 3.42E+02 | 3.70E+06 | 9,12-Octadecadienoic acid (Z,Z)-, methyl ester | C19H34O2 | 91.9 |
| VI | 10.85 | 3.08E+02 | 6.45E+05 | 9,12,15-Octadecatrienoic acid, methyl ester, (Z,Z,Z)- | C19H32O2 | 96.4 |
| VII | 11.99 | 3.58E+03 | 2.42E+07 | Dibutyl phthalate | C16H22O4 | 91.4 |
| VIII | 12.59 | 6.44E+01 | 1.04E+06 | Pentacosane | C25H52 | 91.7 |
| IX | 13.74 | 1.66E+02 | 1.57E+06 | n-Hexadecanoic acid | C16H32O2 | 92.7 |
| X | 14.77 | 4.59E+01 | 1.07E+06 | Octacosane | C28H58 | 90.1 |
| XI | 16.95 | 8.14E+01 | 1.31E+06 | Octadecanoic acid | C18H36O2 | 92.6 |
| XII | 19.46 | 2.31E+02 | 4.92E+05 | 3,5-di-tert-Butyl-4-hydroxyphenylpropionic acid | C17H26O3 | 90.0 |
| XIII | 21.21 | 1.50E+02 | 1.02E+06 | Oxybis(propane-1,2-diyl) dibenzoate | C20H22O5 | 90.7 |
| XIV | 23.14 | 2.38E+02 | 1.20E+06 | Diethylene glycol dibenzoate | C18H18O5 | 97.2 |
| XV | 23.94 | 1.87E+02 | 3.80E+05 | Dehydroabietic acid | C20H28O2 | 88.1 |
Disclaimer/Publisher’s Note: The statements, opinions and data contained in all publications are solely those of the individual author(s) and contributor(s) and not of MDPI and/or the editor(s). MDPI and/or the editor(s) disclaim responsibility for any injury to people or property resulting from any ideas, methods, instructions or products referred to in the content. |
© 2023 by the authors. Licensee MDPI, Basel, Switzerland. This article is an open access article distributed under the terms and conditions of the Creative Commons Attribution (CC BY) license (http://creativecommons.org/licenses/by/4.0/).


