Preprint
Article

Economic Freedom, Sustainable Development and Participatory Democracy in 21 European Smart Cities. Statistical Approach

Altmetrics

Downloads

126

Views

52

Comments

0

Submitted:

01 August 2023

Posted:

02 August 2023

You are already at the latest version

Alerts
Abstract
This paper aims to stress the nexus between sustainable development, economic freedom and local participatory democracy in 21 European smart cities. The development of smart cities is strongly correlated with technological advancements and improved access to pub-lic services for all residents. Furthermore, smart cities are characterized by efficient man-agement of social, economic and environmental resources and a strong partnership be-tween the public and private sectors. The paper aims to map the dynamics of local partic-ipatory democracy in European smart cities and to identify several relevant predictors of local participatory democracy. The sample is represented by 21 European capitals (20 EU countries plus UK), which are included in the Smart City Index (SCI). Using the quantita-tive design based on both statistical regressions and structural equations modelling (SEM), the paper shows positive statistical correlation between economic factors, sustainable de-velopment, political culture, education and the level of local participatory democracy. Be-sides the exogenous variables, the study emphasized the main priority areas, which might be seen as urgent issues for local governments. The conclusion of the paper underlines the fact that economic freedom, sustainable development, upper secondary education, afford-able housing and an increased level of citizens’ engagement could predict further evolu-tions of the local participatory democracy in 21 European capitals.
Keywords: 
Subject: Social Sciences  -   Urban Studies and Planning

1. Introduction

This paper highlights the nexus between economic freedom, sustainable development and local participatory democracy in European smart cities. An important aspect of social and political sciences is represented by the challenges in the structure of local democracy. Technological advancement and economic opportunities have created premises for emerging a new urban form of social and political interconnections: smart cities. The emerging of the smart cities around the world is an important social and political both challenge and opportunity of the new millennium. Technological advancement and economic progress might be seen as an important vector of smart cities’ development. ICT’ networks and business freedom facilitated the development of these social, economic and urban areas. Moreover, smart cities are seen as structures based on the complex interrelations between political institutions, economic agents and citizens using technological tools. This complex network of interactions facilitated both the flow of information and decisions regarding the social, architectural and physical form of the city. In this respect, citizens should play an important role in local decision-making and assessment of the local governmental performance [1] (p. 482). In order to estimate the dynamics of the participatory democracy in European smart cities, the paper uses a quantitative design, based on secondary statistical data related to sustainable development, economic freedom, the level of national democracy and political culture, the proportion of European capitals’ residents with upper secondary education and the main priority areas specific to smart cities local governments. The paper is structured into four sections that present a systematic review of the academic literature regarding development, political participation and governance in smart cities. These sections include methodological considerations, research results and a series of interpretations and detailed statistical analysis.

Participatory Democracy, Sustainable Development and Governance in Smart Cities. A Brief Systematic Literature Review

The beginning of the millennium is characterized by rapid urbanization. This fact creates issues, challenges and also opportunities for a new concept and a new social reality: smart city. From the mid of the XX-th century to the beginning of the XXI-st century, more than half of the world’s population has migrated to urban areas [2]. In this context, “the urbanization, growth and associated problems of modern cities, coupled with the rapid development of new ICT, has enabled us to first envisage the smart cities concept, and now to begin to build smart cities, which is seen as the future form for cities” [3] (p. 2). Although the concept of “smart city” can be seen as a fuzzy concept, in academic literature there are several significant definitions which could clarify the meaning and the reality described through this concept. Thus, a smart city can be defined as: “a high-tech intensive and advanced city that connects people, information and city elements using new technologies to create a sustainable, greener city, competitive and innovative commerce, and an increased life quality” [4] or “using all available technology and resources in an intelligent and coordinated manner to develop urban centres that are at once integrated, habitable, and sustainable” [5].
In connection with these theoretical assumptions, we agree with the fact that a smart city represents the social community based on “networked infrastructure that enables political efficiency, social and cultural development”, which emphasizes the “business-led urban development and creative activities for the promotion of urban growth” and protect “the natural capital as a strategic component for the future” [6] (p. 11). The model of a smart city based on interconnectivity places the citizen at the centre of political and decision-making activities. Related to this idea, scholars underlined that “a smart city is an ultra-modern urban area that addresses the needs of businesses, institutions, and especially citizens” [7] (p.46). Regarding human prosperity and further sustainable development, smart cities are defined by several features such as quality of life, social, economic and environmental sustainability, economic progress and smartness and urbanization defined in terms of infrastructure and governance [8,9,10,11,12]. Moreover, smart cities are defined in terms of interconnectivity, sustainability, comfort attractiveness and secure social and natural environment [13,14,15,16].
By integrating the conceptual frameworks with a series of social and political implications, scholars have stressed that the core of defining smart cities lies in synchronous interaction among three factors: technological, human and institutional factors [17,18]. Regarding the integration of human resources, researchers proposed a process based on the interaction between learning, partnership and empowerment. In this respect, “citizens and stakeholders first provide the opinions, views, visions, fears, desires, and empirical knowledge that feeds the subsequent stages of the process.” [19] (p. 45).
Concerning the theoretical aspects of smart cities, governance assumes a significant role in social and political dimensions. The scientific literature regarding governance in smart cities is quite extensive, with the majority of studies focusing on identifying local governance components and outcomes. Scholars presented that local governance in smart cities is based on: stakeholders, structures and organizations, processes, roles and responsibilities, technology and data, legislation and policies and exchange arrangements [20] (p.11). The relevant aspects of smart cities’ governance are related to good administration, good policy, innovative decision-making processes, innovative organizations and networks [21,22,23]. In this context, we can underline the fact that “factors for successful smart cities include the active participation of citizenry to create a sense of ownership and commitment, local level coordination to ensure the integration of solutions across the portfolio of initiatives and participation of local governments in networks to share knowledge and experiences” [24] (p. 3). The core of local governance in smart cities should be represented by the interactions of collaborative governance with residents’ participation and civic engagement [25,26,27,28,29,30]. This complex correlation between residents, environment, local government and other stakeholders could be structured in several social and political fields such as public communication, governance, management and administration, quality of life and lifestyle environment and sustainability economy and finances [31]. Political participation and involvement in decision-making remain the main goals of the local government in smart cities [32]. “Citizens-centricity” is the “core concept that defines participatory democracy in smart cities. Thus, “the increased focus on citizens enables stronger citizen engagement based on collaboration, participation, and community empowerment” [22] (p. 147).
The most important aspects, found in academic literature, which are strongly related to smart cities’ governance are represented by sustainable development and the active involvement of residents in decision-making processes and community affairs [33,34,35,36,37,38]. Accountability and adaptive governance should be the features of public management in smart cities [39,40]. However, we argue that “the governance challenges of smart cities are many and at one level these include issues of digital inclusion, inclusive delivery of public services, new forms of participation in the decision-making or transparent governance, among others” [41] (p. 797).
The link between sustainable development and democracy is quite complex, being based on multiple economic, social and political interdependencies. In order to argue the role played by sustainable development in local smart city governance, we agree that democratic governance “refers to public participation, culture, and political mobilization” [42] (p.185). The relationship between democracy, public participation and sustainable development depends on the structure of the political institutions, geographical position, social and political mentalities and the strongest social and civic partnerships for achieving the SDGs goals [43,44,45,46,47,48,49,50].
An important function of democratic regimes consists in creating opportunities for the free market, economic freedom and entrepreneurship. Sustainable cities should emphasize the correlation between economic development, entrepreneurship and citizens’ involvement in public affairs. Economic freedom and entrepreneurship should be seen as relevant components of a smart economy in smart cities [51,52,53,54,55,56,57,58,59,60]. Economic freedom is strongly related to the quality of life and political rights [61] and creates premises for seeing citizens as co-participants in the decision-making process [62,63,64,65]. In this respect, residents are seen in terms of social capital. Social capital is defined as a key-concept and important feature for providing participatory democracy in smart cities [66].
Overall, participatory democracy could contain an ideological perspective [67,68] and refers to the active involvement of citizens in the optimal solving of social issues and needs. Although economic factors [69] are relevant in shaping a good model of participatory governance, in practice, there are several limitations and weaknesses. Thus, critics of participatory democracy sustain that “not only does participatory democracy as a political project pursue multiple objectives (restoring public trust, opening up the decision-making process, providing information, fostering social change, including citizens, etc.)[...]Furthermore, because participatory democracy has produced small-scale changes that are not very spectacular, the overall transformation remains incremental” [70] (p. 228). Other critics of participatory democracy are related to limited EU political institutions in creating an adequate framework of civic participation [71], the presence of a technocrat or managerial political process in many contemporary societies [72] or the absence of critical civic engagement [73]. Regarding participatory democracy in smart cities, scholars discussed smart citizenship, political debates using e-technologies, proposals for local budgets and urban plans [74,75,76]. In most cities, local participatory democracy is related to participatory budgeting, community funds at the city level, and establishing public-private negotiations and solutions regarding public finances [77,78,79,80,81,82,83,84,85,86]. Being based on civic culture and solid social and political education [87,88,89,90], participatory democracy remains a political activity which gives people “the sense of involvement and investment in a project” [91] (p.48). Moreover, human development, civil society, deliberation and political participation remain the “optimum formula” of local participatory democracy [92].

2. Materials and Methods

Following the theoretical dimension, this empirical study shows the relation between sustainable development, economic freedom and participatory democracy in European smart cities. We introduced a specific measure for local participatory democracy based on several components such as accessibility to local government information, residents’ contribution to local decision-making and resident’s feedback on local government projects. This section of the study introduces the theoretical research design, data and procedures, research methods and tools used for explaining the dynamics of the local participatory democracy in European smart cities.

2.1. Theoretical Research Design. Objectives, Questions and Hypothesis

In order to explain the relationship between political, cultural and economic factors in the field of participatory democracy at the local level in European smart cities, we start the current analytical approach using several research questions: 1. How extensive is the participation of residents in local government in European smart cities? 2. What is the correlation between SDGs acquisition and the dynamics of local participatory democracy in European smart cities? 3. What is the impact of economic freedom and entrepreneurship in the field of residents’ participation on local decision-making? 4. How could be influenced political participation in local government in European smart cities by the levels of the national democracy and political culture? 5. Are educated residents from European smart cities more prone to participate on local decision-making than other social categories?
Using secondary statistical data, this paper aims to create a comprehensive and exploratory model of understanding the level of political participation at the local level in European smart cities. In this respect, both normative and empirical levels are covered by the following research objectives:
Objective 1 (O1): to map the evolution of the resident’s access to public information, involvement in decision-making and assessment of the local government policies in European smart cities.
O2: to estimate the correlation between economic determinants and the level of local participatory democracy in European smart cities.
O3: to analyze the influence of the SDGs in shaping a model of local participatory democracy in European smart cities
O4: to measure the magnitude of the correlation between the residents’ education and the level of local participatory democracy in European smart cities
O5: to predict the further evolutions of the local participatory democracy in European smart cities.
Related to the research questions and objectives, this paper aims to test several research hypotheses:
Hypothseis1 (H1).
An increased level of economic freedom is strongly related to an increased level of residents’ participation in decision-making at the local government in European smart cities.
H2. 
The level of national democracy is strongly related to the resident’s participation in public affairs in local governments.
H3. 
An increased level of SDGs achievement predict the dynamics of the residents’ participation in decision-making and assessment of the local public projects in European smart cities.
H4. 
An increased level of education is positively correlated with an increased level of residents’ information, participation and assessment of the public projects in European smart cities.

2.2. Quantitative Data, Research Methods and Statistical Design

Using available secondary statistical data from statistical and academic sources, this paper correlates the dependent variables represented by: residents’ access to public information, residents’ participation in decision-making and resident’s assessment of the local public projects with several social, economic and political factors represented by: the level of country GDP, GDP/capita, economic freedom, political culture and democracy, education and sustainable development. The analytical model tests the association between all these dependent variables with the degree of social inclusion and human development. Data related to residents’ access to public information, residents’ participation in decision-making and residents’ assessment of the local public projects were collected from IMD World Competitiveness Center [93], an academic research centre which provides data and outcomes related to how countries and enterprises achieve future prosperity. In this respect, IMD World Competitiveness Center provides an aggregate statistical index of the Smart Cities (Smart Cities Index) in 118 units from different geographical areas. The main components of the Smart Cities Index are structure and technologies. In the field of the structures of the smart-cities, researchers used variables such as health and safety, mobility, activities, opportunities (work and school) and governance. We collected data from governance related to: 1. Accessibility of public information (information on local government decisions is easily accessible); 2. Residents’ participation in local decision-making (residents contribute to the decision-making of local government); 3. Residents’ assessment of public projects (residents provide feedback on local government projects). These variables are measured on a scale between 0 and 100. The highest values (> 50) reflect that there is an important impact on the citizens in the field of local government. Besides these variables, we were interested to estimate the importance of public projects in the residents ‘life. In order to complete this perspective, we collected data related to priority areas in European smart cities. Statistical data based on a list of 15 indicators represent the most urgent issues perceived by the residents of smart cities. IMD World Competitiveness Center provides the percentages of the respondents in each area. The highest values reflect an urgent priority for the city. Taking into consideration these remarks, we used as urgent issues in smart cities the following priority areas (PA): PA1: Affordable Housing; PA2: Air Pollution; PA3: Security; PA4: Road Congestion; PA5: Unemployment; PA6: Health Services; PA7: Fulfiling Employment; PA8: Recycling; PA9: Corruption; PA10: Green Spaces; PA11: Public Transport; PA12: School Education; PA13: Social Mobility; PA14: Basic Amelities; P15: Citizen Engagement.
Statistical data related to GDP/ capita were collected from World Bank [94]. Also, in correlation with GDP/ capita, we used Economic Freedom as an important economic determinant. Economic Freedom is a statistical aggregate measure of the economic components: fiscal health, business freedom, labour freedom, monetary freedom, trade freedom, investment freedom and fiscal freedom. The indicator is provided by Heritage Foundation [95] on a scale measurement between 0 and 100. Upper quantitative values reflect a high degree of economic freedom in the observed statistical units. Political culture and the Index of Democracy are provided by the international think-tank The Economist Intelligence Unit (EIU) [96] on a scale measured between 1 and 10. EIU is ranking countries by the quality of democracy using the following significances: values between 0 and 4.00 are specific for authoritarian regimes; values between 4.01 and 6.00 are characteristic of hybrid political regimes; values between 6.01 and 8.00 define flawed democracy; values between 8.01 and 10 are specific for full democratic regimes. The Sustainable Development Index measured by the level of SDGs achievement is collected from Sustainable Development Report [97] on a scale between 0 and 100. The highest score of the Sustainable Development Index reflects an optimal level of achieving the SDGs in accordance with The 2030 Agenda for Sustainable Development. Regarding the educational level, data were collected from the official database of Eurostat [98] and referred to people with at least an upper secondary education. Thus, this variable measures the cumulative proportion of citizens with secondary and tertiary education in European countries. Values represent the proportion of the population from 0 to 100. Social inclusion is a statistical indicator developed by the Global Green Growth Institute [99], which measures the level of achieving sustainability targets by The 2030 Agenda for Sustainable Development and the Paris Climate Agreement. Social inclusion reflects the level of integration and access to basic services, being measured on a statistical scale between 0 (the absence of inclusion) and 100 (total integration of the citizens in sustainable societies). For testing the social capital theory of democracy we used the measures of the Human Development Index, as a ratio index between 0 and 1, where the highest values (> 0.8) are relevant for developed countries. The composite indicator and the quantitative values are developed by United Nations Development Programme (UNDP) [100]. Starting with these qualitative descriptions of the research data, Table 1 presents the research variables, their symbols, units of measurement and available data sources:
The sample of analysis is represented by 21 European capitals (20 EU countries plus UK). We have chosen only the capitals as emblematic examples of smart cities. We used in the analysis only countries in which were registered statistical data related to the Smart Cities Index. Table 2 shows the structure of the sample and the smart cities included in the current analysis:
Data were analyzed in a long-term statistical series between 2015 and 2022. We used it as starting point in the analysis the year 2015, taking into consideration the fact that in 2015 UN adopted The 2030 Agenda for Sustainable Development. Data are limited of the available secondary sources for the year 2022. Only for several statistical indicators are available statistical measurements for the current year (2023).
Regarding the statistical design, we used both elements of descriptive and inferential statistics. For describing central tendencies and the dispersion of the variables we used descriptive statistics and we tested the normality of the statistical distributions through the Kolmogorov-Smirnov test. For all the variables included in the analysis, we obtained normal values of the Kolmogorov-Smirnov test of normality with p > 0.05. Taking into account this aspects, we used a quantitative research design based on linear regression, non-linear regression and Structural Equations Modelling (SEM) for explaining the multiple interactions between dependent and independent variables.
Following the methodological premises, the paper developed a specific measure of local participatory democracy taking into account statistical data available for residents’ information, participation in decision-making and assessment of the political projects in smart cities. Thus, we used the harmonic mean between three variables: accessibility of the local government information, residents’ participation in decision- making and residents’ assessments of the local government projects. We used the harmonic mean for creating the index of the local participatory democracy (LPD), taking into consideration the fact that the dependent variables had different proportions and ratios in defining the level of the residents’ participation in local governance in smart cities. Moreover, through this measure (harmonic mean) we aimed to underline the averaging rates of chance in the field of citizens ‘information, participation in public decisions and assessment of public policies. In this respect, we use the following measure for estimating the level of the local participatory democracy in each smart city included in the sample:
H = N i = 1 N 1 x i = N ( 1 x 1 + 1 x 2 + + 1 x n )  
where N= number of observations; X1,n= values of the variable X.
Starting with the canonical form of the harmonic mean, we proposed the following measure of the local participatory democracy (LPD):
L P D = 3 ( 1 A I i + 1 R D M i + 1 R A i   )
where AI= Accessibility of the Local Government Information; RDM= Residents’ Participation to Decision-Making and RA= Residents’ Assessments of the Local Government Projects.
Using the multiple linear equations of regression we aim to estimate the main predictors which are relevant for explaining the dynamics of the local participatory democracy in 21 European capitals. In this respect, the general model for multiple linear equation is:
Let be X, Y- variables and
X = x 1 x n   a n d   Y = y 1 . y n     a n d   X ,   Y R ,    
Y i = f ( X i ) , where   Y-   dependent   variable   and   X-   independent   variable
Y i = α + β x i + ε i j ε i j , where   Y-   dependent   variable ,   X-   independent   variable ; ε i j -   residuals
If Y is the dependent variable and X1…Xn several independent variables (factors) we can determine from (3) and (4) that the Multiple Linear Equation of Regression is:
Y i = α + β 1 x 1 + β 2 x 2 + + β n x n + ε i j
By this quantitative model of regression, we used the following multiple equation:
L P D = α + β 1 × G D P + β 2 × H D I + + β 8 × P C + ε i j
For estimating the indirect effects of the predictors (X1,n) in the sphere of the dependent variables ( y i ) we used a nonlinear equation of regression like:
Y i = β 1 x 1 n + β 2 x 2 n 1 + + β n x n + α
In correlation with this nonlinear model, we used polynomial regression equations as cubic and quadratic models:
Y i = β 1 x 1 3 + β 2 x 2 2 + β 3 x 3 + α
Y i = β 1 x 1 2 + β 2 x 2 + α
These mathematical models are useful for understanding both direct and indirect effects of the social, economic and political factors in the sphere of local participatory democracy in European smart cities. Our dependent variables are represented by the accessibility of the local government information (AI), residents’ participation in decision-making (RDM) and residents’ assessments of the local government projects. Also, we used as a dependent variable our index of local participatory democracy based on the calculus of the harmonic mean between these variables.
The main factors (independent variables) which are related to local participatory democracy are represented by: Human Development Index (HDI), Sustainable Development Index (SDI), Level of Education (ED), Democracy Index (DI), Economic Freedom (EF) Social Inclusion (SI) and Political Culture (PC). Moreover, the following section details the empirical findings and the correlations between statistical results and the theoretical perspectives presented in the first section of the paper. Empirical results are configured according to the methodological guidelines. For explanations and argumentation, we used only significant statistical results with a very high level of likelihood. All the empirical results presented within the paper are significant, with p 0.05 .

3. Results

This section of the study presents the empirical findings related to the research objectives. We use four subsections for presenting the map of local participatory democracy in 21 European smart cities, the relation between economic determinants and an increased level of residents’ participation in public decision-making and indirect effects generated by the political culture and economy in the field of local participatory democracy. Moreover, we aim to develop and explain the impact of the Priorities Areas (PA) in the field of residents’ interest in political participation. In order to demonstrate the economic impact in the field of local participatory democracy we observed that a high level of the country's sustainable development is an important factor associated with political participation. The interaction between sustainable development, economic freedom, an increased level of national democracy and upper secondary education could be seen as the “core” of the local participatory democracy in 21 European smart cities.

3.1. Mapping Local Participatory Democracy in 21 European Smart Cities

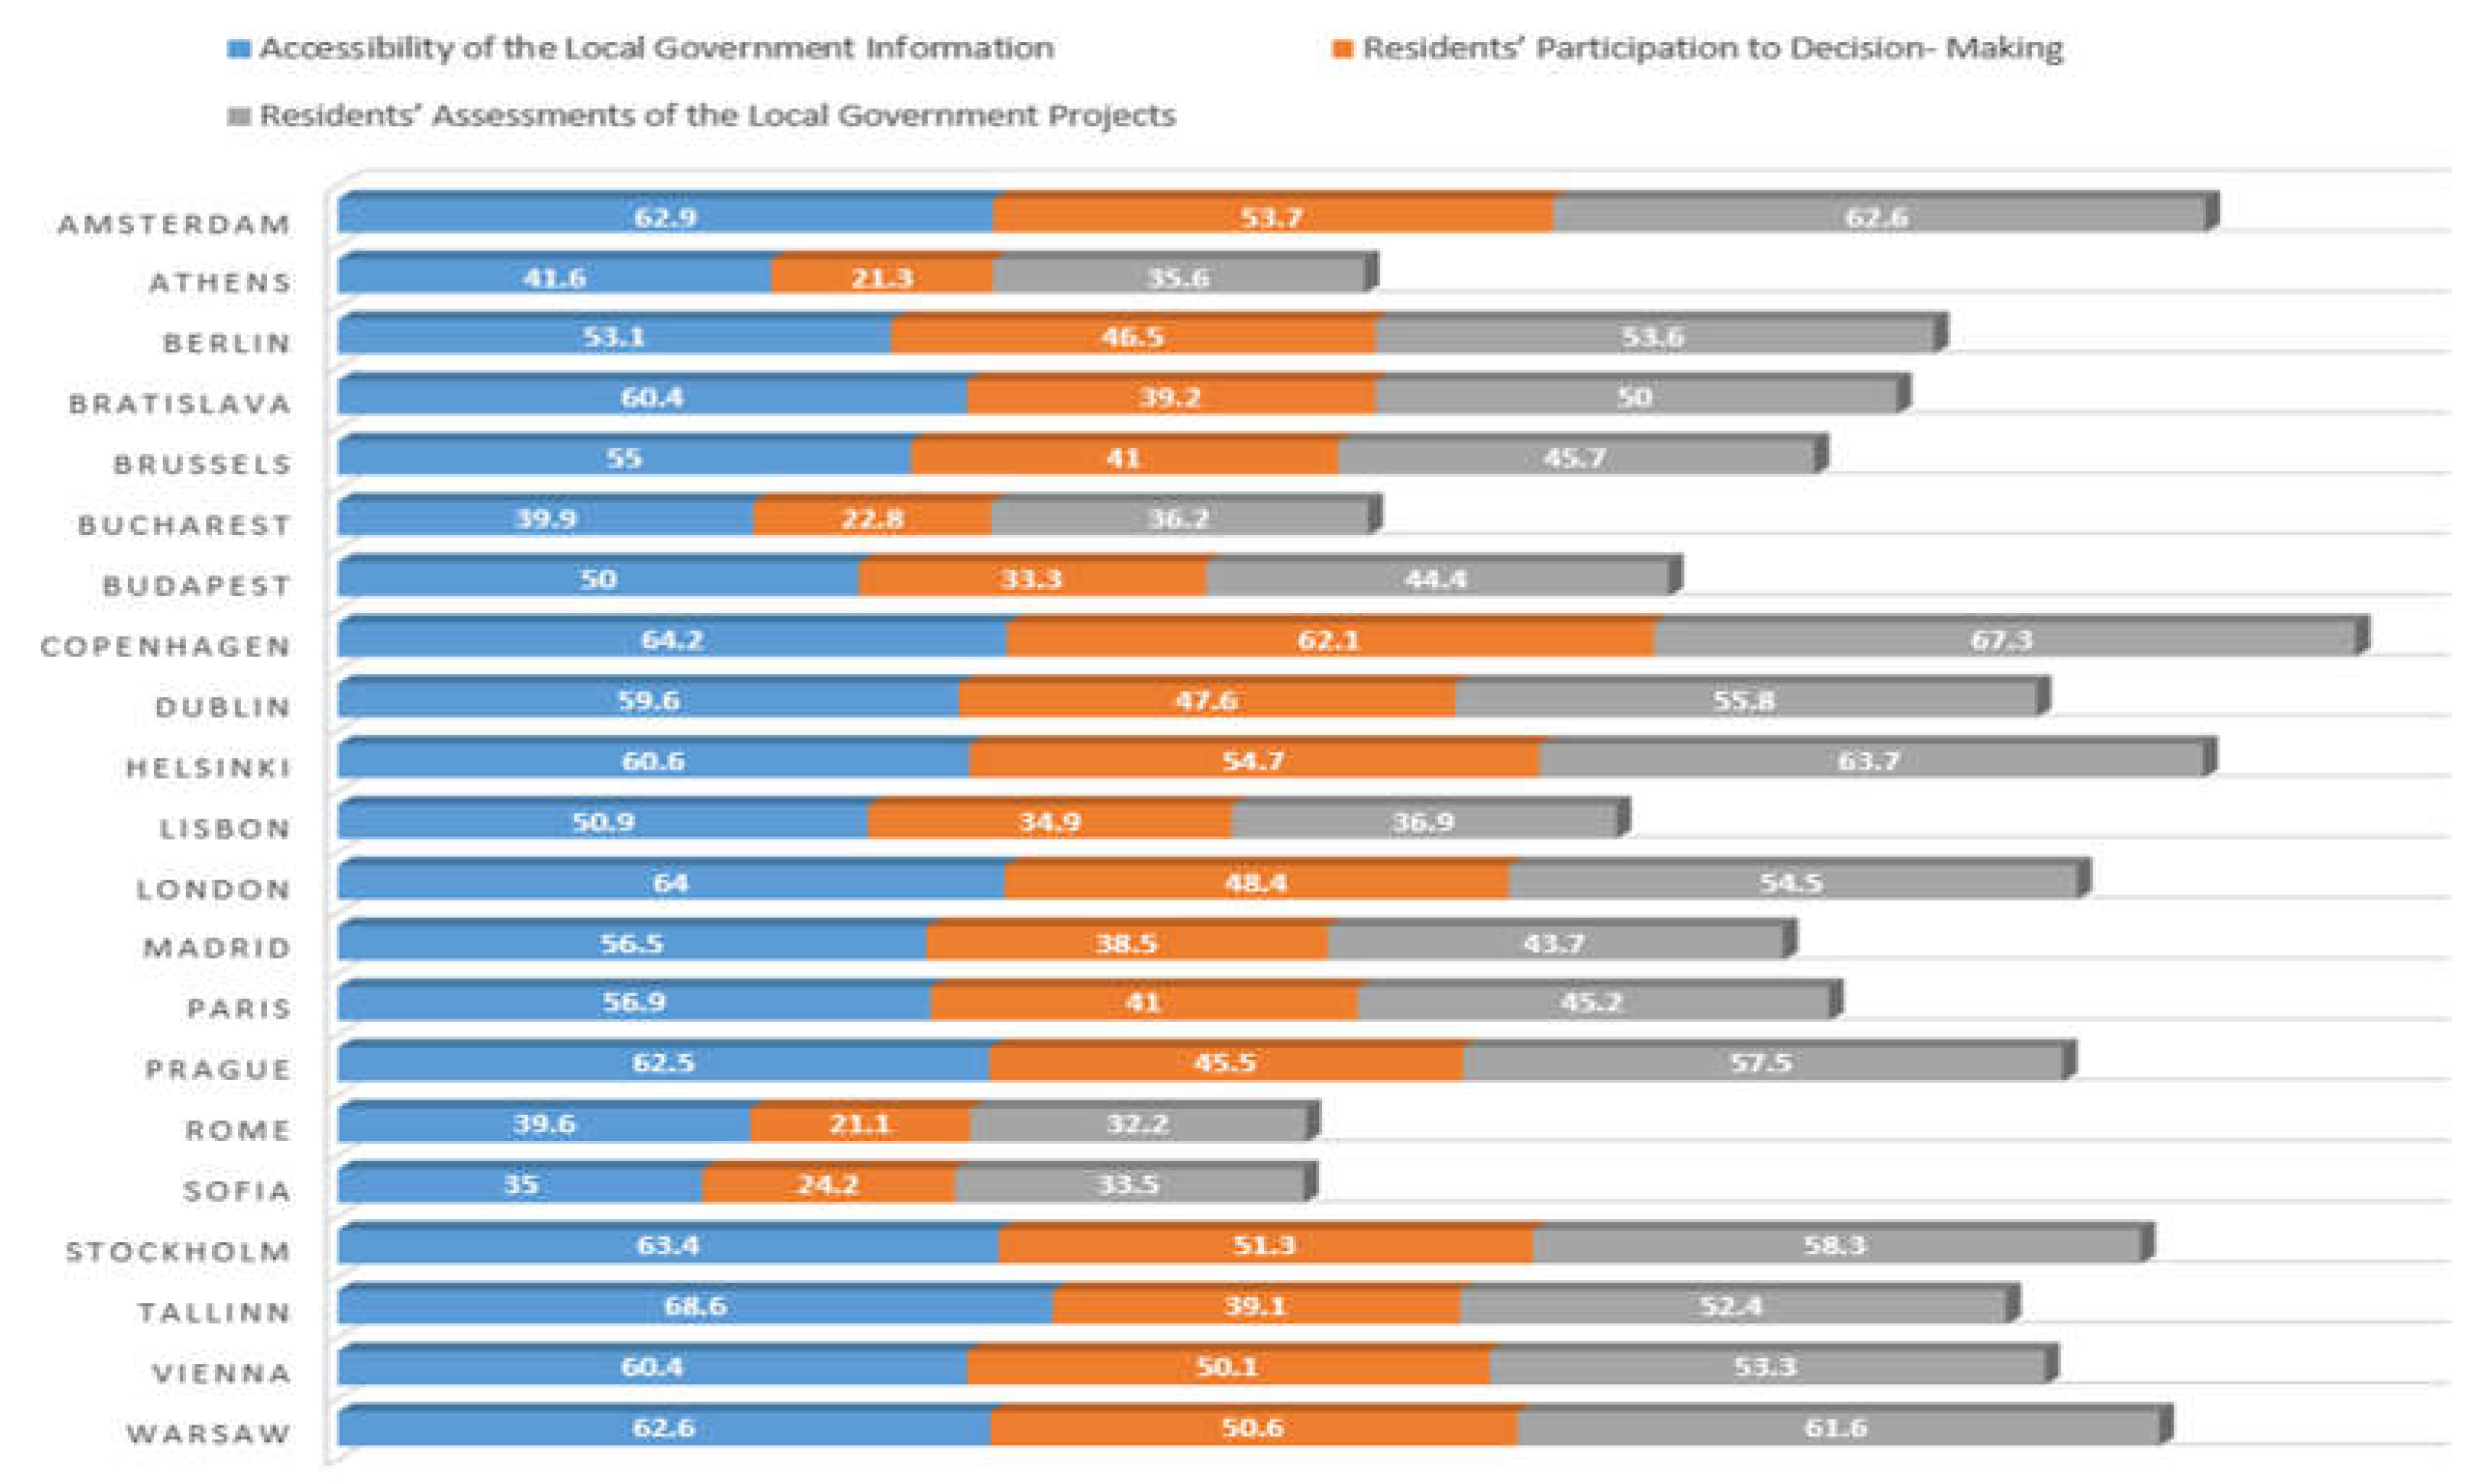
As we have pointed out in the first section of the paper, local participatory democracy is an important variable for understanding residents' behaviour and interest in public affairs at the local level. Using geographical classification we have estimated the measures of the central tendency and dispersion related to each research variable. Regarding the sample (n=21) during 7 years, we observed that 71.4% of the smart cities are characterized by an increased level of accessibility to the local government information (AI >50), 19% of the smart cities are characterized by an increased level of resident’s participation to decision-making (RDM> 50.10) and 52.4 of the smart cities are characterized by an increased level of residents’ assessment of the local government projects (RA> 50). In this respect, political participation in local public affairs might be seen in terms of political information and assessments of the local government's public policies. Regarding our composite measure of the local participatory democracy (LPD) we estimated that in 52.4% of the smart cities included in the sample statistical values are relevant for an increased level of residents’ participation in local public affairs (LPD> 50.64). Figure 1 shows the circular averages for Accessibility of the Local Government Information, Residents’ Participation to Decision- Making and Residents’ Assessments of the Local Government Projects.
Regarding the dependent and independent research variables, there are significant statistical differences by geographical region. Smart cities from Nordic countries are more prone to have increased values in the field of accessibility to local government information. The highest values are registered in Nordic smart cities ( x ¯ = 64.2 ;   σ = 3.31 ) and the lowest values are registered in Southern European smart cities ( x ¯ = 47.15 ;   σ = 7.94 ). Besides the geographical disparities between North and South, we estimated the statistical differences between Western Europe ( x ¯ = 58.58 ;   σ = 4.35 ) and Eastern European smart cities ( x ¯ = 53.23 ;   σ = 10.45 ). Eastern and Southern European smart cities are characterized by a high level of variance in the field of accessibility to local government information. In the field of political participation in local decision-making, we stressed the fact that residents of Nordic ( x ¯ = 51.8 ;   σ = 9.59 ) and Western ( x ¯ = 46.37 ;   σ = 4.84 ) European smart cities are more likely to participate in local governance than other geographical areas. In this hierarchical approach, the second place is specific for smart cities from Western European countries ( x ¯ = 52.06 ;   σ = 5.00 ). There are no significant statistical differences between values of the LPD from Central ( x ¯ = 46.18 ;   σ = 13.94 ) and Eastern European smart cities ( x ¯ = 44.62 ;   σ = 11.25 ,   T = 7.93 ,   p = 0.04 ). The smallest values of the LPD are registered in Southern European smart cities ( x ¯ = 36.02 ;   σ = 7.73 ). In correlation with these tendencies related to LPD, the national democracy index (DI) registered the highest values both in Northern ( x ¯ = 8.88 ;   σ = 0.69 ) and Western European countries ( x ¯ = 8.45 ;   σ = 0.54 ). Similar statistical values were estimated in the field of political culture. Analysing the results obtained, it is found that 42.9 % of the political systems included in the sample are full democracies and 57.1% are defined as flawed democracies. Taking into account the relevance of the quality of the national democracy in the field of residents’ participation in public affairs, the participatory political culture is met in 23.8% of the countries included in the sample. Even though most of the countries are flawed democracies, economic parameters indicate progress in the field of GDP/ capita and economic freedom. Confirming the fact that Nordic and Western systems are more likely to develop democratic and civic practices, empirical findings reflect significant differences between these geographical regions and the Southern and Central-Eastern parts of the EU. In this respect, statistical values reflect the highest rates of economic freedom, with average values > 70. However, the lowest rates of economic freedom are met in Southern and Eastern Europe, with average values between [64.57; 67.44]. Regarding the level of social inclusion, data highlite several issues in providing a better level of citizens’ integration in social, economic and political activities in Eastern European’countries ( x ¯ = 82.4 ;   σ = 2.7 ). In the rest of the countries, the percentage of social inclusion is above 87%. In the field of education, all political systems registered close values between 82.12 in Western European countries and 87.21 in the Central part of Europe. Table 3 shows the central tendency values for the dependent and independent variables:
Regarding the accessibility of the local government information’ statistical measures, the first quartile (Q1= 50.45) included the following smart cities: Sofia (AI=35), Rome (AI= 39.6), Bucharest (AI=39.9), Athens (AI= 41.6) and Budapest (AI=50). In the third quartile, the highest values associated with the accessibility of local government information (Q3= 62.75) are met in the following smart cities: Amsterdam (AI= 62.9), Stockholm (AI= 63.4), London (AI=64), Copenhagen (AI= 64.2) and Tallinn (AI=68.6). Figure 2 shows the average values for residents’ participation in the political process at the local level:
In the case of the residents’ participation in decision-making, the first quartile (Q1=34.1) included cities like Rome (RDM=21.1), Athens (RDM= 21.3), Bucharest (RDM= 22.8), Sofia (RDM= 24.2) and Budapest (RDM= 33.3). In contrast, the highest scores from the third quartile (Q3= 50.35) are relevant for smart cities as Warsaw (RDM= 50.6), Stockholm (RDM= 51.3), Amsterdam (RDM= 53.7), Helsinki (RDM=54.7) and Copenhagen (RDM= 62.1). Regarding the residents’ assessment of the local public policies, the lowest scores are registered (Q1= 40.30) in smart cities as Rome (RA= 32.2), Sofia (RA= 33.5), Athens (RA= 35.7), Bucharest (RA= 36.2) and Lisbon (RA= 36.9). The highest values, included in the third quartile (Q3= 57.90), are met in several smart cities as Stockholm (RA= 58.3), Warsaw (RA= 61.6), Amsterdam (RA= 62.6), Helsinki (RA= 63.6) and Copenhagen (RA= 67.3).
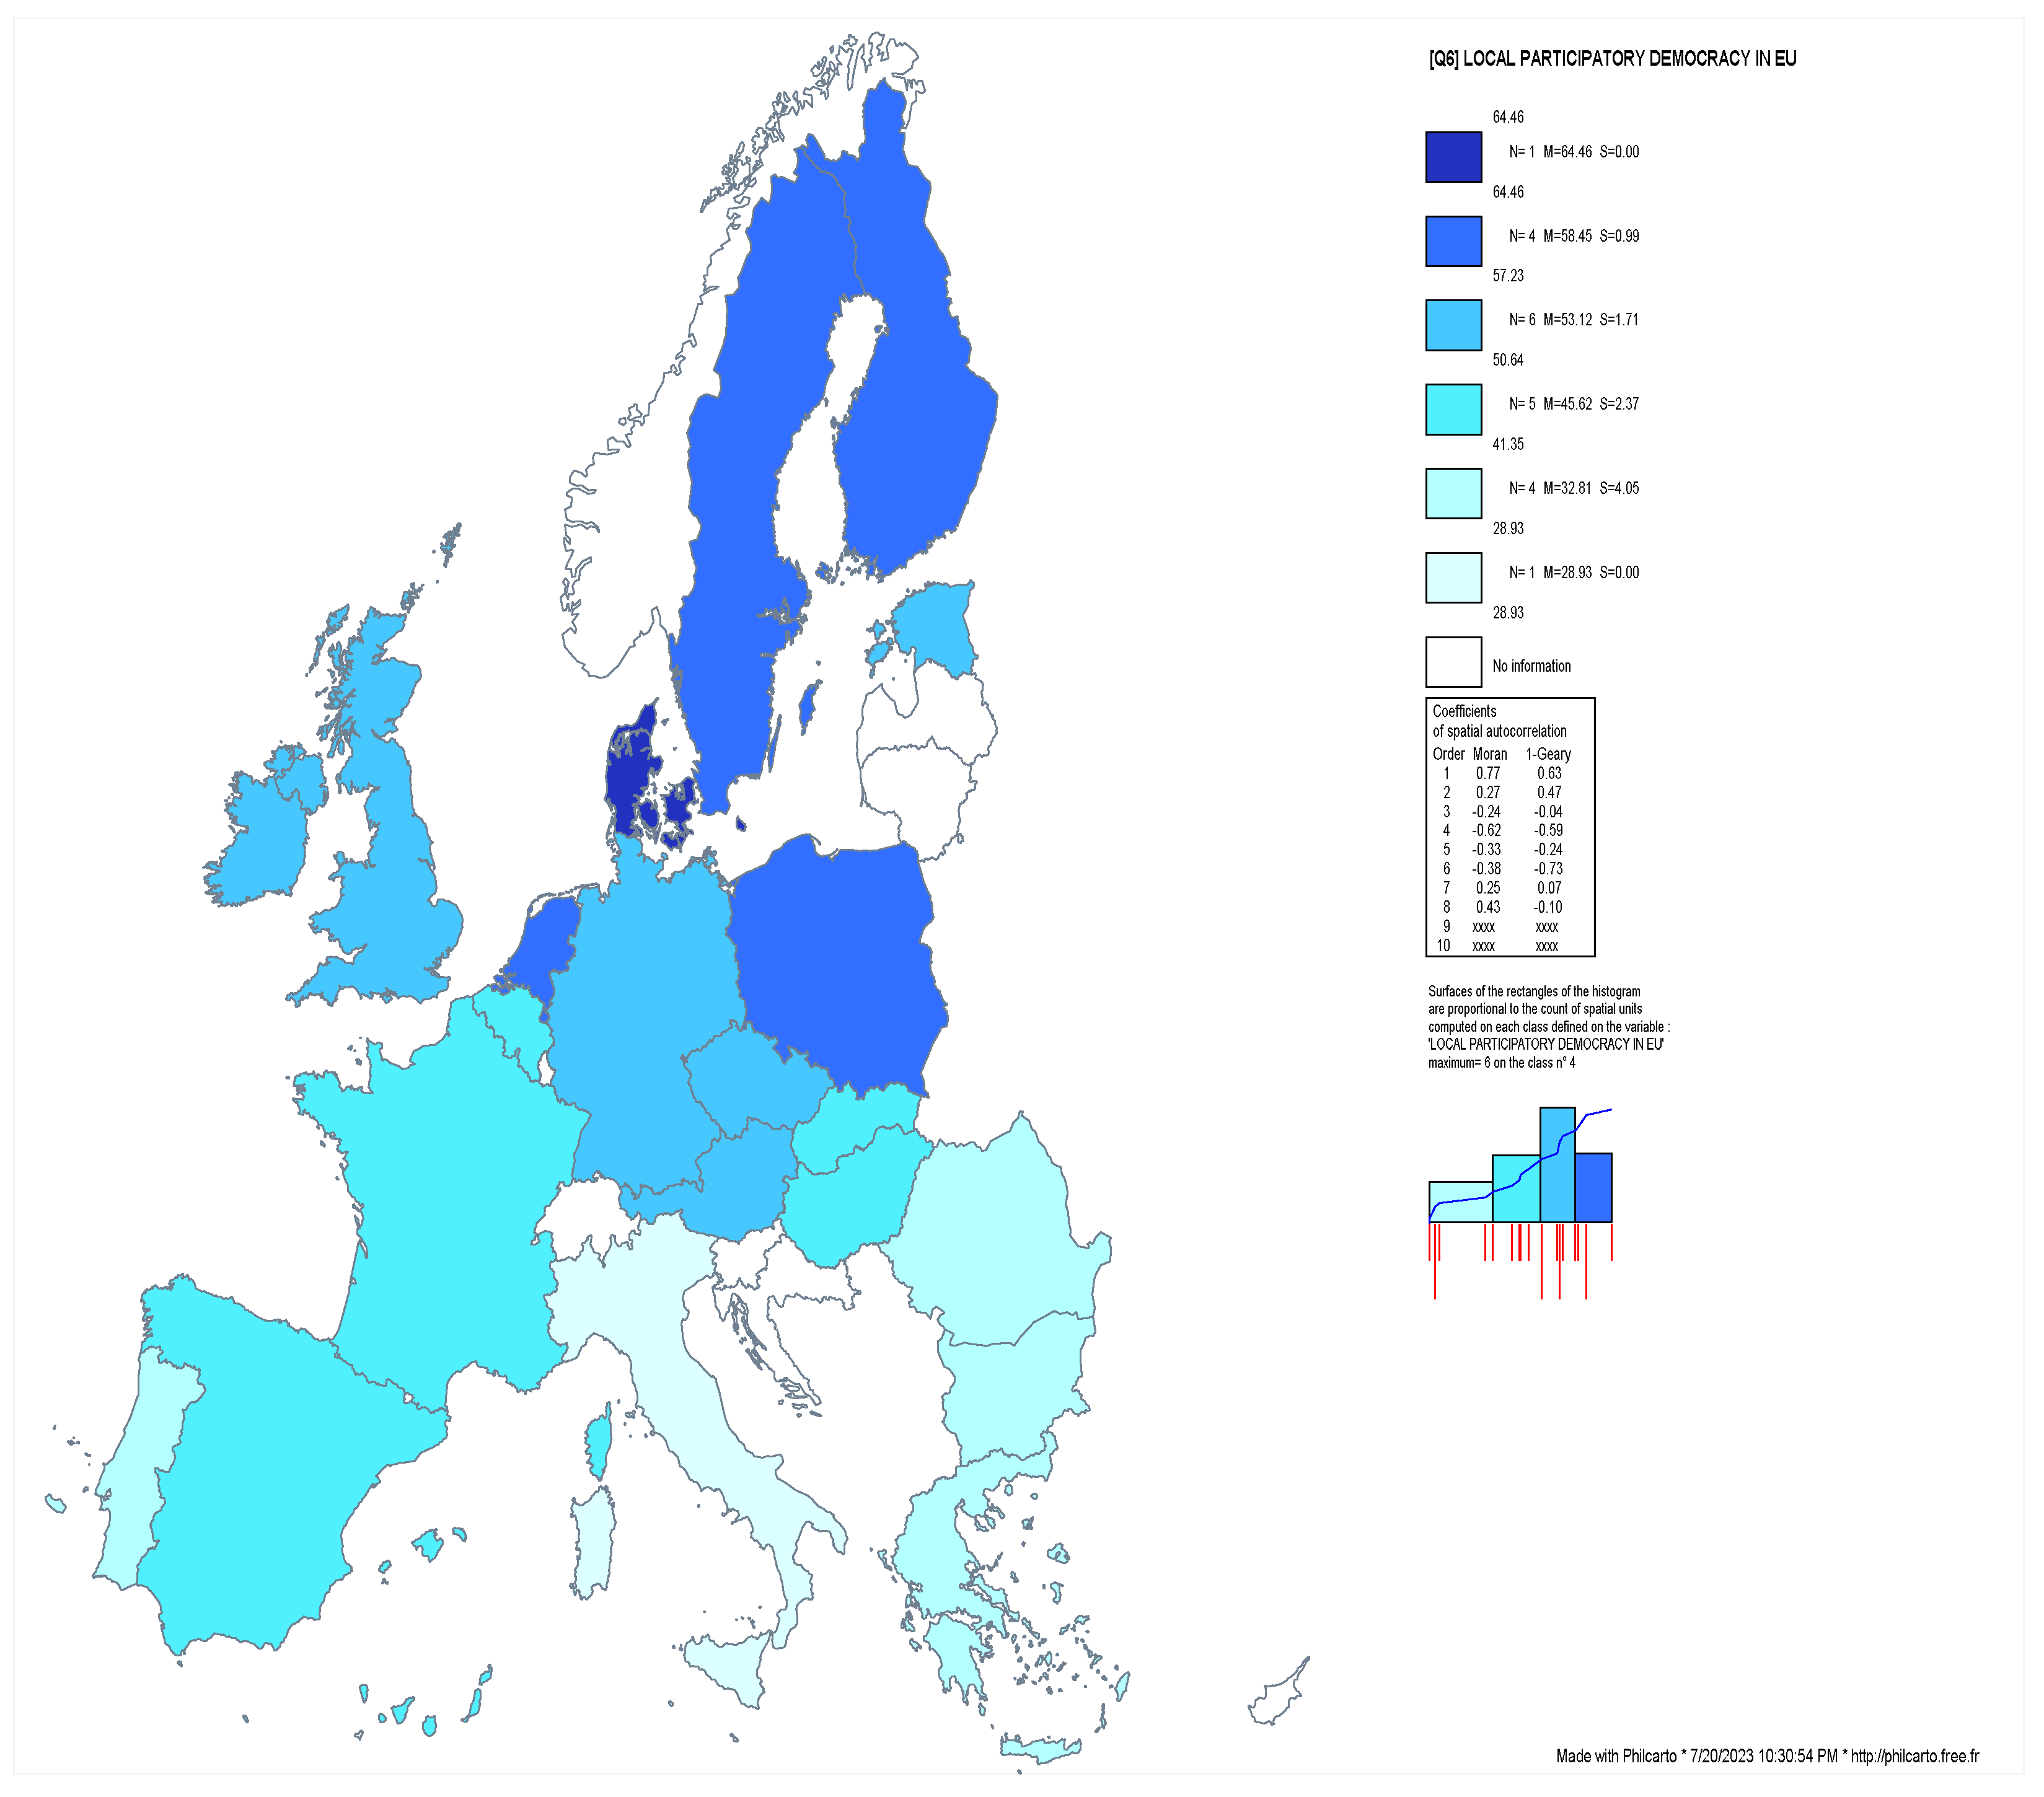
In correlation to these statistical distributions, we estimated the values of the composite indicator of the local participatory democracy (LPD). In order to present the dynamics and distribution of LPD we observed that there are geographical differences between two major axes: North-South and West-Est. Figure 3 shows the geographical distribution of the LPD in the capitals of the EU countries. We used countries as units on the map for creating a comprehensive image of the dispersion of the LPD across the EU. The dark blue colour is used for high values of LPD (LPD > 64.46), and light blue for the smallest values of LPD (LPD < 45.62). The gradient between light blue and dark blue indicates different variations of the LPD between 45.62 and 64.46.
Regarding the map from Figure 3, spatial indicators of spatial correlation suggest that there is a high tendency of grouping LPD in European smart cities by geographical area (Moran Index- I = 0.77; 1- Geary = 0.63). In this respect, the map indicates three clusters: 1. first cluster represented by the smart cities from Northern and Central Europe (with dark blues), characterized by an increased level of LPD (LPD > 55.45); 2. second cluster of smart cities characterized by average values of LPD (45.02 < LPD < 55.44) is met in Western European countries; 3. third cluster of smart cities characterized by lowest values of LPD (LPD < 45.02) is met in Southern and Eastern EU countries. In this respect, in the first quartile (Q1= 40.56) are included the following smart cities: Rome (LPD= 28.93), Sofia (LPD= 30.08), Athens (LPD= 30.28) and Bucharest (LPD= 31.07). In the third quartile (Q1= 57.00) are included smart cities from Northern and Central Europe as Stockholm (LPD= 57.23), Warsaw (LPD= 57.72), Amsterdam (LPD= 59.41), Helsinki (LPD= 59.43) and Copenhagen (LPD= 64.46). The level of technological advancement, alongside cultural, historical, political and economic variables could be several external factors which explain and predict the further evolution of the LPD in these smart cities.

3.2. Predictors of Local Participatory Democracy in 21 European Smart Cities: Economic Freedom and Sustainable Development

Using the Multiple Linear Regression we estimated through Stepwise Method the main factors which are directly correlated to the level of LPD in the 21 European smart cities. We obtained two statistical models, with R2 > 0.73. We have chosen the second model of regression with R2= 0.809. The second model best fits the relation between LPD and other significant factors with minimum effects of the residuals autocorrelation (D.W. = 2.10), statistical significance with F= 7.128, p= 0.016 and the absence of collinearity diagnostics ( τ = 0.614 ; V I F = 1.269 ) .
Table 4. Multiple Linear Regression with LPD-dependent variable (Stepwise Method).
Model Predictors Unstandardized Coefficients Standardized Coefficients Significance Collinearity
B Std. Error Beta T Sig. Tolerance VIF
1 (Constant) -175.144 30.88 -5.672 0.01
Sustainable Development Index 2.782 0.385 0.856 7.228 0.01 1.00 1.00
R2= 0.733, p = 0.001
2 (Constant) -165.177 27.11 -6.093 0.01
Sustainable Development Index 2.073 0.427 0.638 4.853 0.01 0.614 1.629
Economic Freedom 0.658 0.246 0.351 2.67 0.016 0.614 1.629
R2= 0.804, p = 0.016
In order to predict the values of LPD in European smart cities we underline the fact that the interaction between sustainable development and economic freedom are relevant independent factors. Thus, the first predictor is represented by SDI with   β = 0.638 ,   T = 4.853 ,   p = 0.01 , which reflect a moderate positive association between sustainable development and the level of local participatory democracy in the smart cities. The second relevant predictor is represented by economic freedom, with a weak but positive association with the level of local participatory democracy: β = 0.351 ,   T = 2.67 ,   p = 0.01 6. The multiple linear equation of regression between PLD and these predictors is:
P L D = 165.17 + 0.638 × S D I + 0.351 × E F
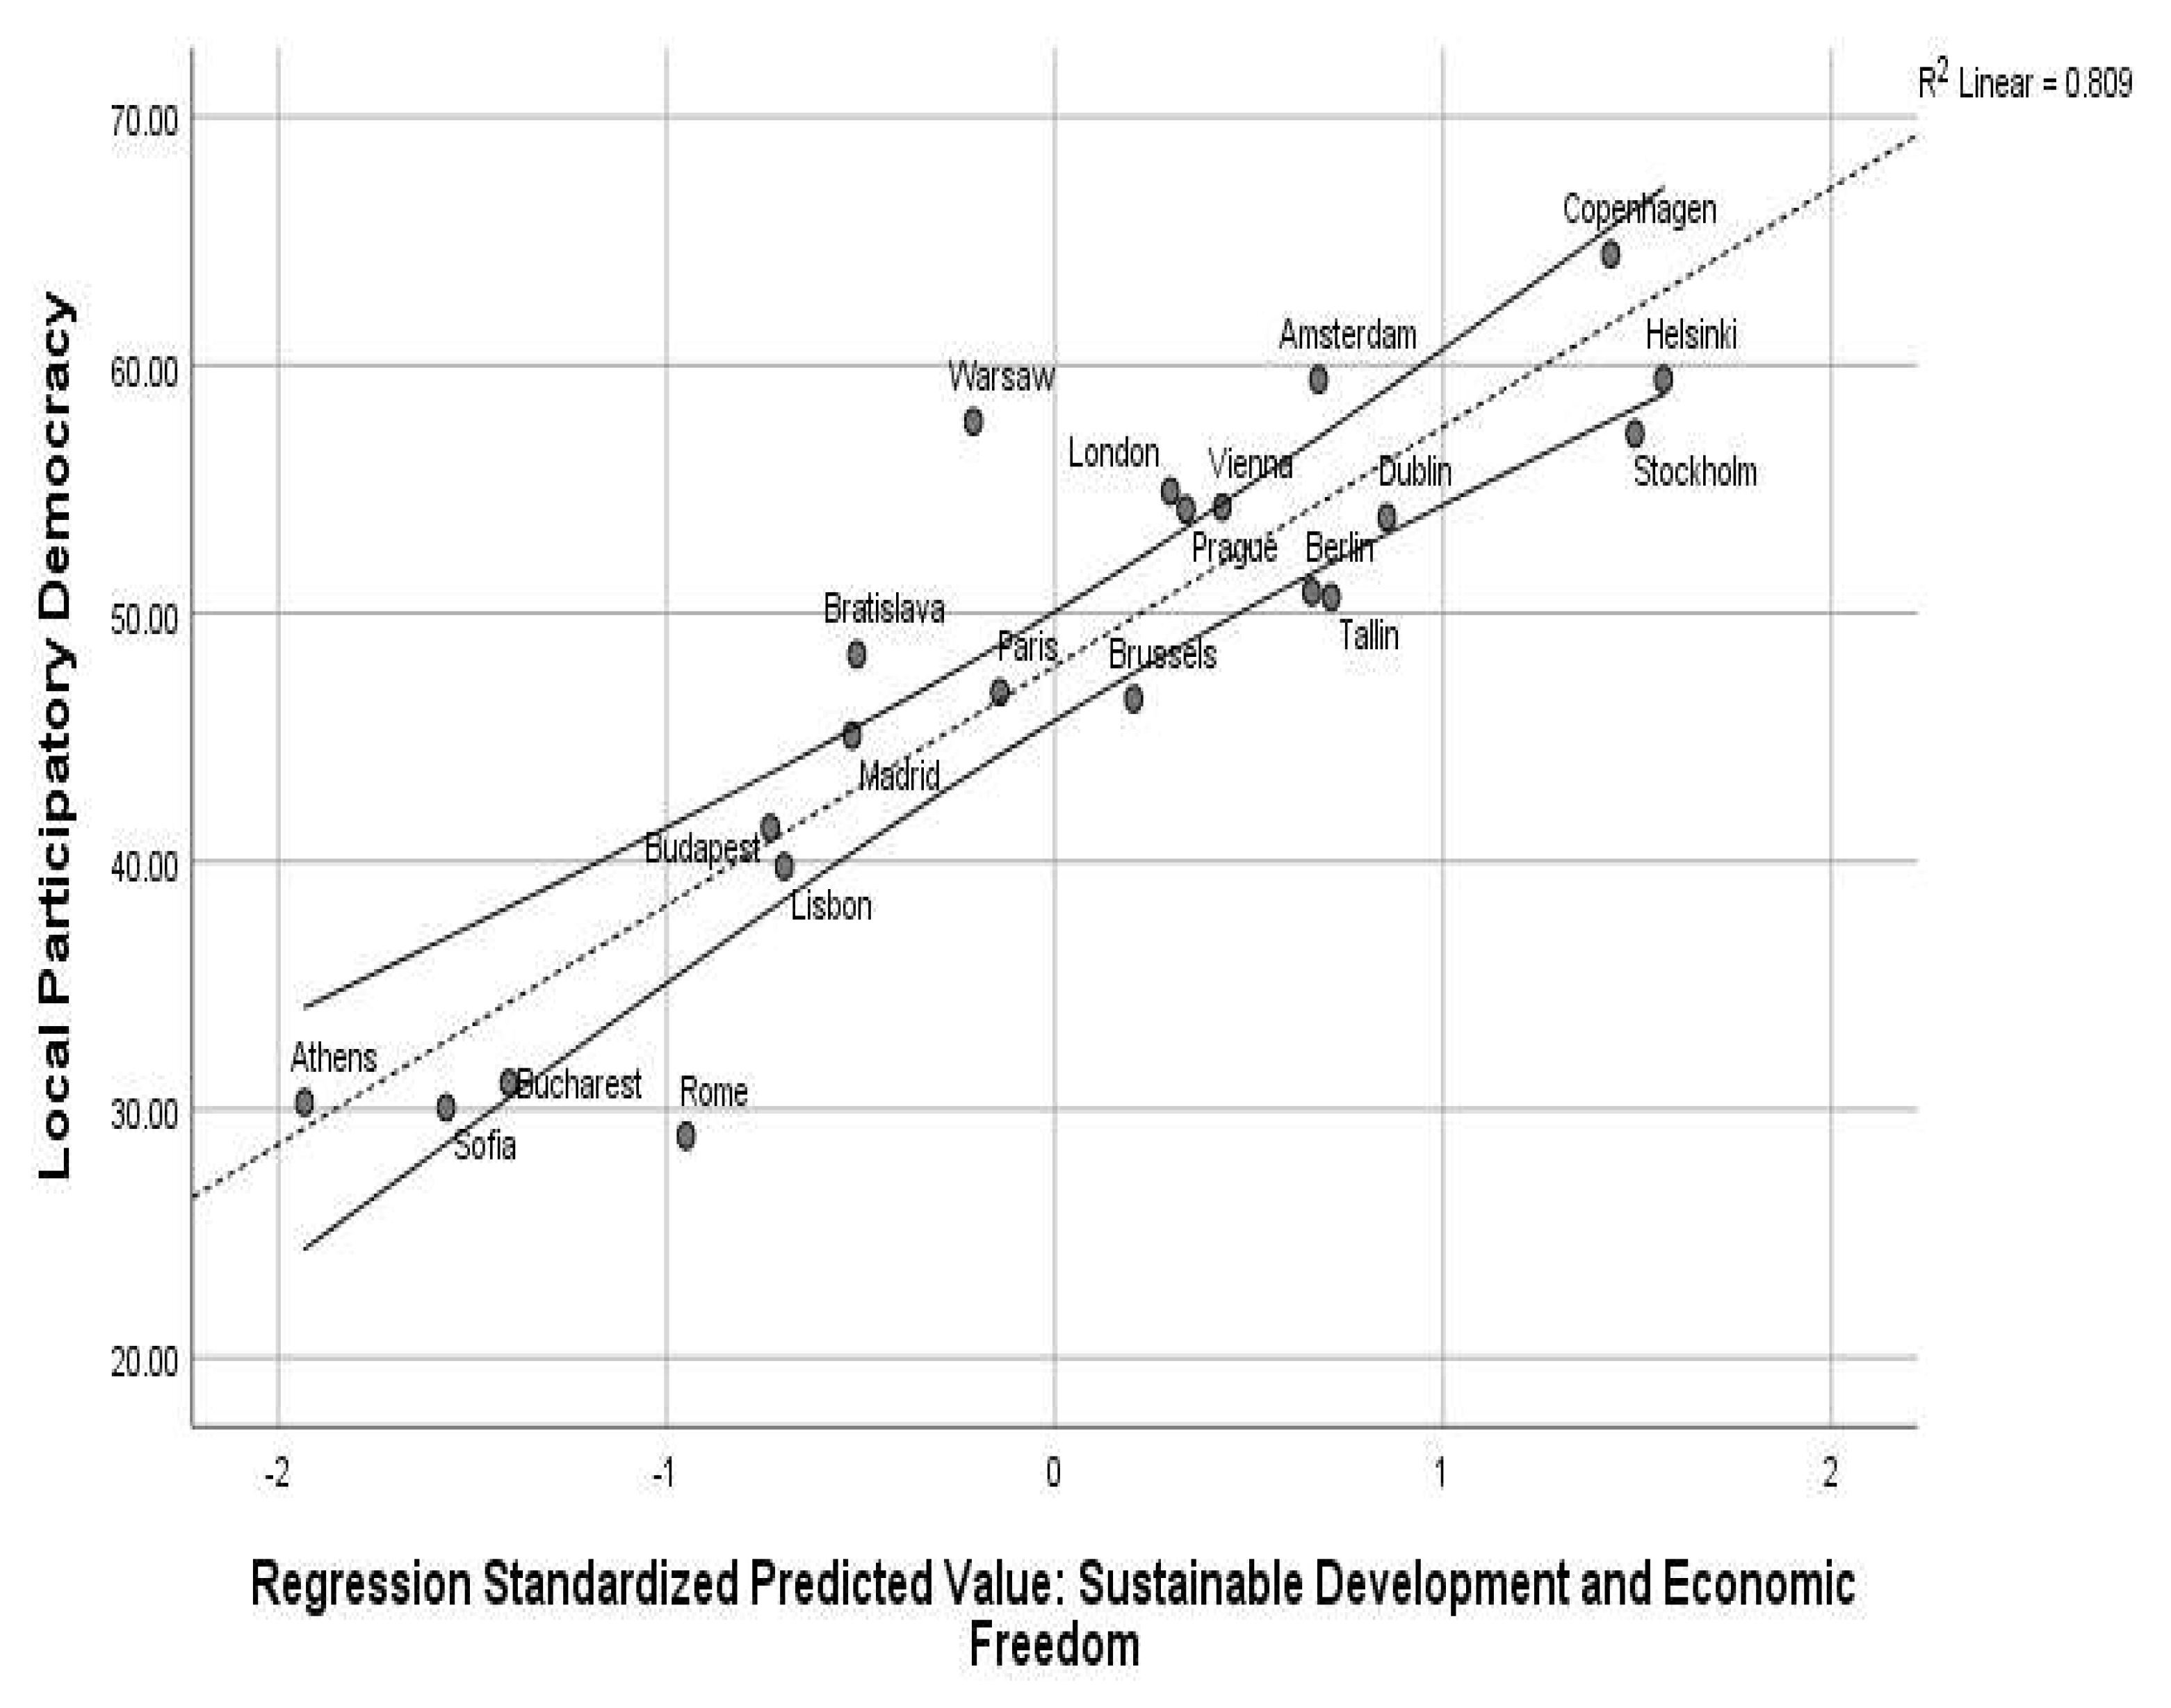
The regression model is characterized by homoscedasticity with normal distribution for both standardized and studentized residuals (Kolmogorov-Smirnov = 0.114, p = 0.20; Shapiro-Wilk= 0.963, p= 0.578). The predictors from the multiple linear equation explain the dynamics of the PLD with the maximum value of 63.83. Statistical measures associated with testing residuals show that there are no centred leverage values (CLV= 0.01; Cook’s Distance= 0.04). Regarding the dynamics of the LPD influenced by SDI and EF, it is observed that these predictors are relevant for explaining the values of LPD in Northern European smart cities such as Copenhagen, Helsinki and Stockholm. The lowest values of the predicted LPD are registered in smart cities from Southern and Eastern Europe: Athens, Sofia, Bucharest and Rome. Figure 4 shows the predicted values of LPD in correlation with predictors of the multiple linear regression:
Besides the estimation of the OLS (Ordinary Least Squares) through the multiple linear regression between the level of LPD and the main independent variables, we used, for refining the research results, both PLS (Partial Least Squares) and WLS (Weighted Least Squares) methods. Both methods show that there are two significant predictors with R2= 0.844. In this meaning we observed that the same predictors are relevant: SDI with β = 0.673 ,   p = 0.015 and FE with β = 0.564 ,   p = 0.036 .
An increased level of SDGs achievement associated with economic freedom (business freedom, trade freedom, fiscal freedom) has a direct effect on increasing the level of residents’ participation in local decision-making in smart cities included in the sample. This result confirms that economic determinants and development are the “core” of participatory democracy. Beyond human capital and other social factors, economic freedom is an important vector for motivating and increasing the level of citizens’ interest and engagement in public affairs. Also, a sustainable society, based on economic development, social integration, environmental protection, strong social and political partnerships and stable institutional and constitutional design is strongly related to an increased level of liberal and participatory democracy.

3.3. Non-Linear Associations with LPD in 21 European Smart Cities: National democracy, Political Culture and Education

Following the methodological guidelines, the paper aims to observe the interaction between the level of LPD and political, social and educational factors. In this context, besides the linear/ directed effects generated by the SDI and EF in the field of LPD, we have measured the impact of the DI, PC, ED and SI in shaping an increased score of the residents’ participation on the public decision-making in the smart cities. Statistical results reveal that there is no direct interaction between social, political and educational factors and the level of citizens’ engagement in public affairs. In addition to this fact, we created several quantitative models, based on the non-linear association between these factors and the dependent variable. The model which best fits the relation between these predictors and the level of LPD is expressed by a cubic relation between the quality of the national democracy, the level of the participatory political culture and the level of education (measured as the proportion of the citizens with upper secondary education in EU regions).
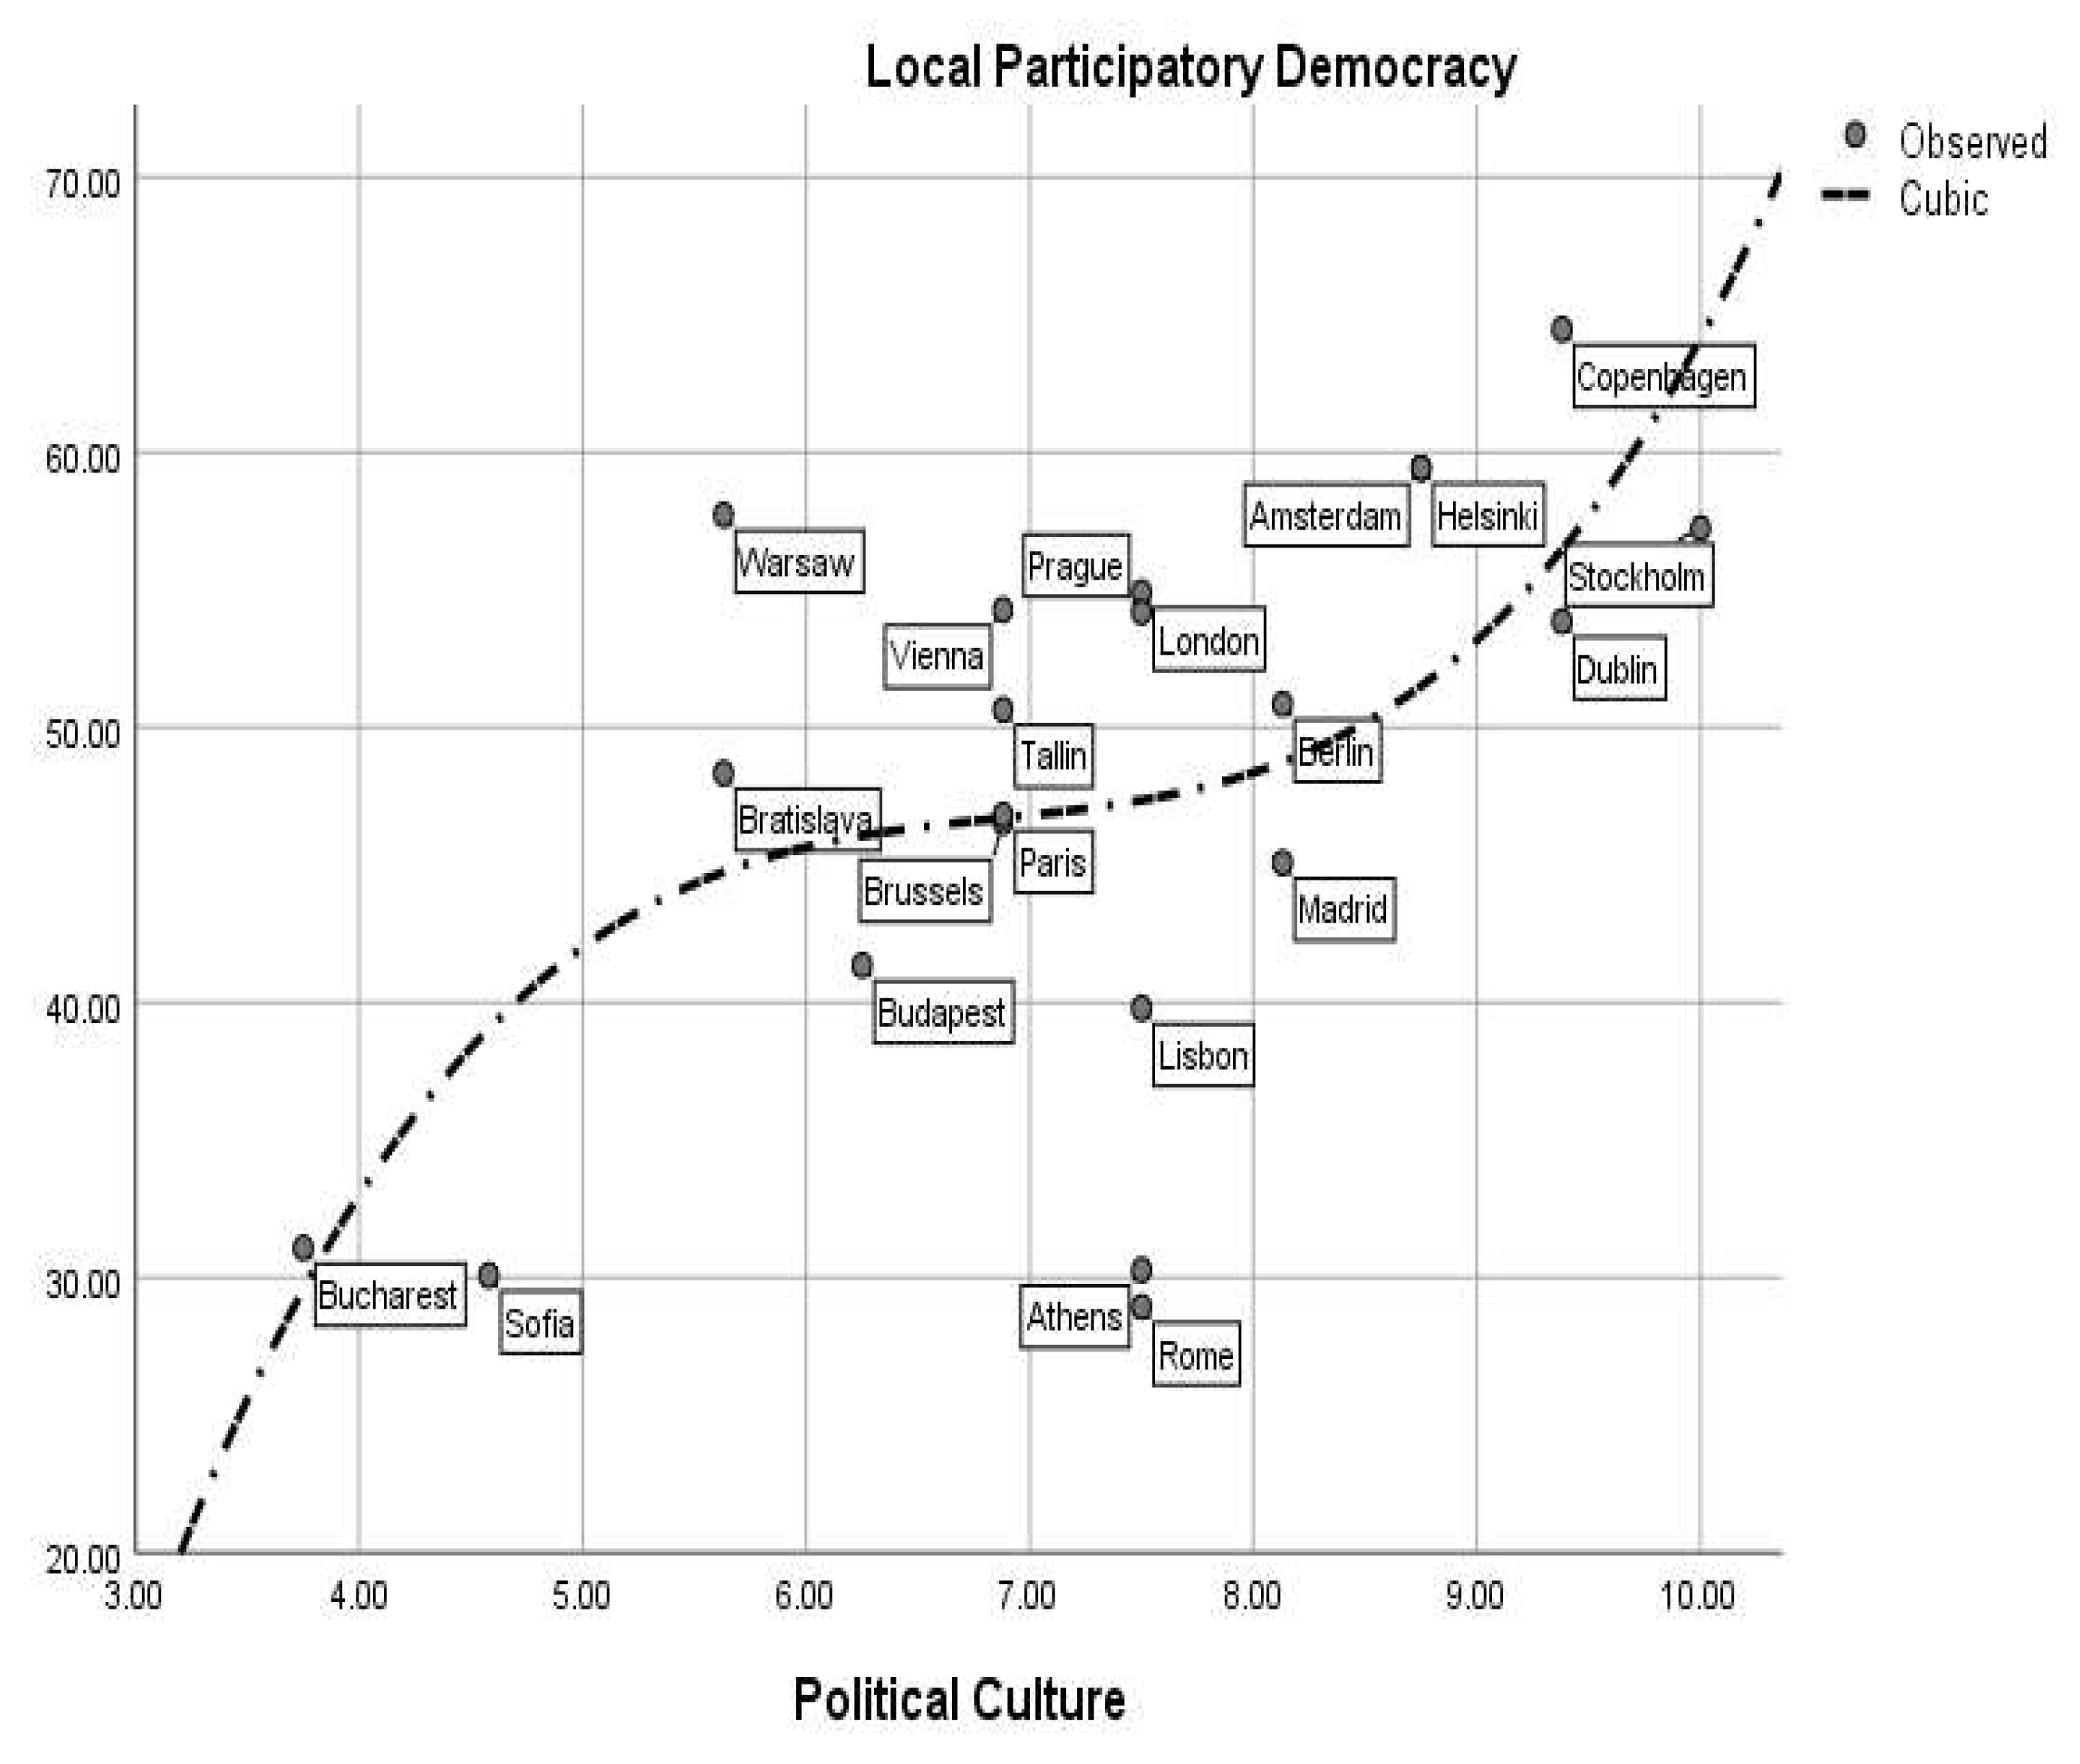
Concerning the relation between political culture and the residents’ involvement in local governance in European smart cities it can be underlined that the statistical model which fits the data and their interaction is a cubic equation of regression with R2= 0.385:
L P D = 0.480 × P C 3 9.876 P C 2 + 68.64 × P C 114.22
The statistical result confirms that there is a weak and nonlinear relation between the level of the national participatory political culture and citizens' involvement in local public decision-making. Related to this finding, we underline the fact that data have linear positive correlations only in several smart cities as Western and Northern European capitals: Copenhagen (PLD= 64.46; PC= 9.38), Stockholm (PLD= 57.23; PC= 10), Helsinki (PLD= 59.43; PC= 8.45), Amsterdam (PLD= 59.41; PC= 8.45) and Dublin (PLD= 53.97; PC= 9.38). The theoretical approach based on the direct relationship between political culture and local participatory democracy is relevant only for 23.80% of the smart cities included in the sample. Figure 5 presents the nonlinear regression between political culture and local participatory democracy:
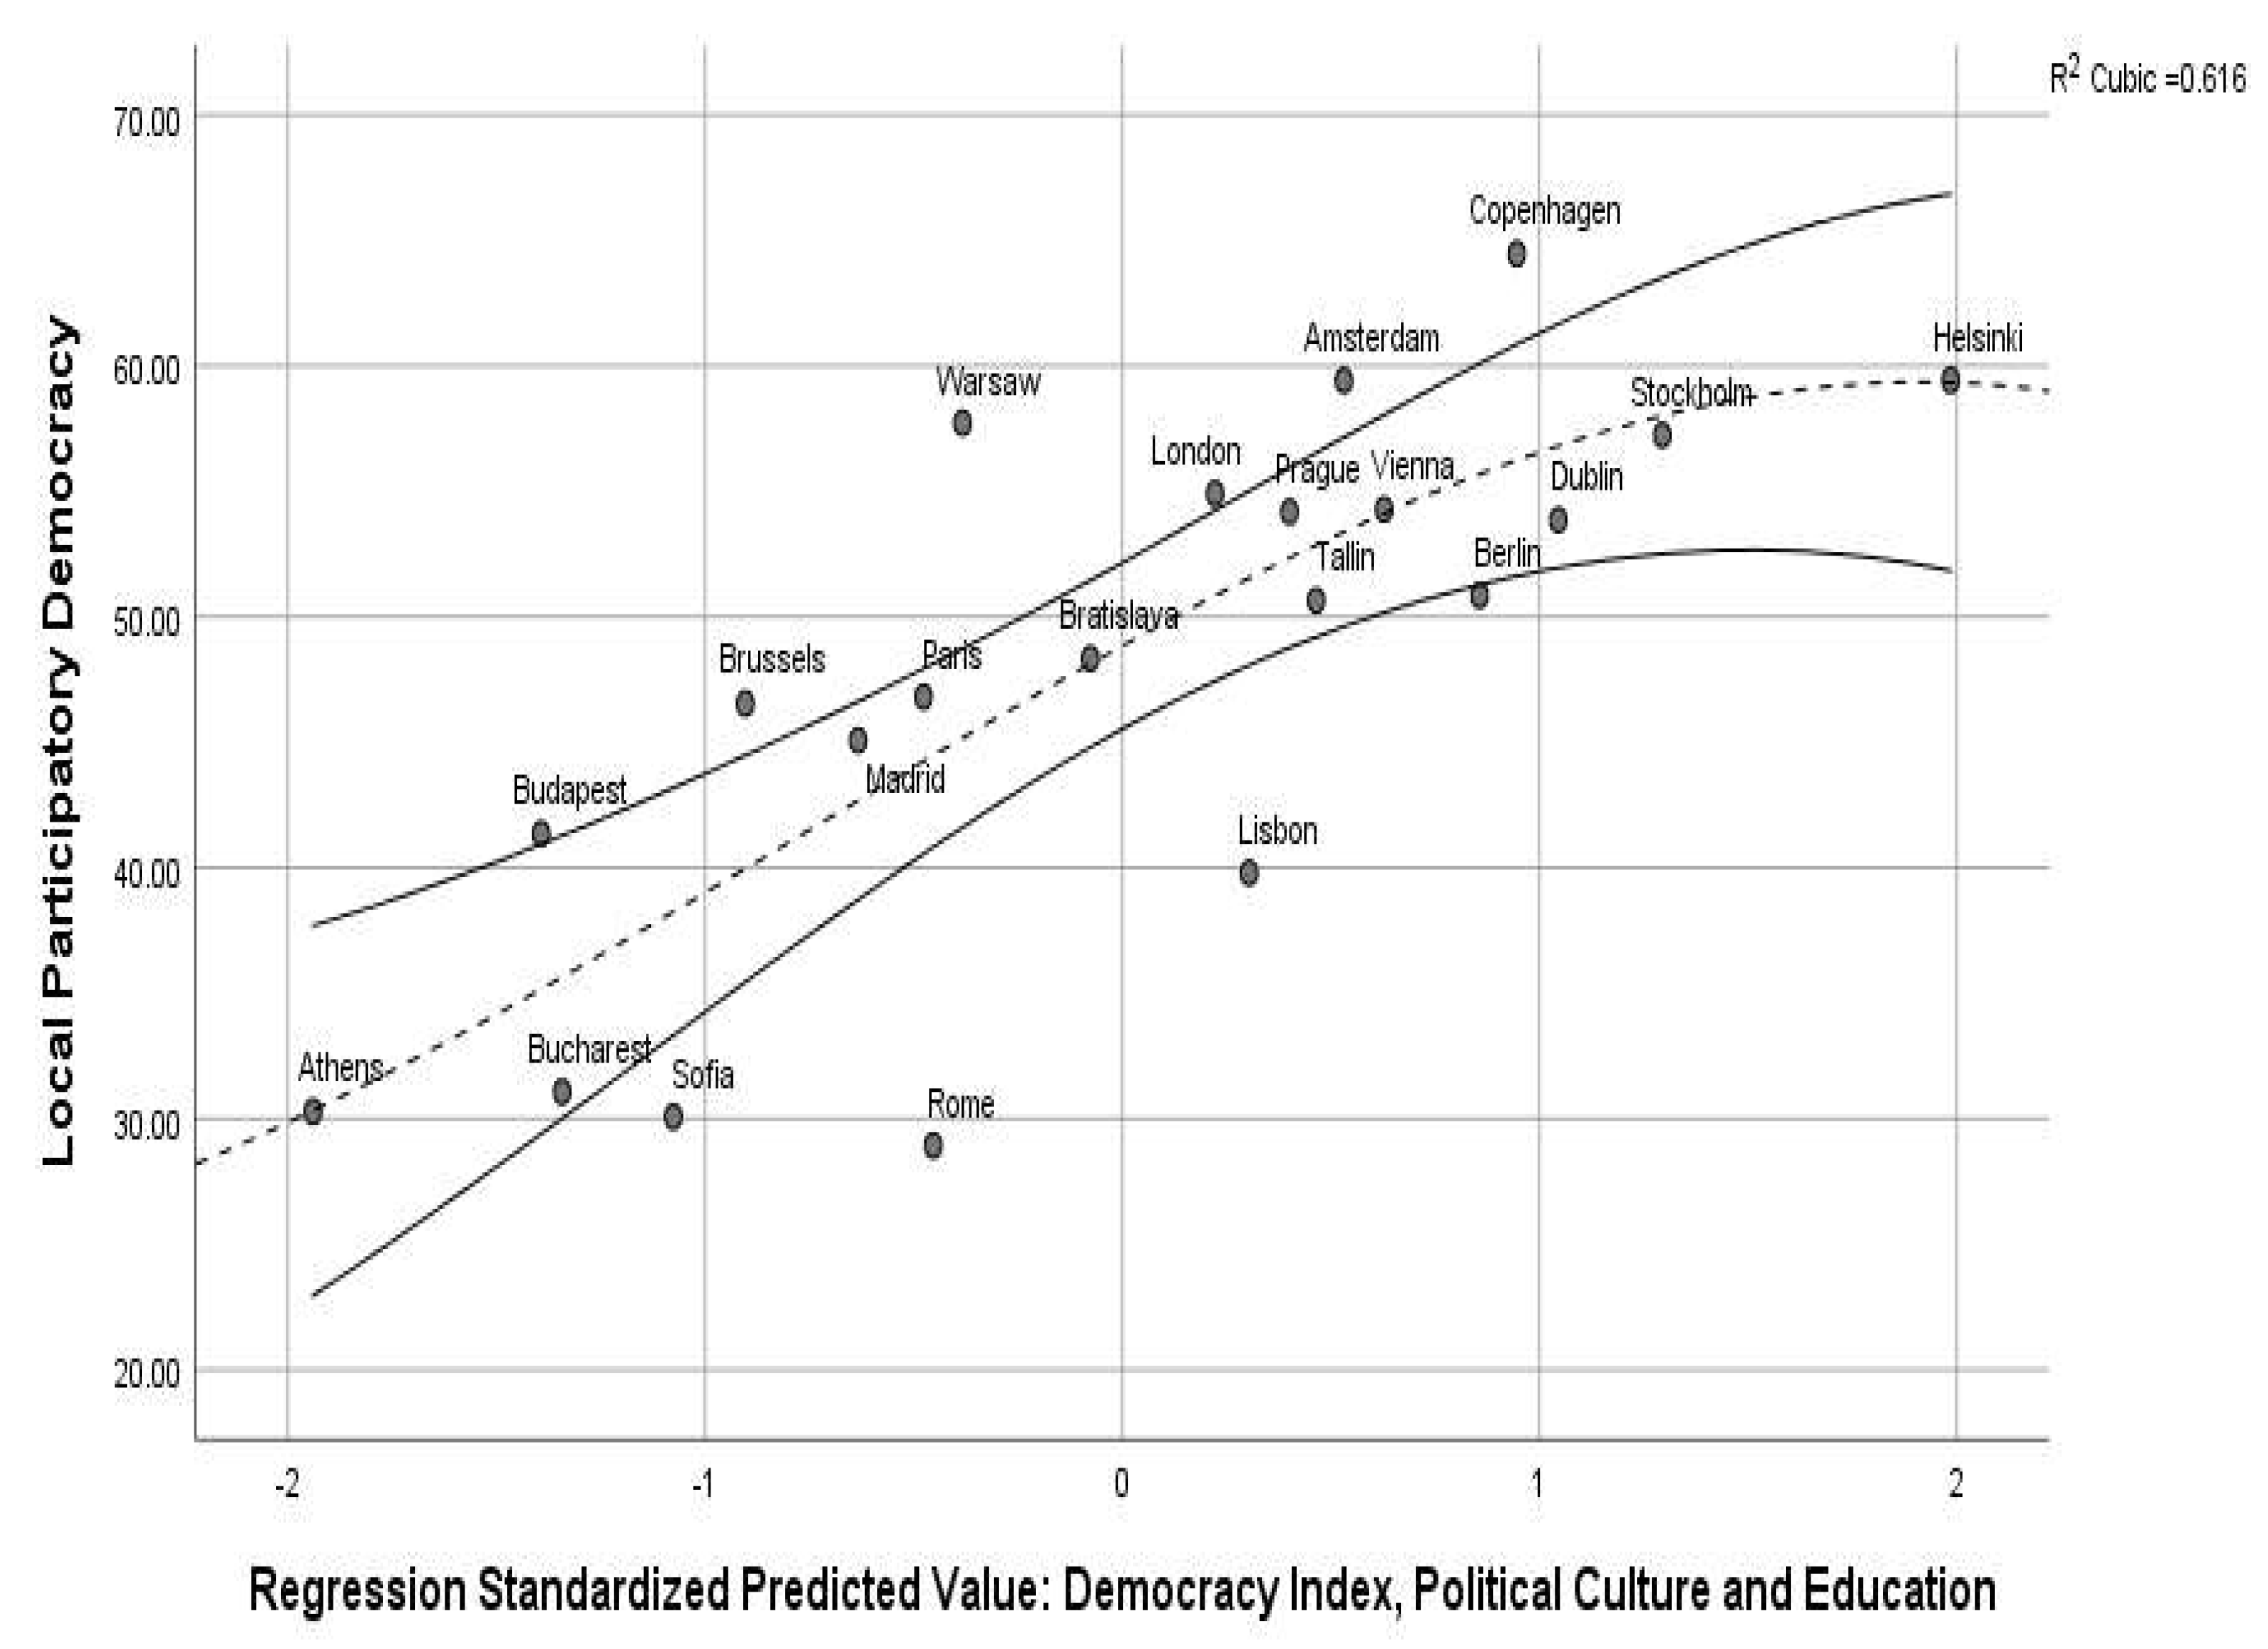
Accordingly, to this empirical finding, we created several statistical models in order to explain the relationship between LPD, the quality of the national democracy, political culture, education, human development and social inclusion. The model which best fits the relation between LPD and other factors is a cubic model, with the value of R2 = 0.616 and the best level of significance p < 0.001:
L P D = 0.06 × D I 3 0.115 × P C 2 + 0.770 × E D 42.46
An important statistical result refers to the fact that the quality of the national democracy and the degree of the participatory political culture needs to be complemented by a high level of education among residents in smart cities. Upper secondary education in European smart cities might be seen as an important vector of increasing the level of participation in local public debates, local decision-making and assessment of the local government's public policies. Although there isn’t a direct implication of upper secondary education in the field of participation we agree with the fact that full democracies, with a high level of participatory political culture and upper-secondary educated residents, are more prone to shape good practices in the field of local participatory democracy. A high level of education is strongly related to individuals’ information about public affairs, political motivation to participate in public debates and decisions a long-term involvement in local political life. Figure 6 shows the association between democracy, political culture, education and the level of local participatory democracy using a cubic regression:
The cubic model is characterized by homoscedasticity with the normal distribution of both standardized and studentized residuals (Kolmogorov-Smirnov= 0.08, p= 0.2; Shapiro-Wilk= 0.988, p= 0.994). The model reflects that LDP depends on the nonlinear association between democracy, political culture and education in European smart cities like Helsinki, Stockholm, Dublin, Vienna, Prague, London and Berlin. Moderate values of the statistical association between the dependent variable and these factors are met in European capitals like Bratislava, Paris, Madrid, Brussels, Bucharest and Athens. Except for Warsaw, Copenhagen, Rome and Lisbon, the nonlinear association between Democracy Index, level of participatory culture and upper secondary education might predict the values related to the local participatory democracy in 80.95% of the smart cities included in the sample.

3.4. Priority Areas in 21 European Smart Cities. The SEM Model of Local Participatory Democracy

In the previous subsections, we observed the direct and indirect effects of the independent variables in the sphere of local participatory democracy. In this respect, the paper estimates that sustainable development and economic freedom are relevant predictors for increasing the level of local democracy in European smart cities. In addition to these direct and indirect factors, in this section, we present the main issues which are described by smart cities’ residents in terms of priority areas or urgent issues which must be solved by the local government.
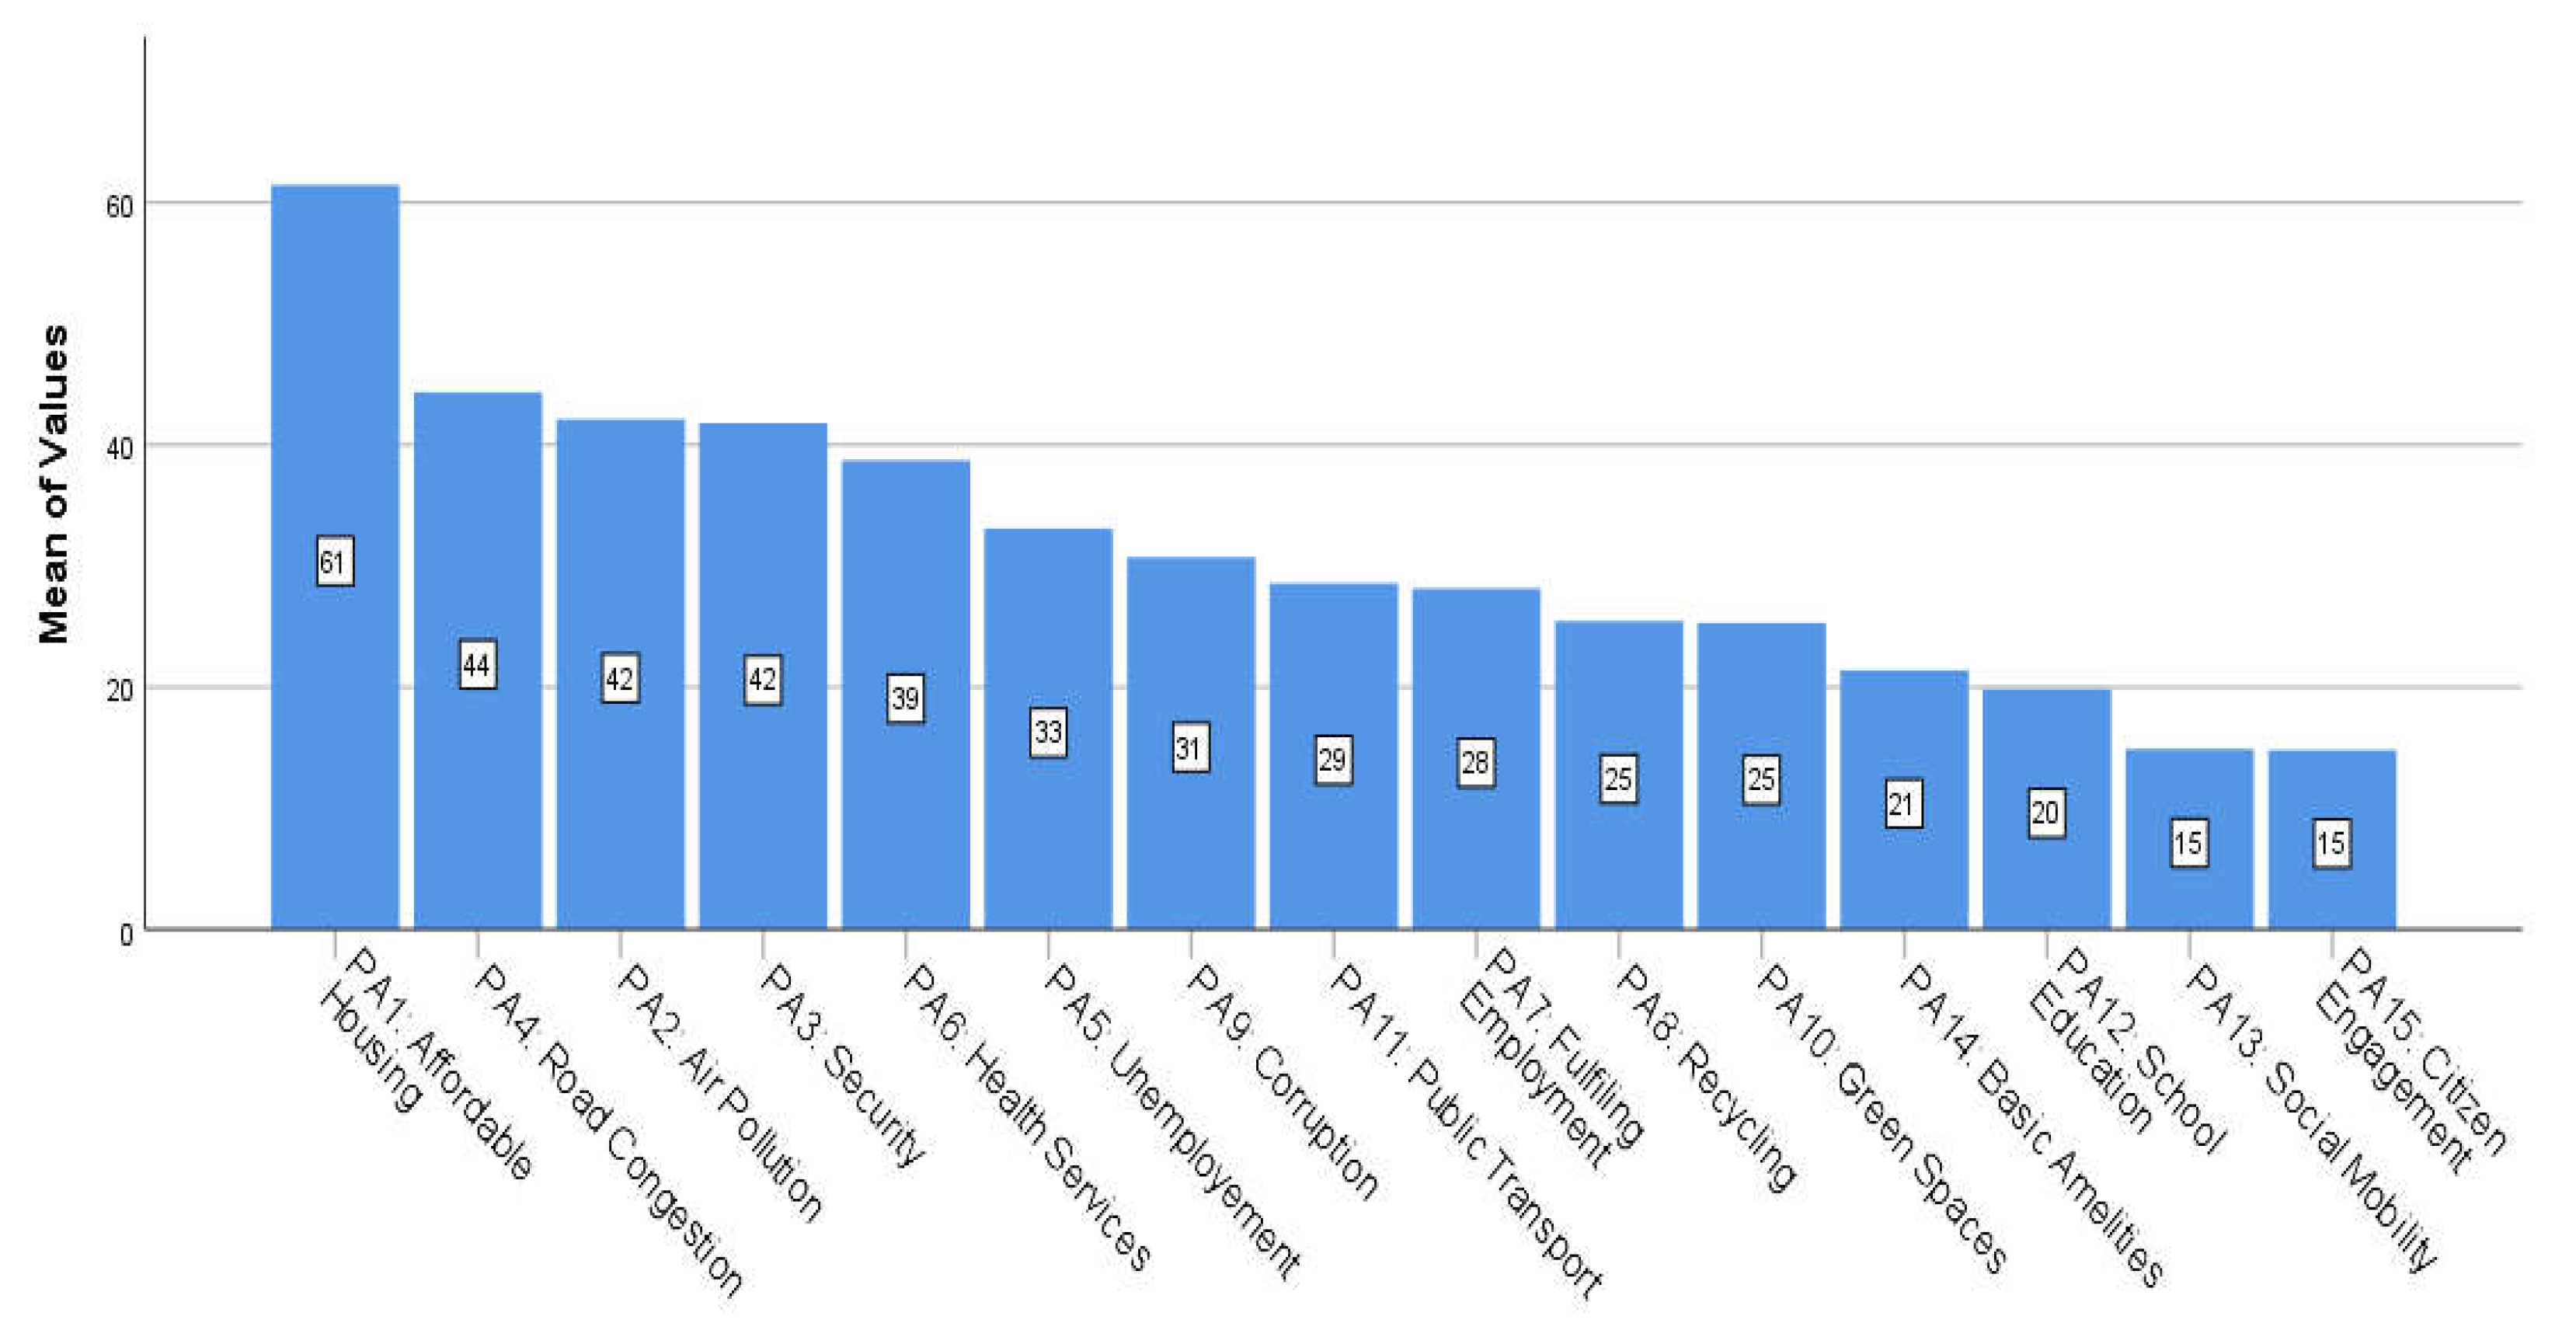
In order to evaluate the priorities from all 21 smart cities we used the average values of each item of the scale related to the priority areas. Generally speaking, in all 21 smart cities we observed that in top 5 urgent issues for local government included: affordable housing (PA1 = 61%), road congestion (PA4= 44%), air pollution (PA2= 42%), security (PA3= 42%) and health services (PA6 = 39%). Figure 7 shows the average values from 21 European smart cities for 15 priorities areas, considered urgent issues by the residents:
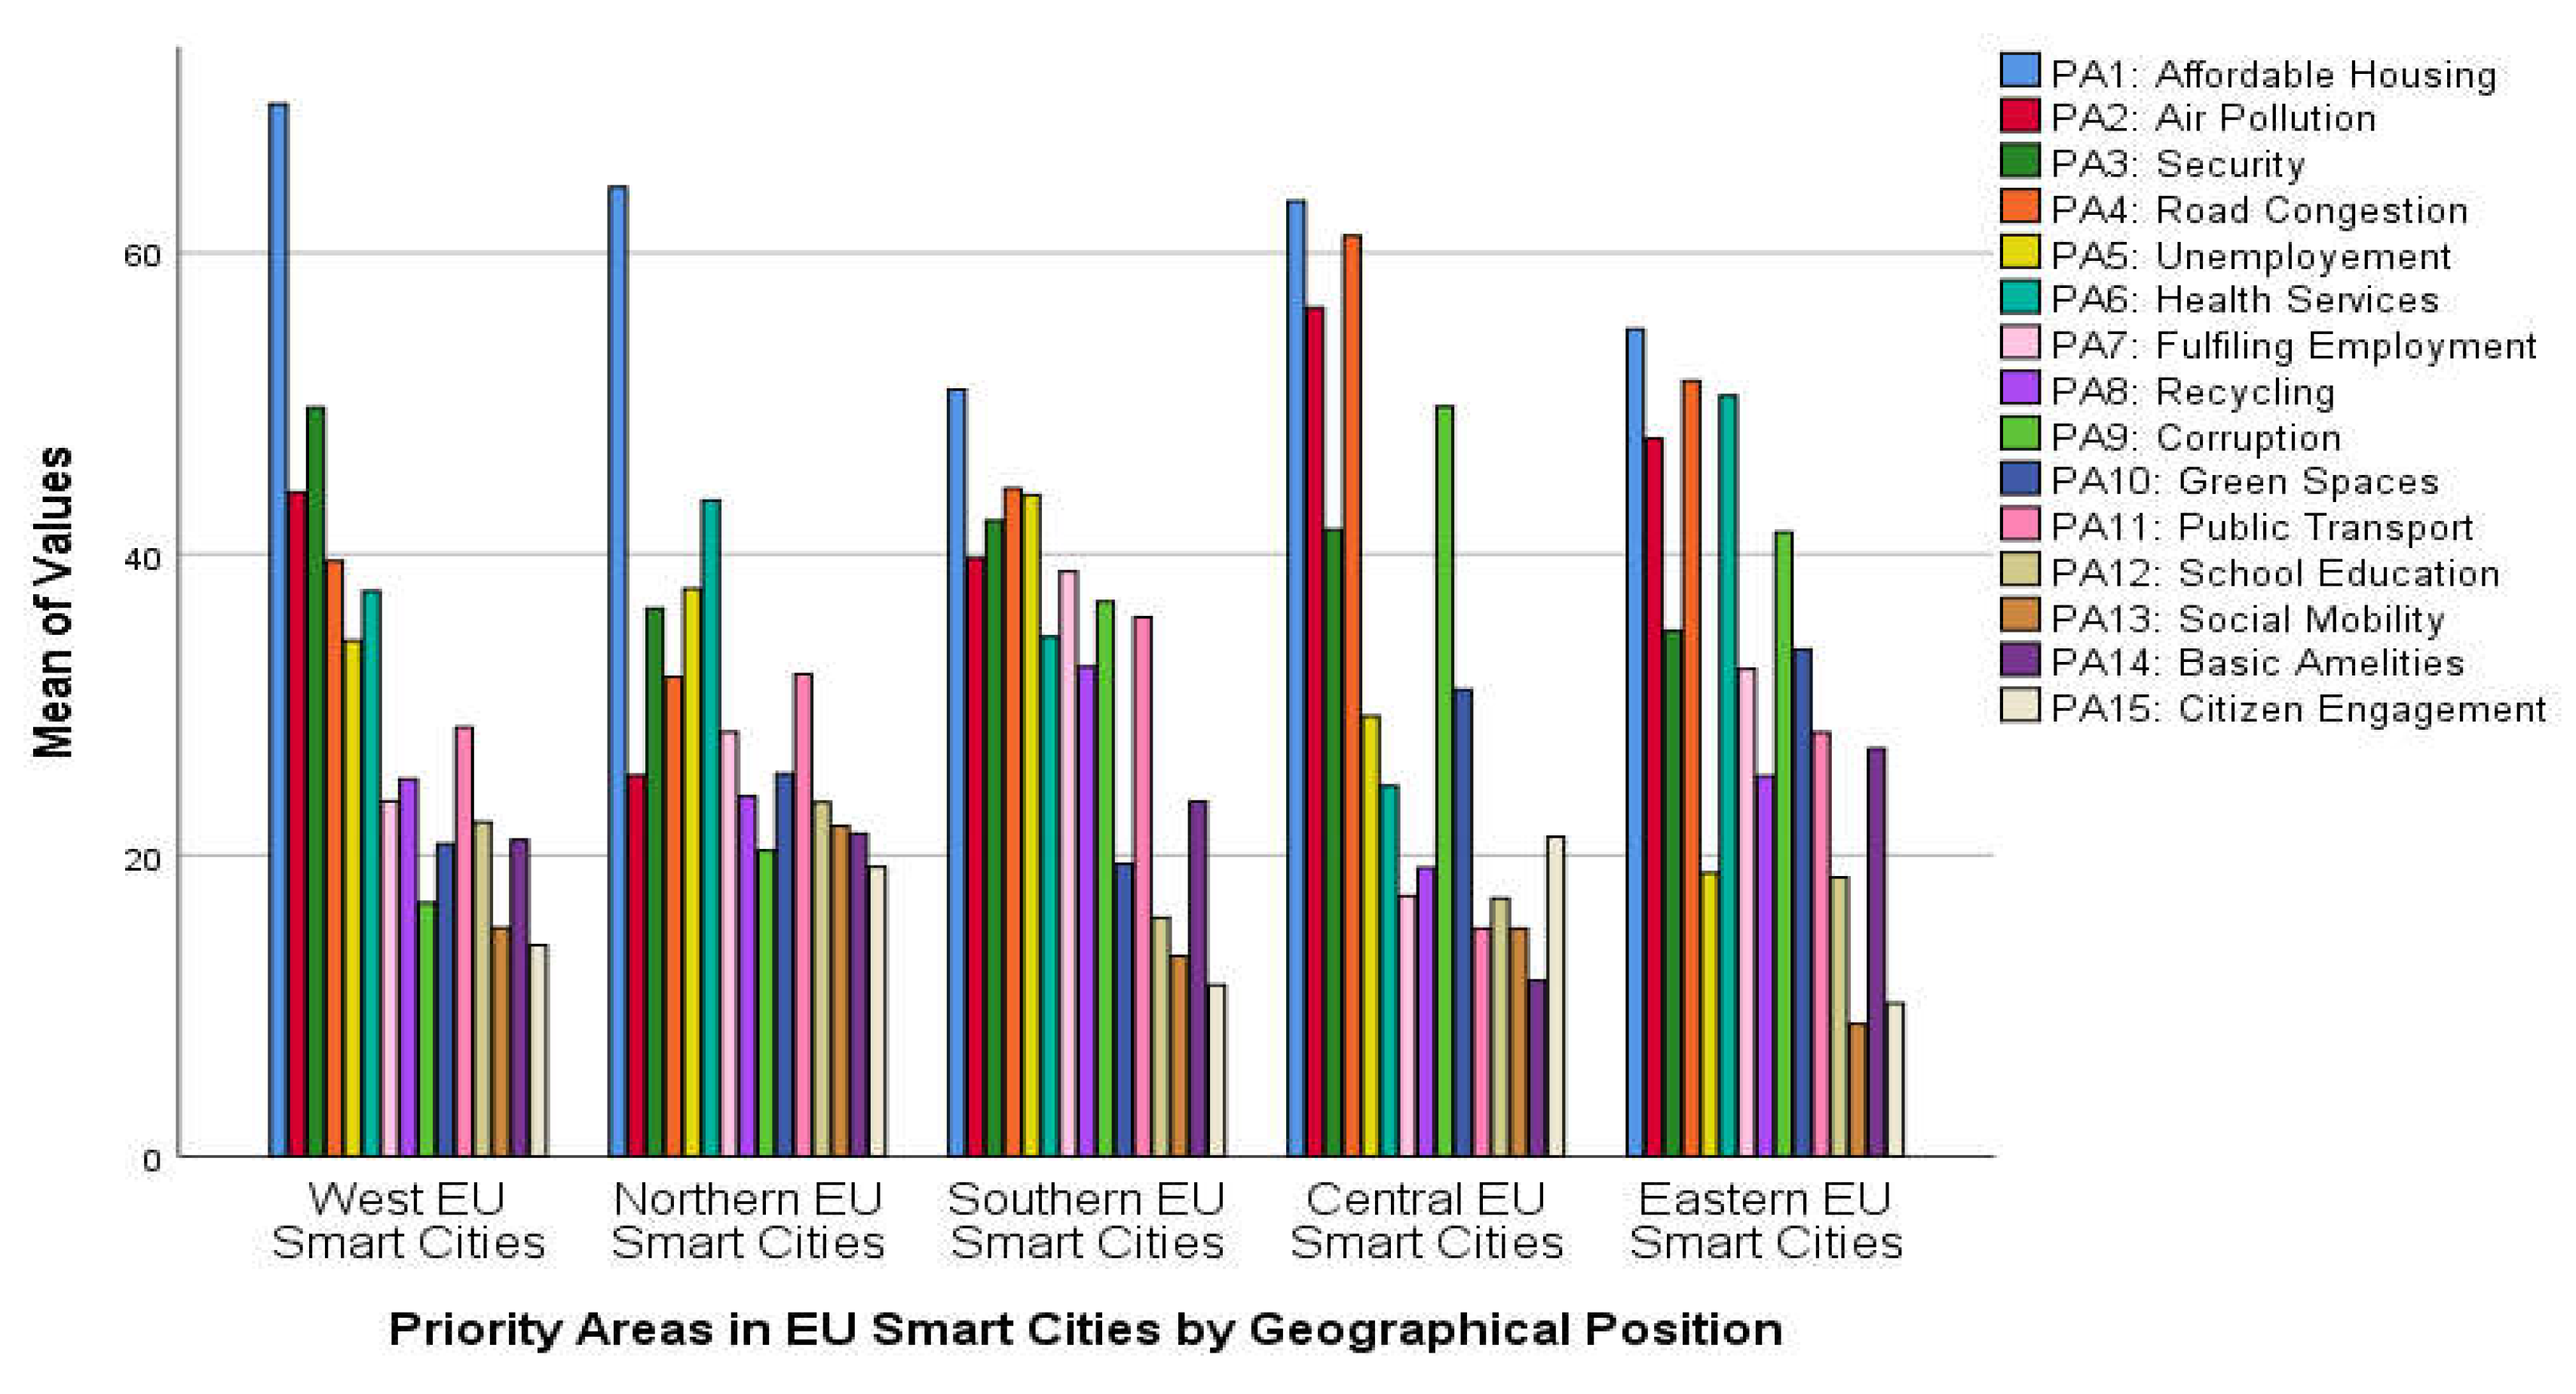
Concerning the geographical distribution, there are significant statistical differences in the proportion and hierarchy of the priority areas within the smart cities included in the sample. There are similar values of affordable housing across all observed statistical units. For all the residents of the European smart cities, this is considered to be an important problem. In the capitals of Western European countries, the main priority areas for local government should be represented by: security (PA3= 49.73%), air pollution (PA2= 44.10%) and road congestion (PA4= 39.55%). Besides the affordable housing, in smart cities from Nordic European capitals, the urgent problems that have to be solved by the local governments are health services (PA6 = 43.57%), unemployment (PA5 = 37.70) and security (PA3= 36.70%). Regarding the smart cities from the Southern countries, residents consider that the urgent problems which have to be solved by local public administration are related to road congestion (PA4= 44.35%), unemployment (PA5 = 43.92) and security (PA3= 42.92%).
In Central European countries, residents of the smart cities considered that the main priorities areas for local administration should be represented by: road congestion (PA4= 61.13%), air pollution (PA2= 56.36%) and corruption (PA9= 49.88%). Besides the road congestion (PA4= 51.50%), in Eastern European countries, residents of the smart cities considered urgent problems for local authorities both health services (PA6 = 50.52%) and corruption (PA9= 41.45%). Figure 8 presents the main findings related to the distribution of priority areas by the geographical position of the country:
These descriptive results emphasize the main differences generated by the geographical distribution and the particularities of the Central and Eastern European countries, where residents consider corruption is an urgent issue which needs to be solved by the local government.
Using structural equation modelling (SEM) we aimed to observe the relations between residents’ participation in local decision-making in the 21 smart cities included in the sample. For clarifying our quantitative design we use the following mathematical approach [101]:
Proposition 1.
Let be y 1 ,   y 2 ,   z 1 - variables and M- the mathematical model. If y 1 ,   y 2 ϵ M, than y 1 and y 2   are endogenous variables. If   z 1 M, than   z 1 is an exogenous variable.
Proposition 2.
Given that y 1 ,   y 2 ,   z 1 the relation between y 1 ,   y 2 ,   z 1 is described by the following equations:
y 1 = γ 1 + β 1 × y 2 + ε i
y 2 = y 1 +   z 1
Proposition 3.
Given the relations (13) and (14), than the coefficient   β 1 is written as the ratio between the following partial derivates:
β 1 = y 1   z 1 ÷ y 2   z 1 β 1 = y 1 y 2
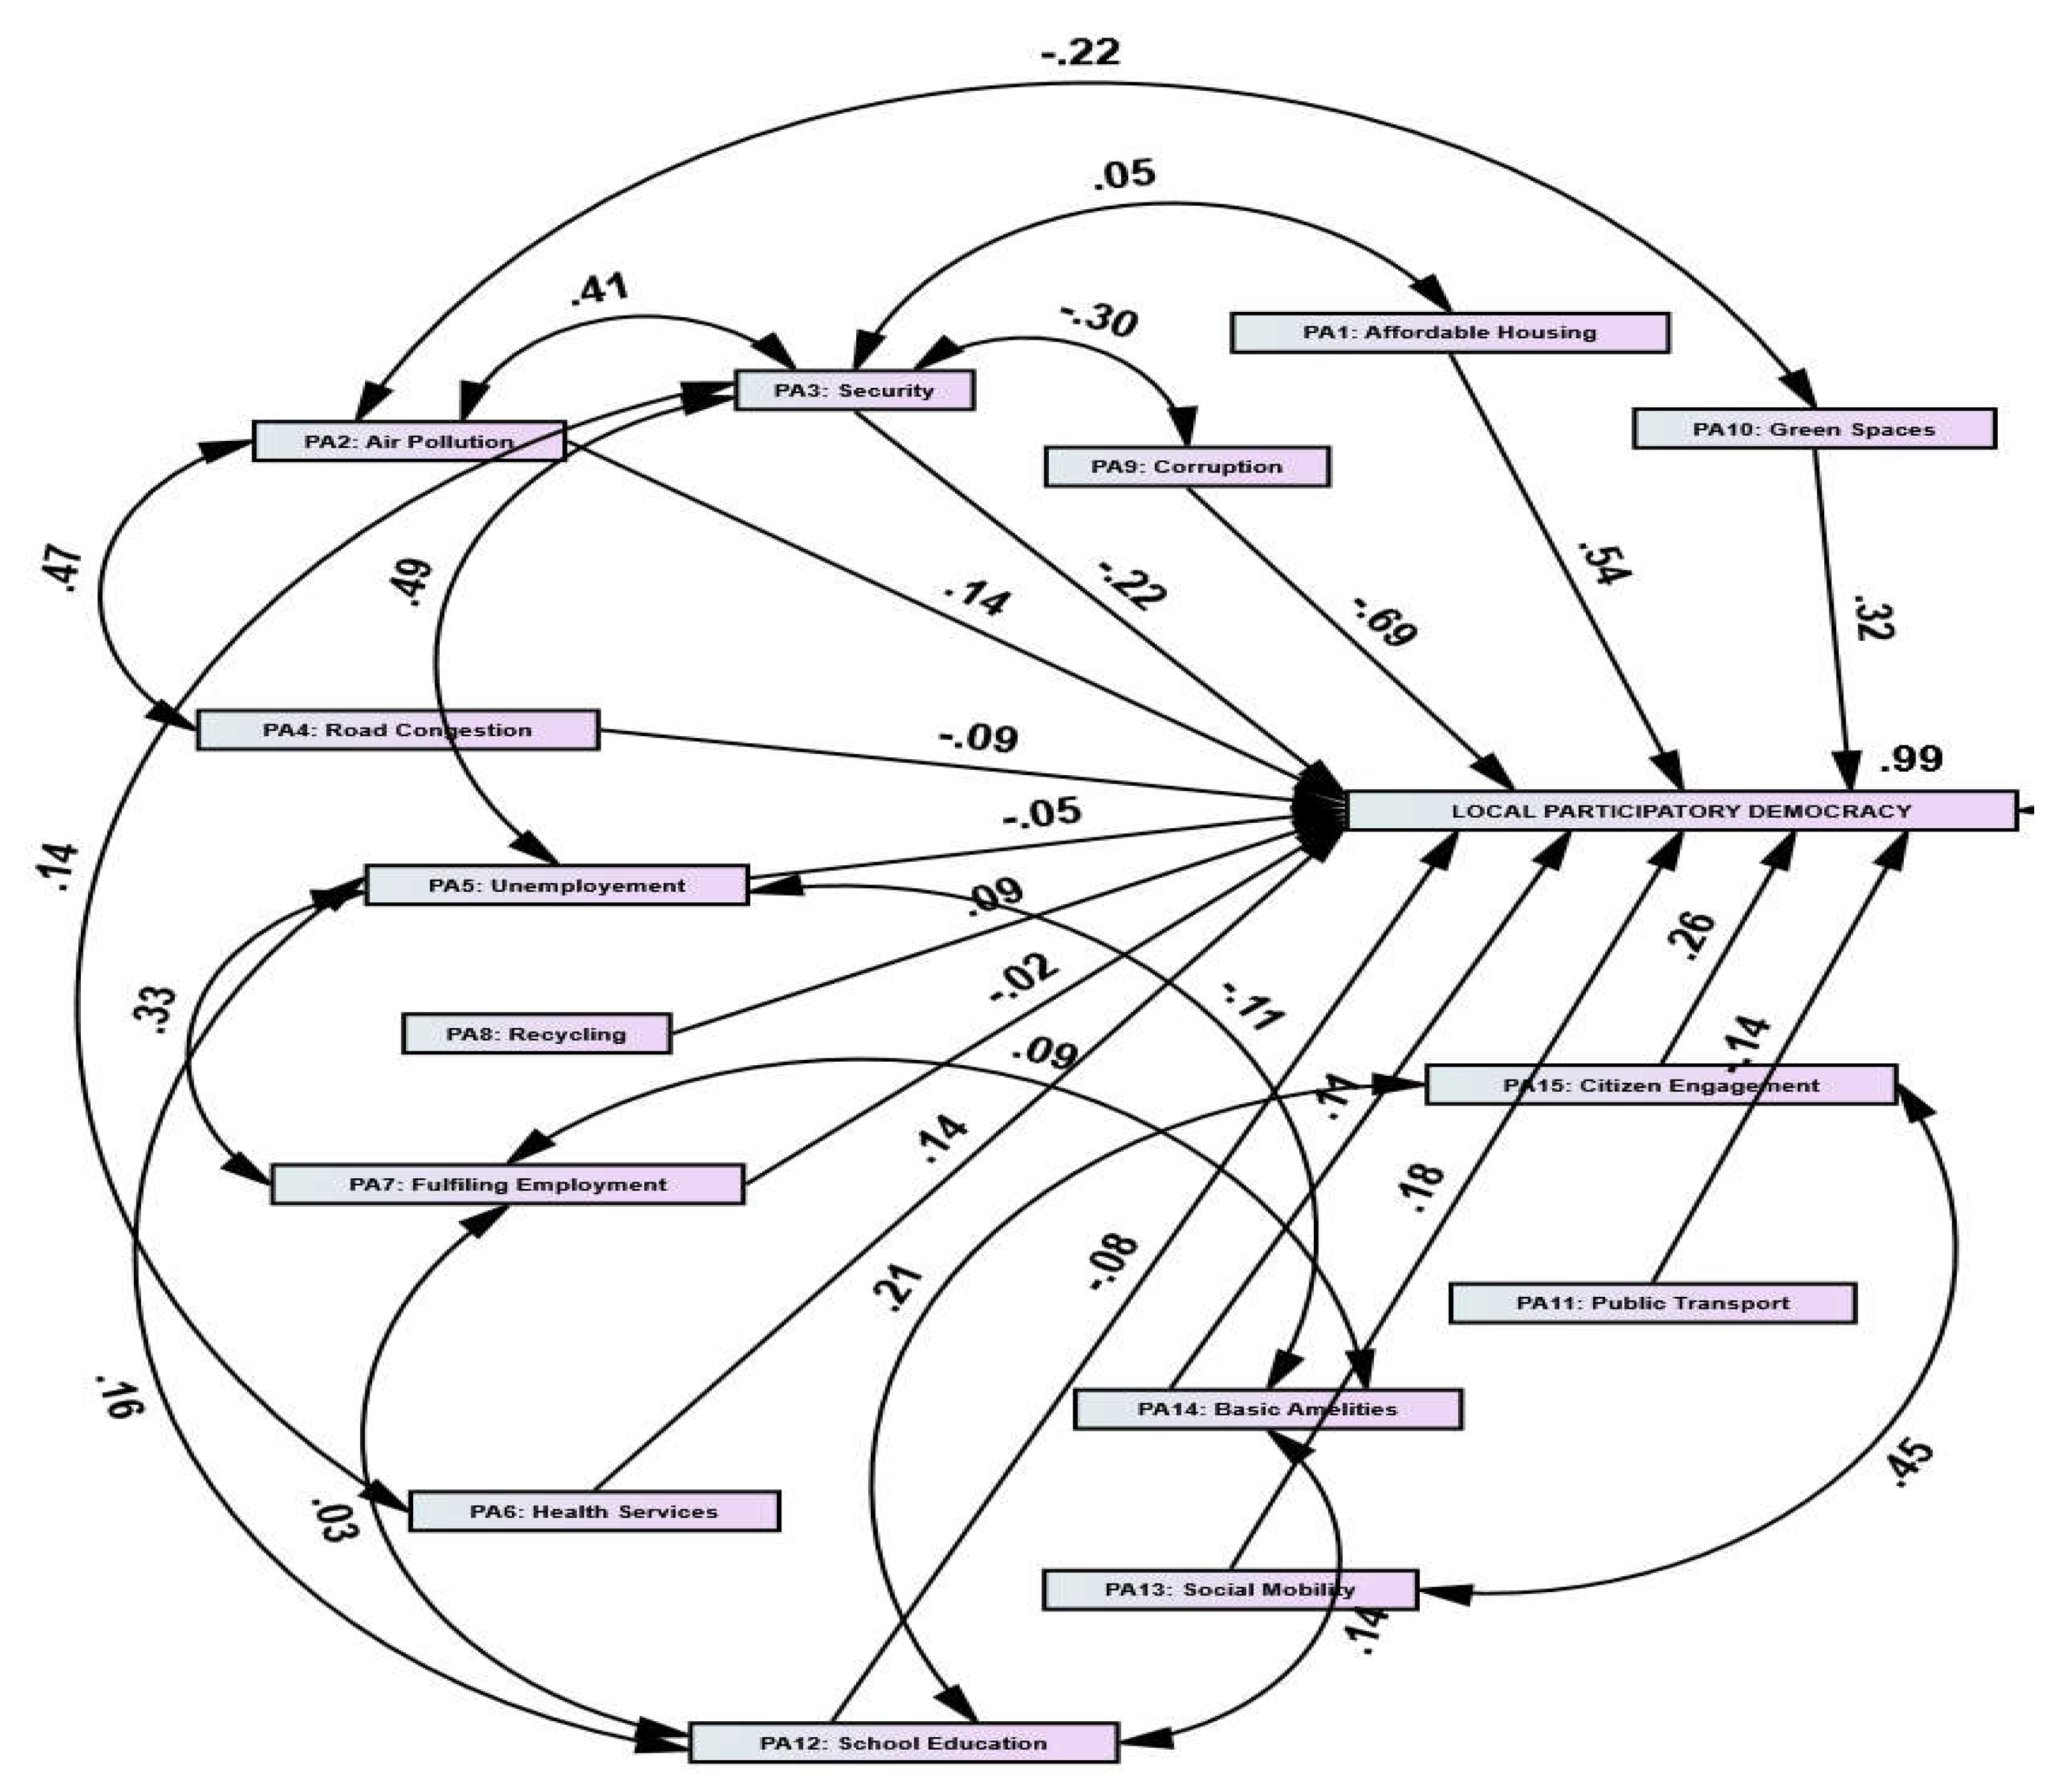
In correlation to this theoretical perspective, using the sample of the 21 sample of 21 smart cities we created a model for estimating the predictors of LPD using as factors the 15 Priority Areas (PA1-15). The SEM model results with LPD as a dependent variable indicate the following structural equation:
L P D = 27.676 + 0.54 × P A 1 0.69 × P A 9
Taking into account only the relevant predictors ( β 1 > 0.50 ,   p < 0.05 ) the model shows that affordable housing ( P A 1 ) and corruption ( P A 1 ) are seen as determinants factors of an increased level of LPD in European smart cities. However, there is a moderate negative correlation between corruption ( β = 0.69 )   and the level of local participatory democracy in European smart cities included in the sample. The statistical result confirms that residents’ participation in local decision-making and assessment of the local governmental public policies might be explained by a low level of political and administrative corruption. Smart cities with the lowest values in the field of political and administrative corruption are more likely to develop both judicial frameworks and political practices related to participatory democracy. In smart cities in which corruption isn’t considered an urgent issue, local decision-makers registered the highest rates of the LPD. In this sphere, relevant examples are: Stockholm (PA9 = 8.1%; LPD = 57.23), Helsinki (PA9 = 8.8%; LPD = 59.43), Amsterdam (PA9 = 12.3%; LPD = 59.41) and Copenhagen (PA9 = 15.6%; LPD = 64.46). In contrast, in smart cities where corruption is considered a priority area by the residents, statistical data confirm the lowest rates of LPD. The relevant examples of smart cities characterized by an increased level of residents’ concern about corruption and the smallest values of LPD are Sofia (PA9 = 61.5%; LPD = 30.8), Bucharest (PA9 = 53.8%; LPD = 31.07), Athens (PA9 = 40%; LPD = 30.28) and Budapest (PA9 = 47.4%; LPD = 41.35). Figure 9 shows the structural equations for explaining the dynamics of LPD in 21 smart cities from the sample:
In addition to the absence of corruption, another important factor related to LPD is affordable housing. There is a moderate positive correlation between affordable housing (PA1) and the level of LPD ( β = 0.54 ) . This positive relation is highlighted by several arguments and perspectives like i. create equal opportunities in local decision-making; ii. increase civic engagement taking into consideration the fact that diverse categories of citizens are living within smart cities; iii. reduce social and economic disparities generating an inclusive model of participatory democracy; iv. create premises for social cohesion and real opportunities for reducing social and political exclusion, taking into consideration the large participation of the residents in local decision-making.
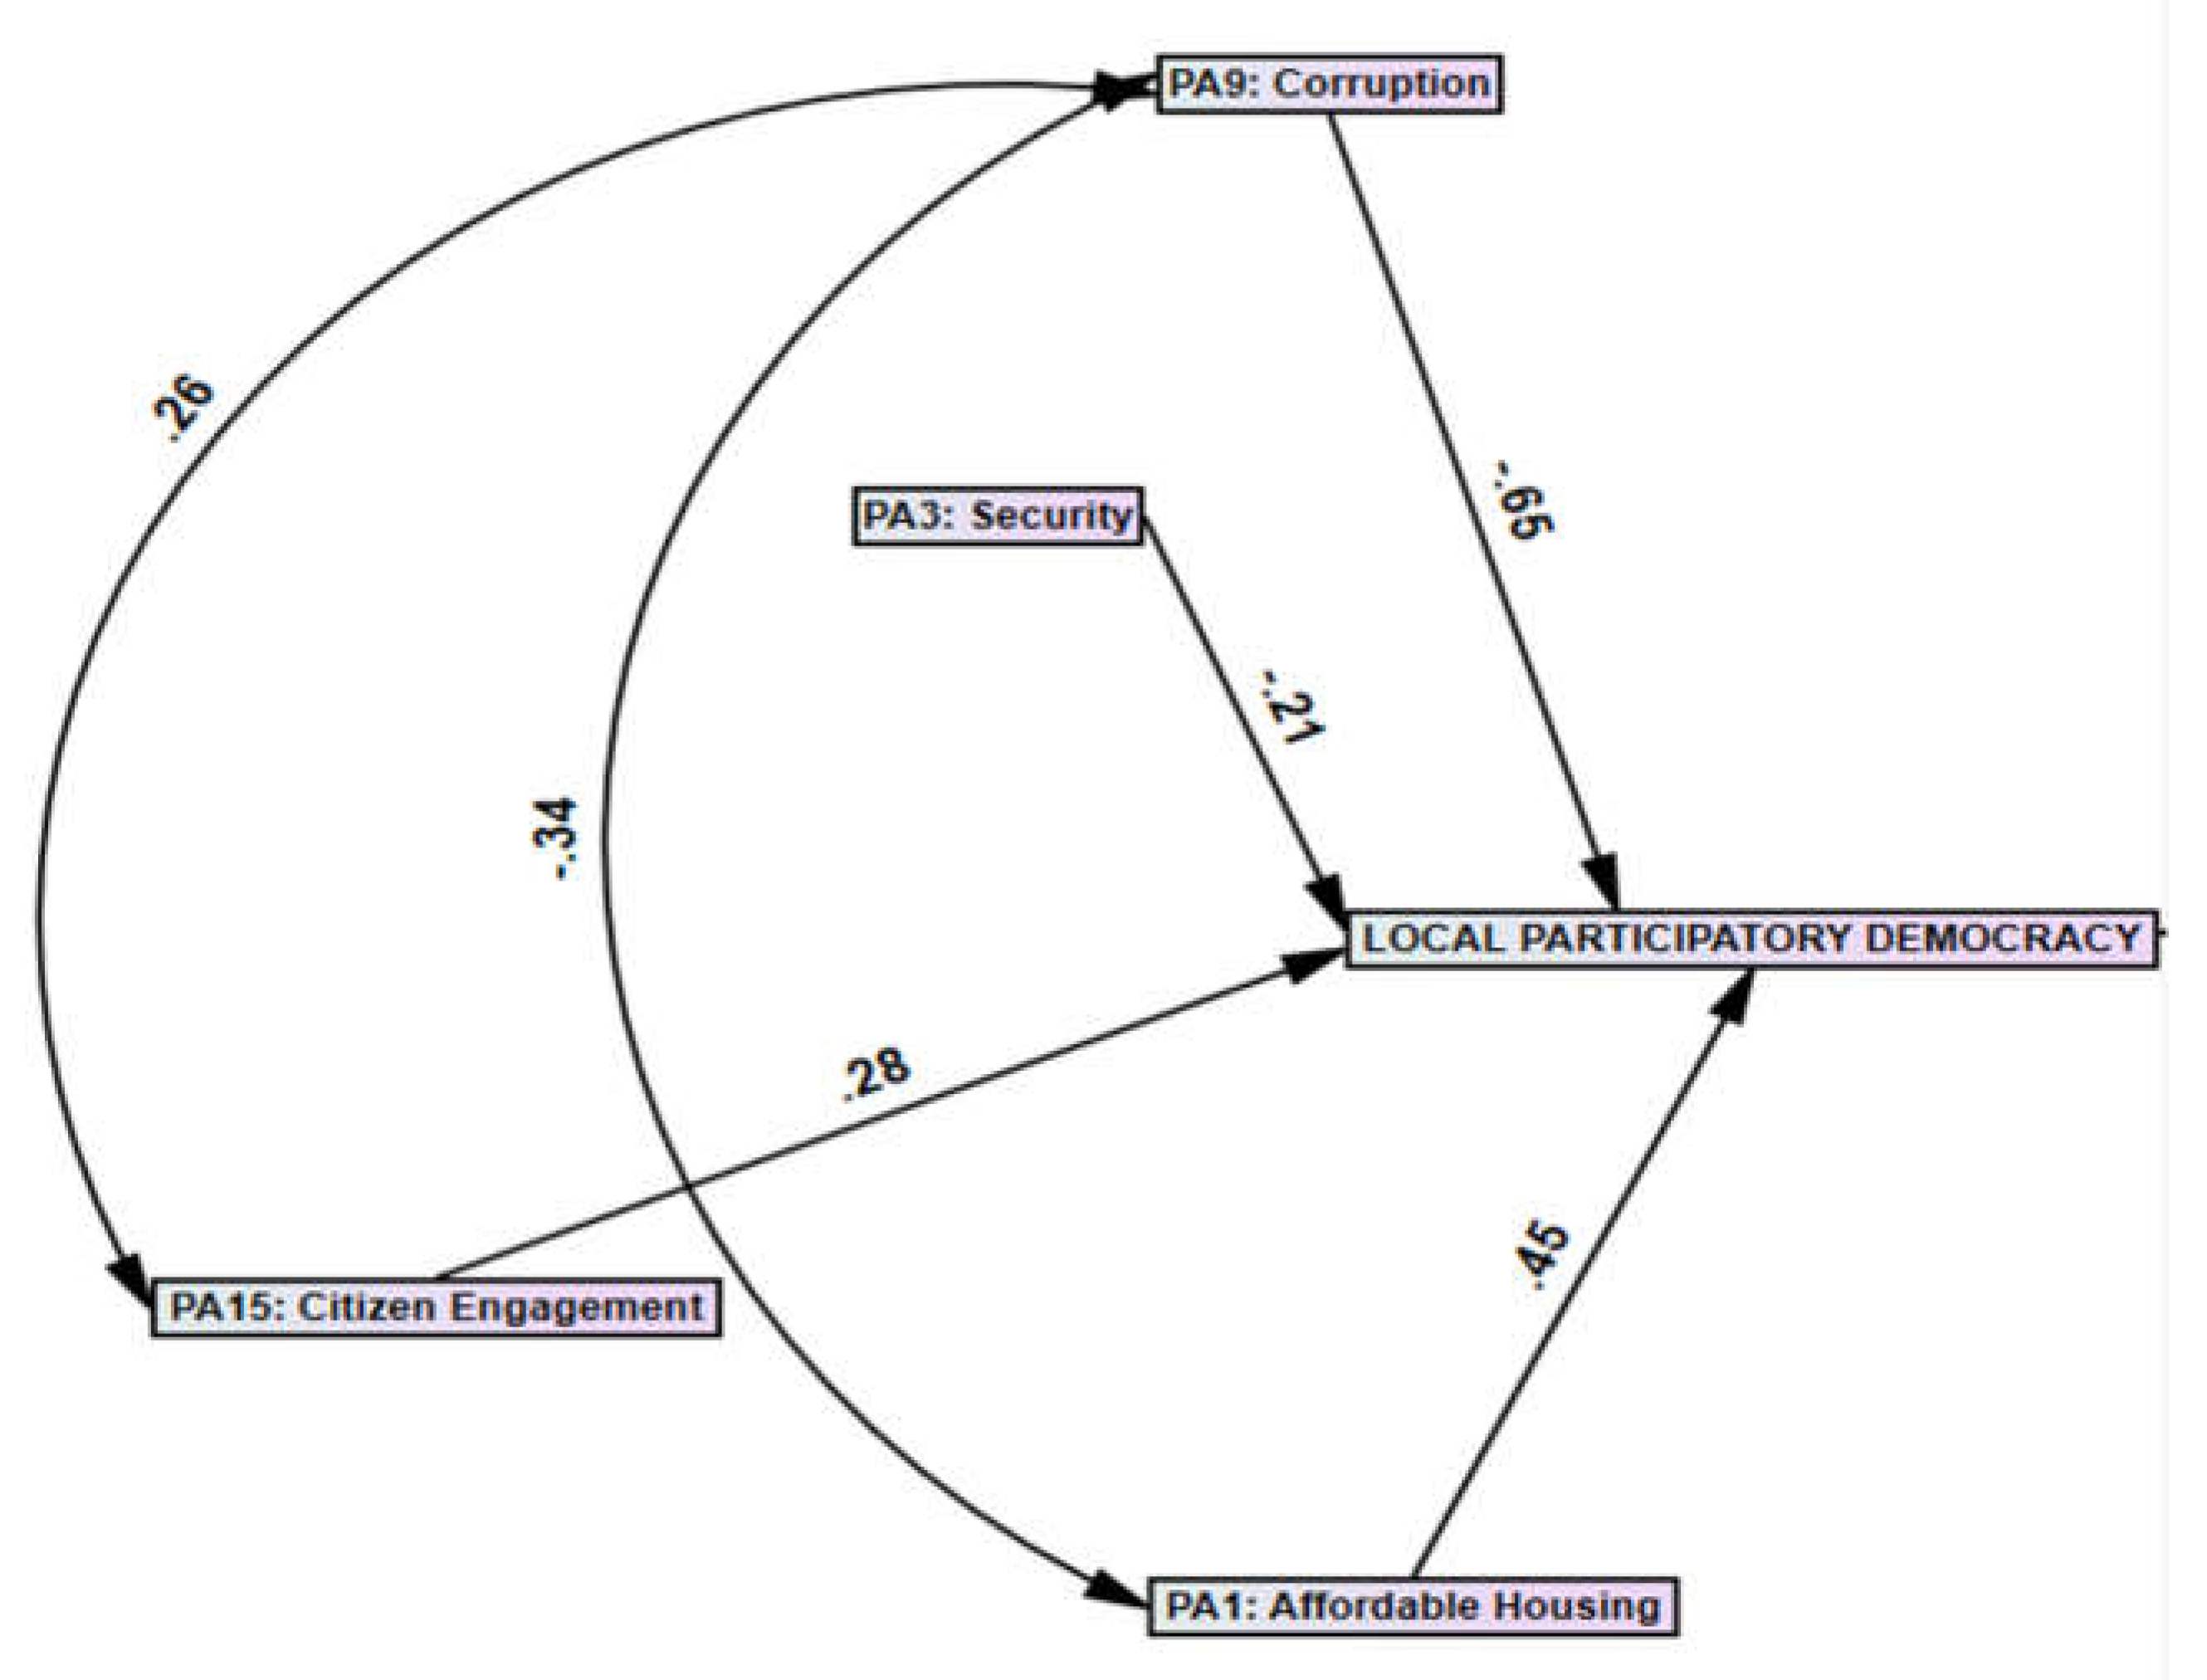
From the SEM model of LPD, the best fit with RMSEA= 0.015 and AIC= 40 for the saturated model is represented by the following result. In this respect, the model is based on several variables which might be considered good predictors for the dynamics of the LPD in European smart cities included in the sample: PA9 -corruption ( β = 0.65 ) , PA1- affordable housing ( β = 0.45 ) , PA15- citizens’ engagement ( β = 0.28 ) and PA3- security ( β = 0.21 ) . Figure 10 shows the interactions between relevant variables included in the model which describes the dynamics of LPD in the observed statistical units. In this respect, the model is described by the following structural equation:
L P D = 46.34 + 0.45 × P A 1 0.65 × P A 9 + 0.28 × P A 15 0.21 × P A 3
Statistical results are confirmatory for the classical theory of democracy based on civil society and civic engagement. Participatory democracy should be understood in terms of the absence of corruption, affordable housing, social security and civic engagement. In practice, participatory democracy is a mix between accountability, civic engagement, deliberation and both transparent institutions and political decisions. Results highlight the importance of political transparency (lack or absence of corruption) in increasing the residents’ interest in local public affairs. Alongside institutional transparency, a robust model of participatory democracy should be based on civic engagement, social cohesion, social inclusion and active participation in the field of political decision-making.

4. Discussion

Regarding the theoretical perspectives, this paper created the nexus between exogenous factors as economic determinants, sustainable development, political factors, educational level and residents’ involvement in the decision-making process at the local level in European smart cities. From the perspective of development, smart cities are seen as the product of the multiple and multifaceted interactions between economic development, democracy, good governance, population growth and the need for social and political inclusion. The widespread of information technology has resulted in rapid and efficient decision-making and improved residents’ integration in different fields related to professional development, economic growth, political decision-making and cultural aspects of urban life.
Regarding the sociological and anthropological perspectives, unlike modern cities, smart cities entail not only urban and socio-economic development but also a very high level of interconnectedness among their residents. If traditional urban areas were characterized by architectural and socio-economic development, the recent trends in urban sociology denote the fact smart cities could be considered a “hub” for “providing conditions for a healthy and happy community under the challenging conditions that global, environmental, economic and social trends may bring” [102]. Thus, the main feature of the recent smart cities should consist of sustainable development. Unlike traditional urban development, recent trends in shaping smart cities take into consideration aspects related to sustainable professions, low rates of residents’ unemployment, economic growth, entrepreneurship, sustainable resources and environmental protection and, the most significant aspect, residents’ participation in local government political decision-making. Smart cities are often strongly associated with economic development due to their interest in technology, IT innovation, e- governance and social stability [103]. In addition to this fact, smart cities’ local governments are interested in both creating job opportunities and emphasizing conventional and nonconventional education among residents [4,5,6,7,8,9,10,11,12,13,14,15,16,19,20,21]. In practice, a significant number of smart cities are known for their interest in business, economic innovation and social stability [22,23,39,40,41,103]. Entrepreneurship contributes to economic development and prosperity among the residents [104]. Moreover, it have a positive externality in the field of social culture, emphasizing democratic values such as economic freedom, prosperity, social inclusion, equality, active participation in public affairs etc.
This paper emphasizes the relationship between citizens (residents in smart cities) and local participatory democracy in 21 European smart cities. We analyzed the capitals of 21 countries of the European Union plus UK for observing the impact of the social, economic and political variables in the field of participatory democracy. Local participatory democracy is a key concept and also a key aspect of the social and political life in European smart cities. This fact underlines the importance of the residents in local decision-making and governance. Unlike national politics, at the local level (in smart cities) is much easier to create models of participatory democracy taking into consideration the access to the digital tools and networks and a higher cohesion among residents in addressing issues related to the local community.
An important statistical result shows the linear relation between sustainable development and economic freedom in increasing the level of local participatory democracy in European capitals. The statistical result confirms that there is a strong positive association (R2= 0.809) between these factors and the residents’ access to public information, participation in local decision-making and assessment of the local government’s public projects. As we pointed out in the theoretical part, sustainable development creates premises for developing smart cities and increasing the level of citizens’ interest in managing public affairs [42,43,45,46,48,49,50,91]. Being based on strong political institutions, transparent decisions, the rule of law and strong social partnerships, sustainable development is key-aspect in generating a viable model of local participatory democracy.
The nexus between sustainable development and local participatory democracy in smart cities could consist of several aspects as residents‘ input and participation in local decision-making, accountability, transparent laws with predictable enforcement, sustainable management of the social, economic and natural resources, sustainable policies and a higher level of social inclusion and cohesion [74,75,76,92]. Nordic capitals such as Copenhagen (SDI= 84.77; LPD= 64.46), Helsinki (SDI=85.8; LPD= 59.43) and Stockholm (SDI= 85.58; LPD= 57.23) are more likely to develop a strong model of local participatory democracy based on sustainable development. In correlation with sustainable development, economic freedom represents an important predictor of local participatory democracy. This result confirms the economic theory of democracy, proposed in the field of the political sciences in the early 1960s-1970s. In our field of interest, we observed that political mechanism as participatory democracy is positively related to a high level of entrepreneurship, financial, trade and economic freedom. Moreover, the connection between economic freedom and local participatory democracy is explained by the presence of the following social and political values: individual freedom (both economic and political freedom), choice and the protection of political rights and civil liberties. Regarding the economic dimension, statistical results show that Northern and Western capitals are more likely to develop a consolidated local participatory democracy based on economic freedom. In this respect, we noticed several eloquent examples of smart cities with both high levels of residents’ involvement in local decision-making and economic freedom: Dublin (EF= 81.36; LPD= 53.85), Tallinn (EF= 78.22; LPD= 50.64), Copenhagen (EF= 77.68; LPD= 64.46), Amsterdam (EF= 76.62; LPD= 59.41), Helsinki (EF= 76.42; LPD= 59.43), Stockholm (EF= 76.04; LPD= 57.23) and London (EF= 75.84; LPD= 54.91). The map from Section 3 presents the geographical differences in the distribution of the LPD between the capitals of the Nordic countries and those of Southern European countries, as well as the differences between the capitals of Western European countries and those of Eastern Europe.
Another important finding of the paper is related to the impact of political culture and education in the field of local participatory democracy. Quantitative results show a nonlinear relation between the political variables and the level of LPD in 21 European smart cities. The mix between political culture and education (measured as % of citizens with upper secondary education) has an indirect effect in increasing the level of participation of residents in local governance [84,85,87,88,89,90]. The regression model is cubic and refers to the impact of the national democracy index, participatory political culture and upper education in increasing local participatory democracy. Overall, the national democracy index and political culture might increase the values for LPD, especially in conditions where political culture promotes the spread of democratic values such as tolerance, freedom, equality and equity, ensures the legitimacy of governance, enhances the civic trust in public institutions and serves as a model for fostering the civic culture. Besides the implications of the political culture, education is seen as an important vector for developing deliberative democracy, critical thinking, political information and social accountability. Residents with upper secondary education have an increased likelihood to participate in political decision-making and to evaluate the political outcomes of the local public governments. The moderate cubic association (R2= 0.616) between democracy, political culture, education and local participatory democracy is relevant for the following smart cities: Prague, Vienna, Amsterdam, Berlin, Dublin, Stockholm, Copenhagen and Helsinki.
In correlation with these statistical results, the paper presents the main urgent priorities (priority areas) for local governments in the 21 European smart cities. The simple frequencies associated with the mean values reveal the geographical differences in the distribution of the priority areas within EU capitals. In all the geographical areas affordable housing (PA1) remains an important issue which has to be solved by local governments (PA1= 61%). Security (PA3= 49.73%) and health services (PA6 = 43.57%) could be considered urgent issues in Western and Nordic European capitals. Road congestion (PA4= 61.13%) and corruption (PA9= 41.45%) are representative priority areas for Central and Eastern European smart cities. Using the SEM (Structural Equations Modeling) technique the paper presents a model of LPD in 21 smart cities, where the determining factors of residents’ political participation are the absence of corruption, affordable housing, security and a high level of civic engagement.
Related to the research framework, this study presents the positive impact of sustainable development and economic freedom in the field of local participatory democracy [74-76; 92]. Thus, for research objective O1, the map presented in Section 3 illustrates the geographical differences of the LPD index in all the smart cities included in the sample. The highest rates of LPD are registered in Nordic and Western European capitals. Historical particularities, specific political culture, and an increased level of social inclusion are relevant aspects which should be taken into consideration when we analyze these geographical areas. For the research objectives O2 and O3, we estimated through hypotheses H1 and H3 that an increased level of sustainable development related to economic freedom are relevant predictors for increasing the level of LPD in all the capitals included in the sample [43,44,45,46,47,48,49,50,51,52,53,54,55,56,57,58,59,60,61,62,63,64,65,91]. The linear equation of regression which best fit the relation between these variables confirms the direct effects of sustainability and economic freedom in the sphere of residents’ participation on local decision-making and political assessment of the local governments' performance. For the research objective O4 we demonstrated through H2 and H4 that there is a nonlinear positive relation between political culture, upper secondary education and the level of residents’ involvement in decision-making at the local level [87,88,89,90]. Moreover, through objective O5, we stressed the main priority areas and urgencies for local governments. Smart cities' local governments should take into consideration issues related to affordable housing, health services, air pollution, road congestion and corruption. There are several limitations of the study related to the availability of a new dataset for the current year (2023), limitations related to the volume of the sample and, also, related to other unobserved factors which might predict the evolution of LPD in the EU capitals.

5. Conclusions

Concluding, this paper is focused on the relationship between sustainable development, economic freedom and local participatory democracy in a sample of 21 European smart cities. Using a quantitative research design, the paper emphasizes the linear positive association between sustainability, economic determinants and the level of residents’ involvement in accessing public information and participating in local decision-making. Smart cities in countries with a high level of sustainability are much more likely to develop a robust model of local participatory democracy. Similarly, smart cities in countries with a high level of economic freedom contribute to the growth of the local participatory democracy index. The capitals of Nordic and Western democracies are compelling examples of a positive correlation between the level of socio-economic development and that of local participatory democracy. Moreover, political culture and upper secondary education complete the field of the relevant predictors of the residents’ involvement in local public affairs. Urban development is revealing more pressing issues related to new vision on smart cities from different perspectives: demographical, economical, and nevertheless political. Thus, the empirical findings presented within the paper are useful for both scholars and decision-makers interested in the field of the dynamics of the local participatory democracy in European smart cities.

Author Contributions

Conceptualization, B. Ș. and S.-P. G.; methodology, S.-P. G.; software, S.-P. G.; validation, B. Ș., S.-P. G. and E.-S.V.; formal analysis, S.-P. G.; investigation, S.-P. G. and E.-S.V.; resources, B. Ș. and E.-S.V.; data curation, S.-P. G. and E.-S.V.; writing—original draft preparation S.-P. G.; writing—review and editing, B. Ș., S.-P. G. and E.-S.V.; visualization, B. Ș., S.-P. G. and E.-S.V; supervision, B. Ș.; project administration, B. Ș.; funding acquisition, B.Ș. and E.-S.V. All authors have read and agreed to the published version of the manuscript.

Funding

Authors are thankful to Romanian Ministry of Research, Innovation and Digitization, within Program 1 – Development of the national RD system, Subprogram 1.2 – Institutional Performance – RDI excellence funding projects, Contract no.11PFE/30.12.2021, for financial support.

Data Availability Statement

Quantitative data were extracted and collected from secondary sources and archives as follows: Accessibility of the Local Government Information, Residents’ Participation to Decision- Making and Residents’ Assessments of the Local Government Projects from: https://imd.cld.bz/Smart-City-Index-2021/38/ (accessed on 10 June 2023); GDP/ capita from World Bank: https://data.worldbank.org/indicator/NY.GDP.PCAP.KD.ZG?view=chart (accessed on 5 June 2023); Human Development Index from UNDP: https://hdr.undp.org/(accesed on 15 June 2023); Sustainable Development Index from Sustainable Development Report: https://dashboards.sdgindex.org/(accesed on 5 June 2023); Education from Eurostat:https://ec.europa.eu/eurostat/web/products-eurostat-news/-/ddn-20221026-1 (accessed on 15 June 2023); Democracy Index and Political Culture from: https://www.eiu.com/n/ (accessed on 25 May 2023); Economic Freedom from: https://www.heritage.org/index (accessed on 25 May 2023); Social Inclusion from: https://gggi-simtool-demo.herokuapp.com/(accessed on 5 June 2023).

Conflicts of Interest

The authors declare no conflict of interest.

References

  1. Batty, M.; Axhausen, K.W.; Giannotti, F.; Pozdnoukhov, A.; Bazzani, A.; Wachowicz, M.; Ouzounis, G.; Portugali, Y. Smart cities of the future. Eur. Phys. J. 2012, 214, 481–518. [Google Scholar] [CrossRef]
  2. Ritchie, H.; Roser, R.M. Urbanization. 2018. Available online: https://ourworldindata.org/urbanization (accessed on 5 May 2023).
  3. Yin, C.T.; Xiong, Z.; Chen, H.; Wang, J.Y.; Cooper, D.; David, B. A literature survey on smart cities. Sci. China Info. Sci. 2015, 58, 1–19. [Google Scholar] [CrossRef]
  4. Bakici, T.; Almirall, E.; Wareham, J. A Smart City Initiative: The Case of Barcelona. J. of the Know. Econom. 2012, 2, 1–14. [Google Scholar]
  5. Barrionuevo, J.M; Berrone, P.; Ricart, J.E. Smart Cities, Sustainable Progress. IESE Insight. 2012, 14, 50–57. [Google Scholar] [CrossRef]
  6. Albino, V.; Berardi, U.; Dangelico, R.M. Smart Cities: Definitions, Dimensions, Performance, and Initiatives. J.of Urban Tech. 2015, 22, 1–21. [Google Scholar] [CrossRef]
  7. Khatoun, R.; Zeadally, S. Smart Cities: Concepts, Architectures, Research Opportunities. Com. of the ACM 2016, 59, 46–57. [Google Scholar] [CrossRef]
  8. Mohanty, S. P.; Choppali, U.; Kougianos, E. Everything you wanted to know about smart cities: The internet of things is the backbone. IEEE Cons. Elect. Mag. 2016, 5, 60–70. [Google Scholar] [CrossRef]
  9. Silvaa, B.N; Khanb, M.; Hana, K. Towards sustainable smart cities: A review of trends, architectures, components, and open challenges in smart cities. Sust. Cities and Soc. 2018, 38, 697–713. [Google Scholar] [CrossRef]
  10. Yigitcanlara, T.; Kamruzzamanf, Md.; Buysb, L.; Ioppoloc, G.; Sabatini-Marquesd, J.; da Costad, E.M.; Yun, J.J. Understanding smart cities: Intertwining development drivers with desired outcomes in a multidimensional framework. Cities 2018, 81, 145–160. [Google Scholar] [CrossRef]
  11. Al Nuaimi, E.; Al Neyadi, H.; Mohamed, N.; Al-Jaroodi, J. Applications of big data to smart cities. J. of Int. Serv. and Appl. 2015, 6, 1–15. [Google Scholar] [CrossRef]
  12. Ben Letaifa, S. How to strategize smart cities: Revealing the SMART model. J. of Busin. Res. 2015, 68, 141–1419. [Google Scholar] [CrossRef]
  13. Lazaroiu, G.C.; Roscia, M. Definition methodology for the smart cities model. Energy 2012, 47, 326–332. [Google Scholar] [CrossRef]
  14. Angelidou, M. Smart cities: A conjuncture of four forces. Cities 2015, 47, 95–106. [Google Scholar] [CrossRef]
  15. Ismagilovaa, E.; Hughesb, L.; Dwivedic, Y.K.; Ramand, K.R. Smart cities: Advances in research—An information systems perspective. Int. J. of Info. Mang. 2019, 47, 88–100. [Google Scholar] [CrossRef]
  16. Sujataa, J.; Sakshamb, S.; Tanvic, G. Developing Smart Cities: An Integrated Framework. Proc. Comp. Sci. 2016, 93, 902–909. [Google Scholar]
  17. Nam, T.; Pardo, T.A. Nam, T.; Pardo, T.A. Conceptualizing Smart City with Dimensions of Technology People, and Institutions. IN The Proceedings of the 12th Annual International Conference on Digital Government Research, College Park, USA, 15 June 2011.
  18. Lai, C.S.; Jia, Y.; Dong, Z.; Wang, D.; Tao, Y.; Lai, Q.H.; Wong, R.T.K.; Zobaa, A.F.; Wu, R.; Lai, L.L. A Review of Technical Standards for Smart Cities. Clean Technol. 2020, 2, 290–310. [Google Scholar] [CrossRef]
  19. Stratigea, A.; Papadopoulou, C.; Panagiotopoulou, M. Tools and Technologies for Planning the Development of Smart Cities. J. of Urban Tech. 2015, 22, 43–62. [Google Scholar] [CrossRef]
  20. Wilhelm, R.; Ruhland, S. The governance of smart cities: A systematic literature review. Cities. 2018, 81, 1–23. [Google Scholar] [CrossRef]
  21. Meijer, A.; Rodriguez Bolivar, M. P. Governing the smart city: a review of the literature on smart urban governance. Int. Rev. of Adm. Stud. 2015, 0, 1–17. [Google Scholar] [CrossRef]
  22. Pereiraa, G.V.; Paryceka, P.; Falcoc, E.; Kleinhans, R. Smart governance in the context of smart cities: A literature review. Inf. Polity. 2018, 23, 23,143–162. [Google Scholar] [CrossRef]
  23. Kitchin, R. Making sense of smart cities: addressing present shortcomings. Camb. J. of Region., Econ. and Soc. 2014, 8, 1–6. [Google Scholar] [CrossRef]
  24. Rodríguez Bolívar, M.P. Smart Cities: Big Cities, Complex Governance. In Transforming City Governments for Successful Smart Cities; Rodríguez Bolívar, M.P., Ed.; Springer International Publishing: Cham, Switzerland, 2015; pp. 1–8. [Google Scholar]
  25. Pereira, G.V.; Cunha, M.A.; Lampoltshammer, T.J.; Parycek, P.; Testa, M.G. Increasing collaboration and participation in smart city governance: a cross-case analysis of smart city initiatives. Inf. Techn. for Dev. 2017, 1–28. [Google Scholar] [CrossRef]
  26. Vinod Kumar, T.M. E-Governance for Smart Cities. In E-Governance for Smart Cities, Vinod Kumar, T.M. Ed.; Springer Science+Business Media: Singapore, 2015; pp. 1–30. [Google Scholar]
  27. Paskaleva, K.A. Enabling the smart city: the progress of city e-governance in Europe. Int. J. Innov. and Reg. Dev. 2009, 1, 405–422. [Google Scholar] [CrossRef]
  28. Deakin, M. Smart cities: the state-of-the-art and governance challenge. Triple Helix 2014, 1, 1–16. Available online: http://link.springer.com/article/10.1186/s40604-014-0007-9. [CrossRef]
  29. Dameri, R.P.; Benevolo, C. Governing Smart Cities: An Empirical Analysis. Soc. Sci. Comp. Rev. 2015, 1–15. [Google Scholar] [CrossRef]
  30. Broccardo, L.; Culasso, F. Smart city governance: exploring the institutional work of multiple actors towards collaboration. IJPSM. 2019, 1–22. [Google Scholar] [CrossRef]
  31. Castelnovo, V.; Misuraca, G.; Savoldell, A. Smart Cities Governance: The Need for a Holistic Approach to Assessing Urban Participatory Policy Making. Soc. Sci. Comp. Rev. 2015, 1–16. [Google Scholar] [CrossRef]
  32. Bai, Y.; Hu, Q.; Seo, S. -H.; Kang K.; Lee, J. J. Public Participation Consortium Blockchain for Smart City Governance. IEEE Int. of Things J. 2022, 9: 3, 2094-2108. [Google Scholar] [CrossRef]
  33. Mora, L.; Gerli, P.; Ardito, L.; Petruzzelli, A.M. Smart city governance from an innovation management perspective: Theoretical framing, review of current practices, and future research agenda. Techn. 2023, 123, 1–24. [Google Scholar] [CrossRef]
  34. Ruhlandt, R.W.S. The governance of smart cities: A systematic literature review. Cities, 2018, 81, 1–23. [Google Scholar] [CrossRef]
  35. Nesti, G. Defining and assessing the transformational nature of smart city governance: Insights from four European cases. Int. Rev. Adm. Sci. 2018, 86, 20–37. [Google Scholar] [CrossRef]
  36. Razaghi, M.; Finger, M. Smart governance for smart cities. Proc. IEEE 2018, 206, 680–689. [Google Scholar] [CrossRef]
  37. Glasmeier, K.A.; Nebiolo, M. Thinking about smart cities: The travels of a policy idea that promises a great deal, but so far has delivered modest results. Sustainability 2016, 8. [Google Scholar] [CrossRef]
  38. Ju, J.; Liu, L.; Feng, Y. Citizen-centered big data analysis-driven governance intelligence framework for smart cities. Telecomm. Policy 2018, 42, 881–896. [Google Scholar] [CrossRef]
  39. Janssen, M.; van der Voort, H. Adaptive governance: Towards a stable, accountable and responsive government. Gov. Inf. Q. 2016, 33, 1–5. [Google Scholar] [CrossRef]
  40. Soe, R.-M.; Drechsler, W. Agile local governments: Experimentation before implementation. Gov. Inf. Q. 2018, 35, 323–335. [Google Scholar] [CrossRef]
  41. Anand, P.B.; Navío-Marco, J. Governance and economics of smart cities: opportunities and challenges. Telecom. Policy 2018, 42, 795–799. [Google Scholar] [CrossRef]
  42. Pohoryles, R.J. Sustainable development, innovation and democracy and democracy. What role for the regions? Innovation 2007, 20, 183–190. [Google Scholar] [CrossRef]
  43. Sénit, C.A. Leaving no one behind? The influence of civil society participation on the Sustainable Development Goals. EPC: Politics and Space 2020, 38, 693–712. [Google Scholar] [CrossRef]
  44. Imran, S.; Javaid, F. Interlinkage between Democracy and Sustainable Development. Rev. of Econ. and Develop. Studies 2017, 3, 159–166. [Google Scholar] [CrossRef]
  45. Söderbaum, P. Democracy and sustainable development: implications for science and economics. Real-world econ. Rev., 2012, 60, 107–119. [Google Scholar]
  46. Söderbaum, P. Reconsidering economics in relation to sustainable development and democracy. The J. of Phil. Econ. 2019, 13, 19–38. [Google Scholar] [CrossRef]
  47. Lindberg, S.I.; Teorell, J.; Coppedge, M.; Gerring, J. V-Dem: a new way to measure democracy. J. Dem. 2014, 25, 159–169. [Google Scholar] [CrossRef]
  48. Pickering, J.; Hickmann, T.; Backstrand, K.; Kalfagianni, A.; Bloomfield, M.; Mert, A.; Ransan-Cooper, H.; Lo, A. Democratising sustainability transformations: Assessing the transformative potential of democratic practices in environmental governance. Earth Syst. Gov. J. 2022, 11, 1–14. [Google Scholar] [CrossRef]
  49. Monkelbaan, J. Governance for the Sustainable Development Goals Exploring an Integrative Framework of Theories, Tools, and Competencies; Springer Nature: Singapore Pte Ltd. 2019.
  50. Nilsson, M.; Griggs, D.; Visbeck, M. Policy: Map the interactions between Sustainable Development Goals. Nature 2016, 534, 320–322. [Google Scholar] [CrossRef] [PubMed]
  51. Gomez, P.Y.; Korine, H. Entrepreneurs and Democracy A Political Theory of Corporate Governance; Cambridge University Press: Cambridge, United Kingdom, 2008. [Google Scholar]
  52. Wolf, J.; Borges, M.; Marques, J.L.; Castro, E. Smarter Decisions for Smarter Cities: Lessons Learned from Strategic Plans. In New Paths of Entrepreneurship Development The Role of Education, Smart Cities, and Social Factors, Carvalho, L.C., Rego, C., Lucas, M.R., Sánchez-Hernández, I., Backx, A., Noronha, V., Eds. Springer Nature Switzerland AG: Cham, Switzerland, 2019, pp. 7–30.
  53. Audretsch, D.B.; Moog, P. Democracy and Entrepreneurship. Entrepr. Th. and Pract. 2020, 0, 1–25. [Google Scholar] [CrossRef]
  54. Mohammadi, H.; Boccia, F.; Tohidi, A. The Relationship between Democracy and Economic Growth in the Path of Sustainable Development. Sustainability 2023, 15, 9607. [Google Scholar] [CrossRef]
  55. Farè, L.; Audretsch, D.B.; Dejardin, M. Does democracy foster entrepreneurship? Small Bus. Econ. 2023, 1–35. [Google Scholar] [CrossRef]
  56. Kriegera, T.; Meierrieksa, D. Political capitalism: The interaction between income in\equality, economic freedom and democracy. Eur. J. of Pol. Econ. 2016, 45, 115–132. [Google Scholar] [CrossRef]
  57. Saha, S.; Gounder, R.; Su, J.J. The interaction effect of economic freedom and democracy on corruption: A panel cross-country analysis. Econ. Letters 2009, 105, 173–176. [Google Scholar] [CrossRef]
  58. Pereyra, J.A.C. Entrepreneurship and the city. Geogr. Compass 2019, 1–12. [Google Scholar] [CrossRef]
  59. Danaa, L.-P.; Salamzadehb, A.; Hadizadehc, M.; Heydarid, G.; Shamsoddin, S. Urban entrepreneurship and sustainable businesses in smart cities: Exploring the role of digital technologies. Sust. Techn. and Entpr. 2022, 1, 1–9. [Google Scholar] [CrossRef]
  60. Sima, D.; Huang, F. Is democracy good for growth? — Development at political transition time matters. Eur. J. of Pol. Econ. 2023, 78, 1–20. [Google Scholar] [CrossRef]
  61. Stroup, M.D. Economic Freedom, Democracy, and the Quality of Life. World Dev. 2007, 1, 52–66. [Google Scholar] [CrossRef]
  62. Anthony Simonofski, Estefanía Serral Asensio, Yves Wautelet. Citizen participation in the design of smart cities: methods and management framework. In Smart Cities: Issues and Challenges. Visvizi, A., Lytras, M.D., Eds.; Elsevier: Amsterdam, Netherlands, 2019. [Google Scholar]
  63. Ramos, C.T. Democracy and governance in the smart city. In Smart Cities: Issues and Challenges. Visvizi, A., Lytras, M.D., Eds.; Elsevier: Amsterdam, Netherlands, 2019. [Google Scholar]
  64. Sauer, S. Do Smart Cities Produce Smart Entrepreneurs? J. of Theor. And Appl. Elect. Com. Res. 2012, 7, 63–73. [Google Scholar] [CrossRef]
  65. Alizadeh, H.; Sharifi, A. Toward a societal smart city: Clarifying the social justice dimension of smart cities. Sust. Cities and Soc. 2023, 95, 1–12. [Google Scholar] [CrossRef]
  66. Araya, D. Smart cities and the network society: Toward coomon-driven governance. In Smart Cities as Democratic Ecologies, Araya, D., Ed.; Palgrave Macmillan: New York, United States of America, 2015. [Google Scholar]
  67. Barber, B. Participatory Democracy. In The Encyclopedia of Political Thought, First Edition.; Gibbons, T.M., Ed.; John Wiley & Sons, Ltd.: New Jersey, United States of America, 2015; pp. 1–4. [Google Scholar] [CrossRef]
  68. Blanco, I.; Griggs, S.; Sullivan, H. Situating the local in the neoliberalisation and transformation of urban governance. Urb. Stud. 2014, 15, 3129–3146. [Google Scholar] [CrossRef]
  69. Syrett, S.; Sepulveda, L. Urban governance and economic development in the diverse city. Eur. Urb. and Reg. Stud. 2012, 19, 238–253. [Google Scholar] [CrossRef]
  70. Bherer, L.; Dufour, P.; Montambeault, F. The participatory democracy turn: an introduction. J. of Civil Soc. 2016, 12, 225–230. [Google Scholar] [CrossRef]
  71. Hilmer, J.D. The State of Participatory Democratic Theory. New Pol. Sci. 2010, 32, 43–63. [Google Scholar] [CrossRef]
  72. Kutay, A. Limits of Participatory Democracy in European Governance. Eur. Law J. 2015, 21, 803–818. [Google Scholar] [CrossRef]
  73. Esposito, G.; Felicetti, A.; Terlizzi, A. Participatory governance in megaprojects: the Lyon–Turin high-speed railway among structure, agency, and democratic participation. Policy and Soc. 2023, 42, 259–273. [Google Scholar] [CrossRef]
  74. Smith, A.; Martín, P.P. Going Beyond the Smart City? Implementing Technopolitical Platforms for Urban Democracy in Madrid and Barcelona. In Sustainable Smart City Transitions, Mora, L., Deakin, M., Zhang, X., Batty, M., de Jong, M., Santi, P., Appio, F.P., Eds.; Routledge: London, 2022; pp. 280–299. [Google Scholar]
  75. Pickering, J. Can democracy accelerate sustainability transformations? Policy coherence for participatory co-existence. Int. Environ. Agreem. 2023, 23, 141–148. [Google Scholar] [CrossRef]
  76. Helbing, D.; Mahajan, S.; Fricker, R.F.; Carina, A.M.; Hausladen, I.; Carissimo, C.; Carpentras, D.; Stockinger, E.; Sanchez-Vaquerizo, J.A.; Yang, J.; Ballandies, M.C.; Korecki, M.; Dubey, R.H; Pournaras, E. Democracy by Design: Perspectives for Digitally Assisted, Participatory Upgrades of Society. J. of Comp. Sci. 2023, 71, 1–19. [Google Scholar] [CrossRef]
  77. Manes-Rossi, F.; Brusca, I.; Orelli, L.R.; Lorson, P.C.; Haustein, E. Features and drivers of citizen participation: Insights from participatory budgeting in three European cities. Pub. Manag. Rev. 2023, 25, 201–223. [Google Scholar] [CrossRef]
  78. Cabannes, Y. Participatory budgeting: a significant contribution to participatory democracy. Envin.& Urb. 2004, 16, 27–46. [Google Scholar]
  79. Patsias, C.; Latendresse, A.; Bherer, L. Participatory Democracy, Decentralization and Local Governance: the Montreal Participatory Budget in the light of ‘Empowered Participatory Governance’. Int. J. of. Urb. And Reg. Res. 2013, 37.6, 2214–2230. [Google Scholar] [CrossRef]
  80. Dacombe, R.; Parvin, P. Participatory Democracy in an Age of Inequality. Representation 2021, 57, 145–157. [Google Scholar] [CrossRef]
  81. della Porta, D. For participatory democracy: some notes. Eur Polit Sci. 2019, 18, 603–616. [Google Scholar] [CrossRef]
  82. Touchton, M.; McNulty, S.; Wampler, B. Participatory Budgeting and Community Development: A Global Perspective. Am. Beh. Sci. 2023, 67, 520–536. [Google Scholar] [CrossRef]
  83. Font, J.; Motos, C.R. Participatory Institutions and Political Ideologies: How and Why They Matter? Pol. Stud. Rev. 2023, 1–18. [Google Scholar] [CrossRef]
  84. Bell, C.; O’Rourke, C. The People’s Peace? Peace Agreements, Civil Society, and Participatory Democracy. Int. Pol. Sci. Rev. 2007, 28, 293–324. [Google Scholar] [CrossRef]
  85. Geissel, B.; Michels, A.; Silagadze, N.; Schauman, J.; Grönlund, K. Public Deliberation or Popular Votes? Measuring the Performance of Different Types of Participatory Democracy. Representation 2023, 2–23. [Google Scholar] [CrossRef]
  86. Tseng, Y.S.; Becker, C.; Roikonen, I. Dialectical approach to unpacking knowledge-making for digital urban democracy: A critical case of Helsinki-based e-participatory budgeting. Urb. Stud. 2023, 1–18. [Google Scholar] [CrossRef]
  87. Garga, S.; Mittalb, S.K.; Sharma, S. Role of E-Trainings in Building Smart Cities. Proc. Comp. Sci. 2017, 111, 24–30. [Google Scholar] [CrossRef]
  88. Avdeeva, E.; Davydova, T.; Skripnikova, N.; Kochetova, L. Human resource development in the implementation of the concept of "smart cities". E3S Web of Conf. 2019, 110, 0–1. [Google Scholar] [CrossRef]
  89. Bartlett, T. Inclusive civic education and school democracy through participatory budgeting. Ed. Citiz. and Soc. Just. 2023, 1–19. [Google Scholar] [CrossRef]
  90. Anttila, J.; Jussila, K. Universities and smart cities: the challenges to high quality. T. Qualit. Manag. & Busin. Excell. 2018, 1–17. [Google Scholar] [CrossRef]
  91. Polletta, F. Participatory Democracy in the New Millennium. Contemp. Soc. 2015, 42, 40–50. [Google Scholar] [CrossRef]
  92. Boulding, C.; Wampler, B. Voice, Votes, and Resources: Evaluating the Effect of Participatory Democracy on Well-being. World Dev. 2010, 38, 125–135. [Google Scholar] [CrossRef]
  93. The IMD World Competitiveness Center, Smart City Index 2021. Available online: https://imd.cld.bz/Smart-City-Index-2021/38/ (accessed on 10 June 2023).
  94. World Bank, GDP growth (annual %). Available online: https://data.worldbank.org/indicator/NY.GDP.PCAP.KD.ZG?view=chart (accessed on 5 June 2023).
  95. The Heritage Foundation, Economic Freedom. Available online: https://www.heritage.org/index (accessed on 25 May 2023).
  96. Economist Intelligence Unit, Democracy Index. Available online: https://www.eiu.com/n/ (accessed on 25 May 2023).
  97. Sustainable Development Report, Sustainable Development Index. Available online: https://dashboards.sdgindex.org/ (accessed on 5 June 2023).
  98. Eurostat, Upper secondary education in the EU regions. Available online: https://ec.europa.eu/eurostat/web/products-eurostat-news/-/ddn-20221026-1 (accessed on 15 June 2023).
  99. Global Green Growth Index, Social Inclusion. Available online: https://gggi-simtool-demo.herokuapp.com/ (accessed on 5 June 2023).
  100. United Nations Development Programme, Human Development Index. Available online: https://hdr.undp.org/ (accessed on 15 June 2023).
  101. Cameron, A.C.; Trivedi, P.K. Microeconometrics. Methods and Applications; Cambridge University Press: Cambridge, UK, 2005. [Google Scholar]
  102. Guan, L. Smart Steps To A Battery City. Gov. News 2012, 32, 24–72. [Google Scholar]
  103. Kuzior, A.; Pakhnenko, O.; Tiutiunyk, I.; Lyeonov, S. E-Governance in Smart Cities: Global Trends and Key Enablers. Smart Cities 2023, 6, 1663–1689. [Google Scholar] [CrossRef]
  104. Lacson, J.J.; Lidasan, H.S.; Spay Putri Ayuningtyas, V.; Feliscuzo, L.; Malongo, J.H.; Lactuan, N.J.; Bokingkito, P., Jr.; Velasco, L.C. Smart City Assessment in Developing Economies: A Scoping Review. Smart Cities 2023, 6, 1744–1764. [Google Scholar] [CrossRef]
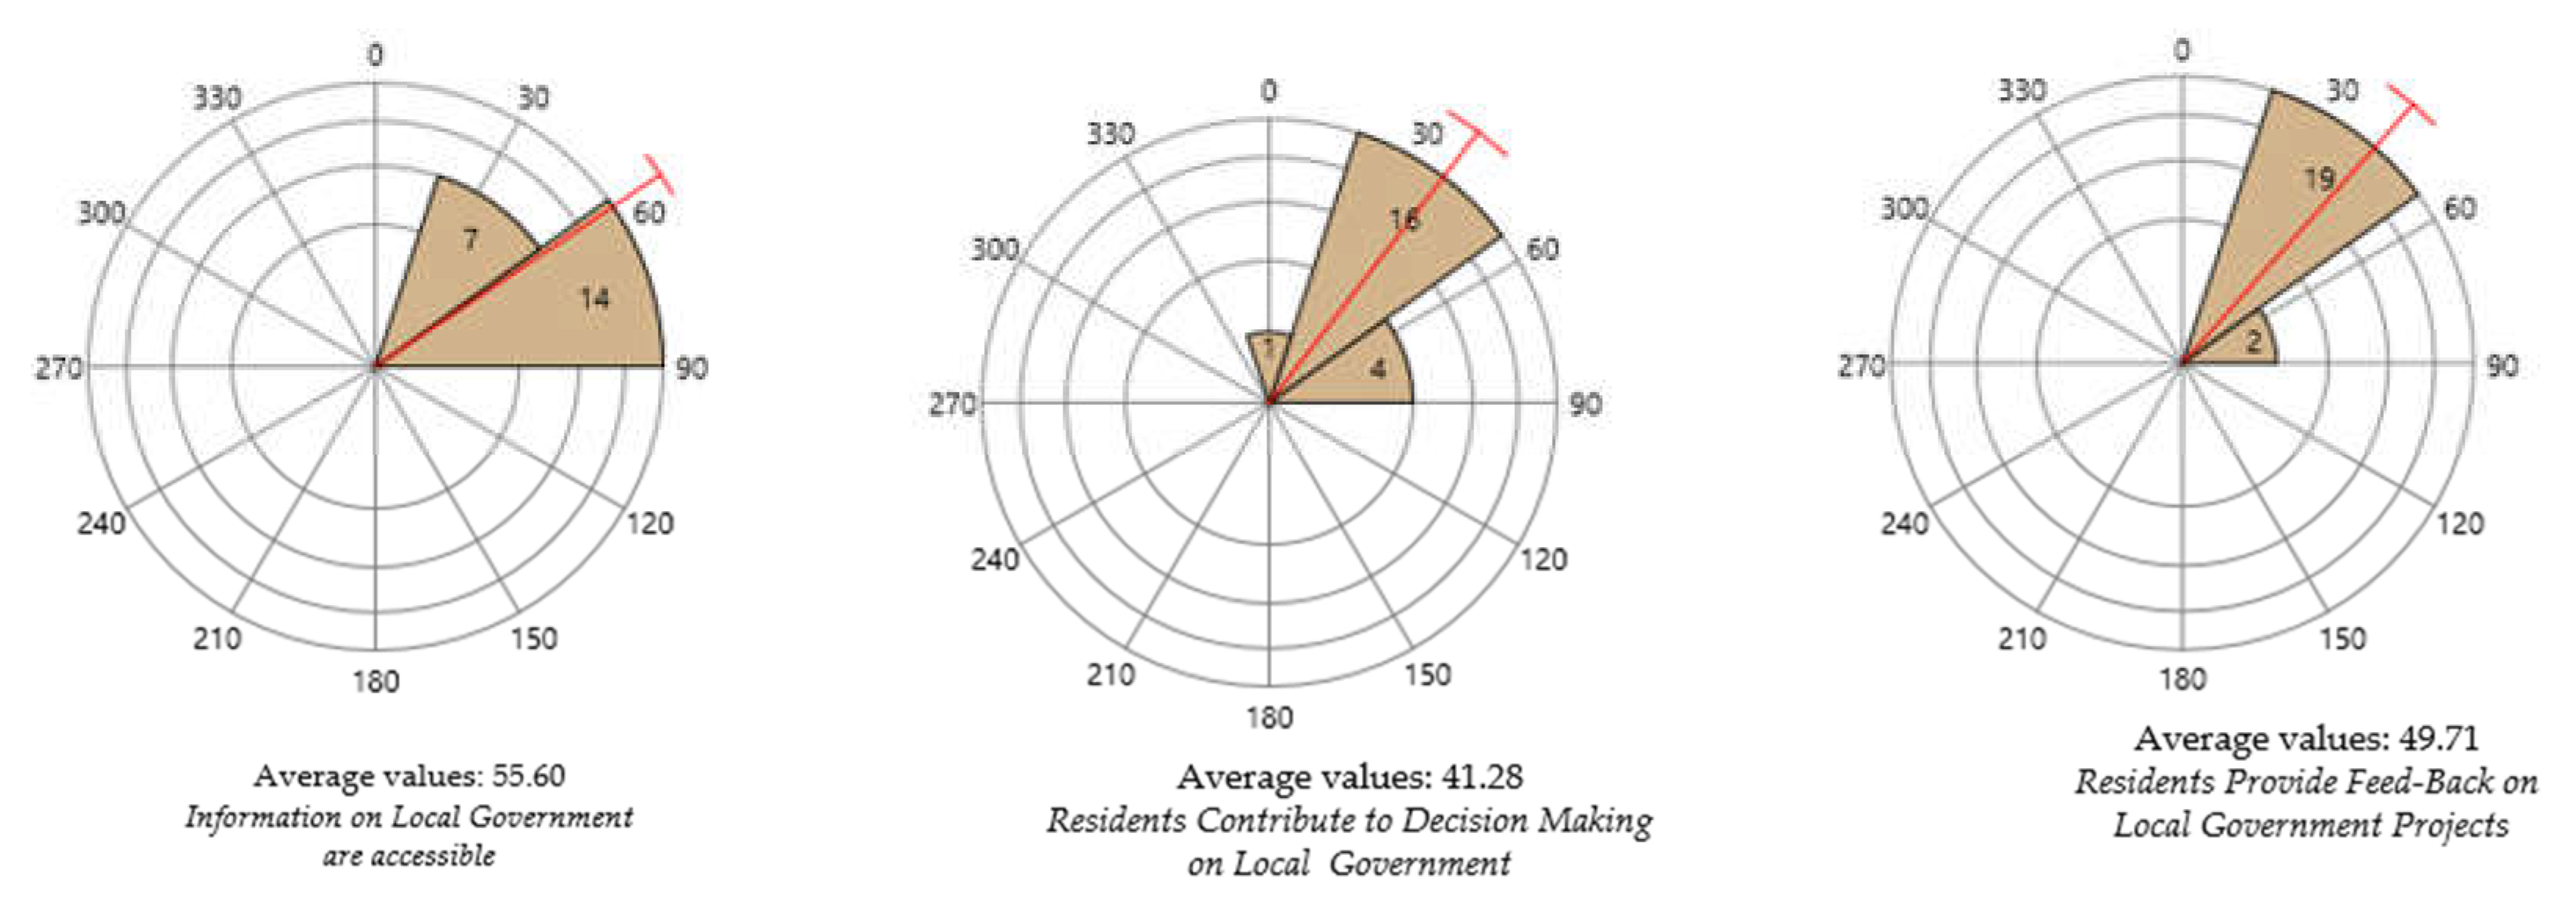
Figure 1. Average values for Accessibility of the Local Government Information, Residents’ Participation to Decision- Making and Residents’ Assessments of the Local Government Projects. Source of data: Smart Cities Index: https://imd.cld.bz/Smart-City-Index-2021/38/ (accessed on 10 June 2023).
Preprints 81157 g001
Figure 2. Average values for Accessibility of the Local Government Information, Residents’ Participation to Decision- Making and Residents’ Assessments of the Local Government Projects in 21 European Smart Cities. Source of data: Smart Cities Index: https://imd.cld.bz/Smart-City-Index-2021/38/ (accessed on 10 June 2023).
Preprints 81157 g002
Figure 3. Local Participatory Democracy in EU-27 plus UK. Statistical data are based on the authors’ estimation of LPD using harmonic mean between Accessibility of the Local Government Information, Residents’ Participation to Decision- Making and Residents’ Assessments of the Local Government Projects. Data sources: Smart Cities Index: https://imd.cld.bz/Smart-City-Index-2021/38/ (accessed on 10 June 2023).
Preprints 81157 g003
Figure 4. Scatterplot: Local Participatory Democracy with Sustainable Development and Economic Freedom (Predictors in Multiple Linear Regression). Data sources: Authors’ estimation based on statistical data presented in Section 2.
Preprints 81157 g004
Figure 5. Scatterplot: Cubic regression between Political Culture and Local Participatory Democracy. Data sources: Authors’ estimation based on statistical data presented in Section 2.
Preprints 81157 g005
Figure 6. Scatterplot: Democracy Index with Political Culture and Education as predictors in the nonlinear regression model. Data sources: Authors’ estimation based on statistical data presented in Section 2.
Preprints 81157 g006
Figure 7. Priority Areas in 21 European Smart Cities - Average values. Data sources: Smart Cities Index: https://imd.cld.bz/Smart-City-Index-2021/38/ (accessed on 10 June 2023).
Preprints 81157 g007
Figure 8. Priority Areas in 21 European Smart Cities by Geographical Position of the Country. Data sources: Smart Cities Index: https://imd.cld.bz/Smart-City-Index-2021/38/ (accessed on 10 June 2023).
Preprints 81157 g008
Figure 9. Structural Equations Model 1 for explaining Local Participatory Democracy in 21 European Smart Cities. Data sources: Smart Cities Index: https://imd.cld.bz/Smart-City-Index-2021/38/ (accessed on 10 June 2023).
Preprints 81157 g009
Figure 10. Structural Equations Model 2 for explaining Local Participatory Democracy in 21 European Smart Cities. Data sources: Smart Cities Index: https://imd.cld.bz/Smart-City-Index-2021/38/ (accessed on 10 June 2023).
Preprints 81157 g010
Table 1. Research Variables.
Variables Symbol Unit
of Measurement
Data Source
Accessibility of the Local Government Information AI [0-100] Smart Cities Index
Residents’ Participation to Decision- Making RDM [0-100] Smart Cities Index
Residents’ Assessments of the Local Government Projects RA [0-100] Smart Cities Index
GDP/Capita GDP $/ capita World bank
Human Development Index HDI [0-1] United Nations Development Programme
Sustainable Development Index SDI [0-100] Sustainable Development Report
Education LE [0-100] Eurostat
Democracy Index DI [0-10] The Economist Intelligence Unit
Economic Freedom EF [0-100] Heritage Foundation
Social Inclusion SI [0-100] Global Green Growth Institute
Political Culture PC [0-10] The Economist Intelligence Unit
Priorities Areas in Smart-Cities PA [0-100] Smart Cities Index
Local Participatory Democracy LPD [0-100] Authors ‘estimation based on secondary statistical data
Table 2. The sample of analysis. 21 Smart Cities from EU countries.
Smart Cities EU-27 Country Geographical position of the country
Amsterdam Netherlands Western Europe
Athens Greece Southern Europe
Berlin Germany Western Europe
Bratislava Slovakia Central Europe
Brussels Belgium Western Europe
Bucharest Romania Eastern Europe
Budapest Hungary Eastern Europe
Copenhagen Denmark Nordic Europe
Dublin Ireland Western Europe
Helsinki Finland Nordic Europe
Lisbon Portugal Southern Europe
London UK Western Europe
Madrid Spain Southern Europe
Paris France Western Europe
Prague Czech Republic Central and Eastern Europe
Rome Italy Southern Europe
Sofia Bulgaria Eastern Europe
Stockholm Sweden Nordic Europe
Tallinn Estonia Nordic Europe/ Baltic states
Vienna Austria Central Europe
Warsaw Poland Eastern Europe
Table 3. Descriptive statistics for research variables. Mean Values and Standard Deviations (2015-2022) 1.
Western Europe Northern Europe Southern Europe Central Europe Eastern Europe
Variables Mean Std.
Dev.
Mean Std. Dev. Mean Std. Dev. Mean Std. Dev. Mean Std. Dev.
Accessibility of the Local Government Information 58.58 ±4.35 64.2 ±3.31 47.15 ±7.94 52.63 ±15.31 53.23 ±10.45
Residents’ Participation to Decision- Making 46.37 ±4.84 51.8 ±9.59 28.95 ±9.07 39.93 ±13.82 36.48 ±11.6
Residents’ Assessments of the Local Government Projects 52.9 ±6.58 60.43 ±6.5 37.1 ±4.83 48.1 ±12.82 48.05 ±10.66
GDP/Capita 54738.25 ±18272.27 47301.5 ±8800.74 33669.29 ±5092.32 37670.98 ±14885.7 30602 ±1419.66
Human Development Index 0.9 ±0.03 0.9 ±0.04 0.88 ±0.05 0.94 ±0.01 0.9 ±0.03
Sustainable Development Index 81.35 ±0.81 84.35 ±2.11 77.51 ±1.78 78.62 ±4.65 78.04 ±2.33
Education 82.12 ±2.59 86.76 ±4.71 82.59 ±6.84 87.21 ±6.11 87.07 ±3.54
Democracy Index 8.45 ±0.54 8.88 ±0.69 7.79 ±0.32 7.66 ±0.69 6.77 ±0.28
Economic Freedom 73.71 ±6.01 77.09 ±1.03 64.57 ±3.92 72.17 ±1.95 67.44 ±1.13
Social Inclusion 91.08 ±1.65 90.75 ±3.18 88.14 ±2.77 87.29 ±5.58 82.4 ±2.7
Political Culture 7.92 ±1.02 8.75 ±1.35 7.66 ±0.32 6.32 ±1.54 5.32 ±1.08
Local Participatory Democracy 52.06 ±5.00 57.94 ±5.73 36.02 ±7.73 46.18 ±13.94 44.62 ±11.25
1 Sources of data: Accessibility of the Local Government Information, Residents’ Participation to Decision- Making and Residents’ Assessments of the Local Government Projects from: https://imd.cld.bz/Smart-City-Index-2021/38/ (accessed on 10 June 2023); GDP/ capita from: https://data.worldbank.org/indicator/NY.GDP.PCAP.KD.ZG?view=chart (accessed on 5 June 2023); Human Development Index from: https://hdr.undp.org/(accesed on 15 June 2023); Sustainable Development Index from: https://dashboards.sdgindex.org/(accesed on 5 June 2023); Education from Eurostat:https://ec.europa.eu/eurostat/web/products-eurostat-news/-/ddn-20221026-1 (accessed on 15 June 2023); Democracy Index and Political Culture from: https://www.eiu.com/n/ (accessed on 25 May 2023); Economic Freedom from: https://www.heritage.org/index (accessed on 25 May 2023); Social Inclusion from: https://gggi-simtool-demo.herokuapp.com/(accessed on 5 June 2023).
Disclaimer/Publisher’s Note: The statements, opinions and data contained in all publications are solely those of the individual author(s) and contributor(s) and not of MDPI and/or the editor(s). MDPI and/or the editor(s) disclaim responsibility for any injury to people or property resulting from any ideas, methods, instructions or products referred to in the content.
Copyright: This open access article is published under a Creative Commons CC BY 4.0 license, which permit the free download, distribution, and reuse, provided that the author and preprint are cited in any reuse.
Prerpints.org logo

Preprints.org is a free preprint server supported by MDPI in Basel, Switzerland.

Subscribe

© 2024 MDPI (Basel, Switzerland) unless otherwise stated