1. Introduction
The physical essence of earthquakes is instability or failure of a stressed medium under the action of tectonic stress. When an earthquake occurs, the accumulated stress is quickly released. Based on rock test results, a focal fault will experience two stages before its failure: a stress-increase stage and a sub-instability stage[
1,
2]. During the latter the focal medium becomes extremely unstable and is approaching instability, where the time of earthquake occurrence can be controlled by weak stress perturbations that make some earthquakes occur more easily than usual. Although the stress changes (~1Pa) due to the variation in the rate of Earth's rotation in the crust are quite tiny[
3], when a strong earthquake is approaching, earthquakes in and around the focal medium would be susceptible to the weak changes of stress, resulting in a strong correlation between the Earth's rotation and the earthquake occurrence. Significant correlations were found between the Earth's rotation and the occurrence of earthquakes occurring before some strong earthquakes[
4,
5,
6,
7,
8,
9] On 6 February 2023 an
Mw 7.8 earthquake occurred in Gaziantep, Turkey with its epicenter located at 37.1662°N, 37.0421°E by the USGS Network. In the present study, we focused on this event to investigate the correlation between the Earth's rotation and the occurrence of earthquakes that occurred in and around its source region during pre-quake time interval.
2. Data and Methods
The 2023 Gaziantep
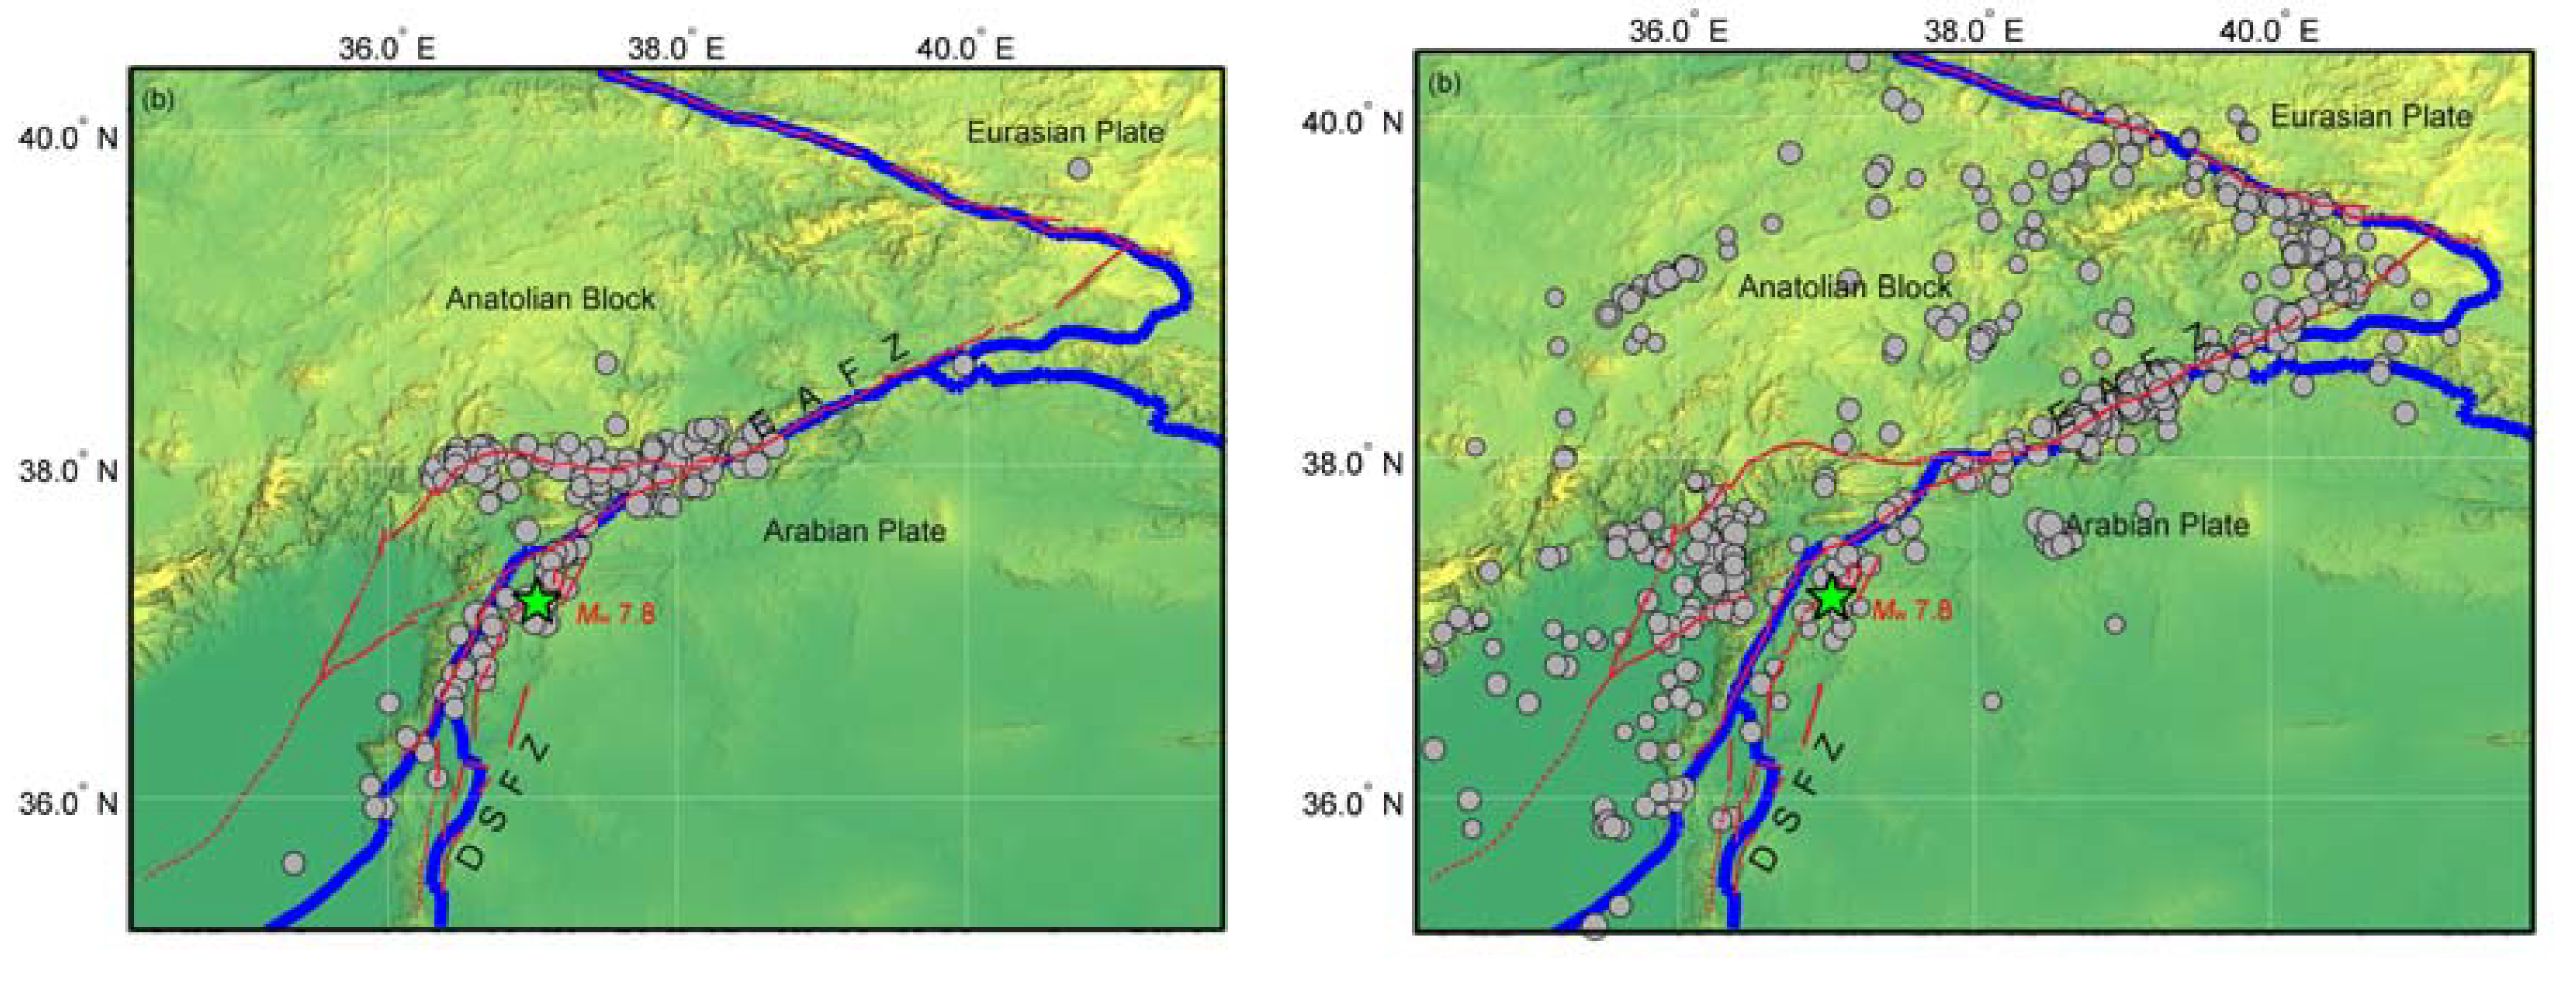
Mw 7.8 earthquake occurred at the junction of the East Anatolian fault zone (EAFZ) with the Dead Sea fault zone (DSFZ). Its focal mechanism solutions indicate a steeply dipping fault plane striking NE-SW with a left lateral slip, or one striking NW-SE with right lateral slip. Aftershocks of the Gaziantep earthquake spread along the direction of NE-SW (
Figure 1a). According to this, the Gaziantep earthquake ruptured on a left-slip plane striking NE-SW due to the relative motion between the Arabian plate and the Anatolian block.
Earthquakes used in this study were obtained from the USGS earthquake catalog (
https://earthquake.usgs.gov/earthquakes/search/). The epicenter distribution of aftershocks of the Mw 7.8 Gaziantep earthquake were showed in
Figure 1a (grey circles). The epicenters of earthquakes of
M≥3.0 that occurred from January 2002 to December 2022 were plotted in
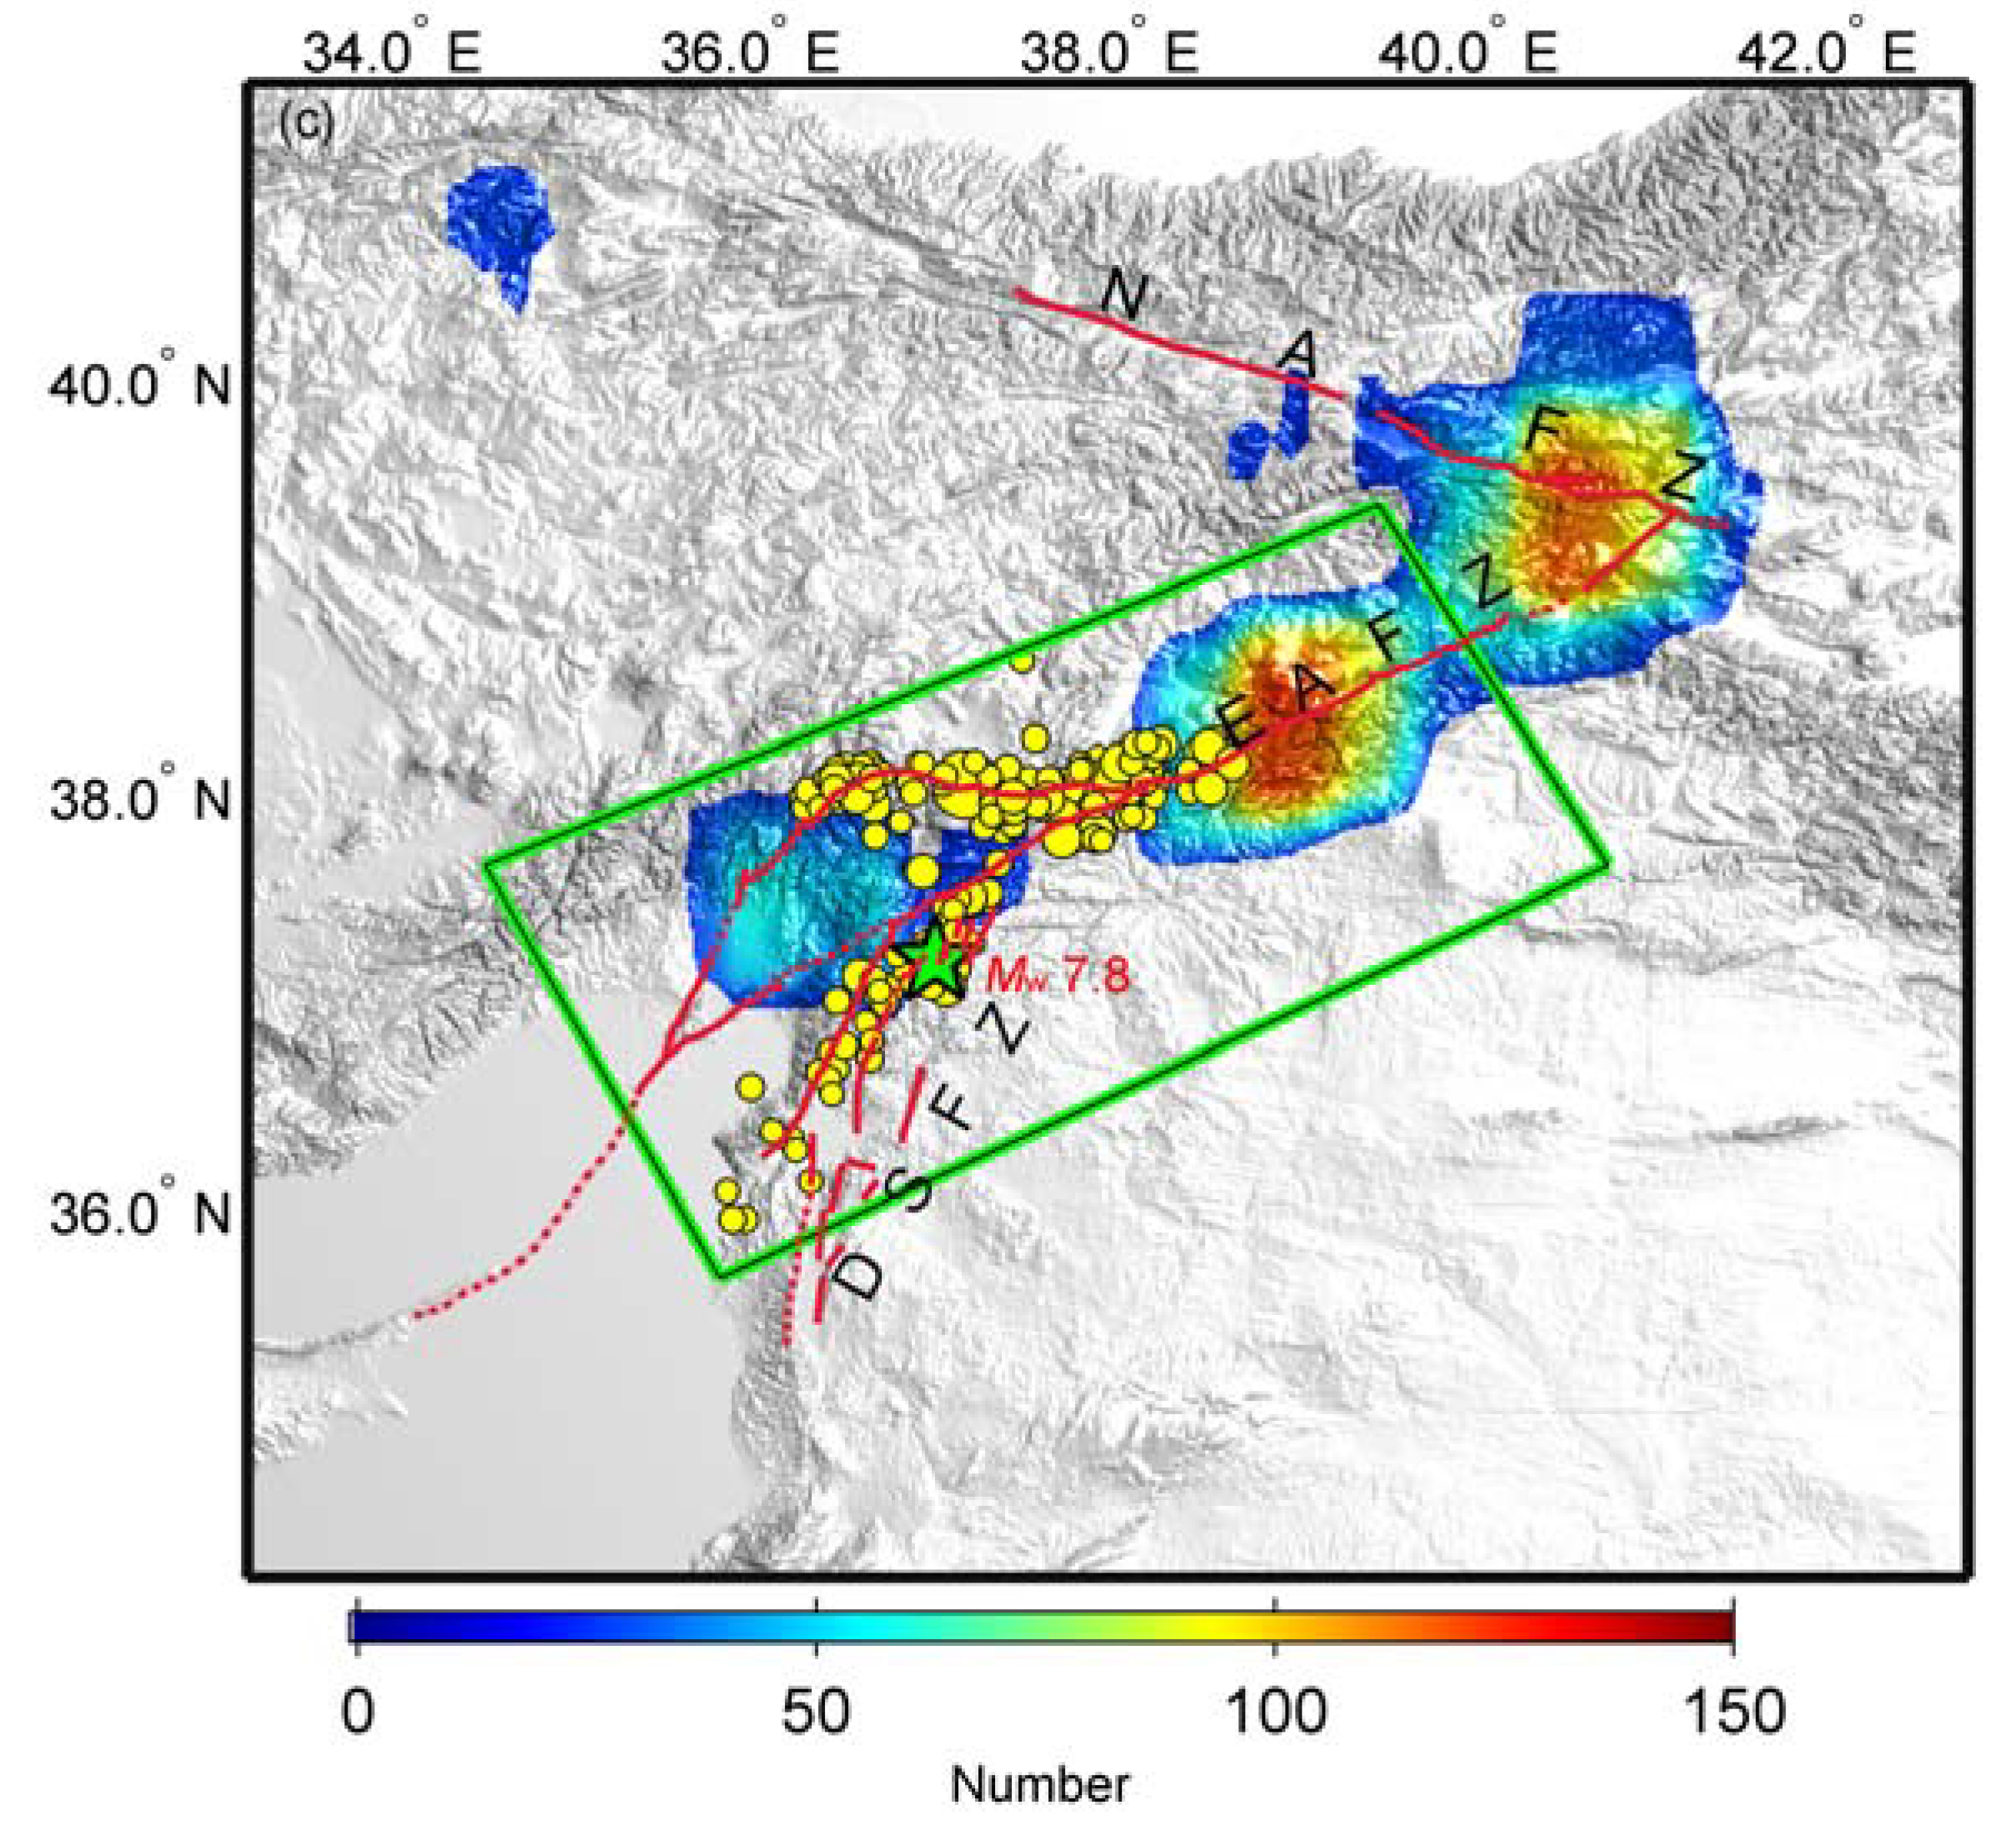
Figure 1b. The spatial distribution of seismic numbers was obtained from the earthquakes in Figure1b applying a spatial window of 1.0° ×1.0° moved by 0.1° in both the latitudinal and longitudinal directions (
Figure 1c). Three higher seismic frequency areas are located near the
Mw 7.8 Gaziantep mainshock, at the central segment and near the junction of the EAFZ and the North Anatolian fault zone (EAFZ), respectively. For analysis of the
P-value as a function of time , we considered an area of~ 400km×230 km as the study region (
Figure 1c, the green boxed region) that covers the aftershock zone of the
Mw7.8 Gaziantep mainshock and two nearby higher seismic frequency areas. For all earthquakes in
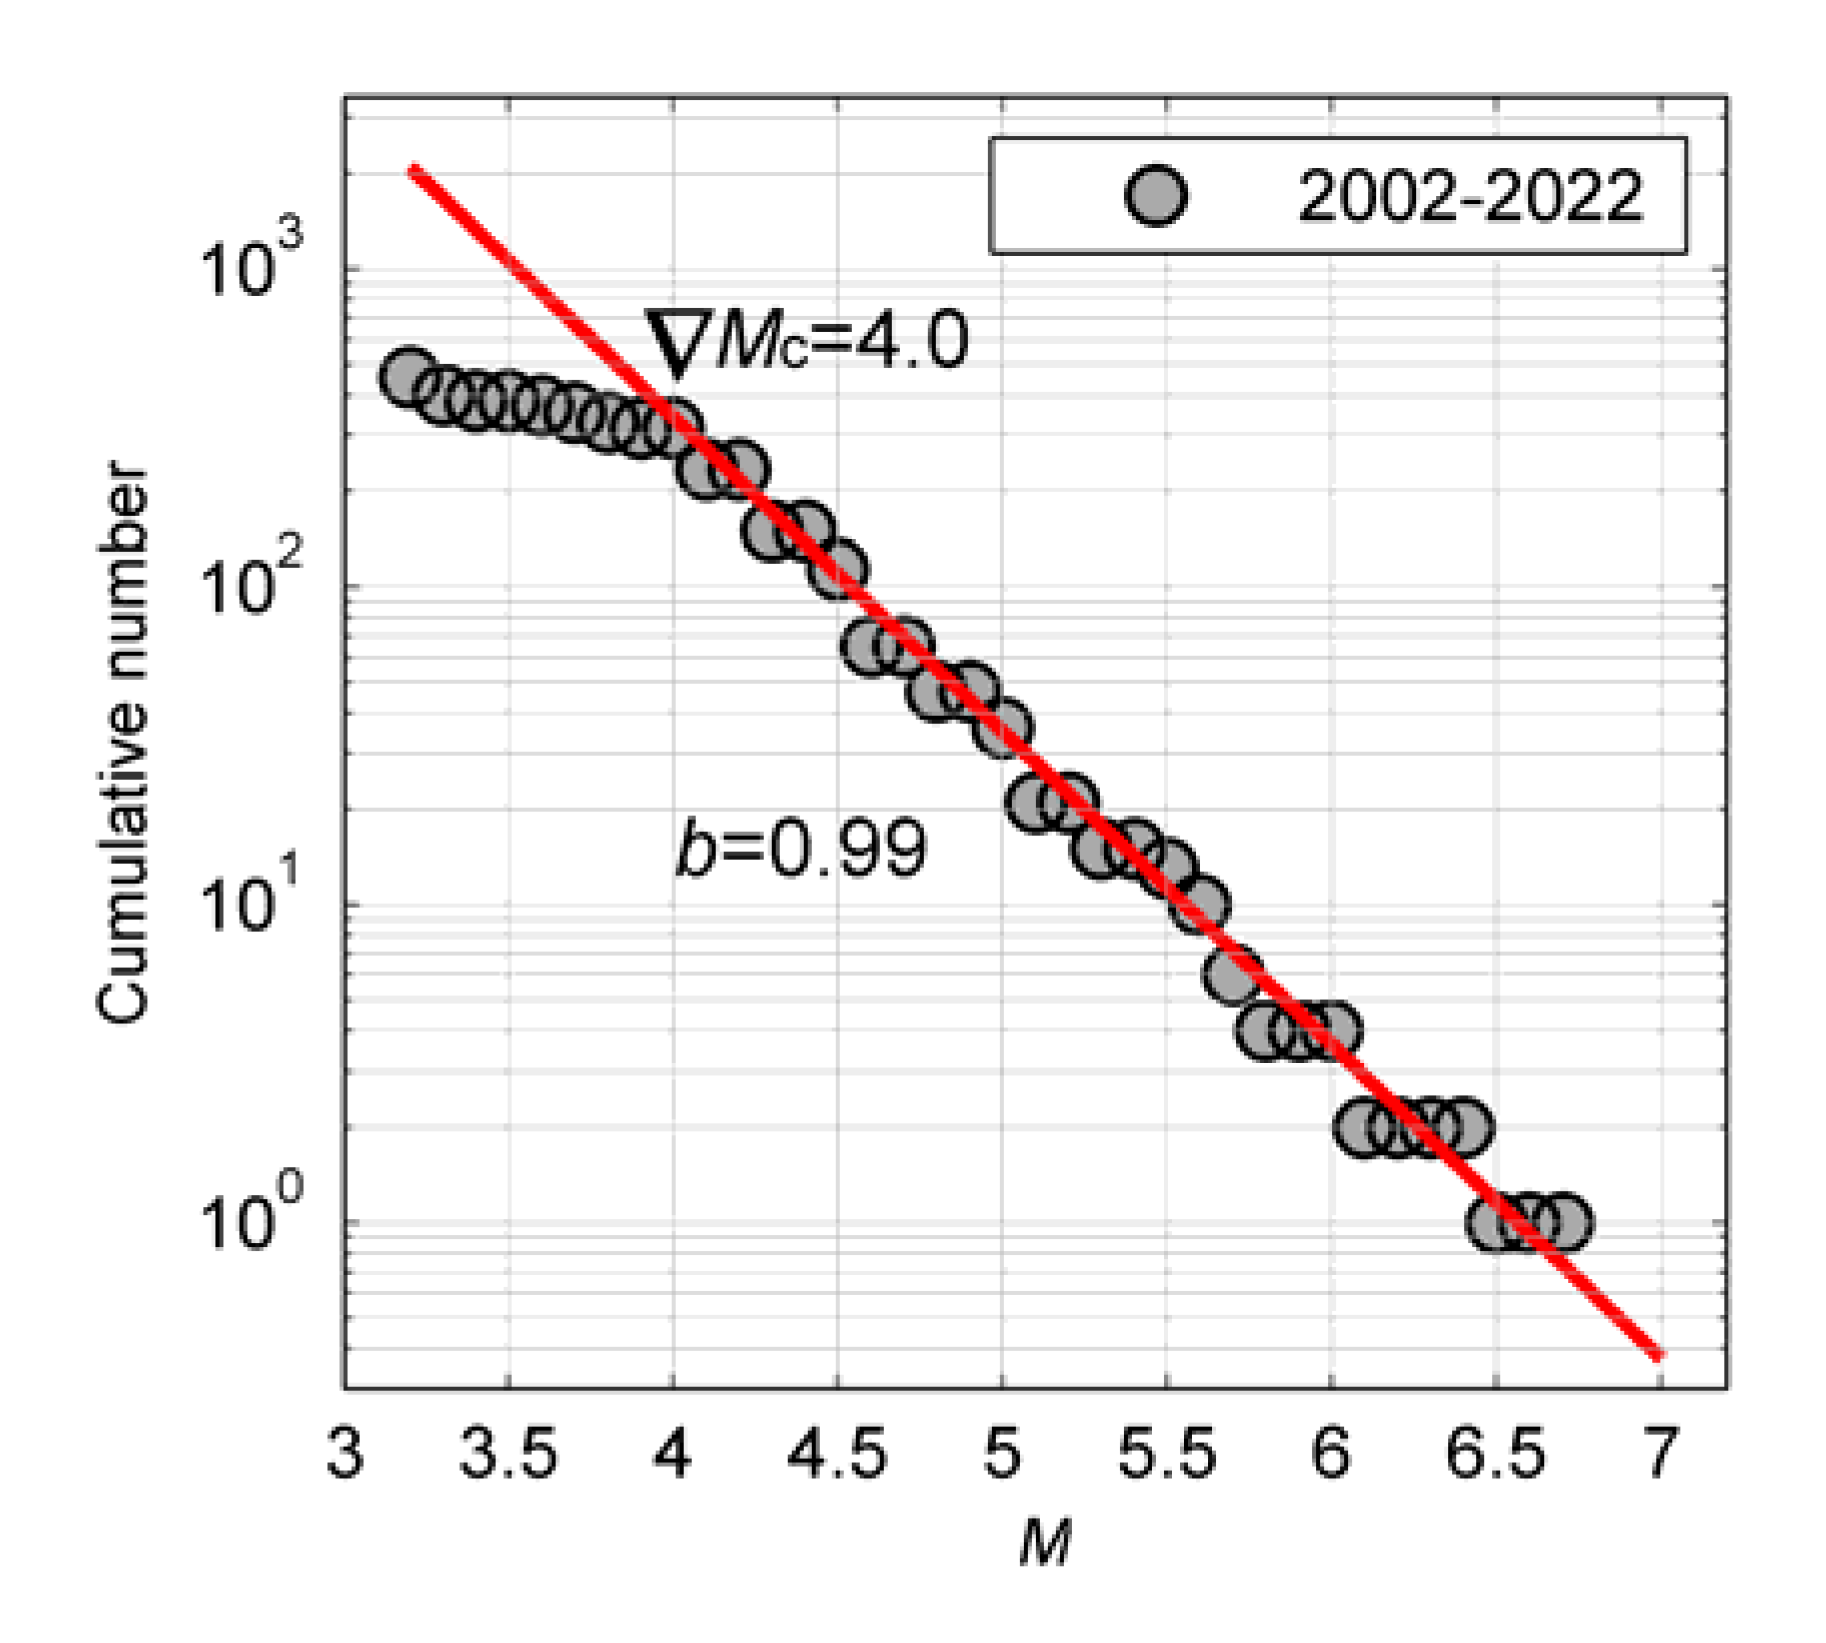
Figure 1b, we considered the completeness of earthquake catalogue with respect to the observed Gutenberg-Richter relationship via visual inspection. The event frequency-magnitude plot (
Figure 2) suggests the threshold of completeness to be
Mc = 4.0. For calculation of the P-value as a function of time we took 190 earthquakes of
M≥4.0 that occurred in the study region from January 2002 to December 2022. For mapping the spatial distribution of the
P-values, all earthquakes (
M≥4.0) in
Figure 1b were used.
The data of length of day relating to the Earth's rotation was acquired from the Earth Orientation Center (
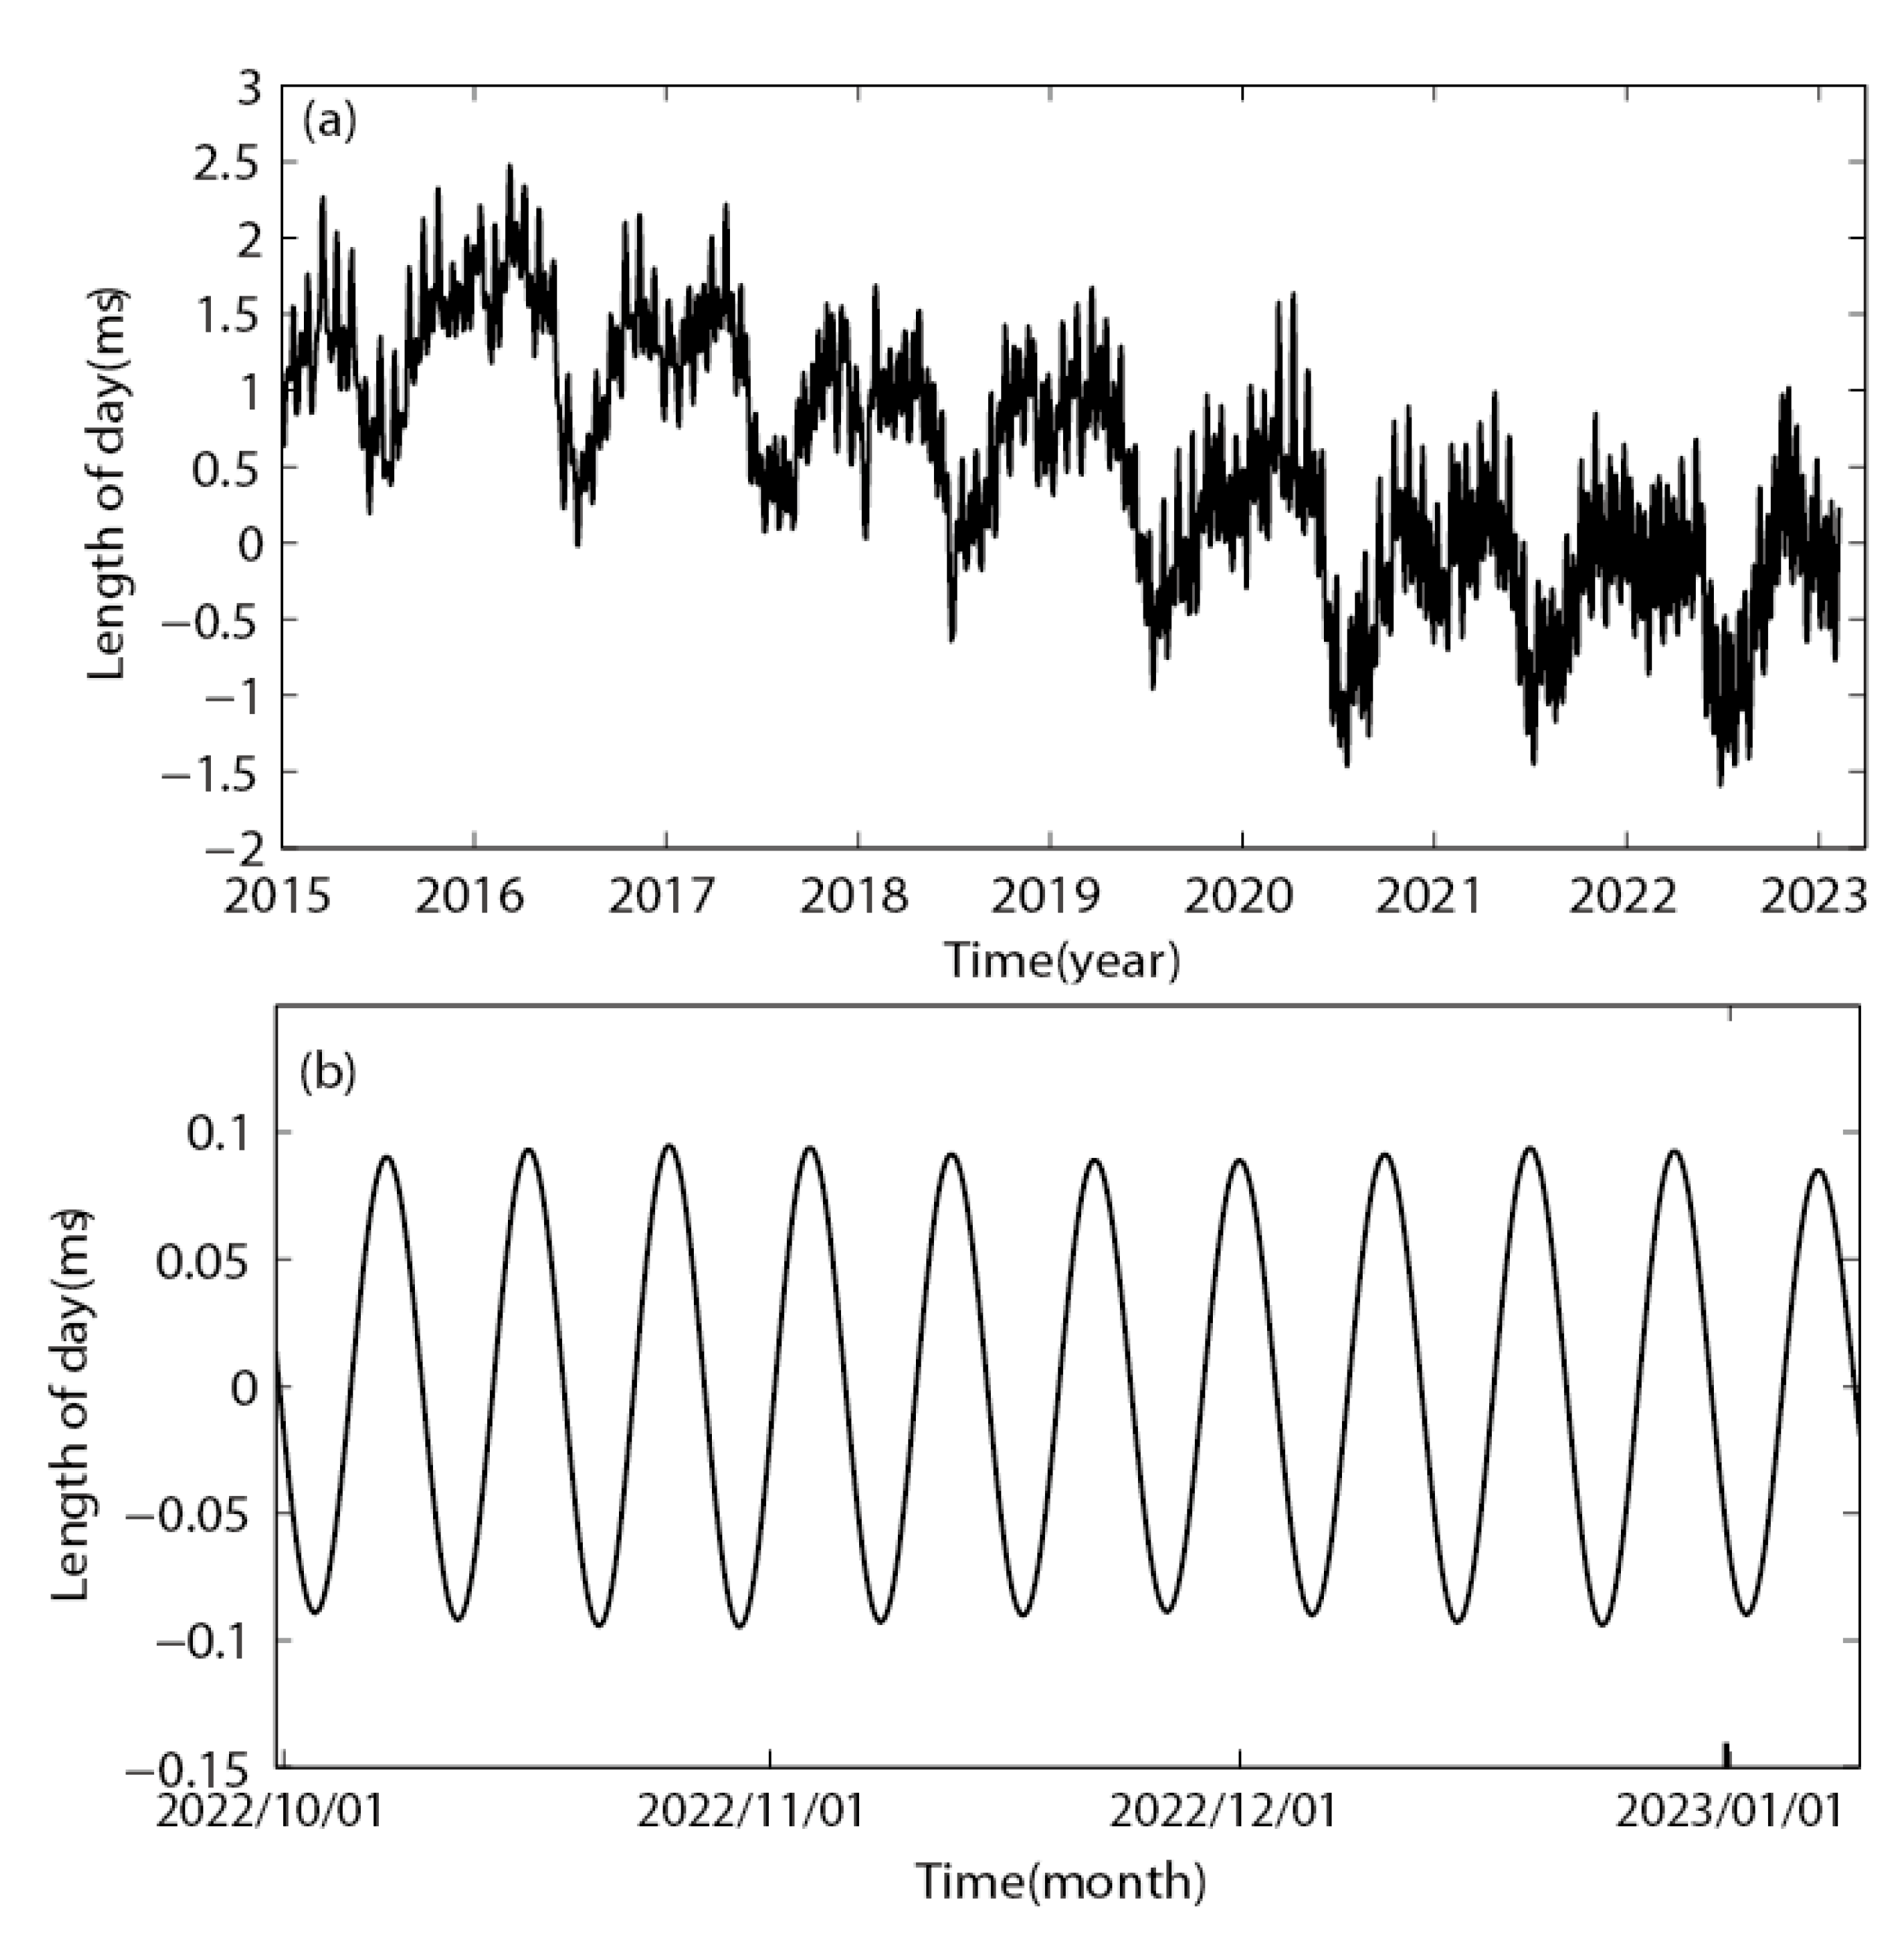
http://hpiers.obspm.fr/eop-pc). The raw data of length of day with the standard length of day (24 hours) subtracted is shown in
Figure 3a. The variation of the length of day consists of different periodic components, which mainly include the long period component with a period of more than ten years, the seasonal component with a period of more than one month and less than one year, and the short period component with a period of less than one month. The nine-day-cycle component is contained in the short period component and is caused by atmospheric effects[
10]. We will use the nine-day-cycle component to investigate the correlation between the Earth's rotation and the occurrence of earthquakes occurring prior to the 2023
Mw 7.8 Gaziantep event in this article. The nine-day-cycle component of the length of day is plotted in
Figure 3b, obtained by band-pass filtering with a period band between 8d and 10d.
We statistically examined the correlation between the Earth's rotation and the earthquake occurrence. The used method has been applied to investigate tidal triggering of earthquakes[
11,
12,
13]. Based on a temporal change series of length of day, the phase angle of the Earth's rotation at the occurring time of each earthquake can be calculated. The phase angle is defined as 0° at each maximum of the rate of the Earth's rotation, -180° at the first minimum on the left of the maximum, and 180° at the first minimum on the right one. The phase angle at the occurring time of an earthquake is calculated according to the following formula.
Where te is the occurring time of an earthquake,
t0 the time at the maximum of length of day immediately before or after
te,
t-180 and
t180 are the times at the minimum of length of day immediately before and after te respectively. With the phase angles of all earthquakes, we can statistically judge whether there is a significant correlation between those earthquakes and Earth's rotation by use of Schuster’s test. The results were valued by
P-value between 0 and 1. The
P-value of
N earthquakes can be obtained on the base of the following formulas.
Where,
θi is the phase angle of the i-th earthquake, N >10. In general, if P 5%, the earthquakes could be non-random[
14,
15].
3. Results
For 190 earthquakes of
M≥4.0 that occurred in the study region from January 2002 to December 2022, we examined the correlation between the nine-day-cycle variation of the Earth's rotation and the earthquake occurrence. The result is evaluated by the
P-value. First, we determined the phase angle of the Earth's rotation at the occurring time of each earthquake on the base of eqation (1) from the temporal change series of length of day (
Figure 3b), then
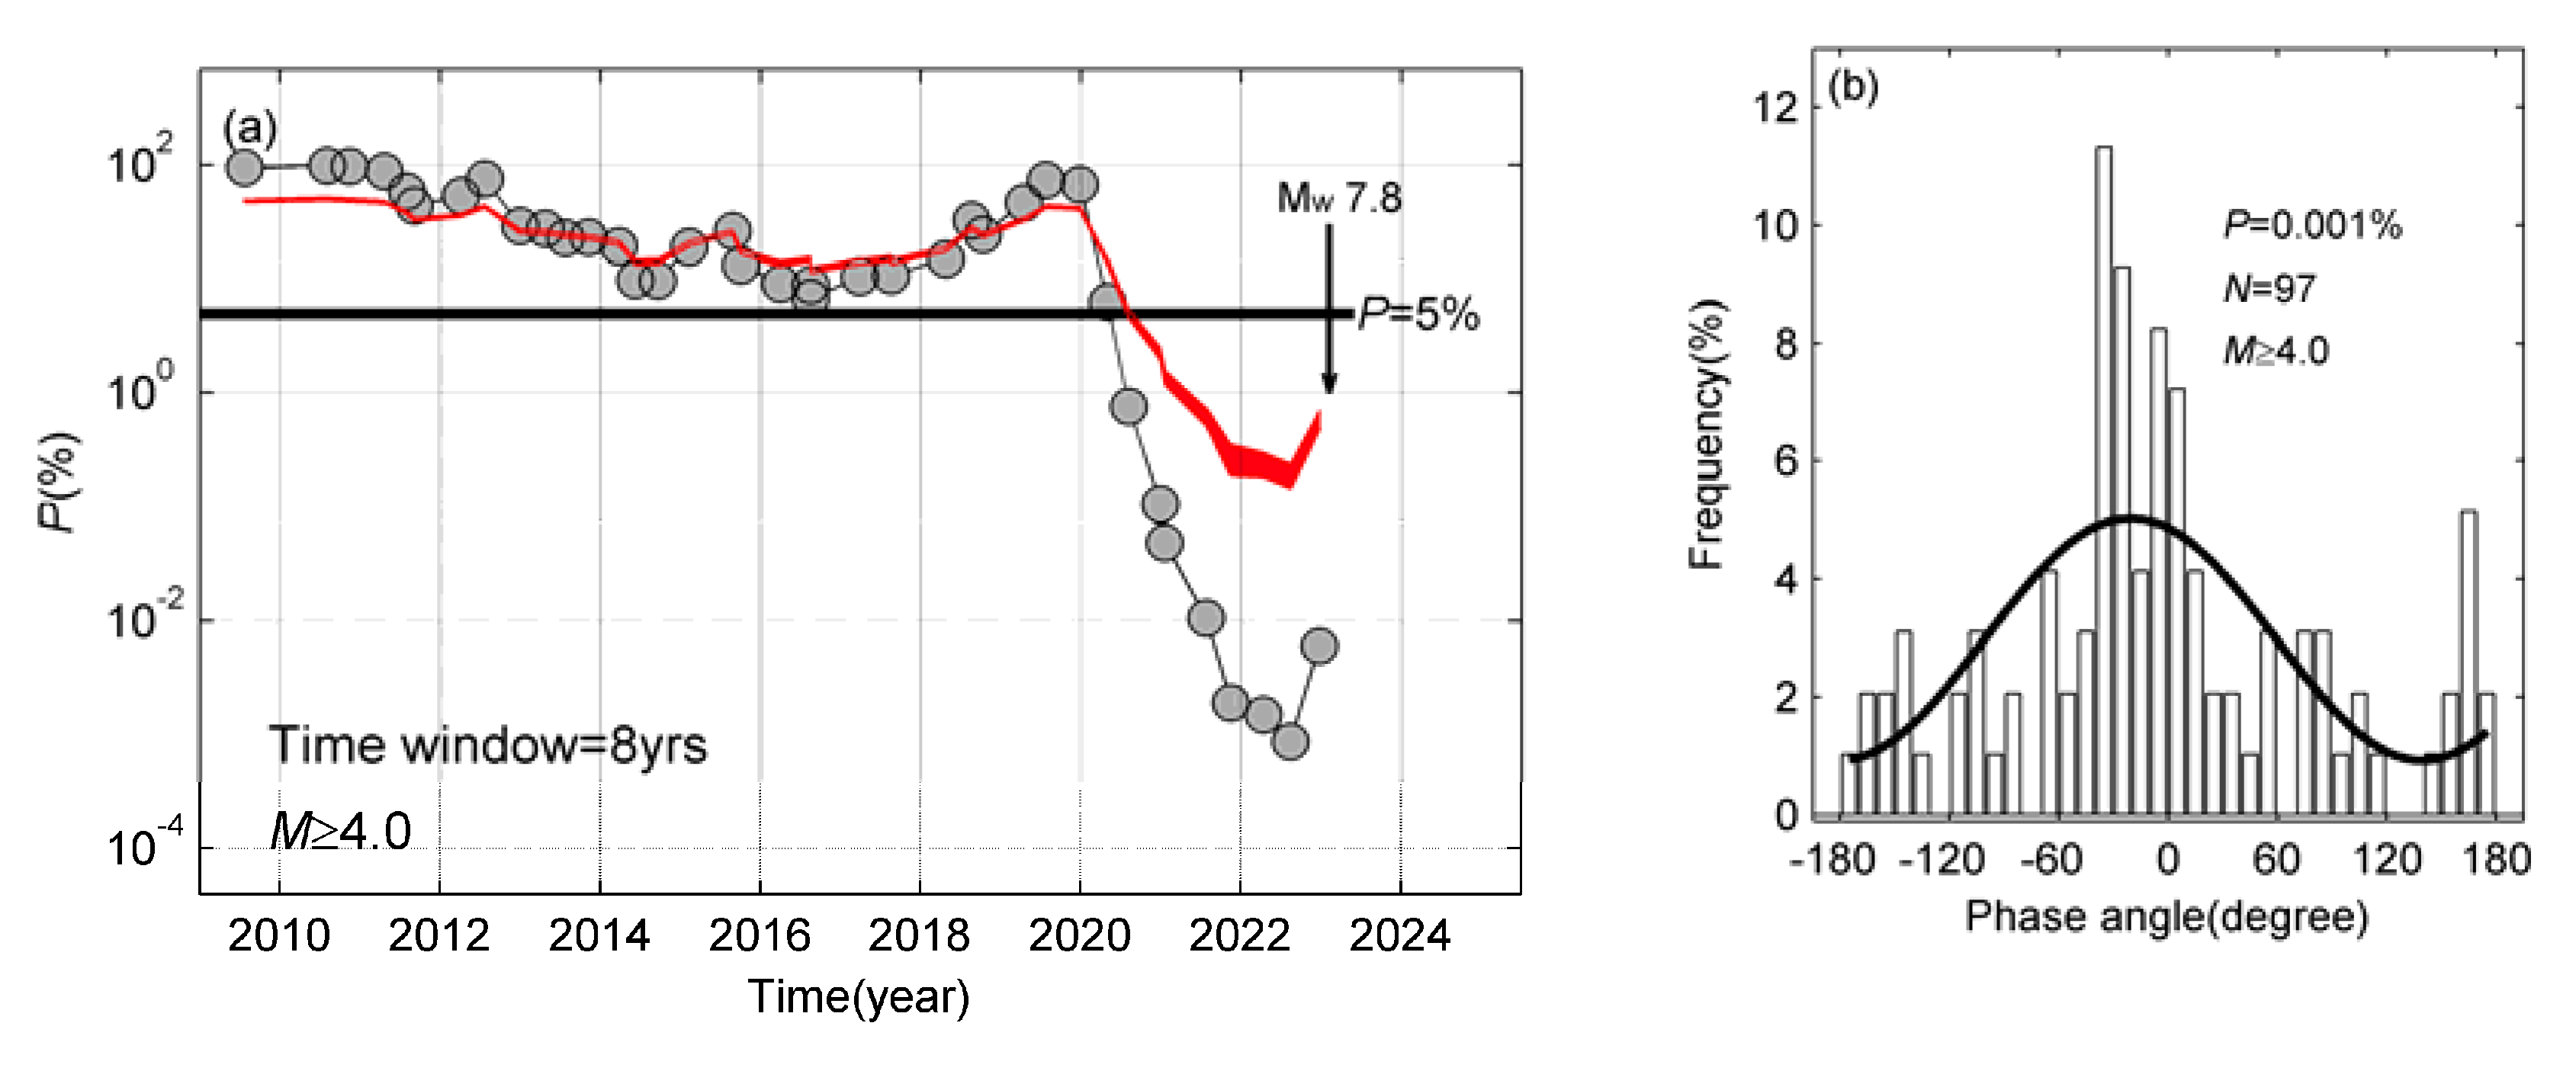
P-values as a function of time can be obtained via considering an eight-year time window moving 6 months at a time (
Figure 4a). We calculated the
P-value of each window according to eqation (2), and took the occurring time of the last earthquake in each window as the time of
P-value. The minimum number of earthquakes in all time windows is 46, the maximum 102 and the mean 63. Therefore, the requirement of earthquake number greater than 10 for the analysis can be met. A total of 40
P-values were calculated, of which only 8 are below 5%. This can be found in
Figure 4a, where the
P values were between 7% and 98% until April 2020 and no significant correlation can be found during this period. The
P value dropped to ~0.8% in the beginning of August 2020, approached the lowest value (0.001%) in August 2022. The
P values were below 0.1% from the beginning of 2021 to December 2022, therefore, a higher correlation between the earthquake occurrence and the Earth’s rotation occurred in this period due to the focal medium’s approaching instability.
The distribution of phase angles was obtained for ninety-seven earthquakes occurring when the
P-value is at its lowest (
Figure 4b), the corresponding time period is from September 2014 to August 2022. We found that most of these earthquakes occurred more easily when the phase angle was between -70° and 30°, this phase angle range corresponds to the increasing stage of the linear acceleration of Earth’s rotation[
9]. Thus, it is the increasing acceleration of Earth’s rotation that controls the occurrence of earthquakes preceding the
Mw7.8 Gaziantep, Turkey earthquake.
The bootstrap method is widely used for analyzing the statistical uncertainty [
16,
17]. It is based on the simulation of large number of data sets directly from the real experimental set of the events. The statistical fluctuations of the parameters are estimated using the simulated data sets for the investigated phenomenon. The simulation is based on the return-back sampling. That is, each simulated data set is randomly selected from the experimental data set without taking into account whether some events already have been taken to create this particular new data set or not. Any event from the initial set of the experimental data can be taken once, more than once, or cannot be taken at all. Each simulated data set contains the same number of events as the original experimental one. When the simulation of a large number of the new data sets is finished then relevant parameters are calculated for each of them. After this, it is easy to get the means and 95% confidence ranges of these parameters. We analyzed the confidence intervals of
P values for each bin in
Figure 4a based on bootstrap method. A sample of size 3000 is taken in the analysis. The confidence intervals of 95% of
P values for each bin are shown by the red area in Figure4a. In December 2021, the
P value dropped to a value between 0.25% and 0.44%, far below 5%.
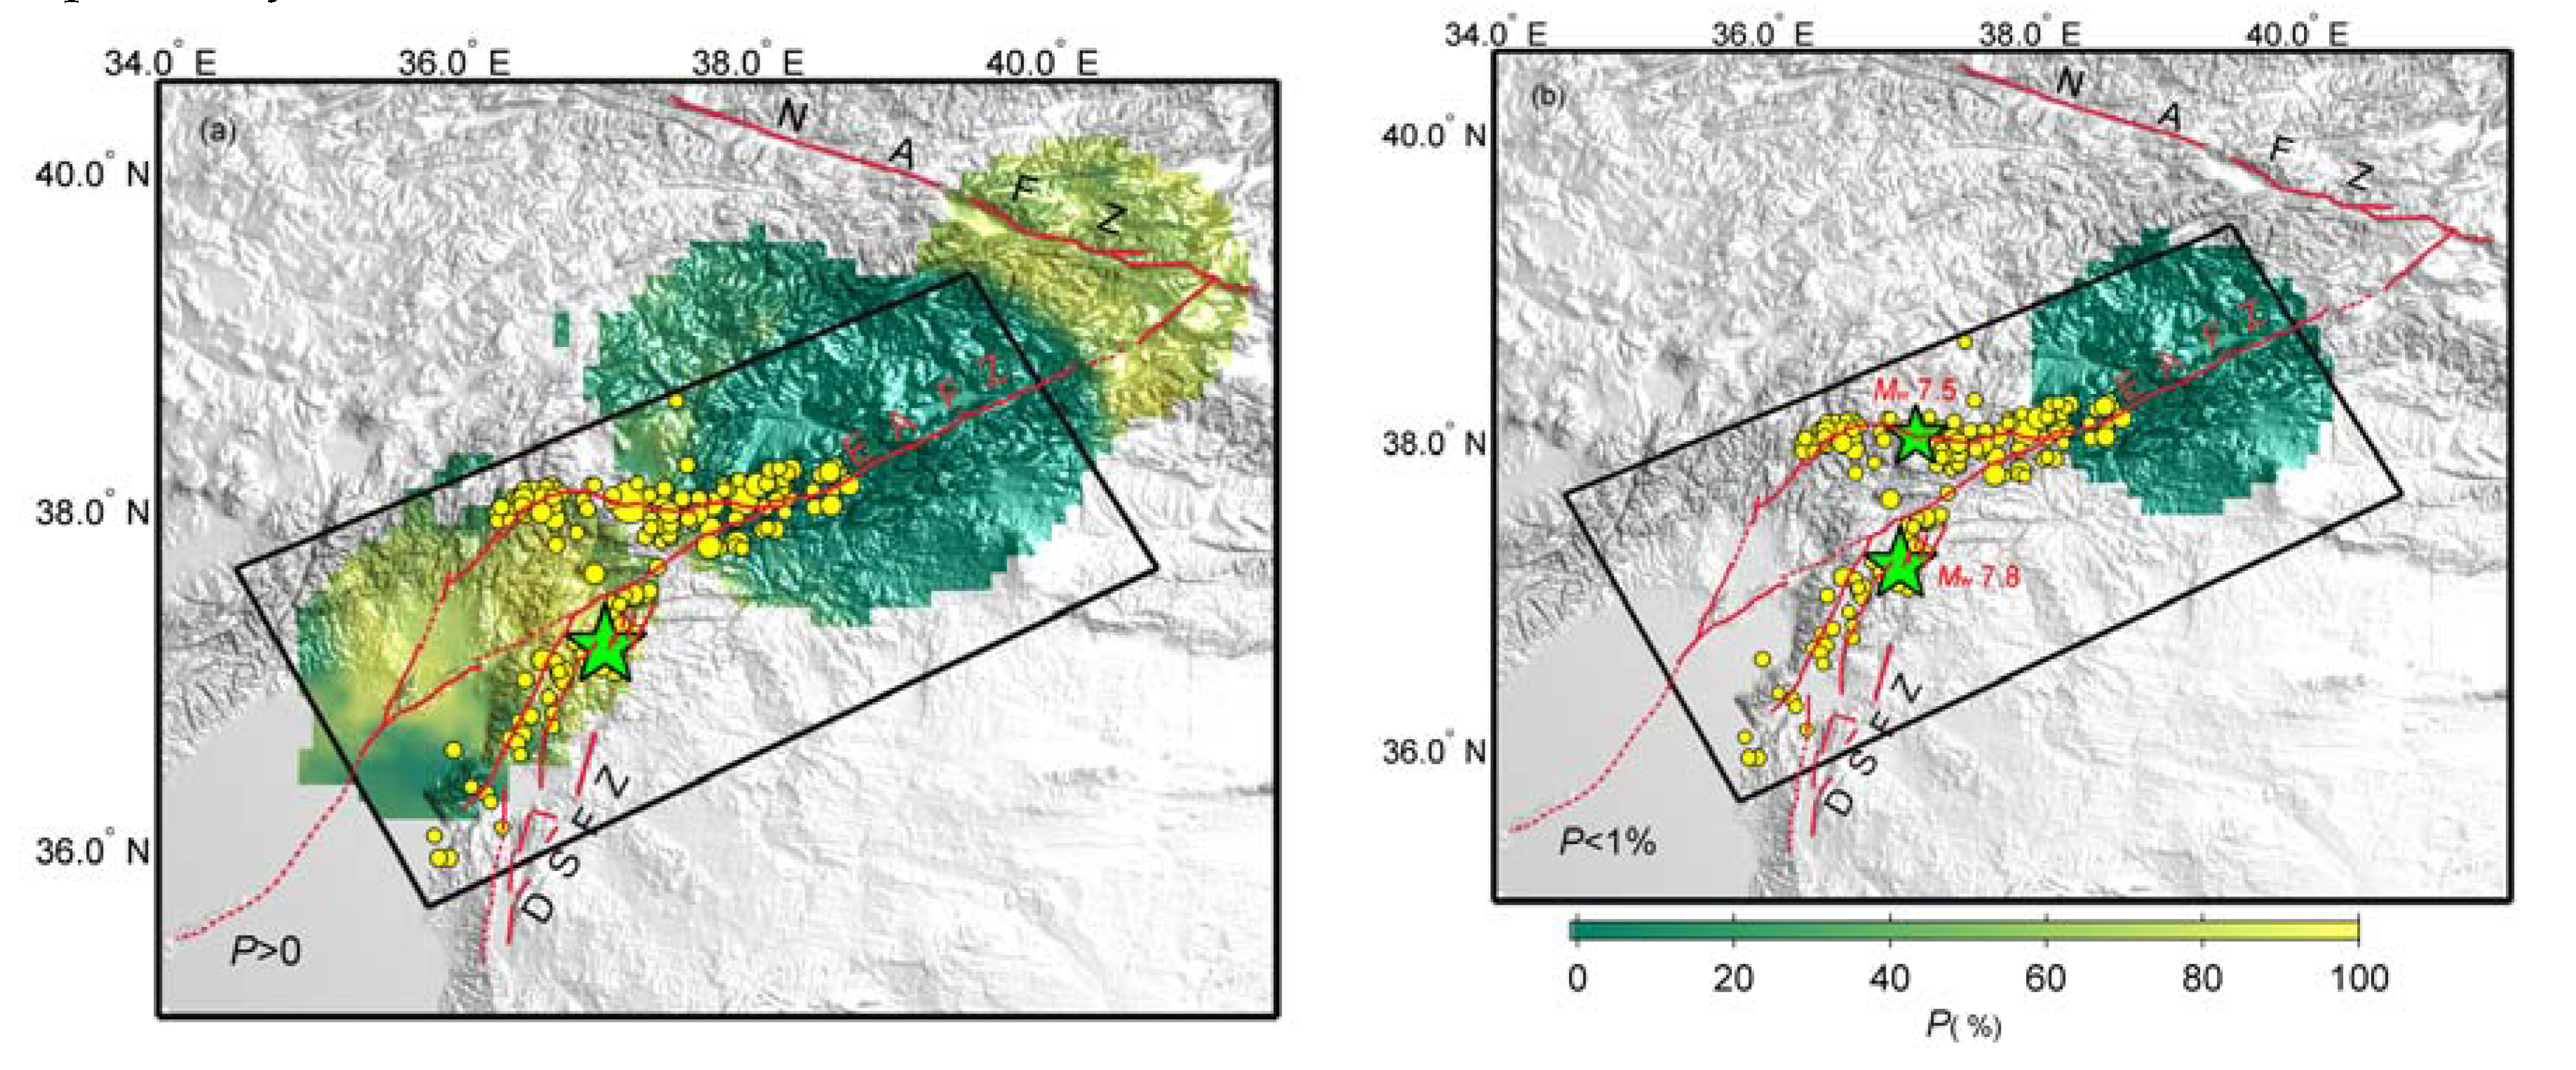
The spatial distribution of the
P-values for earthquakes (
M ≥4.0) occurring from September 2014 to August 2022 is shown in
Figure 5a. A time interval of ten years was used for obtaining the spatial distribution of the
P-values. A rectangle region with latitude range from 34°N-40.5°N and longitude range from 33°E-42°E was considered. A circular spatial window of a radius of 100km moving by 0.1° in along-latitude and along-longitude directions was used. When earthquakes in a window are over 10,
P-value can be worked out. The spatial distribution of
P< 1% was plotted in
Figure 5b, where it can be found that low
P-values located in the northeast of the study area for analysis of the P-value as a function of time. Two mainshocks occurred on 6 February 2023, their magnitudes are
Mw7.8 and
Mw7.5 respectively. Their locations are shown by stars in
Figure 5b. The minimum distances between their epicenters and the edge of the area with
P-values less than 1% less are 138km and 83km respectively.
4. Discussion
We investigated the correlation between the Earth’s rotation and earthquakes that occurred before the Mw 7.8 Gaziantep earthquake. For earthquakes of M≥4.0 in the study area we calculated the P-value as a function of time. We discovered lower P-values only occurred about two years prior to the Mw 7.8 Gaziantep earthquake. Earthquakes happened more frequently when the phase angle was between -70°and 30°, corresponding to the increasing period of the linear acceleration of the Earth’s rotation.
Furthermore, we calculated the spatial distribution of the P-values using earthquakes (M≥4.0) occurring from September 2014 to August 2022 and found that low P-values (P < 1%) covered an area less than 140km northeast of the epicenter of the Mw 7.8 Gaziantep earthquake.
We also investigated the correlation between the rotation of the Earth and the occurrence of earthquakes using the seasonal component and did not find any significant correlation. This may be related to the critical stiffness of the focal medium. It was found based on slider-block models of slip that slip can amplify dramatically under the action of given stress within a narrow band of resonant periods [
18]. Slip response amplifies significantly for a narrow range of periods near the critical period
Tc when stiffness
k is equal to the critical stiffness
kc, and at shorter periods when
k is greater than kc[
19].
It has been well- known that when a stressed medium is approaching failure, it will reach a critical state. Under this condition, when the period of the Earth’s rotation is within a narrow band of resonant periods, seismicity could be significantly correlated to the Earth’s rotation.
5. Conclusions
From the above results, the significant Earth’s rotation-related seismic activity indicated that the focal medium in the region around the Mw 7.8 Gaziantep earthquake was at a critical state. In other words, the focal medium has become extremely unstable, and could failure at any moment to release a strong earthquake. Therefore, we suggest that the Earth's rotation-related seismicity prior to the Mw 7.8 Gaziantep, Turkey earthquake could be considered as one of its precursors.
Author Contributions
X.C. contributed to the conceptualization; supervised the research; formulated the research questions; and specified the manuscript contents, discussed with Y.L. and J.C., and prepared the manuscript. Y.L. participated in the collection of references, performed the collation of the earthquake catalog used and plotting diagrams, submitted the manuscript, and provided constructive suggestions to the study. L.C. participated in the collection of references and provided constructive suggestions to the study. All authors have read and agreed to the published version of the manuscript.
Funding
This research received no external funding.
Data Availability Statement
Not applicable.
Acknowledgments
The authors express sincerely thanks to the journal editors for their help and beneficial comments to the manuscript.
Conflicts of Interest
The authors declare no conflict of interest.
References
- Ma, J.; Guo, Y. Accelerated synergism prior to fault instability: evidence from laboratory experiments and an earthquake case (in Chinese with English abstract). Seismol. Geol. 2014, 36, 547–561. [Google Scholar]
- Ma, J. On “whether earthquake precursors help for prediction do exist?” (in Chinese with English abstract). Chinese Sci. Bull. 2016, 61, 409–414. [Google Scholar] [CrossRef]
- Chen, X.; Wang, H.; Wang, S.; Wei, Y.; Guo, X.; Chen, L; Li, Y. Effect of the Earth’s rotation deceleration on the occurrence of the 2008 Wenchuan Ms 8.0 earthquake (in Chinese with English abstract). Earthquake 2018, 38, 127–136. [Google Scholar]
- Wei, Y.; Chen, X.; Li, Y. Relation between Earth’s rotation and small earthquakes occurring before the Ms 7.8 Tangshan mainshock(in Chinese with English abstract). Chinese Sci. Bull. 6, 1822–1828.
- Chen, X.; Li, Y. Relationship Between the deceleration of Earth’s rotation and earthquakes that occurred before the Ms 8.0 Wenchuan earthquake. Pure and Applied Geophysics 176, 5253-5260.
- Chen, X.; Li, Y.; Wei, Y. Earth's rotation-triggered earthquakes before the 2018 Ms 5.7 Xingwen earthquake. Earthquake Science 32, 35-39.
- Chen, X.; Li, Y.; Wei, Y.; Guo, X.; Chen, L. Relationship between the Earth’s rotation rate and earthquakes occurring prior to the 2011 Mw 9.1 Tohoku-Oki Japan earthquake(in Chinese with English abstract). Chinese Journal of Geophysics 2020, 63, 440–444. [Google Scholar]
- Chen, X.; Li, Y.; Chen, L. Why the Mw 6 Parkfield earthquake expected in the 1985-1993 interval was postponed till 2004? Geomatics, Natural Hazards and Risk 2022, 13, 2151–2165. [Google Scholar] [CrossRef]
- Li, Y.; Chen, X.; Chen, L. The Earth's rotation-triggered earthquakes preceding the occurrence of the 2019 Mw 7.1 Ridgecrest earthquake. Geomatics, Natural Hazards and Risk 2022, 12, 3021–3034. [Google Scholar] [CrossRef]
- Han, Y.; Li, Z. Analysis of main middle and short periods in the variation of the Earth's rotation(in Chinese with English abstract). Chinese Journal of Geophysics 2002, 17, 349–352. [Google Scholar]
- Tanaka, S.; Ohtake, M.; Sato, H. Spatio-temporal variation of the tidal triggering effect on earthquake occurrence associated with the 1982 South Tonga earthquake of Mw 7.5. Geophys. Res. Lett. 2002, 29, 3‐1‐3‐4. [Google Scholar] [CrossRef]
- Tanaka, S. Tidal triggering of earthquakes precursory to the recent Sumatra megathrust earthquakes of 26 December 2004 (Mw 9.0), 28 March 2005 (Mw 8.6), and 12 September 2007 (Mw 8.5). Geophys. Res. Lett. 2010, 37, L02301. [Google Scholar] [CrossRef]
- Tanaka, S. Tidal triggering of earthquakes prior to the 2011 Tohoku-Oki earthquake (Mw 9.1). Geophys. Res. Lett. 2012, 39, L00G26. [Google Scholar] [CrossRef]
- Tsuruoka, H.; Ohtake, M.; Sato, H. Statistical test of the tidal triggering of earthquakes: Contribution of the ocean tide loading effect. Geophysical Journal International 1995, 122, 183–194. [Google Scholar] [CrossRef]
- Heaton, T. H. Tidal triggering of earthquakes. Geophys. J. R. Astr. Soc. 1975, 43, 307–326. [Google Scholar] [CrossRef]
- Efron, B. Bootstrap methods: Another look at the jackknife. Annals of Statistics 1979, 7, 1–26. [Google Scholar] [CrossRef]
- Matsuyama, T. An application of bootstrap method for analysis of particle size distribution. Advanced Powder Technology 2018, 29, 1404–1408. [Google Scholar] [CrossRef]
- Perfettini, H.; Schmittbuhl, J.; Rice, J. R.; Cocco, M. Frictional response induced by timedependent fluctuations of the normal loading. J. Geophys. Res. 2001, 106, 13455–13472. [Google Scholar] [CrossRef]
- Lowry, A. R. Resonant slow fault slip in subduction zones forced by climatic load stress. Nature 2006, 442, 802–805. [Google Scholar] [CrossRef] [PubMed]
|
Disclaimer/Publisher’s Note: The statements, opinions and data contained in all publications are solely those of the individual author(s) and contributor(s) and not of MDPI and/or the editor(s). MDPI and/or the editor(s) disclaim responsibility for any injury to people or property resulting from any ideas, methods, instructions or products referred to in the content. |
© 2023 by the authors. Licensee MDPI, Basel, Switzerland. This article is an open access article distributed under the terms and conditions of the Creative Commons Attribution (CC BY) license (http://creativecommons.org/licenses/by/4.0/).
