Preprint
Article

Obtaining Shingle-Type Bricks through Geopolymerization Processes and Their Application in Building Envelopes for Residential Constructions

Altmetrics

Downloads

109

Views

50

Comments

0

Submitted:

01 August 2023

Posted:

03 August 2023

You are already at the latest version

Alerts
Abstract
Brick is widely used in construction, but it often becomes debris due to its use and lack of quality. In Ecuador, brick production is not completely industrialized, resulting in deficient properties for construction. In the city of Loja, most bricks come from artisanal factories . This research proposes the use of geopolymerization and waste bricks to create a sustainable material in construction. Geopolymerization processes were employed with sodium hydroxide as the alkaline activator. The resulting products underwent various tests to obtain the optimal formula in terms of material behavior and strength. Physical and mechanical property tests were conducted, and their application in building envelopes for low-income housing was analyzed. The results showed that the new material, when used as cladding on facades, can reduce heating and cooling demand. In a case study in Loja, a significant decrease in heating and cooling degree days was observed. This research opens new possibilities in the utilization of recycled materials in construction and can contribute to knowledge in this field.
Keywords: 
Subject: Arts and Humanities  -   Architecture

1. Introduction

This research provides alternative solutions for construction waste, which is identified as the main source of pollution in this industry. In Ecuador, construction waste reaches values of 72,000 tons (2013), without proper classification of these materials [1], often resulting in their disposal in landfills as the best available option.
Brick waste holds significant potential for recycled and reused as a construction material, presenting a friendly alternative to the environment through sustainable management [2]. The research aims to determine if the local material meets the prerequisites for alkaline activation, identify the best mixture proportions, and assess their contributions to the architectural application of this reconstituted brick.
Furthermore, the aluminosilicate content found in brick waste defines it as an inorganic material with properties akin to ceramics. Geopolymers can be formed from these aluminosilicates at room temperature or slightly elevated temperatures [3], which is where this research makes its contribution by reducing CO2 emissions. This is achieved using an alkaline solution in a matrix containing silica and alumina [4].
This research aims to experimentally verify the feasibility of making bricks through geopolymerization processes from finely crushed fired brick waste. The physical properties such as density, porosity, permeability, stain determination, and efflorescence, as well as mechanical properties including compression, flexion, and material stiffness, are studied to characterize the resulting material from the geopolymerization process as a preliminary stage. Subsequently, the thermal characterization of the brick will allow its evaluation as a cladding element in buildings, proceeding with computational simulation applied to a case study using the experimentally obtained data. This will allow predicting the behavior of its thermal input, considering it as an adaptive comfort strategy in building envelopes in the city of Loja as a case study.

2. Materials y methods

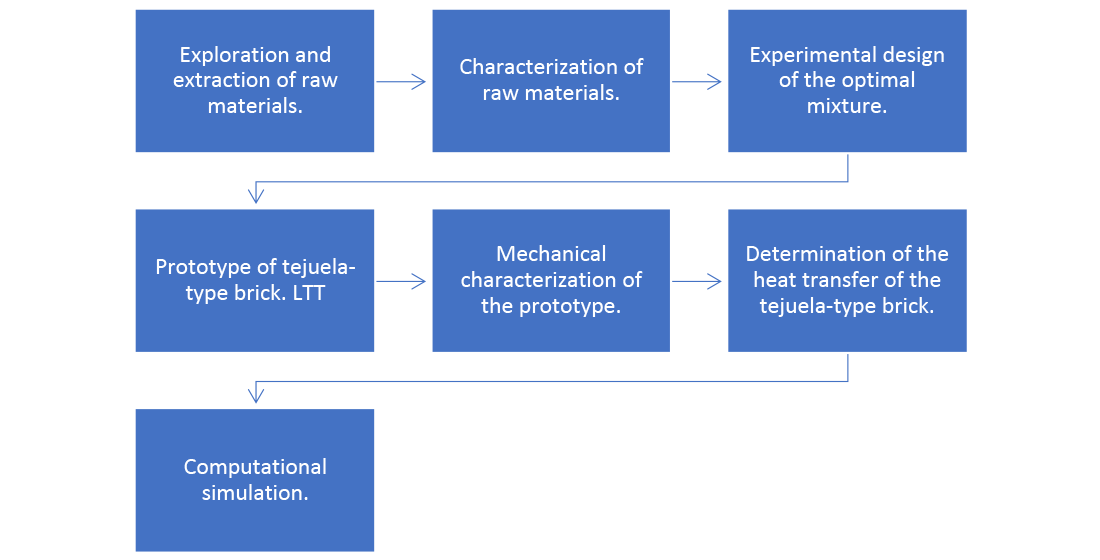
To manufacture and evaluate of the shingle-type brick (LTT), involve the following stages:
First Stage: 1A. Exploration and extraction of raw materials through random sampling, followed by crushing of the materials.
Second Stage: 2A. Characterization of the raw materials through physical, chemical, and mineralogical tests.
Third Stage: 3A. Experimental design of optimal mixture ratio. In this stage, sample discs were prepared to evaluate the maximum load capacity that each mixture proportion can withstand before failure, using the diametral compression test. This test helps determine the optimization factor (FO), which determines the optimal mixture ratio to be applied in the prototype.
Fourth Stage: 4A. Manufacturing of LTT prototype using the best combination established in the previous stages.
Fifth Stage: 5A. Mechanical characterization of the LTT.
Sixth Stage: 6A. Determination of heat transfer of the LTT.
Seventh Stage: 7A. Computational simulation using the thermal conductivity values of the LTT and publicly accessible climatic data for the case study.
These stages allow the production and evaluation of LTT, providing valuable information on its mechanical properties, heat transfer characteristics, and performance in a simulated environment based on local climatic conditions.

3. Results

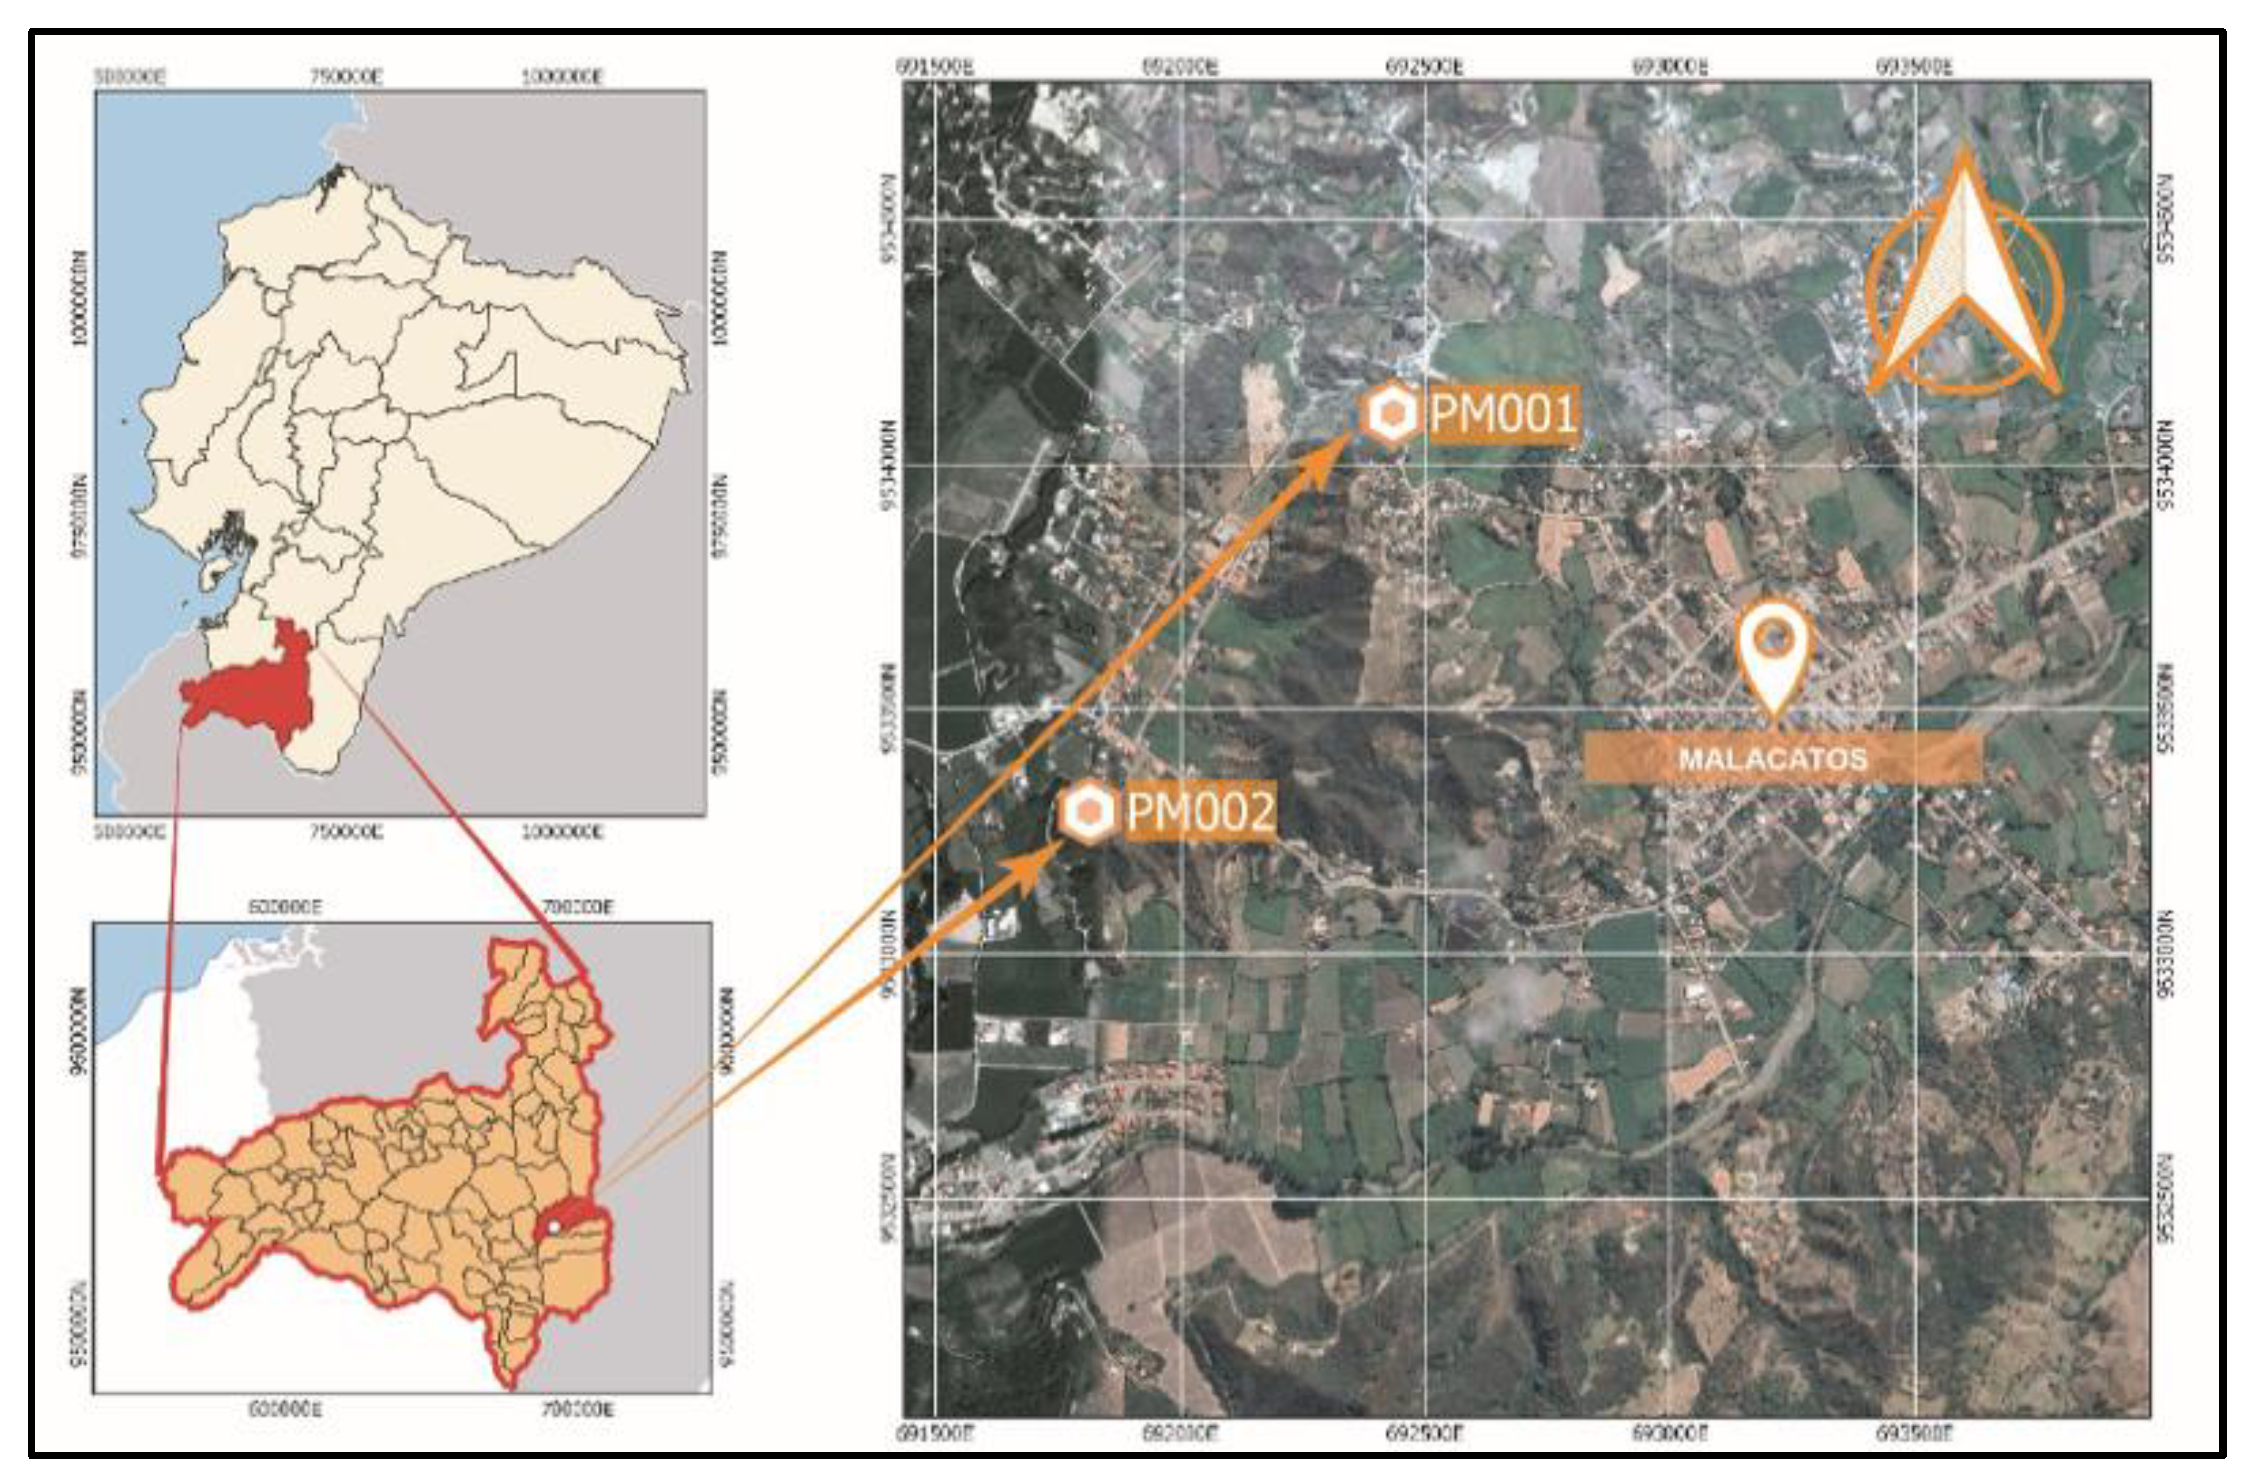
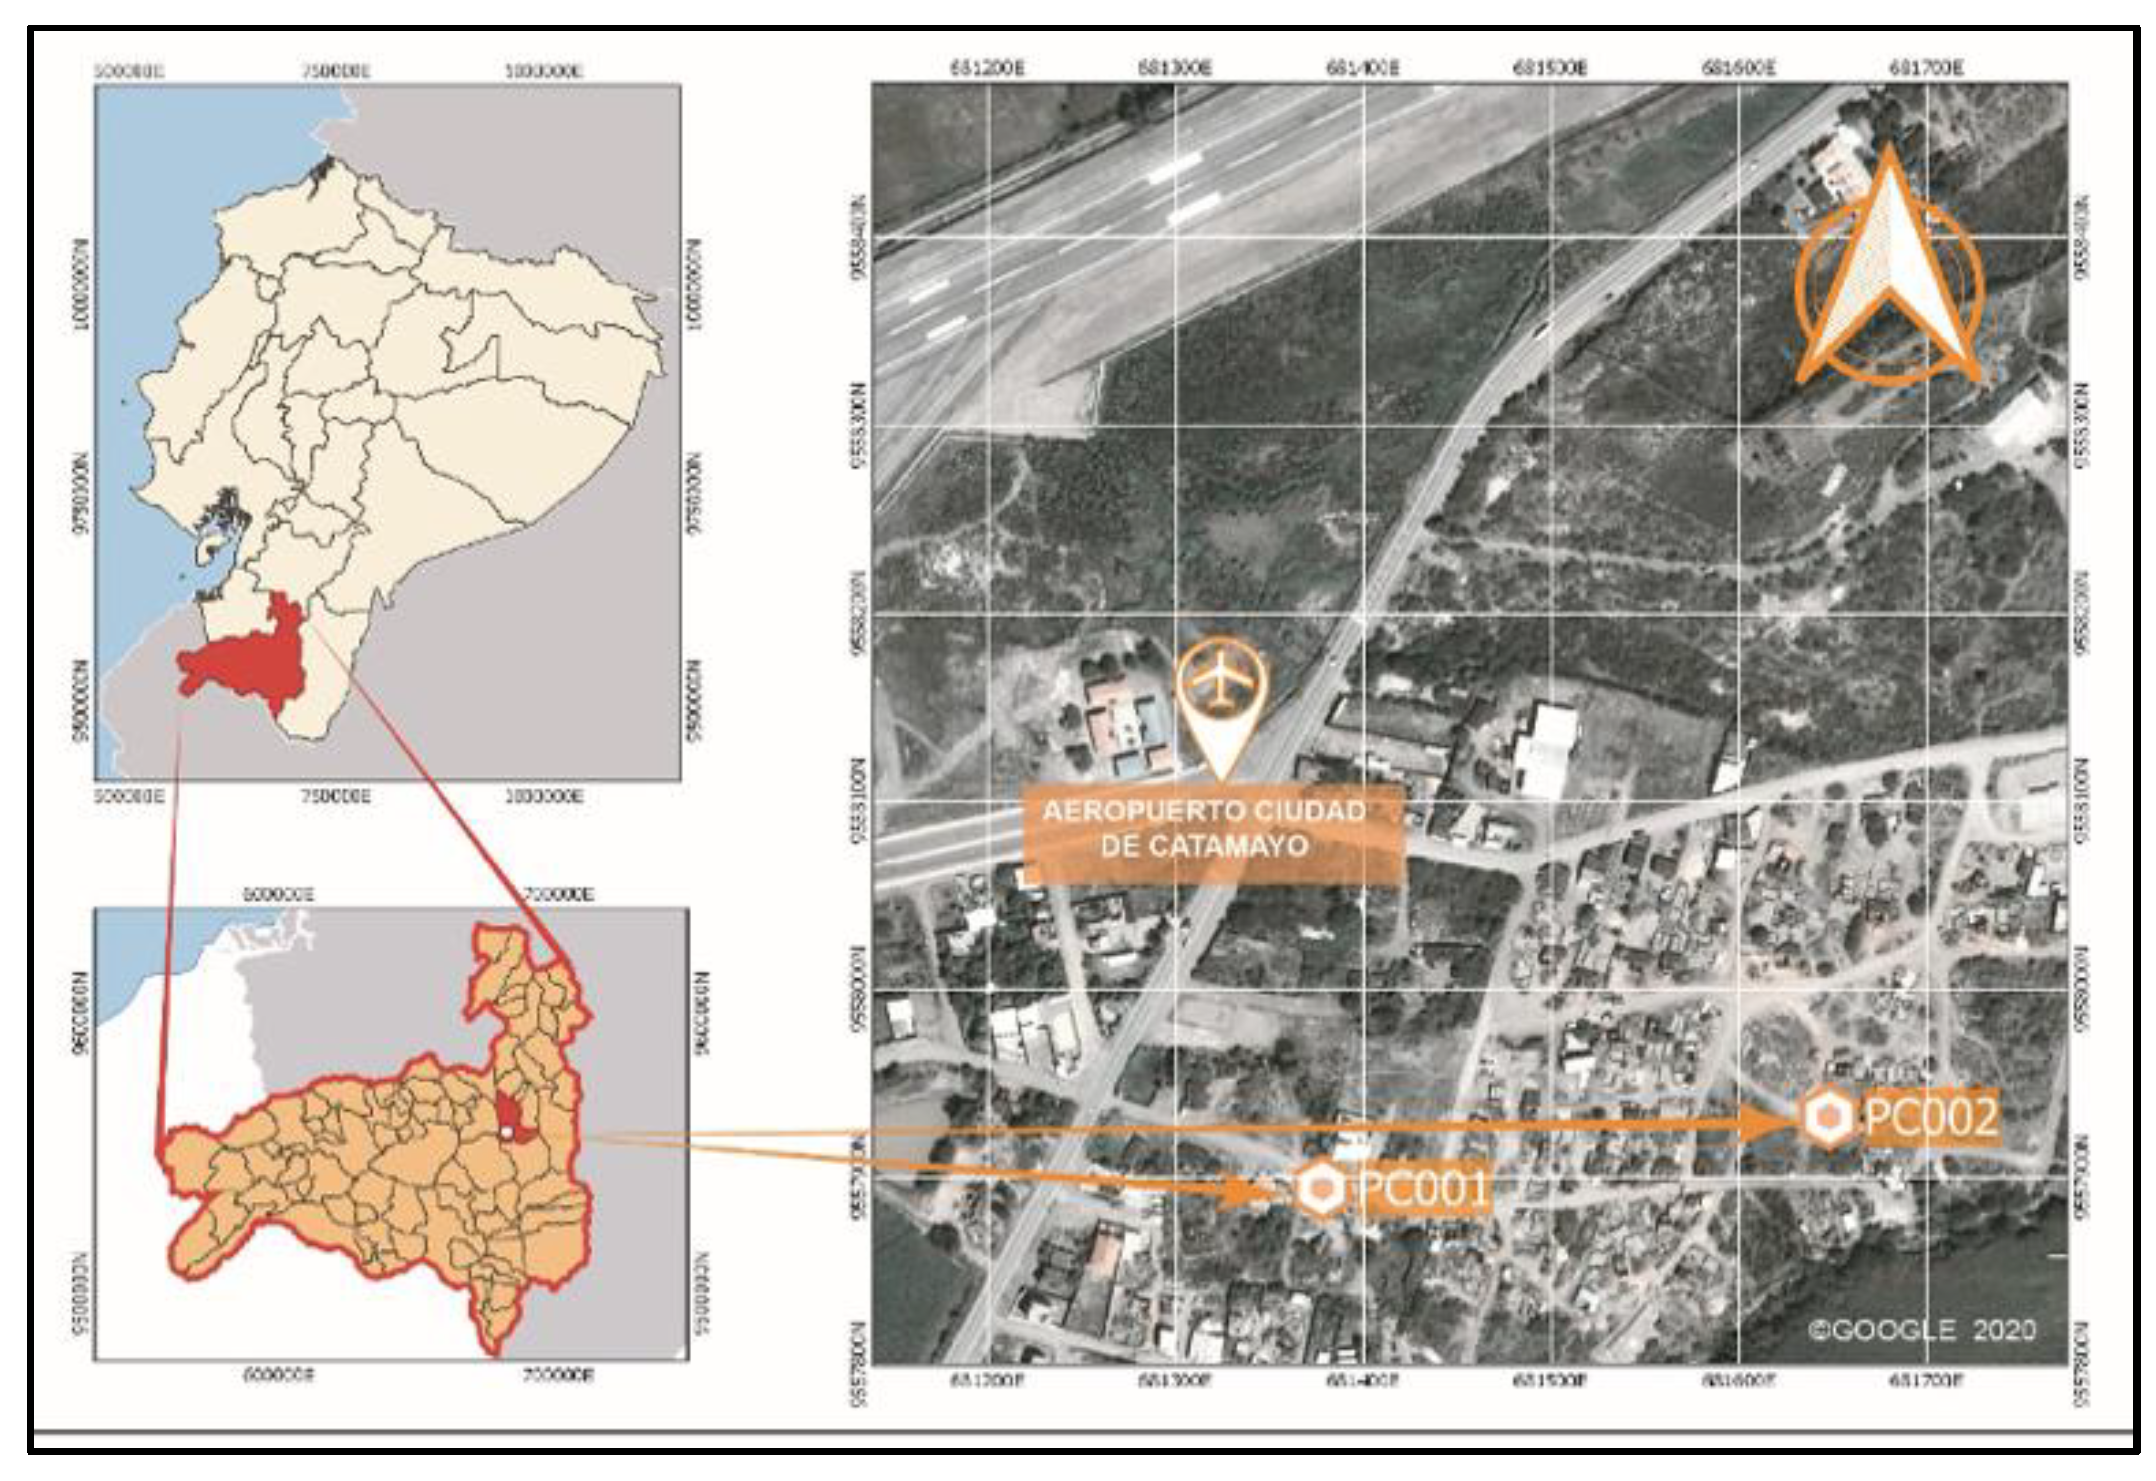
Four brick factories were randomly selected in the towns of Malacatos and Catamayo, which serve as the supply sources of this material for the city of Loja, Ecuador. Most constructions in this city are derived from these artisanal factories, hence the brick waste (BW) will be associated with them.
Figure 1. Location map of producers PM001 and PM002 in the city of Malacatos, Loja Province – Ecuador.
Preprints 81255 g001
Figure 2. Location map of producers PC001 y PC002in the city of Catamayo. Loja Province – Ecuador.
Preprints 81255 g002

3.1. Experimental Process

Once the samples for laboratory analysis are collected, the raw material was characterized by evaluating its physical, chemical, and mineralogical attributes and properties. This characterization involves information about the components that will be used in the geopolymerization process and allowed for predicting their behavior in the manufacture of the LTT.
Several variables play a role in the manufacturing process of LTT and are considered in the optimization factor (FO) for selecting the optimal combination include the molarity of the alkaline solution, alkaline solution content, stabilizing force, or load, and curing temperature.
The waste used for manufacturing the test specimens was a homogeneous mixture of waste materials obtained from the four brick factories.
To conclude this phase, the test specimens were subjected to the diametral compression test to obtain the FO, which is an essential component for the proper selection of the optimal mixture ratio1.

3.2. X-ray Fluorescence (XRF)2

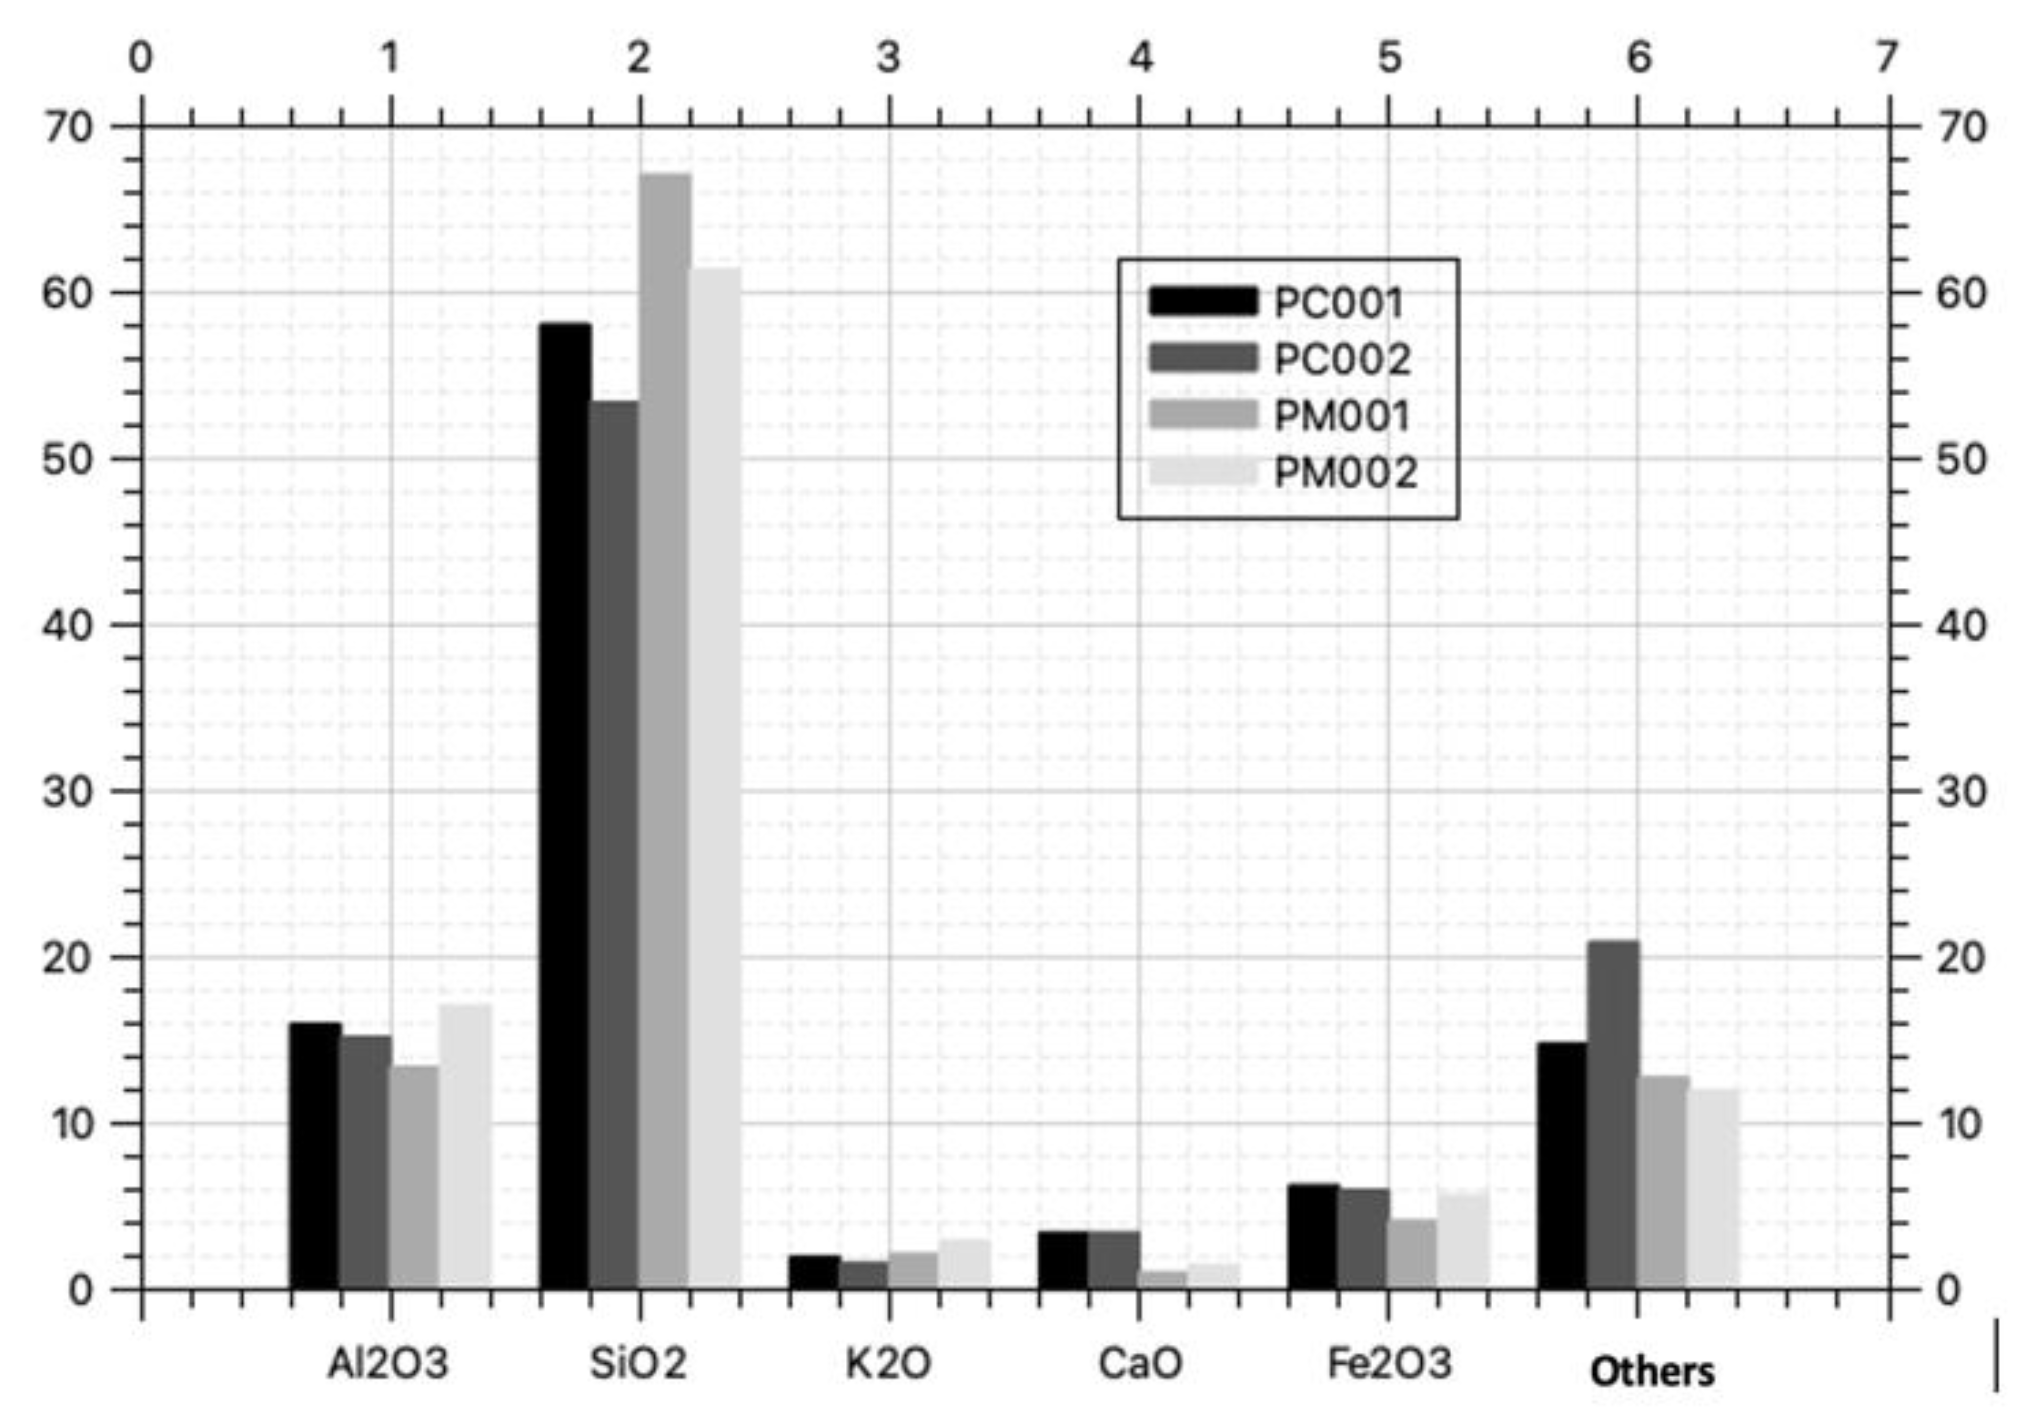
X-ray fluorescence allows for determining the chemical composition of the brick waste through spectrometry. The results obtained are shown in Figure 3 and Table 1.
The sum of AL2O3 + SiO2 + Fe2O3 in the brick waste is greater than 70%, classifying it as an ideal pozzolanic material to be a source of aluminosilicates for geopolymerization processes [5]. Additionally, it contains potassium and calcium oxides, which are beneficial for the geosynthesis process.
According to the study by Rodríguez et al3., an increase in the soluble silicate content and the concentration of alkali ions through an increase in the SiO2/Al2O3 and Na2O/SiO2 ratios, respectively, negatively affects the mechanical behavior of geopolymeric materials. However, for the waste samples PC001, PC002, and PM002, they fall within the optimal ranges: 3-3.8, which would allow for very high mechanical strengths in geopolymeric products [6]. In the case of waste PM001, it presents an SiO2/Al2O3 ratio of 5.154, which would not allow for the complete development of strength in geopolymers.

3.3. X-ray diffraction

X-ray Diffraction (XRD) chemical analysis is a process of scattering X-rays to the atoms that make up the irradiated soil. The X-rays are incident at a fixed wavelength, and each plane of atoms produces a diffraction peak at a specific angle. Each peak is produced by a family of atomic planes, representing a specific identified mineral species, allowing for the identification and quantification of mineral species in soils [7].
In this case, the sample is crushed using an electric jaw crusher4, and the sample is homogenized by lifting the corners of the plastic surface approximately 15 times. It is stratified into multiple sections, and a portion is taken from each section and placed in a new container. The new sample is pulverized using a pulverizer with a ring mill5. It is recommended to use a program that operates at a speed of 700 revolutions per minute for a period of 3 minutes.
Ten grams of the pulverized sample are placed on discs and analyzed using the XRD instrument6 for a duration of 40 minutes. The obtained crystallographic spectrum is loaded for the identification of respective minerals. Figure 4 presents the XRD results of the PC001, PC002, PM001, and PM002 samples, respectively.
According to the results of the mineralogical analysis, quartz, albite, biotite, arsenopyrite, and chlorite were the minerals found in the brick waste. Quartz exhibited the highest peaks from 20° to 30° and was the most abundant mineral in the XRD analysis. Therefore, the brick waste is composed of crystalline materials that contain a significant amount of silicon.
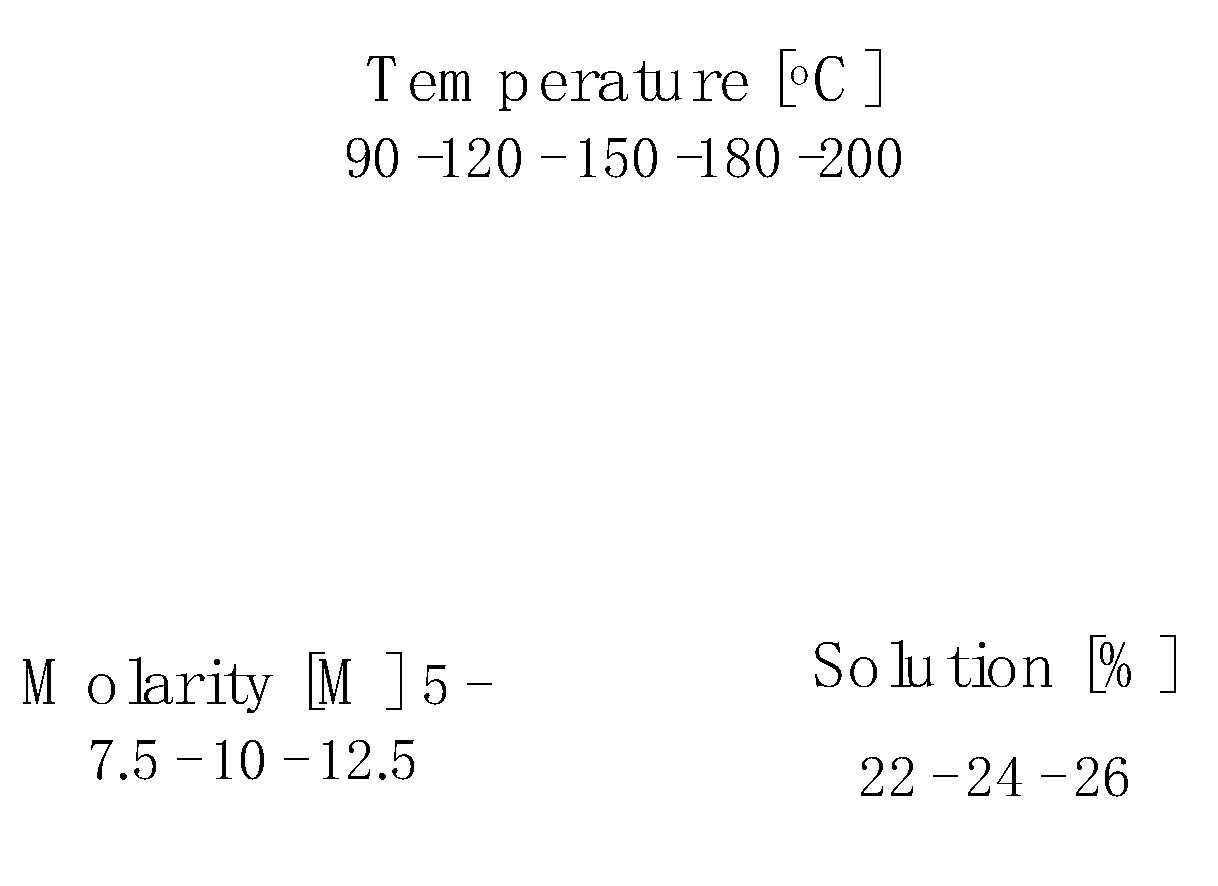
On the other hand, the molarity and content of the alkaline solution, stabilization pressure, and curing temperature are the variables that influence the soil stabilization process when applying geopolymerization [8].
Figure 5. Variables for determining the optimal mixture combination.
Preprints 81255 g005
Sixty combinations were created using the identified variables, and four test specimens were prepared for each combination. The test specimens had dimensions of 7 cm in diameter and 2 cm in thickness. All specimens were subjected to a force of 39.2266N. Subsequently, the test specimens underwent the diametral compression test (Brazilian Test) [9] to obtain the optimization factor (FO) and determine the optimal mixture for the subsequent application in the shingle-type brick (LTT).
The molarity of the alkaline solution refers to the mole content of sodium hydroxide in the solution. In this research, the following molarities were analyzed: 5M, 7.5M, 10M, and 12.5M. The preparation of the solution involved dissolving the specified number of moles (M) of sodium hydroxide in 1000 ml of distilled water, considering the molecular weight of NaOH7.
For this research, 250 ml and 100 ml beakers were used. Table 2 presents the dosages used for each beaker in the experiment.
For the solution content and molding pressure, the percentage represents the proportion of the solution in a 100% combination of soil and solution. The studied solution contents are 22%, 24%, and 26%8.
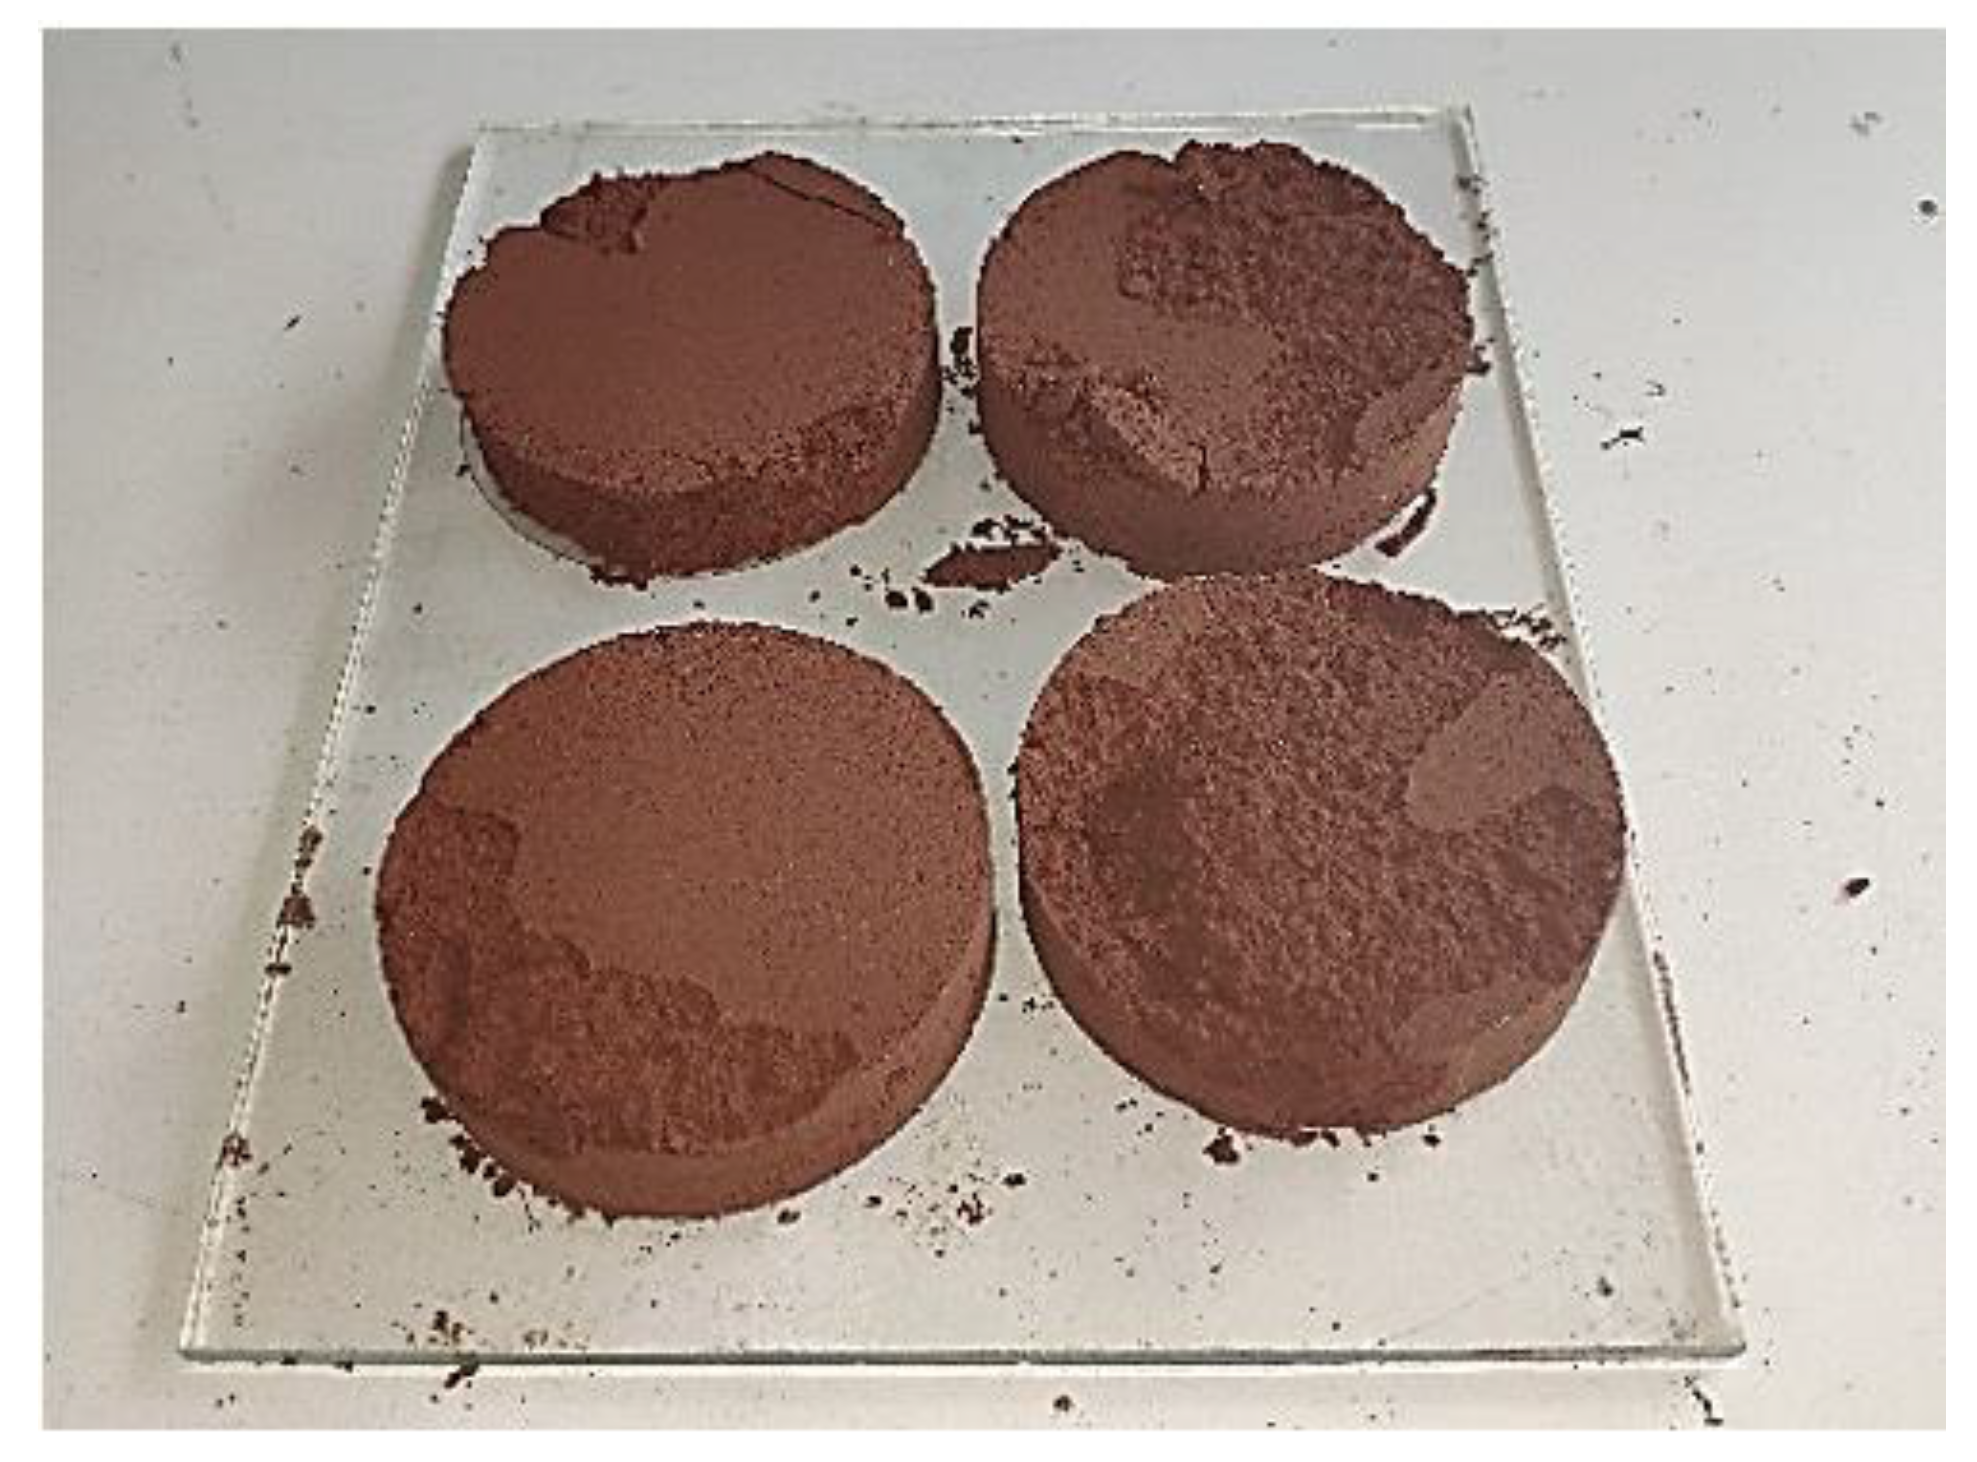
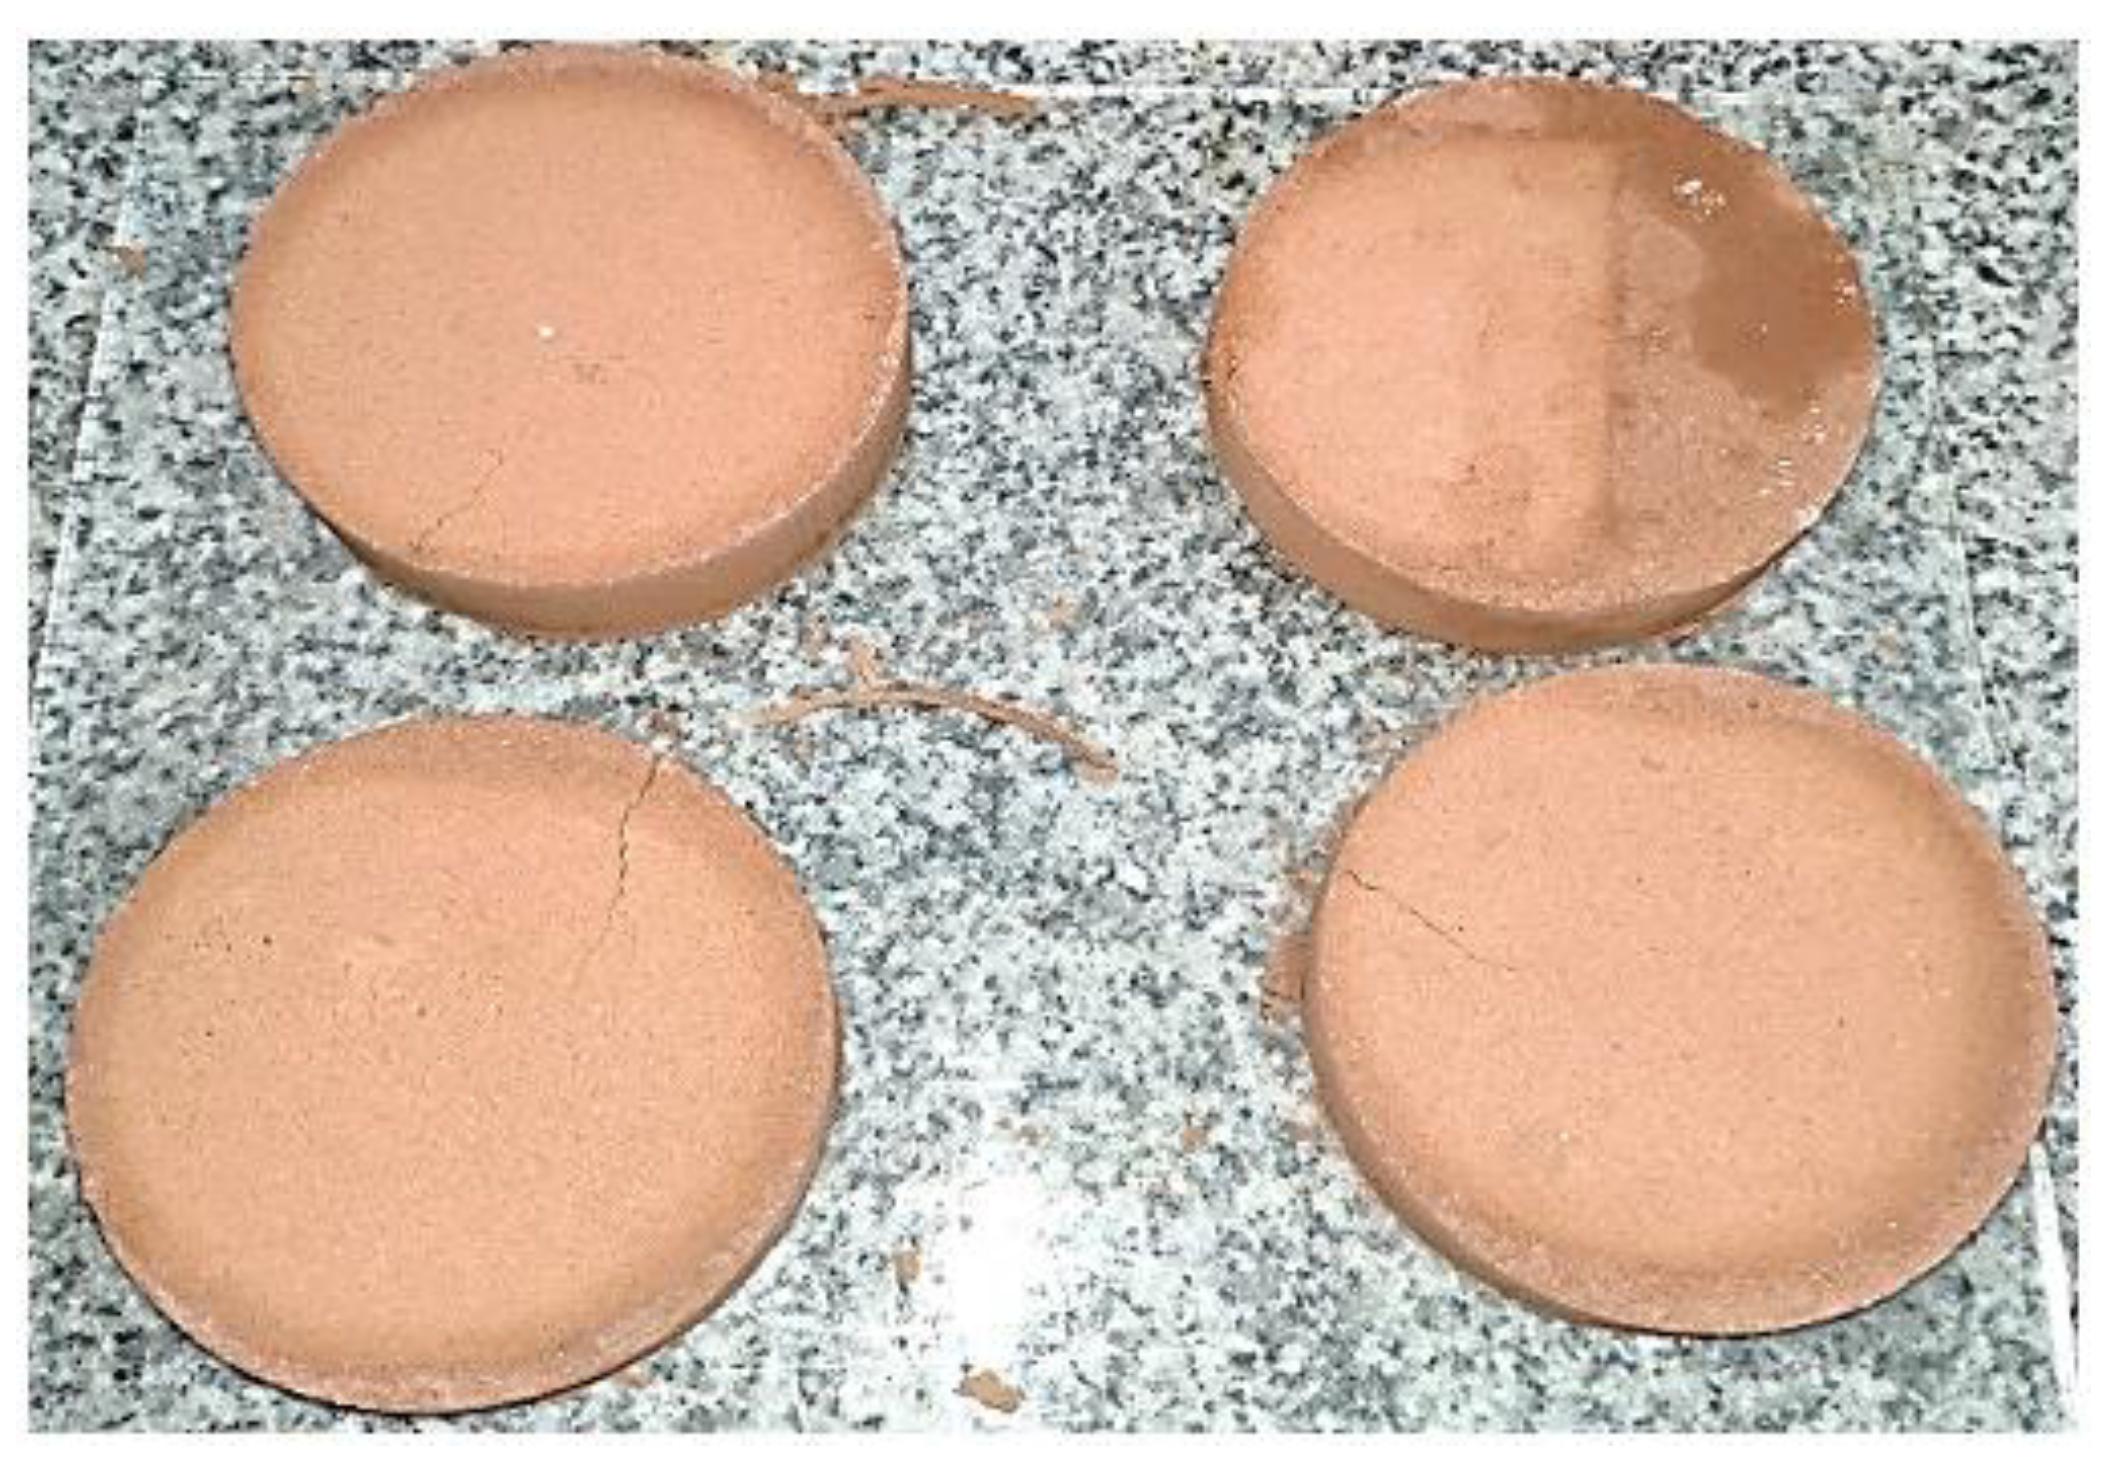
On the other hand, four cylindrical test specimens with a diameter of 7 cm and a thickness of 2 cm were subjected to different loads: 9.80665N, 19.6133N, 29.41995N, and 39.2266N, using a hydraulic press for stabilization with the same soil-solution-temperature combination. It was identified that the pressure that allowed for proper demolding without fractures was 39.2266N. Therefore, this pressure was used for the entire study. At loads of 9.80665N, 19.6133N, and 29.2266N, the disk could not support its own weight and easily crumbled, as evidenced in Figure 6. Approximately 500g of soil-solution mixture was needed, with at least 411g consisting of soil9.
The curing temperature is another crucial factor for completing geopolymerization. Temperatures of 90°C, 120°C, 150°C, 180°C, and 200°C were applied for 8 hours in a drying oven. Subsequently, the specimens were kept at room temperature for a period of 7 days to avoid thermal shock before being subjected to the diametral compression test.

4. Discussion

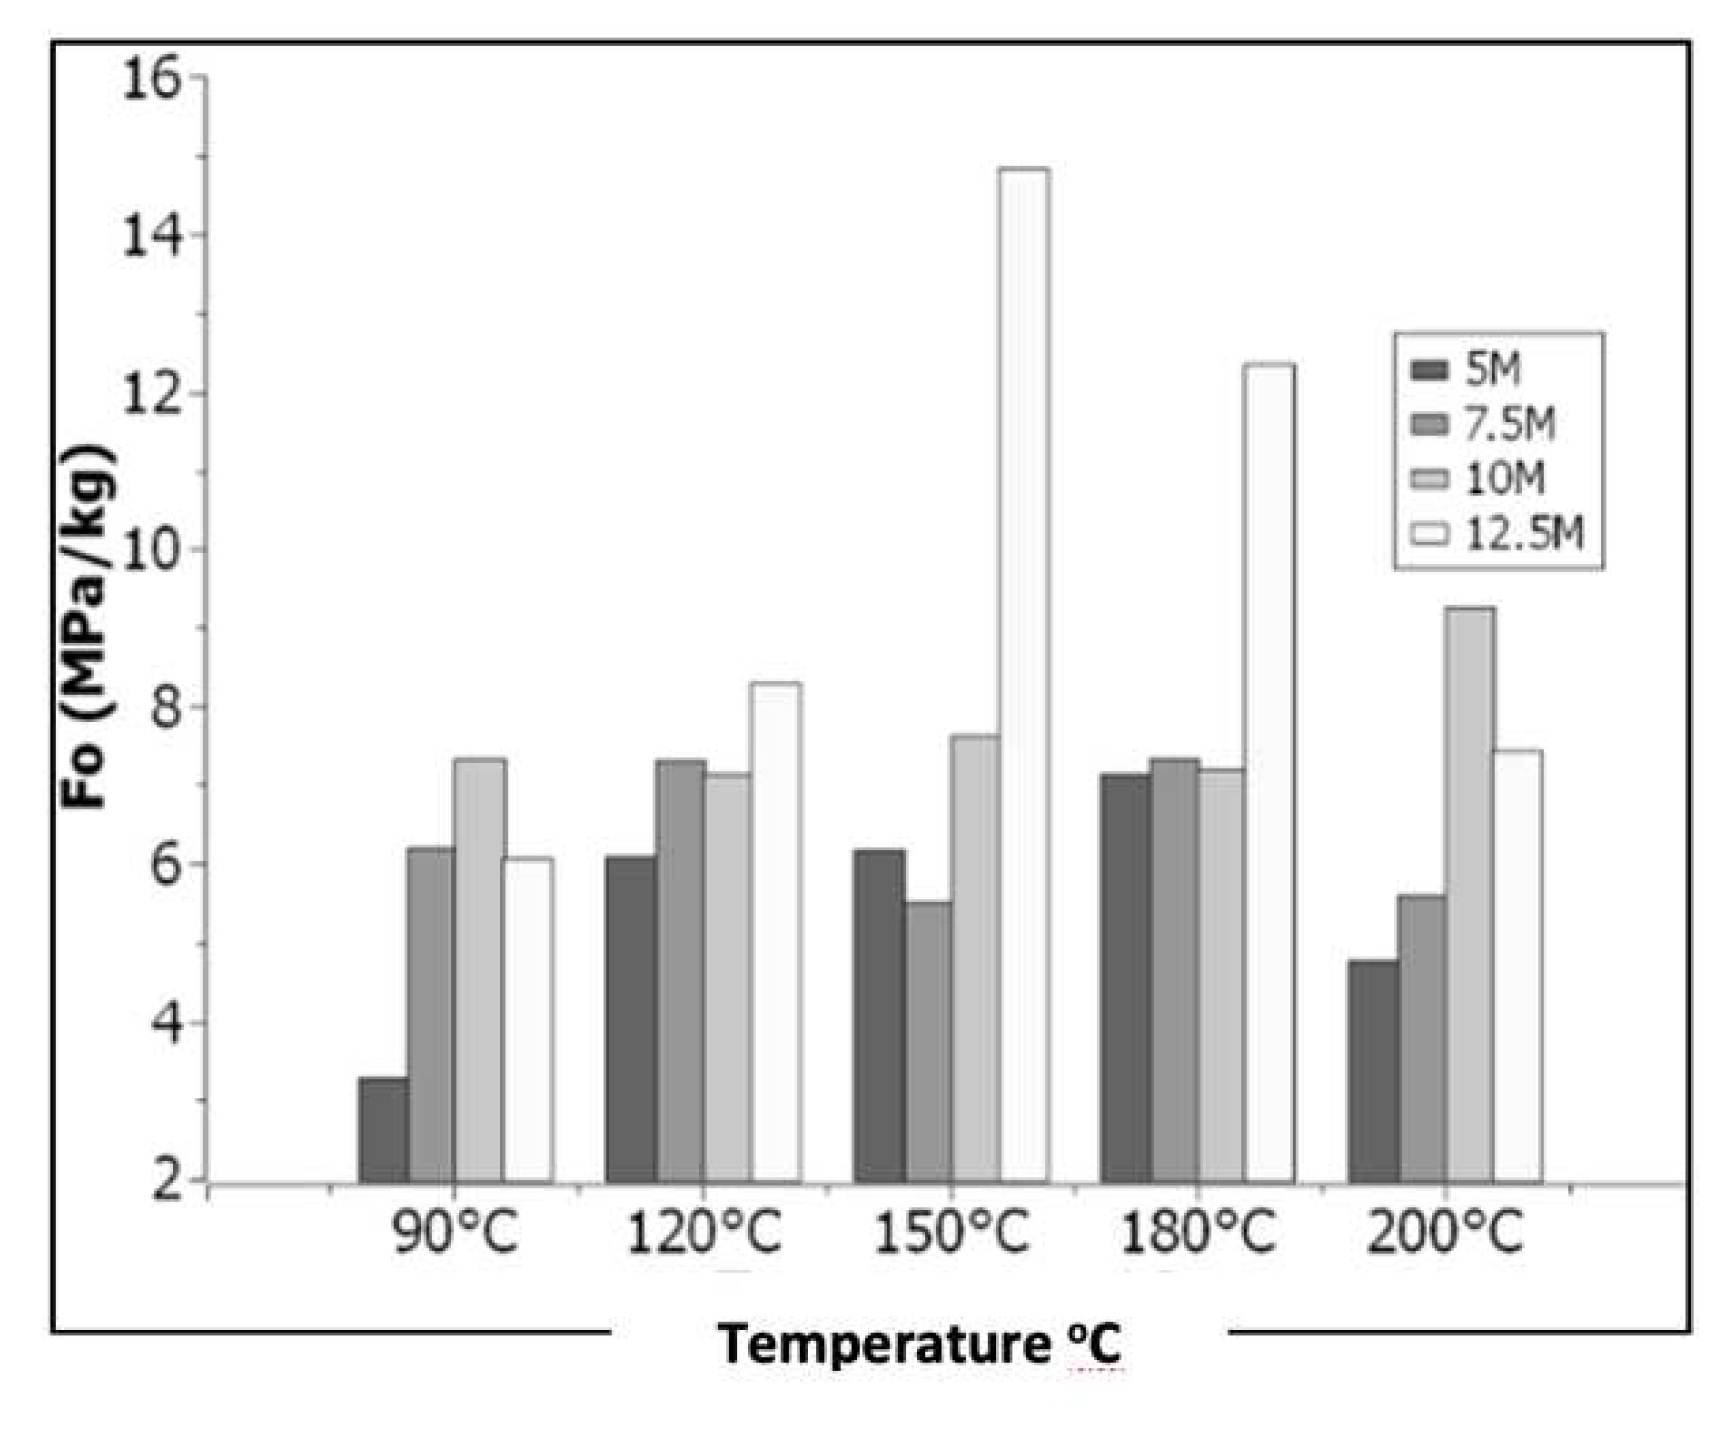
The discussion reveals the following observations for the 26% solution concentration, as shown in Figure 7:
a. When the molarity is 5, the FO shows a proportional increase with the temperature up to 180°C, reaching a peak value of 7.15 MPa/kg. Afterward, the FO decreases proportionally with further increases in the curing temperature.
b. For a molarity of 7.5, a higher FO magnitude of 7.32 MPa/kg and 7.34 MPa/kg can be observed at curing temperatures of 120°C and 180°C, respectively, compared to the other temperatures.
c. when the molarity is 10, a higher FO magnitude of 9.27 MPa/kg is observed at a curing temperature of 200°C compared to the other temperatures.
d. For a molarity of 12.5, the FO increases proportionally with the temperature up to 150°C, where it reaches a peak of 14.84 MPa/kg. Afterward, the FO decreases proportionally with further increases in the curing temperature.
Based on the conducted analysis, the thermal behavior of the discs indicates the presence of two temperature ranges. In the first range (90°C - 150°C), the FO is directly proportional to the curing temperature, while in the second range (150°C - 200°C), the FO becomes proportional to the curing temperature.
It can be inferred that excessive temperature increase negatively affects the mechanical properties of the material. Figure 8 displays the cracks generated under a curing temperature of 200°C.
Therefore, it has been determined that the optimal curing temperature is 150°C, as it resulted in the highest FO values and represented the thermal limit beyond which the mechanical properties of the material start to decrease.
Based on the analysis of the selected design variables for the disc preparation, an analysis was conducted on the effect of molar concentration on the FO concerning the solution content at different curing temperatures.
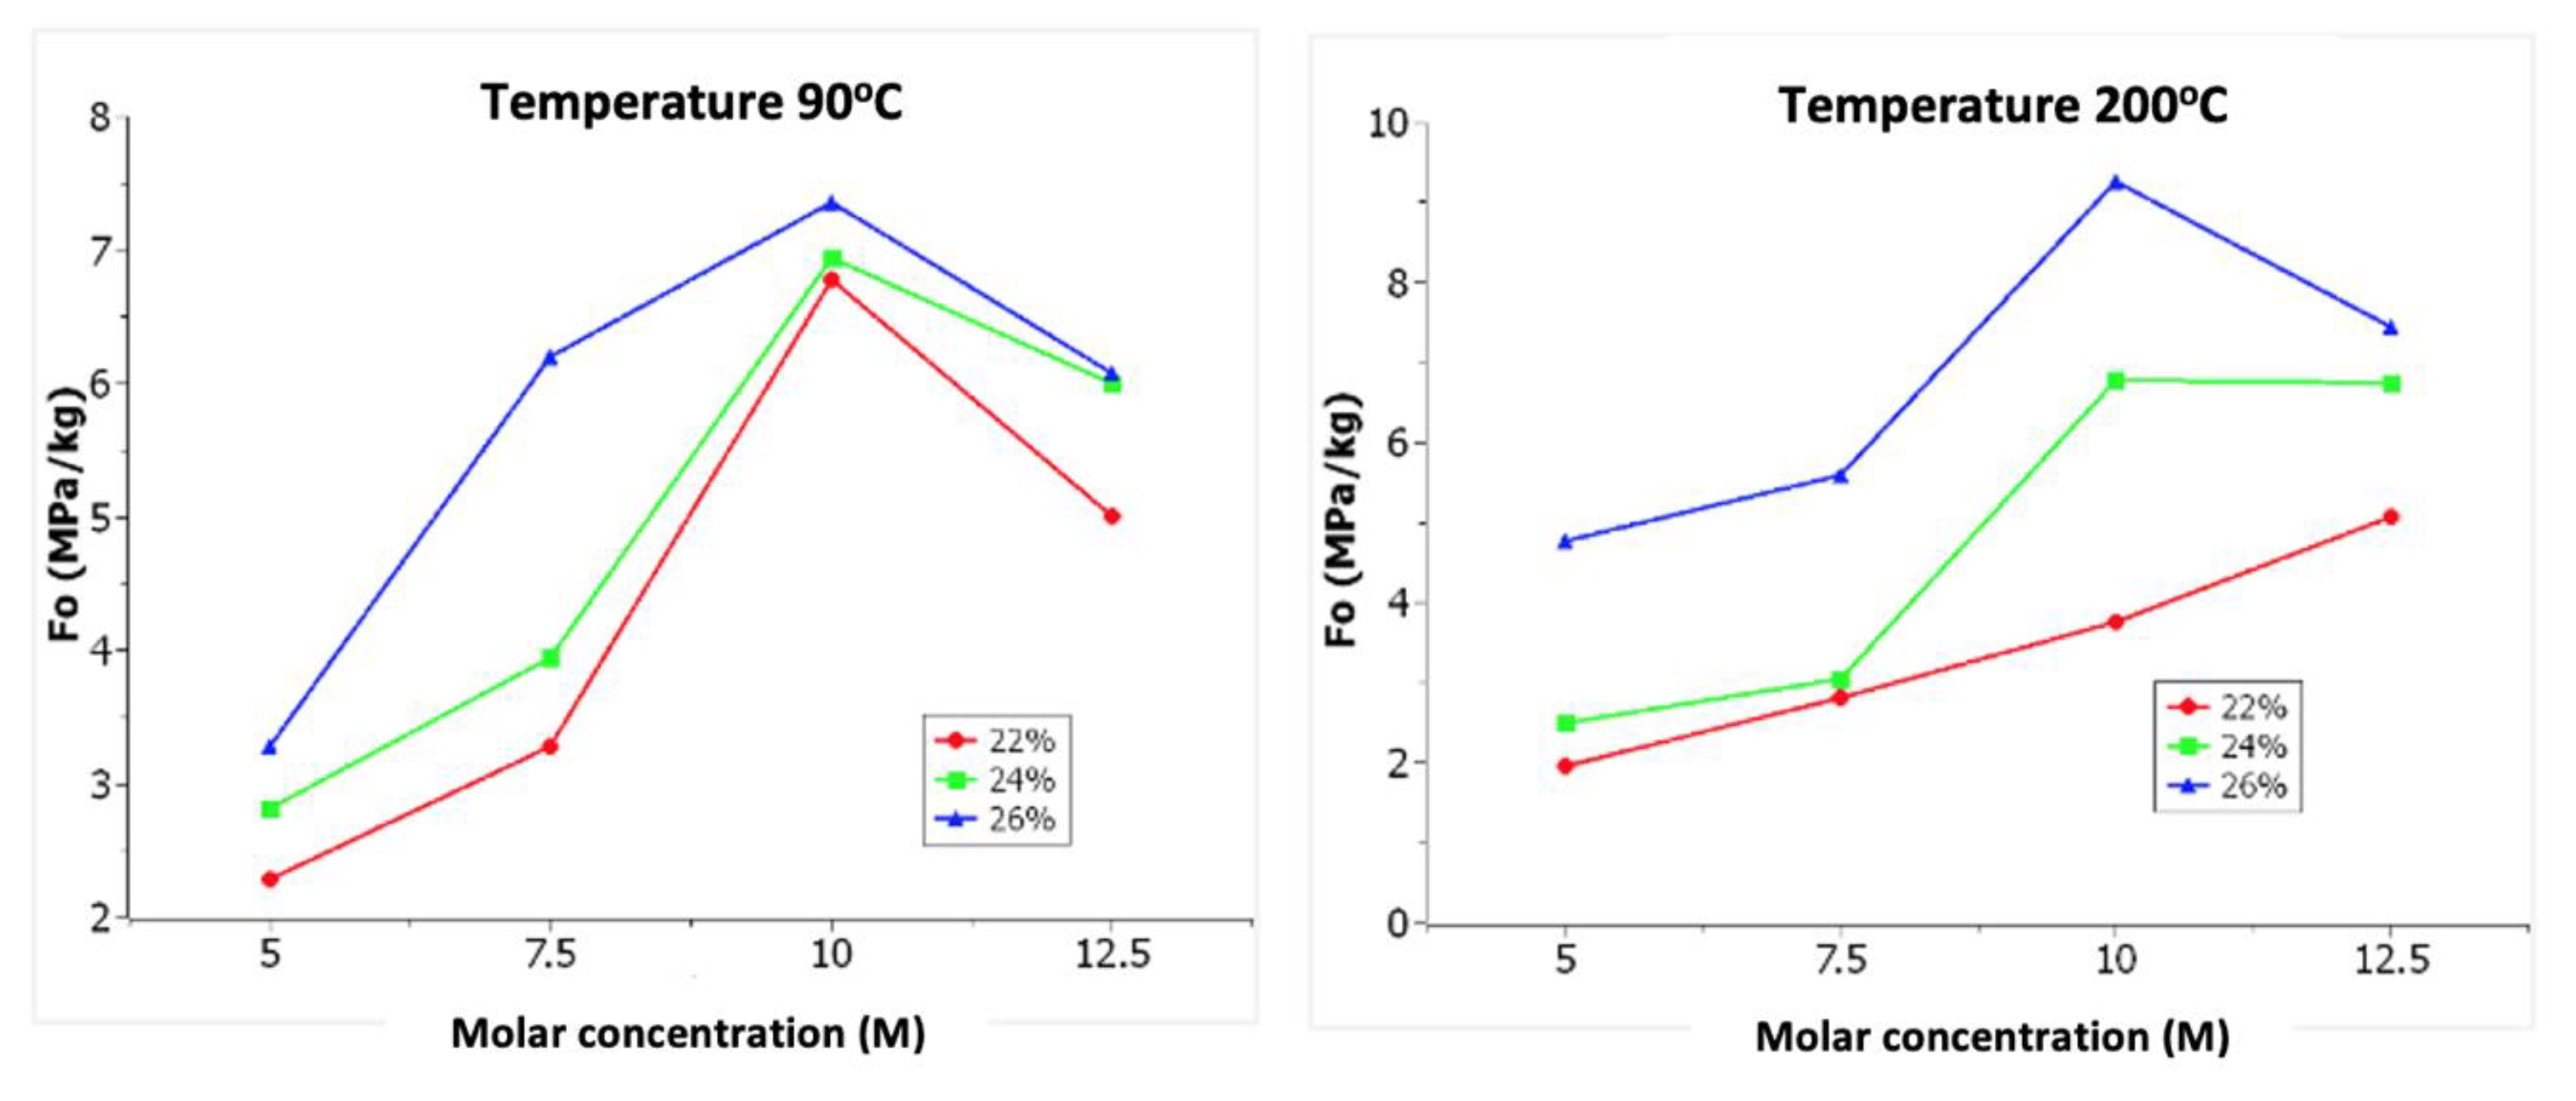
With curing temperatures of 90°C and 200°C, as shown in Figure 9, the following observations can be made:
The FO tends to increase in proportion to the molar concentration up to 10 M. After this molarity, the FO starts to decrease.
Under curing temperatures of 120°C, 150°C, and 180°C, as depicted in Figure 10, it can be observed that the FO tends to increase in proportion to the molar concentration.
Based on the conducted analysis, the behavior of the discs indicates that increasing the molar concentration tends to increase the FO. This occurs because at higher molarities, the particles of the aluminosilicate source react quickly and completely, allowing for an effective dissolution stage, which forms the basis for a successful geopolymerization process. Additionally, it can be observed that the solution content directly affects the FO. As the solution content increases, the FO also increases.
At curing temperatures of 90°C and 200°C, there is a decrease in the 12.5M molar concentration. This could be attributed to the following reasons:
a. At a temperature of 90°C with a high concentration of 12.5M, the complete development of the hardening and geopolymerization process may not occur due to the low temperature.
b. At a temperature of 200°C with a high concentration of 12.5M, the mechanical properties of the material may be negatively affected due to the high temperature.
Finally, the optimal mixture determined is 12.5M-26%SC-150°C, based on which the construction of prototypes will proceed.
Once the optimal mixture is determined, it will be applied to shingle-type bricks (LTT) that undergo compression resistance testing based on NTE INEN 297 (1977) regulations10. The geopolymerization mixture meets the requirements for a solid-type C brick, exceeding the value of 6 MPa by 15.51%. Furthermore, it complies with Spanish UNE 41410 (BTC 5) regulations and the Earth Institute (Class A), surpassing the 5 MPa regulation value by 38.61%, as seen in Figure 11.
The bending test procedure was based on NTE INEN 2554 (2011)11 regulations. Like the compression test, the weight and respective dimensions were measured for each prototype. The prototypes were then placed in the respective machine, considering the supports: one on the top and two supports on the bottom. A gradual load was applied at a constant speed until failure, and the data were recorded for calculation of the modulus of rupture.
In this case, when comparing the prototypes with the INEN-297 regulation, the mixture does not meet the requirements for a solid-fired brick type C, falling 3.15% below the regulation, as the result reached 1.937 MPa, below the 2 MPa specified by the standard. However, it is important to consider that since there is no specific regulation for shingle-type bricks, the comparison has been made with regulations for solid bricks. It can be inferred that this proposed prototype meets the basic requirements for the application of architectural envelopes.

4.1. Measurement of heat transfer12

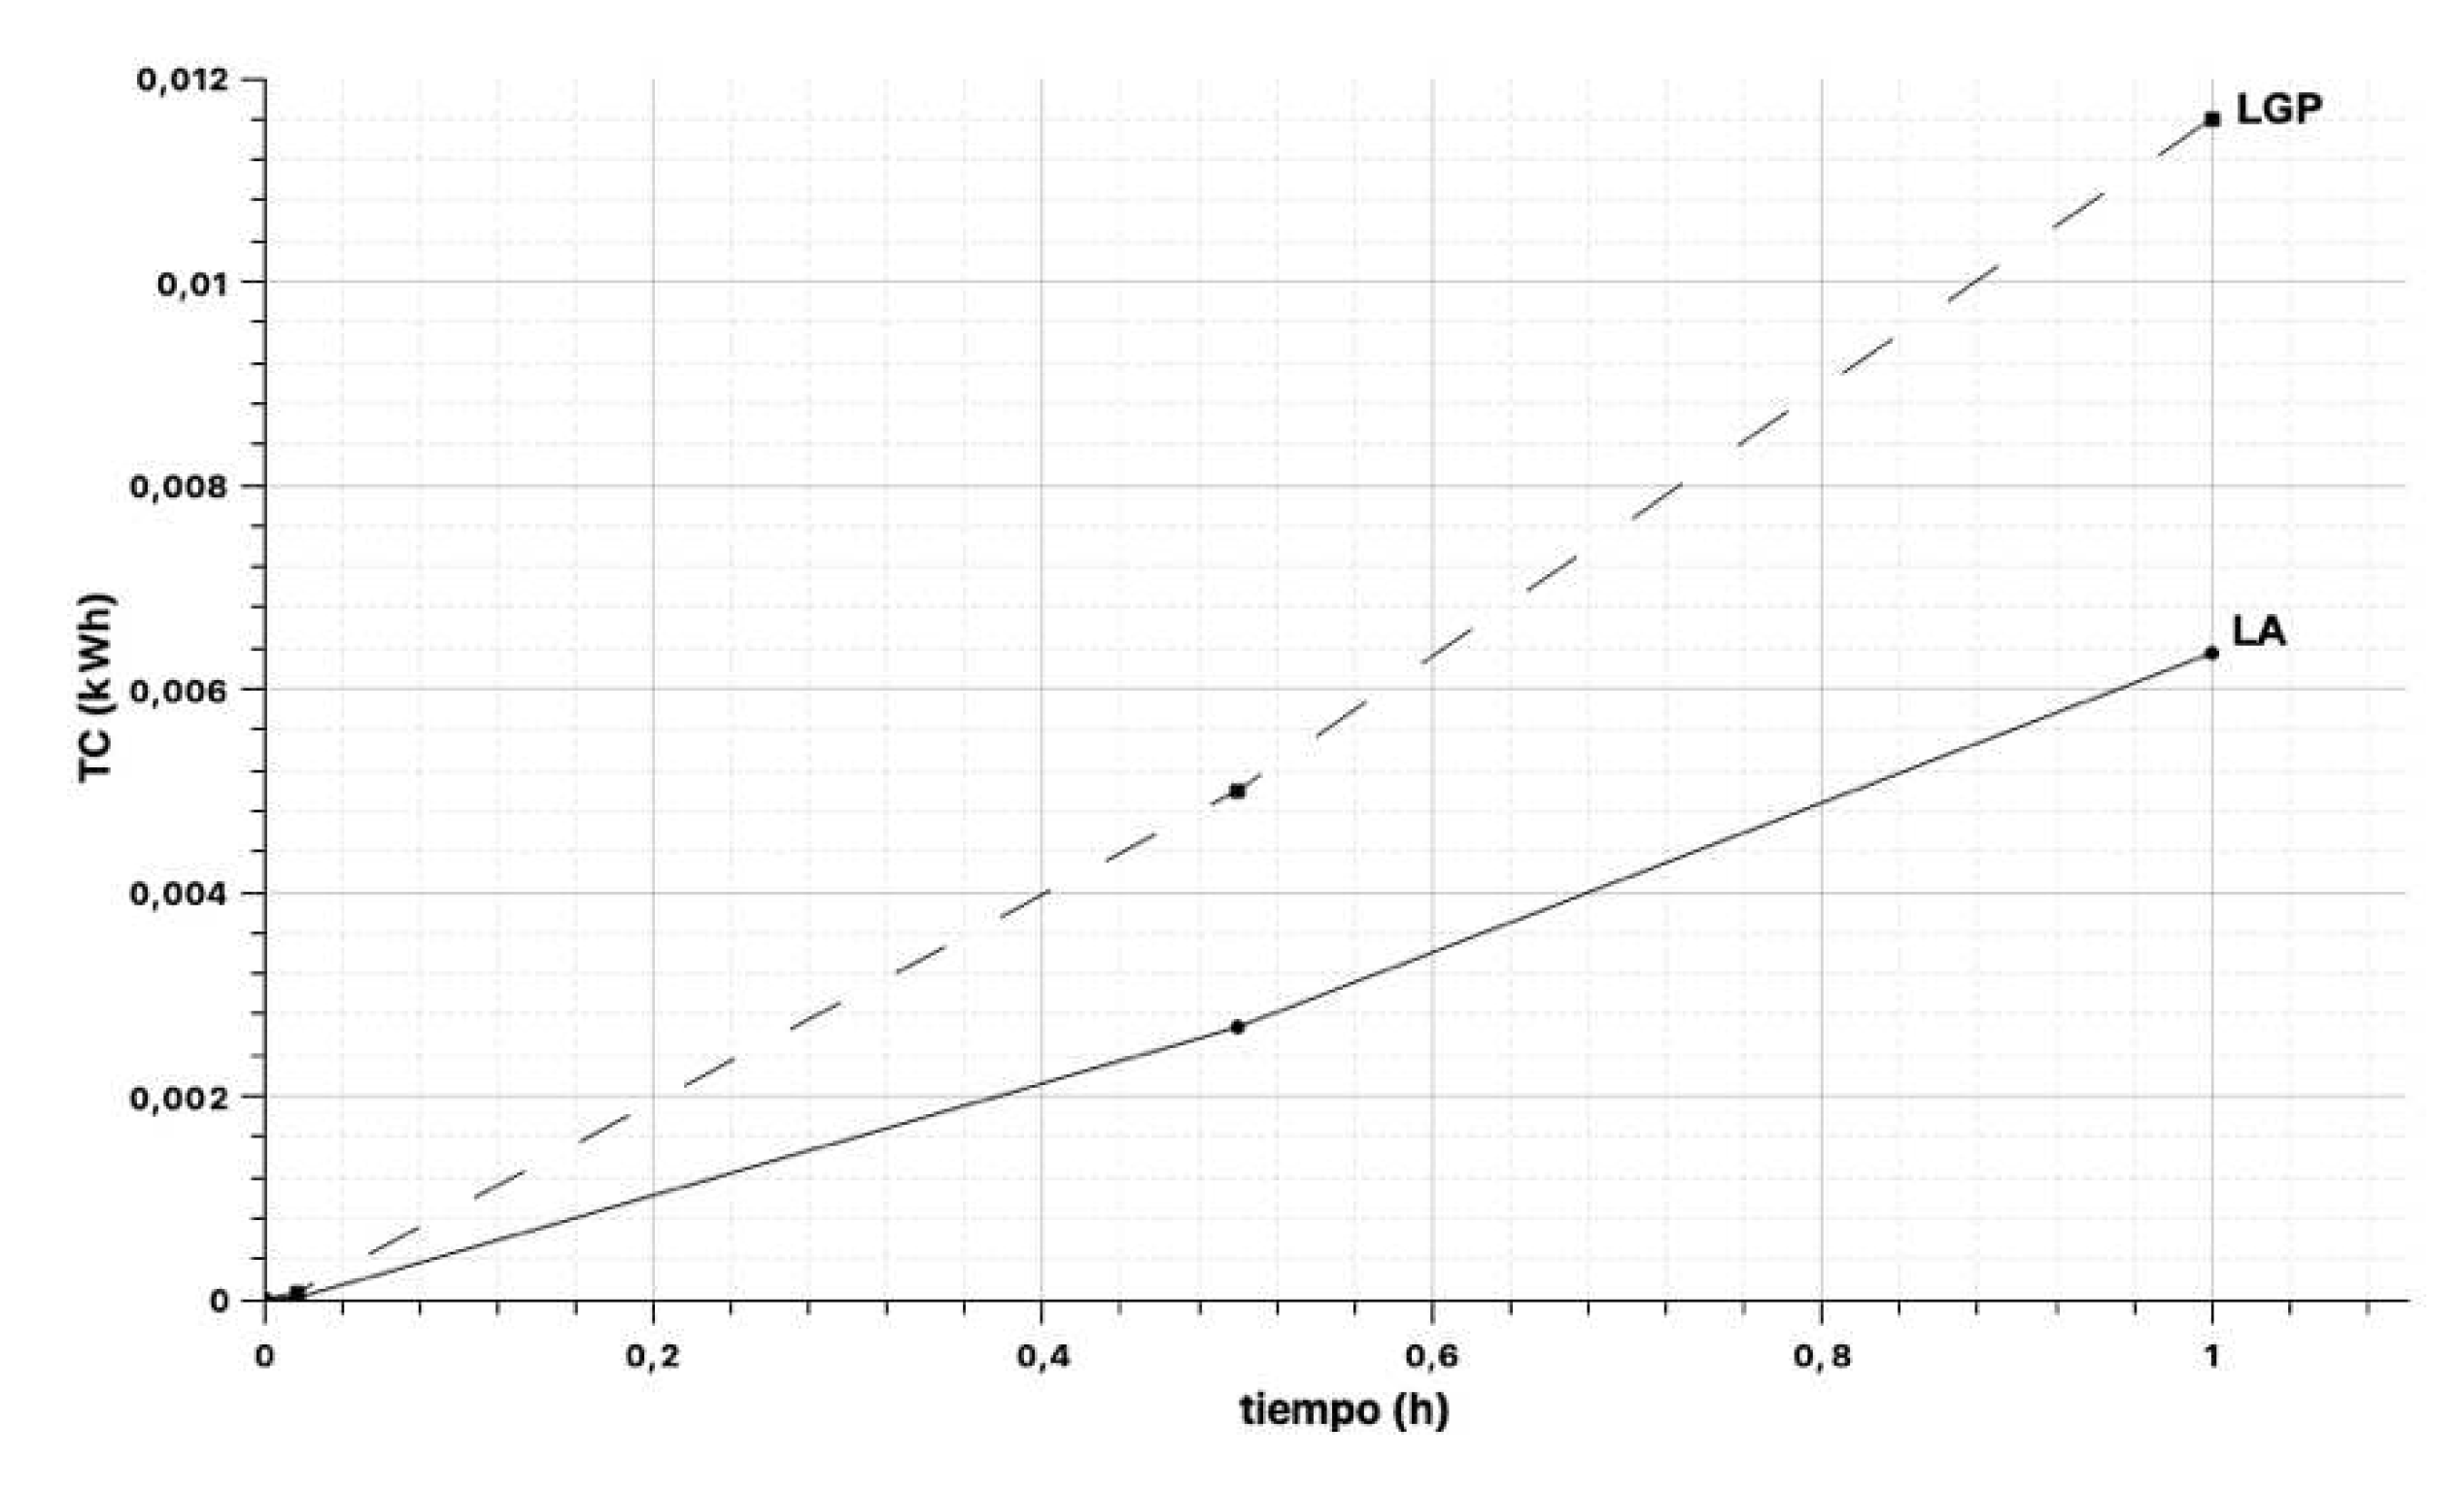
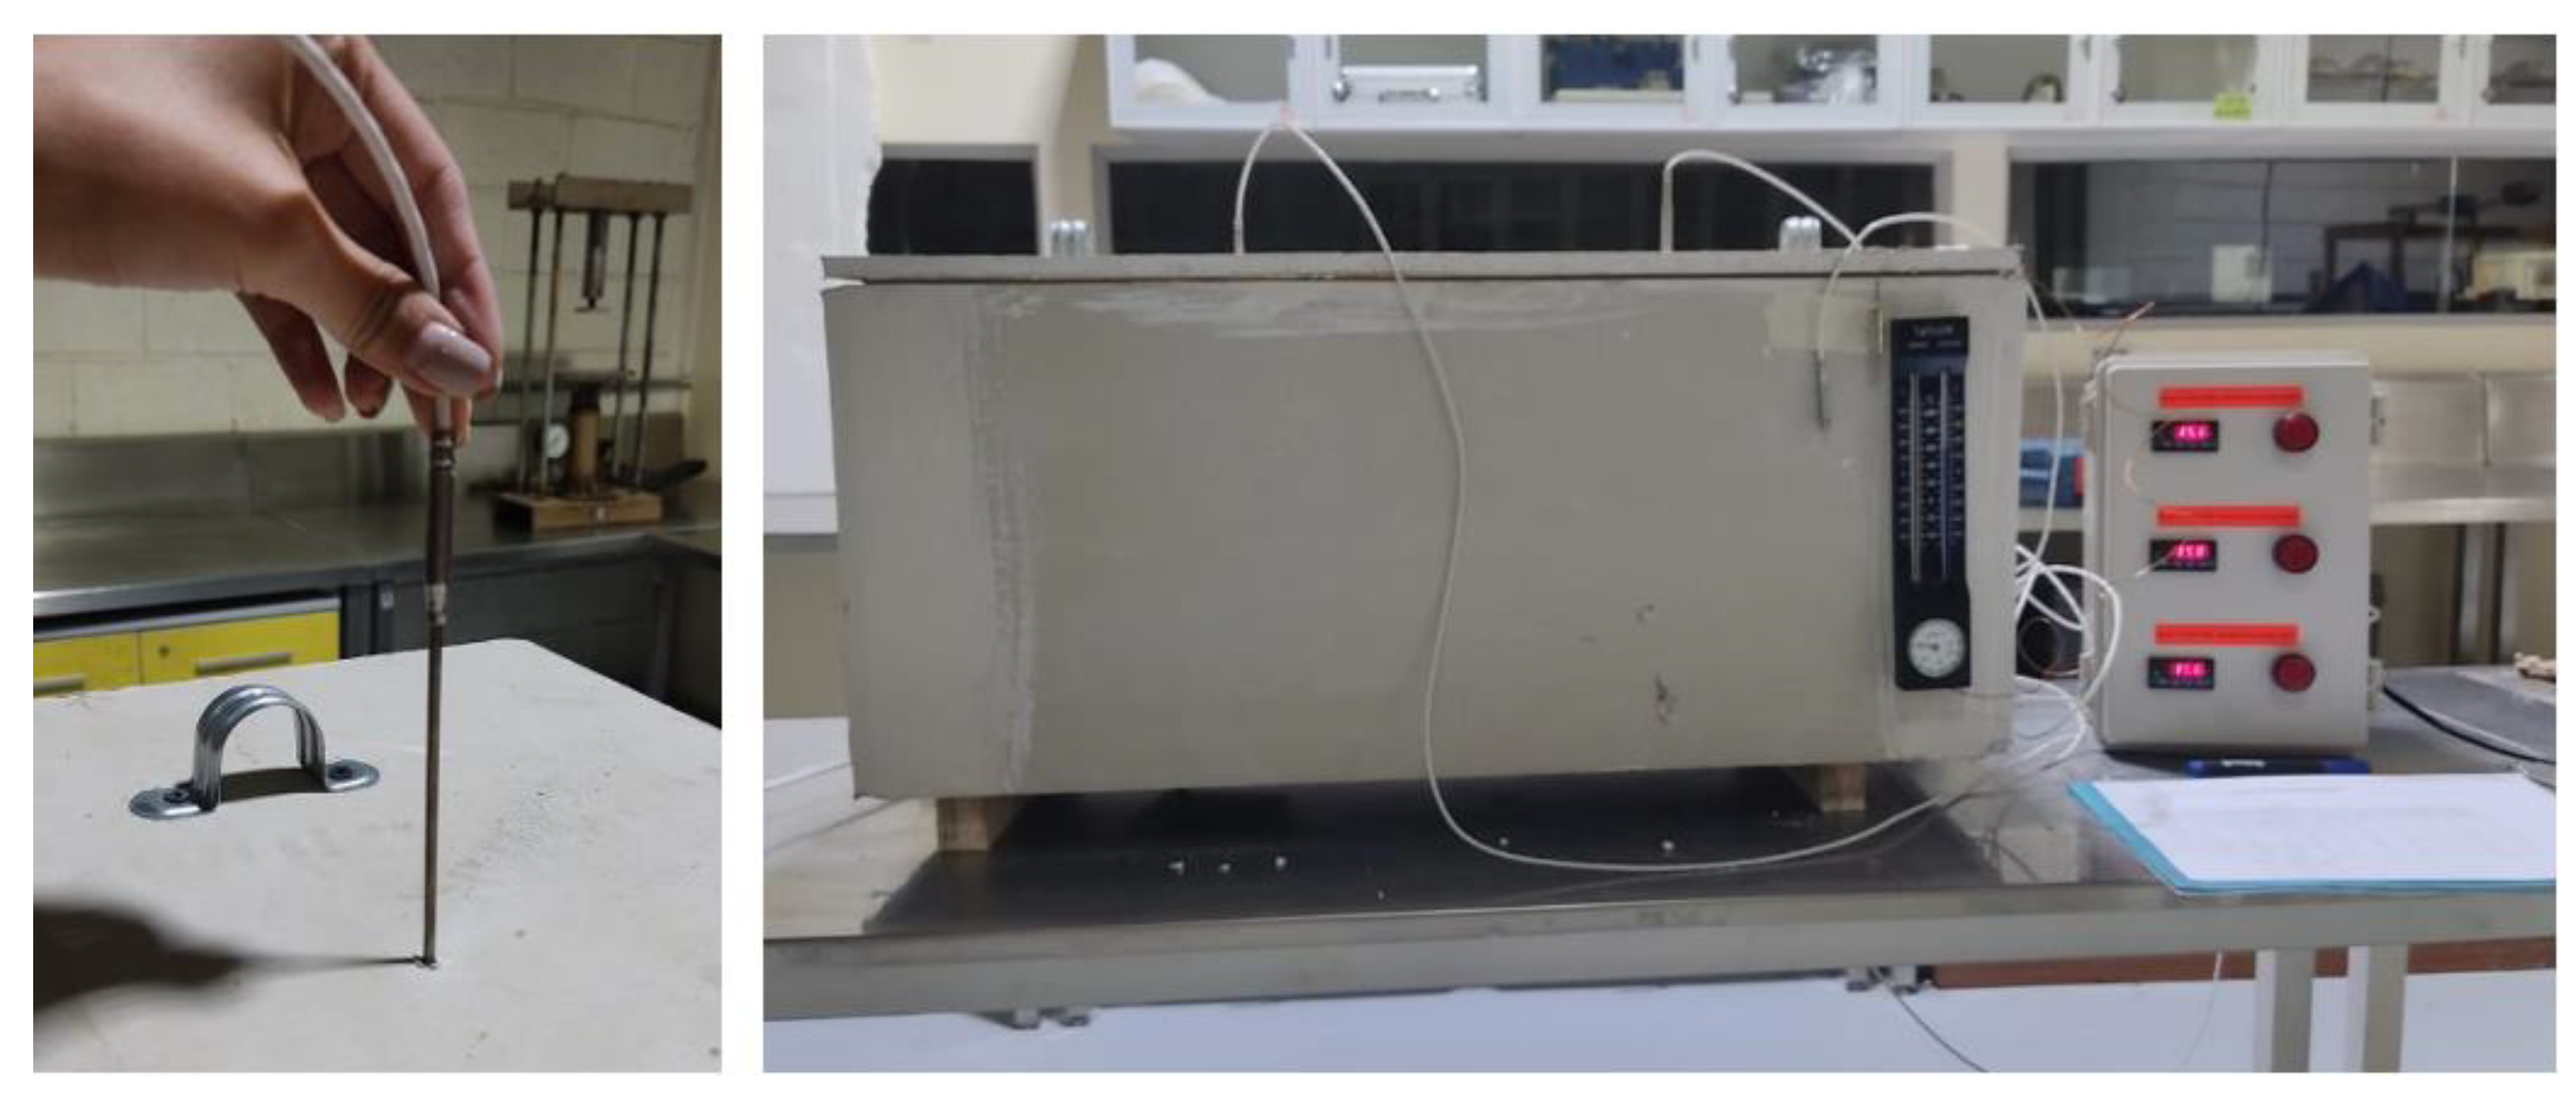
For this test, plates with dimensions of 0.3x0.3x0.02 m3 are used. The thermal balance13 is applied to a calorimeter designed to estimate the conductivity of different materials, following Fourier's Law14.
Figure 13. Heat transfer graph.
Preprints 81255 g013
Table 4. Heat transfer test results.
Sample code SE-T1 (°C) SR-T2 (°C) TE (°C) time t (h) Conductivityλ (W/m·K) Material area A (m2) Material thickness e (m) Heat transfer coefficient Q´ (kW) Heat transfer Q (kWh)
LGP-1 16,70 15,60 16,40 0,017 0,954 0,090 0,020 0,0047 0,000052
LGP-1 19,00 15,50 15,60 0,500 0,954 0,090 0,020 0,0098 0,004883
LGP-1 19,80 15,60 15,50 1,000 0,954 0,090 0,020 0,0117 0,011718
LGP-2 17,40 15,70 15,80 0,017 0,954 0,092 0,021 0,0046 0,000077
LGP-2 19,40 15,60 15,80 0,500 0,954 0,092 0,021 0,0102 0,005088
LGP-2 19,90 15,60 15,70 1,000 0,954 0,092 0,021 0,0115 0,011515
LA-1 19,80 19,40 19,90 0,017 0,800 0,058 0,043 0,0004 0,000007
LA-1 25,10 19,00 19,40 0,500 0,800 0,058 0,043 0,0066 0,003291
LA-1 26,10 19,00 19,00 1,000 0,800 0,058 0,043 0,0077 0,007661
LA-2 20,40 19,40 19,70 0,017 0,800 0,058 0,042 0,0011 0,000019
LA-2 23,00 19,30 19,40 0,500 0,800 0,058 0,042 0,0041 0,002044
LA-2 24,00 19,50 19,30 1,000 0,800 0,058 0,042 0,0050 0,004971

4.2. Analysis of efflorescence in LTT

Efflorescence in LTT was analyzed to assess the presence and severity of salt deposits on the surface. The analysis involved visual inspection and qualitative assessment of the efflorescence patterns, such as the type of salts present and their distribution.
Samples of LTT were collected and examined for efflorescence using established methods. The samples were observed under appropriate lighting conditions and evaluated for the presence of white or colored deposits on the surface. The intensity and extent of efflorescence were recorded and compared among different samples.
Additionally, chemical analysis techniques, such as ion chromatography or spectroscopy, may be employed to identify the specific salts responsible for the efflorescence.
The analysis of efflorescence in LTT provides valuable information on the potential for salt migration and deposition, which can have implications for the durability and aesthetics of the brick material.
One of the factors to consider in the production of LTT is the occurrence of efflorescence, which involves the migration of soluble alkalis and the subsequent dissolution of these alkalis with water, resulting in the formation of white carbonates. In this section, we will analyze the results of the analyses conducted on the samples after being exposed to the environment.
According to Lv et al. [10] in their study on "Efflorescence Inhibition in Sodium-Based Inorganic Geopolymer Coatings," efflorescence is a spontaneous behavior in sodium-based geopolymers. The migration of soluble alkalis can lead to the dissolution of these alkalis in contact with water, resulting in the formation of white carbonates.
The results of the analyses will provide insights into the occurrence and severity of efflorescence in the LTT samples, which is an important factor to consider in assessing the durability and aesthetic quality of the material.
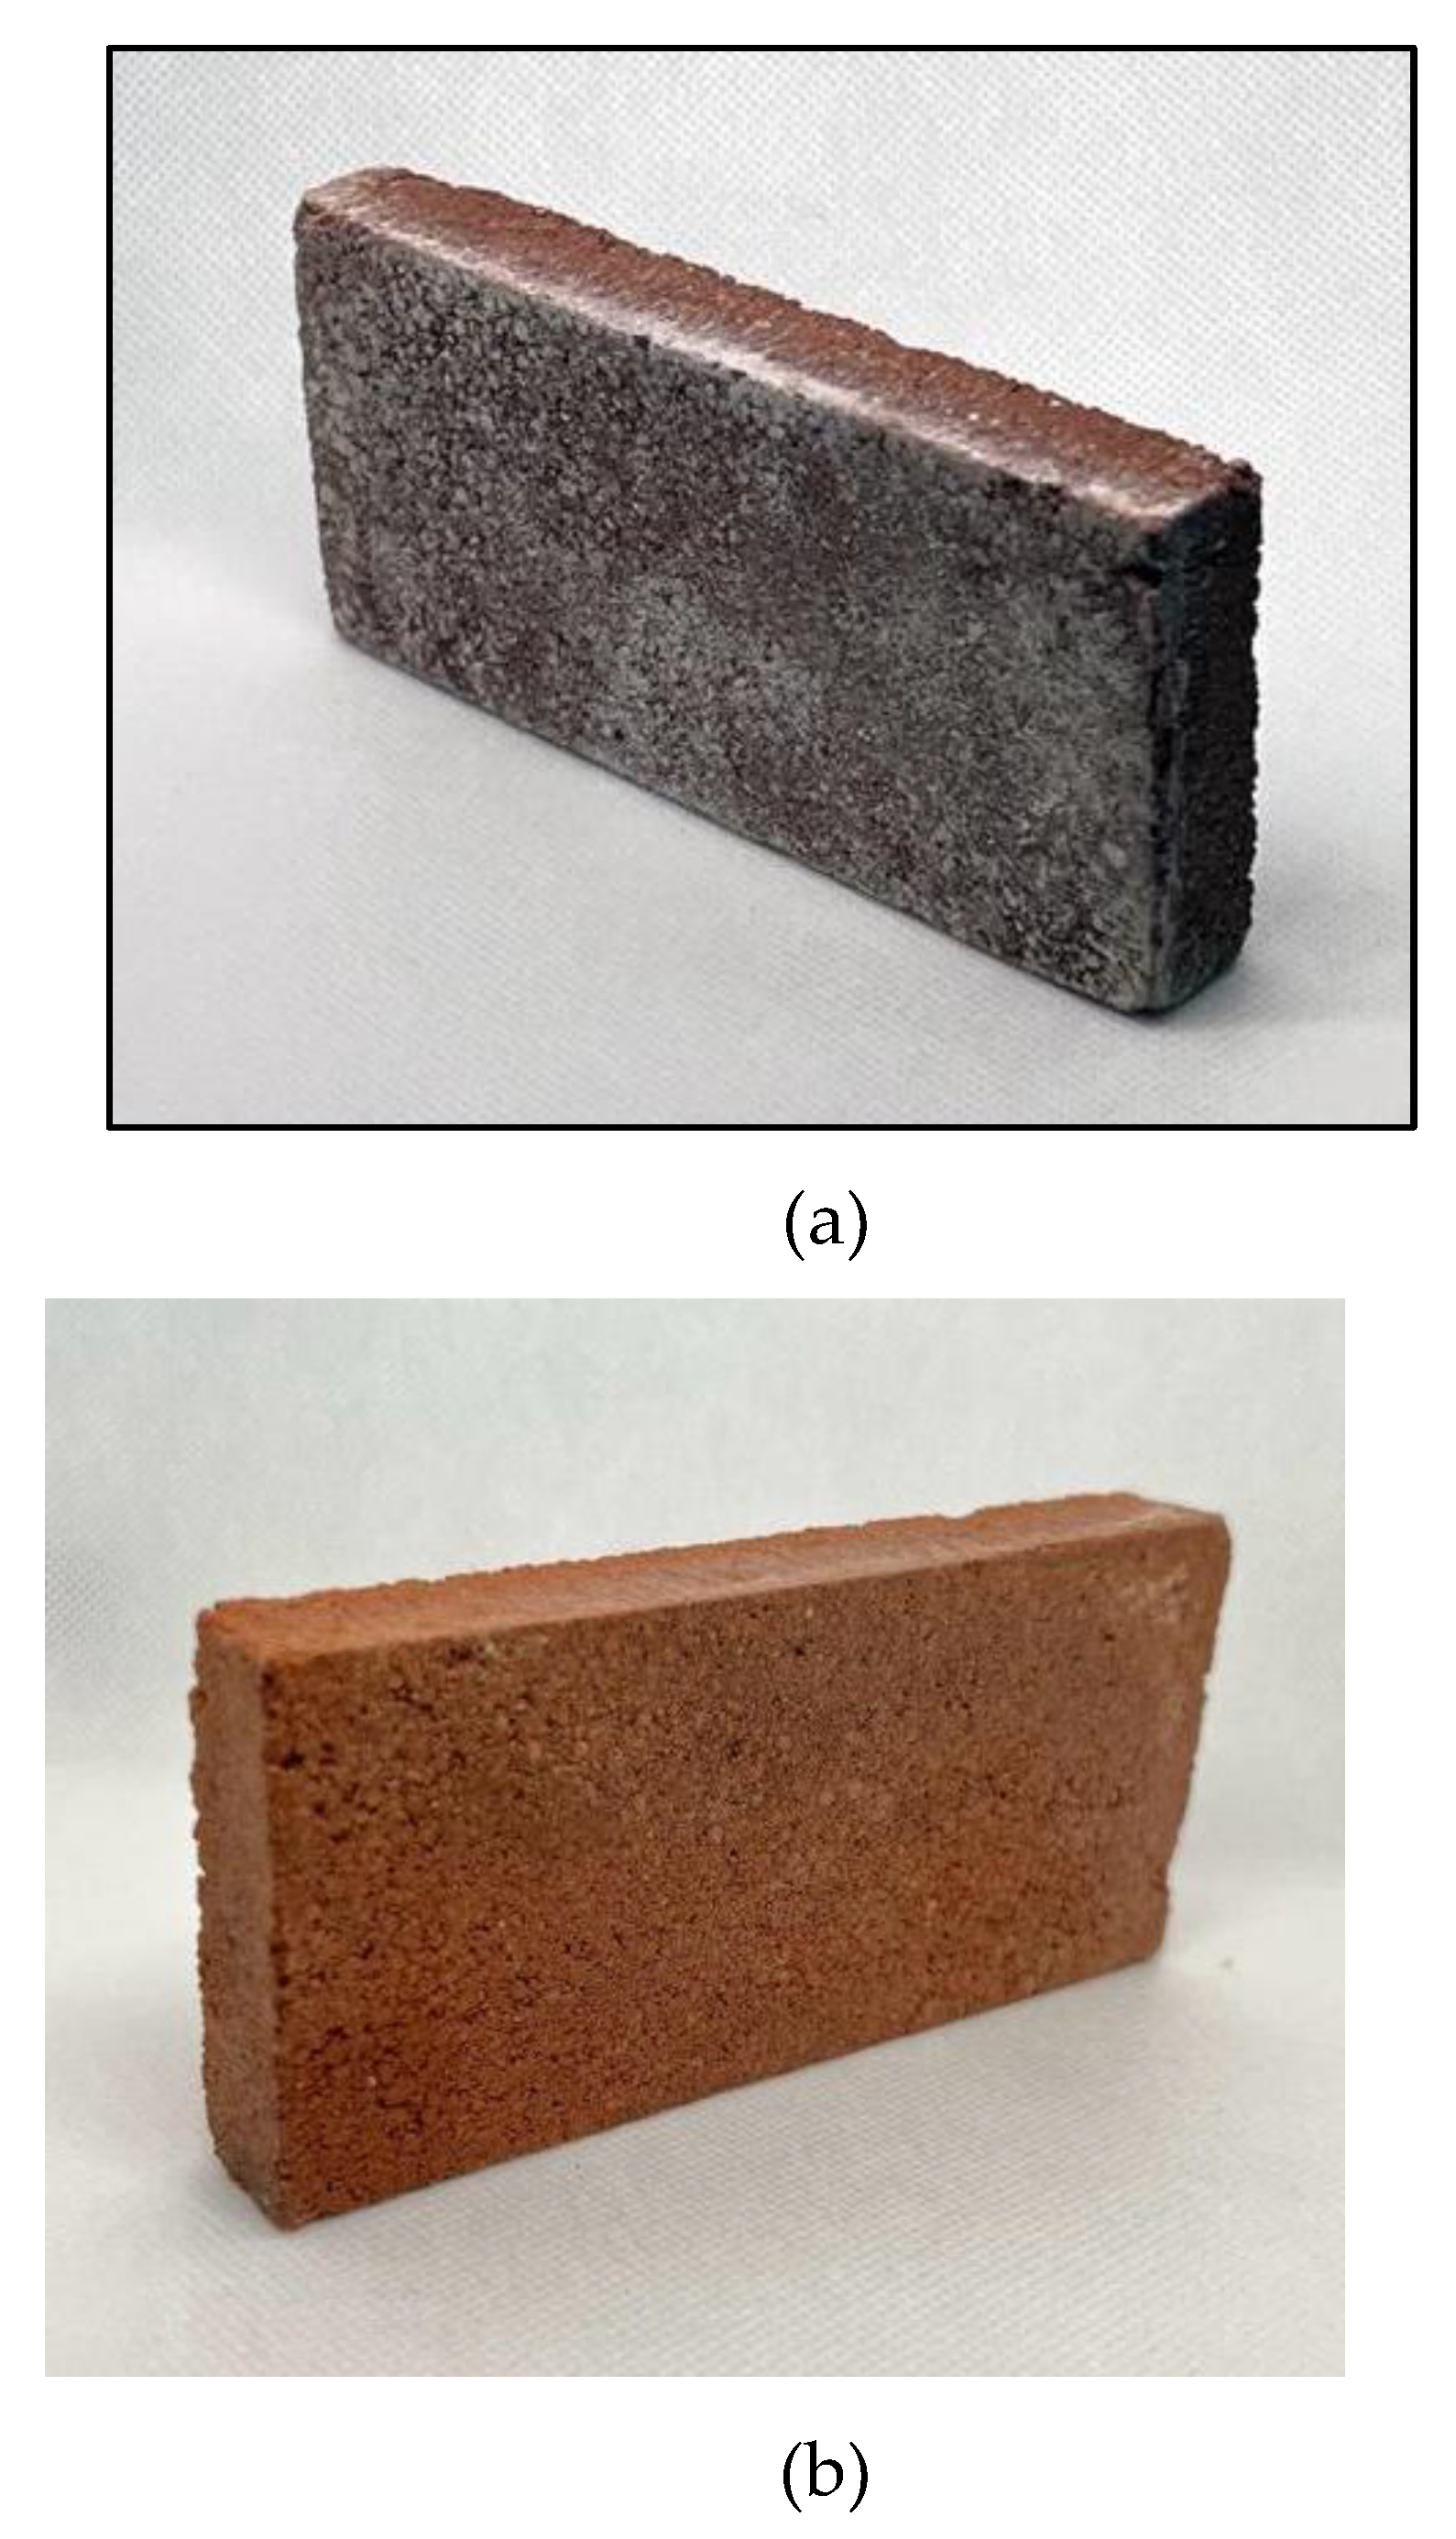
Figure 14. (a) LTT prototype with efflorescence. (b) LTT with silicate paint protection
Preprints 81255 g014
We proceed to perform an XRD analysis of the LTT prototype after a minimum time of 28 days has elapsed, during which it has been exposed to "normal" weathering conditions. The obtained results are shown in Table 5
The first four crystalline phases (quartz, hematite, albite, and muscovite) correspond to minerals that should be present in the brick and are considered harmless.
The last two identified compounds (hydrated aluminum phosphate and hexahydrated magnesium and potassium sulfate) are hydrated phosphates/sulfates that may have formed due to moisture on the surface of the bricks.
These two compounds can cause eye damage and irritation of the skin and/or respiratory system. However, due to their low concentration and outdoor occupation, the risk of complications from toxicity is low.
It is important to note that efflorescence does not affect the mechanical strength of the bricks and can be eliminated by rainwater action without contaminating aquifers. Alternatively, it can be treated with hydrophobic siloxanes, coated with a lime slurry or mortar, or even painted with silicate paints.
Once the thermal conductivity of the new material is obtained, the interior thermal comfort of a house in "Ciudad Victoria" (case study) is simulated using Ecodesigner software, an extension of the Archicad BIM program developed by Graphisoft. This process involves six phases: calibration of the location, climate, and environment; creation and definition of the physical characteristics of the materials; BIM modeling of the building; configuration of operation profiles for each area of the house; analysis and incorporation of infiltrations; simulation and results.
Referring to section 3 of NEC-HS-EE15, the climatic-housing zoning for the city of Loja falls under "climate zone 3," referred to as "rainy continental"16. Using the degree-day method17 and the climatic data obtained from the website http://climate.onebuilding.org/, which includes the annual averages from the LA ARGELIA LJ ECU18 meteorological station, the following values are provided in Table 6.
On the other hand, the "Climate Consultant 6" program is a tool used in this research as it allows for the decomposition of multiple climate variables into simple graphs. Both the "Climate Consultant 6" and "Ecodesigner" tools are compatible with the EPW extension; however, their functions are different. Through this complementary tool, we can more accurately analyze the climatic components within the EPW file for the climate of Loja. Additionally, this tool can be adapted to four different comfort models that align with the international ASHRAE standard. For the study of the rainy continental climate in Ecuador, the ASHRAE Standard 5520 was chosen, as the parameters to be analyzed in this research align with the suggestions provided by the standard.
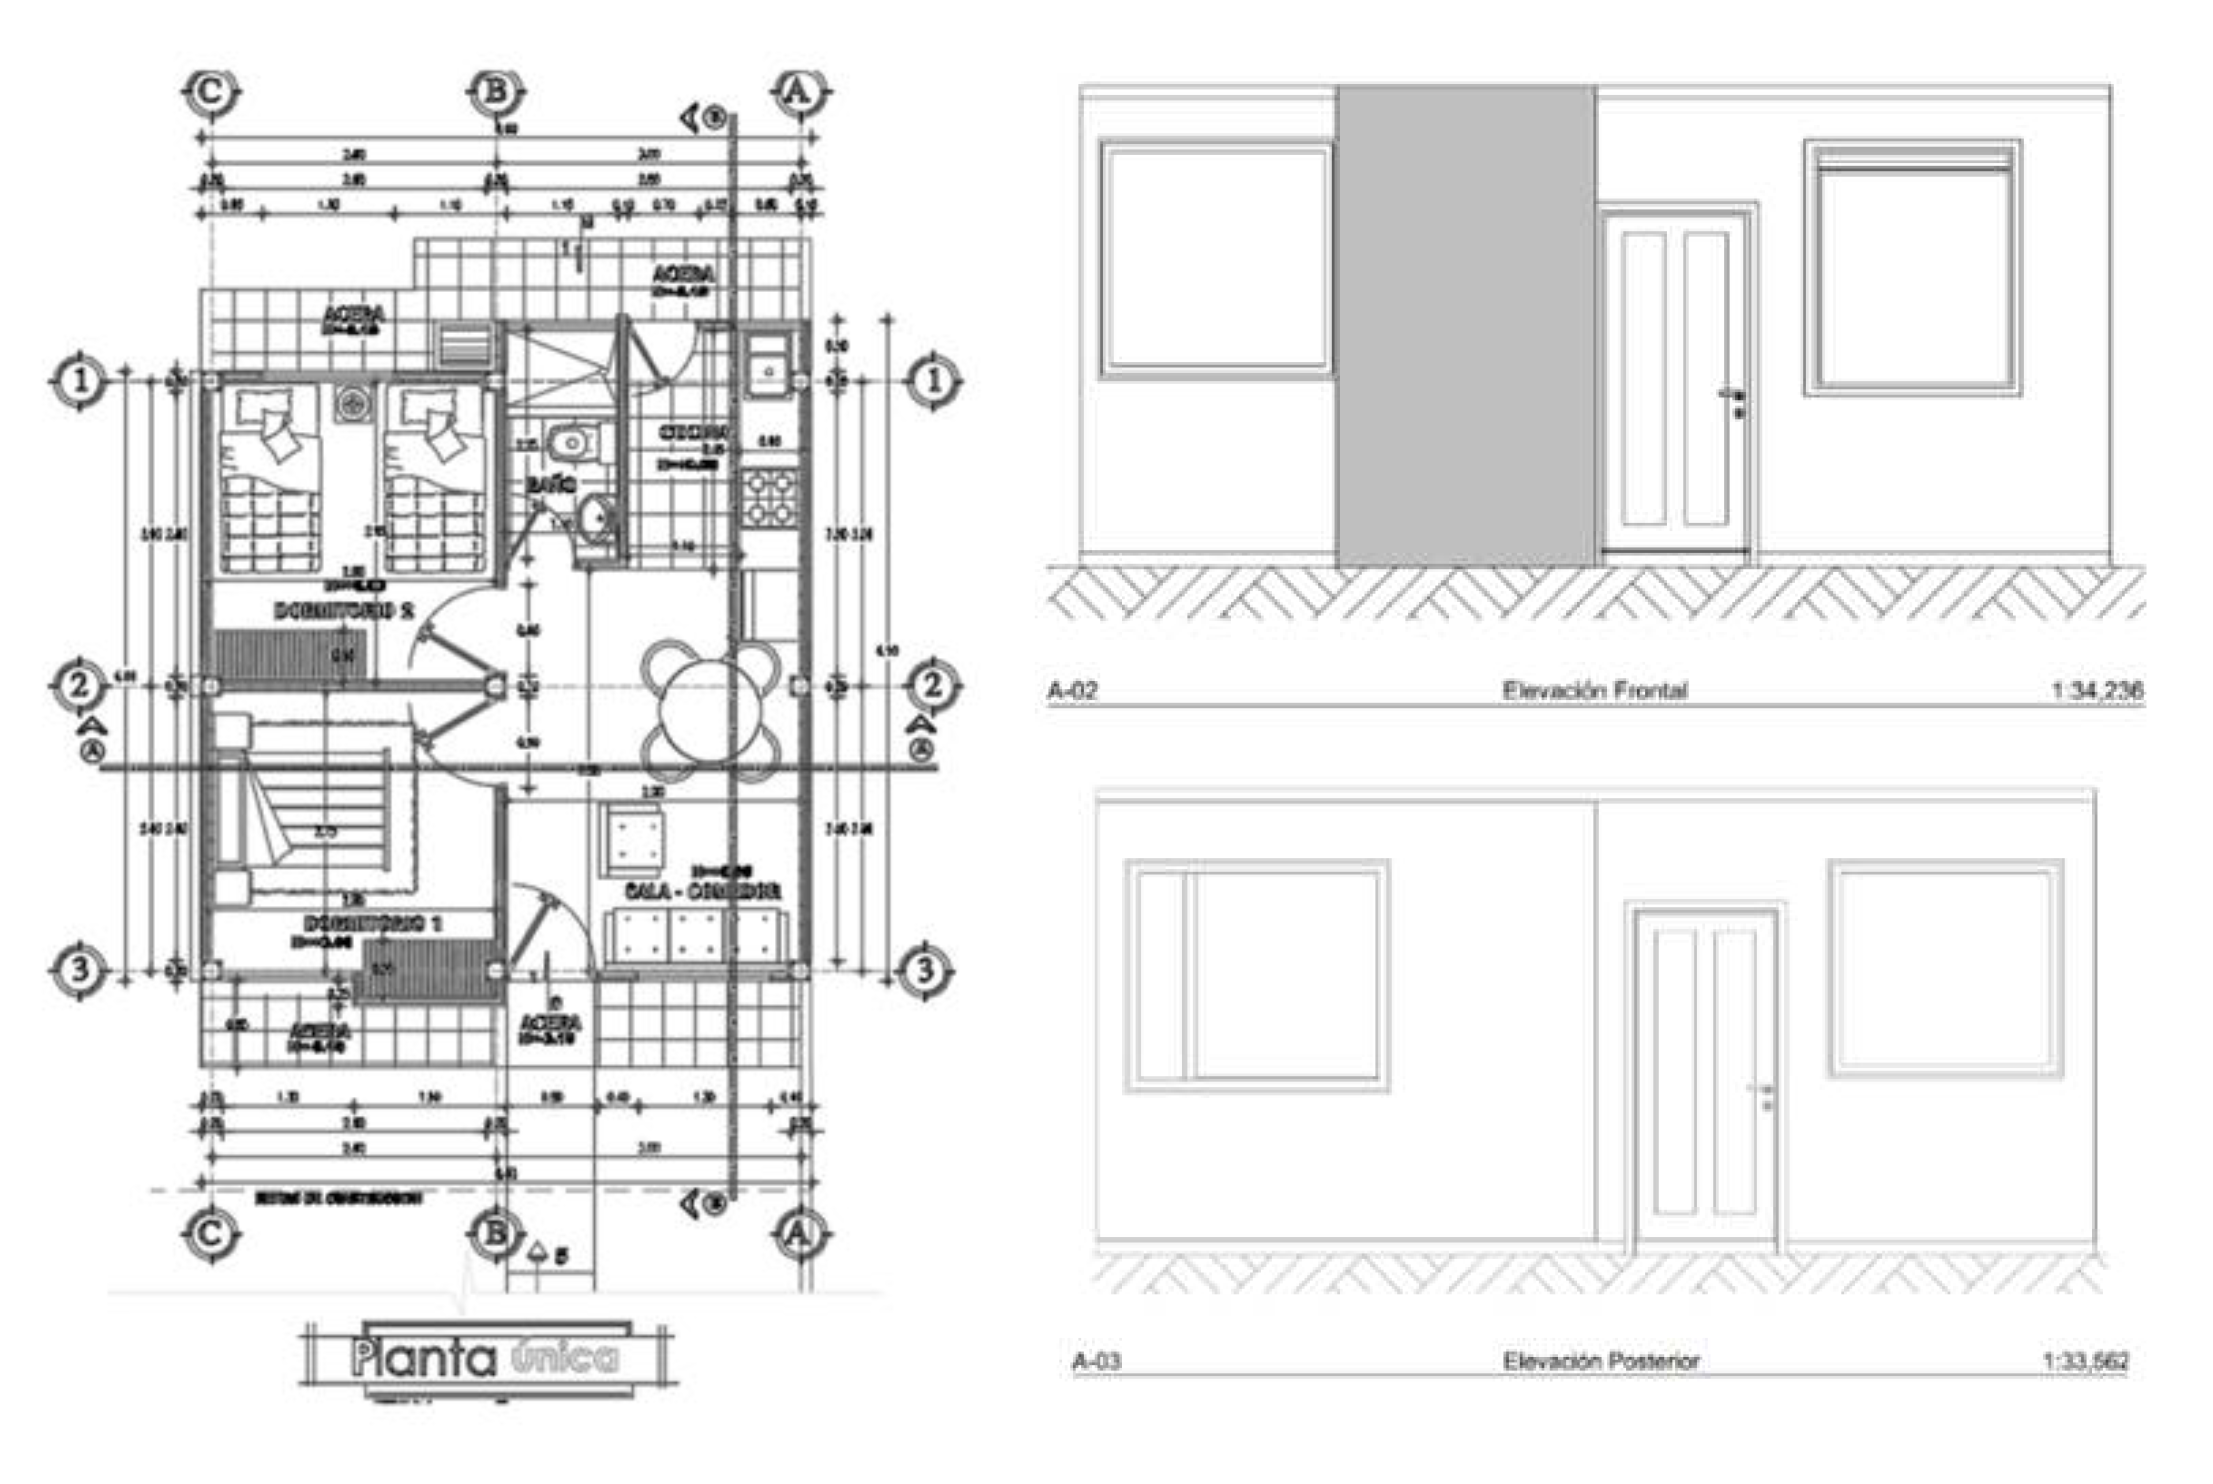
The case study typology consists of a construction area of 40 m² and is developed on a single floor distributed as follows
Typology I Space distribution area(m²)
Living room–dining room - kitchen 14.49
bathroom 1.87
bedroom 1 9.54
bedroom 2 8.20
Figure 15. Single story - elevation
Preprints 81255 g015
Table 7. Construction packages. Infiltration level21.
Construction package Components Thickness(cm) Conductivity(W/ºK) Infiltration level(l/sm²)
roofing reinforced concrete slab reinforced concrete 7 2.3 4,40
walls concrete block exterior plastering 1 0.5 4.40
concrete block 10 0.62
interior plastering 1 0.72
floor wood Hardwood 0.7 0.18 1.10
ceramic Ceramic 0.5 1.75 1.10
doors metal Steel 0.03 50 4
air (R0.15m²k/w) 0.1
Steel 0.03
wood painted oak 4.2 0.19
windows single-pane glass clear glass 0.3 0.9 4
Dynamic thermal simulation is a valuable tool for predicting the long-term thermal performance of buildings22. This method utilizes detailed data in three key areas: building geometry and structure, climatic and location data, and simulation software algorithms. Thanks to the precision of this data, results can closely reflect reality, enabling a better understanding of building behavior and optimization of time and resources. The obtained results are reliable enough to be used in future projects, and the methodology allows for quick comparison of the BIM model's capabilities in different scenarios, including variations in climate, location, and construction materials.
The construction of the different elements of the houses is carried out, including the floors, interior walls, and openings23. As for the roof, the house is built with a 7 cm thick concrete slab.
This research evaluates potential errors in the structures and openings of the houses, considering aspects such as the materiality of window frames, the type of glass, and the level of protection established at 40% due to the use of fabric curtains. A specific schedule is set for window opening, from 2 PM to 3 PM, starting from September 1st to July 31st. High levels of infiltration, common in constructions in Ecuador, are considered. Subsequently, the houses are simulated, and the results are configured based on the dates that mark temperature peaks in each space. This data is used to determine if the houses comply with the comfort ranges established by the regulations applied to the city of Loja, which requires a maximum temperature of 25°C and a minimum of 18°C, according to the comfort range calculation.
The requirements of the Ecuadorian Regulations for Construction, Habitability, and Health (NEC-HS_EE) are based on meeting specific thermal transmittance (U) values for the building envelope's construction components. To verify compliance with these regulations, it is essential to identify the habitable and non-habitable zones of the house and analyze the construction systems that make up the envelope, along with their components and thermal properties. The objective of this analysis is to determine if the houses meet the parameters established by the regulations.
Next, we will detail the components of each construction package of the envelope, along with their descriptive characteristics.
Table 8. Construction packages and thermal properties.
Construction package Components Thickness (cm) Conductivity (W/m2K) Current U-value (W/m2K) Reference U-value (W/m2K) Compliance with NEC
unconditioned living space ceilings e=8.2 cm reinforced concrete 7.0cm 2.3 4.7 2.35 Does not comply
plastering 1.2cm 0.81
Walls of habitable spaces- non – conditioned – above ground level e=12.0cm plastering 1.0cm 0.116 2.89 2.90 Complies
concrete block 10cm 0.62
plastering 1.0cm 0.116
Floors of habitable spaces – non - conditioned e=30cm ceramic 0.7cm 1.75 2.82 3.2 Complies
subfloor 8cm 2.50
The construction elements of the house, such as walls and floors, comply with the thermal transmittance (U) requirements established by the NEC regulations. However, the roofs do not meet the standards set by the regulations.
Furthermore, the house has windows with natural aluminum frames and clear 4mm glass on the front and back facades. According to the NEC-HS_EE regulations, the glazed areas should not exceed 40% of the net area of the facade. The calculation of the glazed area is shown in the following table.
Table 9. Percentage of insulated surface – net wall area of a Type I residential unit.
elevation total facade area (m²) area of glazed surface (m2) percentage of glazed surface (%) compliance with NEC–HS-EE
Front elevation 15.12 3.29 27.1% Complies
Rear elevation 12.12 3.58 23.6% Complies
The analysis of the hygrothermal comfort of the houses reveals that the appropriate temperatures for thermal comfort are not met, causing discomfort to the inhabitants due to constant temperature fluctuations. These fluctuations are caused using materials with high thermal transmittance in the building envelope and interior spaces.
The building envelope plays a crucial role in regulating internal and external temperatures. In winter, internal heat dissipates through the envelope, while in summer, external heat penetrates and accumulates in the house.
Regarding the floor, Type I houses have issues with their construction packages, particularly in areas with ceramic flooring, which creates a cool environment that is not suitable for houses in Ciudad Victoria (Loja). Instead, materials such as wood, parquet, or laminate flooring are needed to maintain a warm environment.
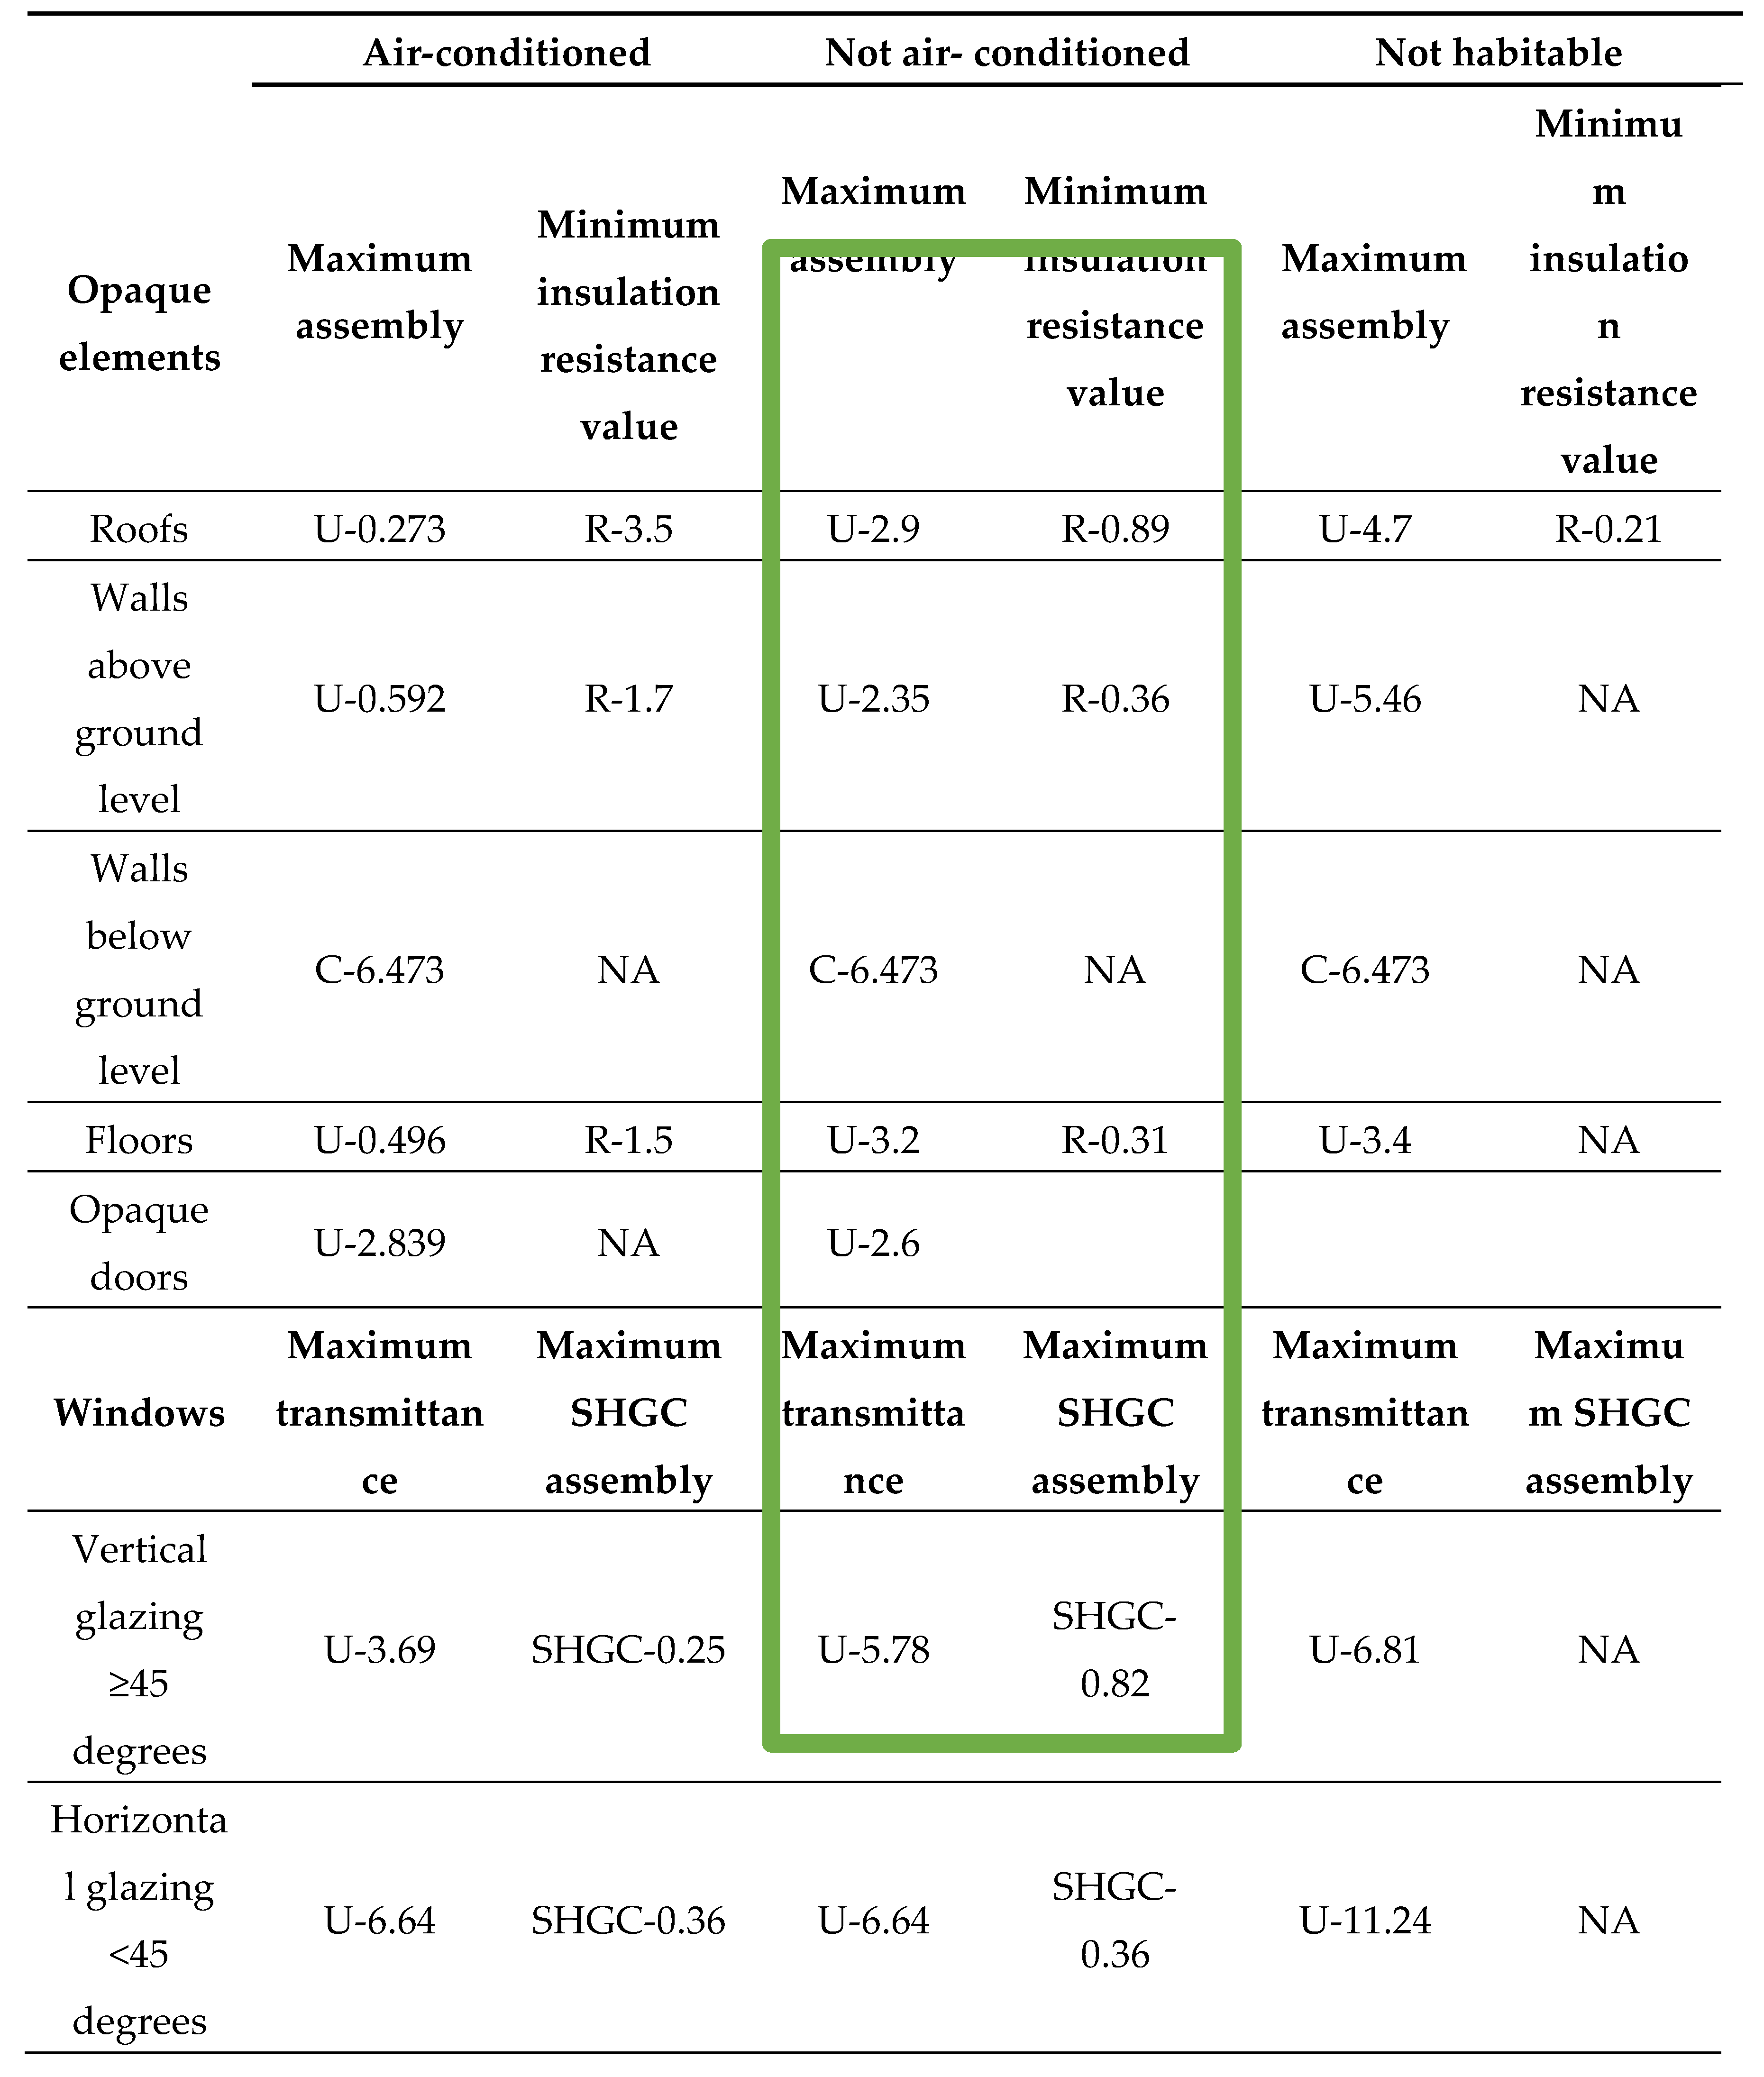
Table 10. Envelope requirements for climate zone 3.
Preprints 81255 i001
The compliance analysis of the NEC-HS-EE regulations demonstrates that the house does not meet the specified values for its respective climatic zone (climate zone 3), resulting in issues with habitability and comfort. Problems associated with the materials used in the interior spaces and building envelope have been identified. Therefore, it is suggested to implement strategies focused on improving the construction materials of the house to enhance the quality of the interior spaces.
Table 11. Compliance values for building envelope according to NEC-HS-EE.
Building envelope - Type I residential unit
Typology Component Current U-value(W/m²K) Required U-value.(W/m²K) Compliance
roofing concrete slab 7cm thick 4.7 2.35 Does not comply
walls concrete block 2.89 2.90 Complies
Intermediate floor ceramic 2.82 3.20 Complies

4.3. Results of the application

To improve the habitability of the house, it is proposed to modify the materiality of the construction packages based on residential design guidelines for the city of Loja.
For the roof, it is suggested to use a 5mm asphalt membrane adhered to the concrete slab for insulation and waterproofing. Additionally, adding a 10cm mineral wool sheet adhered to the slab to control excessive heat loss and gain, and a 9mm plasterboard is proposed.
For the walls, the use of a 2-4 cm geopolymerized brick veneer is recommended, selected for its ability to maintain interior temperature in relation to the exterior temperature and conditioning the houses.
Regarding the floors, due to low temperatures in the bedrooms, a change to floating floor is suggested. This material can store solar gain during the day in winter, providing warmth, and stay cool during the night in summer, regulating the temperatures of the bedrooms.
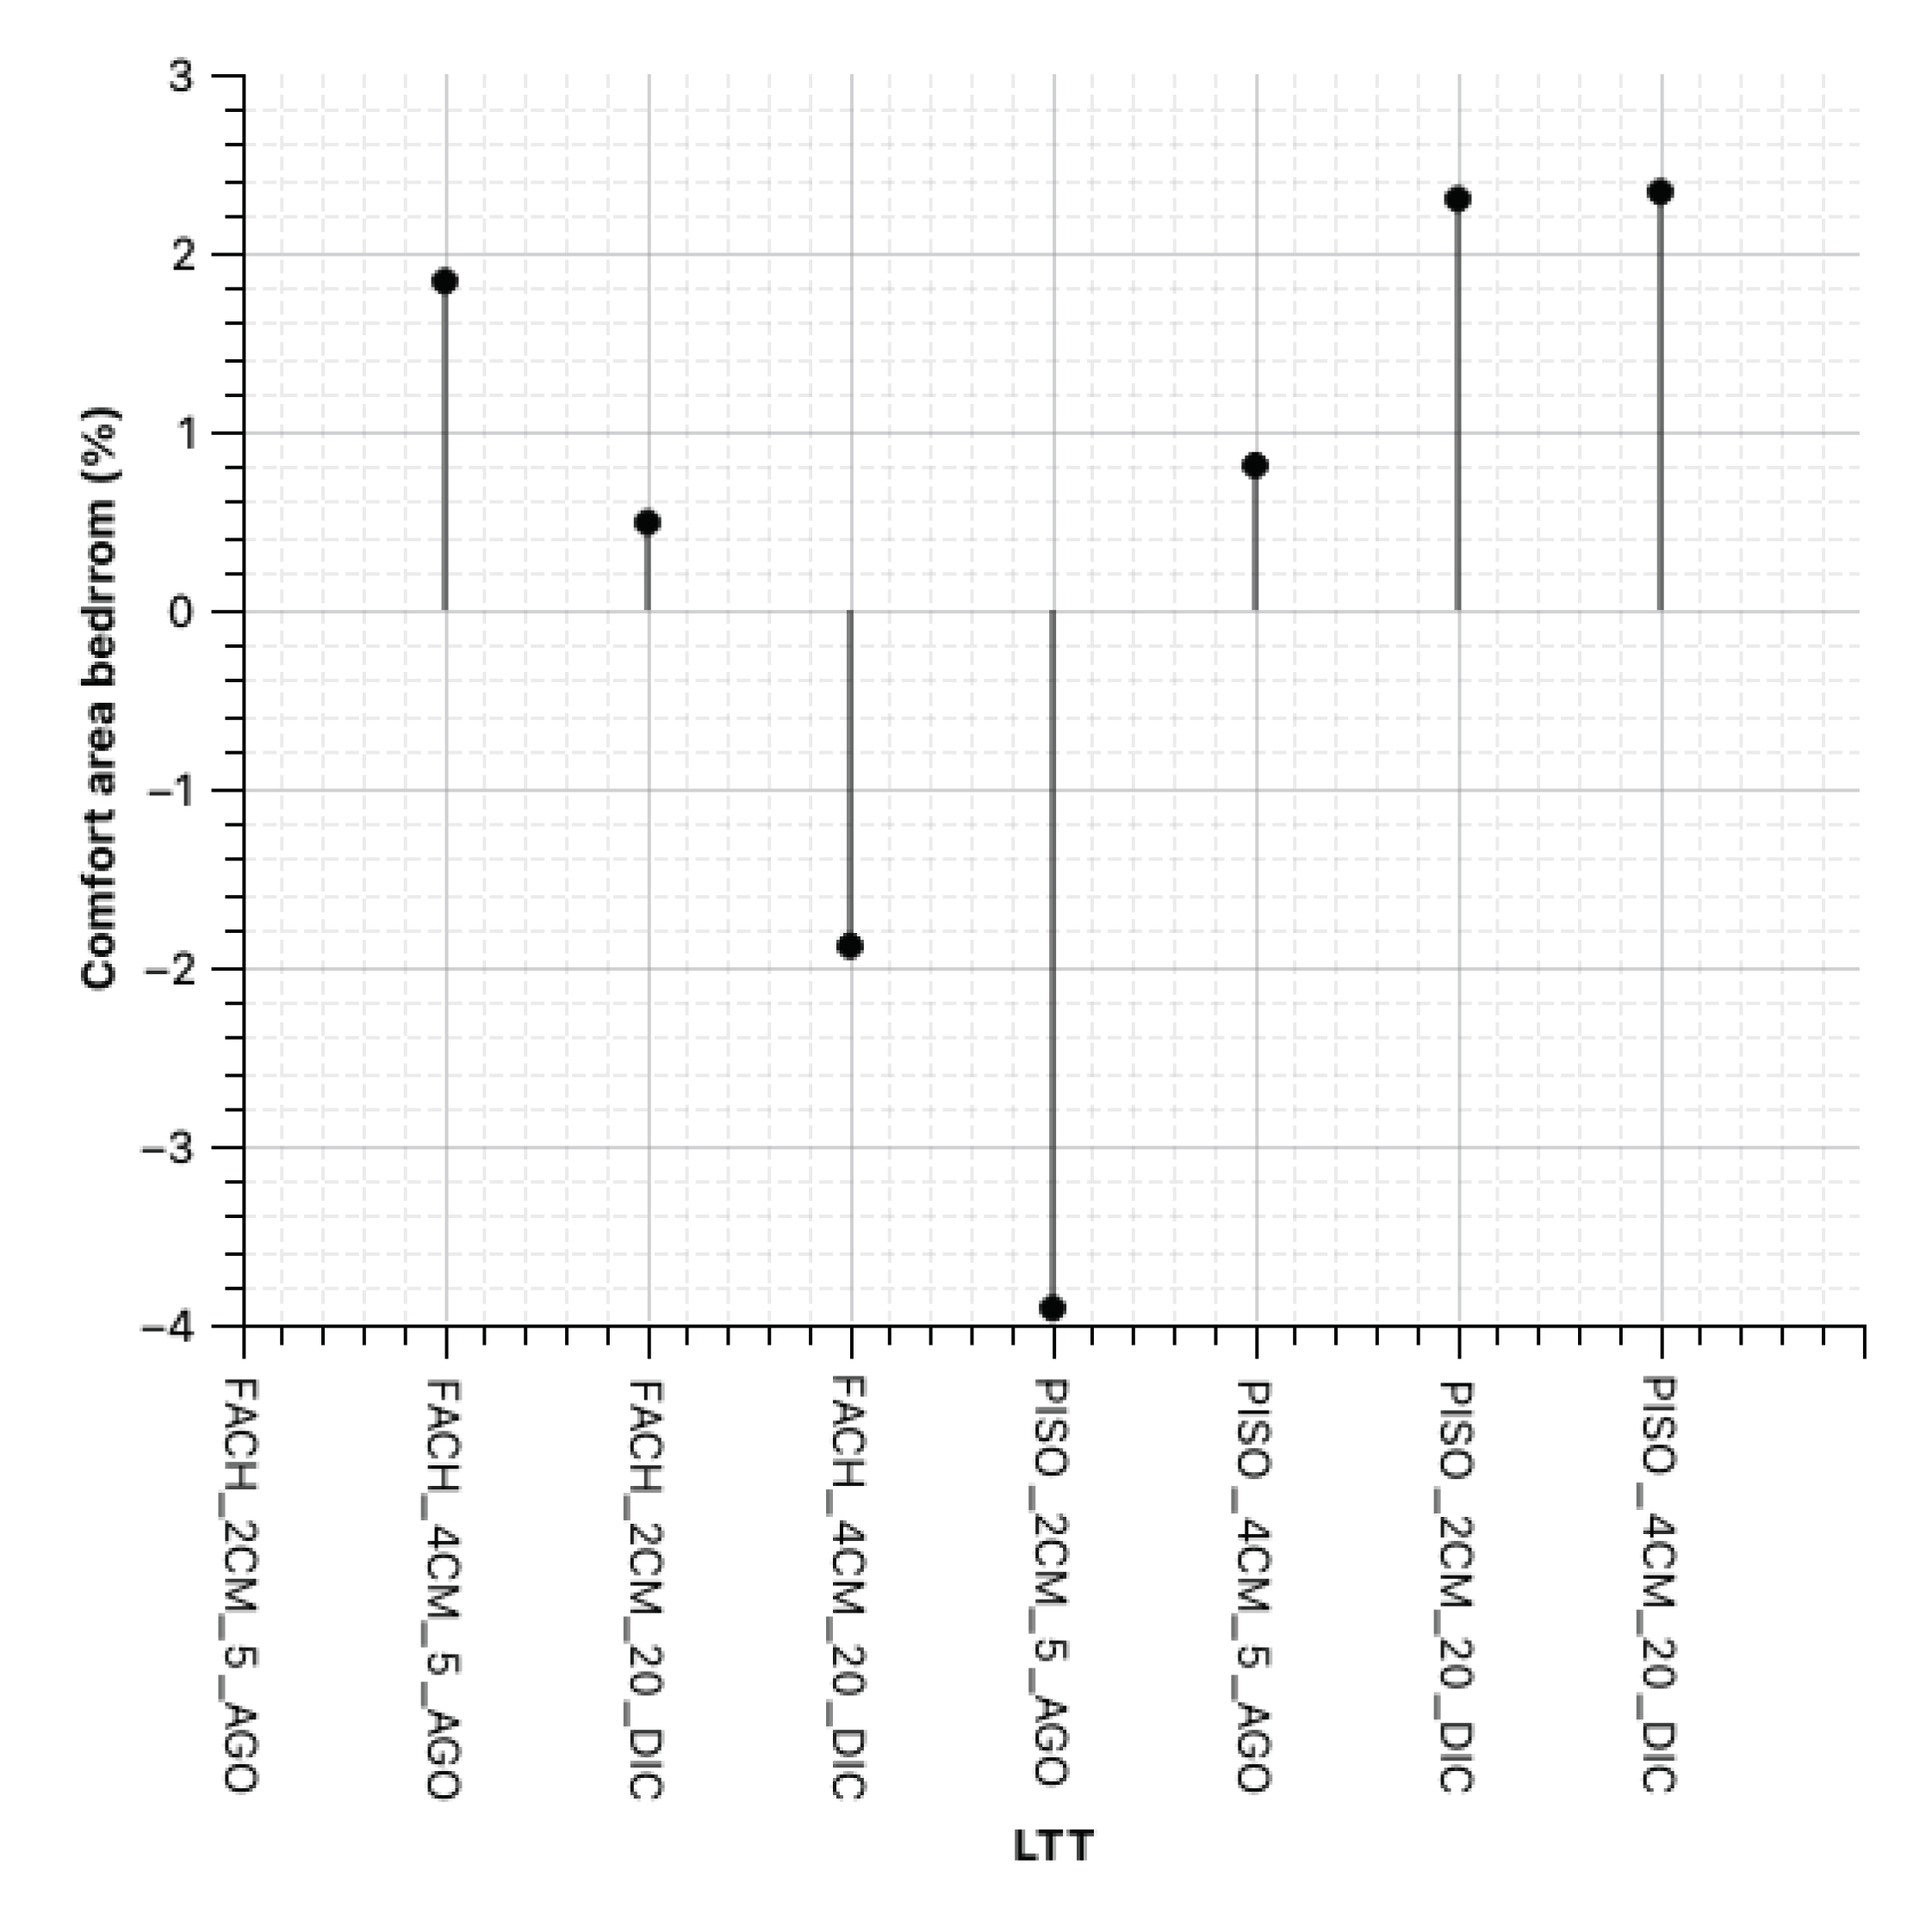
On the other hand, to determine the actual contributions using only the LTT in the envelope and as a possible extension of this research to the use of this material in floors, the simulation is performed without considering improvements in the roof of the Type I house, and considering the change in material thickness, as depicted in the following figures:
Figure 16. Simulation results: percentage reduction / enlargement of the thermal comfort range (19.98oC – 24.98oC) applying LTT, compared to the base case. Space: living room – kitchen.
Preprints 81255 g016
Figure 17. Simulation results: percentage reduction / enlargement of the thermal comfort range (19.98oC – 24.98oC) applying LTT, compared to the base case. Space: Bedroom
Preprints 81255 g017
Table 12. NEC Compliance Verification: Proposed Typology I
Building envelope, Typology I Residence
Typology Component Current U value(W/m²k) Required value.(W/m²k) Compliance
roofing concrete slab 7cmthick 0.643 U-2.35 Complies
walls concrete block 2.89 U-2.90 Complies
floor ceramic 2.31 U-3-20 Complies

5. Conclusions

The chemical characterization using XRD analysis determines that the material meets the raw material conditions for the geopolymerization process using sodium hydroxide, as it exhibits good quartz (Q) content. Furthermore, the results of the XRF analysis indicate high levels of silicon oxide (SiO2) and aluminum oxide (Al2O3), which are highly recommended in geopolymeric mixes to form aluminosilicates and generate high strengths.
The generation of a construction material through a geopolymerization process using brick waste as raw material is viable, based on the experimental results obtained. The optimal mix that presented a maximum optimization factor value of 14.84 MPa/kg was the 12.5M-26%CS-150°C mix.
Geopolymeric brick tiles, such as LTT, are a potential alternative for use in common architectural envelopes due to their satisfactory mechanical and thermal properties and their sustainable production process, which involves low energy consumption compared to the traditional artisanal process, the reuse of waste materials, and a significant reduction in the use of natural resources.
The minimum strength requirement for a solid ceramic brick of type C in a compression test corresponds to a value of 6 MPa according to the requirements of the NTE INEN 297 standard. It is determined that LTT bricks meet this requirement, achieving an average compressive strength of 6.93 MPa.
The minimum flexural strength of the brick tiles does not meet the requirements of the NTE INEN 297 standard for solid ceramic bricks of type C, as it reaches a flexural strength of 1.937 MPa, with a minimum required value of 2.
According to the NTE INEN 297 standard, the maximum absorption percentage recommended for solid ceramic bricks of type C is 25%. The brick tiles have a calculated porosity of 28.12%, resulting in a theoretical absorption percentage of 24.95%, perfectly complying with the standard's recommendations.
The heat transfer test allowed for understanding the thermal behavior of the analyzed brick types. The heat transfer coefficient of the 30x30cm geopolymerized brick plates was higher than that of the fired clay brick plate, with a variation ranging from 0.0117 to 0.0050 kW respectively over a one-hour time range.
The same dynamics are observed in the total heat transfer in kWh of the two materials. The geopolymerized brick plates are more efficient in heat exchange compared to the fired clay brick plates. However, it is observed that LA-1 and LA-2 maintain a constant heat with a minimal fluctuation of 0.001 kW, while LGP-1 and LGP-2 have a higher fluctuation of 0.003 kW. This is evident in the energy simulation application, as no improvement is observed in the heating hours of the house.
The base energy simulation identified that the resulting internal temperatures of the analyzed zones in the house are within the comfort range (18°C to 21°C24), but they fluctuate depending on the time of day, resulting in approximately 8 hours of heat loss per day. This is reflected in the HVAC design data of the initial simulation, which shows a total of 1972 unsatisfied load hours per year.
There is an improvement in the construction material when its thickness is increased to 4 cm, as reflected in the Ecodesigner simulations.
According to the thermal conductivity values, LTT could be applied in floors to function as radiant flooring.
Efflorescence does not affect the mechanical strength and can be eliminated through mechanical action with hydrophobic treatments or the use of siloxanes. Additionally, it can be addressed by applying a lime slurry or mortar or using a silicate paint for protection.

References

  1. INEC. Instituo Nacional de Estadisticas y Censos; p. 2013.
  2. Wong, C.L.; Mo, K.H.; Yap, S.P.; Alengaram, U.J.; Ling, T. C. Potential use of brick waste as alternate concrete-making materials: A review. J Clean Prod 2018, 195, 226–239. [Google Scholar] [CrossRef]
  3. Davidovits, J. Geopolymer Chemistry and Applications, no. January 2008, 3rd ed.; p. 2011.
  4. Amin, S.K.; El-Sherbiny, S.A.; El-Magd, A.A.M.A.; Belal, A.; Abadir, M. F. Fabrication of geopolymer bricks using ceramic dust waste. Constr Build Mater 2017, 157, 610–620. [Google Scholar] [CrossRef]
  5. Wong, C.L.; Mo, K.H.; Yap, S.P.; Alengaram, U.J.; Ling, T. C. Potential use of brick waste as alternate concrete-making materials: A review. J Clean Prod 2018, 195, 226–239. [Google Scholar] [CrossRef]
  6. Sore, S.O.; Messan, A.; Prud’homme, E.; Escadeillas, G.; Tsobnang, F. Synthesis and characterization of geopolymer binders based on local materials from Burkina Faso – Metakaolin and rice husk ash. Constr Build Mater 2016, 124, 301–311. [Google Scholar] [CrossRef]
  7. Pardo, N.; Penagos, G.; Correa, M.; López, E. Desarrollo de morteros de bajo impacto ambiental a partir de residuos sílico-aluminosos activados alcalinamente del sector minero. Boletín de la Sociedad Española de Cerámica y Vidrio 2021. [Google Scholar] [CrossRef]
  8. Mustafa al Bakri, A. M.; et al. Geopolymerization method for soil stabilization application. US 2015/0016895 A1, 2015. [Google Scholar]
  9. García, V.J.; Márquez, C.O.; Zúñiga-Suárez, A.R.; Zuñiga-Torres, B.C.; Villalta-Granda, L. J. Brazilian Test of Concrete Specimens Subjected to Different Loading Geometries: Review and New Insights. Int J Concr Struct Mater 2017, 11. [Google Scholar] [CrossRef]
  10. Lv, X.; Qin, Y.; Lin, Z.; Tian, Z.; Cui, X. Inhibition of Efflorescence in Na-Based Geopolymer Inorganic Coating. ACS Omega 2020, 5, 14822–14830. [Google Scholar] [CrossRef] [PubMed]
  11. Faisal, N.H. Diametral compression test method to analyse relative surface stresses in thermally sprayed coated and uncoated circular disc specimens. Surf Coat Technol 2019, 357, 497–514. [Google Scholar] [CrossRef]
1
This test will be based on the technique defined as the "Brazilian disc test," which has been introduced in the literature as a substitute for direct tensile testing in brittle materials [11].
2
3
Rodríguez, Erich, & Bernal, Susan, & Mejía de Gutiérrez, Ruby, & Gordillo, Marisol (2009). Effect of SiO2/Al2O3 and Na2O/SiO2 modules on the properties of geopolymers based on a metakaolin. Revista Facultad de Ingeniería Universidad de Antioquia, (49), 30-41. [Consultation date: July 12, 2022]. ISSN: 0120-6230. Available at: https://www.redalyc.org/articulo.oa?id=43019324003
4
Retsch BB100
5
Retsch RS 200
6
D8-ADVANCE
7
To determine the amount of NaOH needed to dissolve for the alkaline solution, we need to calculate it by multiplying 12.5 M by 40 g/mol (molecular weight), considering that it will be dissolved in 1000 ml of distilled water.
Tabla 1. 
12.5 M x 40 g/mol = 500 g of NaOH
Tabla 2. 
Therefore, 500 grams of NaOH should be dissolved in 1000 ml of distilled water.
8
Zúñiga Suárez, Alonso (2018). Science and engineering of new materials in the manufacture of technologically improved bricks. Thesis (Doctoral), E.T.S. Architecture (UPM). https://doi.org/10.20868/UPM.thesis.52643.
9
To prepare a soil-solution mixture by creating 4 specimens with a diameter of 7 cm and a thickness of 2 cm, which will be subjected to a molding pressure of 39.2266N. The solution content is 22%. It is known that the amount of soil required for the fabrication of the 4 specimens is 411 grams. How to calculate the amount of solution needed?
10
11
12
Fonseca Diaz, N., & Tibaquirá, J. E. (2008). Method for the experimental estimation of thermal conductivity of some common materials in Colombia for HVAC/R applications. Scientia Et Technica, 2(39). https://doi.org/10.22517/23447214.3185. This article presents the experimental development implemented to estimate the thermal conductivity of some materials used in the field of refrigeration and air conditioning (HVAC/R).
13
14
To determine the heat transfer experiment, we have based this study on Fourier's law of thermal conduction, which considers a flat wall of thickness e and an average thermal conductivity λ.
15
Ecuadorian Construction Standard. Habitability and Health. Energy Efficiency.
16
From the climate file of the city of Loja, obtained from the weather station "Loja La Argelia LJ ECU," it is determined that the Heating Degree Days (HDD) have a value of 588, considering a base temperature for heating of 18°C. On the other hand, the Cooling Degree Days (CDD) have a value of 2339, with a base temperature of 10°C, following the ASHRAE standard as a thermal criterion for climate classification. Analyzing the HDD 18 and CDD 10 data from the weather station and Table 1 of the NEC-HS-EE (page 12), it was determined that the city of Loja belongs to Climate Zone 3, within Zone 3C according to ASHRAE 90.1 standard, referred to as CONTINENTAL LLUVIOSA, meeting the thermal criterion of CDD10°C≤2500 and HDD18°C≤ 2000.
17
It shows, based on the geographical location, whether the building has heating or cooling requirements, or both. It is also defined as the temperature difference between the average outdoor air temperature over a 24-hour period and a specified base temperature.
18
19
Created by the author using Climate Consultant 6.0 software, based on the ECU_LJ_Loja-La.Argelia.842700_TMYx.2004-2018.epw file. Retrieved from https://climate.onebuilding.org/WMO_Region_3_South_America/ECU_Ecuador/LJ_Loja/ECU_LJ_Loja-La.Argelia.842700_TMYx.2007-2021.zip.
20
It is considered in spaces with natural ventilation where occupants can open and close windows. Its thermal response depends in part on the external climate and may have a wider comfort range than in buildings with centralized HVAC systems. This model assumes that occupants adapt their clothing to the thermal conditions and are sedentary (1.0 to 1.3 MET). There should not be a mechanical cooling system in place, and this method is not applicable if a mechanical heating system is operating. Additionally, it considers a comfort range of 19.9ºC for lower comfort and 25.5ºC for maximum comfort, according to the climate.
21
The construction packages used in both housing typologies are summarized in the table, considering the thermal conductivity values taken from the Ecuadorian construction standard NEC (2018) and the infiltration levels from the air tightness manual for buildings in Chile (https://construccionsustentable.uc.cl/images/Documentos/Manual_de_hermeticidad_al_aire_de_edificaciones.pdf).
22
For the simulation, the Ecodesigner software from Archicad is used.
23
The thermal conductivity values for each element were obtained from the Ecuadorian Construction Regulations (2018), while the infiltration levels were taken from the air tightness manual for buildings in Chile by Cite & Decon (2011).
24
According to the NEC_HS_EE (Ecuadorian Construction Standard - Habitability and Health - Energy Efficiency).
Figure 3. X-ray fluorescence percentage, by factory code.
Preprints 81255 g003
Figure 4. X-ray diffraction: PC001-PC002-PM001-PM002.
Preprints 81255 g004
Figure 6. Discs with pressures lower than 39.2266N.
Preprints 81255 g006
Figure 7. Solution concentration 26%.
Preprints 81255 g007
Figure 8. Cracks generated due to excessive curing temperature.
Preprints 81255 g008
Figure 9. Effect of molar concentration: a) 90 C y b) 200 C.
Preprints 81255 g009
Figure 10. Effect of molar concentration: a) 120°C, b) 150°C y c) 180°C.
Preprints 81255 g010
Figure 11. Compression strength results.
Preprints 81255 g011
Figure 12. Data collection with thermocouple at intervals of 1, 30 and 60 minutes.
Preprints 81255 g012
Table 1. X-ray fluorescence results.
Sample AL2O3% SiO2% K2O% CaO% Fe2O3% Others% Total% ΣOxides >70%
PC001 15.90 58.00 1.86 3.34 6.18 14.72 100.0 80.08
PC002 15.10 53.30 1.53 3.35 5.90 20.82 100.0 74.30
PM001 13.30 67.00 2.04 0.95 4.04 12.67 100.0 84.34
PM002 17.00 61.30 2.84 1.39 5.59 11.88 100.0 83.89
Table 2. Molarity dosing.
Capacity of beaker Molarity Amount of NaOH in 1000(ml) Amount of NaOH in 100(ml)
A(ml) B(M) C (g) D (g)
250 12.5 500 125
10 400 100
7.5 300 75
5 200 50
100 12.5 500 50
10 400 40
7.5 300 30
5 200 20
Table 3. Solution content in the soil-solution combination.
Solution content Soil content Soil-solution content
(%) (%) (%)
22 78 100
24 76 100
26 74 100
Table 5. Fases minerales (compuestos químicos) detectados en la muestra.
Mineral compound Chemical Formula Semi-quantification (%)
quartz SiO2 73
hematite Fe2O3 1
albite NaAlSi3O8 1
muscovite KAl2(Si3Al)O10(OH,F)2 20
hydrated aluminum phosphate Al5[(PO4)2[(P,S)O3(OH,O)]2F2(OH)2(H2O)8•6.48(H2O) 1
hexahydrated magnesium potassium sulfate K2Mg (SO4)2•6(H2O) 4
Table 6. Summary table of the climate in the city of Loja19.
Ecuador climate zone JAN FEB MAR APR MAY JUN JUL AUG SEP OCT NOV DEC Unit
Global horizontal radiation* 372 347 414 407 368 356 302 380 420 404 458 400 Wh/m2
Direct normal radiation* 212 154 249 275 270 312 204 309 298 226 319 266 Wh/m2
Diffuse radiation* 224 237 240 215 201 160 174 172 224 242 221 215 Wh/m2
Global horizontal radiation** 1049 1075 1077 1045 988 930 963 995 1055 1071 1091 1039 Wh/m2
Direct normal radiation** 1001 998 1011 1008 984 983 994 988 991 985 1053 1019 Wh/m2
Diffuse radiation** 538 549 558 532 490 450 458 494 546 567 543 522 Wh/m2
Global horizontal radiation*** 4552 4214 4981 4850 4358 4197 3567 4511 5031 4890 5582 4898 Wh/m2
Direct normal radiation*** 2592 1872 2995 3275 3194 3683 2412 3668 3577 2736 3899 3262 Wh/m2
Diffuse radiation*** 2745 2881 2895 2563 2385 1885 2053 2051 2691 2927 2697 2638 Wh/m2
Horizontal global illumination* 41274 38102 45280 44837 41338 39798 33943 41940 45970 44115 50230 44414 lux
Direct normal illumination * 20143 14321 23495 25998 26437 31269 20209 30357 28057 21064 29851 25404 lux
Dry bulb temperature**** 14 15 15 14 15 14 14 14 15 15 14 15 ºC
Dew point temperature**** 11 12 12 11 12 11 10 9 12 11 10 12 ºC
Relative humidity**** 84 86 83 85 85 81 79 70 80 77 81 82 %
Wind direction***** 270 270 90 90 90 90 90 90 90 90 270 270 degrees
Wind speed**** 1 1 2 1 1 2 3 2 2 1 0 1 m/s
Floor temperature**** 14 14 14 15 15 15 15 15 15 14 14 14 ºC
*_Average per hour. **_Maximum per hour. ***_Daily total average. ****_Monthly average. *****_Monthly mode
Disclaimer/Publisher’s Note: The statements, opinions and data contained in all publications are solely those of the individual author(s) and contributor(s) and not of MDPI and/or the editor(s). MDPI and/or the editor(s) disclaim responsibility for any injury to people or property resulting from any ideas, methods, instructions or products referred to in the content.
Copyright: This open access article is published under a Creative Commons CC BY 4.0 license, which permit the free download, distribution, and reuse, provided that the author and preprint are cited in any reuse.
Prerpints.org logo

Preprints.org is a free preprint server supported by MDPI in Basel, Switzerland.

Subscribe

© 2024 MDPI (Basel, Switzerland) unless otherwise stated