Submitted:
02 August 2023
Posted:
02 August 2023
You are already at the latest version
Abstract
Keywords:
1. Introduction
2. Materials and Methods
2.1. Study Design
2.2. Study Cohort

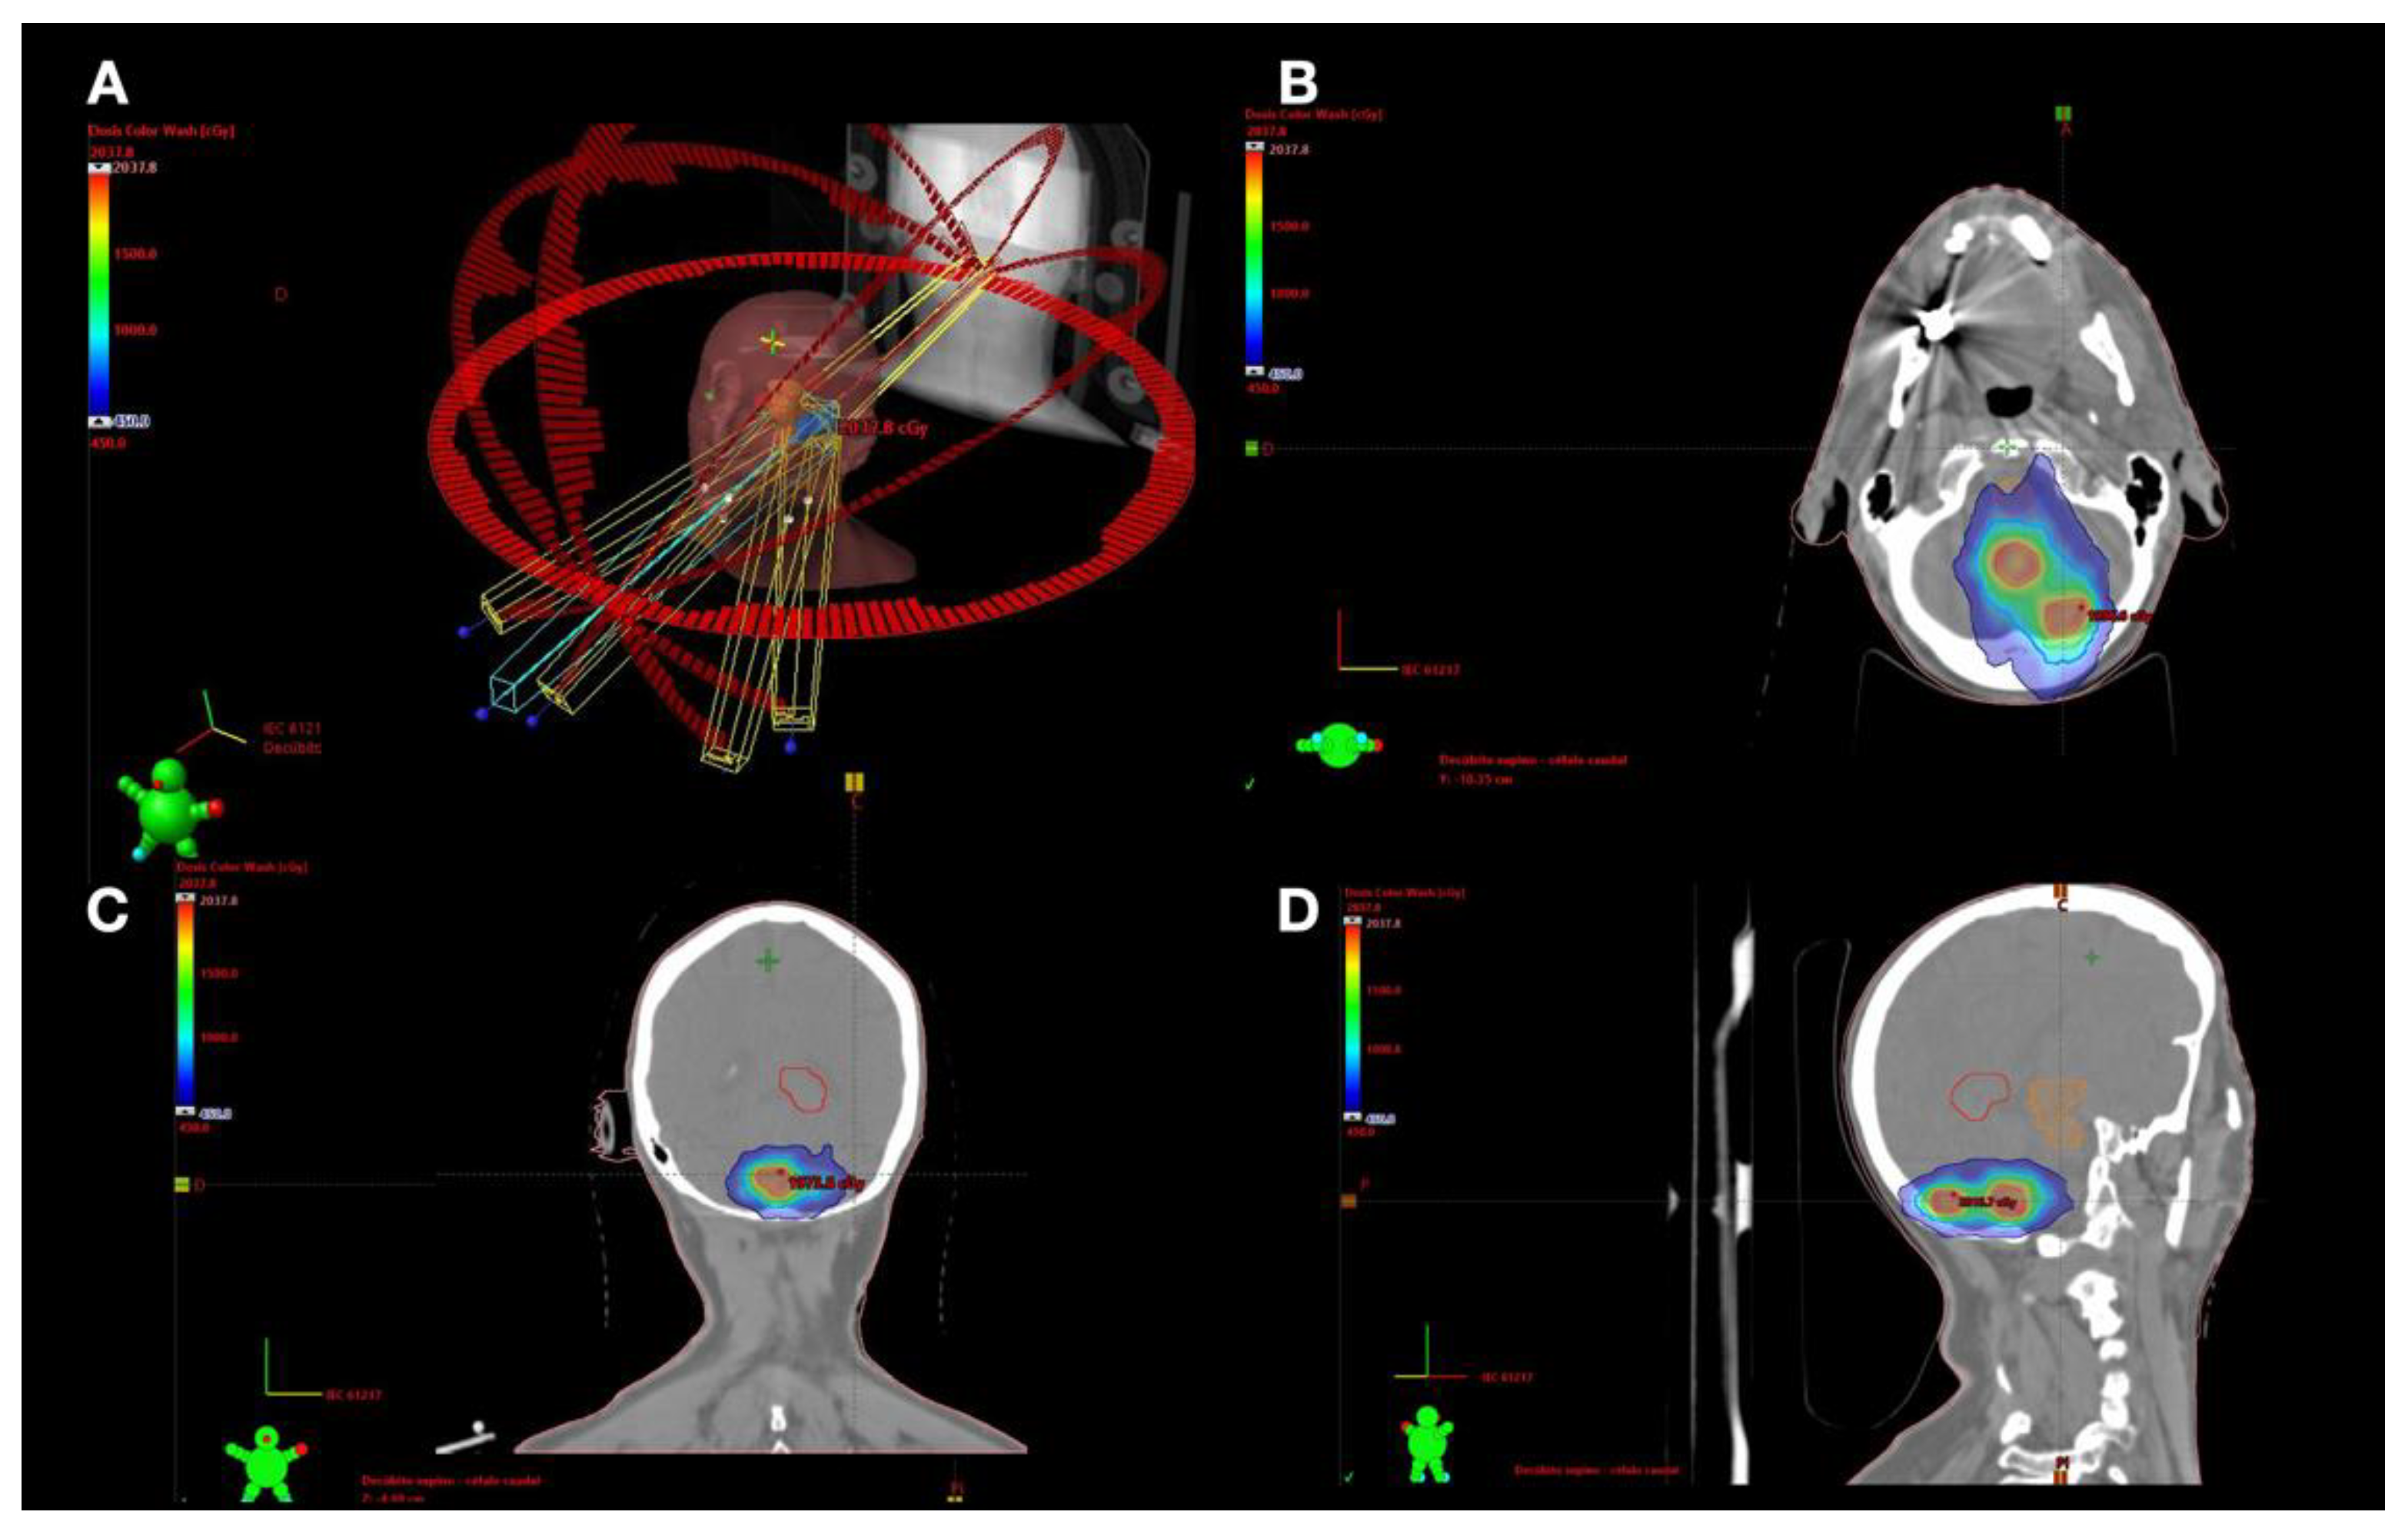
2.3. Treatment Technique
2.4. Statistical Analysis
3. Results
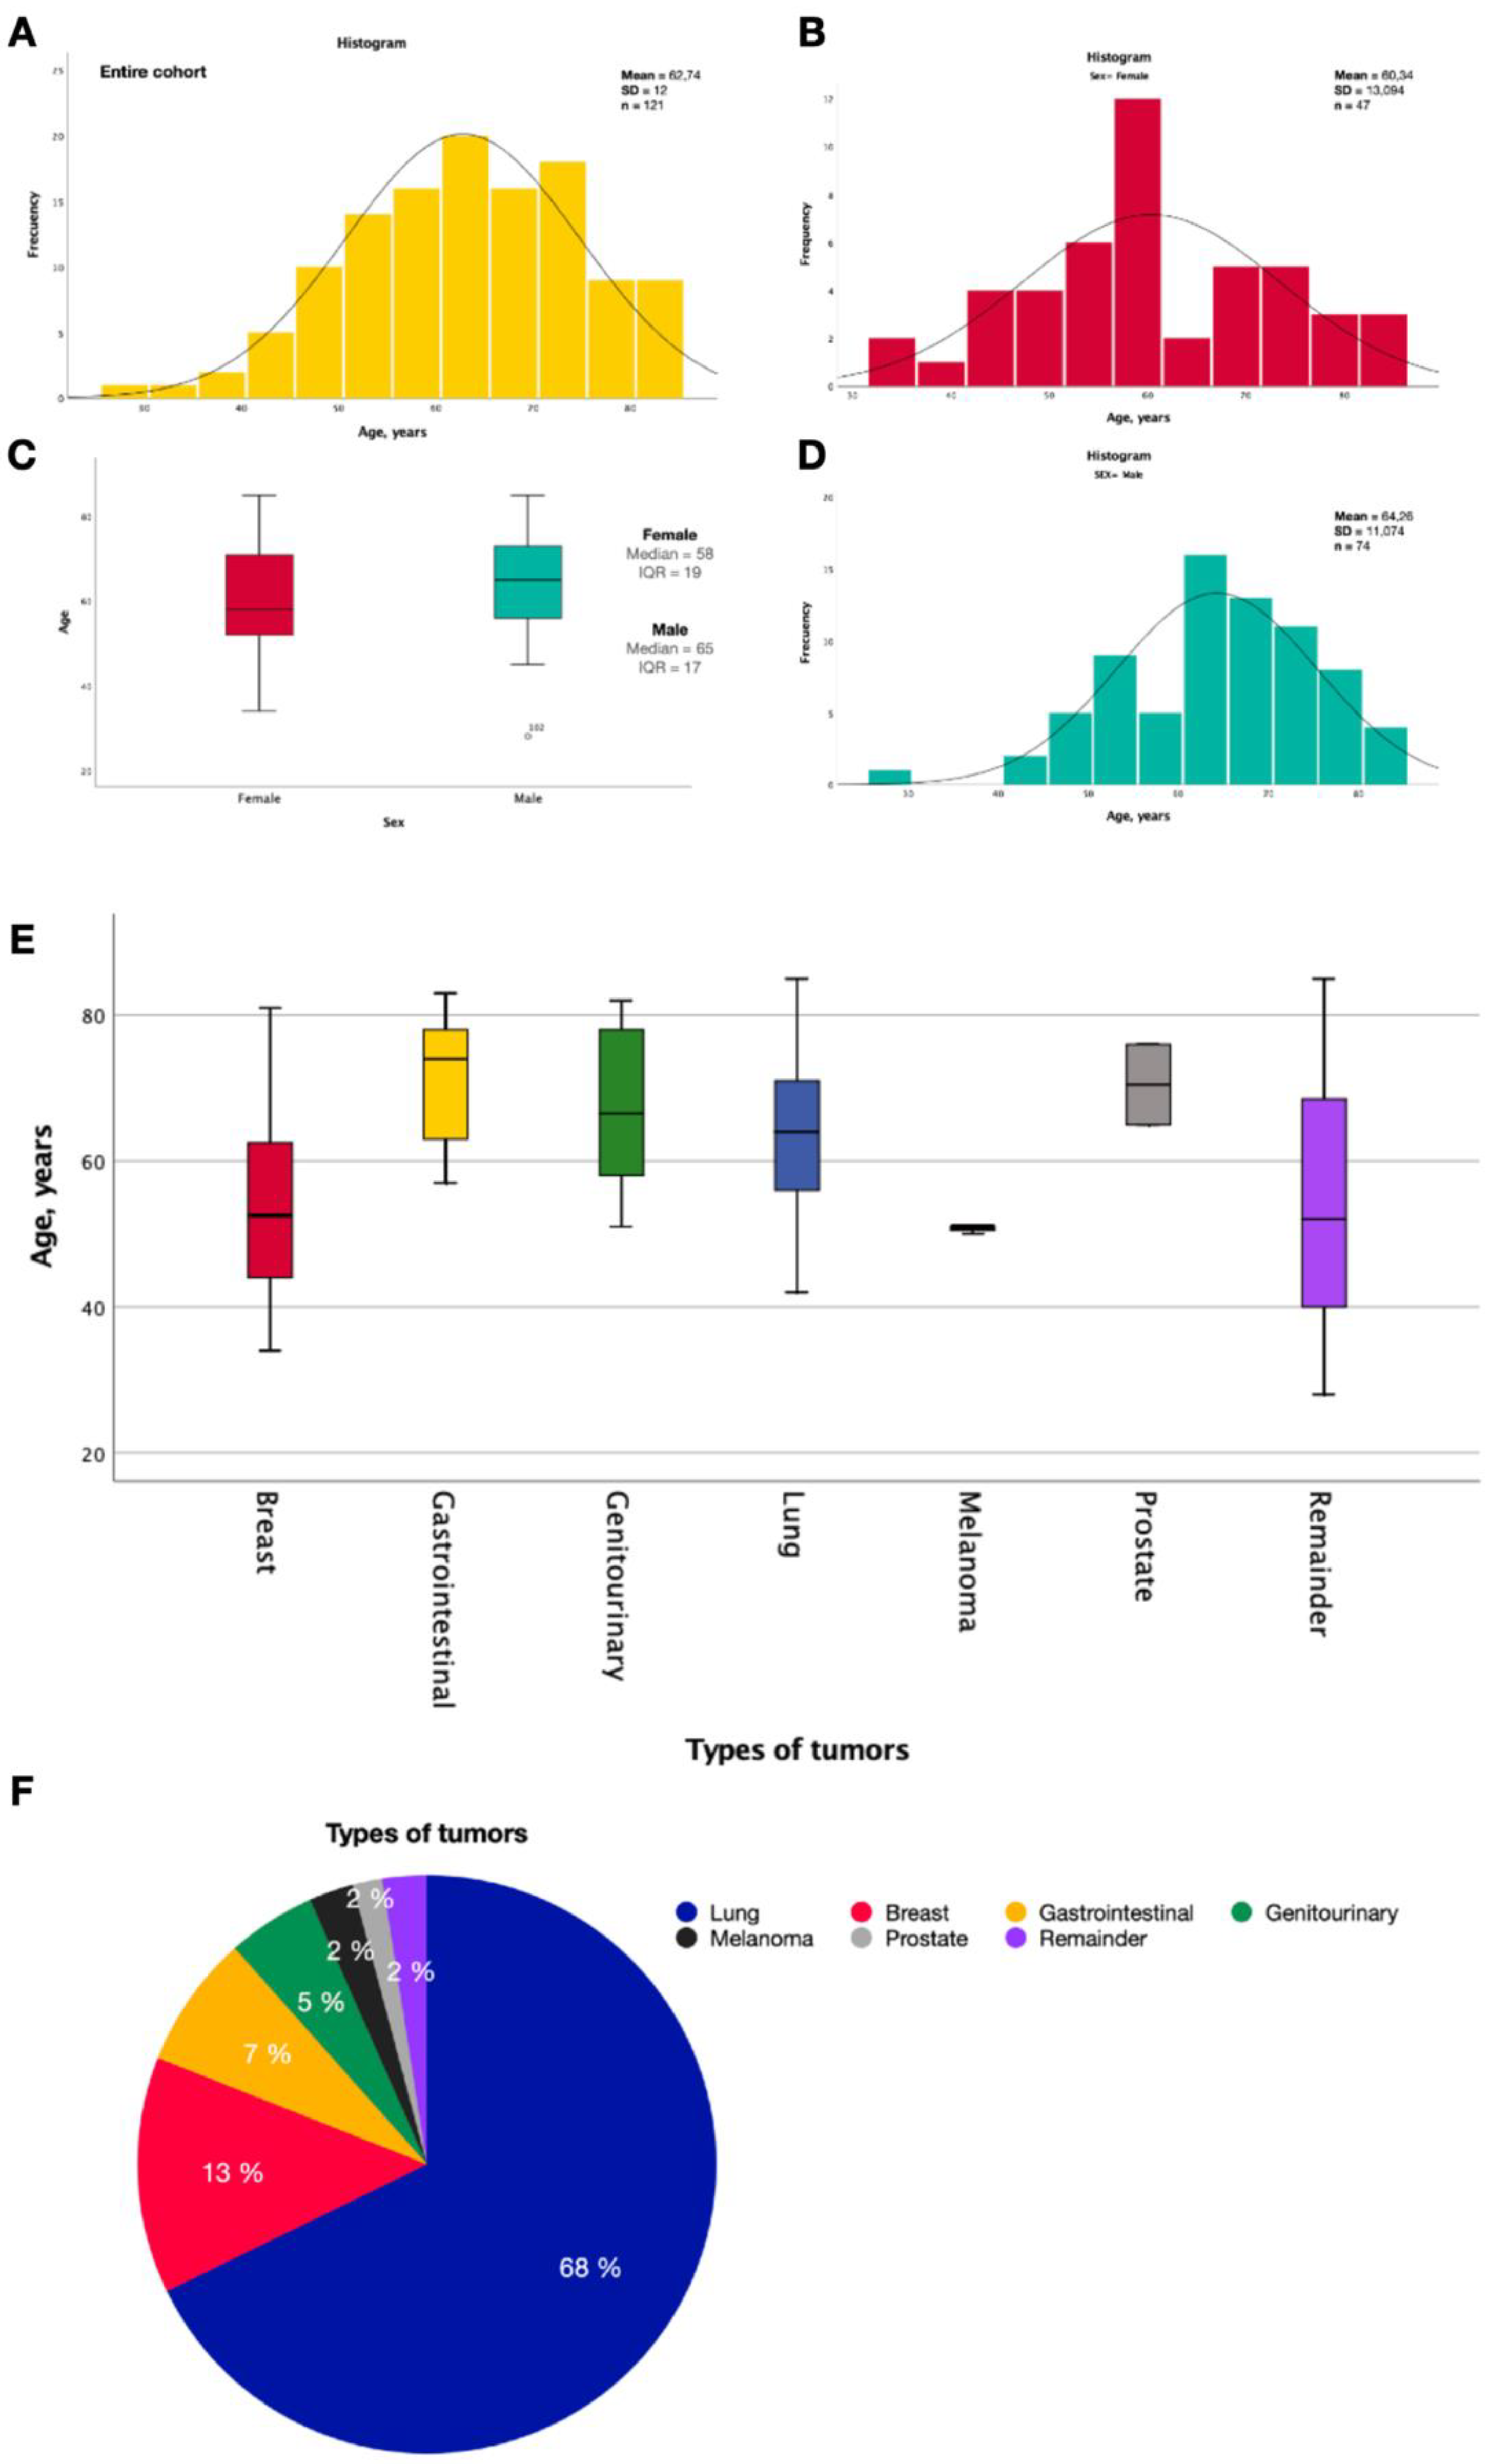
3.1. Demographic Characteristics
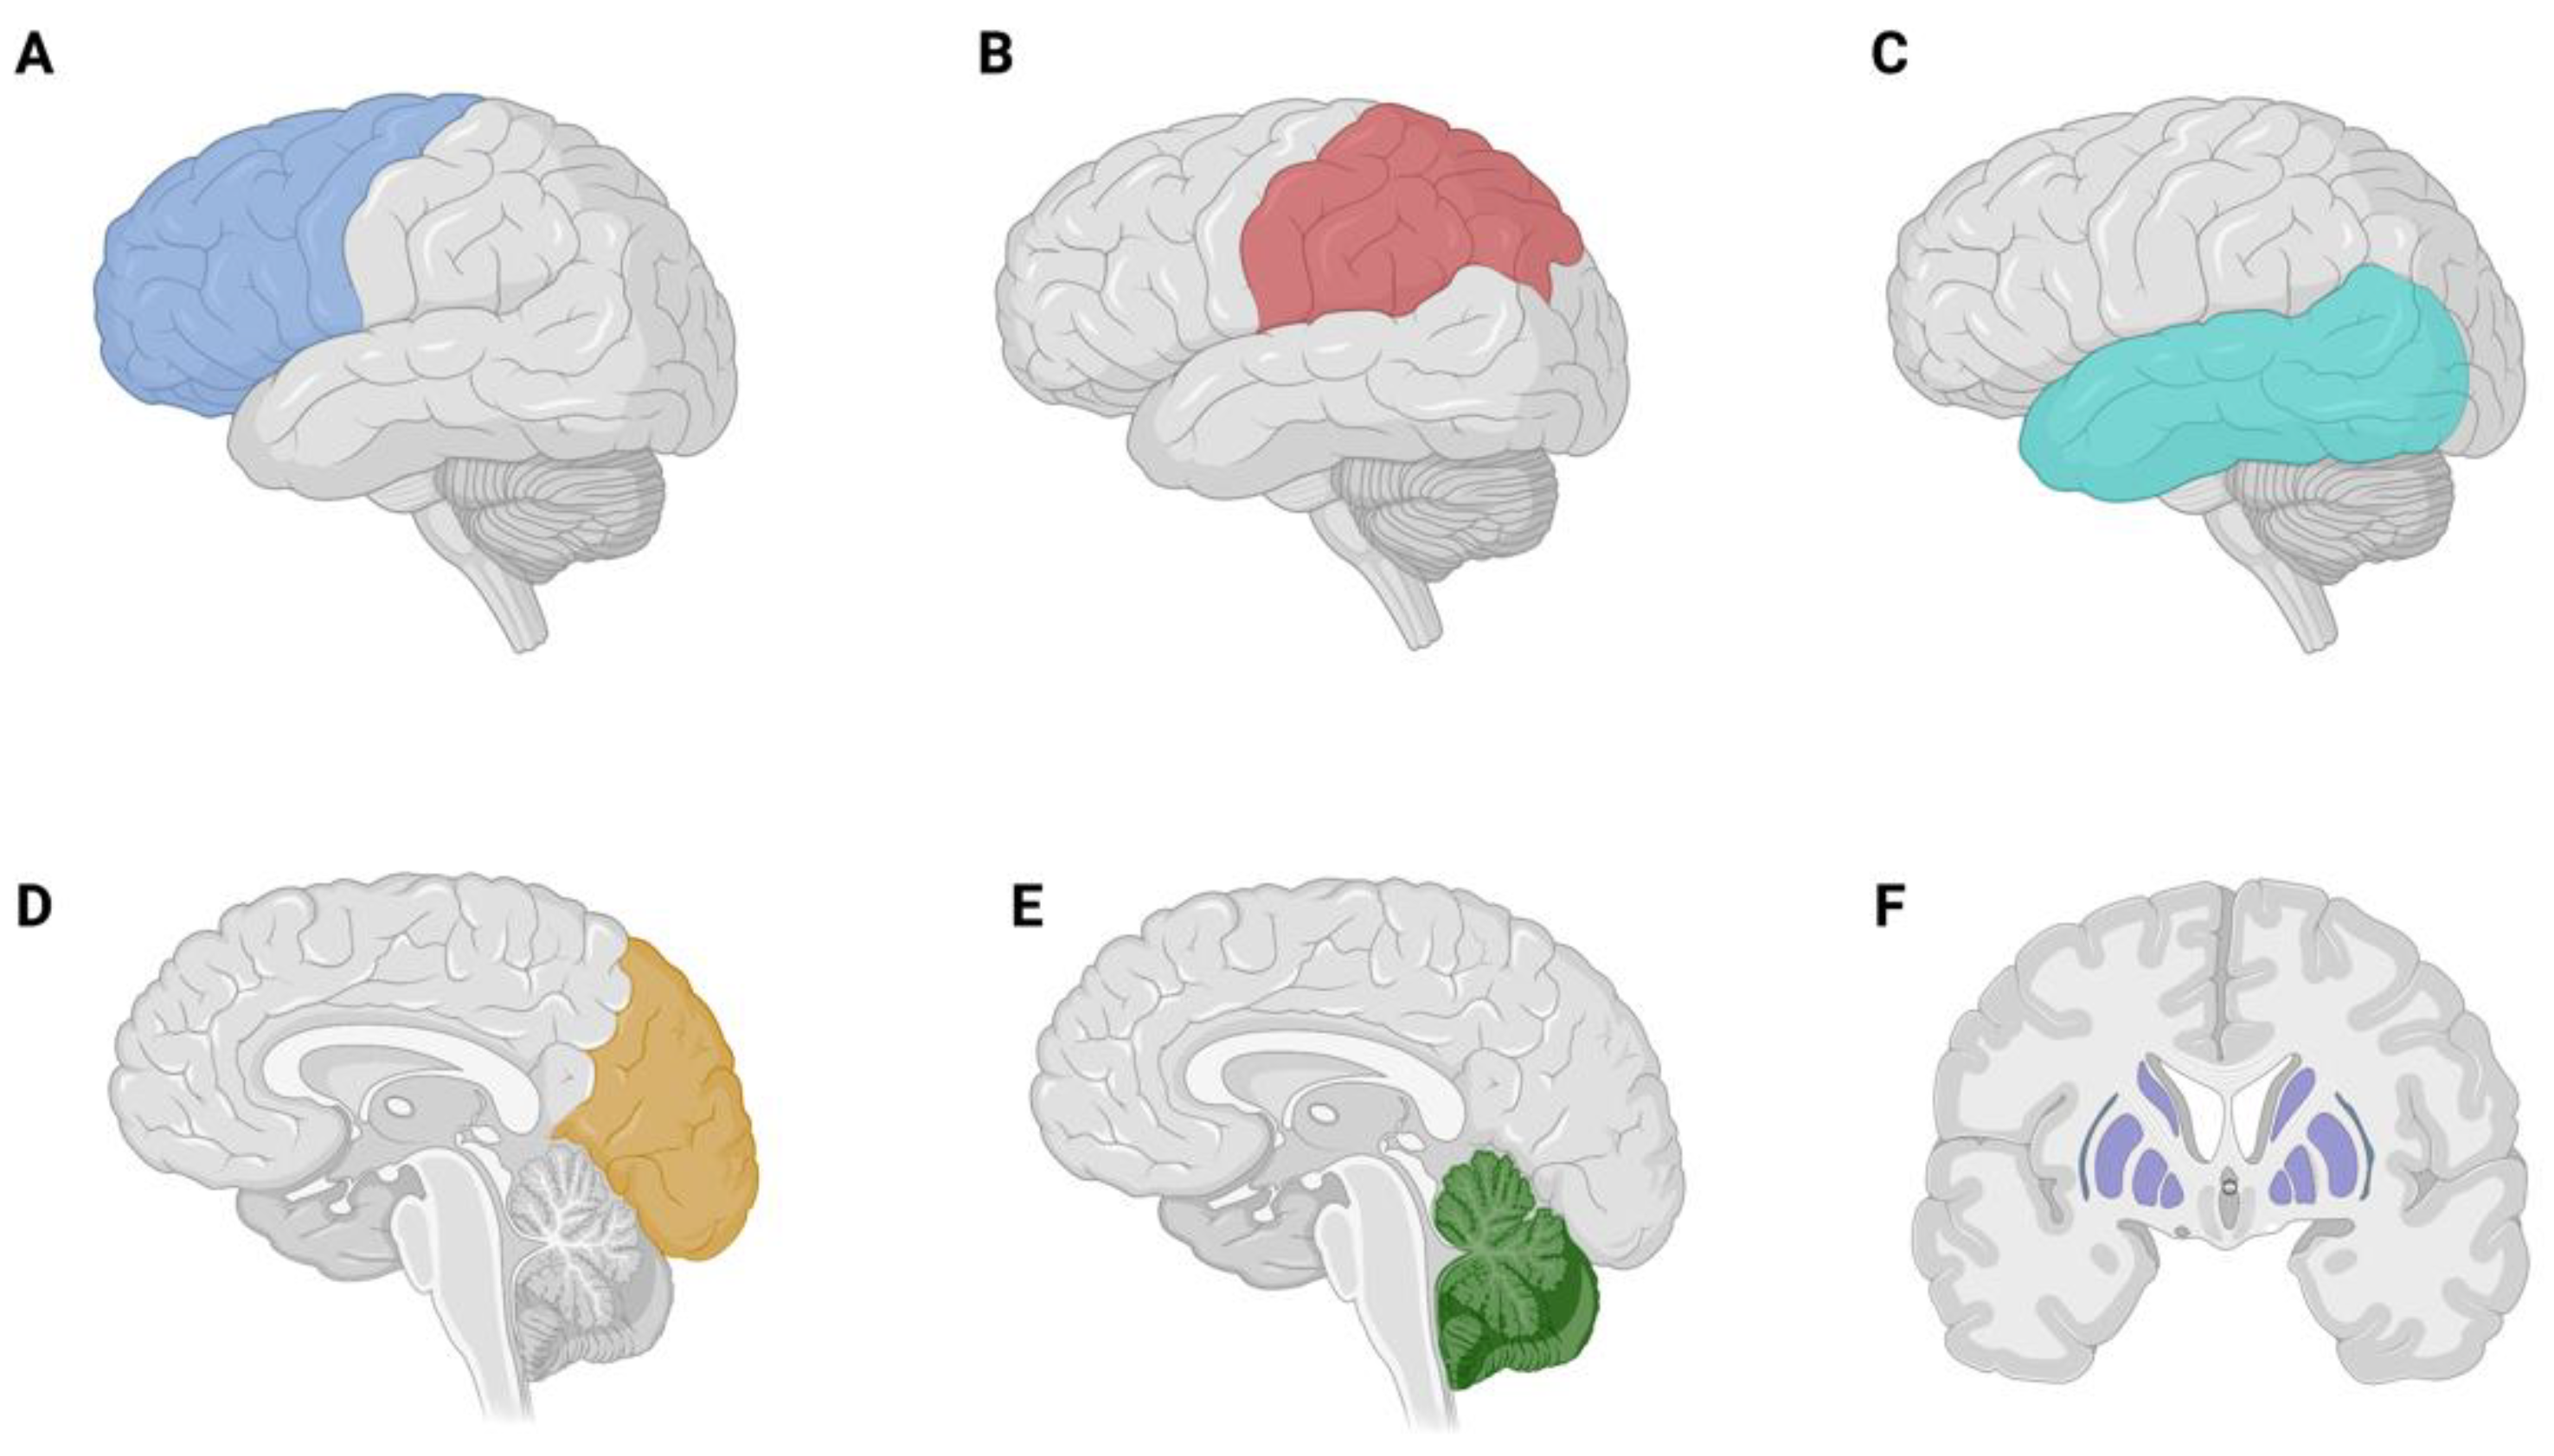
3.2. Brain Metastases
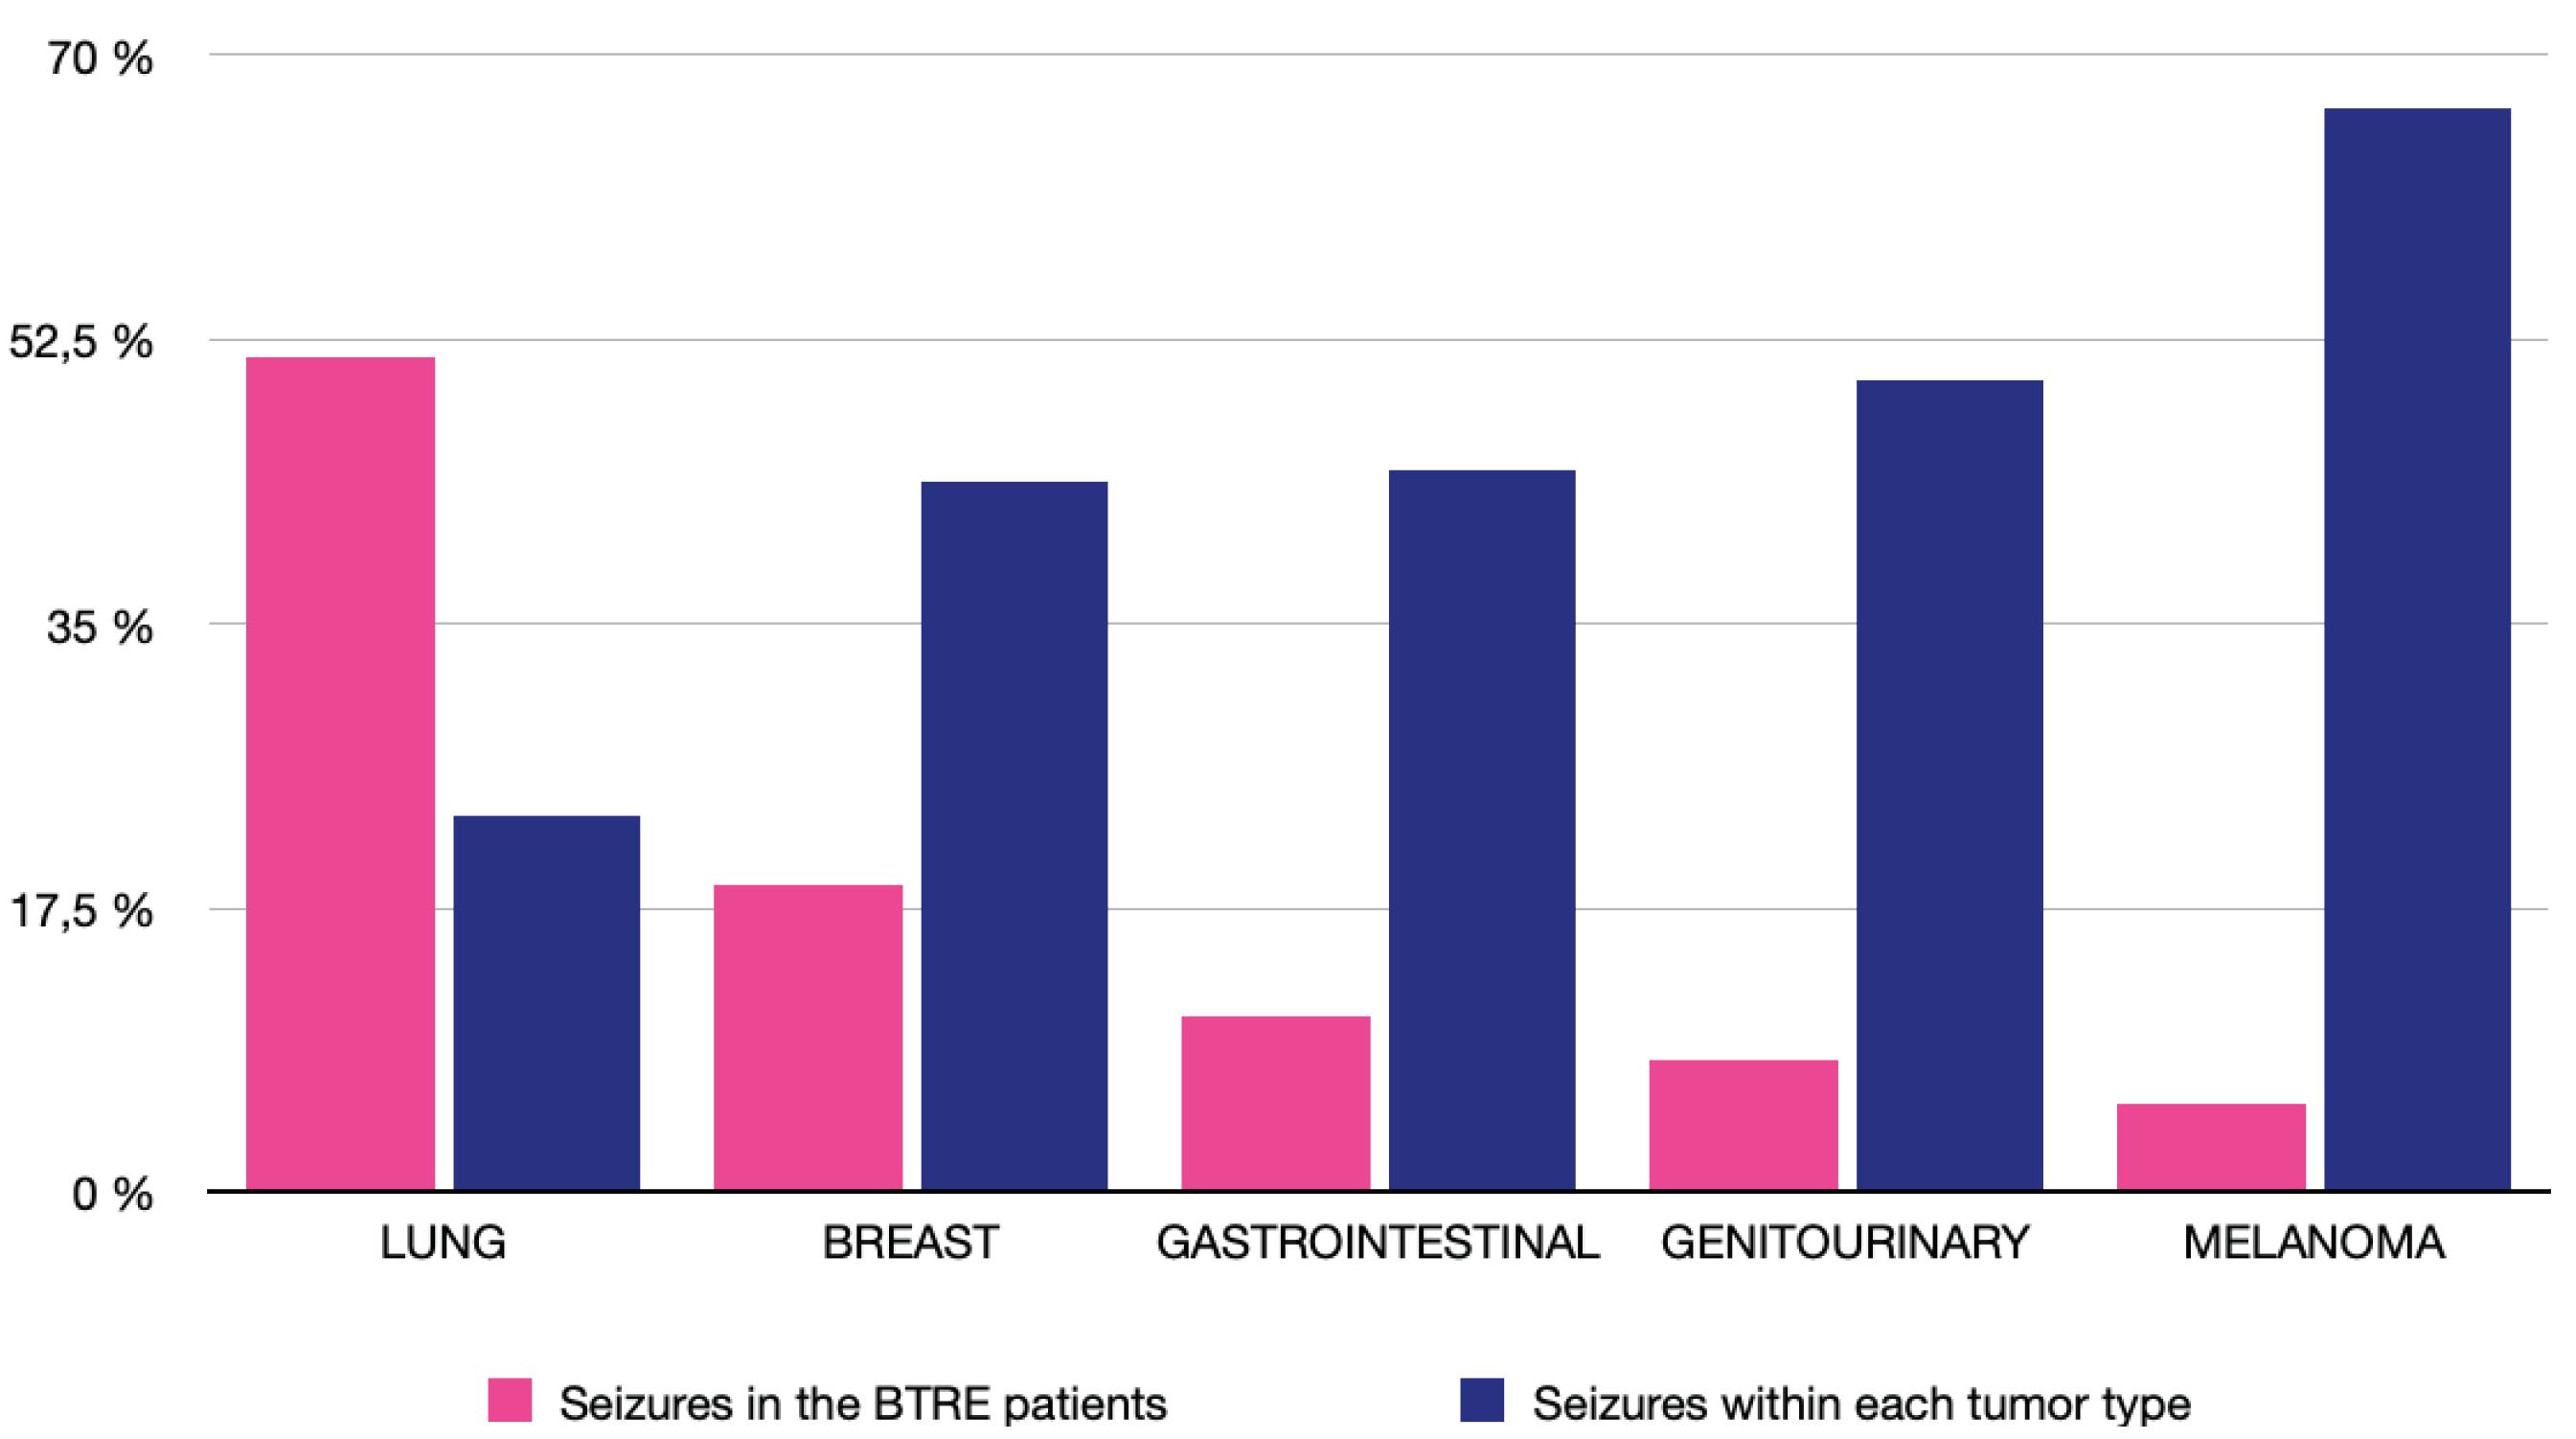
3.3. Brain Tumor Related Epilepsy
3.4. Survival Analysis
3.5. Local Control
4. Discussion
5. Conclusions
Author Contributions
Funding
Institutional Review Board Statement
Data Availability Statement
Acknowledgments
Conflicts of Interest
References
- Franchino, F.; Rudà, R.; Soffietti, R. Mechanisms and Therapy for Cancer Metastasis to the Brain. Front Oncol 2018, 8, 161. [Google Scholar] [CrossRef] [PubMed]
- Linskey, M.E.; Andrews, D.W.; Asher, A.L.; Burri, S.H.; Kondziolka, D.; Robinson, P.D.; Ammirati, M.; Cobbs, C.S.; Gaspar, L.E.; Loeffler, J.S.; et al. The role of stereotactic radiosurgery in the management of patients with newly diagnosed brain metastases: A systematic review and evidence-based clinical practice guideline. J. Neurooncol. 2010, 96, 45–68. [Google Scholar] [CrossRef]
- Davis, F.G.; Dolecek, T.A.; McCarthy, B.J.; Villano, J.L. Toward determining the lifetime occurrence of metastatic brain tumors estimated from 2007 United States cancer incidence data. Neuro. Oncol. 2012, 14, 1171–1177. [Google Scholar] [CrossRef] [PubMed]
- Tabouret, E.; Bauchet, L.; Carpentier, A.F. Brain metastases epidemiology and biology. Bull. Cancer 2013, 100, 57–62. [Google Scholar] [CrossRef]
- Witzel, I.; Oliveira-Ferrer, L.; Pantel, K.; Müller, V.; Wikman, H. Breast cancer brain metastases: Biology and new clinical perspectives. Breast Cancer Res. 2016, 18, 8. [Google Scholar] [CrossRef]
- Kotecki, N.; Lefranc, F.; Devriendt, D.; Awada, A. Therapy of breast cancer brain metastases: Challenges, emerging treatments and perspectives. Ther. Adv. Med. Oncol. 2018, 10, 1–10. [Google Scholar] [CrossRef] [PubMed]
- Chang, E.L.; Wefel, J.S.; Hess, K.R.; Allen, P.K.; Lang, F.F.; Kornguth, D.G.; Arbuckle, R.B.; Swint, J.M.; Shiu, A.S.; Maor, M.H.; et al. Neurocognition in patients with brain metastases treated with radiosurgery or radiosurgery plus whole-brain irradiation: A randomised controlled trial. Lancet Oncol. 2009, 10, 1037–1044. [Google Scholar] [CrossRef]
- Brown, P.D.; Jaeckle, K.; Ballman, K.V.; Farace, E.; Cerhan, J.H.; Anderson, S.K.; Carrero, X.W.; Barker, F.G.; Deming, R.; Burri, S.H.; et al. Effect of Radiosurgery Alone vs Radiosurgery With Whole Brain Radiation Therapy on Cognitive Function in Patients With 1 to 3 Brain Metastases. JAMA 2016, 316, 401–409. [Google Scholar] [CrossRef]
- Serna, A.; Escolar, P.P.; Puchades, V.; Mata, F.; Ramos, D.; Gómez, M.A.; Iglesias, A.; Salinas, J.; Alcaraz, M. Single fraction volumetric modulated arc radiosurgery of brain metastases. Clin. Transl. Oncol. 2015, 17, 596–603. [Google Scholar] [CrossRef]
- Matuszak, M.M.; Yan, D.; Grills, I.; Martinez, A. Clinical applications of volumetric modulated arc therapy. Int. J. Radiat. Oncol. Biol. Phys. 2010, 77, 608–616. [Google Scholar] [CrossRef]
- Sánchez-Villalobos, J.M.; Serna-Berna, A.; Salinas-Ramos, J.; Escolar-Pérez, P.P.; Martínez-Alonso, E.; Achel, D.G.; Alcaraz, M. Volumetric modulated arc radiosurgery for brain metastases from breast cancer: A single-center study. Colomb. medica (Cali, Colomb. 2021, 52. [Google Scholar] [CrossRef]
- Liu, J.L.; Walker, E.V.; Paudel, Y.R.; Davis, F.G.; Yuan, Y. Brain Metastases among Cancer Patients Diagnosed from 2010–2017 in Canada: Incidence Proportion at Diagnosis and Estimated Lifetime Incidence. Curr. Oncol. 2022, Vol. 29, Pages 2091-2105 2022, 29, 2091–2105. [Google Scholar] [CrossRef]
- Soffietti, R.; Abacioglu, U.; Baumert, B.; Combs, S.E.; Kinhult, S.; Kros, J.M.; Marosi, C.; Metellus, P.; Radbruch, A.; Freixa, S.S.V.; et al. Diagnosis and treatment of brain metastases from solid tumors: Guidelines from the European Association of Neuro-Oncology (EANO). Neuro. Oncol. 2017, 19, 162–174. [Google Scholar] [CrossRef] [PubMed]
- Sánchez-Villalobos, J.M.; Aledo-Serrano, Á.; Serna-Berna, A.; Salinas-Ramos, J.; Martínez-Alonso, E.; Pérez-Vicente, J.A.; Alcaraz-Baños, M. Antiseizure medication for brain metastasis-related epilepsy: Findings of optimal choice from a retrospective cohort. Epilepsy Res. 2021, 178, 106812. [Google Scholar] [CrossRef]
- Sánchez-Villalobos, J.M.; Aledo-Serrano, Á.; Villegas-Martínez, I.; Shaikh, M.F.; Alcaraz, M. Epilepsy treatment in neuro-oncology: A rationale for drug choice in common clinical scenarios. Front. Pharmacol. 2022, 13. [Google Scholar] [CrossRef] [PubMed]
- Mainwaring, W.; Bowers, J.; Pham, N.; Pezzi, T.; Shukla, M.; Bonnen, M.; Ludwig, M. Stereotactic Radiosurgery Versus Whole Brain Radiation Therapy: A Propensity Score Analysis and Predictors of Care for Patients With Brain Metastases From Breast Cancer. Clin. Breast Cancer 2019, 19, e343–e351. [Google Scholar] [CrossRef]
- Marcrom, S.R.; McDonald, A.M.; Thompson, J.W.; Popple, R.A.; Riley, K.O.; Markert, J.M.; Willey, C.D.; Bredel, M.; Fiveash, J.B. Fractionated stereotactic radiation therapy for intact brain metastases. Adv. Radiat. Oncol. 2017, 2, 564–571. [Google Scholar] [CrossRef]
- Sperduto, P.W.; Mesko, S.; Li, J.; Cagney, D.; Aizer, A.; Lin, N.U.; Nesbit, E.; Kruser, T.J.; Chan, J.; Braunstein, S.; et al. Survival in Patients With Brain Metastases: Summary Report on the Updated Diagnosis-Specific Graded Prognostic Assessment and Definition of the Eligibility Quotient. J. Clin. Oncol. 2020, 38, 3773–3784. [Google Scholar] [CrossRef]
- Sperduto, P.W.; Berkey, B.; Gaspar, L.E.; Mehta, M.; Curran, W. A new prognostic index and comparison to three other indices for patients with brain metastases: An analysis of 1,960 patients in the RTOG database. Int. J. Radiat. Oncol. Biol. Phys. 2008, 70, 510–514. [Google Scholar] [CrossRef]
- Qian, J.M.; Mahajan, A.; Yu, J.B.; Tsiouris, A.J.; Goldberg, S.B.; Kluger, H.M.; Chiang, V.L.S. Comparing available criteria for measuring brain metastasis response to immunotherapy. J. Neurooncol. 2017, 132, 479–485. [Google Scholar] [CrossRef]
- Sánchez-Villalobos, J.M.; Serna-Berna, A.; Salinas-Ramos, J.; Escolar-Pérez, P.P.; Martínez-Alonso, E.; Achel, D.G.; Alcaraz, M. Volumetric modulated arc radiosurgery for brain metastases from breast cancer: A single-center study. Colomb. Med. 2021, 52, e2004567. [Google Scholar] [CrossRef]
- Quan, E.M.; Li, X.; Li, Y.; Wang, X.; Kudchadker, R.J.; Johnson, J.L.; Kuban, D.A.; Lee, A.K.; Zhang, X. A Comprehensive Comparison of IMRT and VMAT Plan Quality for Prostate Cancer Treatment. Int. J. Radiat. Oncol. 2012, 83, 1169–1178. [Google Scholar] [CrossRef] [PubMed]
- Audet, C.; Poffenbarger, B.A.; Chang, P.; Jackson, P.S.; Lundahl, R.E.; Ryu, S.I.; Ray, G.R. Evaluation of volumetric modulated arc therapy for cranial radiosurgery using multiple noncoplanar arcs. Med. Phys. 2011, 38, 5863–5872. [Google Scholar] [CrossRef]
- Sacks, P.; Rahman, M. Epidemiology of Brain Metastases. Neurosurg. Clin. N. Am. 2020, 31, 481–488. [Google Scholar] [CrossRef] [PubMed]
- Cacho-Díaz, B.; Lorenzana-Mendoza, N.A.; Chávez-Hernandez, J.D.; González-Aguilar, A.; Reyes-Soto, G.; Herrera-Gómez, Á. Clinical manifestations and location of brain metastases as prognostic markers. Curr. Probl. Cancer 2019, 43, 312–323. [Google Scholar] [CrossRef] [PubMed]
- Quattrocchi, C.C.; Errante, Y.; Gaudino, C.; Mallio, C.A.; Giona, A.; Santini, D.; Tonini, G.; Zobel, B.B. Spatial brain distribution of intra-axial metastatic lesions in breast and lung cancer patients. J. Neurooncol. 2012, 110, 79–87. [Google Scholar] [CrossRef] [PubMed]
- Hengel, K.; Sidhu, G.; Choi, J.; Weedon, J.; Nwokedi, E.; Axiotis, C.A.; Song, X.; Braverman, A.S. Attributes of brain metastases from breast and lung cancer. Int. J. Clin. Oncol. 2013, 18, 396–401. [Google Scholar] [CrossRef]
- Tsukada, Y.; Fouad, A.; Pickren, J.W.; Lane, W.W. Central Nervous System Metastasis From Breast Carcinoma Autopsy Study. [CrossRef]
- Kyeong, S.; Cha, Y.J.; Ahn, S.G.; Suh, S.H.; Son, E.J.; Ahn, S.J. Subtypes of breast cancer show different spatial distributions of brain metastases. PLoS ONE 2017, 12, e0188542. [Google Scholar] [CrossRef]
- Ribatti, D.; Mangialardi, G.; Vacca, A. Stephen Paget and the “seed and soil” theory of metastatic dissemination. Clin. Exp. Med. 2006, 6, 145–149. [Google Scholar] [CrossRef]
- van Breemen, M.S.M.; Wilms, E.B.; Vecht, C.J. Epilepsy in patients with brain tumours: Epidemiology, mechanisms, and management. Lancet. Neurol. 2007, 6, 421–430. [Google Scholar] [CrossRef]
- Englot, D.J.; Chang, E.F.; Vecht, C.J. Epilepsy and brain tumors. In Handbook of Clinical Neurology; 2016; Volume 134, pp. 267–285. [Google Scholar]
- Goldstein, E.D.; Feyissa, A.M. Brain tumor related-epilepsy. Neurol. Neurochir. Pol. 2018, 52, 436–447. [Google Scholar] [CrossRef]
- Singh, R.; Stoltzfus, K.C.; Chen, H.; Louie, A.V.; Lehrer, E.J.; Horn, S.R.; Palmer, J.D.; Trifiletti, D.M.; Brown, P.D.; Zaorsky, N.G. Epidemiology of synchronous brain metastases. Neuro-oncology Adv. 2020, 2, 1–10. [Google Scholar] [CrossRef] [PubMed]
- Wolpert, F.; Lareida, A.; Terziev, R.; Grossenbacher, B.; Neidert, M.C.; Roth, P.; Poryazova, R.; Imbach, L.L.; Le Rhun, E.; Weller, M. Risk factors for the development of epilepsy in patients with brain metastases. Neuro. Oncol. 2020, 22, 718. [Google Scholar] [CrossRef] [PubMed]
- Puri, P.R.; Johannsson, B.; Seyedi, J.F.; Halle, B.; Schulz, M.; Pedersen, C.B.; Kristensen, B.W.; Poulsen, F.R. The risk of developing seizures before and after surgery for brain metastases. Clin. Neurol. Neurosurg. 2020, 193. [Google Scholar] [CrossRef]
- Witteler, J.; Kjaer, T.W.; Tvilsted, S.; Schild, S.E.; Rades, D. Pre-Treatment Seizures in Patients With 1-3 Cerebral Metastases Receiving Local Therapies Plus Whole-brain Radiotherapy. In Vivo 2020, 34, 2727–2731. [Google Scholar] [CrossRef] [PubMed]
- Maschio, M.; Maialetti, A.; Giannarelli, D.; Koudriavtseva, T.; Galiè, E.; Fabi, A. Impact of epilepsy and its treatment on brain metastasis from solid tumors: A retrospective study. Front. Neurol. 2022, 13, 2082. [Google Scholar] [CrossRef]
- Goldberg, S.B.; Gettinger, S.N.; Mahajan, A.; Chiang, A.C.; Herbst, R.S.; Sznol, M.; Tsiouris, A.J.; Cohen, J.; Vortmeyer, A.; Jilaveanu, L.; et al. A Phase II trial of pembrolizumab for patients with melanoma or non-small cell lung cancer and untreated brain metastases. Lancet. Oncol. 2016, 17, 976–983. [Google Scholar] [CrossRef]
- Eisenhauer, E.A.; Therasse, P.; Bogaerts, J.; Schwartz, L.H.; Sargent, D.; Ford, R.; Dancey, J.; Arbuck, S.; Gwyther, S.; Mooney, M.; et al. New response evaluation criteria in solid tumours: Revised RECIST guideline (version 1.1). Eur. J. Cancer 2009, 45, 228–247. [Google Scholar] [CrossRef]
- Sánchez-Villalobos, J.M.; Serna-Berna, A.; Salinas-Ramos, J.; Escolar-Pérez, P.P.; Martínez-Alonso, E.; Achel, D.G.; Alcaraz, M. Volumetric modulated arc radiosurgery for brain metastases from breast cancer: A single-center study. Colomb. Med. 2021, 52. [Google Scholar] [CrossRef]
- Chukwueke, U.N.; Wen, P.Y. Use of the Response Assessment in Neuro-Oncology (RANO) criteria in clinical trials and clinical practice. CNS Oncol. 2019, 8, CNS28. [Google Scholar] [CrossRef]
- Bashir, A.; Hodge, C.J.; Dababneh, H.; Hussain, M.; Hahn, S.; Canute, G.W. Impact of the number of metastatic brain lesions on survival after Gamma Knife radiosurgery. J. Clin. Neurosci. 2014, 21, 1928–1933. [Google Scholar] [CrossRef]
- Kim, G.J.; Buckley, E.D.; Herndon, J.E.; Allen, K.J.; Dale, T.S.; Adamson, J.D.; Lay, L.; Giles, W.M.; Rodrigues, A.E.; Wang, Z.; et al. Outcomes in Patients With 4 to 10 Brain Metastases Treated With Dose-Adapted Single-Isocenter Multitarget Stereotactic Radiosurgery: A Prospective Study. Adv. Radiat. Oncol. 2021, 6. [Google Scholar] [CrossRef]
- Park, K.; Bae, G.H.; Kim, W.K.; Yoo, C.J.; Park, C.W.; Kim, S.K.; Cha, J.; Kim, J.W.; Jung, J. Radiotherapy for brain metastasis and long-term survival. Sci. Rep. 2021, 11, 8046. [Google Scholar] [CrossRef] [PubMed]
- Mangesius, J.; Seppi, T.; Bates, K.; Arnold, C.R.; Minasch, D.; Mangesius, S.; Kerschbaumer, J.; Lukas, P.; Ganswindt, U.; Nevinny-Stickel, M. Hypofractionated and single-fraction radiosurgery for brain metastases with sex as a key predictor of overall survival. Sci. Reports 2021 111 2021, 11, 1–8. [Google Scholar] [CrossRef] [PubMed]
- Wegner, R.E.; Olson, A.C.; Kondziolka, D.; Niranjan, A.; Lundsford, L.D.; Flickinger, J.C. Stereotactic Radiosurgery for Patients With Brain Metastases From Small Cell Lung Cancer. Int. J. Radiat. Oncol. 2011, 81, e21–e27. [Google Scholar] [CrossRef] [PubMed]
- Sperduto, P.W.; Berkey, B.; Gaspar, L.E.; Mehta, M.; Curran, W. A new prognostic index and comparison to three other indices for patients with brain metastases: An analysis of 1,960 patients in the RTOG database. Int. J. Radiat. Oncol. Biol. Phys. 2008, 70, 510–514. [Google Scholar] [CrossRef]
| Age, years | |||
| Median (IQR) | 63 | (17) | |
| Sex, n (%) | Female | 47 | (38.8) |
| Male | 74 | (61.1) | |
| Primary tumor, n (%) | Total cohort | 121 | (100) |
| Lung | Total lung cohort | 82 | (67.8) |
| NSCLC adenocarcinoma NSCLC Non adenocarcinoma SCLC |
56 18 8 |
(46.3) (14.9) (6.6) |
|
| Total breast cohort | 16 | (13.2) | |
| Breast | HER2+/HR+ HER2+/HR- HER2-/HR+ HER2-/HR- Sarcoma |
7 3 2 3 1 |
(5.8) (2.5) (1.7) (2.5) (0.8) |
| Gastrointestinal | 8 | (6.6) | |
| Genitourinary | 7 | (5.8) | |
| Melanoma | Total BRAF negative/unknown BRAF positive |
3 1 2 |
(2.5) (0.8) (1.7) |
| Remainder | Prostate Choriocarcinoma Oropharynx Unknown |
2 1 1 1 |
(1.7) (0.8) (0.8) (0.8) |
| KPS score, n (%) | 100 - 90 80 - 70 <70 |
26 53 42 |
(21.5) (43.8) (34.7) |
| DS-GPA Class, n (%) | 0-1 1.5-2.0 2.5-3.0 3.5-4.0 |
38 43 32 8 |
(31.4) (35.5) (26.4) (6.6) |
| Epilepsy related to BMs, n (%) | Yes No |
37 84 |
(30.6) (69.4) |
| Overall survival, months | Median (IQR) | 7.72 | (0.905) |
| Extracranial metastases, n (%) | Yes No |
70 51 |
(57.9) (42.1) |
| Radiosurgery treatment, n (%) | Total BMs treated SRS Fractionated SRS (fSRS) |
229 206 23 |
(100) (90) (10) |
| Previous treatment, n (%) | None Surgery WBRT Prophylactic WBRT |
88 3 27 3 |
(72,7) (2.5) (22.3) (2.5) |
| Posterior treatment, n (%) | None WBRT Single or fractionated SRS SRS + WBRT Surgery |
84 15 14 7 1 |
(69.4) (12.4) (11.6) (5.8) (0.8) |
| PFBMs patients, n (%) | Patients with 1 or more PFBMs Patients without PFBMs |
29 92 |
(24) (76) |
|
BMs treated with SRS (First treatment) |
Median (IQR) Mean (SD) |
1.0 1.7 |
(1.0) (0.96) |
| Prescription dose BMs, Gy | SRS, median (IQR) fSRS, median (IQR) |
18 30 |
(0.8) (0.5) |
|
Gross tumor volume, cc (GTV) |
SRS, median (IQR) fSRS, median (IQR) |
0.8 4.1 |
(2) (10) |
|
Planning target volume, cc (PTV) |
SRS, median (IQR) fSRS, median (IQR) |
2.5 9.3 |
(5) (17) |
|
Cumulative tumor volume, cc (ΣGTV) |
Median (IQR) |
3.2 |
(6.0) |
| BED10-LQ, Gy | SRS, mean (SD) | 49.37 | (10.07) |
| fSRS, mean (SD) | 48.1 | (2.82) |
| Hazard Ratio (HR) |
95% CI | p-Value | |
|---|---|---|---|
| Univariate | |||
|
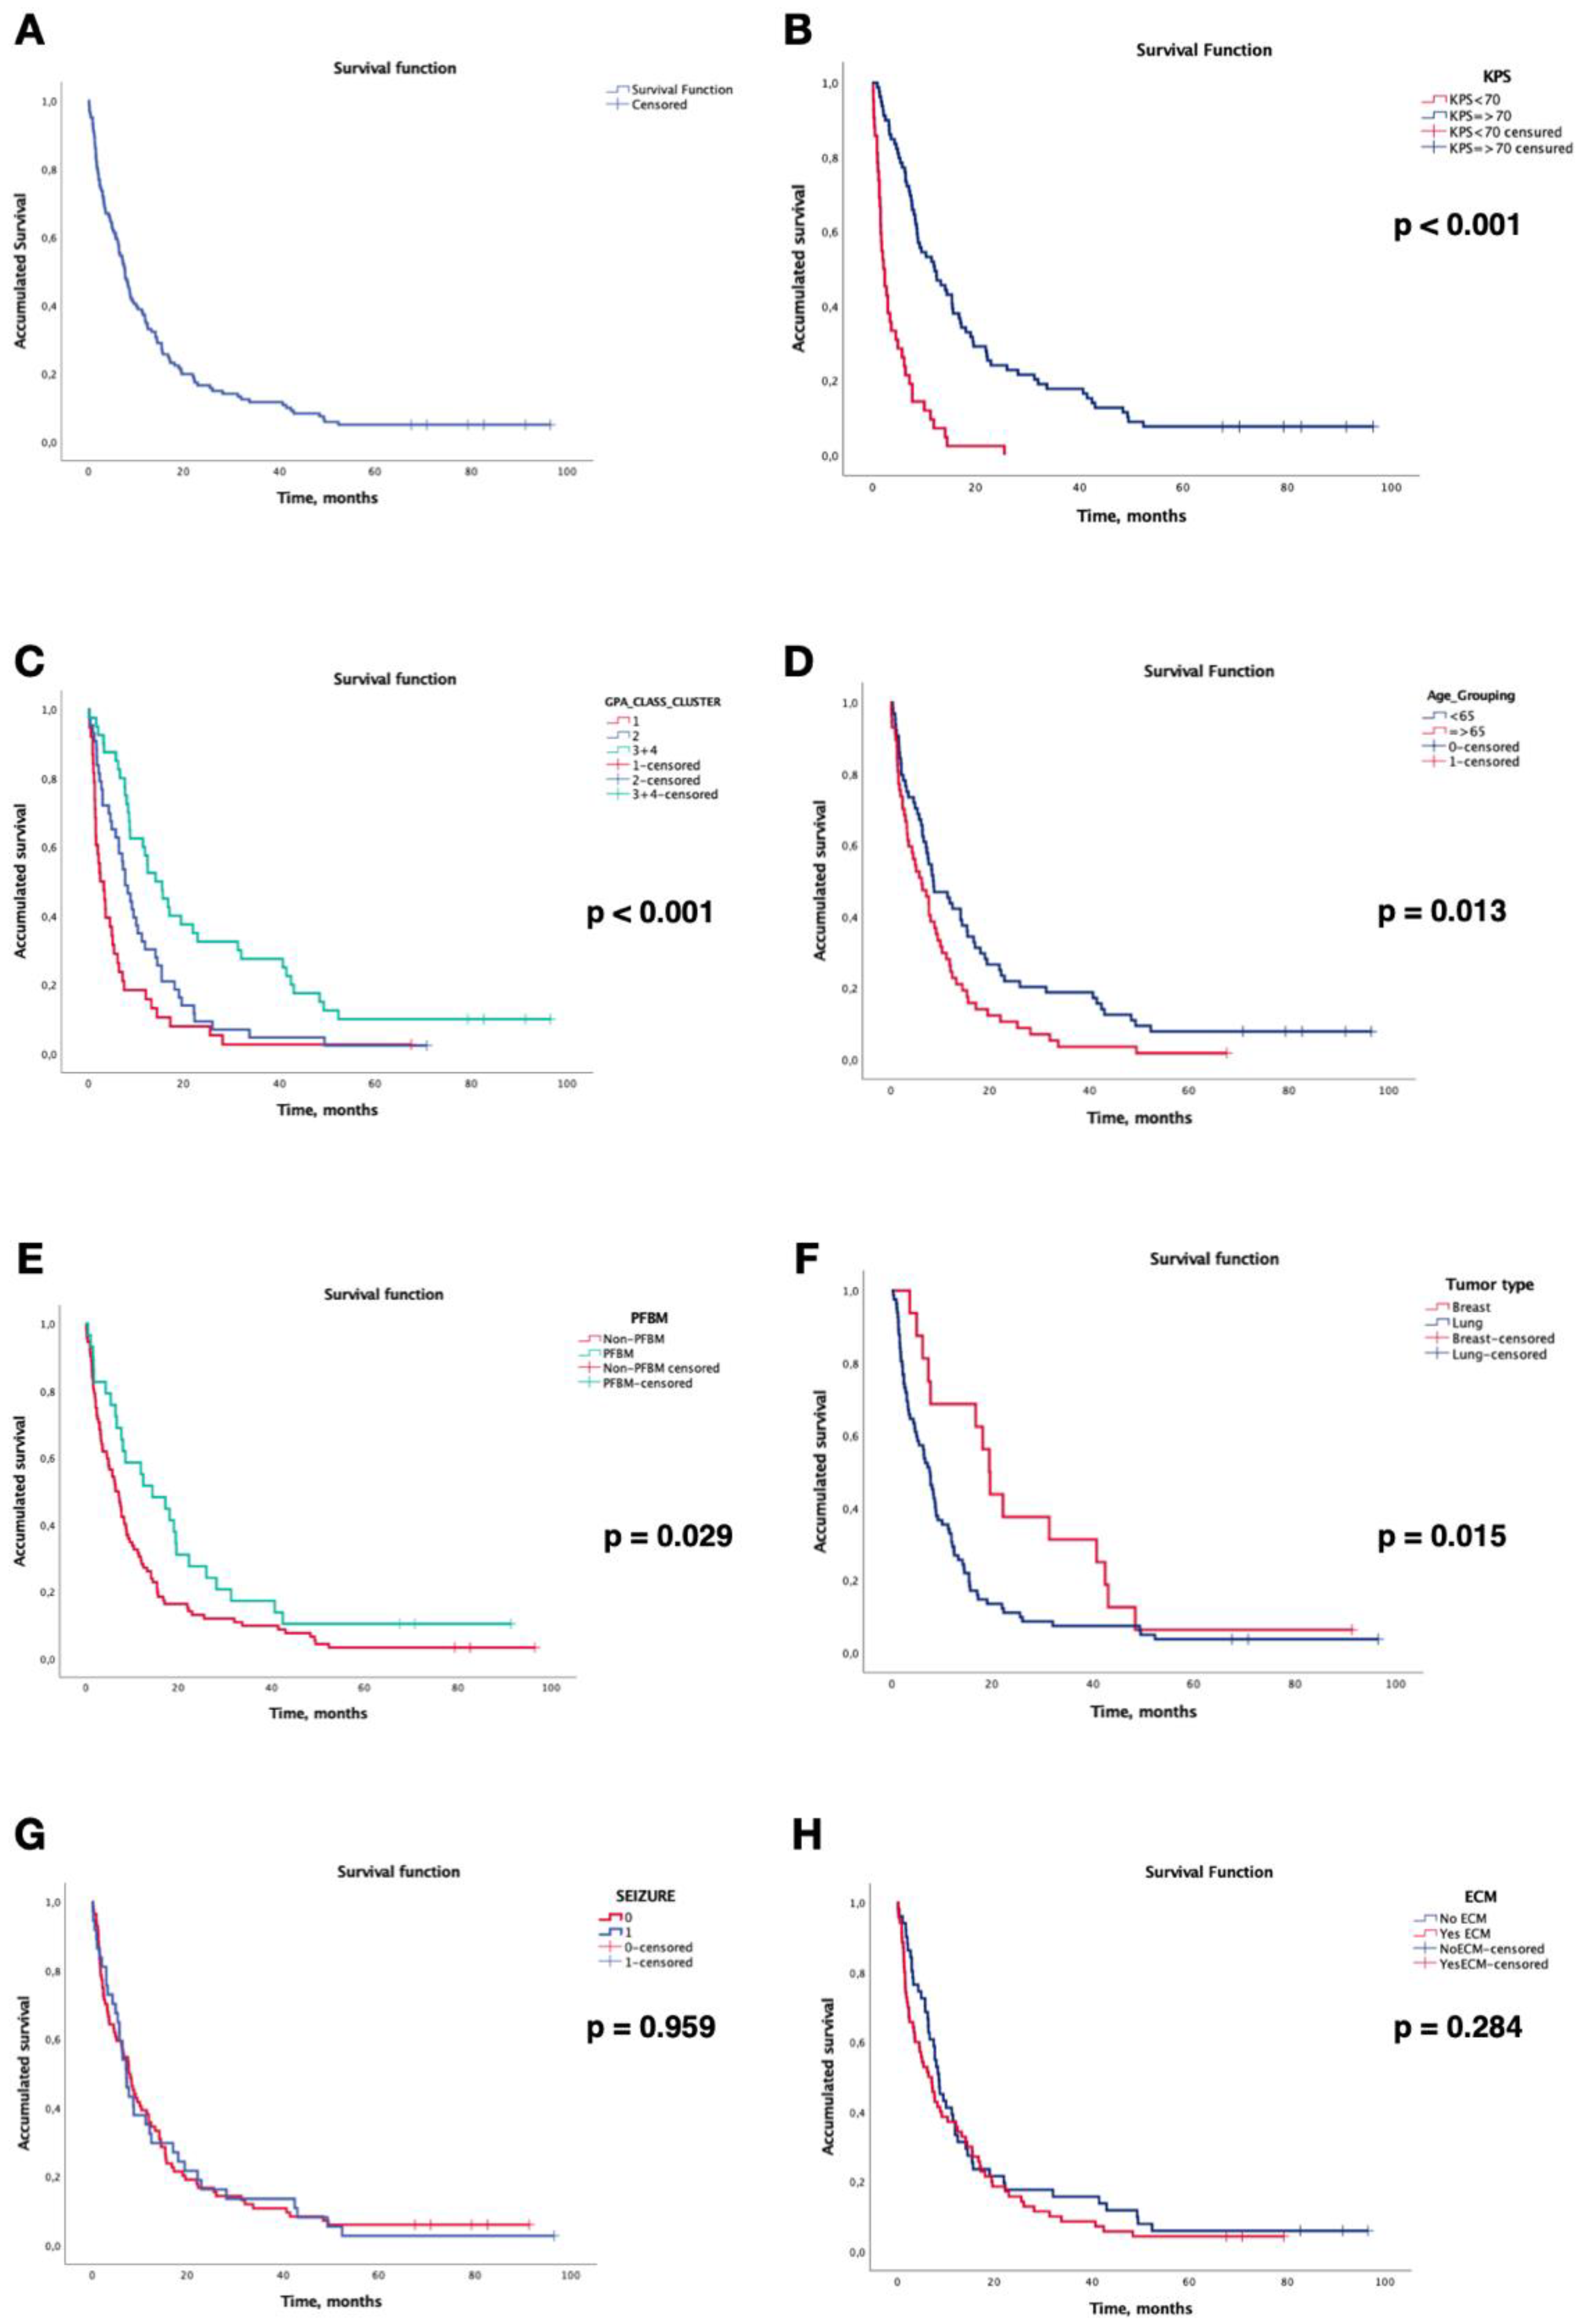
KPS KPS ≥70 KPS < 70 |
1 4.153 |
2.728 - 6.322 |
<0.001 |
|
DS-GPA Class Class I (0-1.0) Class II (1.5-2.0) Class III-IV (2.5-4.0) |
1 0.583 0.319 |
0.373 – 0.911 0.199 – 0.511 |
0.018 <0.001 |
|
Age < 65 years ≥ 65 years |
1 1.596 |
1.101 – 2.316 |
0.014 |
|
Posterior fossa BMs No Yes |
1 0.616 |
0.396 – 0.956 |
0.031 |
|
Primary tumor type Lung Breast |
1 0.505 |
0.289 – 0.885 |
0.017 |
|
Epilepsy related brain tumor Yes No |
1.010 1 |
0.681 – 1.499 |
0.959 |
|
Cumulative brain tumor ΣGTV ≥ 5 cc ΣGTV < 5 cc |
1.292 1 |
0.878 – 1.900 |
0.194 |
|
Extracranial metastasesY es No |
1.225 1 |
0.844 – 1.778 |
0.286 |
| Multivariate | |||
|
KPS KPS ≥70 KPS < 70 |
1 2.593 |
1.484 – 4.532 |
0.001 |
|
DS-GPA Class Class I (0-1.0) Class II (1.5-2.0) Class III-IV (2.5-4.0) |
1 0.548 0.378 |
0.328 – 0.915 0.189 – 0.756 |
0.022 0.006 |
|
Age < 65 years ≥ 65 years |
1 0.714 |
0.433 – 1.178 |
0.187 |
|
Posterior fossa BMs No Yes |
1 0.646 |
0.378 – 1.102 |
0.109 |
|
Primary tumor type Lung Breast |
1 0.731 |
0.403 – 1.327 |
0.303 |
Disclaimer/Publisher’s Note: The statements, opinions and data contained in all publications are solely those of the individual author(s) and contributor(s) and not of MDPI and/or the editor(s). MDPI and/or the editor(s) disclaim responsibility for any injury to people or property resulting from any ideas, methods, instructions or products referred to in the content. |
© 2023 by the authors. Licensee MDPI, Basel, Switzerland. This article is an open access article distributed under the terms and conditions of the Creative Commons Attribution (CC BY) license (http://creativecommons.org/licenses/by/4.0/).


