
Submitted:
02 August 2023
Posted:
03 August 2023
You are already at the latest version
Abstract
It is well known that fiber sizing is one of the most important component in the manufacturing of composites, and it does affect the mechanical properties including strength and stiffness. In this work, the influence of fiber sizing levels on the mechanical properties of carbon fibers (CF) is reported at room temperature by using single fiber tensile testing (Favimat+), single fiber pullout testing (SFPO), and interfacial elemental analysis using X-ray photoelectron spectroscopy (XPS). Standard modulus of CF (7±0.2 μm in diameter) were sized using two Michelman commercially available sizing formulations. The average solid content for each sizing formulation is 26.3 ± 0.2% and 34.1 ± 0.2%, respectively. HEXION RIMR 135 with curing agent RIMH 137 was used as a model thermoset epoxy matrix during the SFPO measurements. A predictive engineering fiber sizing methodology is also developed. Sizing amounts of 0.5, 1, and 2 wt. % on the surface of the fiber is achieved for both sizing formulations. For each fiber sizing level, 50 single fiber tensile testing experiments and 20 single fiber pull-out tests were conducted. The ultimate tensile strength (σult) of the carbon fibers and the interfacial shear strength (τ_app) of the single fiber composite were analyzed. it is also investigated the effect of the sizing levels on the interfacial shear stress and the O/C (Oxygen/Carbon) surface composition ratio. As a result, generalized fiber sizing and characterization methods were established. The developed methods can be used to characterize the strength and interfacial shear strength of any man-made fibers with different sizing formulations and solid contents, irrespective of the matrix i.e. thermoset or thermoplastic.
Keywords:
Carbon fiber
; thermoset
; sizing
; single fiber tensile testing
; single fiber pullout testing
; sizing levels
; X-ray photoelectron spectroscopy (XPS)
1. Introduction
In the last few decades, the research and manufacturing of man-made fibers such as carbon, glass, and aramid fibers have gained much interest due to their versatility [1,2,3,4,5,6]. Carbon fiber reinforced polymers (CFRPs) represent the highest-performance polymer-matrix composites in aircraft components, fuel-efficient automobiles, high performing pieces of machinery, improved construction materials, sustainable sources of energy components and new materials for smart infrastructure [1]. Additionally, CFRPs preserve their high tensile moduli and high strengths even when exposed to harsh environments at elevated temperatures while offering excellent electrical and thermal conductivity and displaying a relatively low coefficient of thermal expansion [1]. However, advancing carbon fiber properties has proven to be challenging under carbon fiber production complexity from designing and synthesizing polymer precursors to converting these polymers into carbon fiber with desired properties. It is also well-accepted that ultimate carbon fiber performance relies on the appropriate design of the precursor chemistry and structure. Over the last few decades, enormous academic and industrial research efforts have been devoted to carbon fiber developments across the globe. These efforts aimed to understand the fundamental aspects that link carbon fiber processing protocols (i.e., adapting low cost and energy reduction approaches) and their chemical composition with the ultimate carbon fiber specifications and target application [7].
Carbon fibers (CF) have significant advantages compared with other man-made fibers for their superior mechanical, thermal, and electrical properties [1]. Over the years, carbon fibers have been made from many different precursors, such as polyacrylonitrile (PAN), pitch, rayon, polyethylene, and lignin. PAN and pitch are the most favorable CF precursors for industrial applications with PAN accounting for some 90% of all production [6,7,8,9,10,11,12,13]. The collection of thousands of individual filaments is bundled together to form a tow, where the tow size can be varied based on the intended application.
The commercial production of carbon fiber reinforced plastic composites started in the late 19th century [1,6]. Subsequently, due to their versatility, they were adopted in many high-end applications, such as energy, aerospace, defense, oil and gas, and automotive [14,15,16,17,18]. In order to deliver a functional composite, the interfacial adhesion between the fiber and matrix must be studied and engineered towards the targeted application. This can be achieved in many ways, including surface treatment and sizing of the reinforcement fibers during the manufacturing process [19,20,21,22]. The sizing of carbon fibers is the step of the process where a thin film of organic polymer is applied to the fiber surface. The surface treatment and sizing of man-made fibers offer many advantages, such as improving the fiber/matrix adhesion and bonding properties, protecting fiber surface from damage during the processing and weaving stages, and enhancing the surface wettability of polymer matrices.
The fiber-matrix interface studies started to gain much research focus during the last decade particularly with the increased use of thermoplastic resins as the matrix. [23,24,25,26]. The interface is the boundary area that leads to stress transfer from one CF filament to another through the matrix [13,23,24,25,26]. Interfacial adhesion plays can follow various mechanisms that include chemical bonding, and mechanical bonding. If the interface layer area between the fiber and the matrix is weak, poor mechanical properties will be observed due to the lack of adhesion [23,24,25,26]. On the contrary, if the matrix and the CF adhesion are very strong, the final composite will be brittle. Consequently, interfacial adhesion is an optimization effort and not one of maximization. Surface engineering is therefore highly required to achieve the optimum level of adhesion.
The effect of carbon fiber surface treatment and sizing on the interfacial properties of different polymeric matrices has been studied [19,20,21,22,27]. Kamps et al. investigated the effect of electrolytic surface treatment parameters, such as current, potential, and conductivity, on the adhesion properties of carbon fiber-reinforced polycarbonate composites [20]. The approach used by Kamps et al. successfully revealed a 12% increase in the apparent interfacial shear strength due to the significant increase in polarity and hydroxyl, carboxyl, and nitrile groups on the fiber surface [20]. Another study was carried out by Zhang [13] and Drzal et al. [28] on the effect of sizing on the adhesion of carbon fibers to epoxy matrix. During their efforts, both groups concluded that the sizing layer had created an interface layer, which improved the interfacial shear strength.
This work will focus on evaluating the fiber-matrix interaction between carbon fibers with increasing sizing amounts of 0.5, 1, and 2 wt.%. Two commercially available polymer sizing dispersions were prepared with the required solid content (three for each dispersion) and applied to the carbon fiber roving by a specialized fiber-sizing machine. The effect of the sizing content on single fiber tensile strength, fiber-epoxy adhesion, and interfacial elemental analysis using X-ray photoelectron spectroscopy (XPS) are examined.
2. Materials
2.1. Carbon fiber
For the fiber sizing experiments, a Polyacrylonitrile (PAN) unsized, standard modulus carbon fiber supplied by Carbon Nexus (CN), (AUS) was used as a reinforcement fiber. Figure 1 shows a Scanning Electron Microscopy (SEM) image under 2000x of the carbon fiber. The average fiber diameter was measured to be 7±0.2 μm. Figure 2 shows the measured distribution of the CN fiber diameters used in this study.
2.2. Epoxy resin
To conduct the single fiber pullout experiments, EPIKOTE™ resin MGS™ RIMR 135 and EPIKURE™ curing agents MGS RIMH 134 – 137 supplied by Westlake Epoxy, (USA) was used as a model thermoset system. The epoxy resin to hardener mixing ratio was (100: 30±2 by weight), and the resin mixture was cured at a temperature of 70°C for 8 hours. The mechanical properties of the cured thermoset are highlighted in Table 1.
2.3. Sizing formulations
Two thermoset-compatible sizing formulations were identified, namely Hydrosize® HP2-06 and Hydrosize® HP3-02, supplied by Michelman®, Inc. (USA). The average solid content for each sizing formulation is 26.3 ± 0.2% and 34.1 ± 0.2%, respectively. Figure 3 shows the films formed from the sizing formulation upon evaporation of the dispersion medium.
3. Methods
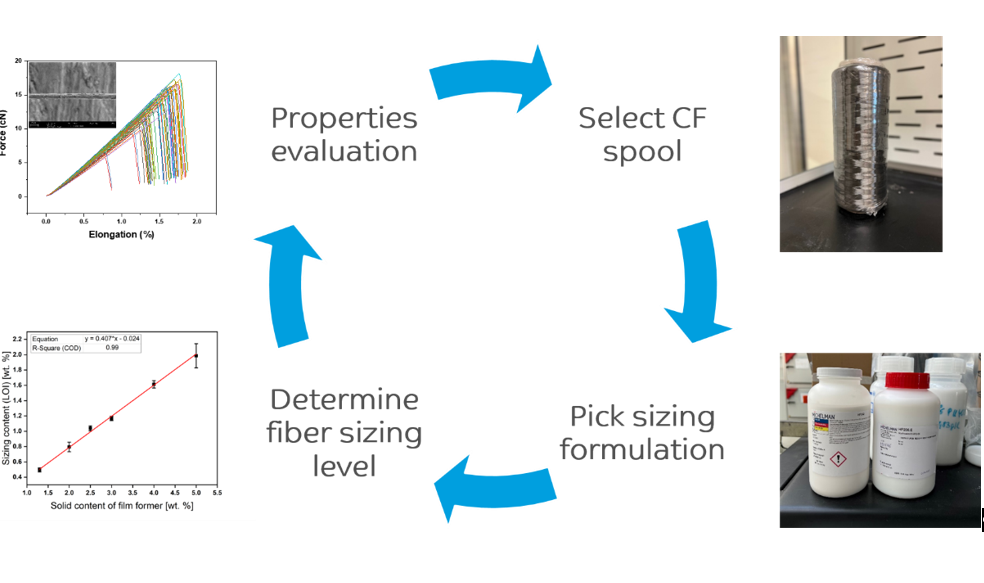
The overall experimental methodology is shown in Figure 4. The process starts with selecting a carbon fiber spool and identifying the desired sizing formulation and sizing levels. After that, the reinforcement fibers are sized and characterized using different techniques, such as single fiber tensile testing, single fiber pullout testing, and elemental analysis mapping using X-ray photoelectron spectroscopy (XPS).
3.1. Fiber sizing procedure
The fiber sizing process is the third step after selecting the reinforcement fiber spool and choosing the sizing formulation, as shown in Figure 4. To achieve 0.5, 1, and 2 wt. % of fiber sizing levels, the procedure starts with diluting the sizing formulation with Deionized (DI) water by following Equation (1). Equation (1) was developed as a function of the targeted sizing solid content level in [%], diluted sizing solution mass (sizing + DI water) in [g], and manufacturer sizing formulation solid content in [%]. The diluted sizing solution mass was fixed to 200 grams, while for space mapping, the targeted sizing solid content on the fiber surface varied from 2 to 4 wt. %. Table 2 shows a breakdown of the sizing solution preparation by using Equation (1). After preparing the diluted sizing solutions, a horizontal, vertical padder type (HVF) supplied by Mathis, (GER) was used to size the fiber tows. During the fiber sizing process, the pressure of the rollers was set to 1 bar, while the sizing speed was fixed to 0.80 m/min. Lastly, the sized fiber tows were dried using Heraeus UT6760 forced convection oven supplied by Thermo, (USA) at 160°C for 4 hours.
3.2. Determination of fiber sizing content
The amount of the fiber sizing was determined by following DIN ISO 1887 standard: sizing content determination by loss on ignition (LOI) at 650 °C. The LOI experiments were carried out using the Phoenix Airwave microwave muffle furnace in air supplied by CEM Corporation, (USA). Equation (2) was used to calculate the fiber sizing content in (wt. %) as a function of the mass of the pan in [g], the mass of the sample in [g], and the mass of the sample after ashing in [g].
3.3. Single fiber tensile testing
Single fiber tensile testing experiments for both unsized and sized carbon fibers were carried out using a Favimat+ Robot 2 single fiber tester supplied by Textechno H. Stein GmbH & Co. KG, (GER). The tensile load extension curves were collected at a cross-head rate of 15 mm/min using a gauge length of 50 mm and pretension of 2 cN/tex. The load data was normalized by dividing by the linear density to give the specific stress-strain curves from which the specific tensile strength (ultimate specific stress or tenacity) and specific modulus can be determined.
3.4. Fiber-Matrix Adhesion: Single fiber pull-out testing
The interfacial adhesion strength between fiber and matrix of the unsized and sized fiber was evaluated by using a custom-made Single fiber pull-out (SFPO) instrument and purposely-built embedding equipment constructed at IPF Dresden, (GER) [29,30], as shown in Figure 5. A pre-selected embedding length of () samples were prepared and embedded accurately and perpendicularly to the surface of the epoxy matrix. For the epoxy formulation, an embedding temperature of 85 °C was carried out under a controlled atmosphere and temperature. After embedding, the epoxy formulation was cured at 85 °C for about 10 s, before cooling down to ambient temperature, after which the pull-out test was carried out with a loading rate of 10 nm/s. The force-displacement curves and the maximum force (Fmax) required for pulling the fiber out of the matrix were measured. After testing, the fiber diameter (df) was measured using optical microscopy; le was determined using the force-displacement curve and cross-checked using a scanning electron microscope (SEM). The adhesion bond strength between the fiber and the matrix was characterized by the values of the apparent interfacial shear strength that is presented by the Equation in (3) [29,30,31].
3.4. X-ray photoelectron spectroscopy
X-ray photoelectron spectroscopy was done on the materials prepared to perform core level analysis. The XPS of unsized and sized fibers was carried out using Thermo scientific ESCALAB 250 Xi. The machine was equipped with a mono-chromated AlKα X-ray source. The base pressure of the chamber was typically in the mid 10-10 mbar. Charge neutralization was used for all samples (compensating shifts of ~1 eV). The spectra were calibrated with respect to C1s peak maxima at 284.8 eV. The C1s, O1s, N1s, binding energy regions were scanned for all carbon fibers. Typical acquisition conditions were as follows, first, the pass energy and scan rate were set to 20 eV and 0.1 eV per 200ms, respectively. The fiber samples were cut into squares with a dimension of 0.5 x 0.5 cm2, which were then loaded into the chamber for analysis. A typical spatial area analyzed was 0.9 x 0.9 mm2. Data acquisition and analysis were performed using the AVANTAGE software.
4. Results and discussions
4.1. Achieving the targeted sizing content
The effect of carbon fiber sizing level on carbon fiber/ epoxy composites is an important factor in its manufacturing. A higher sizing level can increase interfacial bonding between the carbon fibers and the epoxy resin, improving mechanical properties such as strength and stiffness. However, excessive sizing can also lead to increased stiffness of the fiber, which can reduce the overall processability during down-stream part prepreg, tape and part manufacturing. This in turn has a negative effect on the performance of the composite. Therefore, it is essential to carefully balance the sizing level to achieve optimal mechanical performance and durability.
Fiber sizing content on the mechanical properties of the fibers, the desired fiber sizing levels have to be achieved with a high degree of accuracy, namely (0.5, 1, and 2 wt. %). A series of three exploratory experiments of per sizing formulations were conducted to determine the average fiber sizing level, as highlighted in Table 2. In Table 2, experiments A1-A3 and B1-B3 correspond to the fiber sizing experiments using Hydrosize® HP3-02 and Hydrosize® HP2-06 commercial sizing formulations, respectively. In these fiber-sizing experiments, as shown in Figure 6 and Figure 7 respectively, the relationship between solid content of the film former, and the sizing level from the LOI are plotted.
For Hydrosize® HP3-02 formulation (Figure 6), the initial three sizing experiments resulted in LOI sizing levels of 0.80, 1.17, and 1.61 wt. % on the fiber surface. As a result, a first-order straight line fit with (R2 = 0.99) was obtained. As shown in Figure 6, these exploratory experiments yielded a predictive engineering approach to determine the desired fiber sizing level while eliminating the trial by error approach. Based on these findings, the desired predictive sizing content by LOI of the Hydrosize® HP3-02 formulation can be calculated by using Equation (4). Based on Equation (4), the updated solid content of the film former was calculated, as shown in Table 3, for experiments A4-A6. Resizing the fibers with the recalculated predictive solid content of film former (Equation 4) with 1.29, 2.52, and 5.0 wt. % solid content resulted in 0.5, 1, and 2 wt. % of an LOI sizing level, as shown in Table 3 and Figure 6.
On the other hand, the three exploratory experiments for Hydrosize® HP2-06 formulation (Table 2 and Figure 7) resulted in LOI sizing levels of 0.46, 0.81, and 1.02 wt. % on the fiber’s surface. Unlike the Hydrosize® HP3-02 sizing exploratory experiments, two out of three Hydrosize® HP2-06 exploratory experiments achieved the targeted sizing levels without the need for resizing, namely the 0.5 and 1 wt. %. For the 2 wt. % sizing level, and following the same approach developed for Hydrosize® HP3-02 formulation, a straight line fitting with (R2 = 0.95) was attained, where the new desired predictive sizing solid content of the Hydrosize® HP2-06 formulation can be calculated by using Equation (5). Based on Equation (5), the updated solid content of film former was calculated, as shown in Table 3, experiment B8 for the 2.0 wt. % LOI. Resizing the fibers with a 6.90 % film former solid content resulted in a 2 wt. % of an LOI sizing level, as shown in Table 3 and Figure 7. Now that the desired fiber sizing levels were achieved for both sizing formulations with a high degree of accuracy, the effect of fiber sizing on the mechanical properties will be discussed in the next section. For the next section, samples A4-A6, and B1, B3, and B8 were selected to study the effect of fiber sizing level on the mechanical properties. It is noteworthy to mention, that the developed fiber sizing methodology can be utilized and would be applicable to any man-made fibers (glass, aramid, etc.) of any shape (circular, bean, etc.), and for any sizing formulations with different sizing solid content.
4.2. The effect of sizing levels on the tensile properties of the fiber
To study the effect of sizing content on the mechanical properties of the fibers, for each fiber sizing level, a series of 50 single fiber tensile testing experiments (n) were conducted using Favimat+. The ultimate tensile strength () of the carbon fibers were analyzed using the two-parameter Weibull distribution according to Equation (6), where P is the cumulative probability of failure of a filament at the applied stress (σ), shape parameter (m), and the characteristic stress (at which 63.2% break) (σ0) [32]. The high values of the shape parameter (m) indicate a homogenous distribution of damages over the entire filament surface.
The effect of the carbon fiber sizing levels on the fiber’s tensile strength are shown in Table 4 and Figure 8, Figure 9 and Figure 10 a and b for unsized, representative sample (A5) of HP3-02 sized carbon fibers, and representative sample (B1) of HP2-06 sized carbon fibers, respectively. For the unsized fibers, the force vs. elongation tensile test measurements is shown in Figure 8a, while the two-parameter Weibull distribution analysis is shown in Figure 8b. As it is evident from Figure 8b and Table 4, the scale parameter () of the unsized fiber baselined at 3.52 GPa.
For the HP3-02 sized fibers, and as shown in Table 4, increasing the sizing content to 1 wt.% (see Figure 9, sample A5), resulted in a 6% increase in the scale parameter () to 3.72 GPa compared to unsized fibers. This observed increase of the scale parameter can be attributed to the covering of the fiber surface defects by the sizing formulation, which consequently, resulted in a more homogenous distribution of the load along the fiber axis. A further increase in the fiber sizing level to 2 wt. % (sample A6), as shown in Table 4, resulted in a 3% decrease in the scale parameter () to 3.43 GPa compared to the unsized fibers. This is primarily due to human-induced damage during the fiber separation process. The latter claim was also supported by the shape parameter (m) which was the lowest among its group at 5.34. Hence, although the fiber sizing level is increased, handling and processing became more challenging.
On the other hand, the effect of sizing the fibers with Hydrosize® HP2-06 formulation on the fiber tensile strength is shown in Table 4. As the sizing level increased to 0.5 wt. % (see Figure 10, sample B1), the scale parameter () increased by more than 6% compared to unsized fibers. A further increase in the fiber sizing level resulted in a decrease in the scale parameter as explained in the previously. Noticeably, the HP2-06 sizing showed a better-optimized tensile strength performance at a lower solid content ( at 0.5 wt. % sizing) when compared to the HP3-02 ( at 1 wt. % sizing). This is a significant finding, as it will add another economical dimension during the process of selecting an effective low-cost sizing agent in real manufacturing environment. At the same time, increasing the sizing level to 2 wt. % has a negative effect during the post-processing stages (prepreg manufacturing) due to the difficulties faced throughout the fiber spreading process. The effect of sizing on the surface functional groups of sized and unsized carbon fibers will be discussed in the next section.
4.3. The effect of sizing on functional groups
The local surface chemical composition is critically important in discerning the type and number of functional groups on the surface region of the differently sized carbon fibers. X-ray photoelectron spectroscopy (XPS) was employed to probe the chemical composition and the degree of surface modification of treated and untreated fibers. (Figure 11a,c,e) shows a representative example of survey spectrum of the unsized and sized samples A and B surface as well as high-resolution spectra of C 1s. The survey spectrum clearly exhibits peaks at 99.7, 284.7, 400.3 and 532.0 eV corresponding to the binding energies of Si 2p, C 1s, N 1s and O 1s, respectively. High-resolution XPS scan was also carried out to gain additional insight into the chemical composition of these samples. The survey spectrum of the unsized and sized samples A and B as shown in (Figure 11a,c,e) had a three major components detected across all the samples namely, C, O and N, while some samples had a minor presence and impurities of Silicon and Calcium. The presence of calcium can be attributed to the possible contamination from sample handling, whereas the presence of the silicon can be related to the silicon oil agent applied on the surface of the polyacrylonitrile precursor incorporated into the fiber’s structure, and then got preserved during the carbonization process [27]. The detailed XPS elemental compositions of the surfaces of unsized and sized carbon fibers are summarized in Table 5.
The high-resolution C1s spectrum of the unsized and sized fibers could be fitted with four peaks, which are related to the individual contributions from different functional groups (see Figure 11b,d,f). The peak at 283.3 eV, is related to carbide group possibly silicon carbide a residual from the carbonization process [27]. Furthermore, the high-resolution scan for C 1s spectrum also shows deconvoluted three component peaks with binding energies characteristic of the molecular units present on the treated and untreated surfaces of these fibers. This includes peaks at -C-C/C-H (284.8 eV), -C-O-C (285.7 eV) and -C-C=O (287.1 eV) respectively. In addition, the peaks at 289 and 291.3 eV are assigned to carboxyl functions or ester (-COO-) and satellite peak (), respectively. The O1s envelope was fitted with three main peaks centered at 530.8, 532.5, and 534.6 eV that are attributed to C=O, C-O-H, and C-O-C, respectively. Based on the high-resolution scans and the elemental composition analysis presented in Table 5, and for both sizing formulations, the [O]:[C] ratio across all the samples increased linearly with increasing the amount of sizing. As a result, a greater fiber-matrix adhesion is expected. Notably, HP2-06 showed a higher [O]:[C] ratio at 0.33 when compared to the HP3-02 formulation, which plateaued at 0.22.
4.4. The effect of sizing levels on the interfacial properties of the fiber
The Interfacial Shear Strength (IFSS) of the CF/epoxy resin composites with and without sizing were tested by using the single fiber pullout testing (SFPO) instrument (refer to section 3.4 for more details). Comparing the force vs. displacement curves of the SFPO tests, the effect of the carbon fiber sizing levels on the fiber’s interfacial shear strength were investigated thoroughly as shown in Table 6 and Figure 12, Figure 13 and Figure 14 for unsized, representative sample (A5) of HP3-02 sized carbon fibers, and representative sample (B3) of HP2-06 sized carbon fibers, respectively. Table 6 presents the IFSS of the untreated, sample A5, and sample B3 composites are 66 MPa, 67.3 MPa, and 68 MPa, respectively. In general, increasing the sizing level content increased the IFSS. However, it should be noted that even unsized fibers revealed an excellent interaction between the fiber and the epoxy matrix. This might be because the epoxy matrix near the fiber is considerably stretched during the pull-out test. On the other hand, the sudden drop in the IFSS at 1 wt. % is due to human-induced damage during the fiber separation process and before the fiber embedding step.
The key finding was that despite having the lowest sizing solid percentage (26.3±0.2%), HP2-06-sized carbon fibers had the highest rise in the IFSS. A further investigation of the fractured fibers by SEM as shown in (
Figure 12, Figure 13 and Figure 14: right) revealed that the application of the HP2-06 sizing resulted in a uniform residual epoxy on the fiber’s surface. Accordingly, the observed increase in adhesion can be related to the growth of hydrophilic oxygenated functional groups on the fiber surface, which is supported by the XPS analysis and is essential for the improvement of their surface adhesion. Figure 15 and Figure 16 confirm the latter claim, where the O/C ratio is increased with an increase in the IFSS.
Figure 17 and Figure 18 for HP3-02 and HP2-06 demonstrate the application-driven characteristics (tensile and IFSS) at the fiber composite level as a function of the sizing content from a process-by–design space perspective. The desired sizing level content will vary based on the intended end application. For example, for HP2-06 sizing (refer to Figure 18), if the intended use is a shear-driven loading application, then a sizing content of 0.5 wt. % is the optimum sizing level, providing the highest IFSS at 3.74 MPa. On the other hand, if the intended use is a tensile-driven loading application, then a sizing level of 1 wt. % provides the highest tensile stress properties at 68 MPa. These design spaces rationalization are of paramount importance to be taken into account for different ways: Firstly, it unlocks and utilizes the full potential of the sizing formulations, secondly it provides an effective way for an application driven cost saving opportunity due to the different sizing levels. Lastly, it could develop an elegant analytical protocol that can not be used to characterize readily the strength and interfacial shear strength of any thermoset or thermoplastic with different sizing formulations and solid content.
5. Conclusion
The effect of fiber sizing levels on carbon fibers' mechanical properties was investigated using a single fiber tensile test, single fiber pullout test, and interfacial elemental analysis using X-ray photoelectron spectroscopy (XPS). Two commercially available sizing formulations were applied to the surface of the fiber. A closed-form solution has been developed to calculate the required sizing of solid content to achieve 0.5, 1, and 2 wt. % of sizing on the fiber’s surface. For both sizing formulations, the ultimate tensile strength of the sized carbon fibers showed a 6% increase after the sizing. This can be attributed to covering the fiber’s surface defects to have a uniform load transfer along the fiber axis. The XPS result yielded a significant increase in the oxygen-containing surface functional groups as the sizing levels increased. The effect of increasing the O/C ratio on the interfacial shear stress of CF/epoxy composites was investigated by conducting 20 SFPO tests. Overall, increasing the O/C ratio resulted in a 6.3% increase in the fiber’s interfacial properties. As a result, two-process by-design spaces were developed to optimize the fiber’s performance. Lastly, generalized fiber sizing and characterization methods were established. The developed methods can be used to characterize the strength and interfacial shear strength of any man-made fibers with different sizing formulations and solid contents, for both thermoset and thermoplastic matrices.
Acknowledgments
The work described in this document is the result of a joint effort from the authors, the SABIC Technology department and contributors at the Leibniz-Institut für Polymerforschung Dresden e.V. (IPF). Special acknowledgement goes to Prof. Dr. Christina Scheffler, Matthias Krüger, Janett Hiller, Alma Rothe and Steffi Preßler at IPF.
References
- Advani, S.G.; Sozer, E.M. Process modeling in composites manufacturing; CRC press: 2002.
- Jaber, A.A.; Abu Obaid, A.; Advani, S.G.; Gillespie, J.W. Influence of relative humidity on charge stability of ozone treated polystyrene particles. J. Appl. Polym. Sci. 2020, 138. [Google Scholar] [CrossRef]
- Jaber, A.A.; Abu Obaid, A.; Advani, S.G.; Gillespie, J.W. Prediction of circumferential equilibrium spacing between charged polymer particles in contact with a grounded carbon fiber. Powder Technol. 2021, 386, 307–318. [Google Scholar] [CrossRef]
- Jaber, A.A.; Abu Obaid, A.; Advani, S.G.; Gillespie, J.W. Prediction of equilibrium spacing between charged polymer particles in contact with a carbon fiber. J. Electrost. 2021, 111, 103577. [Google Scholar] [CrossRef]
- Jaber, A.A.; et al. Experimental investigation of dry powder coating processing parameters on the polystyrene particle's distribution on the surface of carbon fibers. Powder Technology 2021, 393, 461–470. [Google Scholar] [CrossRef]
- Park, S.-J. Carbon Fibers; Springer Series in Materials Science: 2015; Vol. 210.
- Khayyam, H.; Jazar, R.N.; Nunna, S.; Golkarnarenji, G.; Badii, K.; Fakhrhoseini, S.M.; Kumar, S.; Naebe, M. PAN precursor fabrication, applications and thermal stabilization process in carbon fiber production: Experimental and mathematical modelling. Prog. Mater. Sci. 2019, 107, 100575. [Google Scholar] [CrossRef]
- Sedghi, A.; Farsani, R.E.; Shokuhfar, A. The effect of commercial polyacrylonitrile fibers characterizations on the produced carbon fibers properties. J. Mater. Process. Technol. 2008, 198, 60–67. [Google Scholar] [CrossRef]
- Xu, Z.; Li, J.; Wu, X.; Huang, Y.; Chen, L.; Zhang, G. Effect of kidney-type and circular cross sections on carbon fiber surface and composite interface. Compos. Part A: Appl. Sci. Manuf. 2008, 39, 301–307. [Google Scholar] [CrossRef]
- Cai, J.Y.; McDonnell, J.; Brackley, C.; O’brien, L.; Church, J.S.; Millington, K.; Smith, S.; Phair-Sorensen, N. Polyacrylonitrile-based precursors and carbon fibers derived from advanced RAFT technology and conventional methods – The 1st comparative study. Mater. Today Commun. 2016, 9, 22–29. [Google Scholar] [CrossRef]
- Moskowitz, J.D.; Abel, B.A.; McCormick, C.L.; Wiggins, J.S. High molecular weight and low dispersity polyacrylonitrile by low temperature RAFT polymerization. J. Polym. Sci. Part A: Polym. Chem. 2016, 54, 553–562. [Google Scholar] [CrossRef]
- Perrier, S.; Takolpuckdee, P. Macromolecular design via reversible addition-fragmentation chain transfer (RAFT)/xanthates (MADIX) polymerization. J. Polym. Sci. Part A: Polym. Chem. 2005, 43, 5347–5393. [Google Scholar] [CrossRef]
- Zhang, J. Different surface treatments of carbon fibers and their influence on the interfacial properties of carbon fiber/epoxy composites, 2012, ÉCOLE CENTRALE PARIS.
- Edie, D.D. The effect of processing on the structure and properties of carbon fibers. Carbon N. Y. 1998, 36, 345–362. [Google Scholar] [CrossRef]
- Lim, T.H.; Kim, M.S.; Yeo, S.Y.; Jeong, E. Preparation and evaluation of isotropic and mesophase pitch-based carbon fibers using the pelletizing and continuous spinning process. J. Ind. Text. 2019, 48, 1242–1253. [Google Scholar] [CrossRef]
- Park, S.-J.; Heo, G.-Y. Precursors and Manufacturing of Carbon Fibers. 2014, 31–66. [Google Scholar] [CrossRef]
- Lewis, S. The use of carbon fibre composites on military aircraft. Compos. Manuf. 1994, 5, 95–103. [Google Scholar] [CrossRef]
- Soutis, C. Fibre reinforced composites in aircraft construction. Prog. Aerosp. Sci. 2005, 41, 143–151. [Google Scholar] [CrossRef]
- Dai, Z.; Shi, F.; Zhang, B.; Li, M.; Zhang, Z. Effect of sizing on carbon fiber surface properties and fibers/epoxy interfacial adhesion. Appl. Surf. Sci. 2011, 257, 6980–6985. [Google Scholar] [CrossRef]
- Kamps, J.H.; Henderson, L.C.; Scheffler, C.; Van der Heijden, R.; Simon, F.; Bonizzi, T.; Verghese, N. Electrolytic Surface Treatment for Improved Adhesion between Carbon Fibre and Polycarbonate. Materials 2018, 11, 2253. [Google Scholar] [CrossRef]
- Kamps, J.H.; Scheffler, C.; Simon, F.; van der Heijden, R.; Verghese, N. Functional polycarbonates for improved adhesion to carbon fibre. Compos. Sci. Technol. 2018, 167, 448–455. [Google Scholar] [CrossRef]
- Tiwari, S.; Bijwe, J. Surface Treatment of Carbon Fibers - A Review. Procedia Technol. 2014, 14, 505–512. [Google Scholar] [CrossRef]
- Kim, J.-K.; Mai, Y.-W. Engineered interfaces in fiber reinforced composites1998: Elsevier.
- Sharma, M.; Gao, S.; Mäder, E.; Sharma, H.; Wei, L.Y.; Bijwe, J. Carbon fiber surfaces and composite interphases. Compos. Sci. Technol. 2014, 102, 35–50. [Google Scholar] [CrossRef]
- Morgan, P. Carbon fibers and their composites2005: CRC press.
- Yao, S.-S.; Jin, F.-L.; Rhee, K.Y.; Hui, D.; Park, S.-J. Recent advances in carbon-fiber-reinforced thermoplastic composites: A review. Compos. Part B: Eng. 2018, 142, 241–250. [Google Scholar] [CrossRef]
- Li, N.; Liu, G.; Wang, Z.; Liang, J.; Zhang, X. Effect of surface treatment on surface characteristics of carbon fibers and interfacial bonding of epoxy resin composites. Fibers Polym. 2014, 15, 2395–2403. [Google Scholar] [CrossRef]
- Drzal, L.T.; Rich, M.J.; Koenig, M.F.; Lloyd, P.F. Adhesion of Graphite Fibers to Epoxy Matrices: II. The Effect of Fiber Finish. J. Adhes. 1983, 16, 133–152. [Google Scholar] [CrossRef]
- Pisanova, E.V.; Zhandarov, S.F.; Dovgyalo, V.A. Interfacial adhesion and failure modes in single filament thermoplastic composites. Polym. Compos. 1994, 15, 147–155. [Google Scholar] [CrossRef]
- Mäder, E.; Grundke, K.; Jacobasch, H.-J.; Wachinger, G. Surface, interphase and composite property relations in fibre-reinforced polymers. Composites 1994, 25, 739–744. [Google Scholar] [CrossRef]
- Textechno, Fibre-Matrix Adhesion Tester FIMATEST.
- Scheffler, C.; Förster, T.; Mäder, E.; Heinrich, G.; Hempel, S.; Mechtcherine, V. Aging of alkali-resistant glass and basalt fibers in alkaline solutions: Evaluation of the failure stress by Weibull distribution function. J. Non-Crystalline Solids 2009, 355, 2588–2595. [Google Scholar] [CrossRef]
Figure 1.
Scanning electron microscopy (SEM) image of the CN carbon fiber.
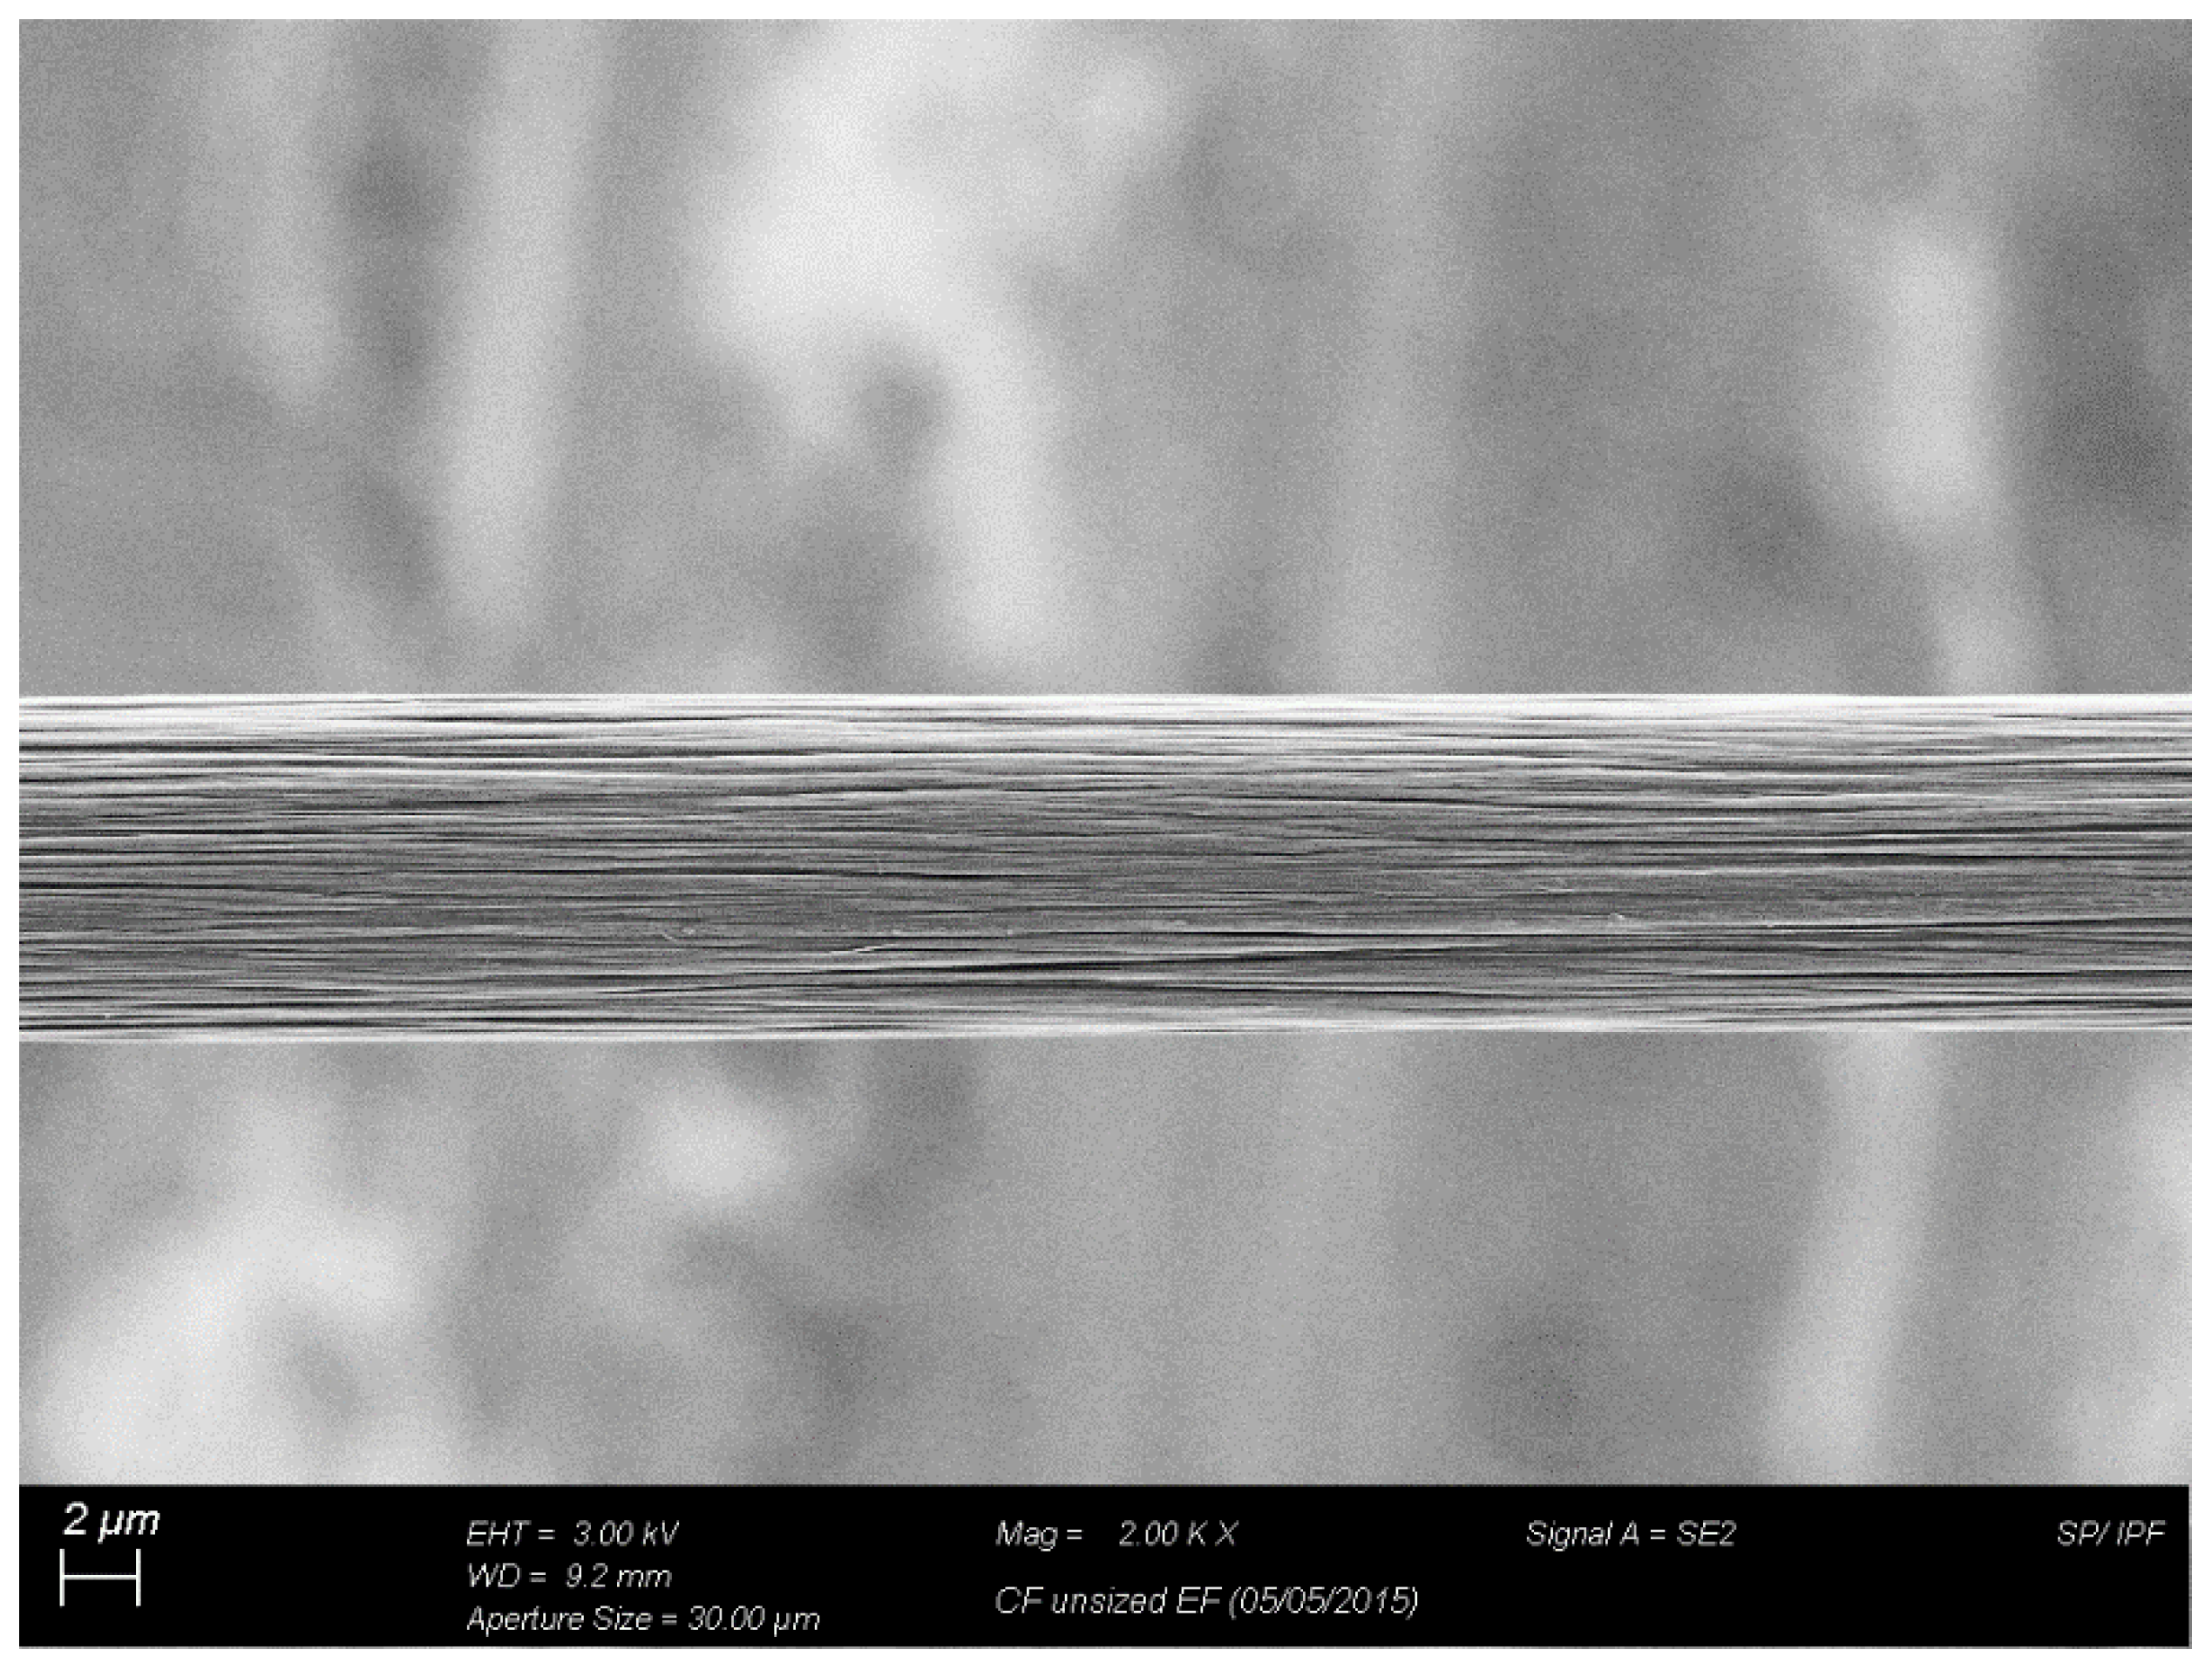
Figure 2.
Measured size distribution of the carbon fibers to be 7±0.2 μm.
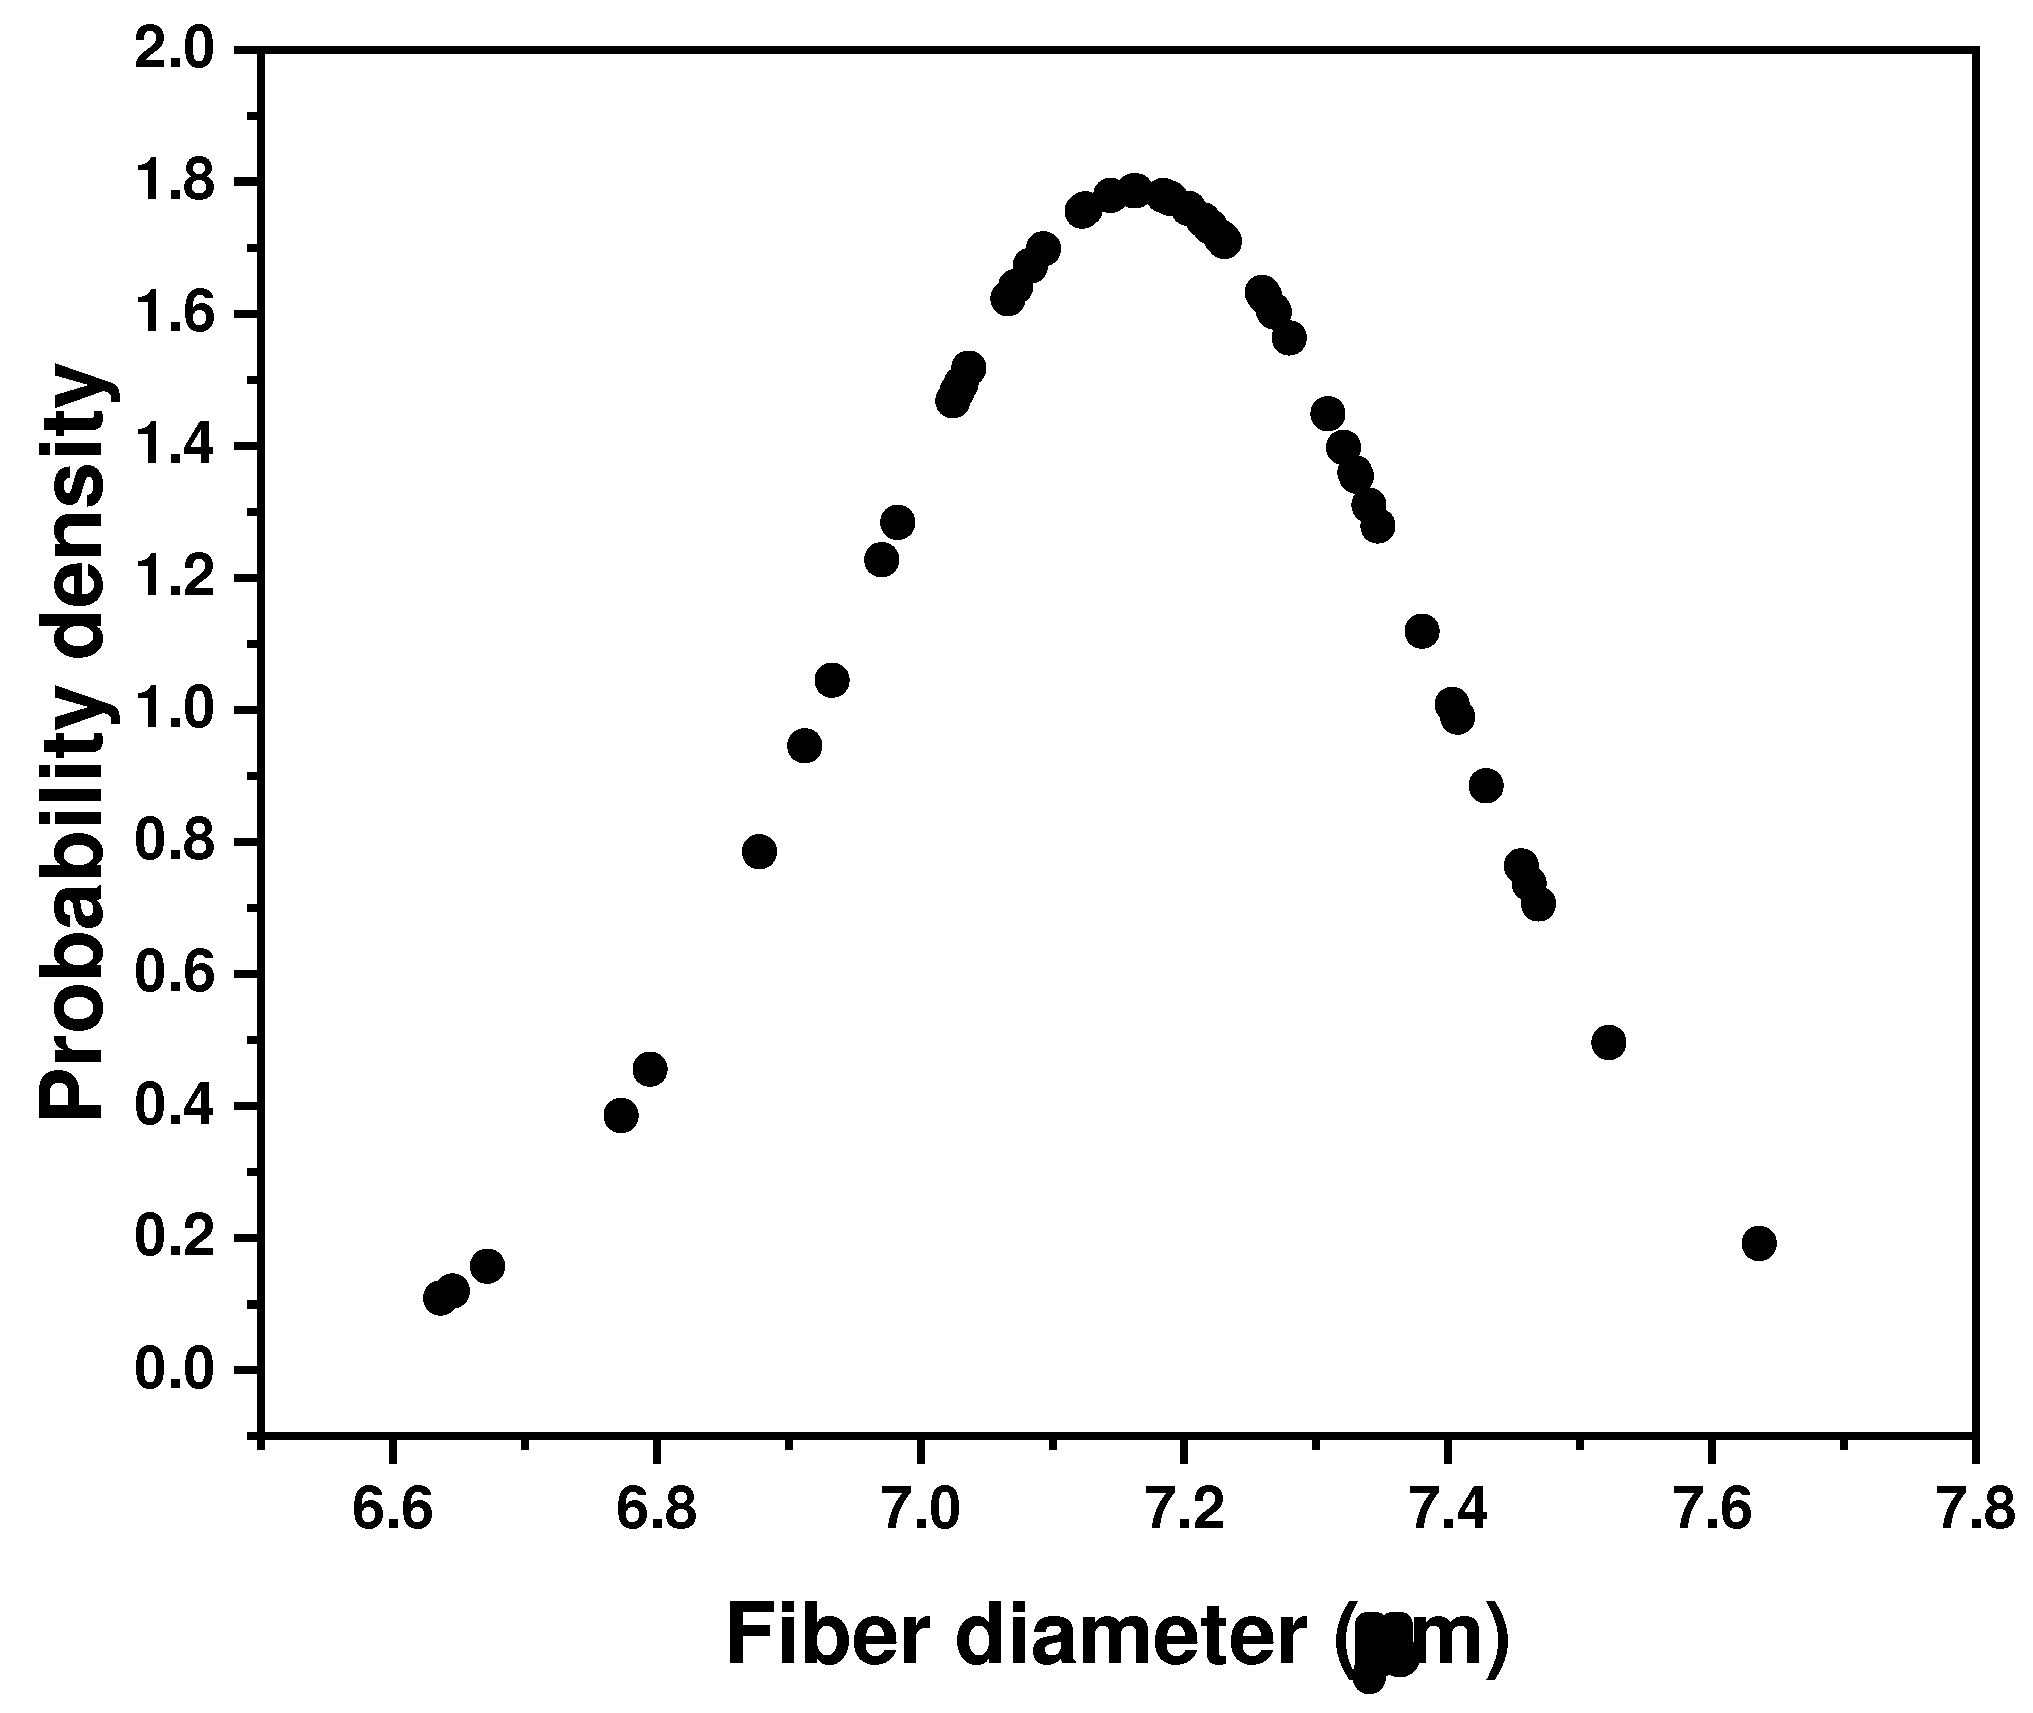
Figure 3.
Sizing formed films after evaporating the dispersion medium, Left sample: Hydrosize® HP2-06, and Right sample: Hydrosize® HP3-02.
Figure 3.
Sizing formed films after evaporating the dispersion medium, Left sample: Hydrosize® HP2-06, and Right sample: Hydrosize® HP3-02.
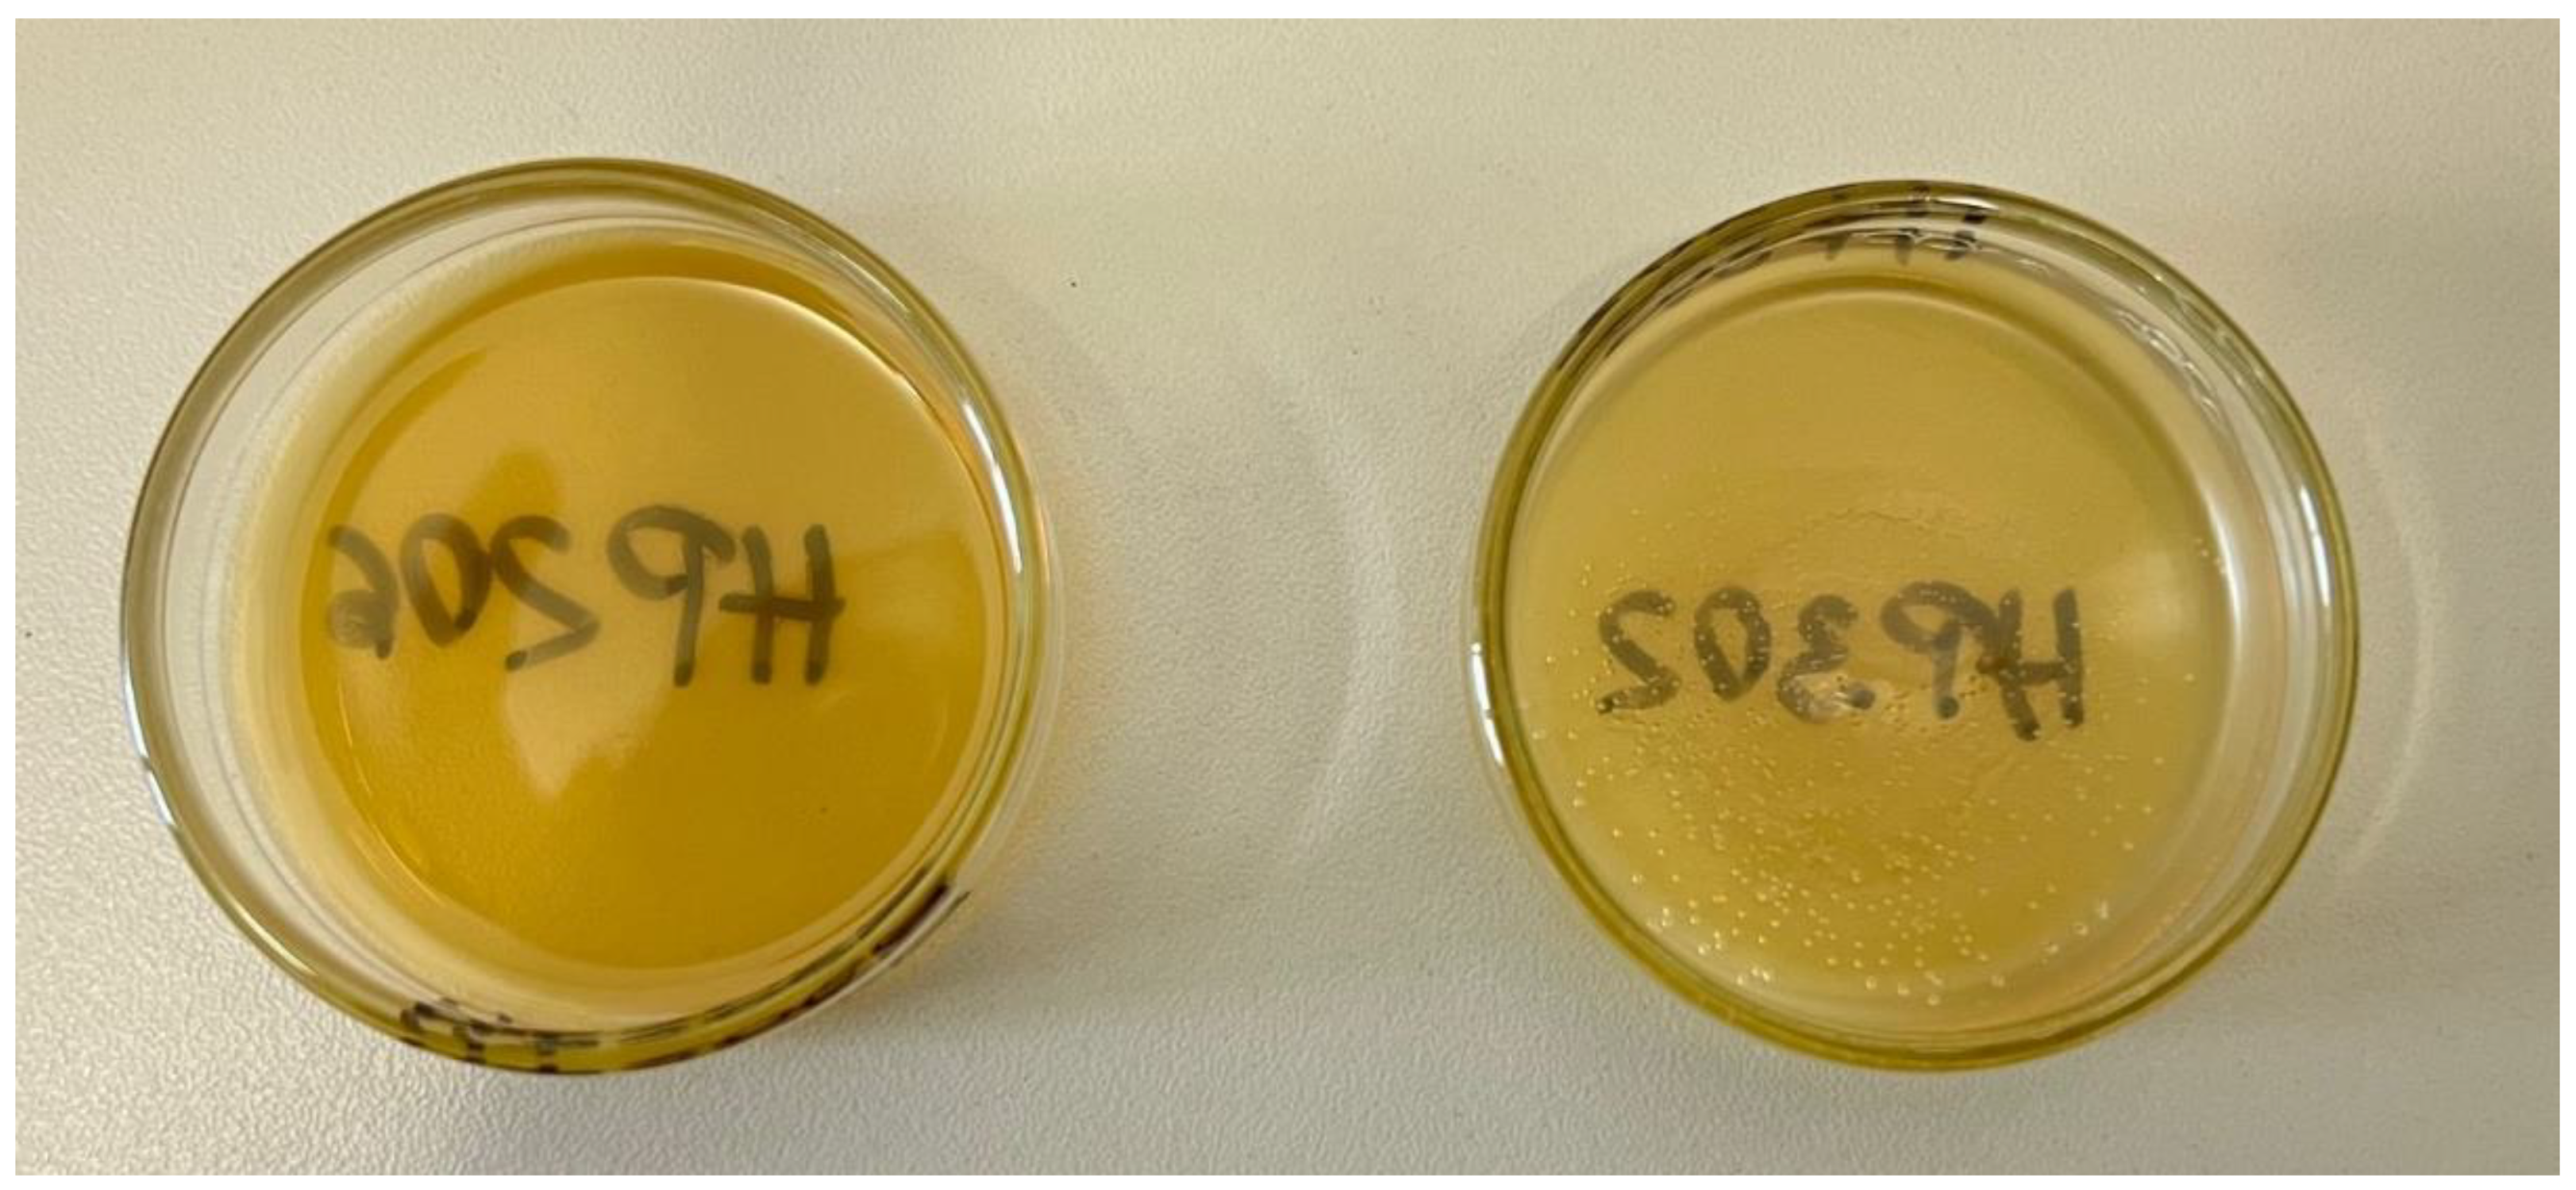
Figure 4.
Overall experimental methodology.
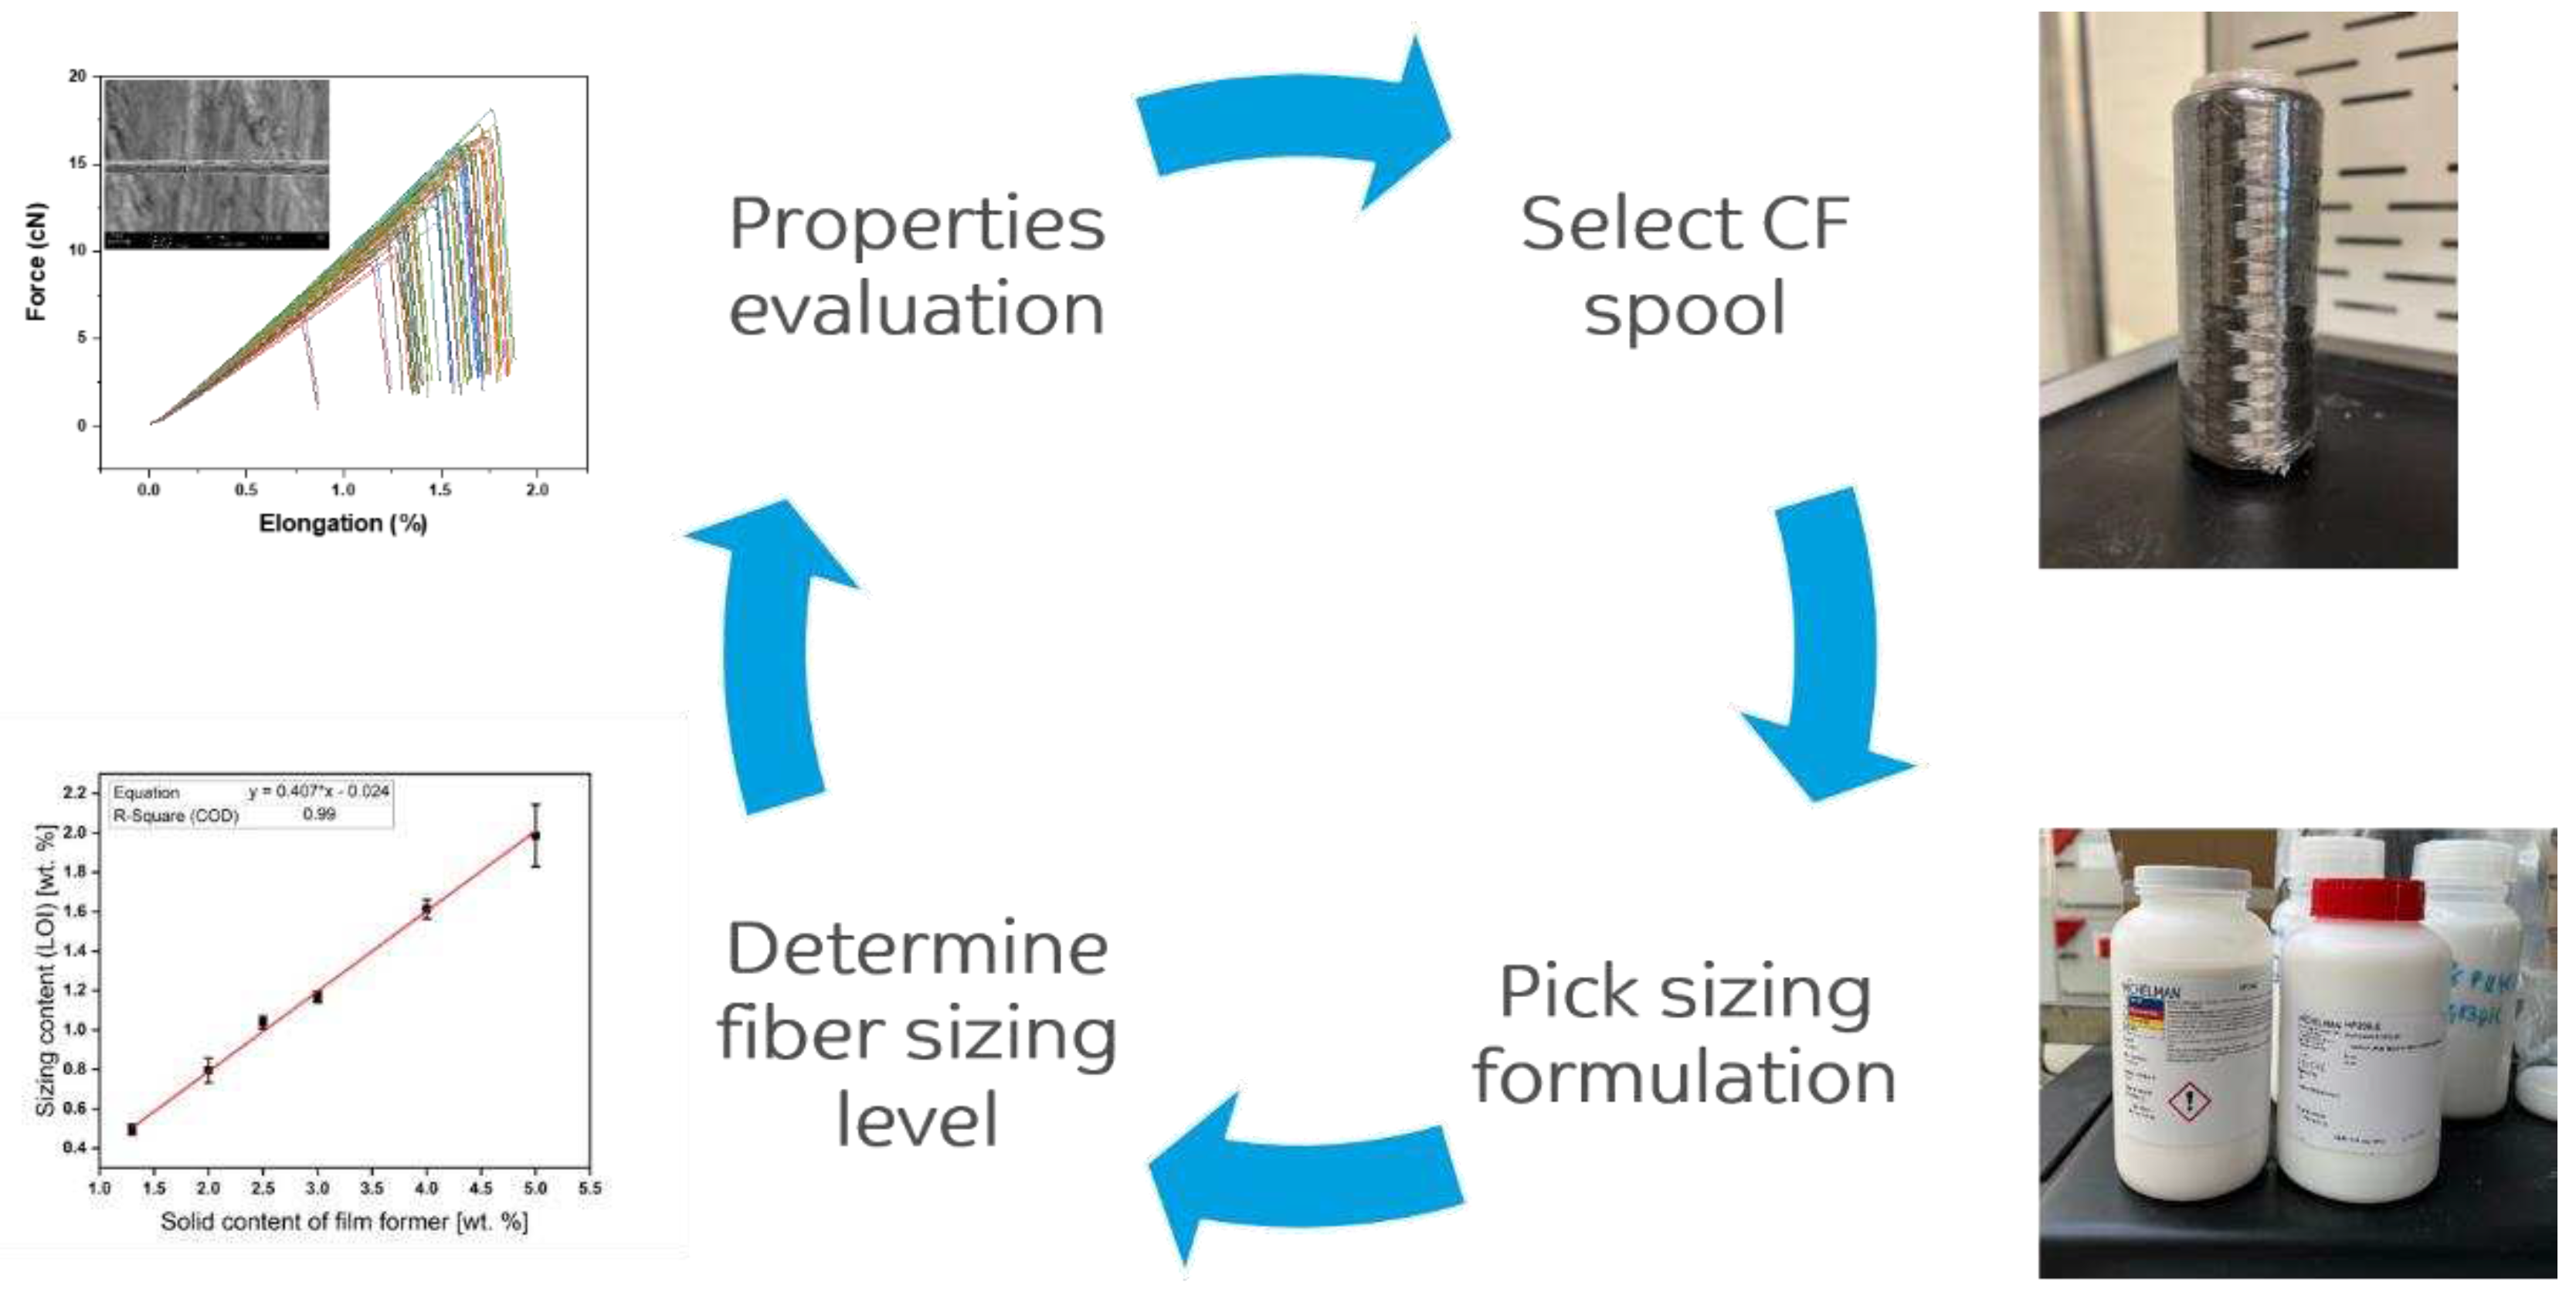
Figure 5.
single fiber pull-out test setup.
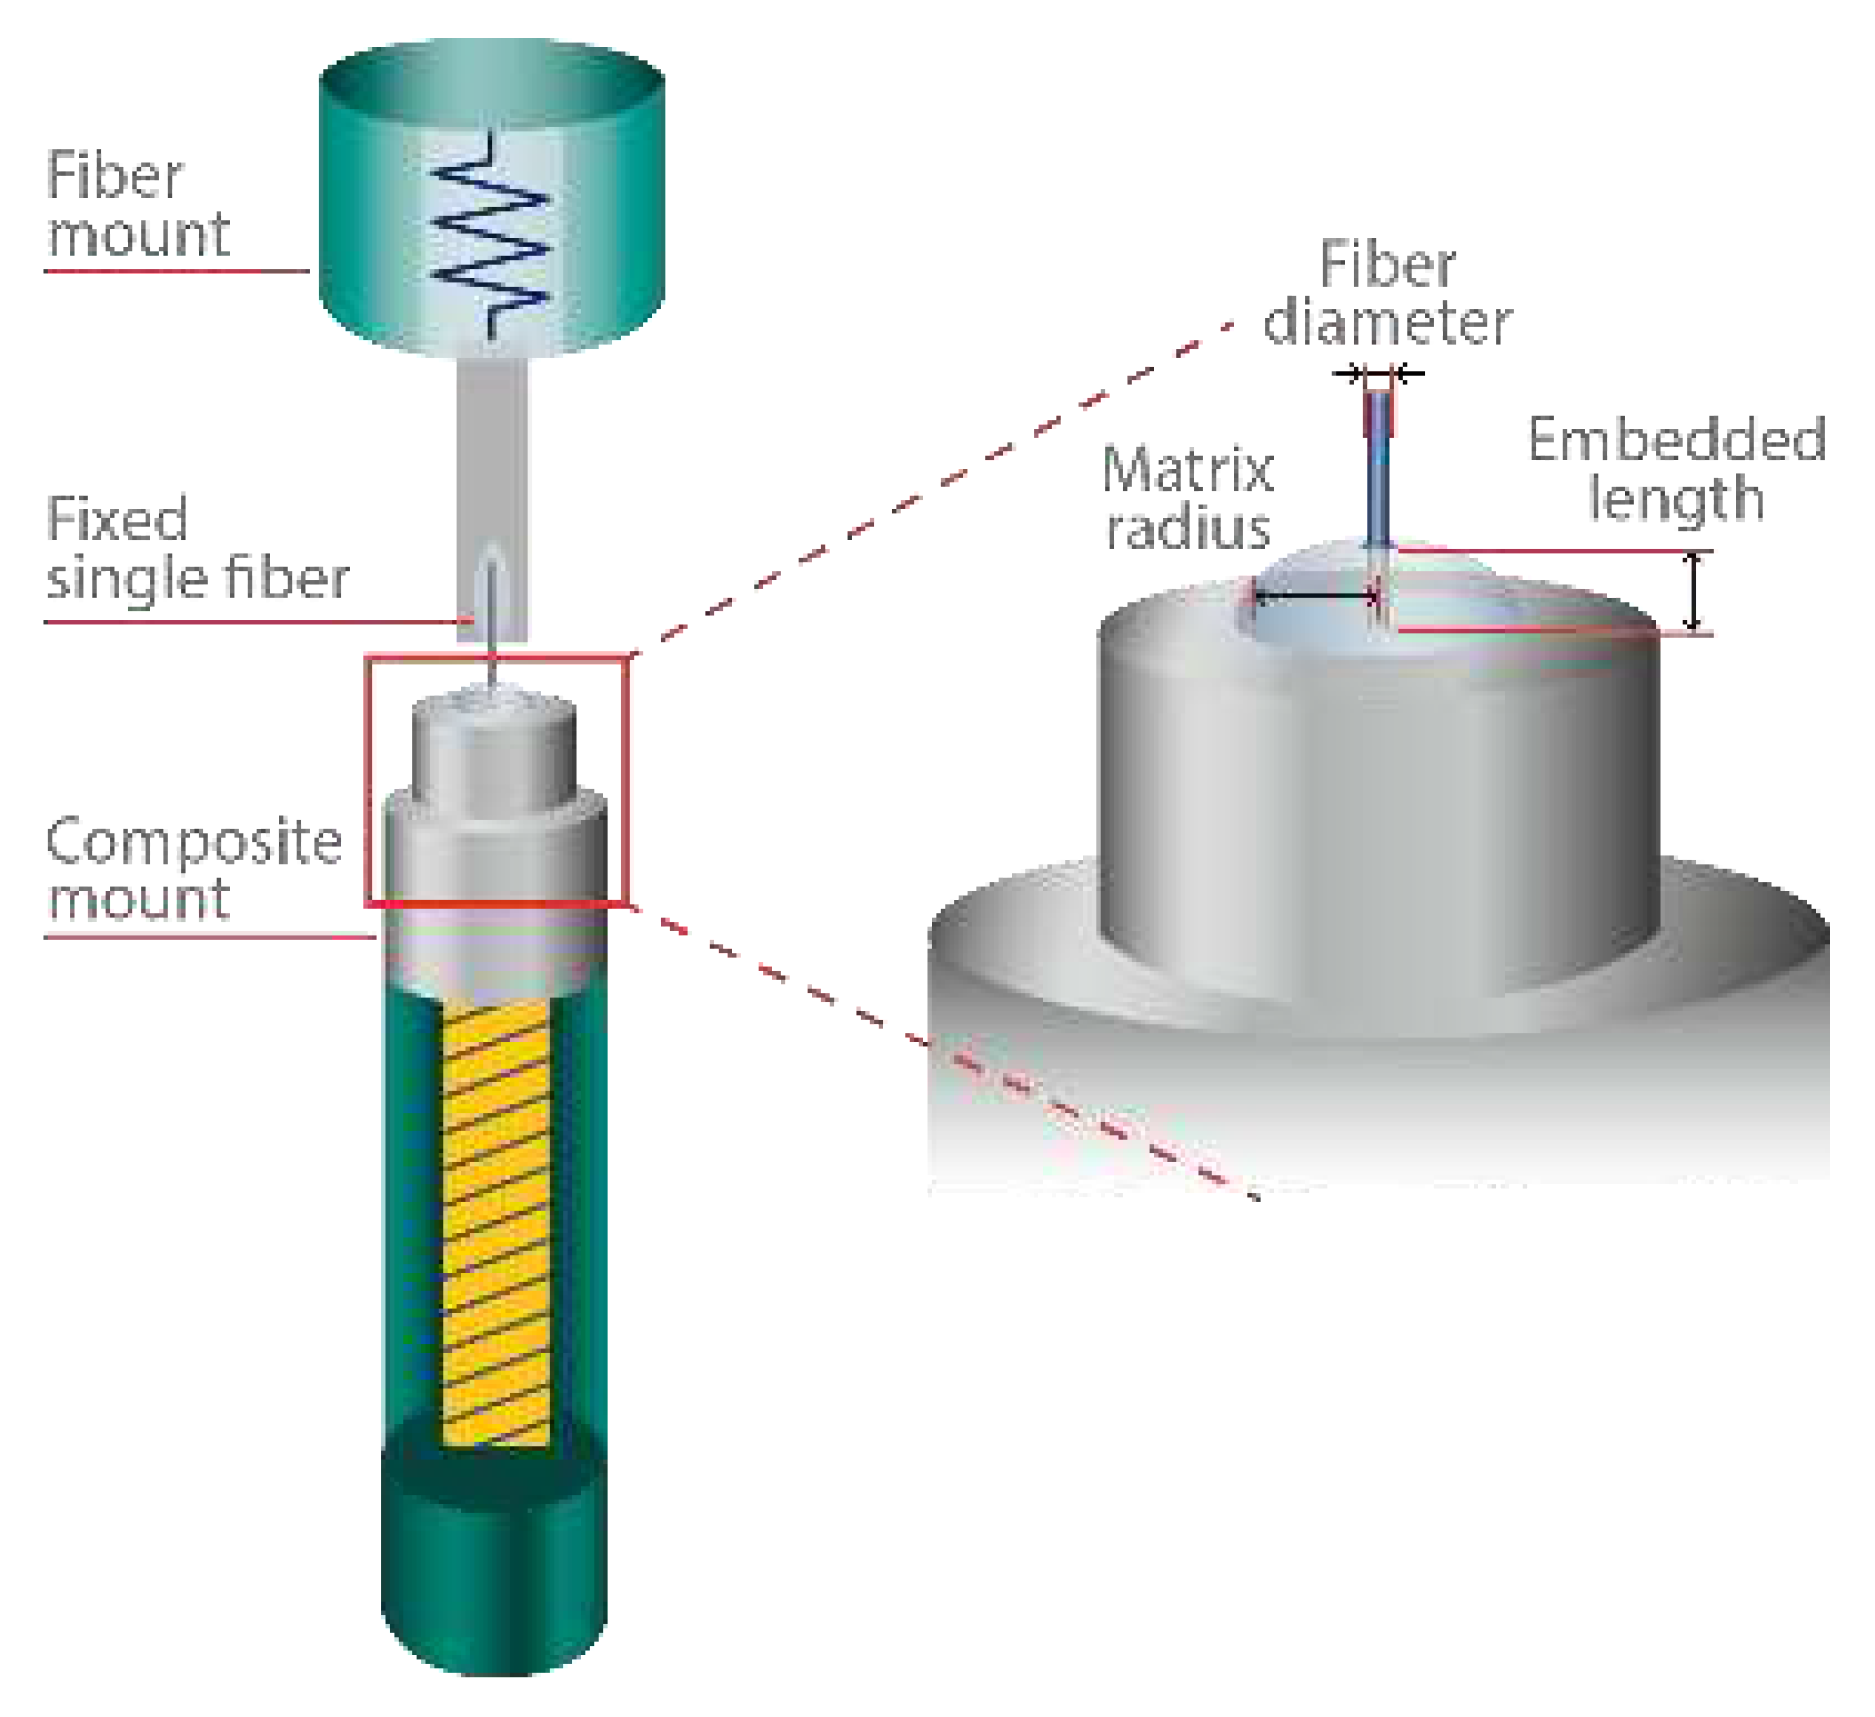
Figure 6.
Hydrosize® HP3-02 sizing experiments.
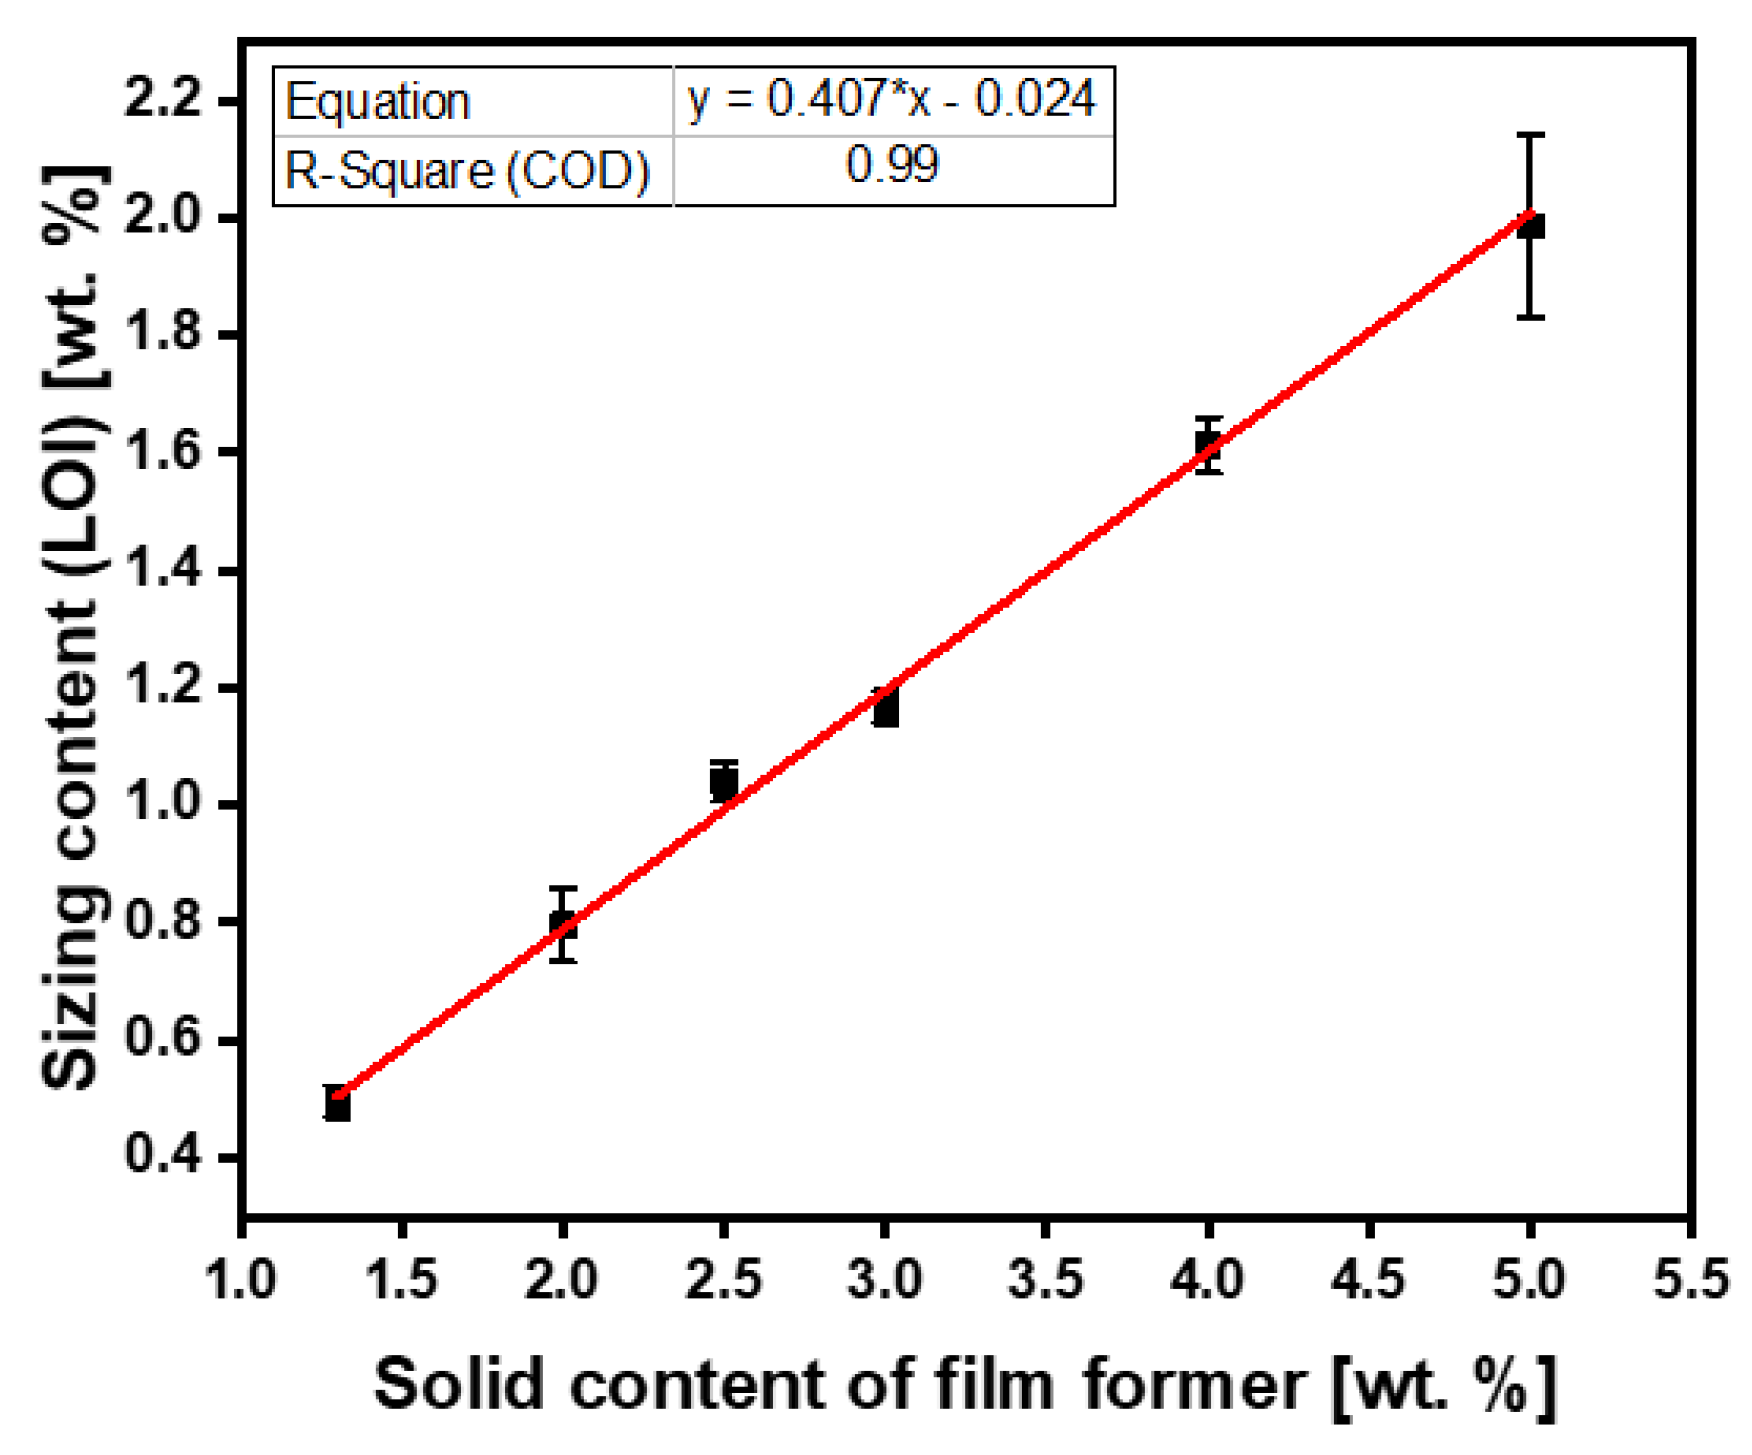
Figure 7.
Hydrosize® HP2-06 sizing experiments.
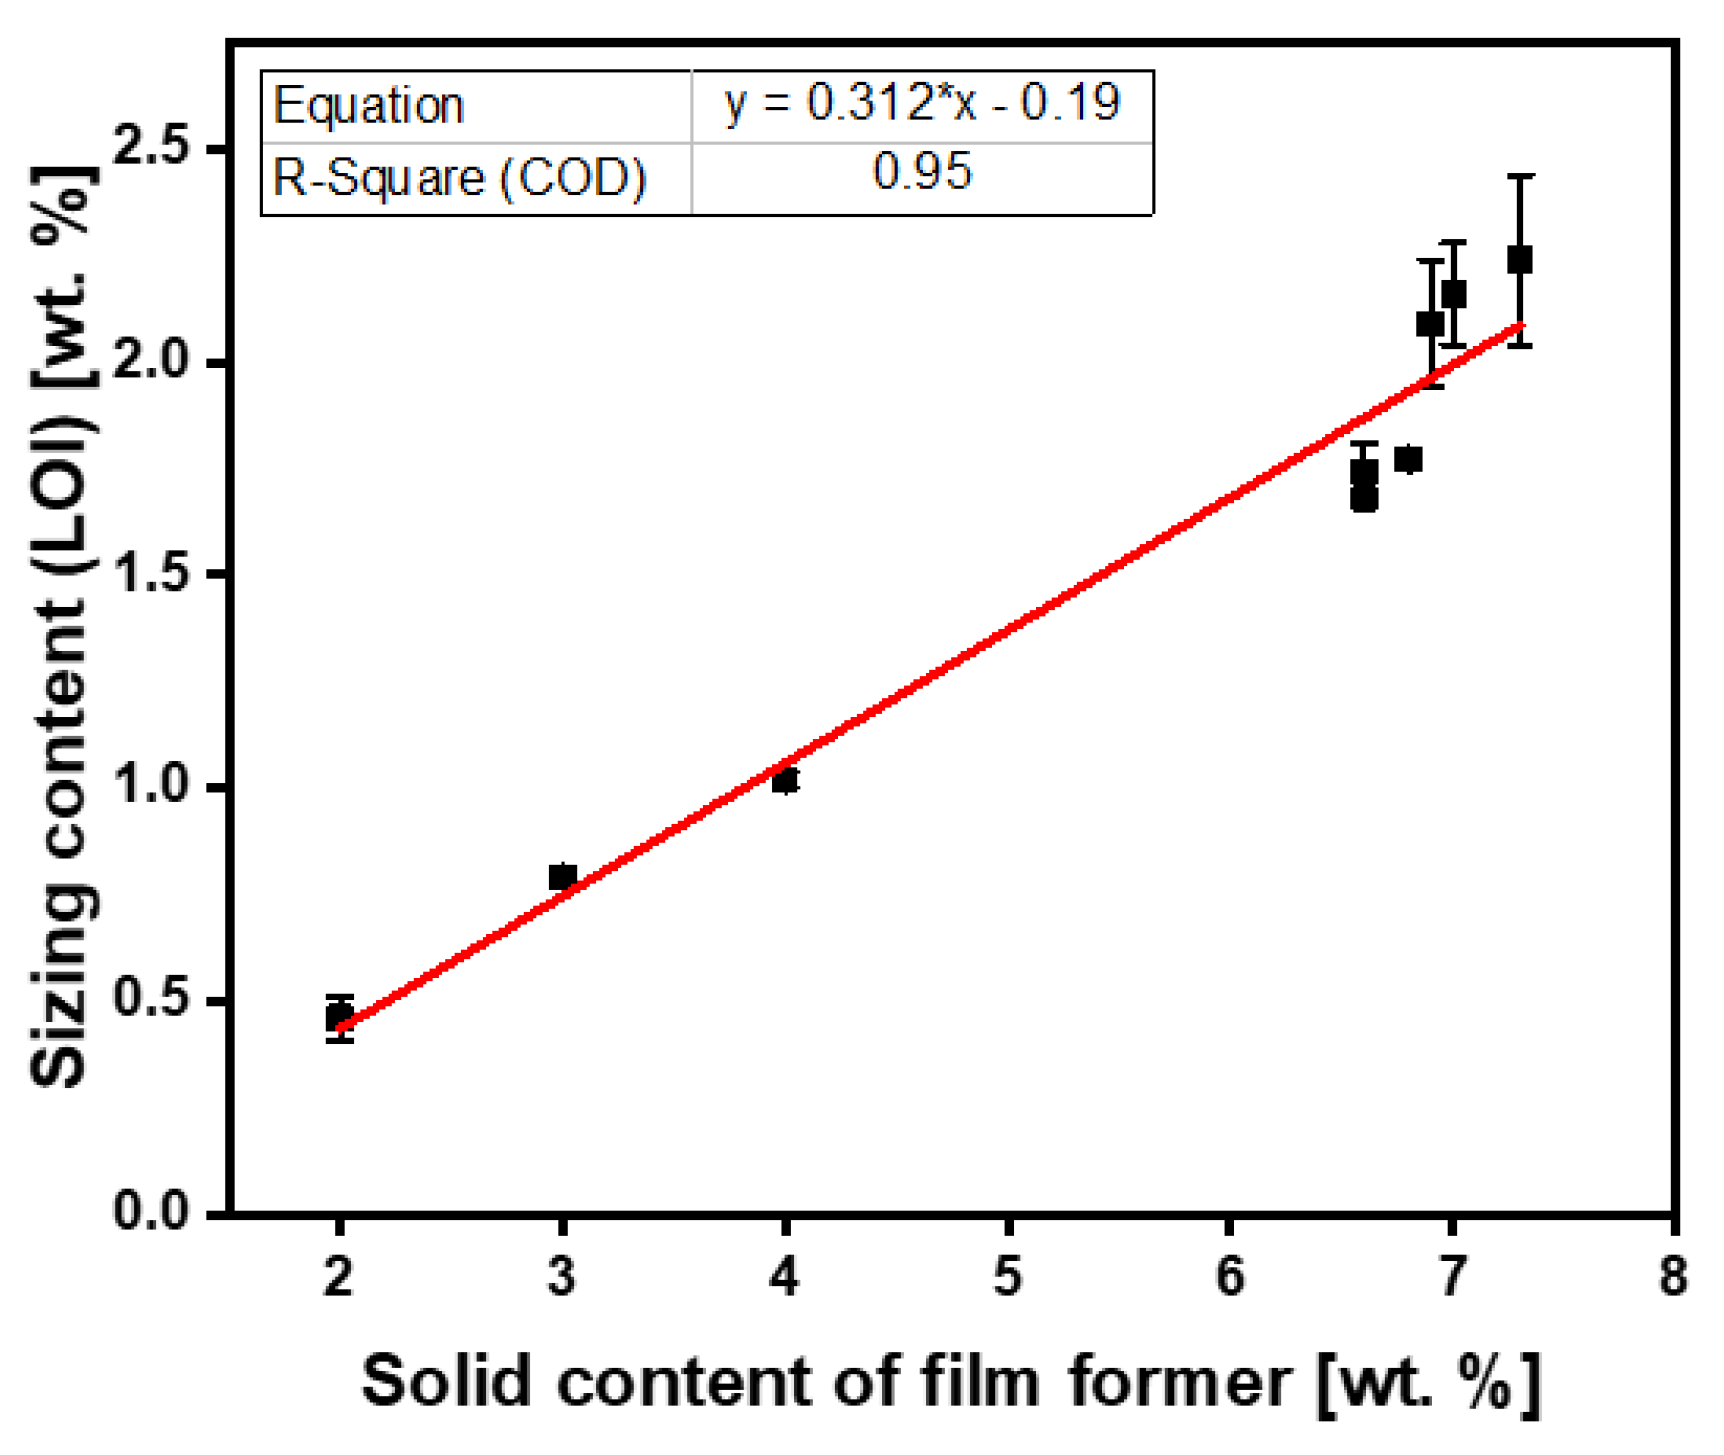
Figure 8.
Unsized carbon fibers: (a) tensile testing measurement using FAVIMAT+, and (b) two-parameter Weibull distribution analysis.
Figure 8.
Unsized carbon fibers: (a) tensile testing measurement using FAVIMAT+, and (b) two-parameter Weibull distribution analysis.
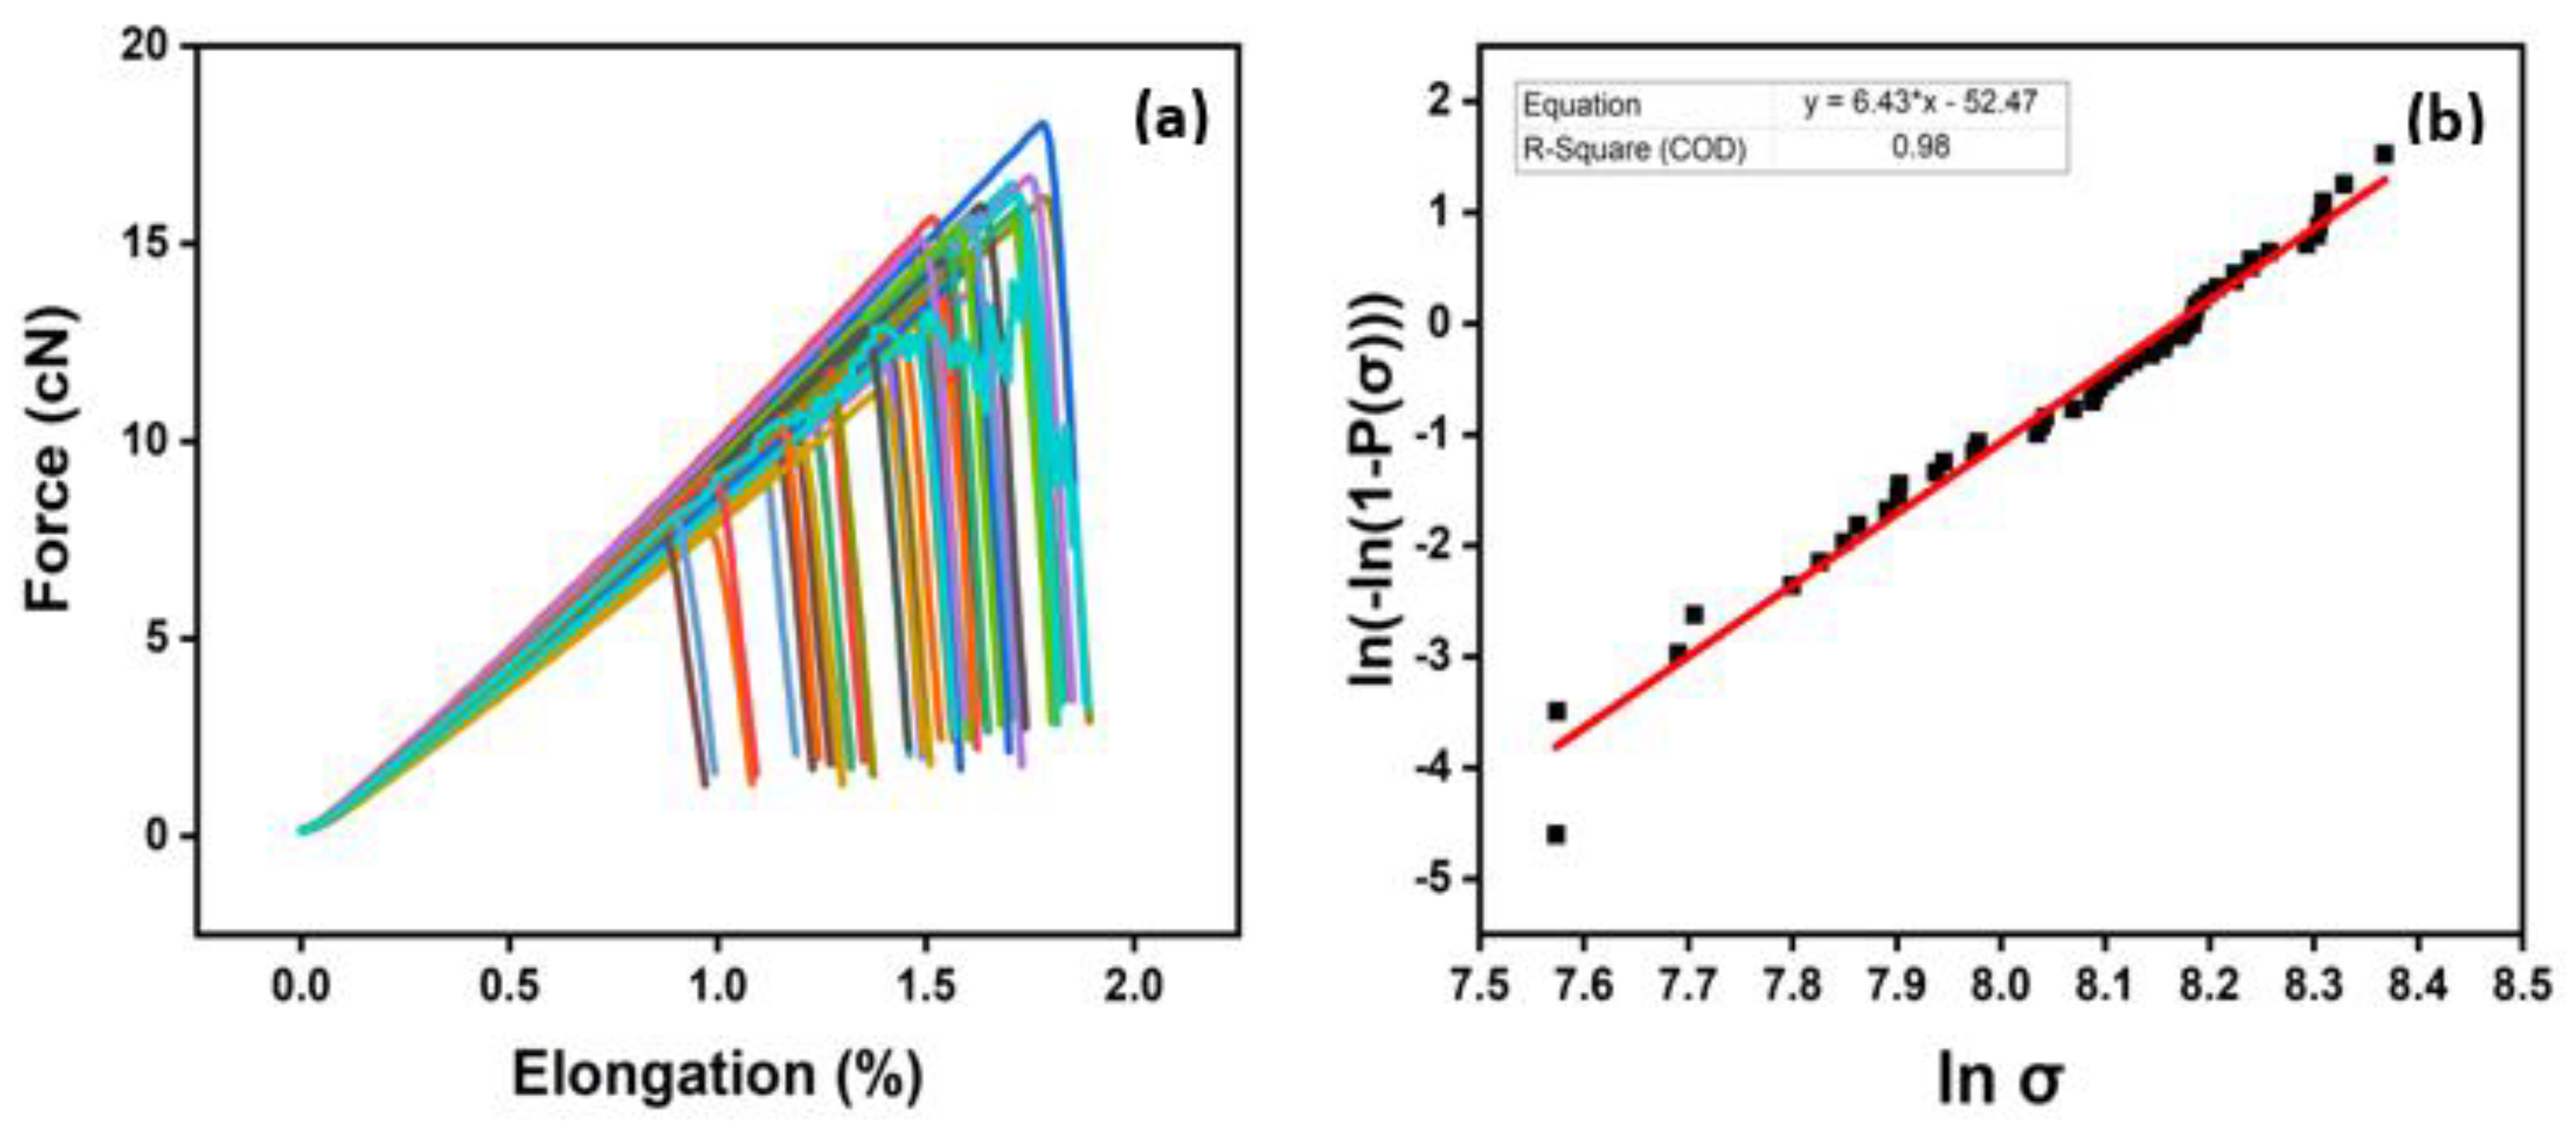
Figure 9.
Representative sample (A5) of HP3-02 sized carbon fibers: (a) tensile testing measurement using FAVIMAT+, and (b) two-parameter Weibull distribution analysis.
Figure 9.
Representative sample (A5) of HP3-02 sized carbon fibers: (a) tensile testing measurement using FAVIMAT+, and (b) two-parameter Weibull distribution analysis.
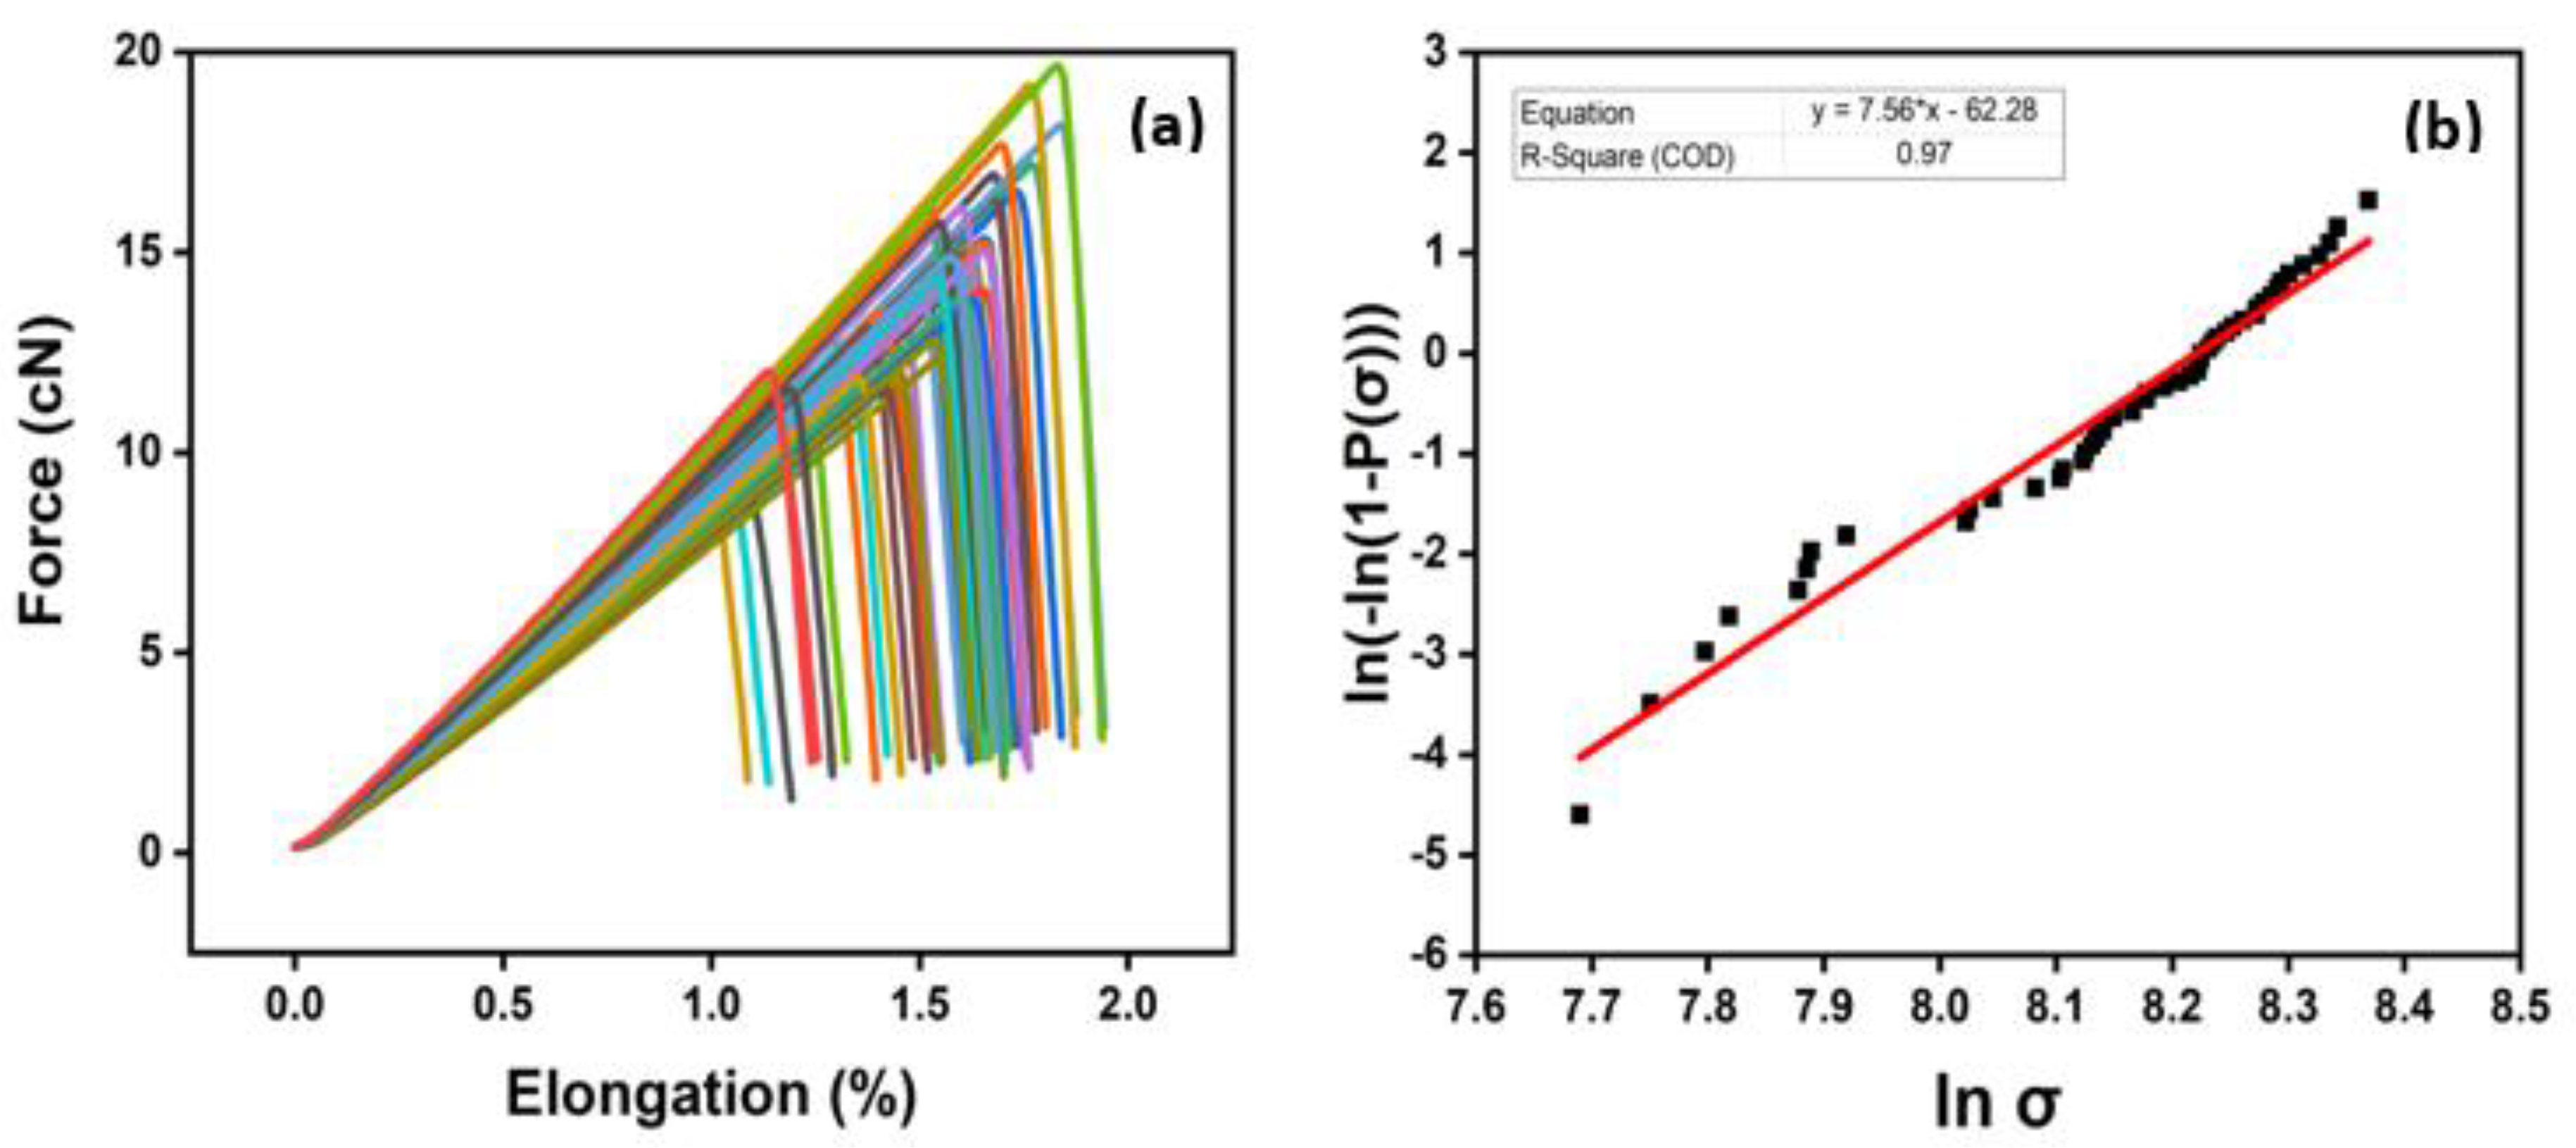
Figure 10.
Representative sample (B1) of HP2-06 sized carbon fibers: (a) tensile testing measurement using FAVIMAT+, and (b) two-parameter Weibull distribution analysis.
Figure 10.
Representative sample (B1) of HP2-06 sized carbon fibers: (a) tensile testing measurement using FAVIMAT+, and (b) two-parameter Weibull distribution analysis.
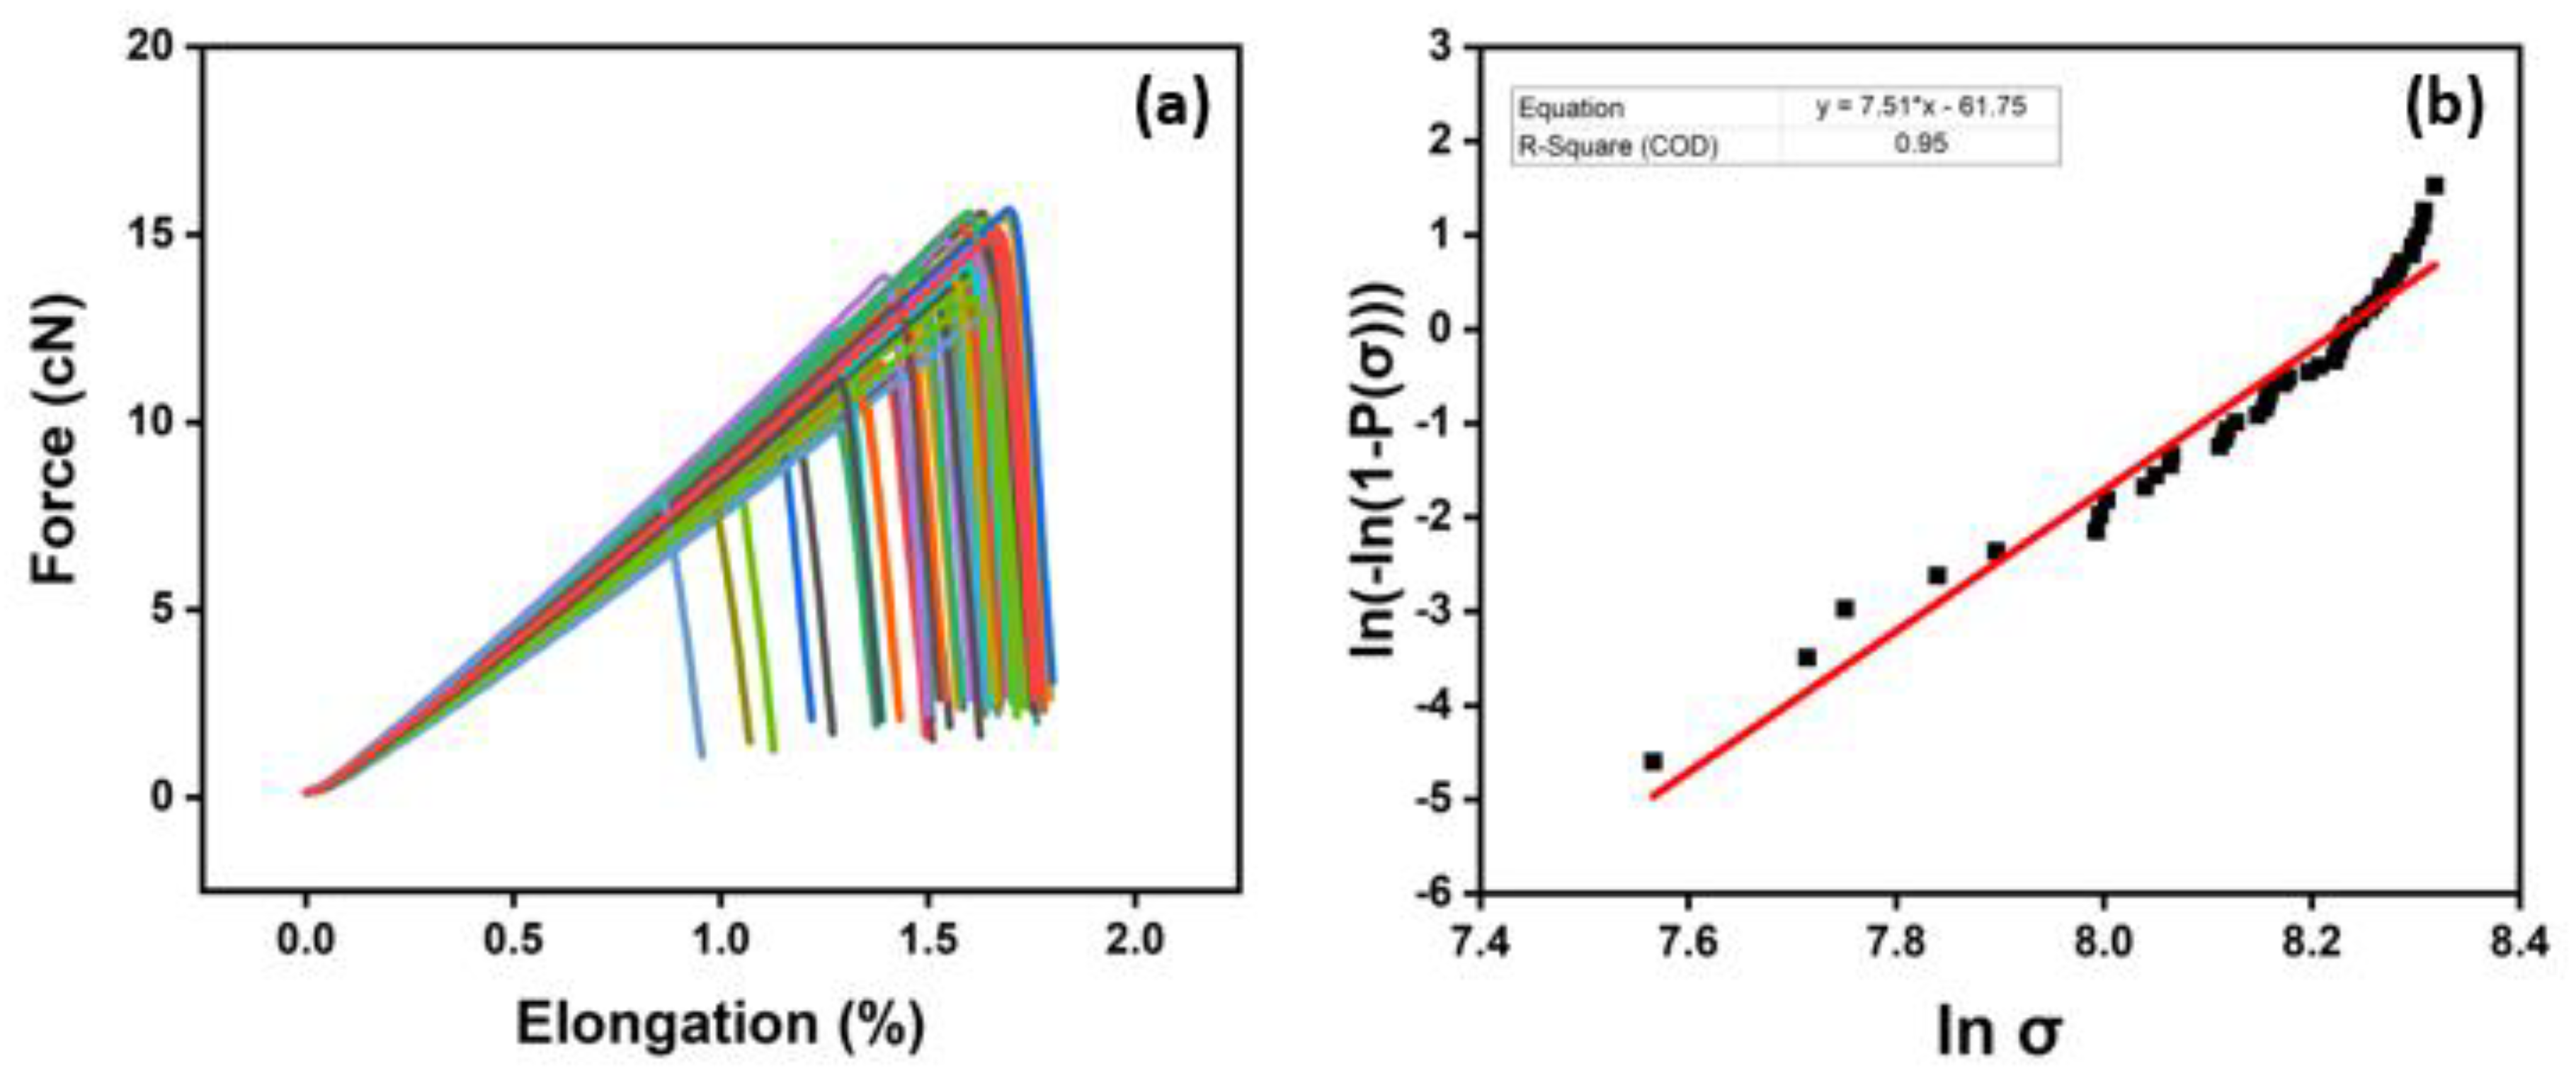
Figure 11.
(a) XPS survey of unsized fibers, (b) high-resolution C1s spectrum of unsized fibers, (c) XPS survey of HP3-02 sized fibers, (d) high-resolution C1s spectrum of HP3-02 sized fibers, (e) XPS survey of HP2-06 sized fibers, and (f) high-resolution C1s spectrum of HP2-06 sized fibers.
Figure 11.
(a) XPS survey of unsized fibers, (b) high-resolution C1s spectrum of unsized fibers, (c) XPS survey of HP3-02 sized fibers, (d) high-resolution C1s spectrum of HP3-02 sized fibers, (e) XPS survey of HP2-06 sized fibers, and (f) high-resolution C1s spectrum of HP2-06 sized fibers.
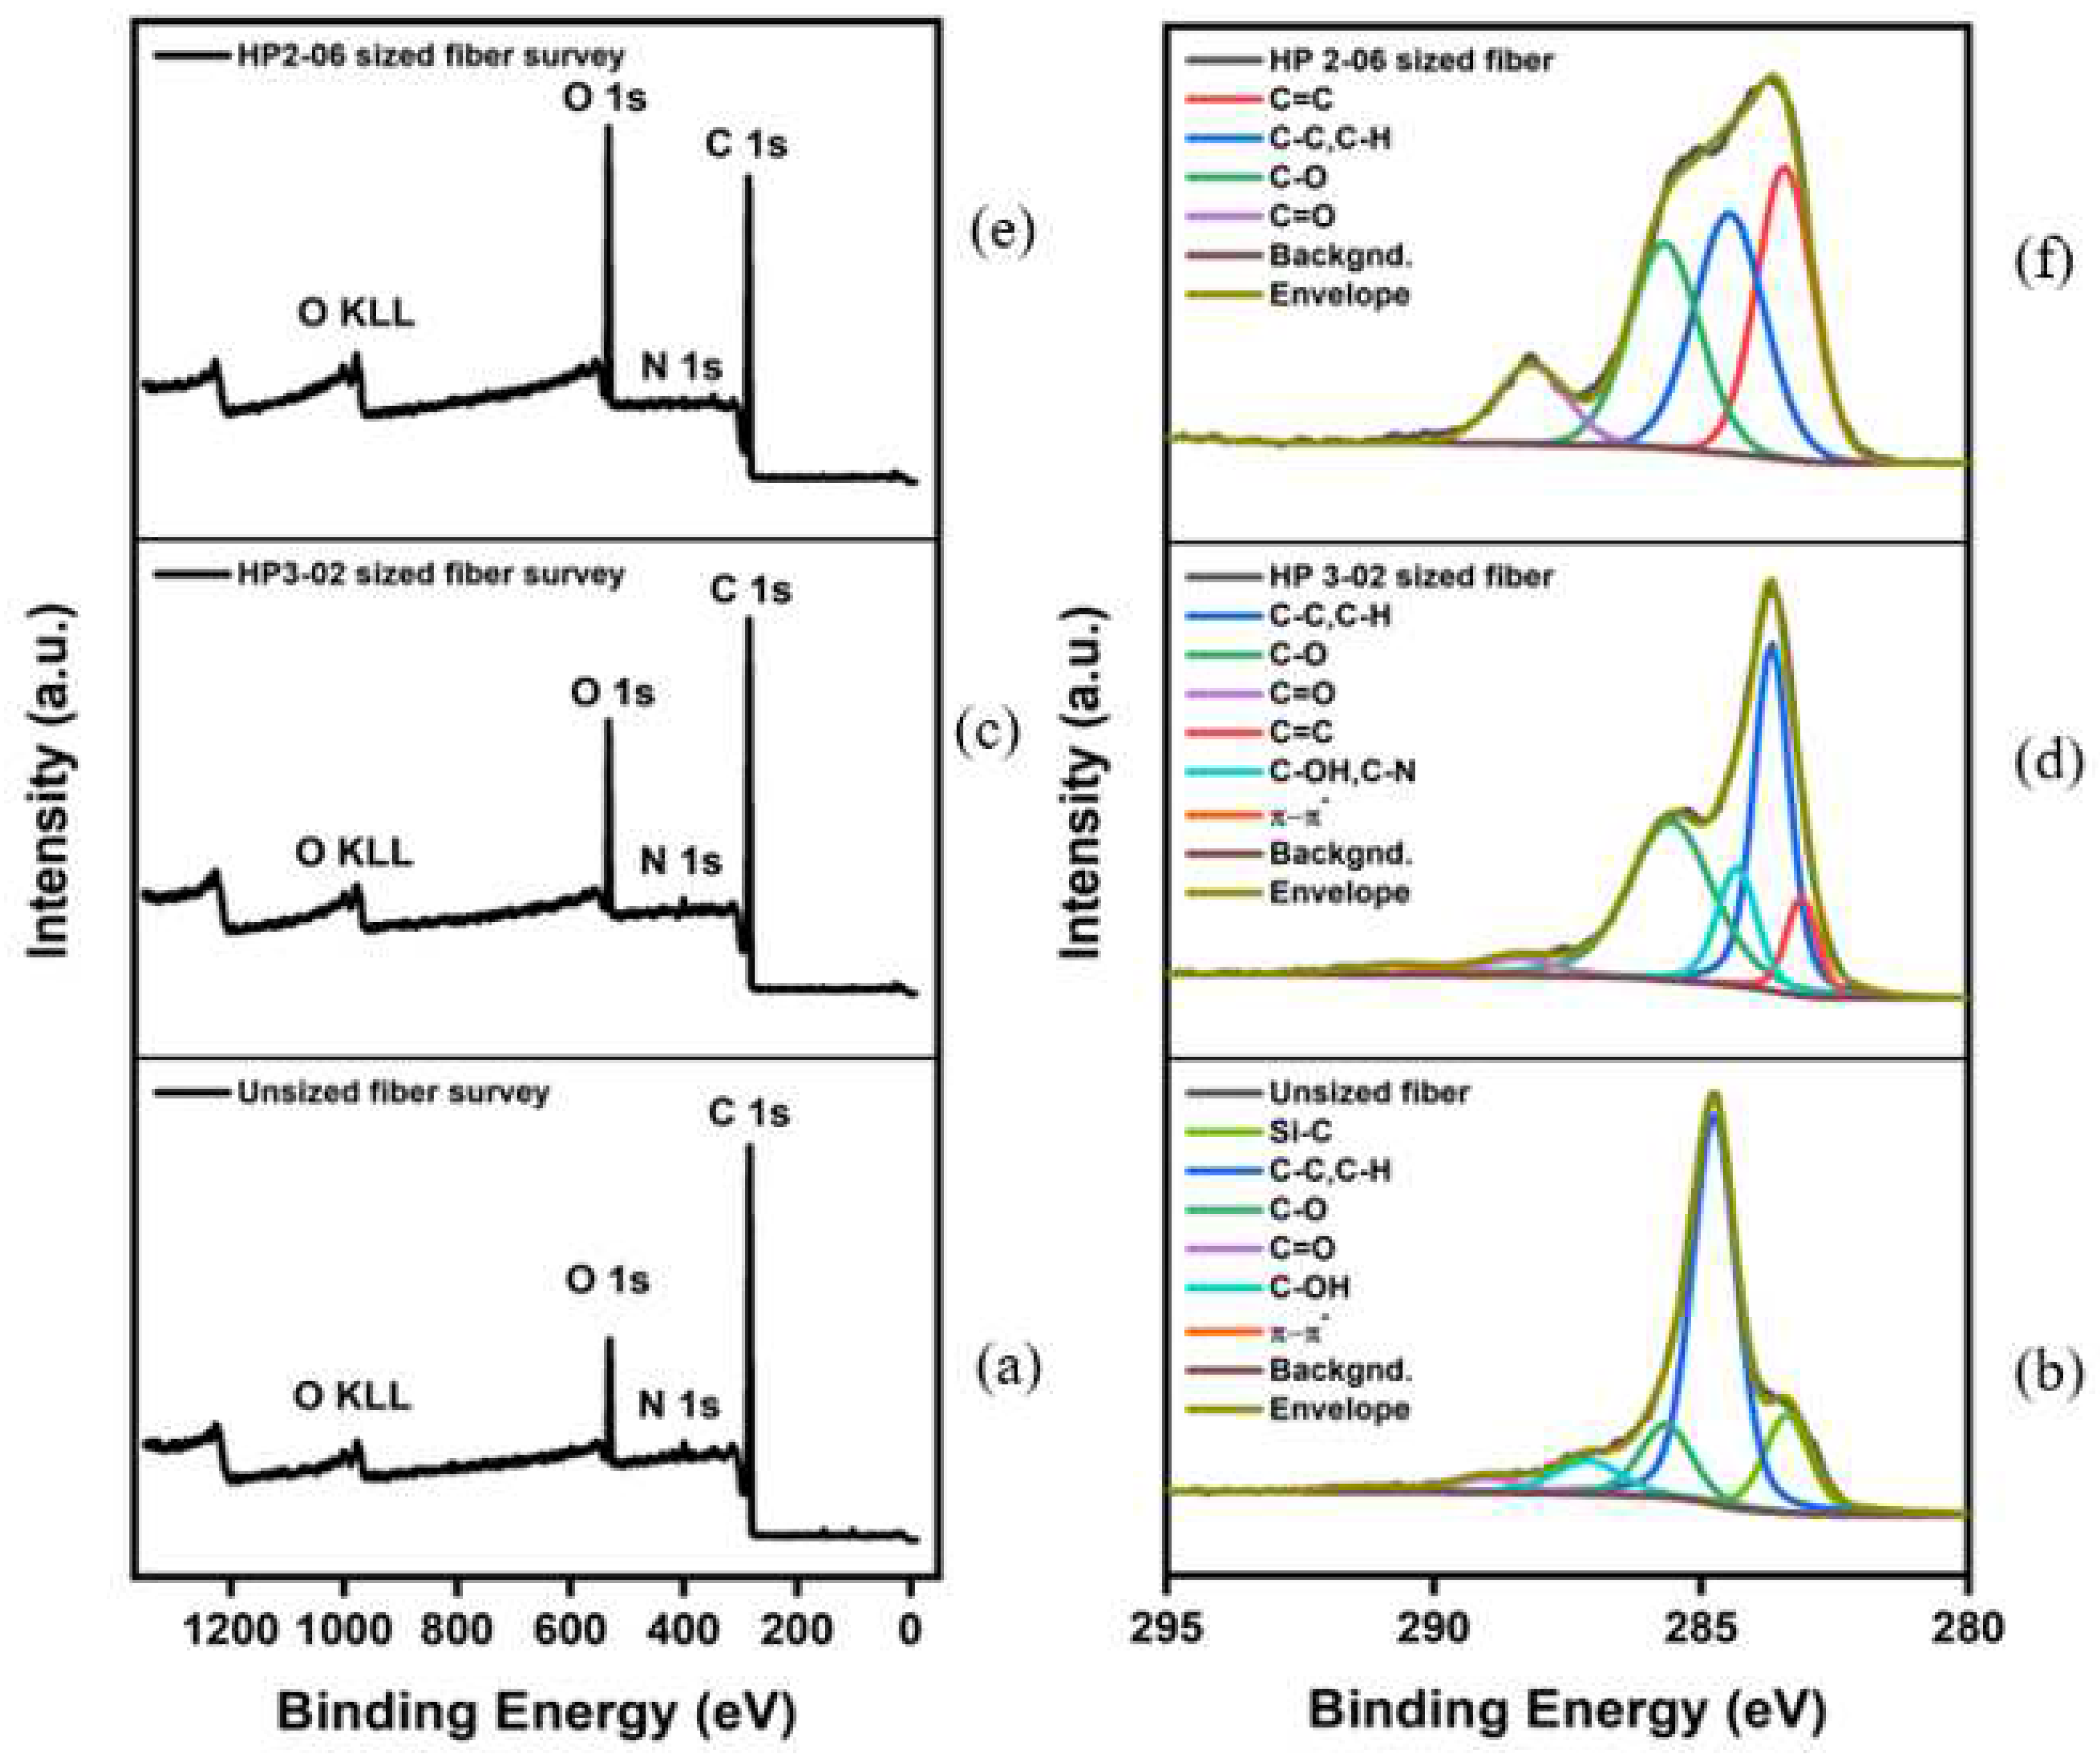
Figure 12.
Force-displacement curves of unsized fibers (left) and SEM-image of a fiber after SFPO (right).
Figure 12.
Force-displacement curves of unsized fibers (left) and SEM-image of a fiber after SFPO (right).
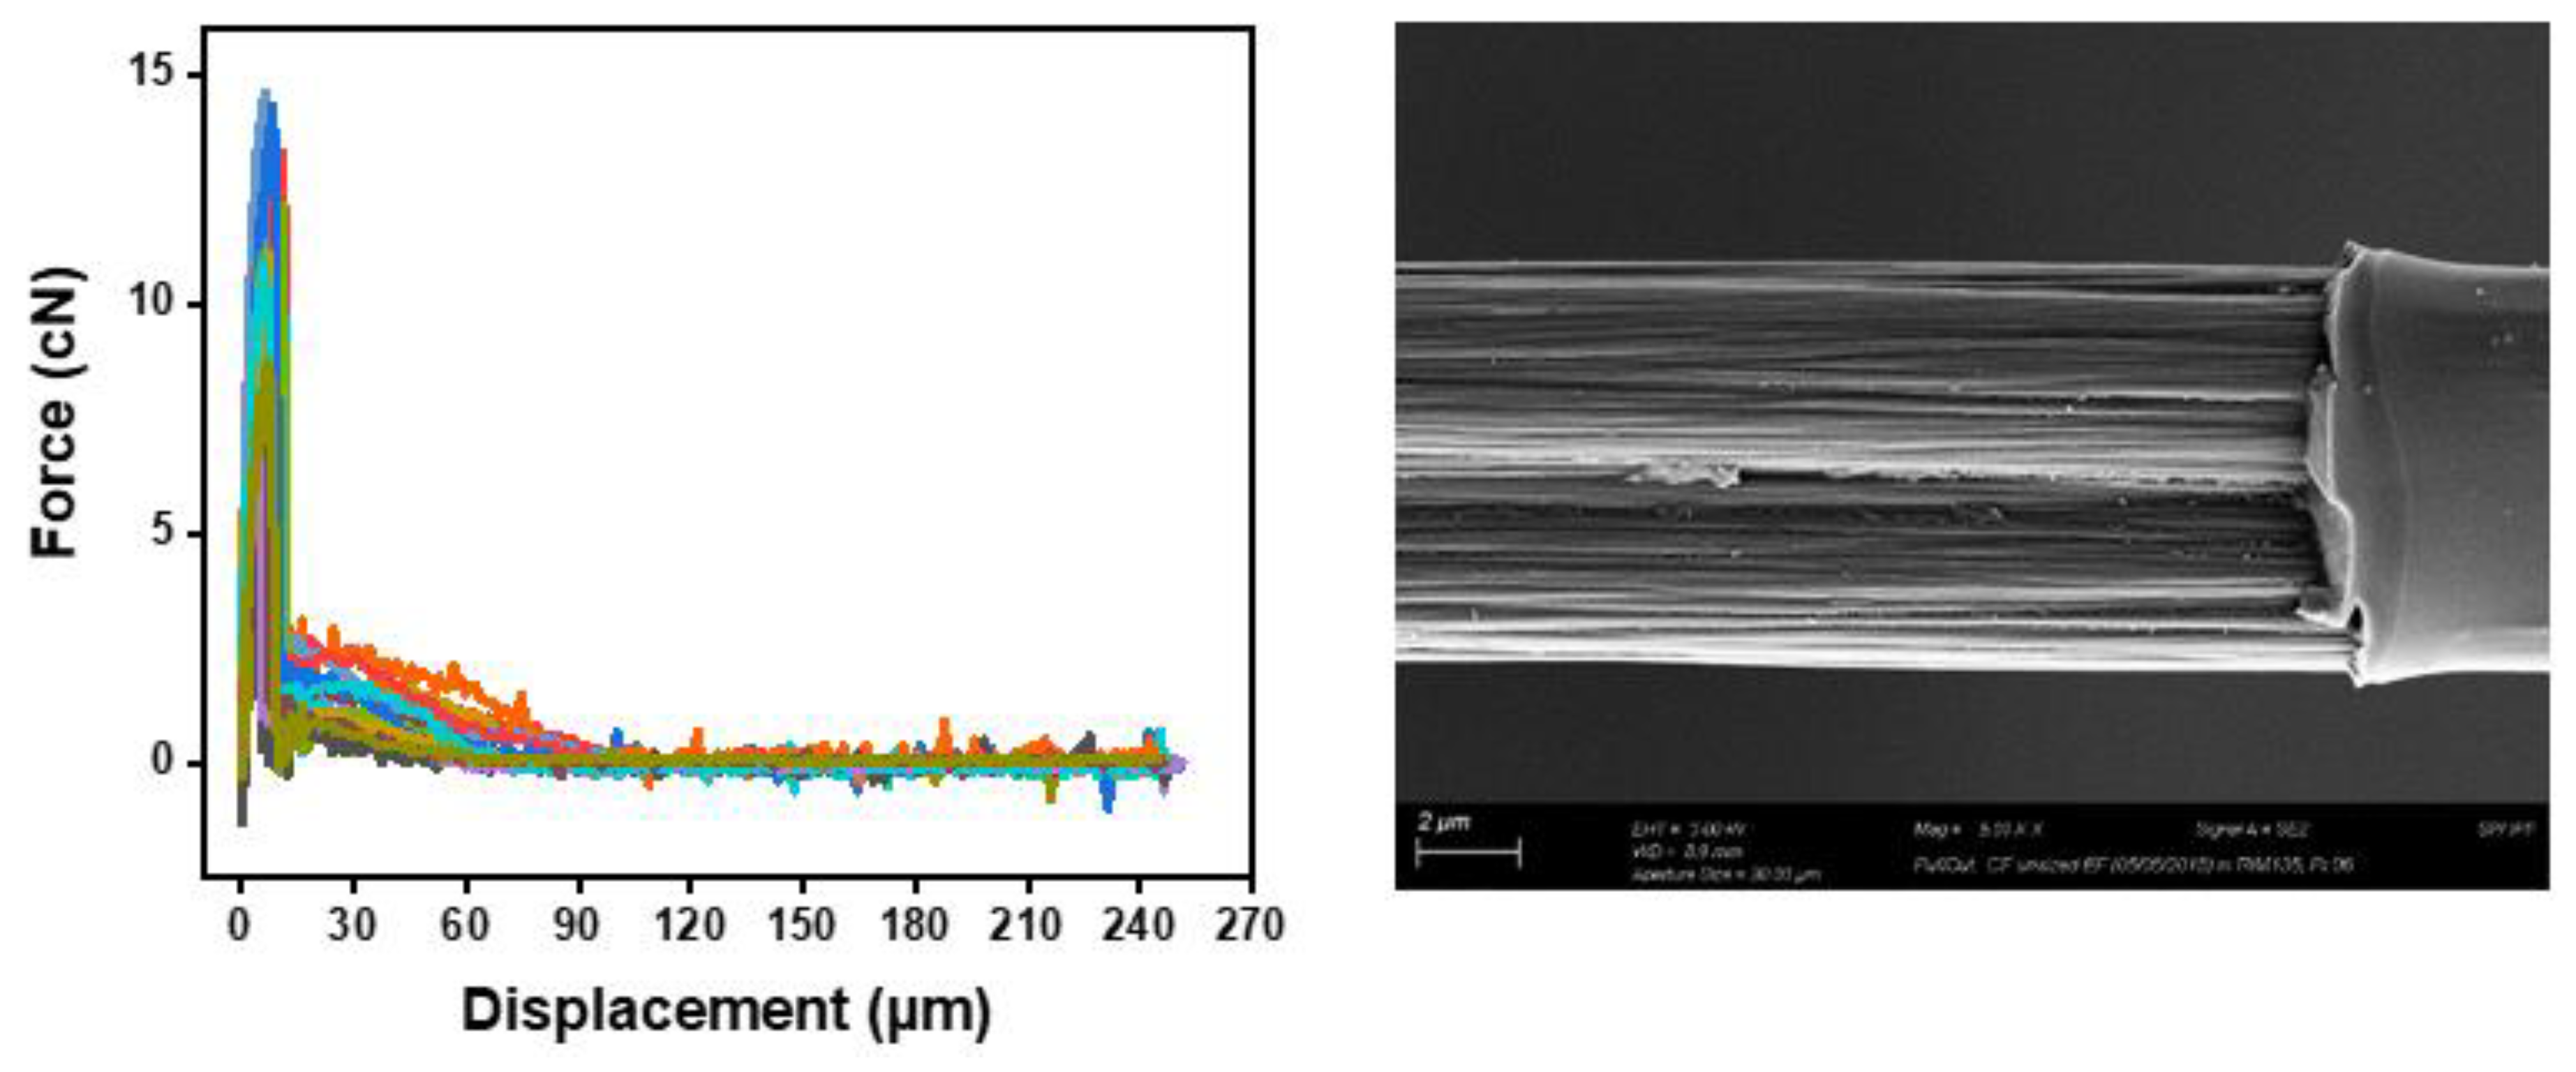
Figure 13.
Representative sample (A5) of HP3-02 sized carbon fibers, (left) Force-displacement curves of , and SEM observation of a fiber surface after testing showing a non-significant amount of residual epoxy on the surface (right).
Figure 13.
Representative sample (A5) of HP3-02 sized carbon fibers, (left) Force-displacement curves of , and SEM observation of a fiber surface after testing showing a non-significant amount of residual epoxy on the surface (right).
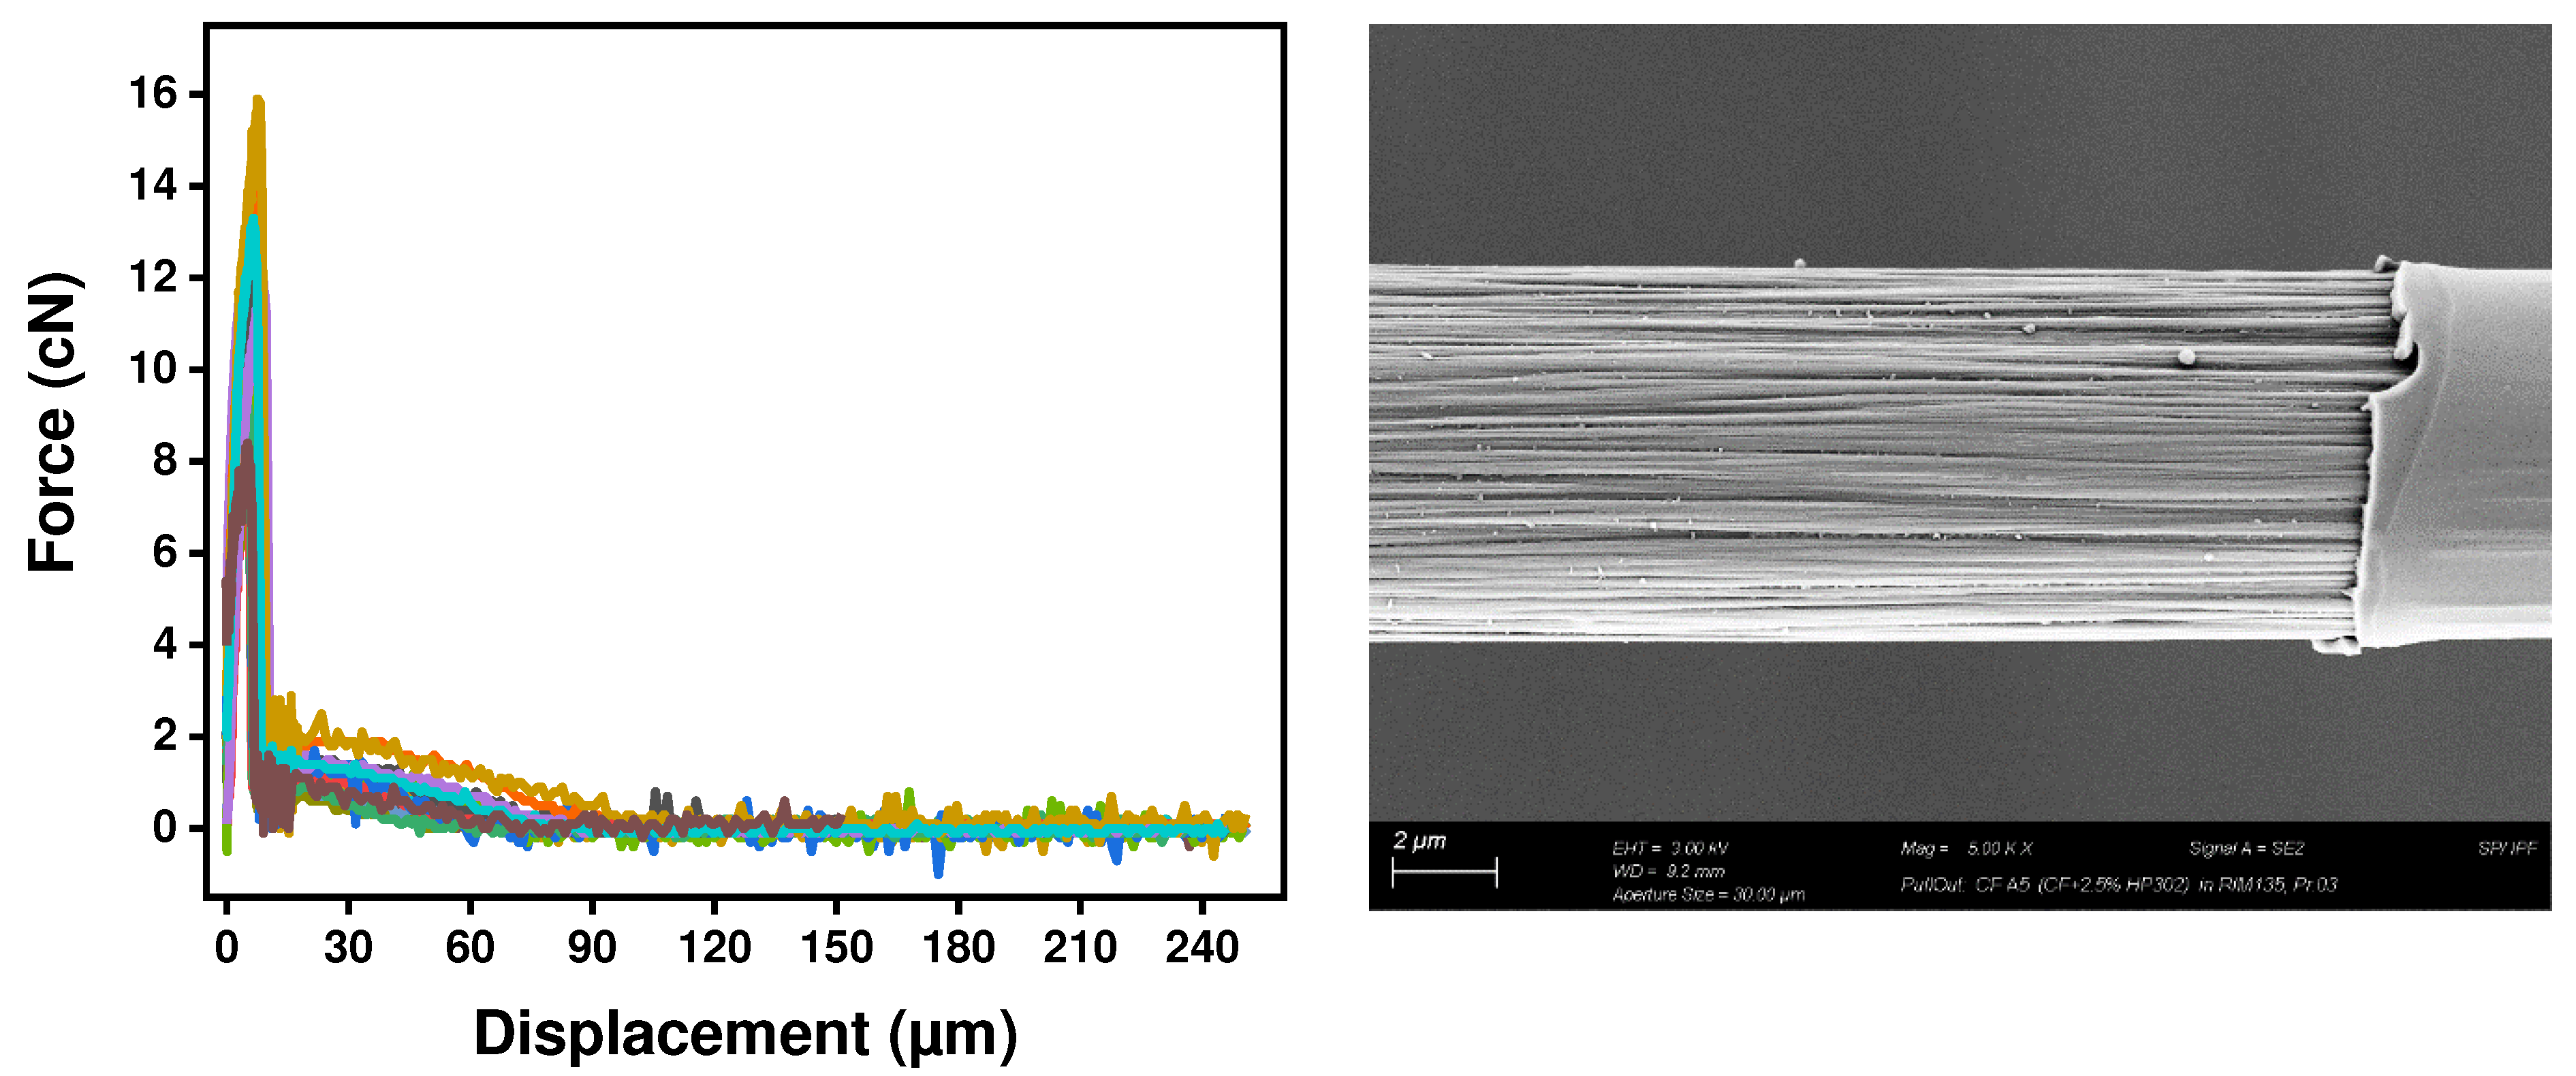
Figure 14.
Representative sample (B3) of HP2-06 sized carbon fibers, (left) Force-displacement curves of , and SEM observation of a fiber surface after testing showing a uniform residual epoxy on the surface (right).
Figure 14.
Representative sample (B3) of HP2-06 sized carbon fibers, (left) Force-displacement curves of , and SEM observation of a fiber surface after testing showing a uniform residual epoxy on the surface (right).
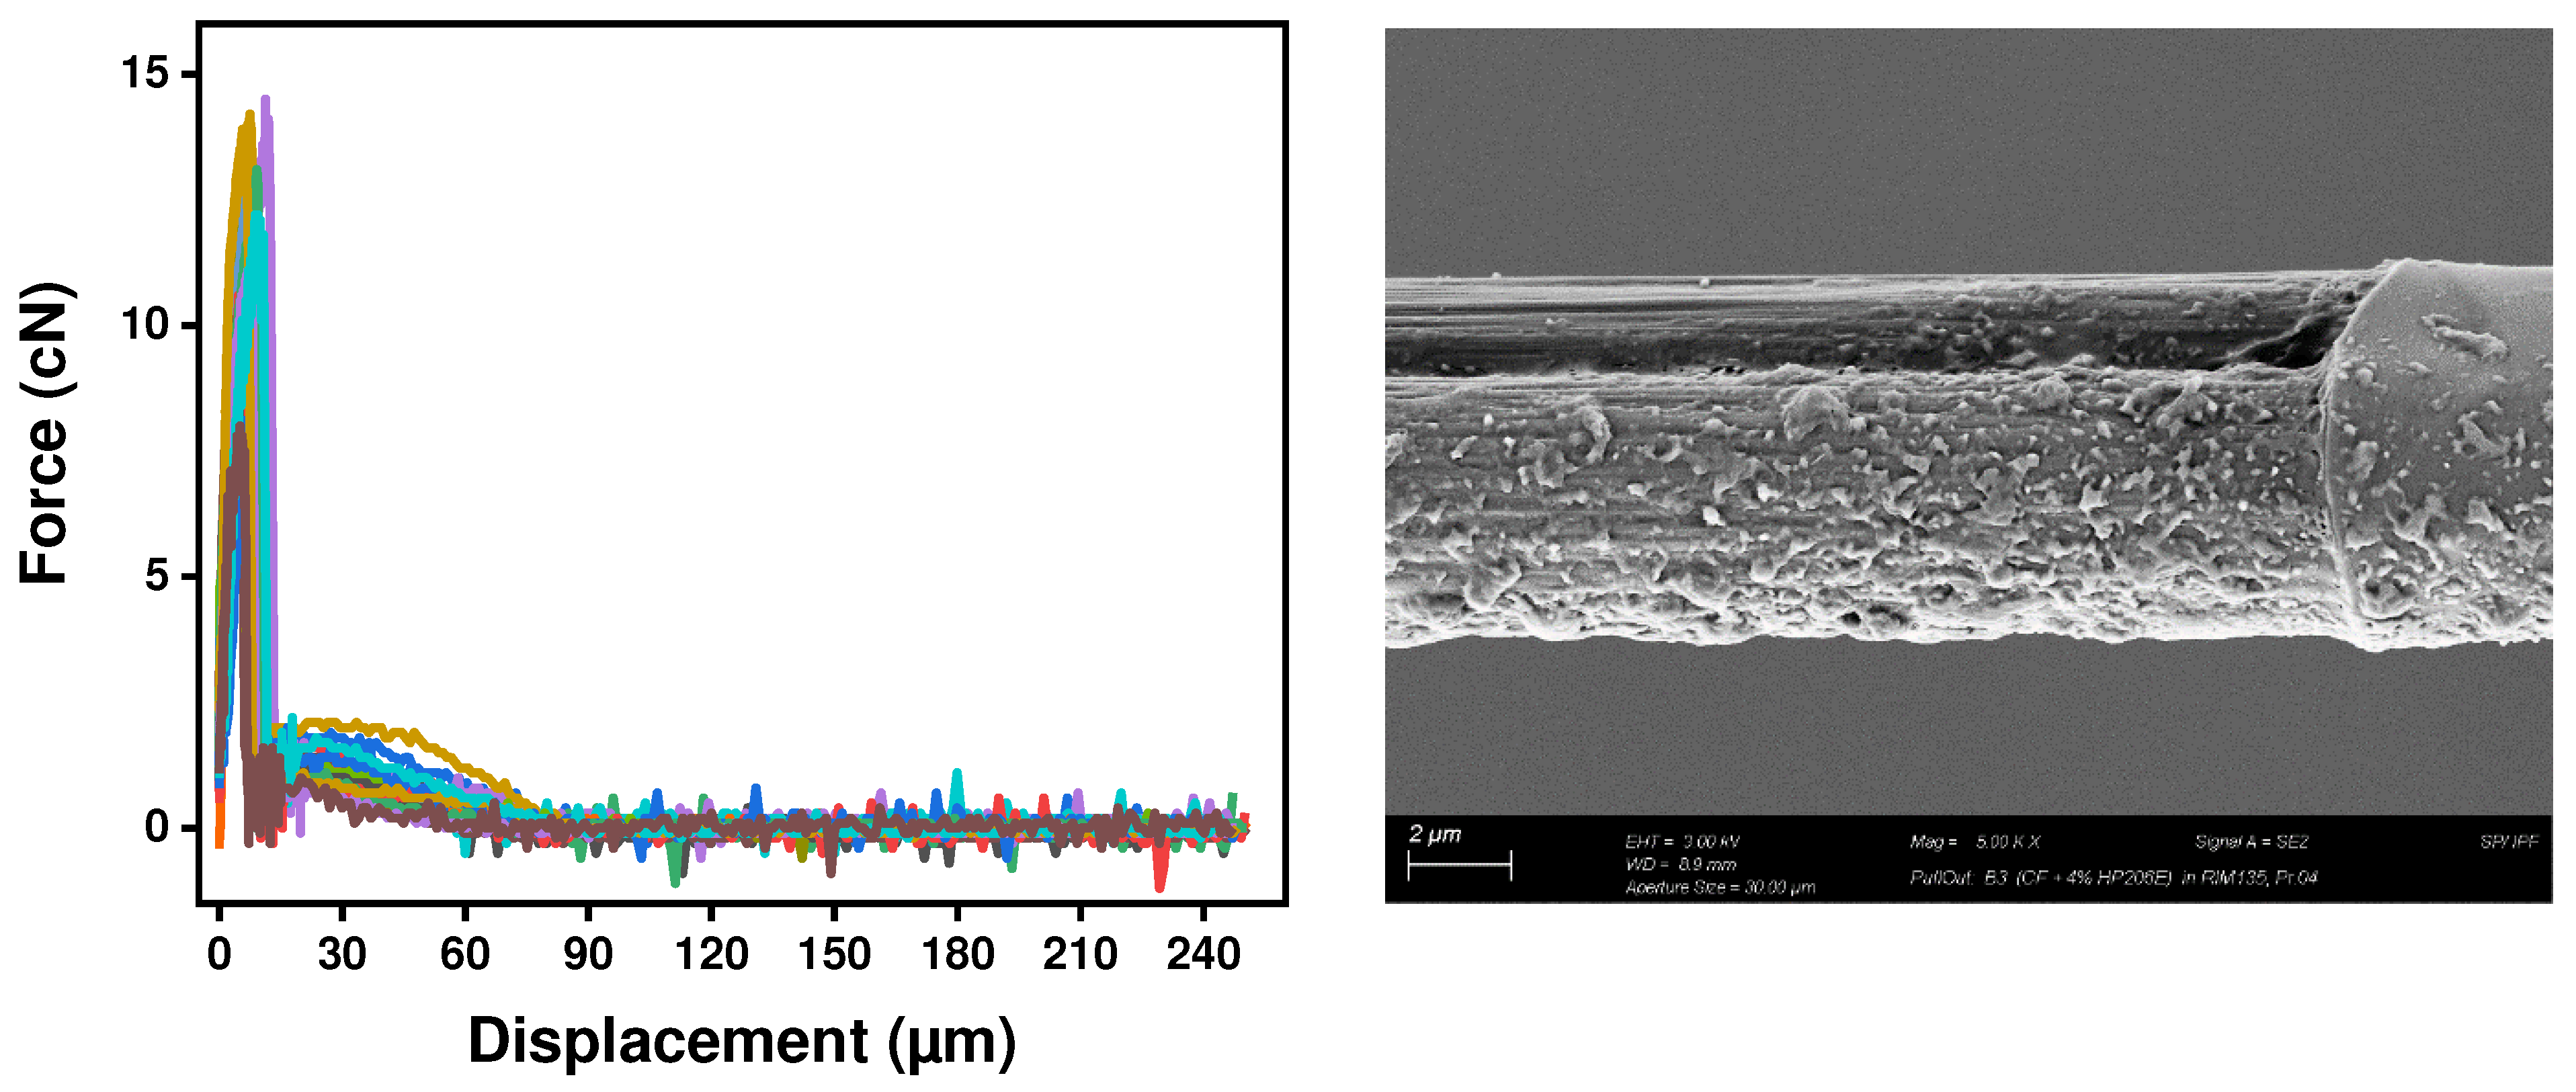
Figure 15.
Effect of HP3-02 sizing levels on the apparent interfacial shear stress and the O/C surface composition ratio.
Figure 15.
Effect of HP3-02 sizing levels on the apparent interfacial shear stress and the O/C surface composition ratio.
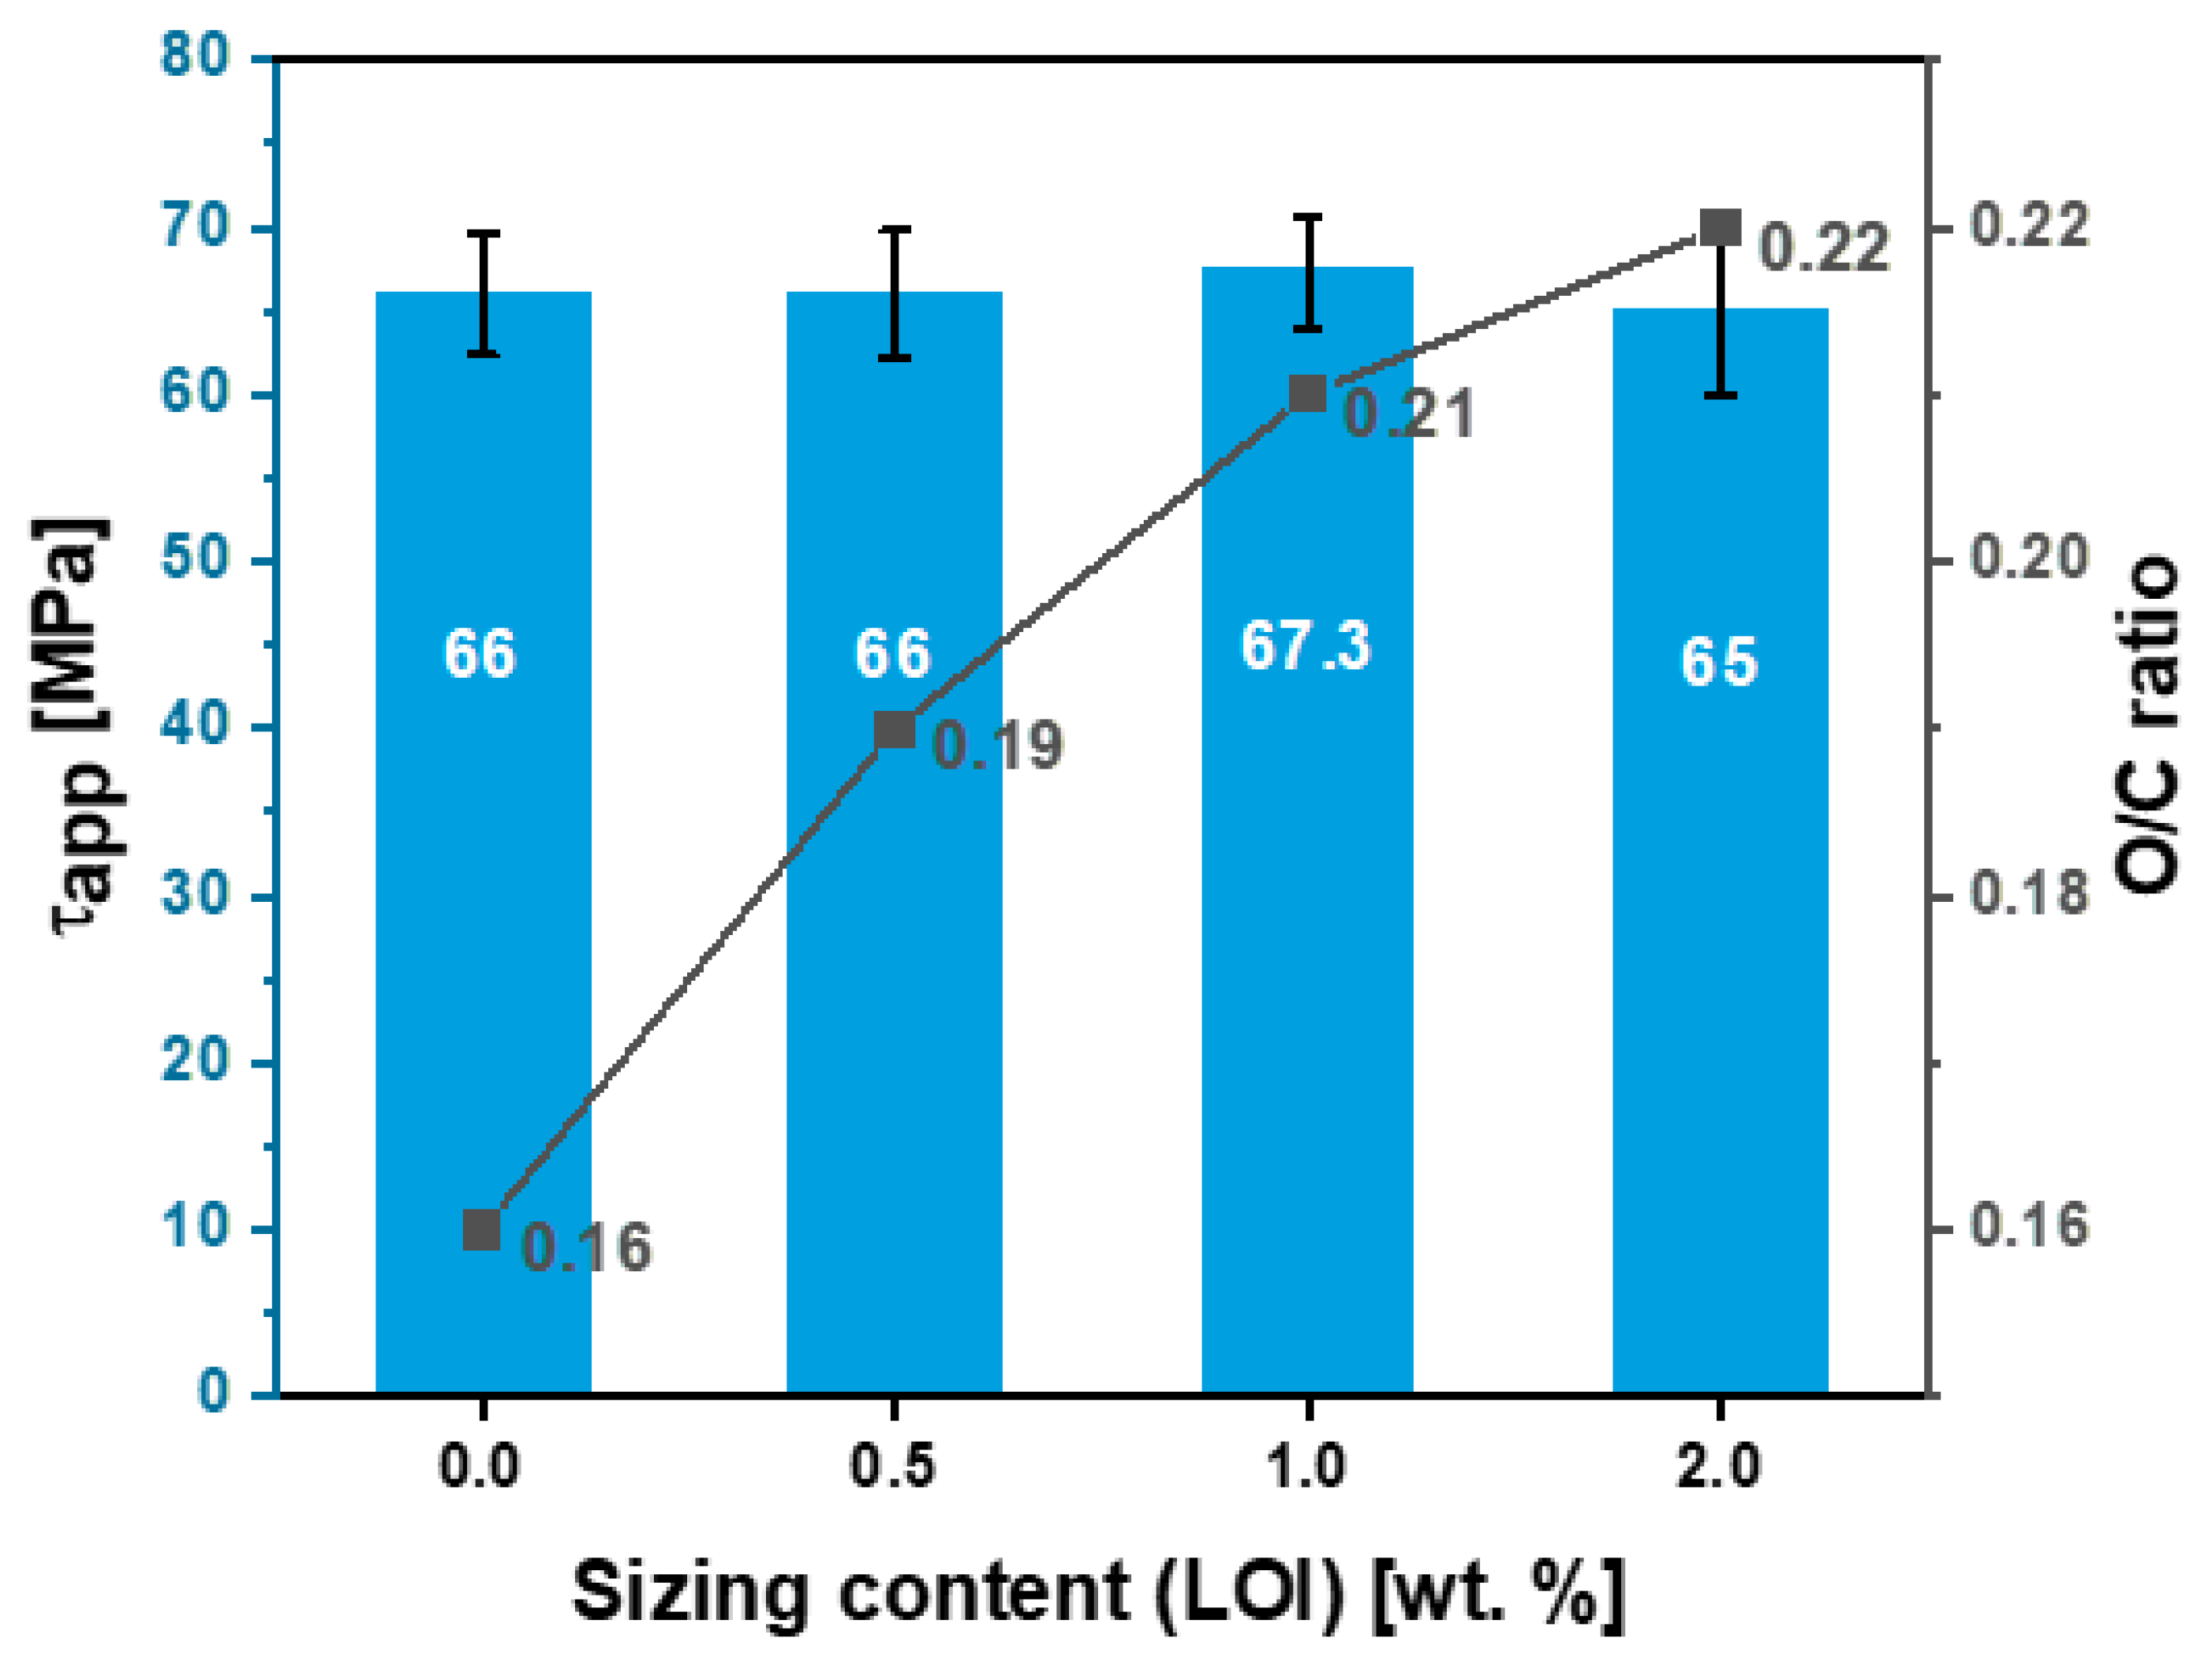
Figure 16.
Effect of HP2-06 sizing levels on the apparent interfacial shear stress and the O/C surface composition ratio.
Figure 16.
Effect of HP2-06 sizing levels on the apparent interfacial shear stress and the O/C surface composition ratio.
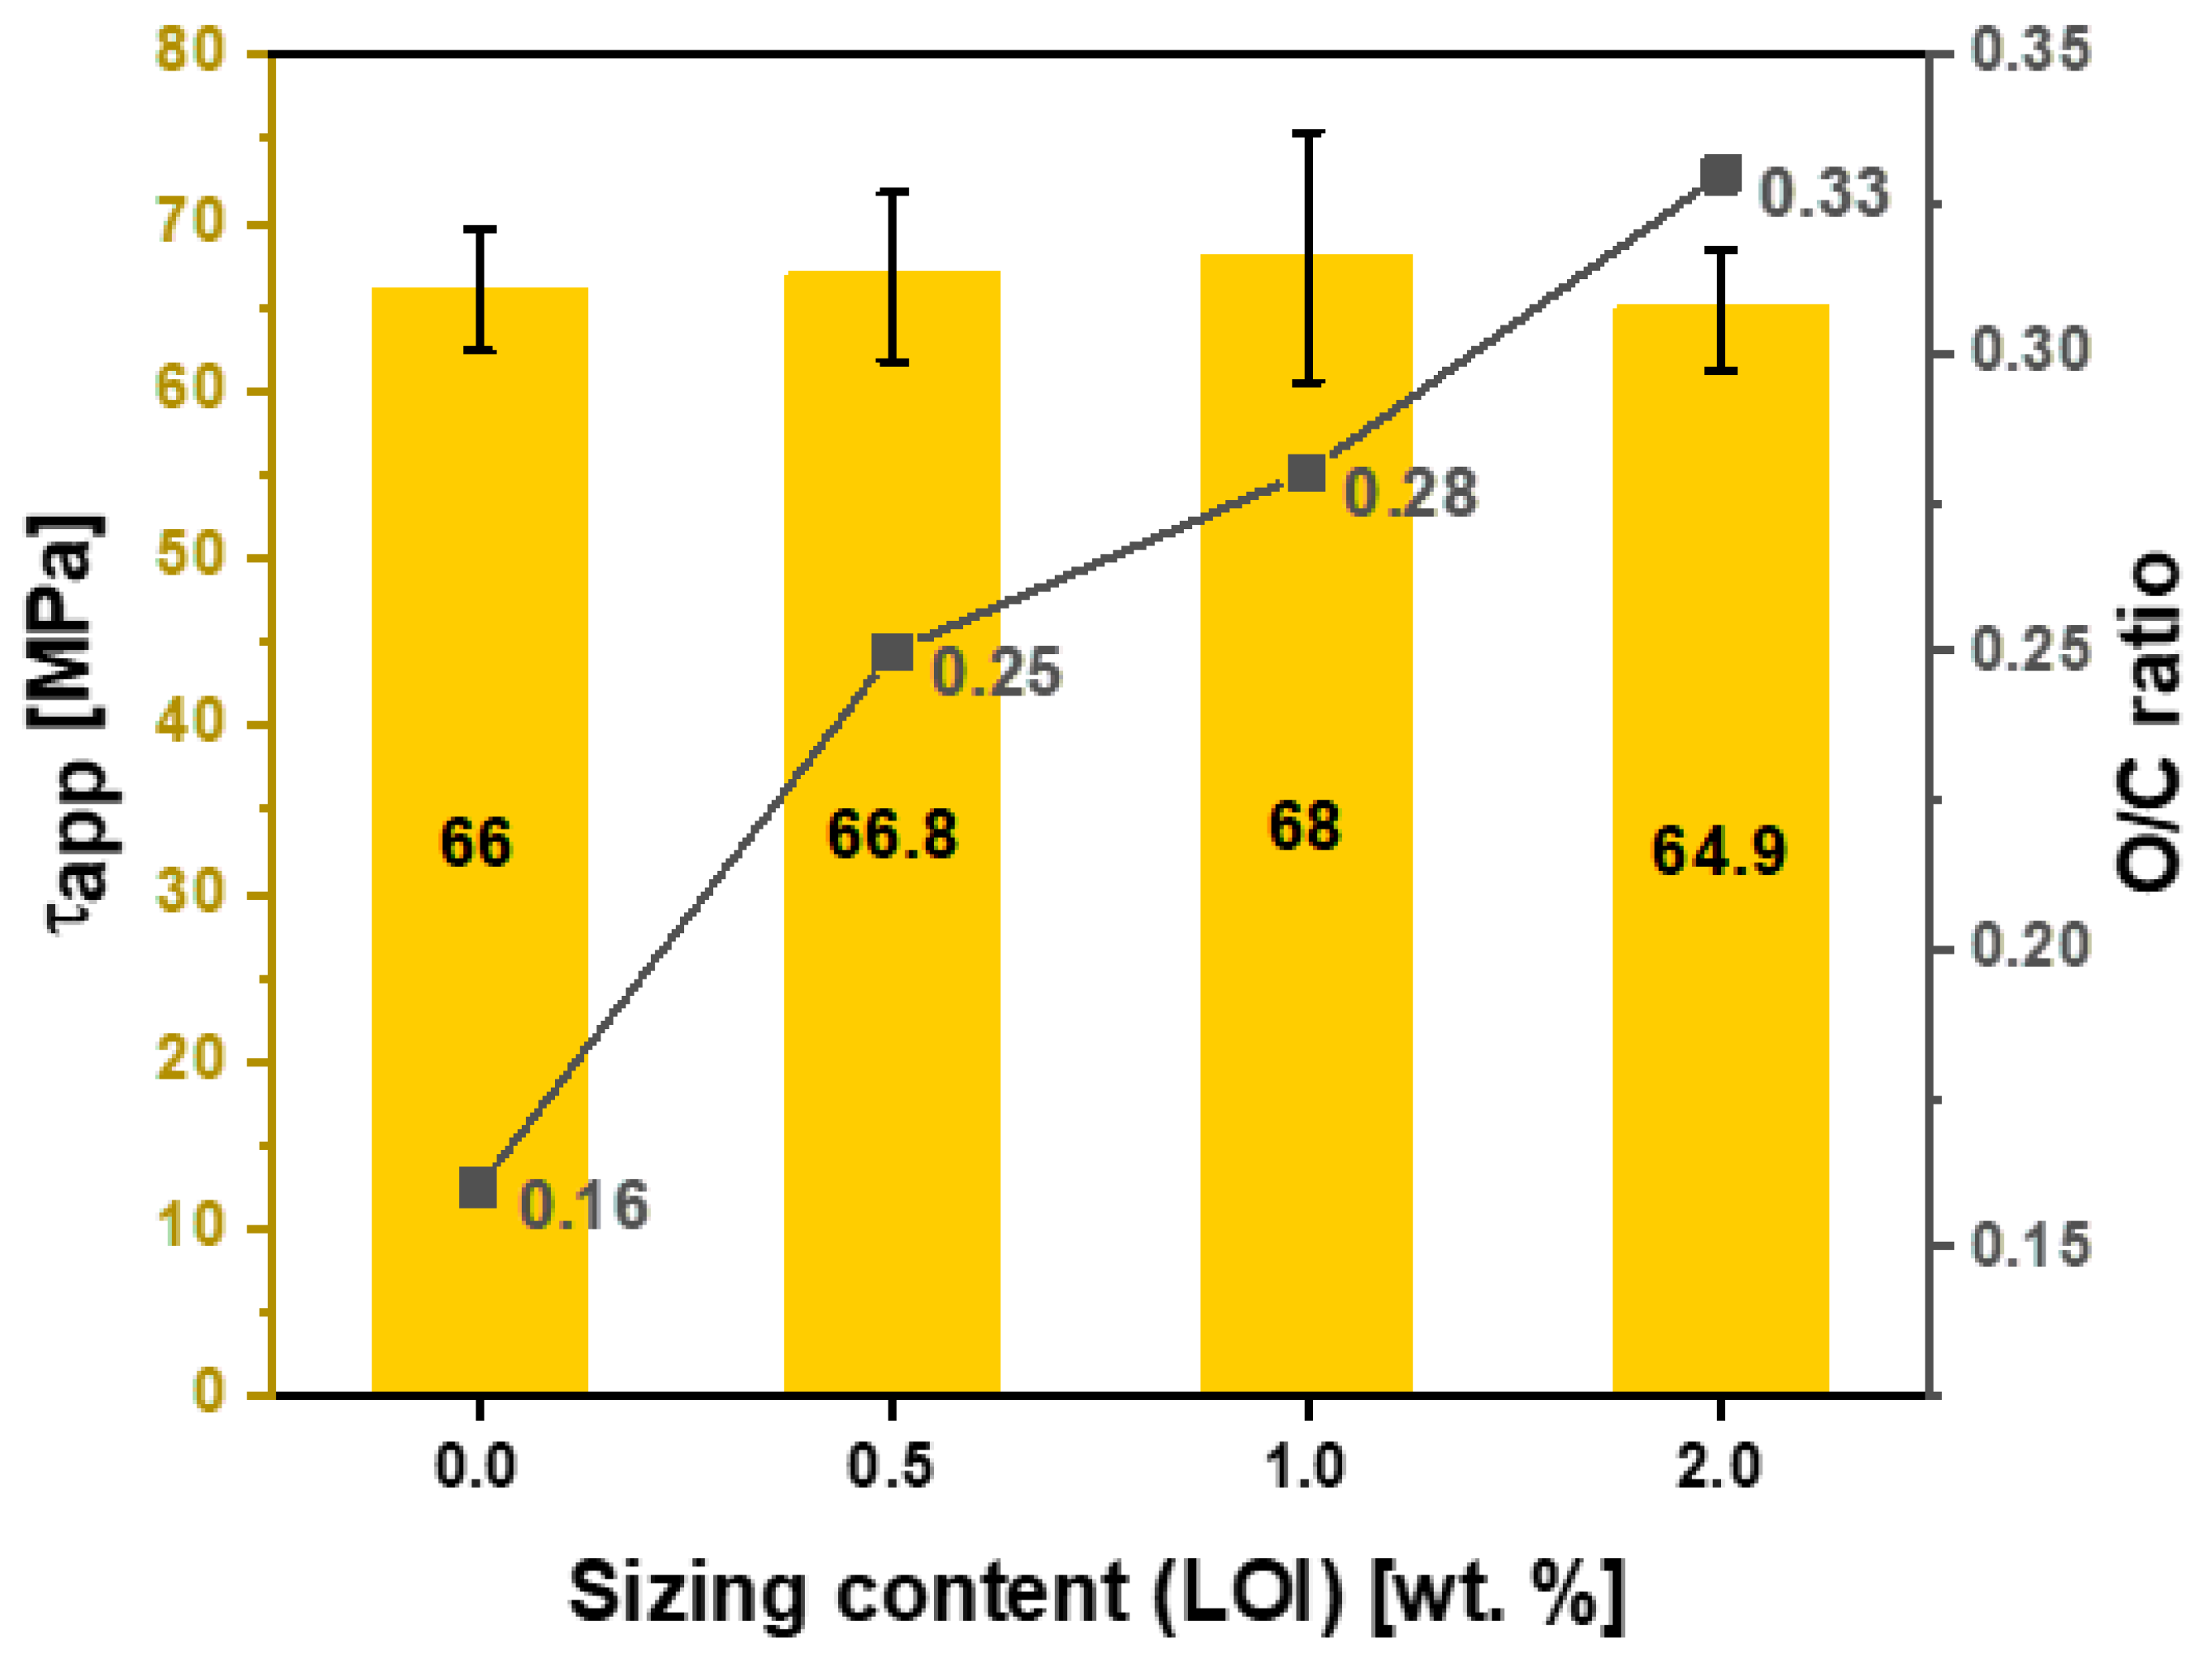
Figure 17.
Effect of Hydrosize® HP3-02 sizing content on the apparent interfacial shear stress and the characteristic stress of sized and unsizedfibers.
Figure 17.
Effect of Hydrosize® HP3-02 sizing content on the apparent interfacial shear stress and the characteristic stress of sized and unsizedfibers.
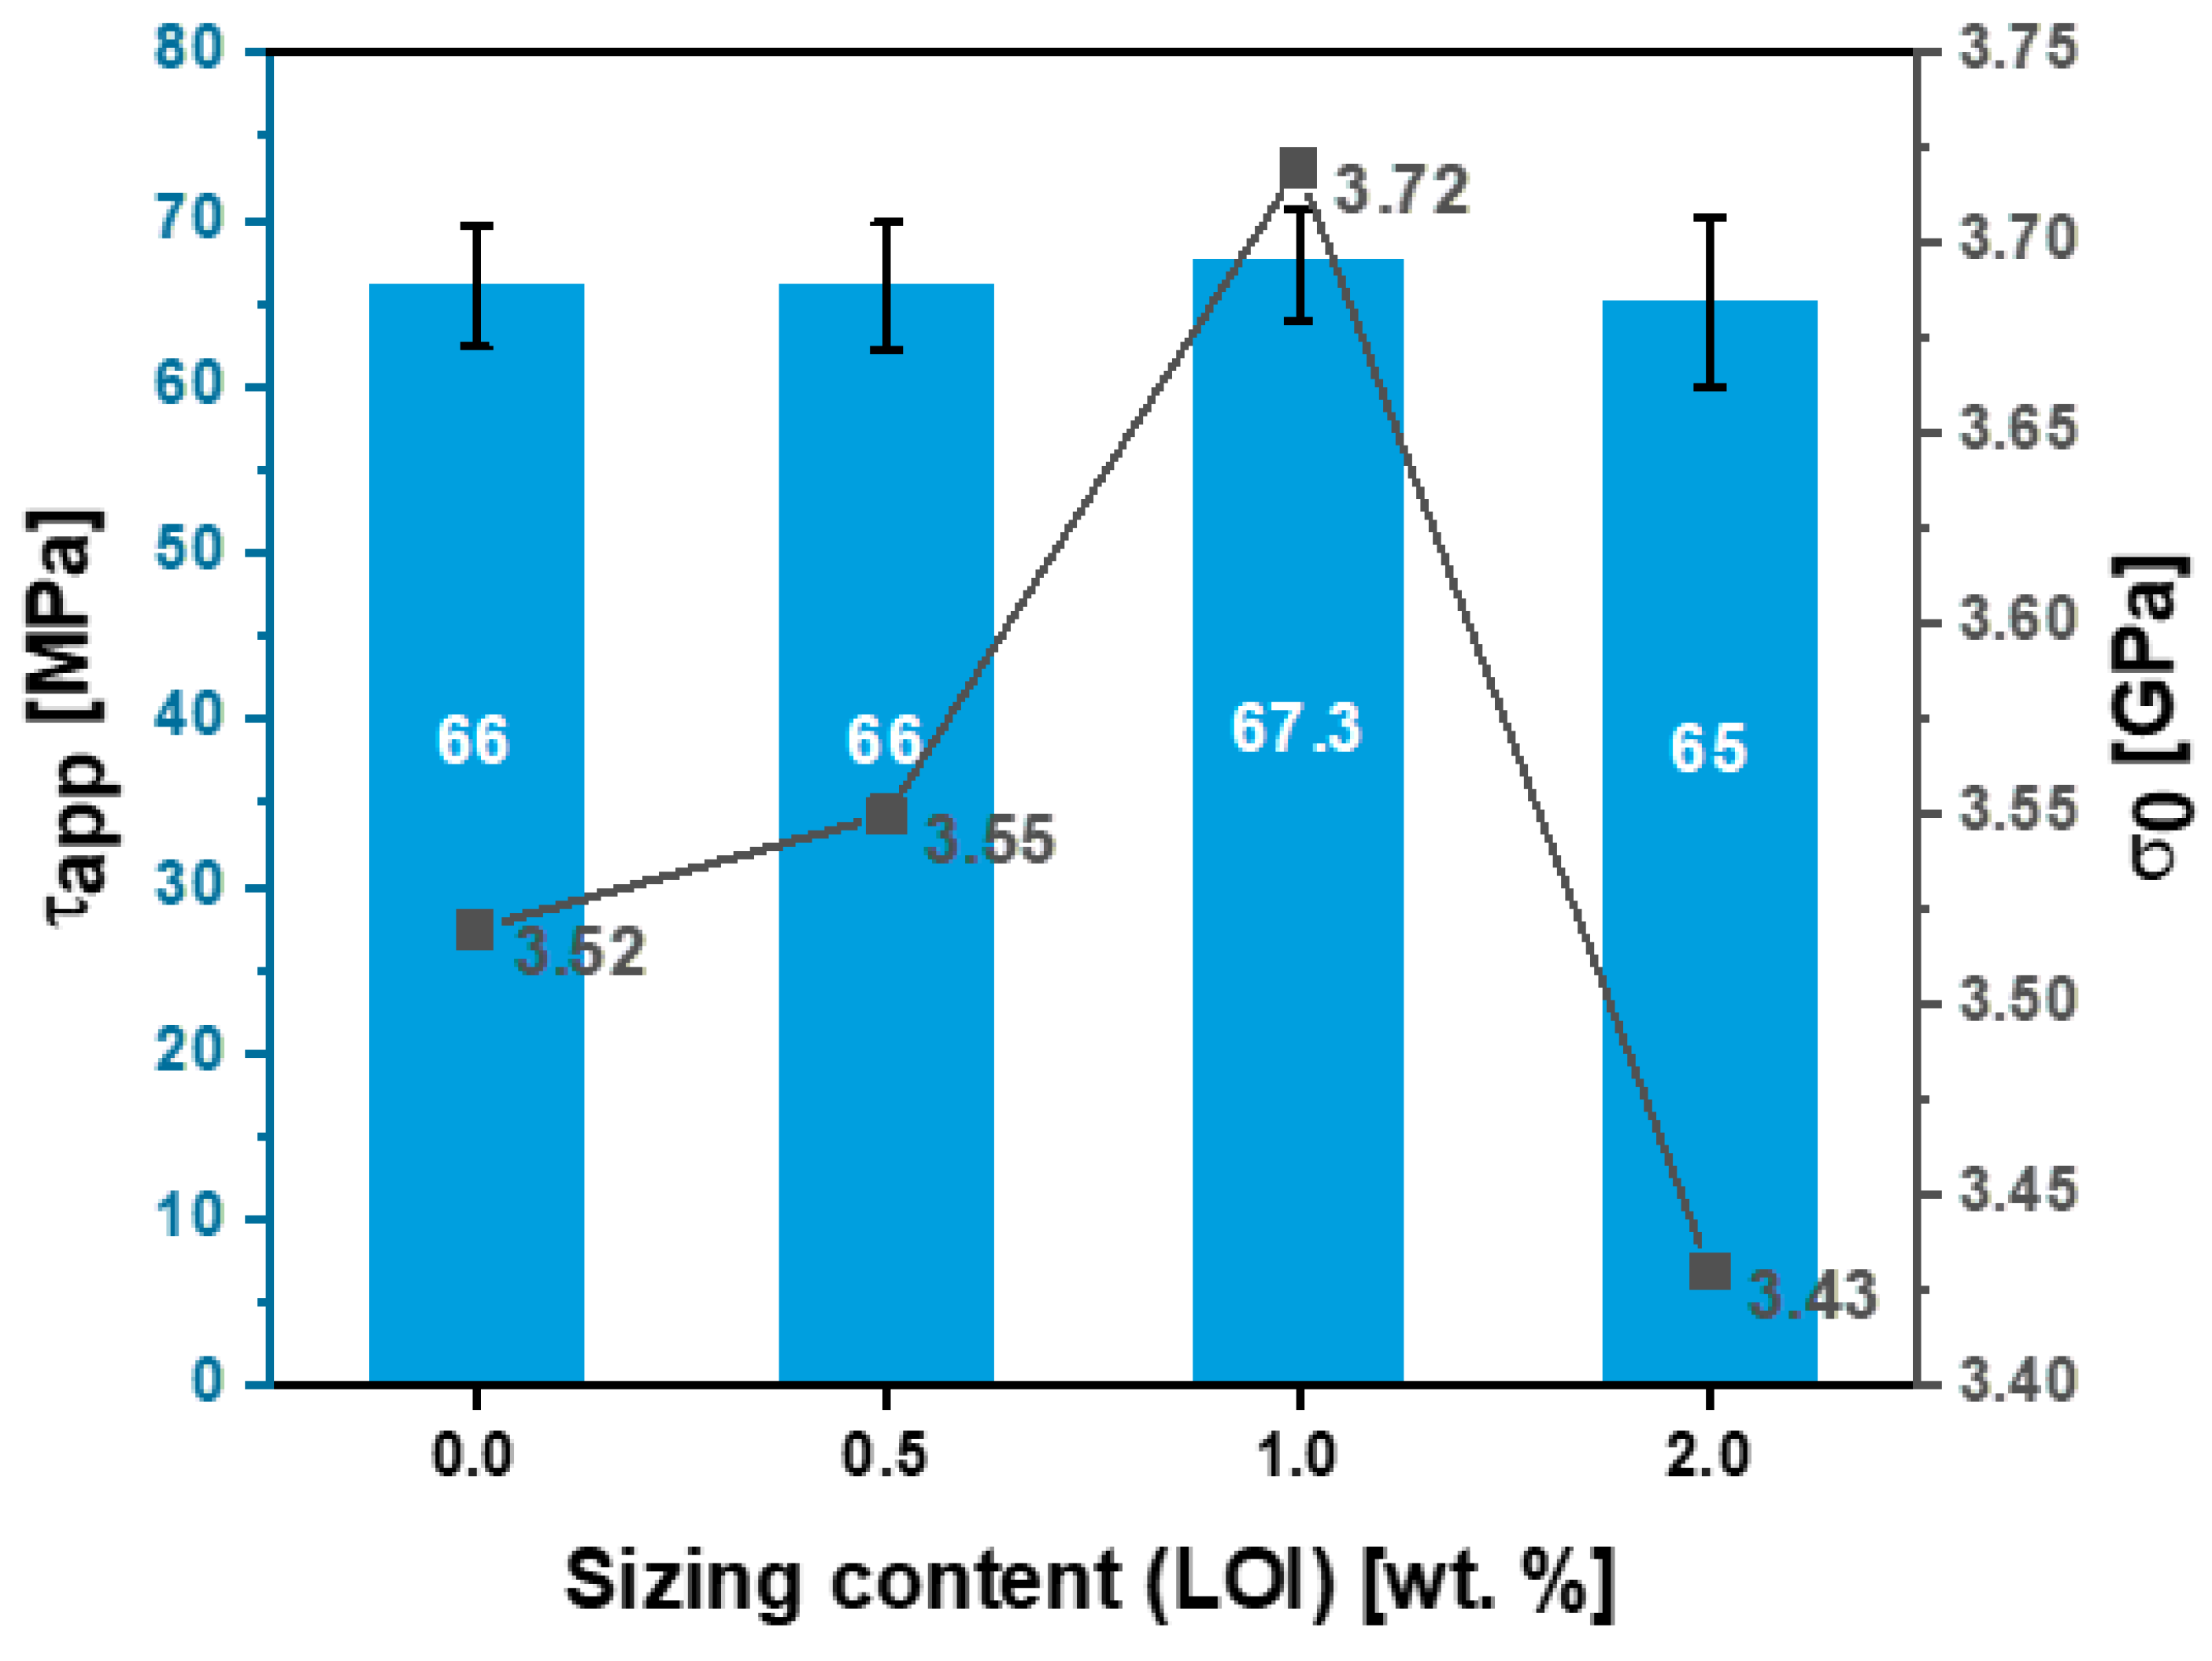
Figure 18.
Effect of Hydrosize® HP2-06 sizing content on the apparent interfacial shear stress and the characteristic stress of sized and unsized fibers.
Figure 18.
Effect of Hydrosize® HP2-06 sizing content on the apparent interfacial shear stress and the characteristic stress of sized and unsized fibers.
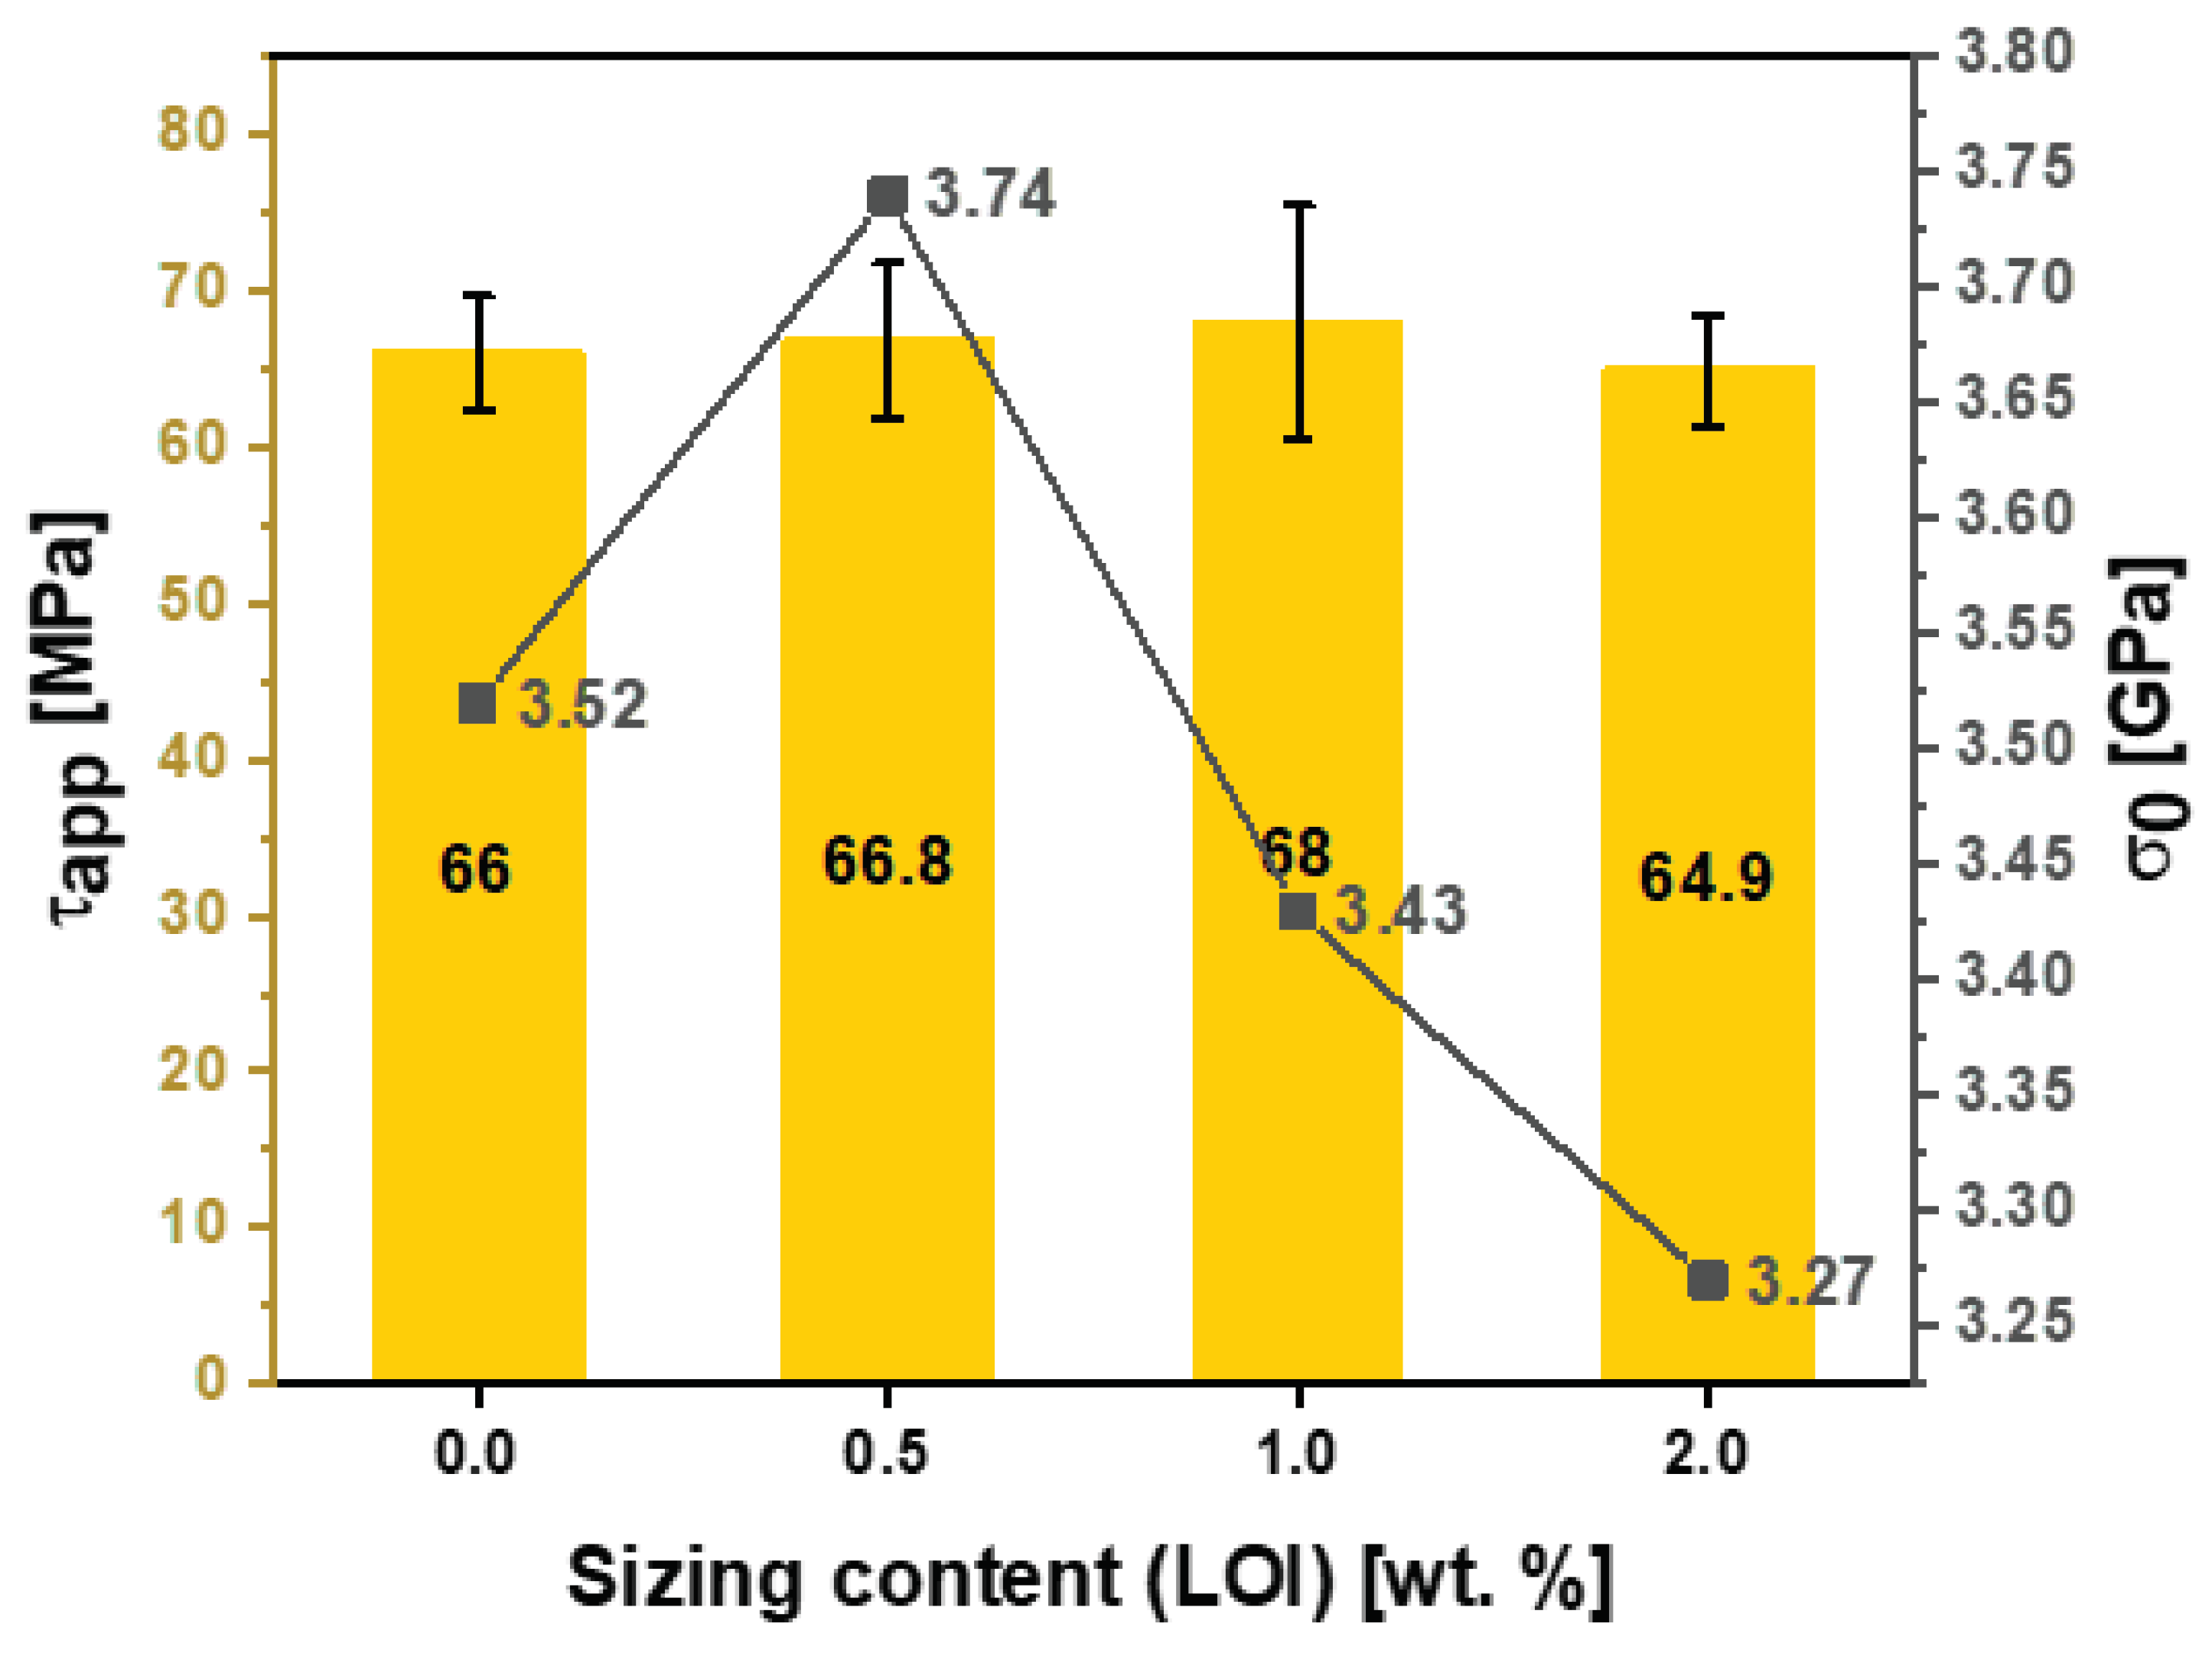

Table 1.
Mechanical properties of resin RIMR 135 with curing agent RIMH 137.
| Mechanical data | Value |
| Density [g/cm3] | 1.15 |
| Tensile strength [MPa] | 70 |
| Tensile modulus [GPa] | 2.95 |
Table 2.
Breakdown of the sizing solution preparation by using equation (1).
| Sample name | Sizing formulation | Solid content of film former (wt. %) | Targeted lot mass (g) | DI-water diluting mass (g) | Sizing content (LOI) (wt. %) |
|---|---|---|---|---|---|
| A1 | Hydrosize® HP3-02 | 2 | 11.73 | 188.27 | 0.80 ± 0.06 |
| A2 | 3 | 17.60 | 182.40 | 1.17 ± 0.03 | |
| A3 | 4 | 23.47 | 176.53 | 1.61 ± 0.05 | |
| B1 | Hydrosize® HP2-06 | 2 | 15.31 | 184.69 | 0.46 ± 0.05 |
| B2 | 3 | 22.96 | 177.04 | 0.81 ± 0.02 | |
| B3 | 4 | 30.62 | 169.38 | 1.02 ± 0.02 |
Table 3.
Updated fiber sizing content based on the developed models by using equations (4 and 5) and Figure 5 and Figure 6.
| Sample name | Sizing formulation | Solid content of film former (wt. %) | Targeted lot mass (g) | DI-water diluting mass (g) | Sizing content (LOI) (wt. %) |
| A4 | Hydrosize® HP3-02 | 1.29 | 7.57 | 192.43 | 0.5 ± 0.03 |
| A5 | 2.52 | 14.78 | 185.22 | 1.04 ± 0.03 | |
| A6 | 5.0 | 29.28 | 170.72 | 2 ± 0.16 | |
| B8 | Hydrosize® HP2-06 | 6.90 | 52.81 | 147.19 | 2.09 ± 0.15 |
Table 4.
Values of the two-parameter Weibull distribution function of unsized, 0.50, 1, and 2 wt. % sizing using Hydrosize® HP3-02 and Hydrosize® HP2-06.
Table 4.
Values of the two-parameter Weibull distribution function of unsized, 0.50, 1, and 2 wt. % sizing using Hydrosize® HP3-02 and Hydrosize® HP2-06.
| Sample name | Sizing formulation | Sizing level [wt. %] |
||||
| Unsized fibers | NA | 0 | 3.52 | 6.42 | 0.98 | 50 |
| A4 | Hydrosize® HP3-02 | 0.5 | 3.55 | 8.48 | 0.95 | 50 |
| A5 | 1 | 3.72 | 7.58 | 0.97 | 50 | |
| A6 | 2 | 3.43 | 5.34 | 0.98 | 50 | |
| B1 | Hydrosize® HP2-06 | 0.5 | 3.74 | 7.51 | 0.95 | 50 |
| B3 | 1 | 3.27 | 9.21 | 0.91 | 50 | |
| B8 | 2 | 3.43 | 7.49 | 0.98 | 50 |
Table 5.
XPS elemental compositions of the surfaces of unsized and sized carbon fibers.
| Sample name | sizing content (wt. %) | ||||||||||
| B.E./eV | A.C./% | B.E./eV | A.C./% | B.E./eV | A.C./% | ||||||
| Unsized fiber | 0 | 284.80 | 83.1 | 532.0 | 13.2 | 400.3 | 2.3 | 0.16 | |||
| A4 | 0.5 | 284.80 | 81.4 | 532.8 | 15.4 | 400.1 | 2.7 | 0.19 | |||
| A5 | 1 | 284.80 | 79.5 | 532.8 | 17.0 | 400.0 | 2.0 | 0.21 | |||
| A6 | 2 | 284.80 | 80.5 | 533.1 | 17.9 | 400.4 | 1.6 | 0.22 | |||
| B1 | 0.5 | 284.80 | 78.3 | 532.8 | 19.6 | 400.4 | 2.1 | 0.25 | |||
| B3 | 1 | 284.80 | 77.0 | 532.8 | 21.4 | 400.2 | 1.5 | 0.28 | |||
| B4 | 2 | 284.77 | 74.1 | 532.5 | 24.5 | 399.6 | 1 | 0.33 | |||
Table 6.
Interfacial parameters and standard deviations received by SFPO.
| Sample name | Sizing formulation | Sizing level [wt. %] |
Broken fibers |
(IFSS) [MPa] |
le [µm] |
| Unsized fibers | NA | 0 | 0/21 | 66.0 ± 3.7 | 79 ± 15 |
| A4 | Hydrosize® HP3-02 | 0.5 | 0/20 | 66.0 ± 3.8 | 80 ± 11 |
| A5 | 1 | 0/20 | 67.3 ± 3.4 | 75 ± 14 | |
| A6 | 2 | 0/20 | 65.0 ± 5.1 | 80 ± 11 | |
| B1 | Hydrosize® HP2-06 | 0.5 | 0/20 | 66.8 ± 5.0 | 73 ± 13 |
| B3 | 1 | 0/20 | 68.0 ± 7.5 | 78 ± 10 | |
| B8 | 2 | 0/20 | 64.9 ± 3.6 | 76 ± 9 |
Disclaimer/Publisher’s Note: The statements, opinions and data contained in all publications are solely those of the individual author(s) and contributor(s) and not of MDPI and/or the editor(s). MDPI and/or the editor(s) disclaim responsibility for any injury to people or property resulting from any ideas, methods, instructions or products referred to in the content. |
© 2023 by the authors. Licensee MDPI, Basel, Switzerland. This article is an open access article distributed under the terms and conditions of the Creative Commons Attribution (CC BY) license (http://creativecommons.org/licenses/by/4.0/).
Copyright: This open access article is published under a Creative Commons CC BY 4.0 license, which permit the free download, distribution, and reuse, provided that the author and preprint are cited in any reuse.


