1. Introduction
In Mexico, there are more than 40 species of stingless bees; many of these are cultivated for the production of honey, pollen, and propolis. Stingless beekeeping, or meliponiculture, is part of a rich biocultural tradition dating back thousands of years [
1].
Scapotrigona mexicana Guérin-Méneville was kept by pre-Columbian societies in Mexico and is still kept in many regions today [
2]. These bees are important pollinators of many wildflowers and crops and are of both ecological and economical importance [
3].
Scaptotrigona mexicana honey is in high demand in organic food markets and is believed to have significant curative properties [
3]. Scientific studies have confirmed its antimicrobial and antioxidant potential [
4]. Up until now, the studies on the chemical composition of
S. mexicana honey have been limited to physicochemical properties, identification of lactic acid and 5-(hydroxymethyl)furfural (HMF) [
5]. Our approach includes NMR chemical profiling of
S. mexicana honey that provides the composition of sugars, organic and amino acids as well as some additional honey components.
S. mexicana propolis has also demonstrated antibacterial activity [
6]. There is only one study of its chemical composition: some flavonoids, chromenes, totarolon and hydroxycinnamic acids have been identified in it by LC-MS/MS [
6].
It is generally accepted that the chemical composition of stingless bee honey and propolis depends on the plant sources used, and that it is influenced by the flora available in the vicinity of the hives, the preferences of the bees and the climate (altitude and temperature) [
7]. Whether nearby flora, species-specific bee preferences or the climate are of primary importance in this respect is yet debatable. To determine the relative influence of each of these factors, we studied the composition of honey and propolis from two
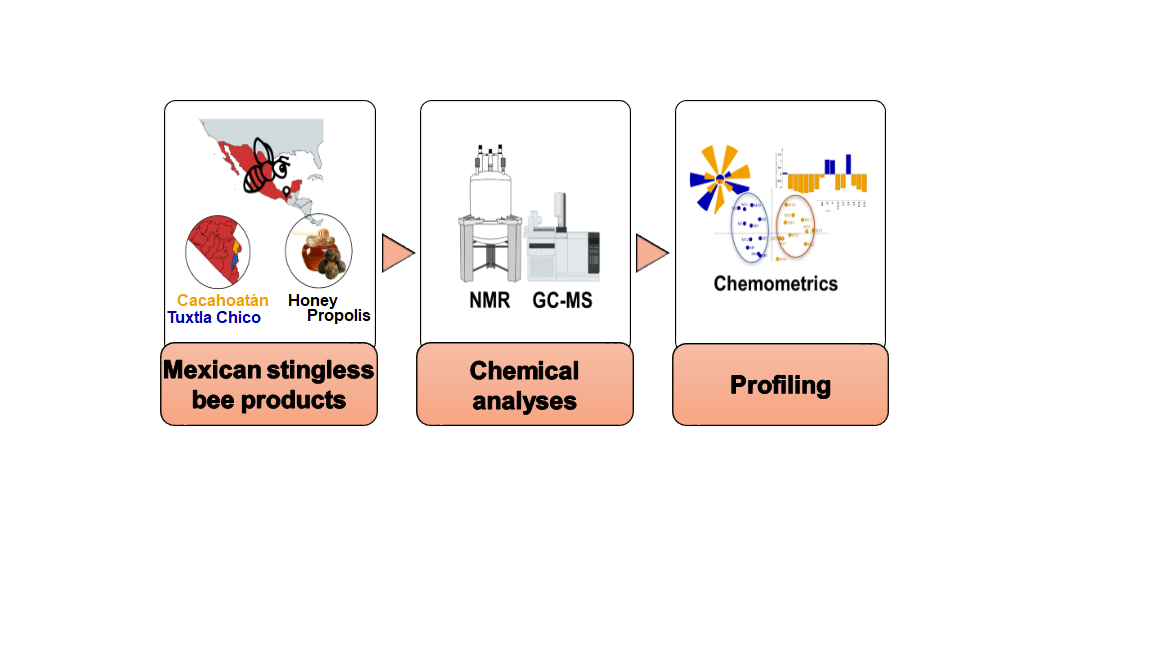
S. mexicana meliponaries (or stingless bee yards) in the state of Chiapas, in southern Mexico. The meliponaries were located only 8.5 km apart but with over 150 m difference in altitude. In order to characterize the chemical variability of stingless bee honey and propolis, samples from 24 colonies were analyzed: 12 from each meliponary. Our results demonstrate that climate and the specific flora around the hives influence the chemical compositions of honey and propolis collected by bees of the same species. Additionally, we addressed the emergent question of whether the saccharide trehalulose can be used as a biomarker for stingless bees’ honey.
2. Materials and Methods
2.1. Bee species and study sites
12 x 2
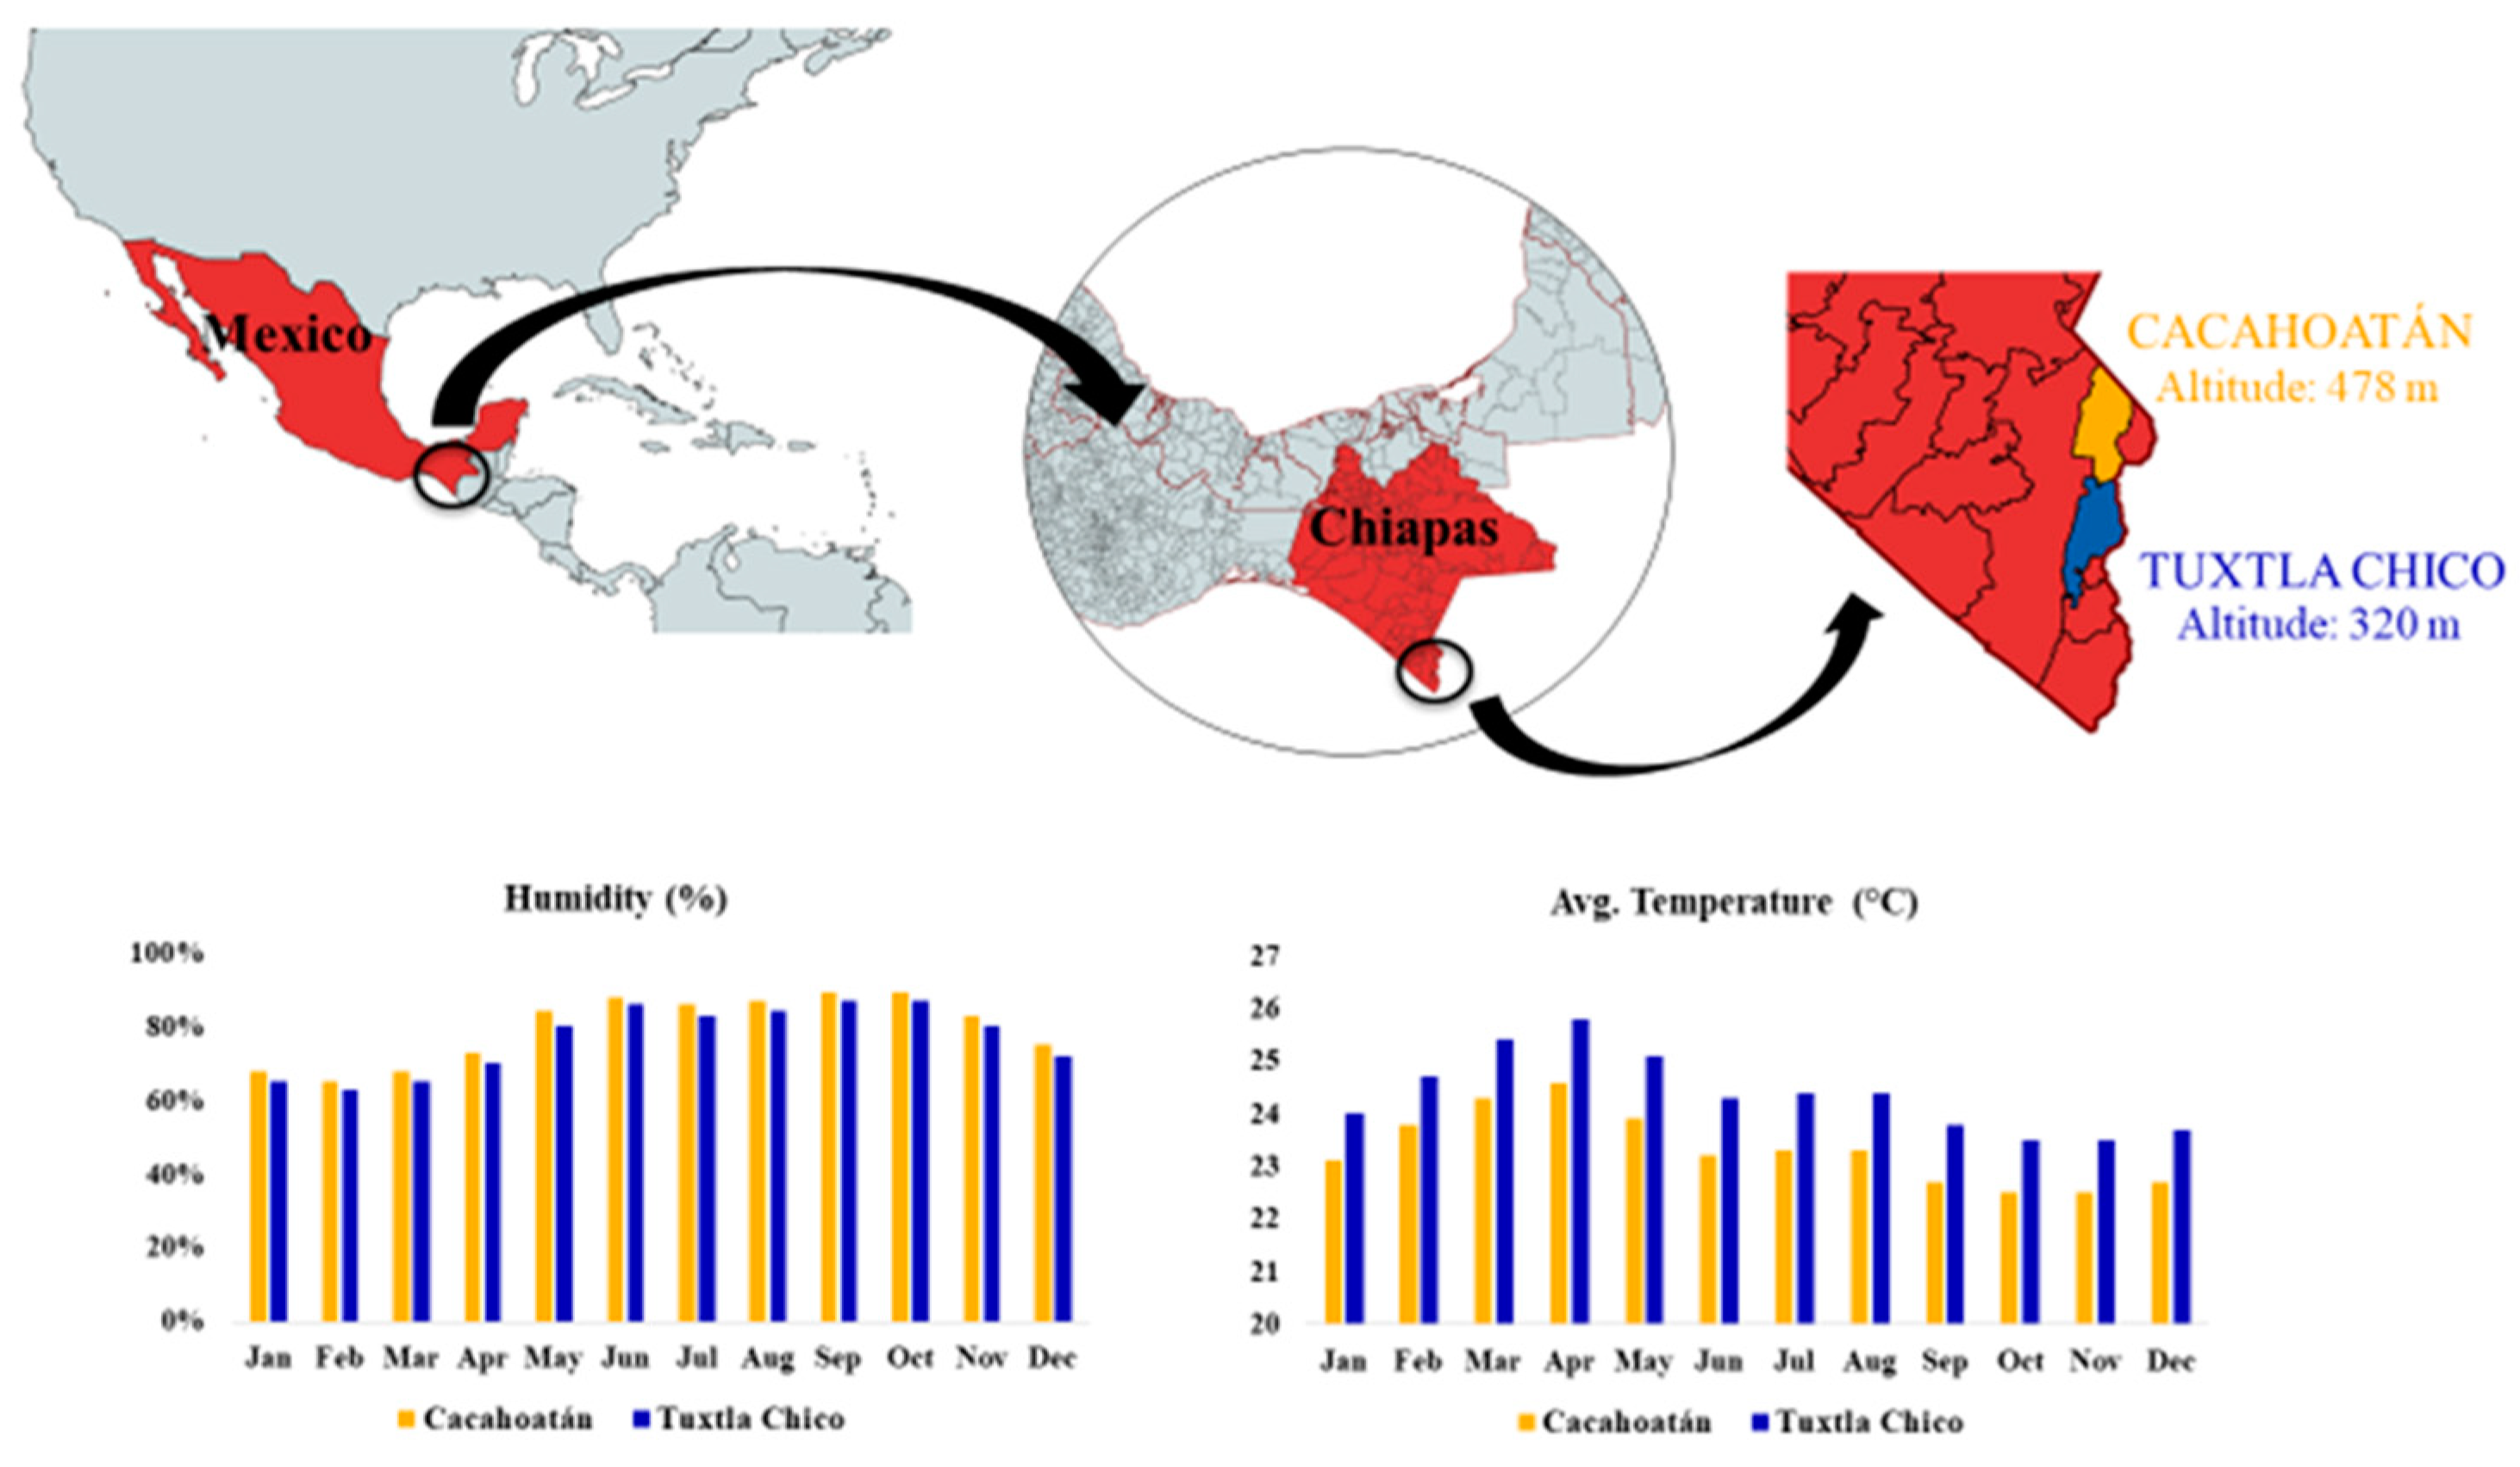
Scaptotrigona mexicana honey and propolis samples were collected from two meliponiaries in Mexico in 2021. The meliponaries were located in Tuxtla Chico (T; 14.89°N 92.18°E, 320 msnm) and in Cacahoatán (C; 15.00°N 92.16°E, 478 msnm). Both study sites are situated within the Pacific Coastal Plains phytogeographic region. Vegetation consists of a mosaic of secondary strata covered by high evergreen forest. Predominant species include: Heliocarpus donnell.smithii, Cordia alliodora, Spondias mombin, Cecropia obtusifolia, Croton draco, Carica papaya, Nephelium lappaceum, Theobroma cacao, Coffea arabica. Both study sites are characterized by a warm-humid climate with an annual average temperature of 31°C, but precipitation differs substantially between sites. Average annual rainfall in Tuxtla Chico is 2488.9 mm, while average annual rainfall in Cacahoatán is 951 mm. In
Figure 1 the location and climate of study sites are visualized.
The bee species was determined by stingless beekeeping technician Miguel Guzmán.
2.2. Propolis sample collection
Five grams of propolis were collected from the interior of each of the 24 study colonies in October/November of 2021. Propolis was scraped from the undersurface of each colony lid using sterile gloves and clean serrated knives; fresh extraction equipment was used for each colony to avoid contaminating samples. Samples were placed in sterile 50ml Falcon tubes, labeled, and subsequently stored at 10°C.
2.3. Honey sample collection
Twenty milliliters of honey from the interior of each colony were collected using a sterile syringe and stored in an amber glass bottle (120 ml) in May of 2021. Fresh extraction equipment was used for each colony to avoid contaminating samples. The samples were labeled and stored in a refrigerator at 10°C.
2.4. Honey sample preparation
320 mg honey were dissolved in 418 µL purified water. 187 µL phosphate buffer in D2O solution at pH ~ 4.5 were added. pH was adjusted to 4.2 with small quantities of 0.1M H3PO4 or 0.1M NaOH.
2.5. NMR spectroscopy
NMR spectra were acquired on a Bruker NEO 600 spectrometer (Biospin GmbH, Rheinstetten, Germany) at 300.0 ± 0.1 K using a Prodigy probehead. Standard parameters for broad band decoupled 13C NMR spectra were used - pulse sequence zgdc30, pulse width 300, spectral width 238 ppm, 64 K data points, 4 K scans, acquisition time 0.90 s, and relaxation delay 1.05 s. The signal of α-fructofuranose at 104.34 ppm was used as internal reference corresponding to −2.83 ppm for the 13C TSP signal. Signal assignments and semiquantitative analysis have been achieved as described previously using 1D and 2D spectra and literature data [
8,
9]. Quantitation of the sugar components has been made from 13C NMR signals of two monosaccharides (glucose, fructose), 13 disaccharides (sucrose, kojibiose, α,α- and α,β-trehalose, trehalulose, maltose, isomaltose, maltulose, isomaltulose, nigerose, leucrose, turanose, gentiobiose), 6 trisaccharides (raffinose, melezitose, 1-kestose, panose, erlose, maltotriose). The detailed NMR analysis allows us to quantify, in addition to sugars, several identified (e.g., meso- and racemic 2,3-butanediol) and 16 unidentified organic components that are important for the characterization of honey (
Table S1).
2.6. Propolis extraction and sample preparation
Propolis samples were grated after cooling and extracted with 70% ethanol (1:10, w/v) at room temperature, 2 x 24 h. The extracts were filtrated and evaporated to dryness in vacuo. The dry extracts were silylated: about 5 mg dry extract was mixed with 50 μL dry pyridine and 75 μL N,O-bis(trimethylsilyl)trifluoracetamide (Sigma-Aldrich, Darmstadt, Germany), heated at 80° C for 20 min, and analyzed by GC-MS.
2.7. Total phenolics
The total phenolic content was determined using Folin–Ciocalteu method. Each honey sample (2.5 g) was diluted to 25 mL with distilled water. 0.5 mL of the solution was then mixed with 2 mL of Folin–Ciocalteu reagent (Merck, Darmstadt, Germany), and 3 mL of a 20% sodium carbonate solution (w/v) were added (Labosi, Paris, France). The volume was made up with distilled water to 25 mL. The absorbance at 760 nm was measured after 2h. Gallic acid (Sigma–Aldrich Chemie, Steinheim, Germany) in the concentration range 28–220 µg/mL was used as standard to produce the calibration curve. The total phenolic content was expressed in mg of gallic acid equivalents (GAE)/100 g of honey.
2.8. GC-MS analysis
GC-MS analysis was performed with a GC coupled to a tandem mass spectrometer GC-MS-TQ 8050 NX Shimadzu (Tokyo, Japan), operating in Q3 scan mode and equipped with a 30 m long, 250 μm i.d., and 0.5 μm film thickness SAPIENS-5MS capillary column (Teknokroma, Spain). The oven temperature was programmed from 75 to 300°C at a rate of 5°C/min, with 5 min hold at 75°C and 25 min hold at 300°C. Carrier gas He at a constant flow rate of 0.8 mL/min. Pressure 45.9 kPa, split ratio was 75:1, injector temperature 280°C, interface temperature 310°C, ionization voltage 70 eV. The compounds were identified using computer searches on commercial libraries, comparison with spectra of authentic samples and literature data. The percentage figures in Table 1Sa and 1Sb refer to the percent of the Total Ion Current (TIC) and are semi-quantitative (semi-quantification was carried out by internal normalization.)
2.9. Free Radical Scavenging Activity
The scavenging activity against the 2,2-diphenyl-1-picrylhydrazyl (DPPH) free radical (RSA) was performed as previously described [
10]. Each dry extract was diluted with MeOH to final concentration 1 mg/mL), and for Bulgarian propolis, used as a standard, 0.1 mg/mL. Then, 2 mL of fresh methanolic DPPH solution (0.1 mM) was mixed with a 100 μL aliquot of each tested sample.
After 30 min storage in dark, the decrease in the absorption was measured at 517 nm using a UV-vis spectrophotometer (Thermo Scientific Helios gamma). The results were expressed as percentages with respect to the control value. The DPPH activity of the tested samples was calculated by the following equation:
where A0 is the absorbance of the control sample (100 μL of MeOH was added instead of the aliquot volume of the sample), and AS is the absorbance of the tested sample. Every sample was analyzed in triplicate.
2.10. Ferric Reducing Antioxidant Power (FRAP) Assay
The assay was performed as published before [
11], with slight modifications. The FRAP reagent was freshly prepared by mixing ten parts of 0.3 M acetate buffer (pH 3.6), one part of TPTZ (2,4,6-tri(2-pyridyl)-1,3,5-triazine) in 40 mM HCl and one part of 20 mM FeCl3.6H2O in distilled H2O. The reaction was started when the FRAP reagent (3 mL) was mixed with the tested sample (100 μL of a solution with a concentration of 1 mg/mL stingless bees propolis and 0.1 mg/mL for Bulgarian propolis. After 30 min at room temperature in darkness, the absorbance was measured at 593 nm against a blank. The FRAP value, expressed as μmol Fe2+/L, was calculated from a calibration curve of FeSO4.7H2O standard solutions. Every sample was analyzed in triplicate.
2.11. Statistical analysis
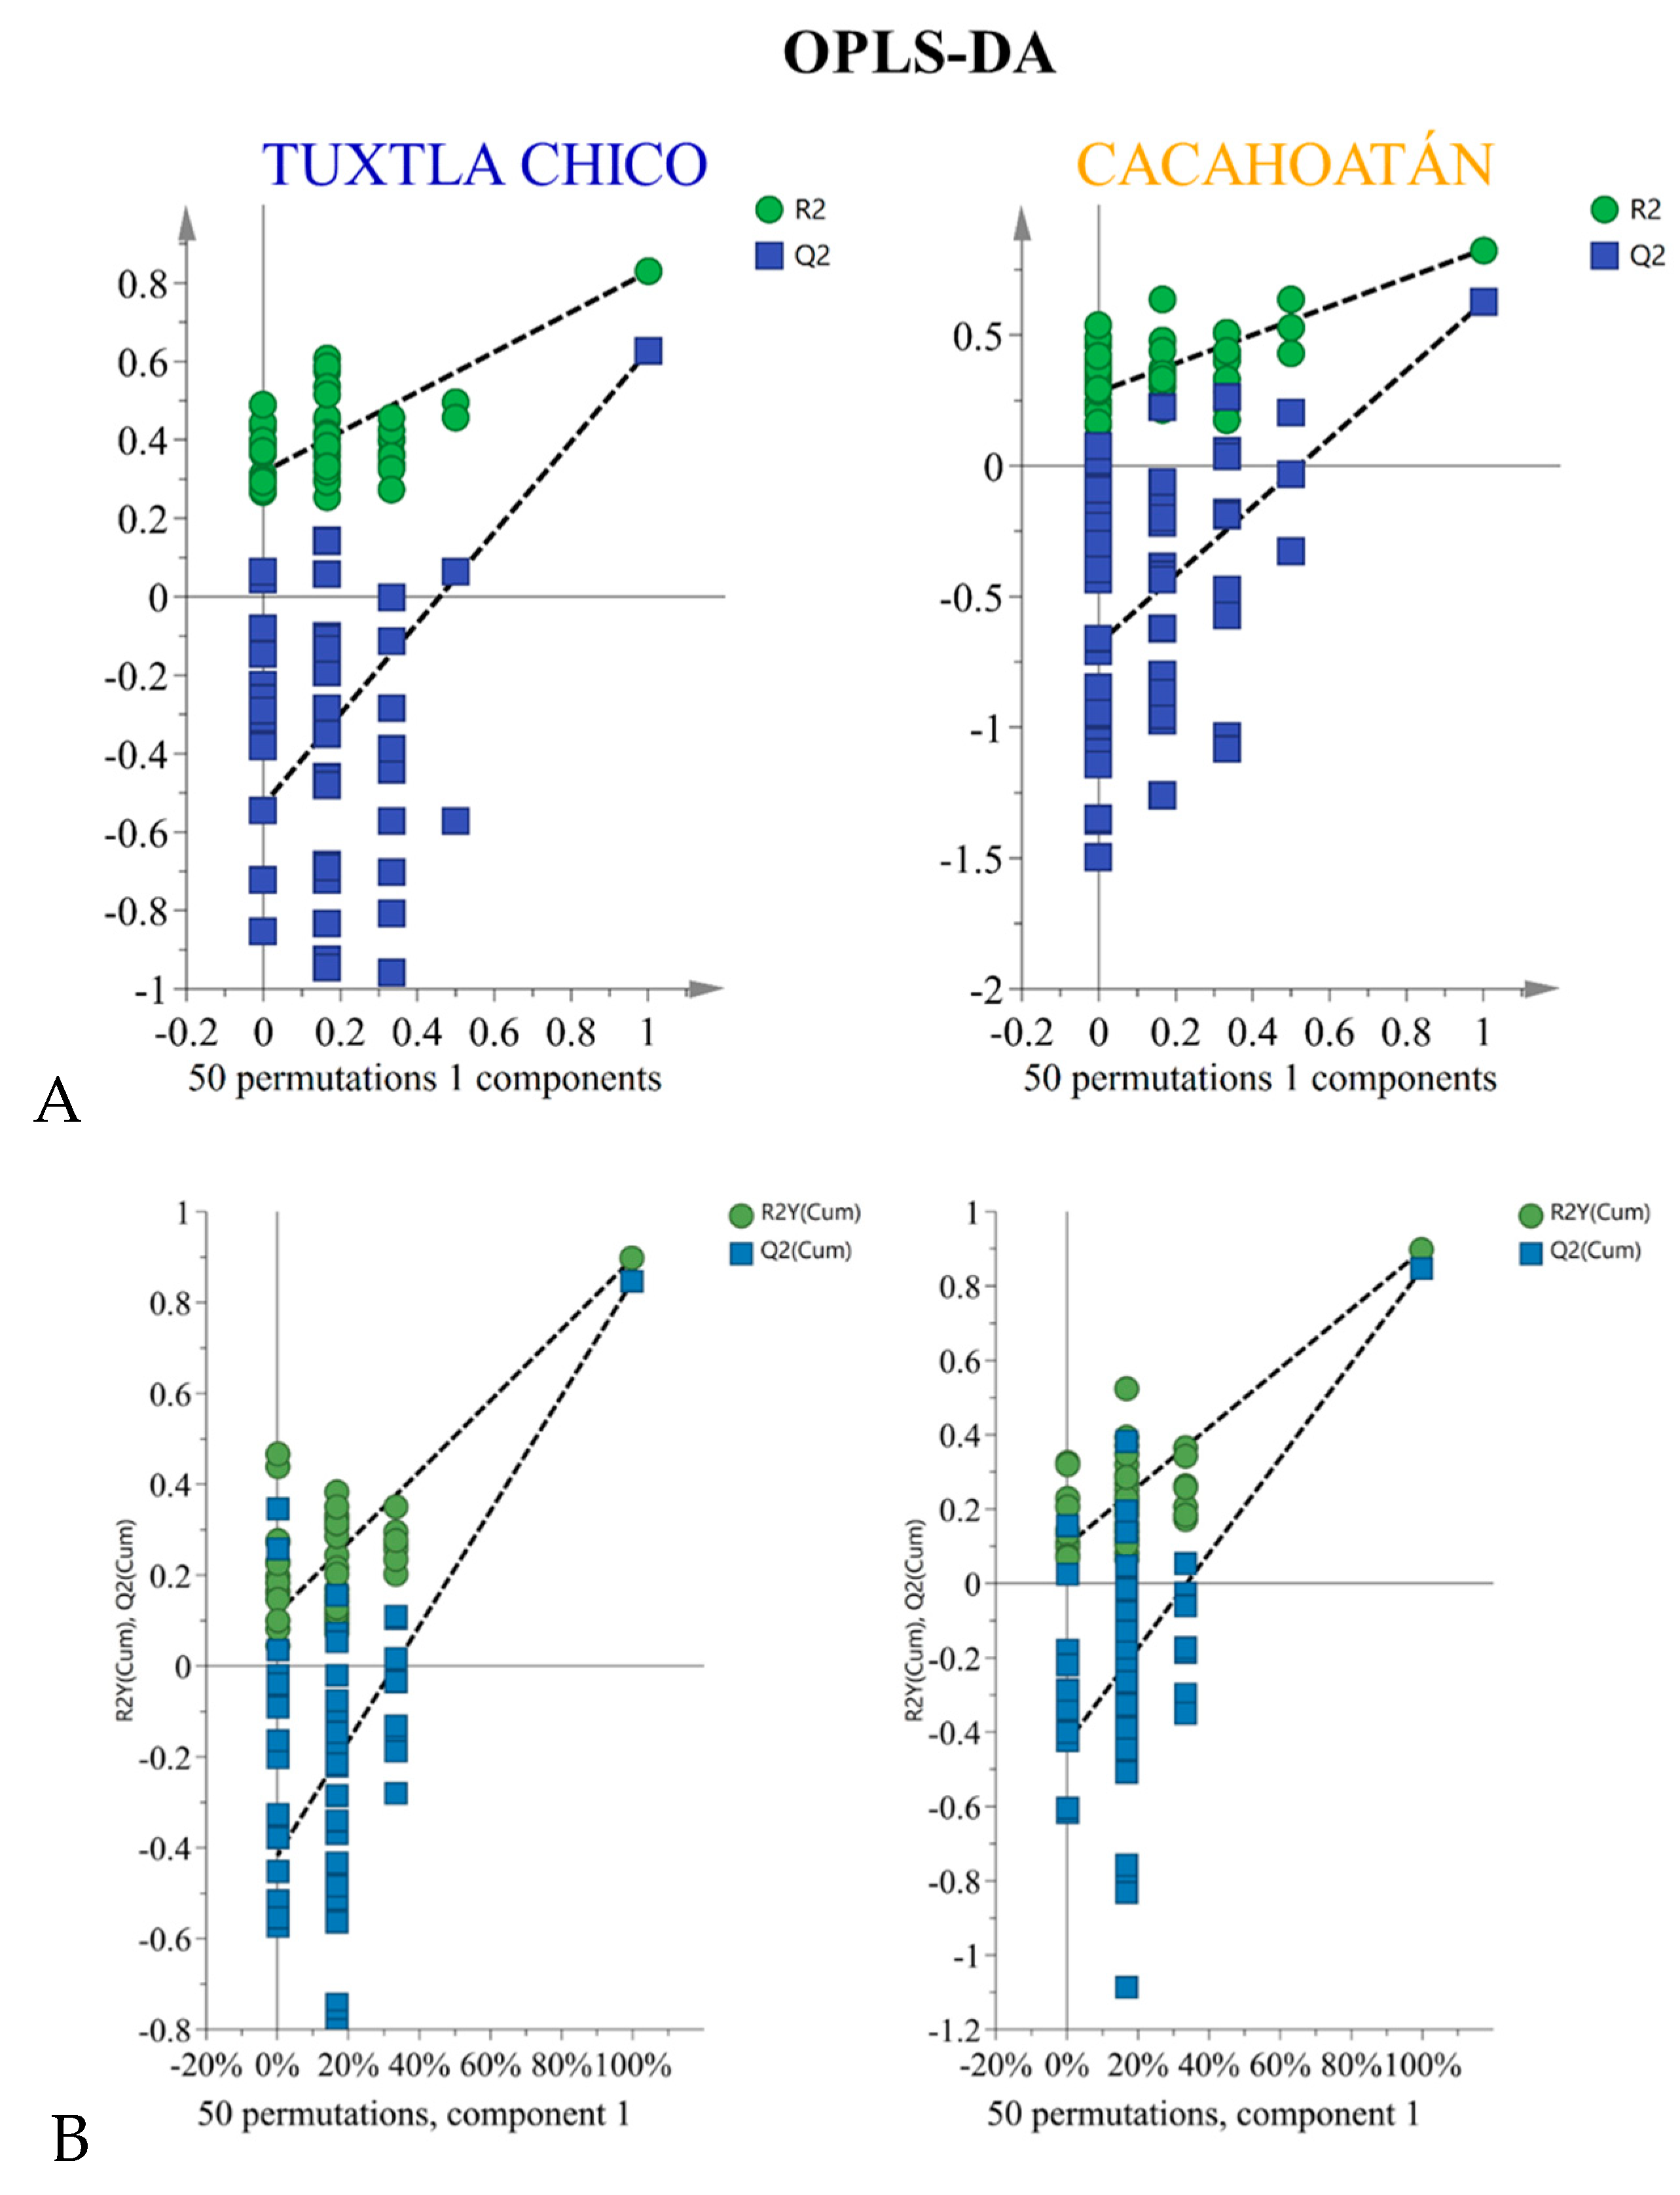
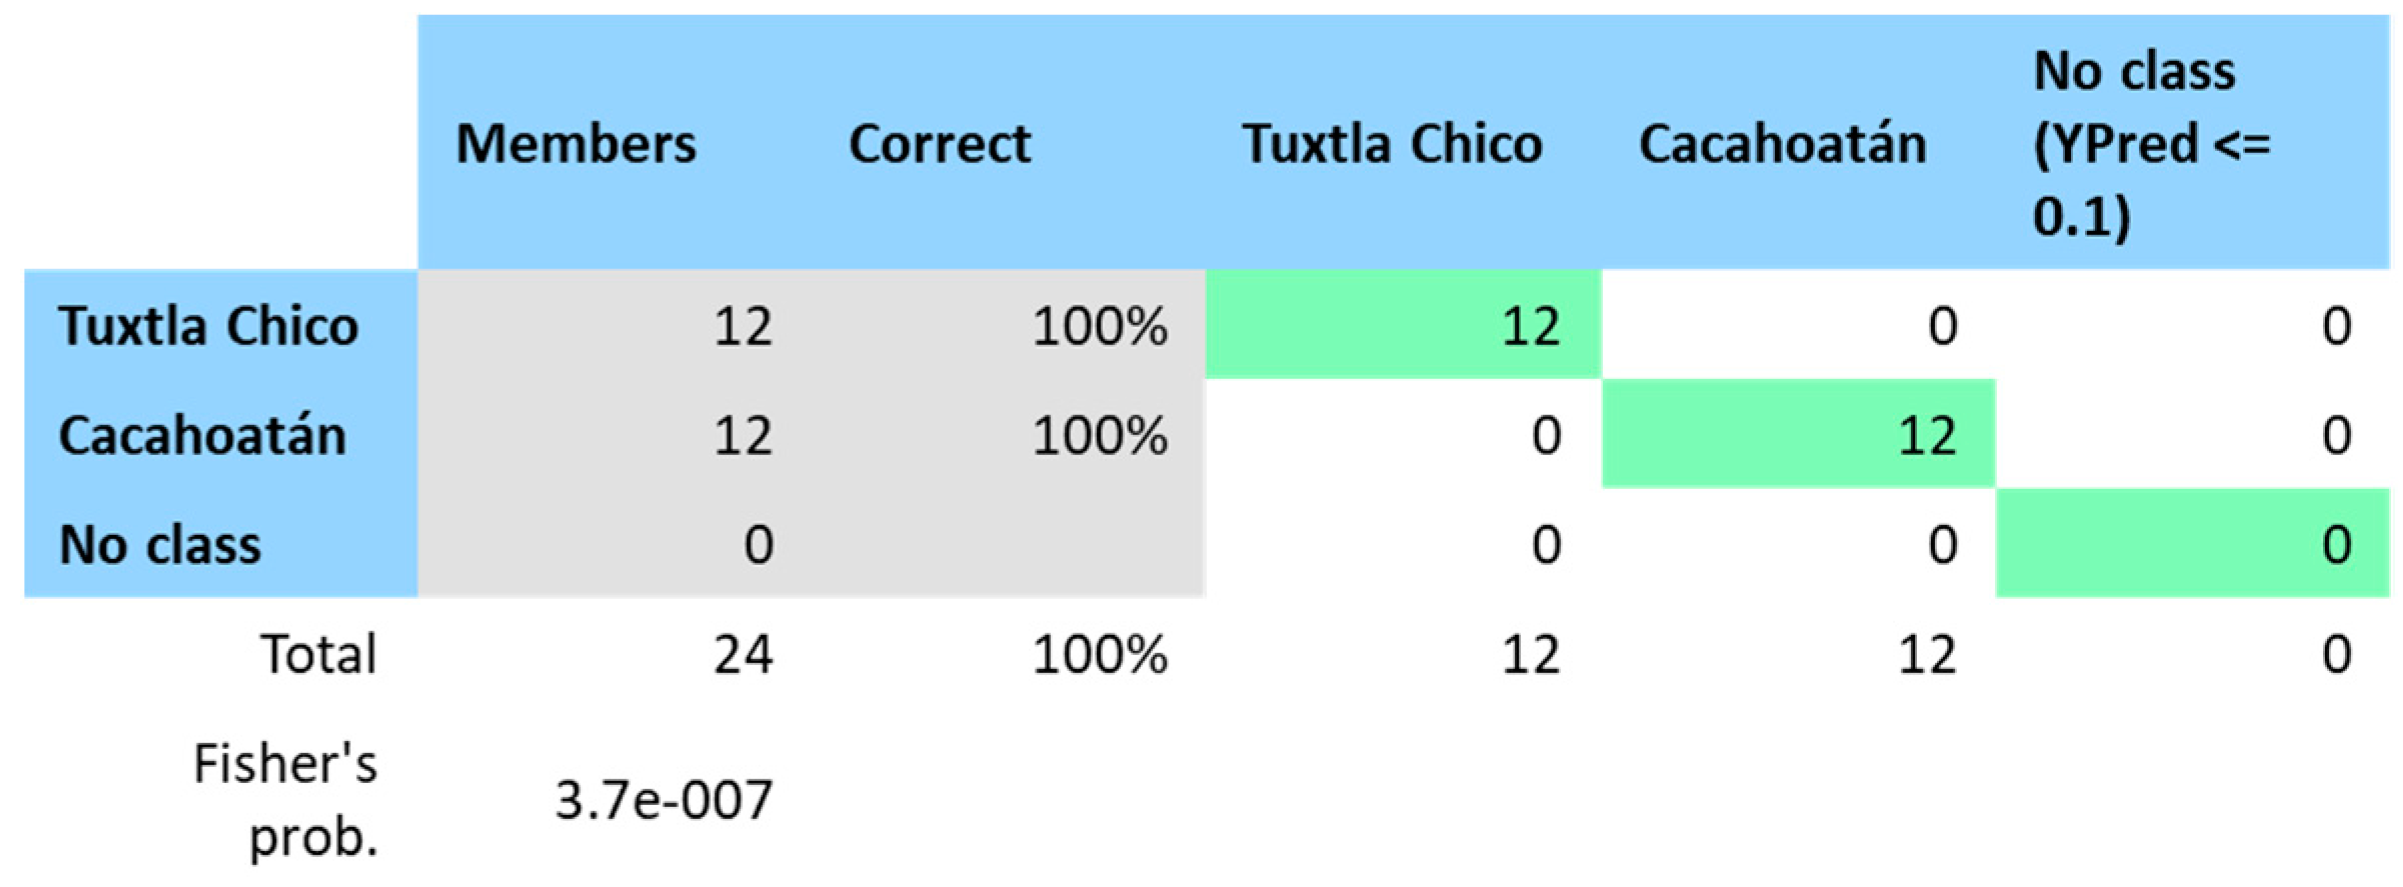
Orthogonal Partial Least Squares Discriminant Analysis (OPLS-DA) was prepared using SIMCA 17.0.2 software (Sartorius Stedim Data Analytics AB, Umetrics). The analysis utilized semiquantitative data for compounds observed in 24 samples: 43 compounds for honey and 10 groups of compounds for propolis. In both cases, the samples were divided into two classes (groups) with an equal number of samples in each class. Misclassification tables (
Table 1; the same for honey and propolis) and permutation tests (
Figure 2) were used to validate the established OPLS-DA models and evaluate their predictive ability. These techniques ensure the reliability and accuracy of the models by evaluating their performance and ability to correctly classify samples from both classes. Nightingale’s diagrams were created using Excel software (Microsoft Office Standard 2019). The diagram is typically used to visually present the distinct characteristics and enables a more intuitive understanding of the variations in the two groups.
The values of DPPH and FRAP were represented as means and standard deviation of triple replicates. Pearson’s correlation, one-way ANOVA and Tukey’s post hoc test at significance levels of p < 0.01 and/or p < 0.05 were performed with Excel (ChemOffice 2019).
3. Results and Discussion
3.1. Honey chemical profiles
For chemical profiling of the honey samples, we used 13C NMR spectroscopy as previously described [
8,
9].
To investigate the differences in the honey sugar profiles (
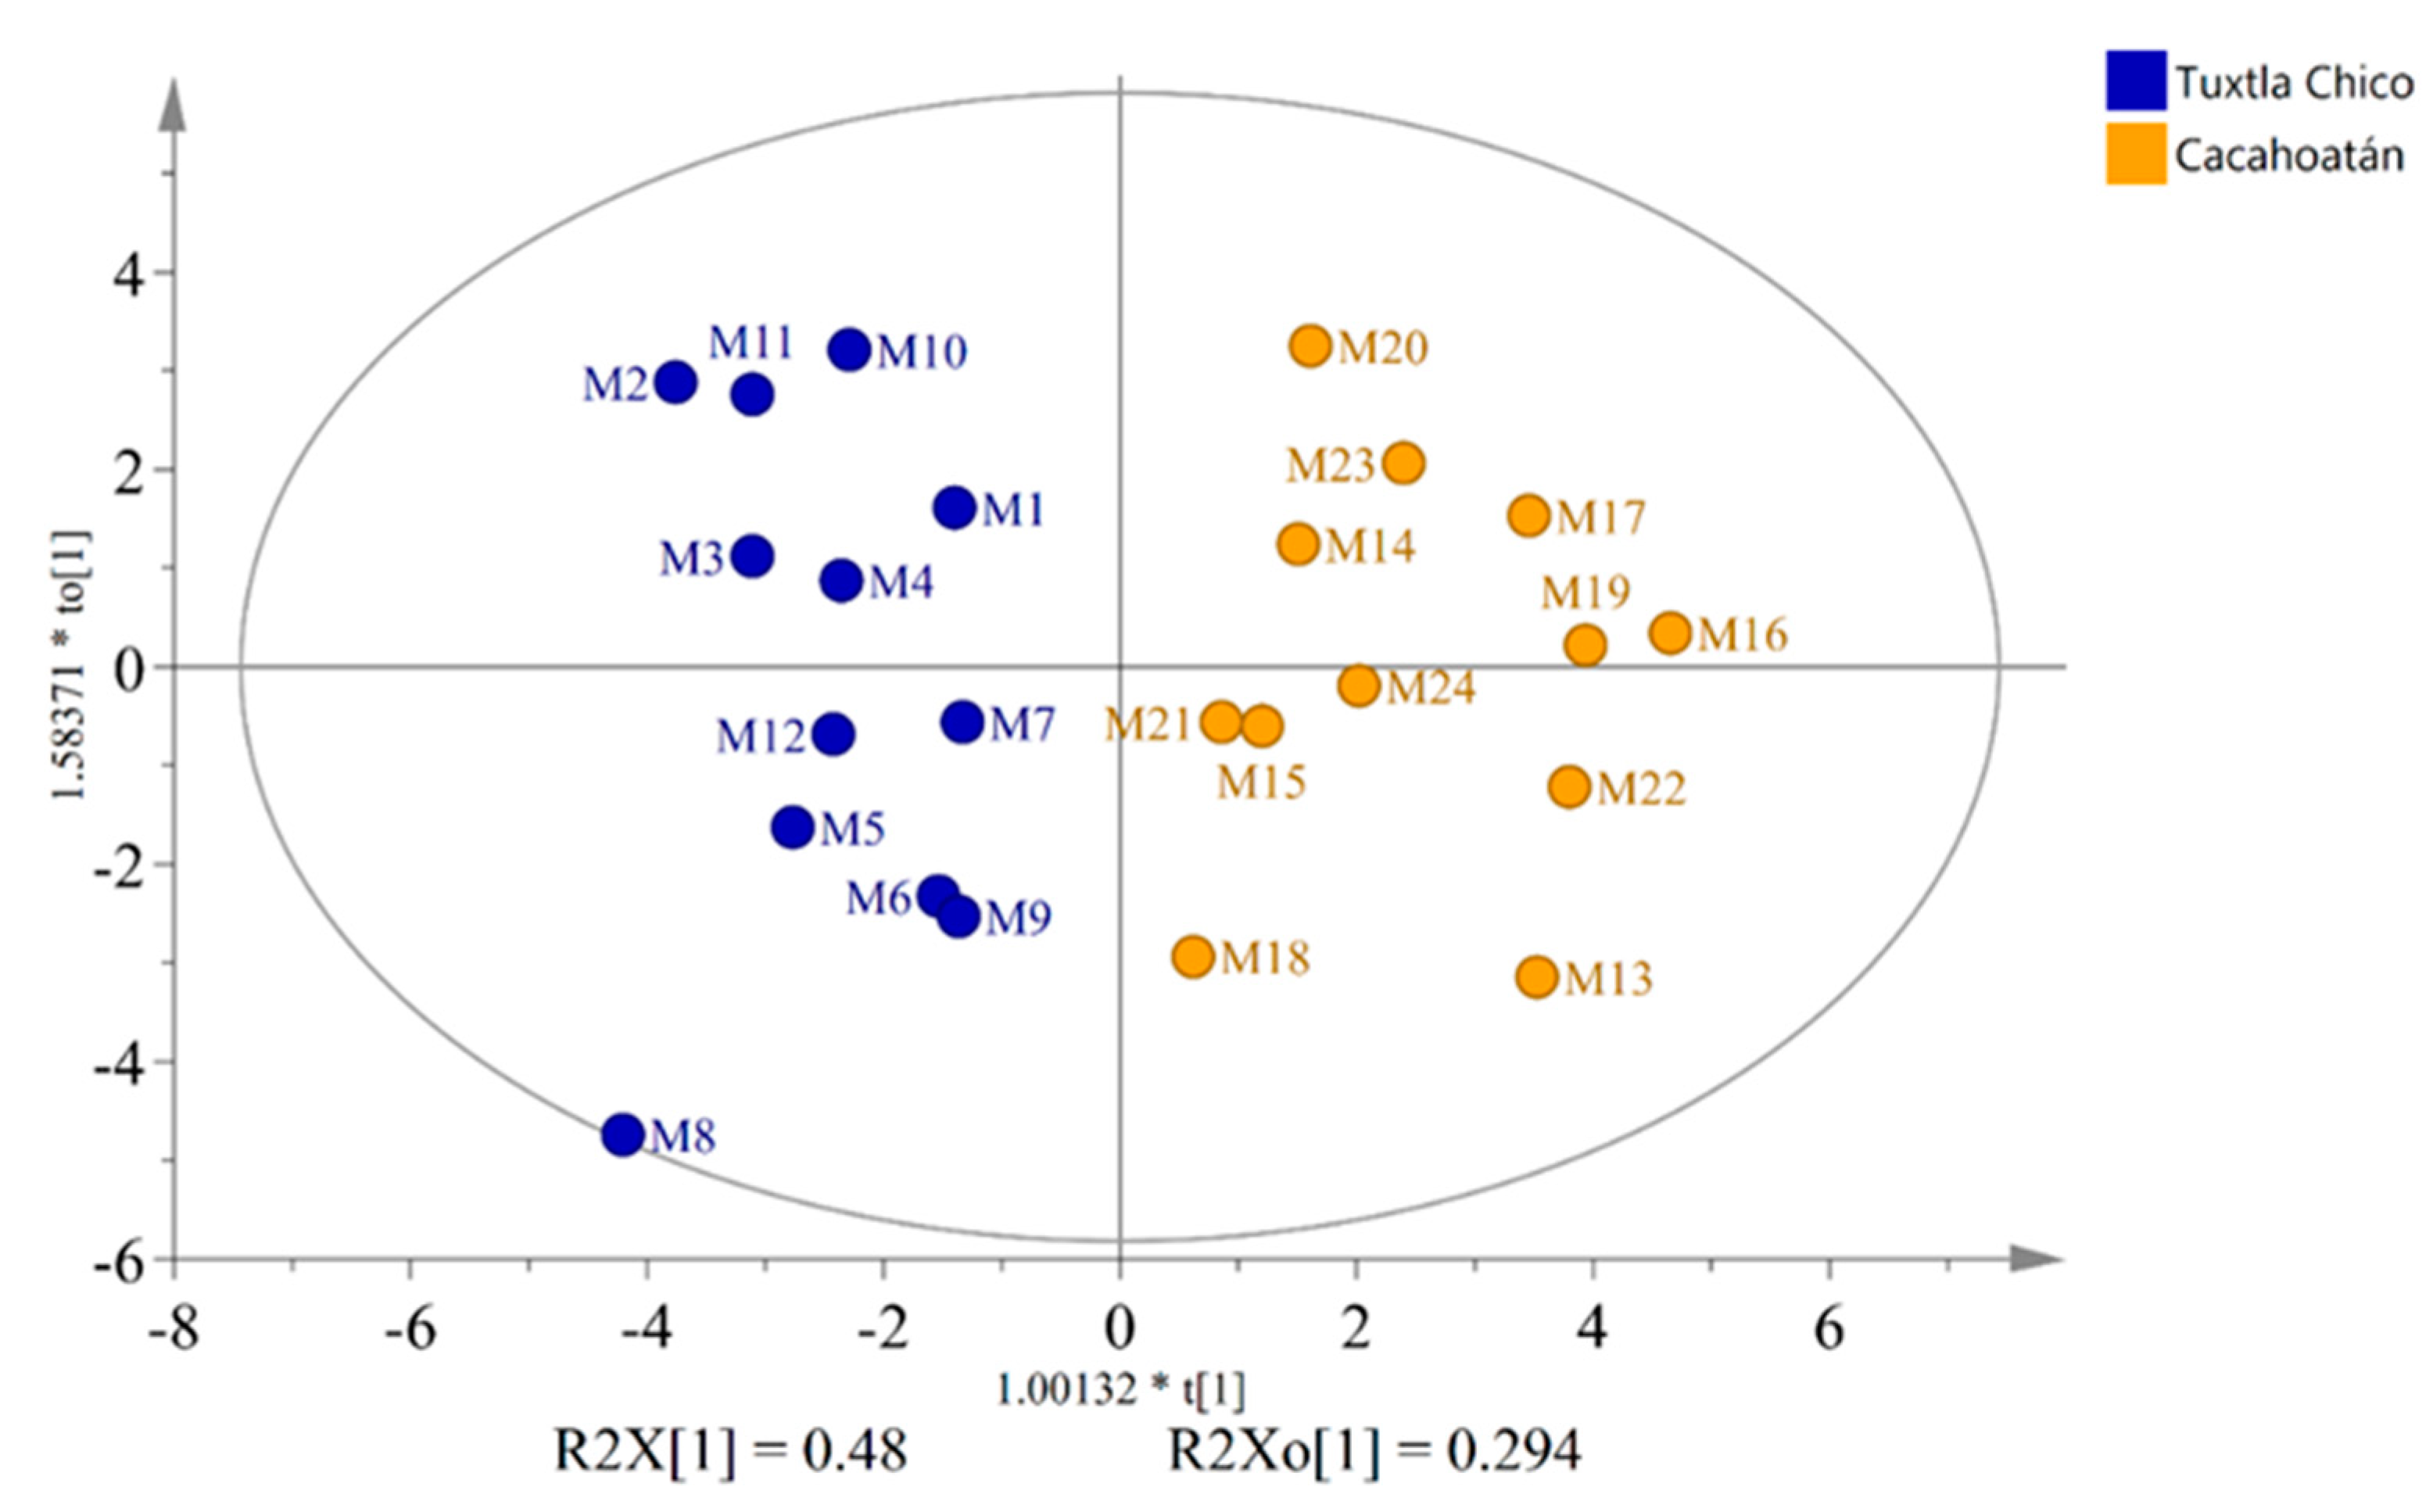
Table S1) originating from two different geographical regions, the widely used supervised statistical method – Orthogonal Partial Least Squares Discriminant Analysis (OPLS-DA) was used to analyze quantitative data obtained from 13C NMR spectra. By employing the OPLS-DA analysis with 2 components VIP values were obtained (
Figure 3). They revealed 16 statistically significant compounds to differentiate between Tuxtla Chico and Cacahoatán honeys. The subsequent use of an OPLS-DA based on these 16 compounds (R2X(cum) = 0.862; R2Y(cum) = 0.827; Q2(cum) = 0.626), visually demonstrated significant differences in the composition of the honey samples, presented in
Figure 4.
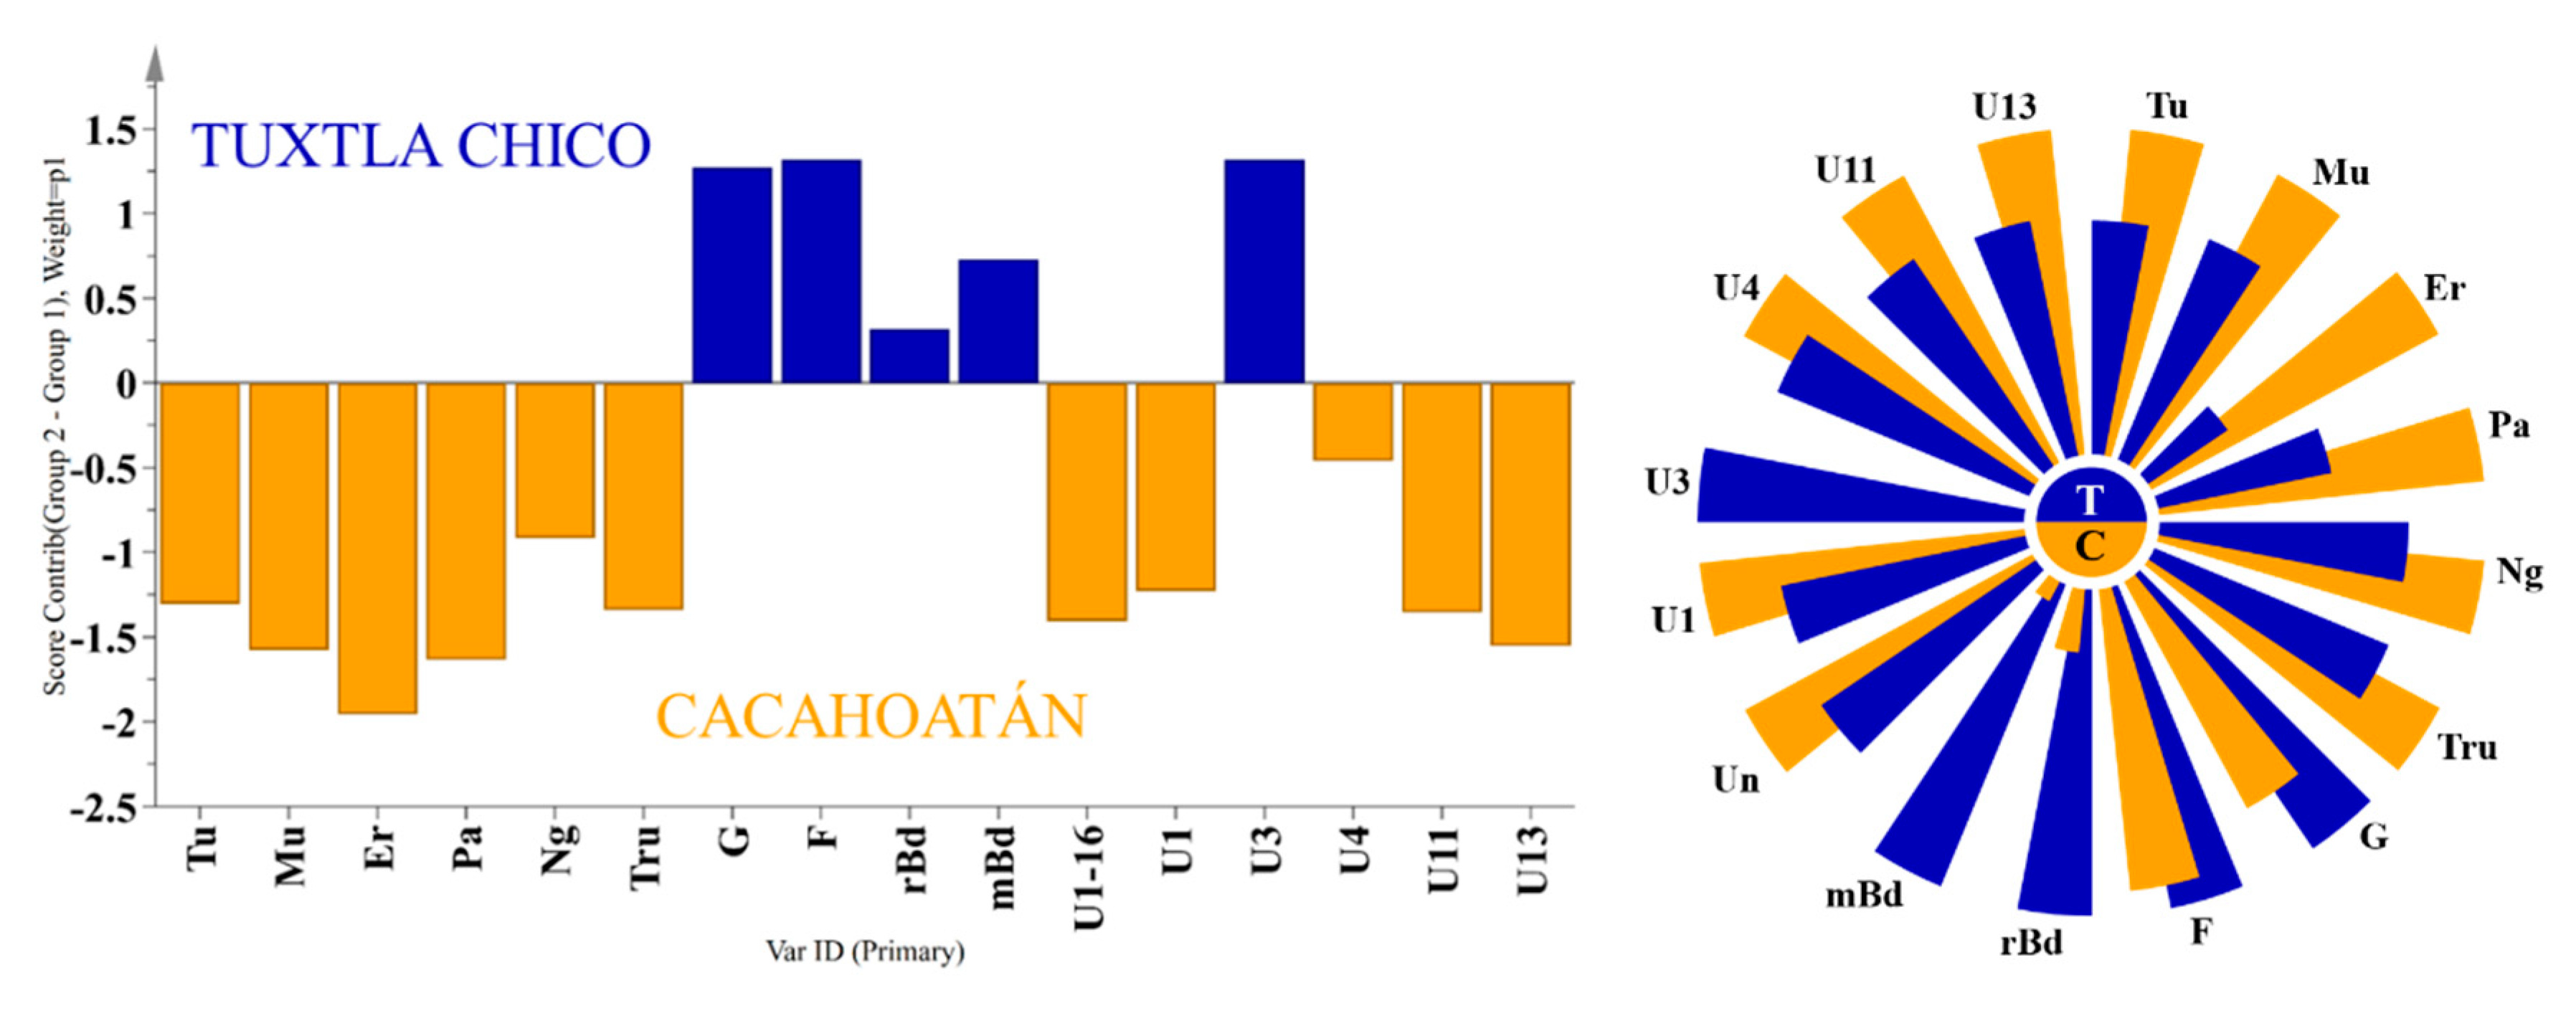
The honey samples from Tuxtla Chico contained higher concentrations of glucose (17.4-25.2 g/100g) and fructose (26.8-30.6 g/100g) compared to those from Cacahoatán, where the concentrations of glucose ranged from 14.6 to 20.0 g/100g and fructose – from 24.3 to 28.1 g/100g. Cacahoatán honey samples were characterized by a rich composition of di- and trisaccharides, including maltulose, turanose, trehalulose, erlose and panose. It should be noted that the concentration of erlose in all samples from this region exceeded 1g/100g, while only one sample from Tuxtla Chico – M7 demonstrated such a high concentration at 1.2 g/100g. The differences between the two honey groups are illustrated using contribution plot and Nightingale’s diagram (
Figure 5). These variations can be attributed to the distinct sources of nectar utilized by the bees in each geographical region. The differences in altitudes and average temperatures between the two regions (
Figure 1) contribute to the divergence in plant species and their nectar composition.
An interesting observation is the significant presence of trehalulose in all honey samples – more than 6.7g/100g. Recently, this unusual reducing sugar, α-(1→1) glucose-fructose isomer of sucrose, was found in stingless bee honeys of different bee species from Asia, Australia, Africa and South America, and it was suggested that trehalulose could be a marker for the authenticity of stingless bee honey [
12,
13]. The presence of trehalulose is considered beneficial, because of its known low glycemic index, acariogenic properties, and antioxidant activity [
14].
In a series of feeding experiments with Australian stingless bees, Hungerford et al. [
14] demonstrated that the conversion of fed sucrose resulted in trehalulose (64–72%) with lesser erlose (18–23%) and fructose (9–12%). On the other hand, feeding solutions of glucose/fructose (1:1) mixtures did not result in trehalulose/erlose formation. It has been suggested that this disaccharide is the result of some enzymatic processes due to microbes in the stingless bee nest, and does not come from the floral sources of the nectar. Thus, Hungerford et al. speculated that stingless bees with access to floral nectar with high sucrose content will produce honey with high trehalulose content. This hypothesis is supported by our results, as the honey form Tuxtla Chico, which had higher fructose and glucose content, had lower amounts of trehalulose.
However, there are still not enough published data to conclude that trehalulose is a universal marker for stingless bee honey. Recent work from Malaysia [
15] and some unpublished data for honey from Malaysia and Indonesia [
16] indicate that this hypothesis needs verification in future studies.
The total phenolic content of the honey samples was also studied. The values varied between 61.5 and 111 mg GAE/100 g (
Table S2). This is in accordance with previous studies of different stingless bee honeys [
17]. Our data are also similar to data for A. mellifera, which displays a wide range of values (18.9 to 177 mg GAE/100 g), dependent on the geographic region of origin [
18,
19]. It has been demonstrated that Folin-Ciocalteu method could be considered as suitable for antioxidant potency evaluation purposes [
20]. This suggests that the honey of
S. mexicana has similar antioxidant potential to A. mellifera honey.
The results of the two locations did not demonstrate statistically significant difference: honey samples from Tuxtla Chico contained an average 79.9+12 mg GAE/100 g, while honey samples from Cacahoatán - 74.8+10 mg GAE/100 g (p=0.279).
3.2. Propolis chemical profiles
The 70% ethanol extracts of the propolis samples were analyzed using GC-MS after silylation. More than 40 individual compounds were identified. For this reason, the chemical profiles are presented as means of the main type of compounds identified, not as a percentage of individual substances. The results obtained are presented in Table 2. The full chemical profiles of all samples can be found in
Table S2a,b.
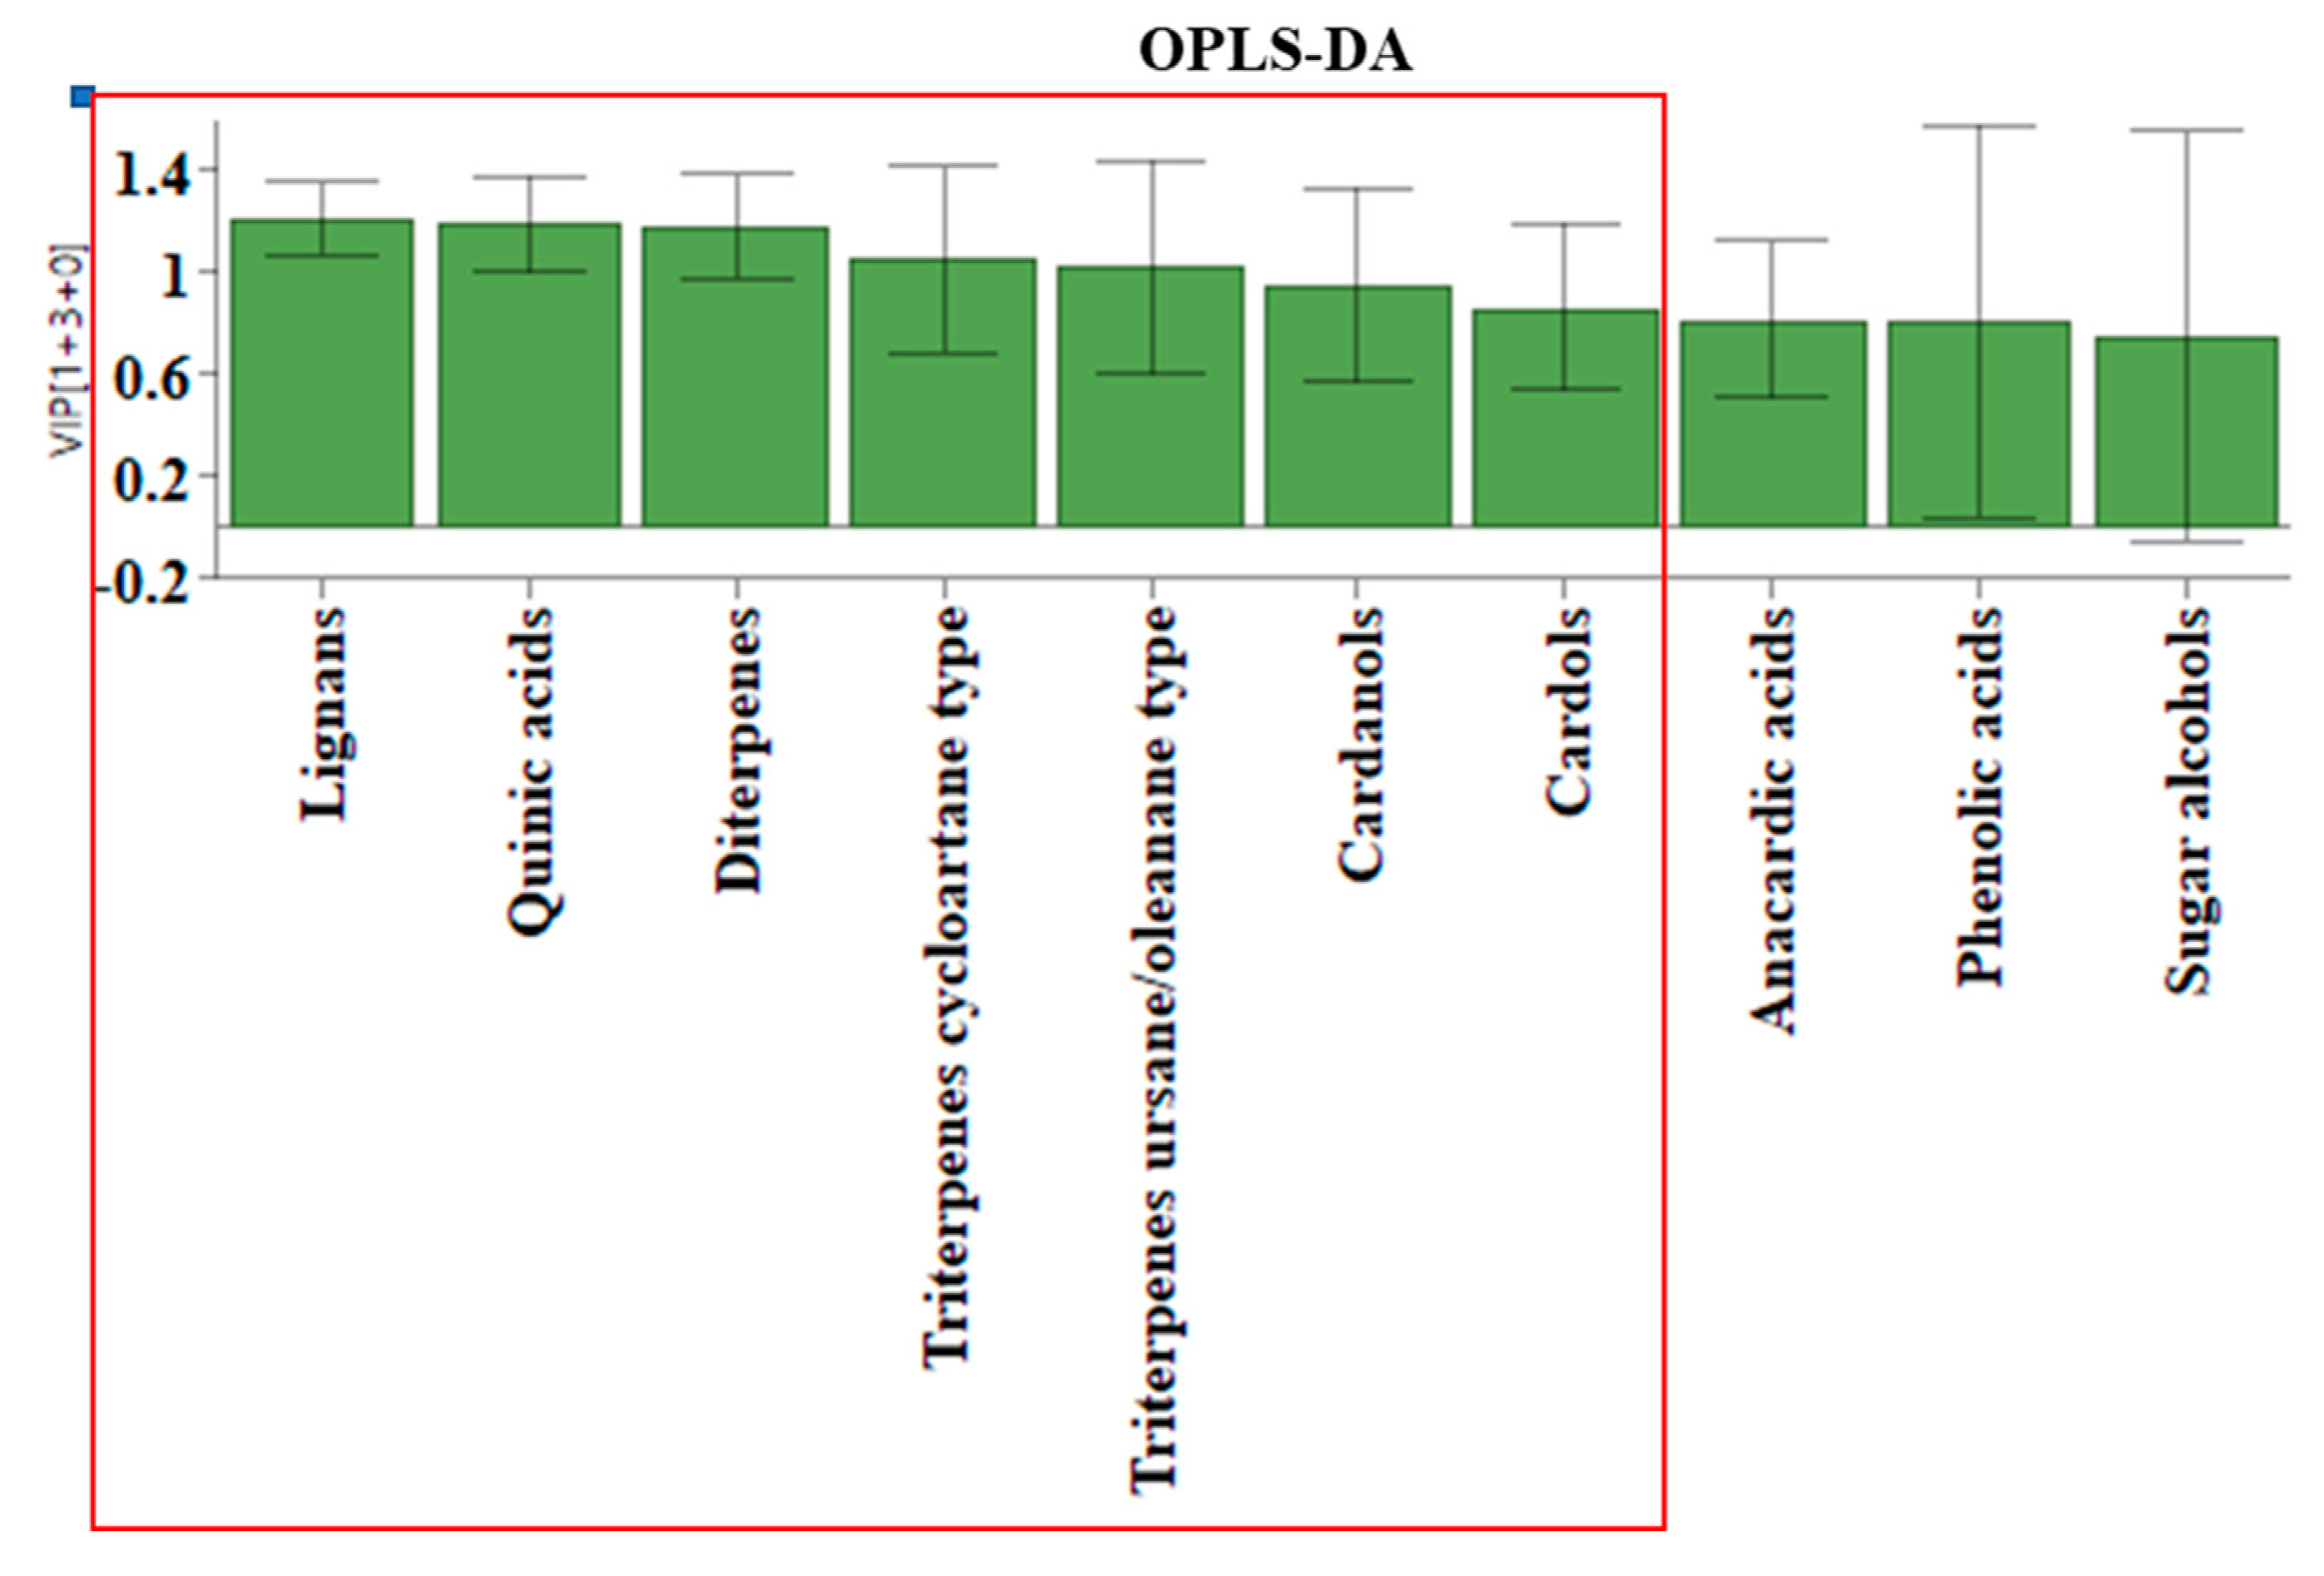
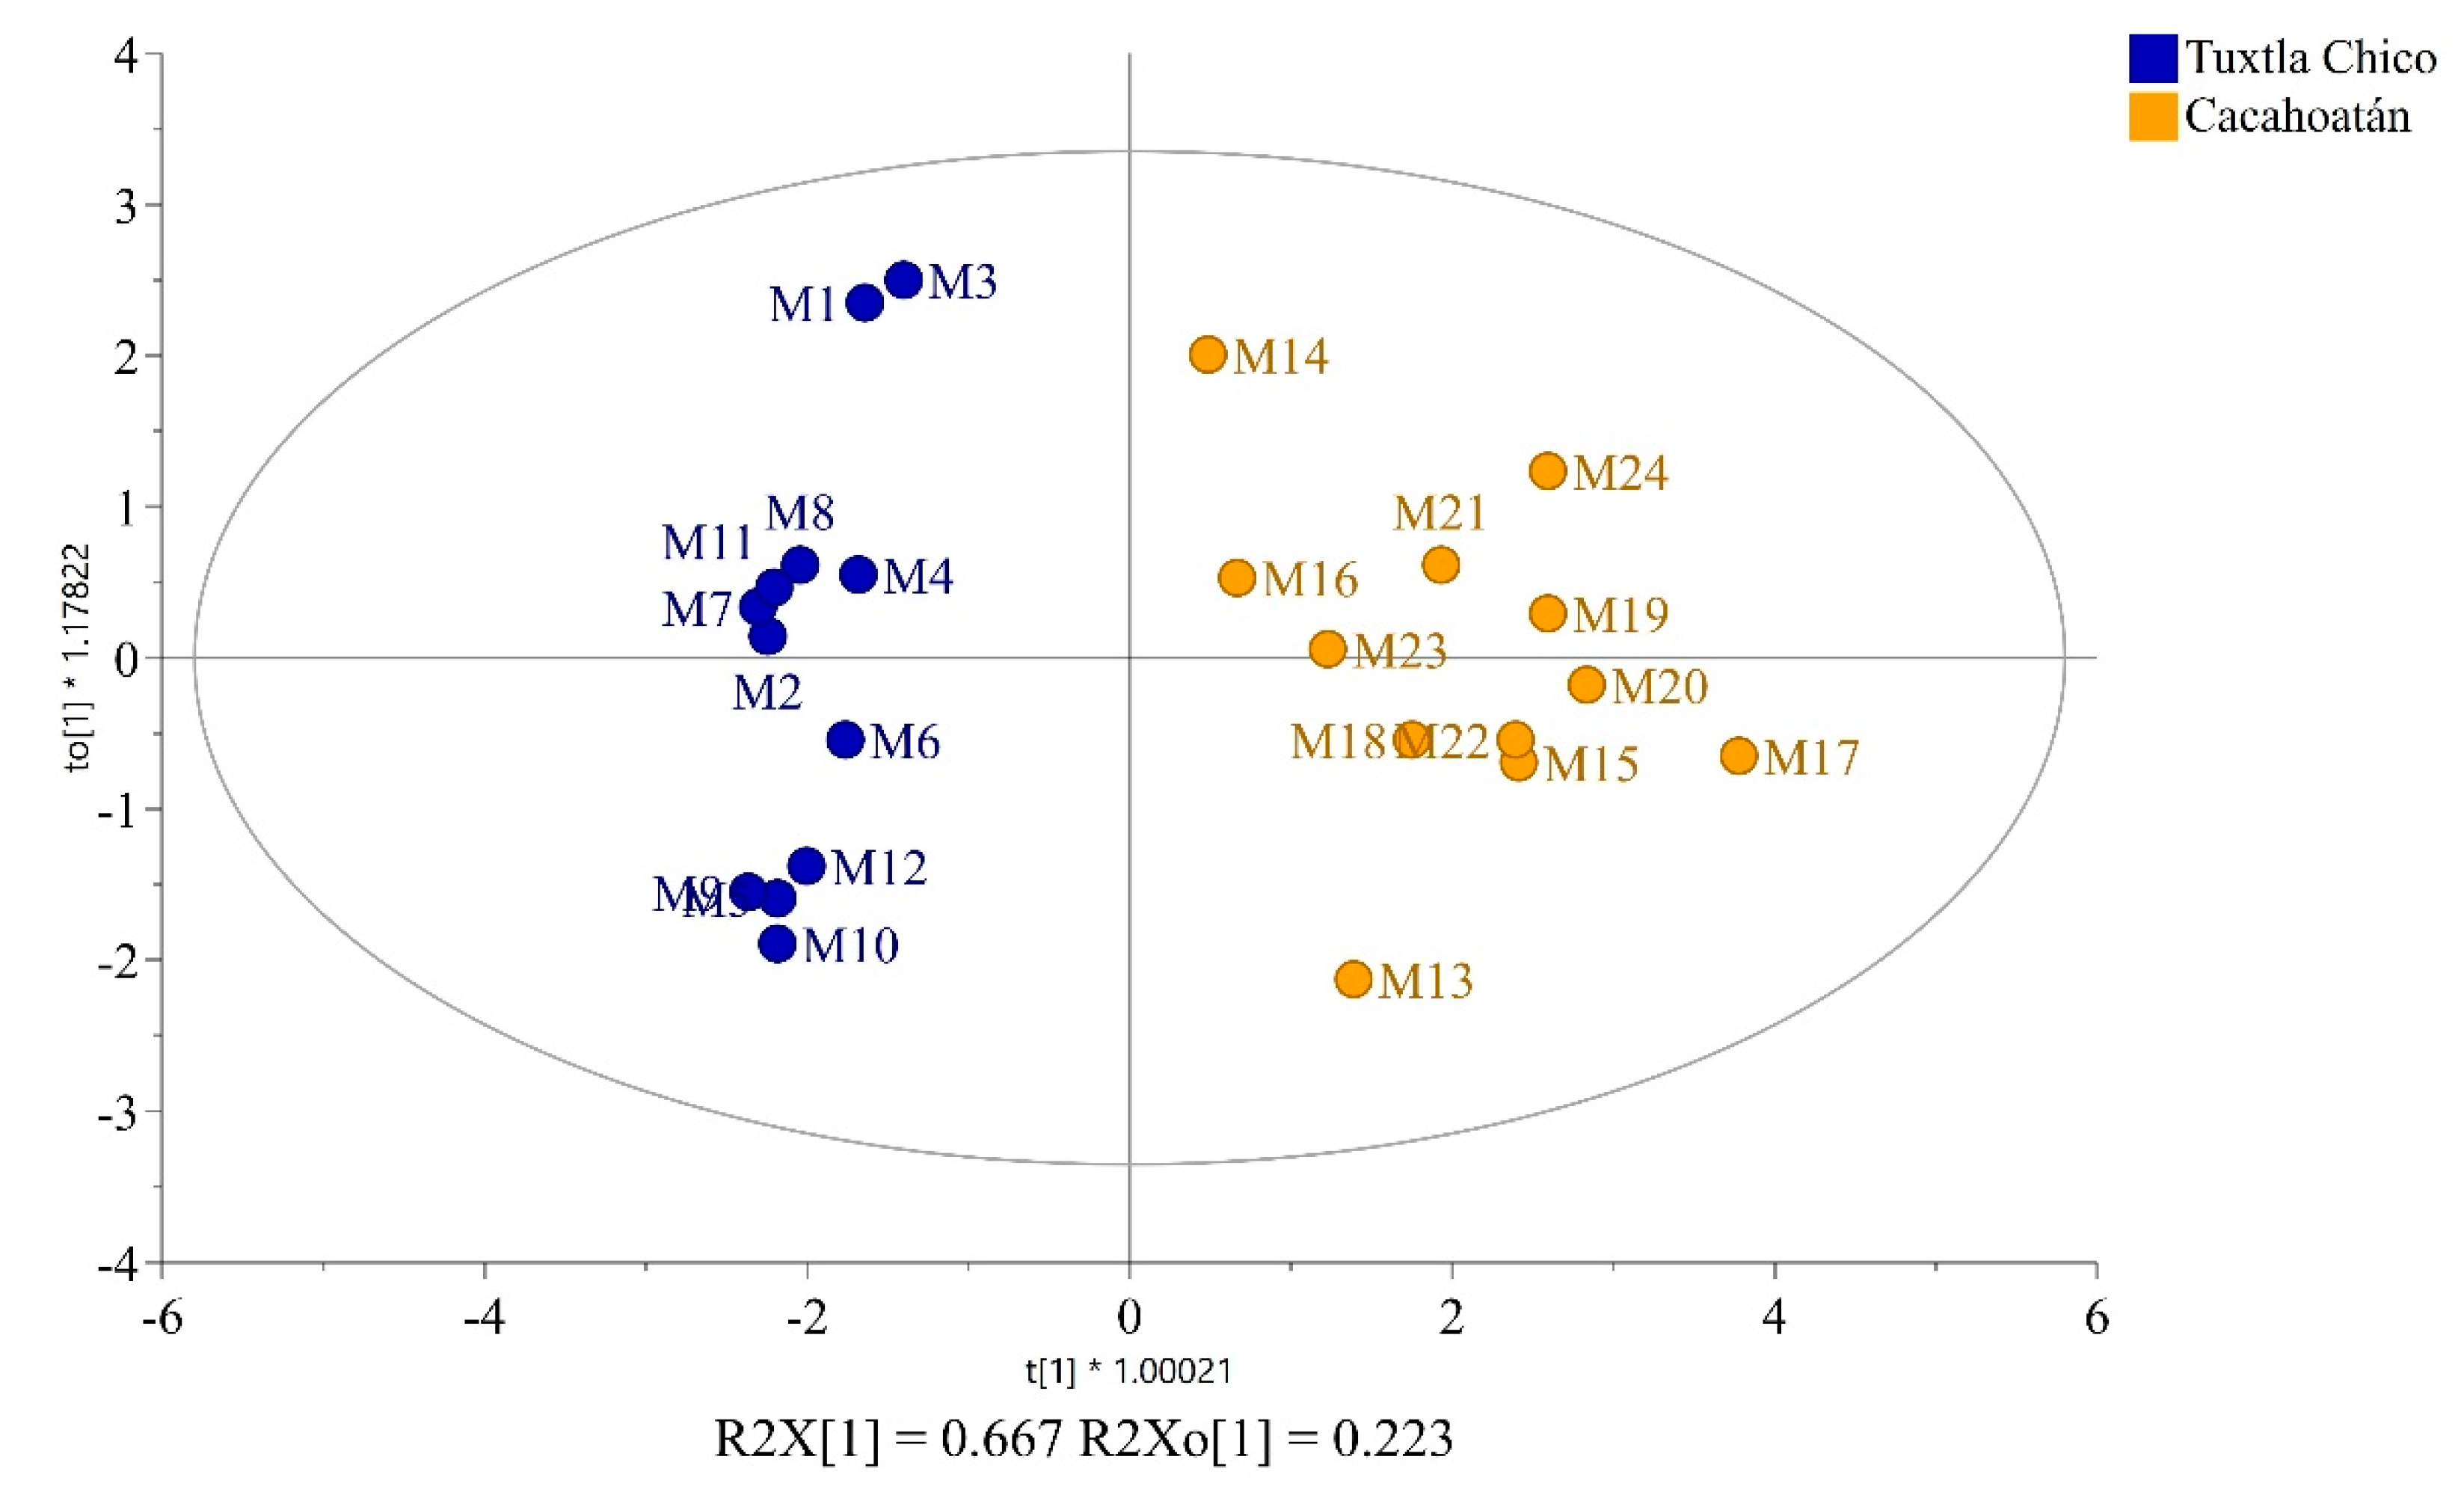
To determine whether the propolis samples could be distinguished according to their geographical origin, a 2-component OPLS-DA analysis was applied analogously to the honey samples. Of the ten different groups of compounds that were identified, only seven proved to be statistically significant for distinguishing between Tuxtla Chico and Cacahoatán propolis according to the VIP values presented in
Figure 6. This model, based on seven groups of compounds (R2X(cum) = 0.984; R2Y (cum) = 0.897; Q2(cum) = 0.847), demonstrates the formation of two distinct groups of samples visualized in
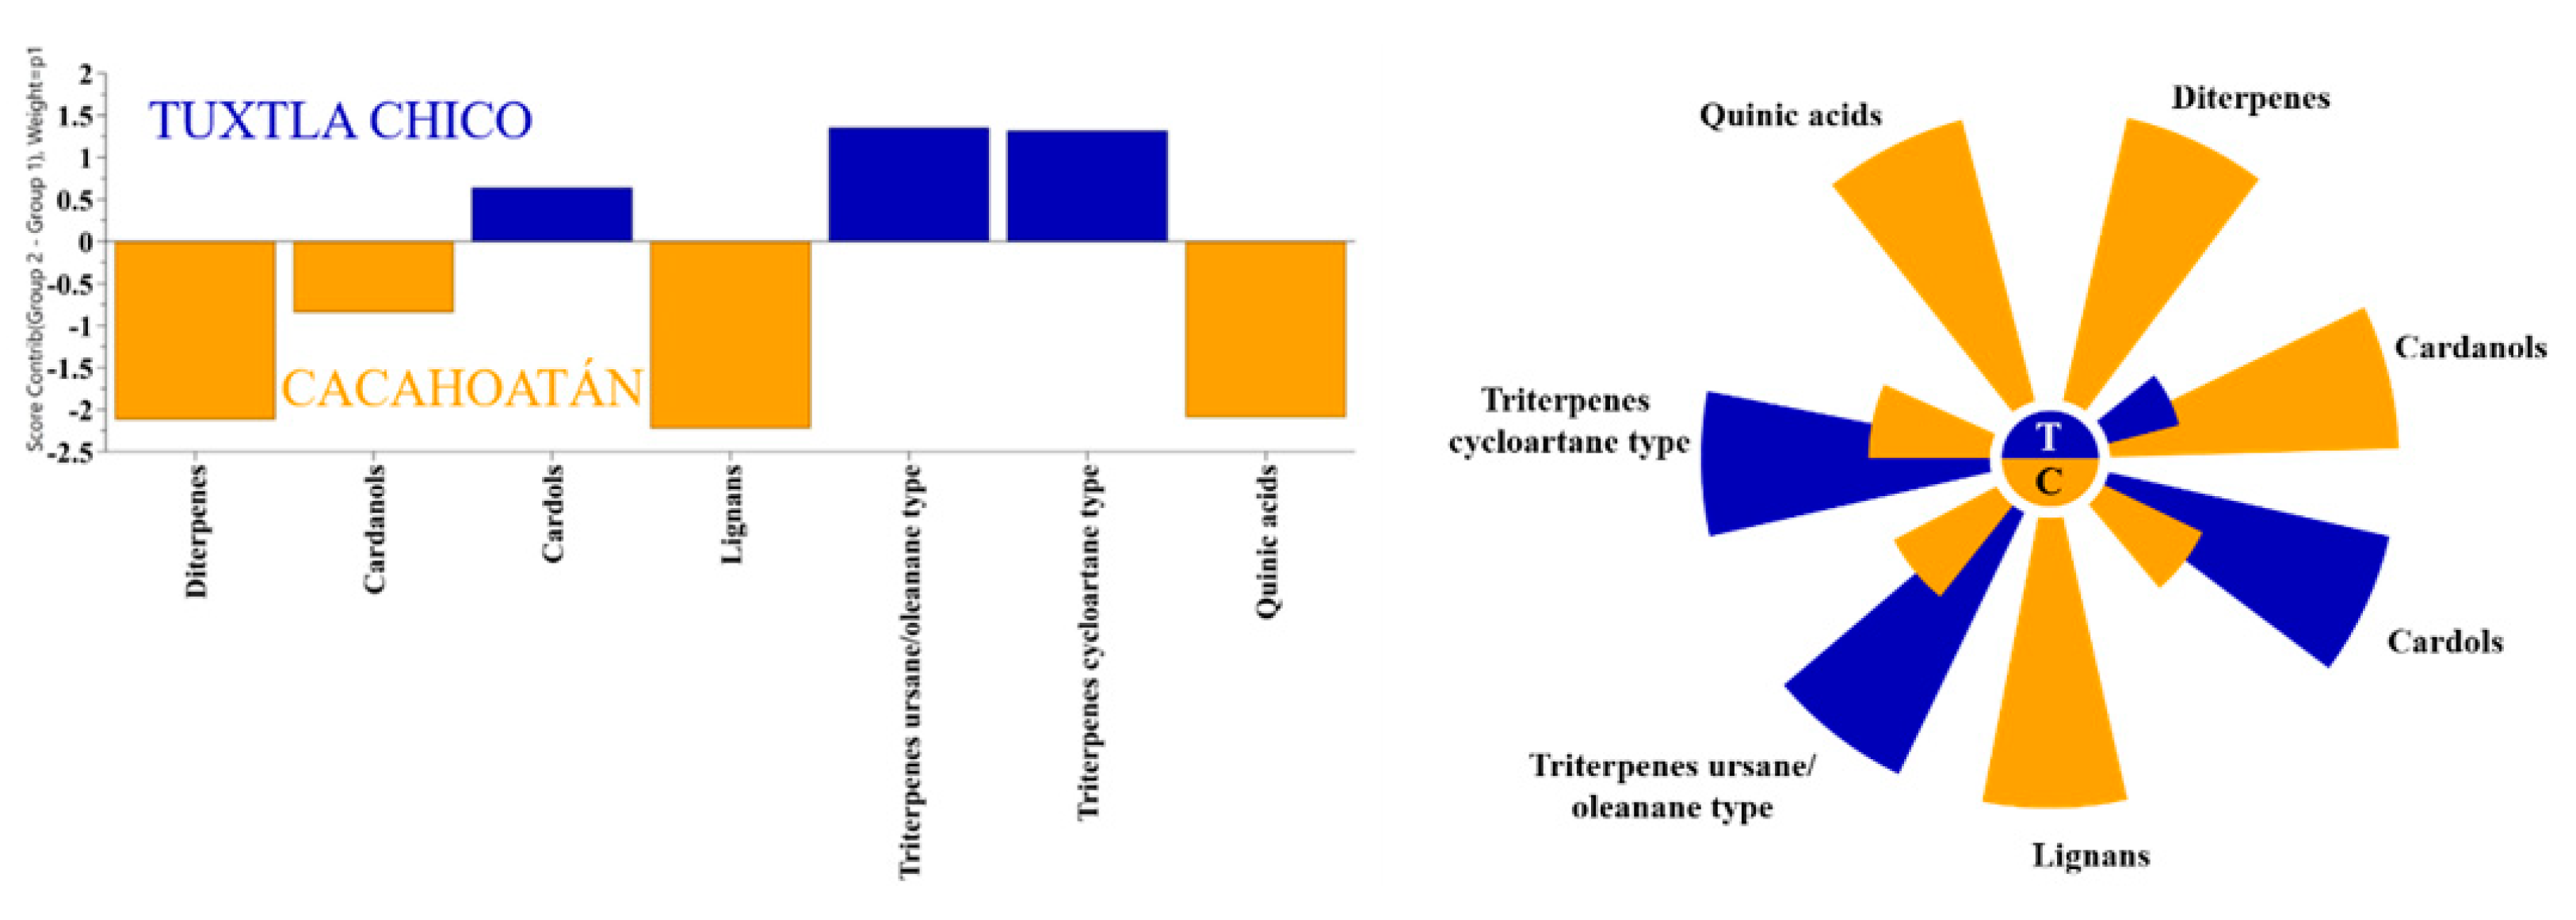
Figure 7. The variables responsible for the distinction between the two groups and their contribution are presented in
Figure 8.
All samples from both locations contained the typical
Mangifera indica chemical markers: the cycloartane type triterpenes (cycloartenol, mangiferolic, and isomangiferolic, acids), and the group of phenolic lipids, mainly cardols (alk(en)yl resorcinols) [
21]. However, the two sample groups also demonstrated a significant difference. While 11 of the 12 samples from Tuxtla Chico contained almost no other secondary metabolites besides the mango tree compounds, all samples from Cacahoatán, contained diterpenes of kaurane type (mainly kaurenoic acid), dibenzylbutanediol lignans (dihydrocubebin and 3,4-methylenedioxy secoisolariciresinol), and small amounts of quinic acid isomers. The difference in the chemical profiles of the two sample groups is demonstrated in
Figure 8. Our results differ from the published data [
7]: in our samples, no flavonoids, no chromenes and no totarolon were identified.
These results are a solid indication that the bees in the Cacahoatán meliponary collected resin from another botanical source, in addition to the mango latex since their propolis contained diterpenes, lignans, and quinic acids that were not found in the samples from Tuxtla Chico. The only exception is the sample M-11 (Tuxtla Chico), in which diterpenes and lignans were detected in significantly lower amounts. The suggestion that all three groups of constituents (diterpenes, lignans and quinic acids), which differ from the Tuxtla Chico samples, come from the same source plant, is supported by the statistically significant correlation between lignans and diterpenes concentration (R=0.818, p < 0.01), and between the lignans and quinic acids concentration (R=0.859, p < 0.01). The predominance of a single additional resin source in these samples is surprising, however, given that bees were observed entering Cacahoatán colonies with resins of a variety of distinct colors (reds, browns, organs, whites) twice weekly over the course of one year. To the best of our knowledge, no plant resin, exudate, or latex has been reported to contain a combination of all these substances. Indeed, in many cases, especially in Gymnosperm resins, lignans and diterpenes occur simultaneously, but a material with the combination of kaurenoic acid and kaurene type diterpenes with dibenzylbutanediol lignans is yet unknown. The only information about such co-occurrence concerns
Aristolochia species [
22,
23]. However, these plants do not produce any type of substance on their surface which could attract the stingless bees and serve as a source of resinous material for the bees. The botanical origin of these compounds has yet to be revealed; additional observations of bee behavior could be very helpful to determine their source. This plant must be attractive to resin foragers: as already mentioned, one of the samples from Tuxtla Chico was found to contain small amounts of the same diterpenes and lignans, despite possibly being located far from their source.
The antioxidant activity of the extracts was tested using DPPH radical scavenging activity test and a FRAP test. The results are presented in
Table S2. The DPPH radical inhibition values for the two groups were relatively low and displayed no statistically significant differences, unlike the FRAP. No correlation was observed between the DPPH and the FRAP values of all samples, but this is expected [
21]. The samples from Cacahoatán have higher ferric reducing antioxidant potential compared to Tuxtla Chico ones, and the difference was statistically significant at p < 0.05 (p=0.0425). The presence of lignans is probably the reason for this difference. This suggestion is supported by the strong positive correlation between the FRAP and lignan concentration in this group of samples (r=0.8991, p<0.01). It is interesting to note that dihydrocubebin has been found to possess significant antituberculosis activity [
24].
5. Conclusions
In conclusion, our results indicate the importance of the geographic location, specifically the plant origin and climate, on the composition of honey and propolis produced by the same stingless bee species. The observed substantial differences in the chemical composition of propolis and honey of
S. mexicana from two relatively close locations definitely support the conclusion that the bee species cannot be regarded as the most important factor determining the chemistry of these products. Propolis composition indicates that the bees visit different resin sources at the two locations. The significant difference we observed between the honeys from the two regions are not in line with the recent conclusion [
25] that the entomological origin is the main factor that determines the characteristics of honey, and that the floral origin is only the secondary factor.
Supplementary Materials
The following supporting information can be downloaded at the website of this paper posted on
Preprints.org, Table S1: Chemical composition of studied honey samples (g/100 g); Table S2a: Chemical composition of the propolis of Scaptortigona mexicana (GC-MS after silylation; %TIC). samples 1 -12; Table S2b: Chemical composition of the propolis of Scaptortigona mexicana (GC-MS after silylation; %TIC). samples 13 -24; Table S3: DPPH and FRAP for
S. mexicana propolis.
Author Contributions
Conceptualization, M.S., V.B.; methodology, M.Sh., M.G., E.S-G., E.L-R., S.S., M.P., B.T. and V.B.; investigation, D.G., S.S., M.P., R.C., B.T., M.Sh., M.G., E.S-G., E.L-R., V.B.; resources, M.Sh.; visualization, D.G., M.P.; writing—original draft preparation, V.B., S.S.; writing—review and editing, S.S., V.B., M.P., M.S., M.Sh., E.S-G., E.L-R.; project administration, M.Sh, V.B. All authors have read and agreed to the published version of the manuscript.
Funding
This material is based upon work supported by the National Science Foundation Graduate Research Fellowship Program under Grant No. CON-75851, project 00074041 to M. Shanahan. Any opinions, findings, and conclusions or recommendations expressed in this material are those of the author(s) and do not necessarily reflect the views of the National Science Foundation. Funding was also provided by the University of Minnesota (UMN) Interdisciplinary Center for the Study of Global Change, the UMN Consortium on Law and Values in Health, Environment & the Life Sciences, and the UMN Thesis Research Travel Grant to M. Shanahan. In this investigation NMR and GC-MS equipment purchased by Project No BG05M2OP001-1.002-0012, Center of Competence “Sustainable utilization of bio-resources and waste from medicinal and aromatic plants for innovative bioactive products”, funded by the Operational Program “Science and Education for Smart Growth” 2014-2020, co-financed by the European Union through the European Regional Development Fund, and equipment of the Distributed Research Infrastructure INFRAMAT, part of the Roadmap for Research Infrastructures of the Republic of Bulgaria 2020-2027, supported by the Ministry of Education and Science, was used.
Data Availability Statement
The data of the current study is available from the corresponding authors on reasonable request.
Acknowledgments
The authors would like to thank Rémy Vandame and Héctor Morales Urbina for supporting the experimental work that preceded this study, and made this project possible.
Conflicts of Interest
The authors declare no conflict of interest.
References
- Arnold, N.; Zepeda, R.; Vásquez, V.D.; Maya, E.M.A. Las abejas sin aguijón y su cultivo en Oaxaca, México; ECOSUR: Lerma Campeche, México, 2019; ISBN 978-607-8429-53-0. [Google Scholar]
- Gutierrez, A.; Obregon, F.H.; Jones, W.R. Optimum brood size for artificial propagation of the stingless bee, Scaptotrigona mexicana. J. Apic. Res. 2002, 41, 62–63. [Google Scholar] [CrossRef]
- Vit, P.; Medina, M.; Eunice Enríquez, M. Quality standards for medicinal uses of Meliponinae honey in Guatemala, Mexico and Venezuela. Bee World 2004, 85, 2–5. [Google Scholar] [CrossRef]
- Jimenez, M.; Beristain, C.I.; Azuara, E.; Mendoza, M.R.; Pascual, L.A. Physicochemical and antioxidant properties of honey from Scaptotrigona mexicana bee. J. Apic. Res. 2016, 55, 151–160. [Google Scholar] [CrossRef]
- Vit, P.; Rojas, L.B.; Usubillaga, A.; Aparicio, R.; Meccia, G.; Muiño, M.A.F.; Sancho, M.T. Presence of lactic acid and other semivolatil compound in Meliponini honeys. RINHRR 2011, 42, 58–63. [Google Scholar]
- Grajales-Conesa, J.; Elías-Chirino, J.; Lozano-Guzmán, E.; Moreno-Cruz, F.; Albores-Flores, V.; López-García, A. Stingless bees propolis antimicrobial activity in combination with garlic, Allium sativum (Amaryllidaceae). Rev. Biol. Trop. 2021, 69, 22–35. [Google Scholar]
- Souza, B.; Roubik, D.; Barth, O.; Heard, T.; Enríquez, E.; Carvalho, C.; Villas-Bôas, M.L.; Locatelli, J.; Persano-Oddo, L.; Almeida-Muradian, L.; Bogdanov, S.; Vit, P. Composition of stingless bee honey: setting quality standards. Interciencia 2006, 31, 867–875. [Google Scholar]
- Gerginova, D.; Dimova, D.; Simova, S. Preliminary NMR and chemometric study of pine jams used as medicinal remedies. Bulg. Chem. Commun. 2017, 49, 215–220. [Google Scholar]
- Gerginova, D.; Simova, S.; Popova, M.; Stefova, M.; Stanoeva, J.P.; Bankova, V. NMR Profiling of North Macedonian and Bulgarian Honeys for Detection of Botanical and Geographical Origin. Molecules 2020, 25, 4687. [Google Scholar] [CrossRef]
- Tomasina, F.; Carabio, C.; Celano, L.; Thomson, L. Analysis of two methods to evaluate antioxidants. Biochem. Mol. Biol. Educ. 2012, 40, 266–270. [Google Scholar] [CrossRef]
- Benzie, I.; Devaki, M. The ferric reducing/antioxidant power (FRAP) assay for non-enzymatic antioxidant capacity: Concepts, procedures, limitations and applications. In Measurement of Antioxidant Activity and Capacity: Recent Trends and Applications; Apak, R., Capanoglu, E., Shahidi, F., Eds.; Wiley: Hoboken, NJ, USA, 2018; pp. 77–106. [Google Scholar]
- Fletcher, M.T.; Hungerford, N.L.; Webber, D.; de Jesus, M.C.; Zhang, J.; Stone, I.S.J.; Blanchfield, J.T. Stingless bee honey, a novel source of trehalulose: A biologically active disaccharide with health benefits. Scientific Reports 2020, 10, 12128. [Google Scholar] [CrossRef]
- Popova, M.; Gerginova, D.; Trusheva, B.; Simova, S.; Tamfu, A.N.; Ceylan, O.; Clark, K.; Bankova, V. A preliminary study of chemical profiles of honey, cerumen, and propolis of the African stingless bee Meliponula ferruginea. Foods 2021, 10, 997. [Google Scholar] [CrossRef] [PubMed]
- Hungerford, N.L.; Zhang, J.; Smith, T.J.; Yates, H.S.; Chowdhury, S.A.; Carter, J.F.; Carpinelli de Jesus, M.; Fletcher, M.T. Feeding sugars to stingless bees: identifying the origin of trehalulose-rich honey composition. J. Agric. Food Chem. 2021, 69, 10292–10300. [Google Scholar] [CrossRef]
- Ng, W.-J.; Sit, N.-W.; Ooi, P.A.-C.; Ee, K.-Y.; Lim, T.-M. Botanical Origin Differentiation of Malaysian Stingless Bee Honey Produced by Heterotrigona itama and Geniotrigona thoracica Using Chemometrics. Molecules 2021, 26, 7628. [Google Scholar] [CrossRef] [PubMed]
- Simova, S. (Institute of Organic Chemistry with Centre of Phytochemistry, Bulgarian Academy of Sciences, Sofia, Bulgaria) Unpublished work.
- Ali, H.; Abu Bakar, M.F.; Majid, M.; Muhammad, N.; Lim, S.Y. In vitro anti-diabetic activity of stingless bee honey from different botanical origins. Food Res. 2020, 4, 1421–1426. [Google Scholar] [CrossRef] [PubMed]
- Wilczyńska, A. Effect of filtration on colour, antioxidant activity and total phenolics of honey. LWT-Food Sci. Technol. 2014, 57, 767–774. [Google Scholar] [CrossRef]
- Pauliuc, D.; Dranca, F.; Oroian, M. Antioxidant activity, total phenolic content, individual phenolics and physicochemical parameters suitability for Romanian honey authentication. Foods 2020, 9, 306. [Google Scholar] [CrossRef]
- Rumpf, J.; Burger, R.; Schulze, M. Statistical evaluation of DPPH, ABTS, FRAP, and Folin-Ciocalteu assays to assess the antioxidant capacity of lignins. Int. J. Biol. Macromol. 2023, 233, 123470. [Google Scholar] [CrossRef]
- Ediriweera, M.K.; Tennekoon, K.H.; Samarakoon, S.R. A review on ethnopharmacological applications, pharmacological activities, and bioactive compounds of Mangifera indica (Mango). Evid Based Complement Alternat Med. 2017, 2017, 6949835. [Google Scholar] [CrossRef]
- Zhang, G.; Shimokawa, S.; Mochizuki, M.; Kumamoto, T.; Nakanishi, W.; Watanabe, T.; Ishikawa, T.; Matsumoto, K.; Tashima, K.; Horie, S.; Higuchi, Y.; Dominguez, O.P. Chemical constituents of Aristolochia constricta: Antispasmodic effects of its constituents in guinea-pig ileum and isolation of a diterpeno− lignan hybrid. J. Nat Prod. 2008, 71, 1167–1172. [Google Scholar] [CrossRef]
- Pereira, A.O.; Avila, J.M.; do Carmo, G.; Siqueira, F.S.; Campos, M.M.; Back, D.F.; Morel, A.F.; Dalcol, I.I. Chemical composition, antimicrobial and antimycobacterial activities of Aristolochia triangularis Cham. from Brazil. Ind. Crop. Prod. 2018, 121, 461–467. [Google Scholar] [CrossRef]
- Koirala, N.; Modi, B.; Subba, R.K.; Panthi, M.; Xiao, J. Medicinal Plants in Targeting Tuberculosis II. In Medicinal Plants for Lung Diseases; Dua, K., Nammi, S., Chang, D., Chellappan, D.K., Gupta, G., Collet, T., Eds.; Springer: Singapore, 2021. [Google Scholar] [CrossRef]
- May-Canché, I.; Moguel-Ordoñez, Y.; Valle-Mora, J.; González-Cadenas, R.; Toledo-Núñez, B.; Arroyo-Rodríguez, L.; Piana, L.; Rémy Vandame, R. Sensory and physicochemical analysis of honeys of nine stingless bee species of Mexico and Guatemala. J Food Sci Technol 2022, 59, 4772–4781. [Google Scholar] [CrossRef] [PubMed]
|
Disclaimer/Publisher’s Note: The statements, opinions and data contained in all publications are solely those of the individual author(s) and contributor(s) and not of MDPI and/or the editor(s). MDPI and/or the editor(s) disclaim responsibility for any injury to people or property resulting from any ideas, methods, instructions or products referred to in the content. |
© 2023 by the authors. Licensee MDPI, Basel, Switzerland. This article is an open access article distributed under the terms and conditions of the Creative Commons Attribution (CC BY) license (http://creativecommons.org/licenses/by/4.0/).
