Submitted:
02 August 2023
Posted:
03 August 2023
You are already at the latest version
Abstract
Keywords:
1. Introduction
2. OSI Representation on A Plane From Spiral Samples


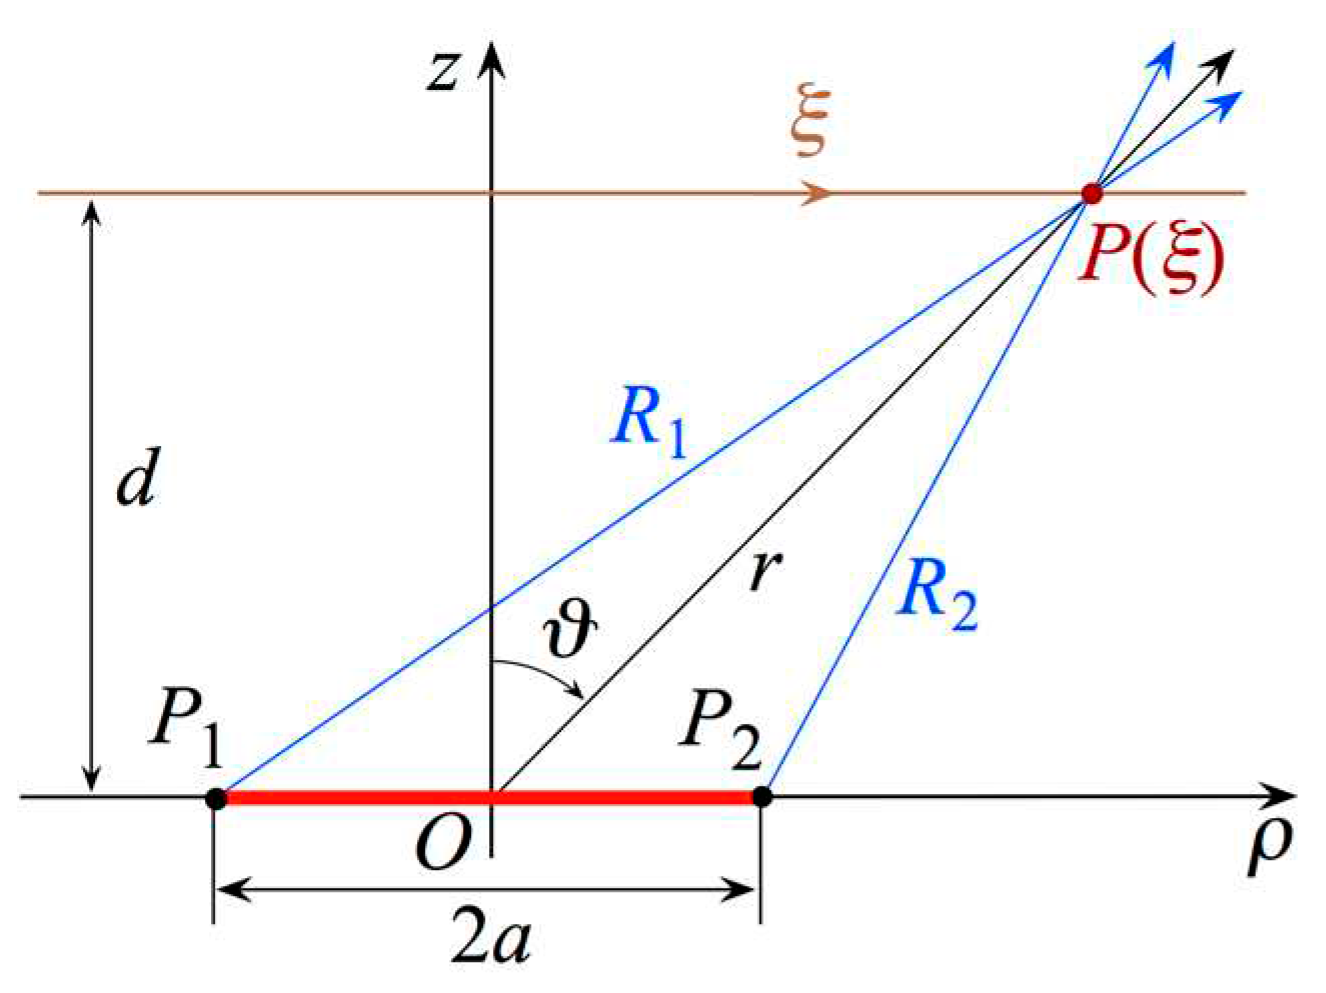
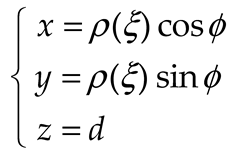


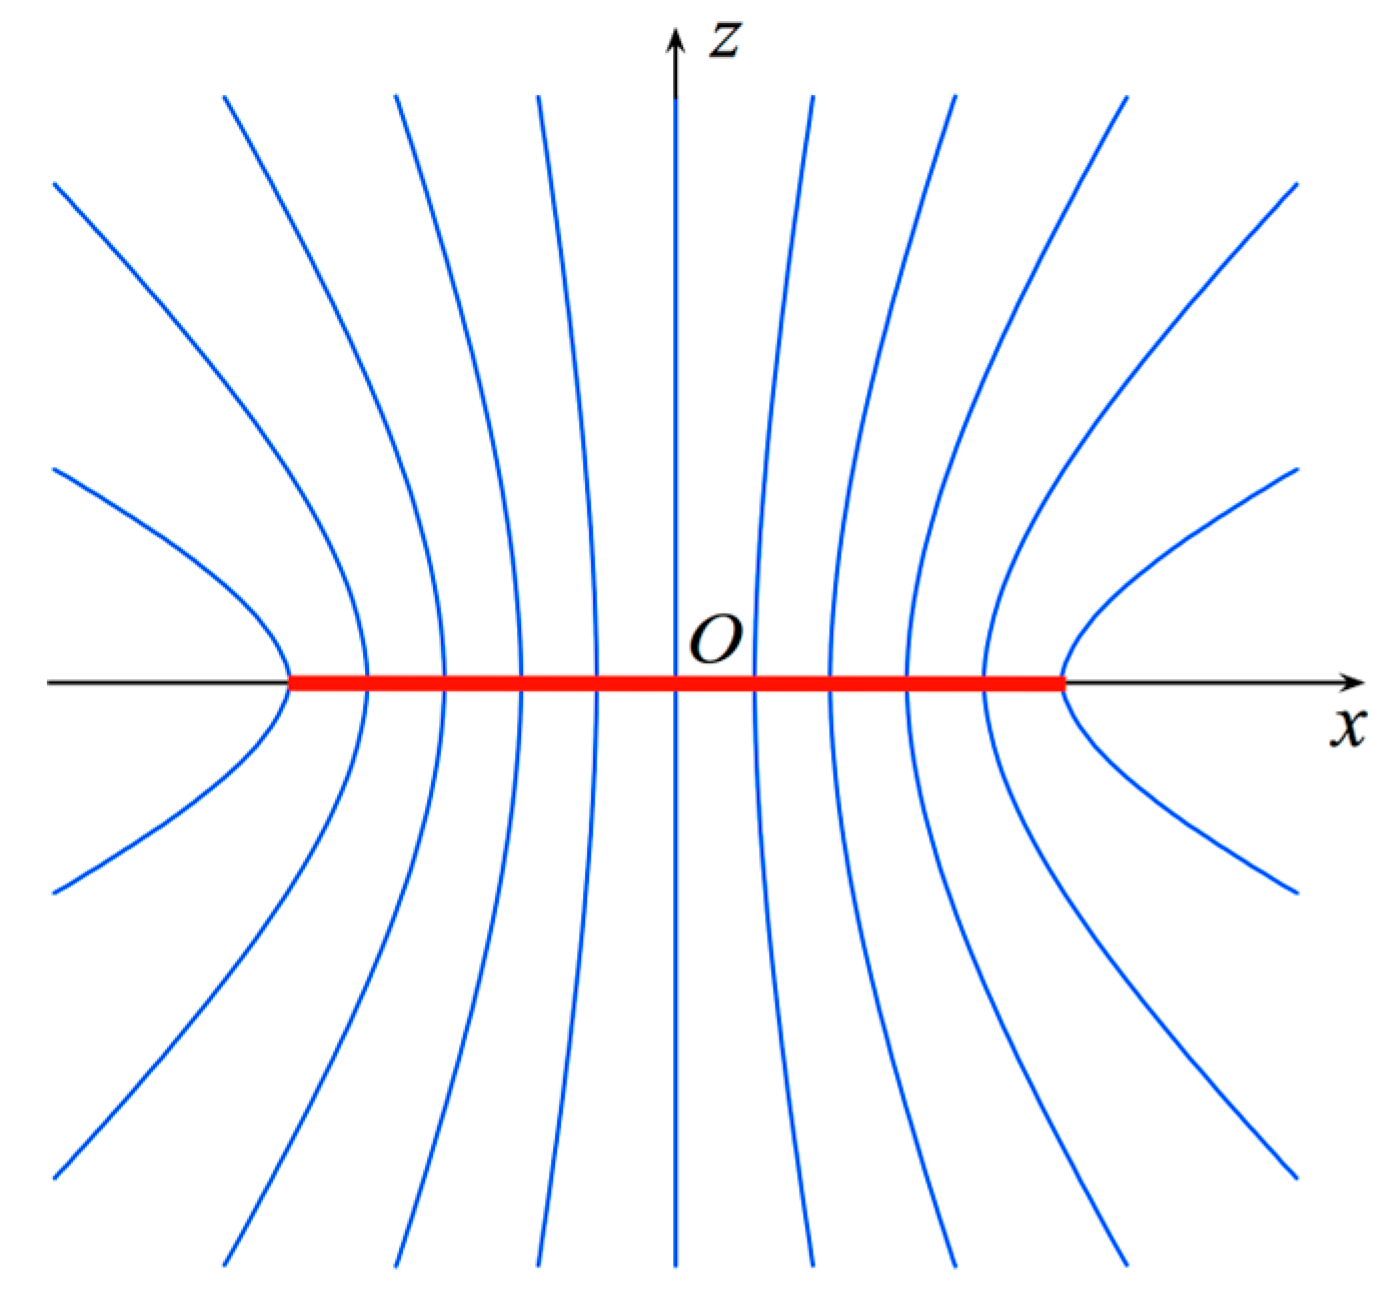
3. Results
3.1. Numerical tests results
3.1. Experimental tests results
4. Conclusions
Funding
Conflicts of Interest
References
- Bucci, O.M.; Gennarelli, C.; Savarese, C. Representation of electromagnetic fields over arbitrary surfaces by a finite and nonredundant number of samples. IEEE Trans. Antennas Propag. 1998, 46, 351–359. [Google Scholar] [CrossRef]
- Bucci, O.M.; Gennarelli, C. Application of nonredundant sampling representations of electromagnetic fields to NF-FF transformation techniques. Int. J. Antennas Propag. 2012, 2012, 1–14. [Google Scholar] [CrossRef]
- Yaghjian, A.D. An overview of near-field antenna measurements. IEEE Trans. Antennas Propag. 1986, AP-34, 30–45. [Google Scholar] [CrossRef]
- Appel-Hansen, J.; Dyson, J.D.; Gillespie, E.S.; Hickman, T.G. Antenna measurements. In The Handbook of Antenna Design; Rudge, A.W., Milne, K., Olver, A.D., Knight, P., Eds.; Peter Peregrinus: London, UK, 1986; pp. 584–694. [Google Scholar]
- Gregson, S.F.; McCormick, J.; Parini, C.G. Principles of Planar Near-Field Antenna Measurements; IET: London, UK, 2007. [Google Scholar]
- Francis, M.H.; Wittmann, R.C. Near-field scanning measurements: theory and practice. In Modern Antenna Handbook; Balanis, C.A., Ed.; John Wiley & Sons Inc.: Hoboken, NJ, USA, 2008; pp. 929–976. [Google Scholar]
- IEEE Standard 1720-2012 IEEE Recommended Practice for Near-Field Antenna Measurements; Francis, M.H., Ed.; IEEE: New York, NY, USA, 2012. [Google Scholar]
- Ferrara, F.; Gennarelli, C.; Guerriero, R. Near-field antenna measurement techniques. In Handbook of Antenna Technologies; Chen, Z.N., Liu, D., Nakano, H., Qing, X., Zwick, T., Eds.; Springer-Verlag: Singapore, 2016; pp. 2107–2163. [Google Scholar]
- Sierra Castañer, M.; Foged, L.J. Post-processing Techniques in Antenna Measurement; SciTech Publishing IET: London, UK, 2019. [Google Scholar]
- Parini, C.; Gregson, S.; McCormick, J.; Van Resburg, D.J.; Eibert, T. Theory and Practice of Modern Antenna Range Measurements; SciTech Publishing IET: London, UK, 2020. [Google Scholar]
- Ferrara, F.; Gennarelli, C.; Guerriero, R.; D’Agostino, F. Non-Redundant Near-Field to Far-Field Transformation Techniques; SciTech Publishing IET: London, UK, 2022. [Google Scholar]
- Ferrara, F.; Gennarelli, C.; Guerriero, R.; Riccio, G.; Savarese, C. An efficient near-field to far-field transformation using the planar wide-mesh scanning. J. Electromagn. Waves Appl. 2007, 21, 341–357. [Google Scholar] [CrossRef]
- D’Agostino, F.; De Colibus, I.; Ferrara, F.; Gennarelli, C.; Guerriero, R.; Migliozzi, M. Far-field pattern reconstruction from near-field data collected via a nonconventional plane-rectangular scanning: experimental testing. Int. J. Antennas Propag. 2014, 2014, 1–9. [Google Scholar] [CrossRef]
- Bucci, O.M.; Gennarelli, C.; Riccio, G.; Savarese, C. Near-field–far-field transformation from nonredundant plane-polar data: effective modellings of the source. IEE Proc. Microw. Antennas Propag. 1998, 145, 33–38. [Google Scholar] [CrossRef]
- Bucci, O.M.; D’Elia, G.; Migliore, M.D. Advanced field interpolation from plane-polar samples: experi mental verification. IEEE Trans. Antennas Propag. 1998, 46, 204–210. [Google Scholar] [CrossRef]
- D’Agostino, F.; Ferrara, F.; Gennarelli, C.; Guerriero, R.; Migliozzi, M. Far-field pattern reconstruction from a nonredundant plane-polar near-field sampling arrangement. IEEE Antennas Wirel. Propag. Lett. 2016, 15, 1345–1348. [Google Scholar] [CrossRef]
- D’Agostino, F.; Ferrara, F.; Gennarelli, C.; Guerriero, R.; Migliozzi, M. Reconstruction of the antenna far-field pattern through a fast plane-polar scanning. Appl. Comp. Electromagn. Society J. 2016, 31, 1362–1369. [Google Scholar]
- D’Agostino, F.; Ferrara, F.; Gennarelli, C.; Guerriero, R.; Migliozzi, M. Fast and accurate far-field prediction by using a reduced number of bipolar measurements. IEEE Antennas Wirel. Propag. Lett. 2017, 16, 2939–2942. [Google Scholar] [CrossRef]
- D’Agostino, F.; Ferrara, F.; Gennarelli, C.; Guerriero, R.; Migliozzi, M. Laboratory tests on a near-field to far-field transformation technique from non-redundant bi-polar data. IET Microw. Antennas Propag. 2018, 12, 712–717. [Google Scholar] [CrossRef]
- Paris, D.T.; Leach, W.M., Jr.; Joy, E.B. Basic theory of probe-compensated near-field measurements. IEEE Trans. Antennas Propag. 1978, AP-26, 373–379. [Google Scholar] [CrossRef]
- Joy, E.B.; Leach, W.M.; Rodrigue, G.P.; Paris, D.T. Applications of probe-compensated near-field measurements. IEEE Trans. Antennas Propag. 1978, AP-26, 379–389. [Google Scholar] [CrossRef]
- Yaccarino, R.G.; Williams, LI.; Rahmat-Samii, Y. Linear spiral sampling for the bipolar planar antenna measurement technique. IEEE Trans. Antennas Propag. 1996, 44, 1049–1051. [Google Scholar] [CrossRef]
- Bucci, O.M.; D’Agostino, F.; Gennarelli, C.; Riccio, G.; Savarese, C. Probe compensated far-field reconstruc tion by near-field planar spiral scanning. IEE Proc. Microw. Antennas Propag. 2002, 149, 119–123. [Google Scholar] [CrossRef]
- D’Agostino, F.; Ferrara, F.; Gennarelli, C.; Guerriero, R.; Migliozzi, M. A planar NF–FF tranformation for quasi-spherical antennas using the innovative spiral scanning. Appl. Comp. Electromagn. Society J. 2018, 33, 115–118. [Google Scholar]
- D’Agostino, F.; Ferrara, F.; Gennarelli, C.; Guerriero, R.; Migliozzi, M. An effective NF-FF transformation technique with planar spiral scanning tailored for quasi-planar antennas. IEEE Trans. Antennas Propag. 2008, 56, 2981–2987. [Google Scholar] [CrossRef]
- D’Agostino, F.; Ferrara, F.; Gennarelli, C.; Guerriero, R.; McBride, S.; Migliozzi, M. Fast and accurate antenna pattern evaluation from near-field data acquired via planar spiral scanning. IEEE Trans. Antennas Propag. 2016, 64, 3450–3458. [Google Scholar] [CrossRef]
- D’Agostino, F.; Gennarelli, C.; Riccio, G.; Savarese, C. Theoretical foundations of near-field–far-field transformations with spiral scannings. Prog. Electromagn. Res. 2006, 61, 193–214. [Google Scholar] [CrossRef]
- D’Agostino, F.; Ferrara, F.; Gennarelli, C.; Guerriero, R.; Migliozzi, M. The unified theory of near–field–far–field transformations with spiral scannings for nonspherical antennas. Prog. Electromagn. Res. B. 2009, 14, 449–477. [Google Scholar] [CrossRef]
- Cicchetti, R.; D’Agostino, F.; Ferrara, F.; Gennarelli, C.; Guerriero, R.; Migliozzi, M. Near-field to far-field transformation techniques with spiral scannings: a comprehensive review. Int. J. Antennas Propag. 2014, 2014, 1–13. [Google Scholar] [CrossRef]
- Yaghjian, A.D. Approximate formulas for the far field and gain of open-ended rectangular waveguide. IEEE Trans. Antennas Prop. 1984, AP-32, 378–384. [Google Scholar] [CrossRef]
- Rahmat-Samii, Y.; Galindo-Israel, V.; Mittra, R. A plane-polar approach for far-field construction from near-field measurements. IEEE Trans. Antennas Propag. 1980, AP-28, 216–230. [Google Scholar] [CrossRef]
- Gatti, M.S.; Rahmat-Samii, Y. FFT applications to plane-polar near-field antenna measurements. IEEE Trans. Antennas Propag. 1988, 36, 781–791. [Google Scholar] [CrossRef]
- Bevilacqua, F.; D’Agostino, F.; Ferrara, F.; Gennarelli, C.; Guerriero, R.; Migliozzi, M.; Riccio, G. Experimental testing of an effective near to far-field transformation for flat antennas using non-redundant spiral data. In Proceedings of the European Conference on Antennas & Propagation, EUCAP 2022, Madrid, Spain, 2022; pp. 1–5. [Google Scholar]

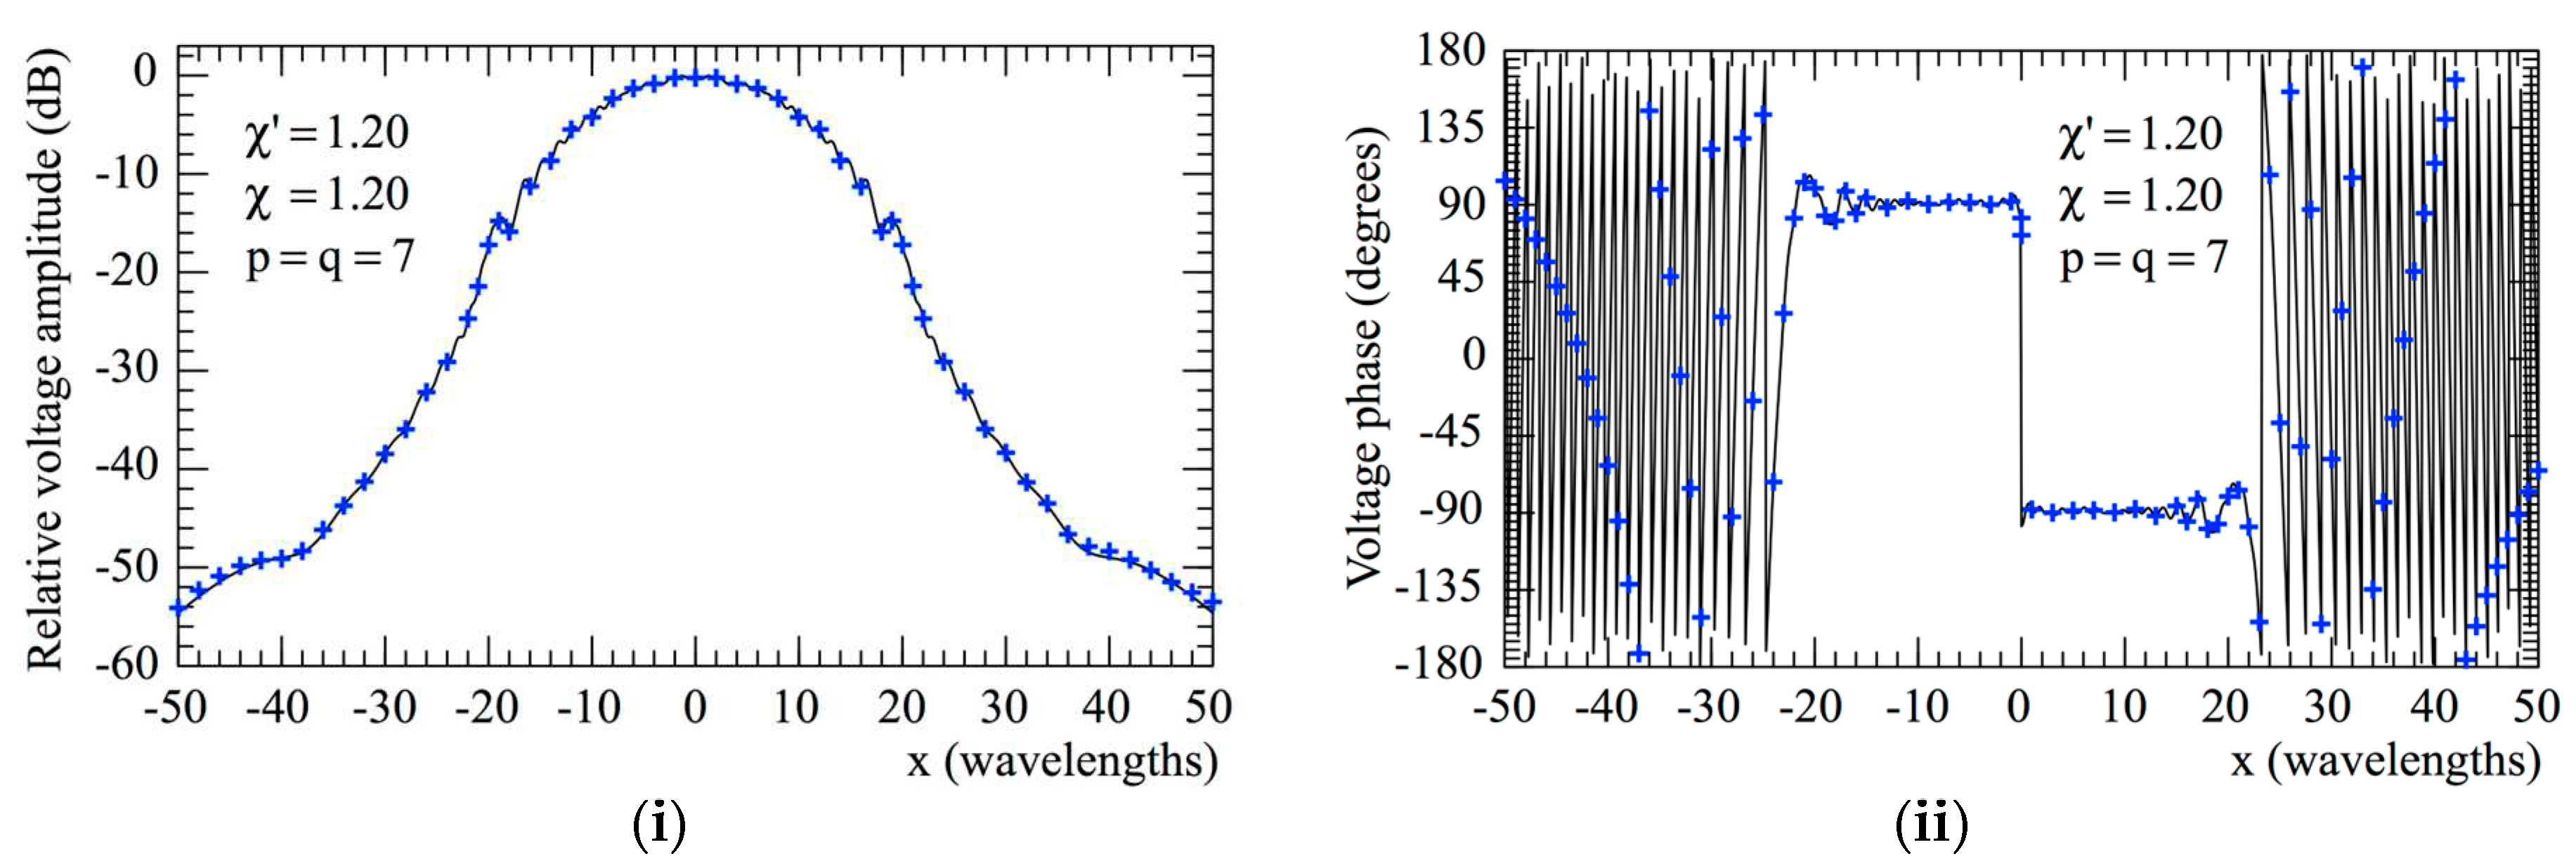
 reference.
  evaluated from the planar spiral NF measurements: (i) Amplitude; (ii) Phase.
 reference.
  evaluated from the planar spiral NF measurements: (i) Amplitude; (ii) Phase.
 reference.
  evaluated from the planar spiral NF measurements: (i) Amplitude; (ii) Phase.
 reference.
  evaluated from the planar spiral NF measurements: (i) Amplitude; (ii) Phase.
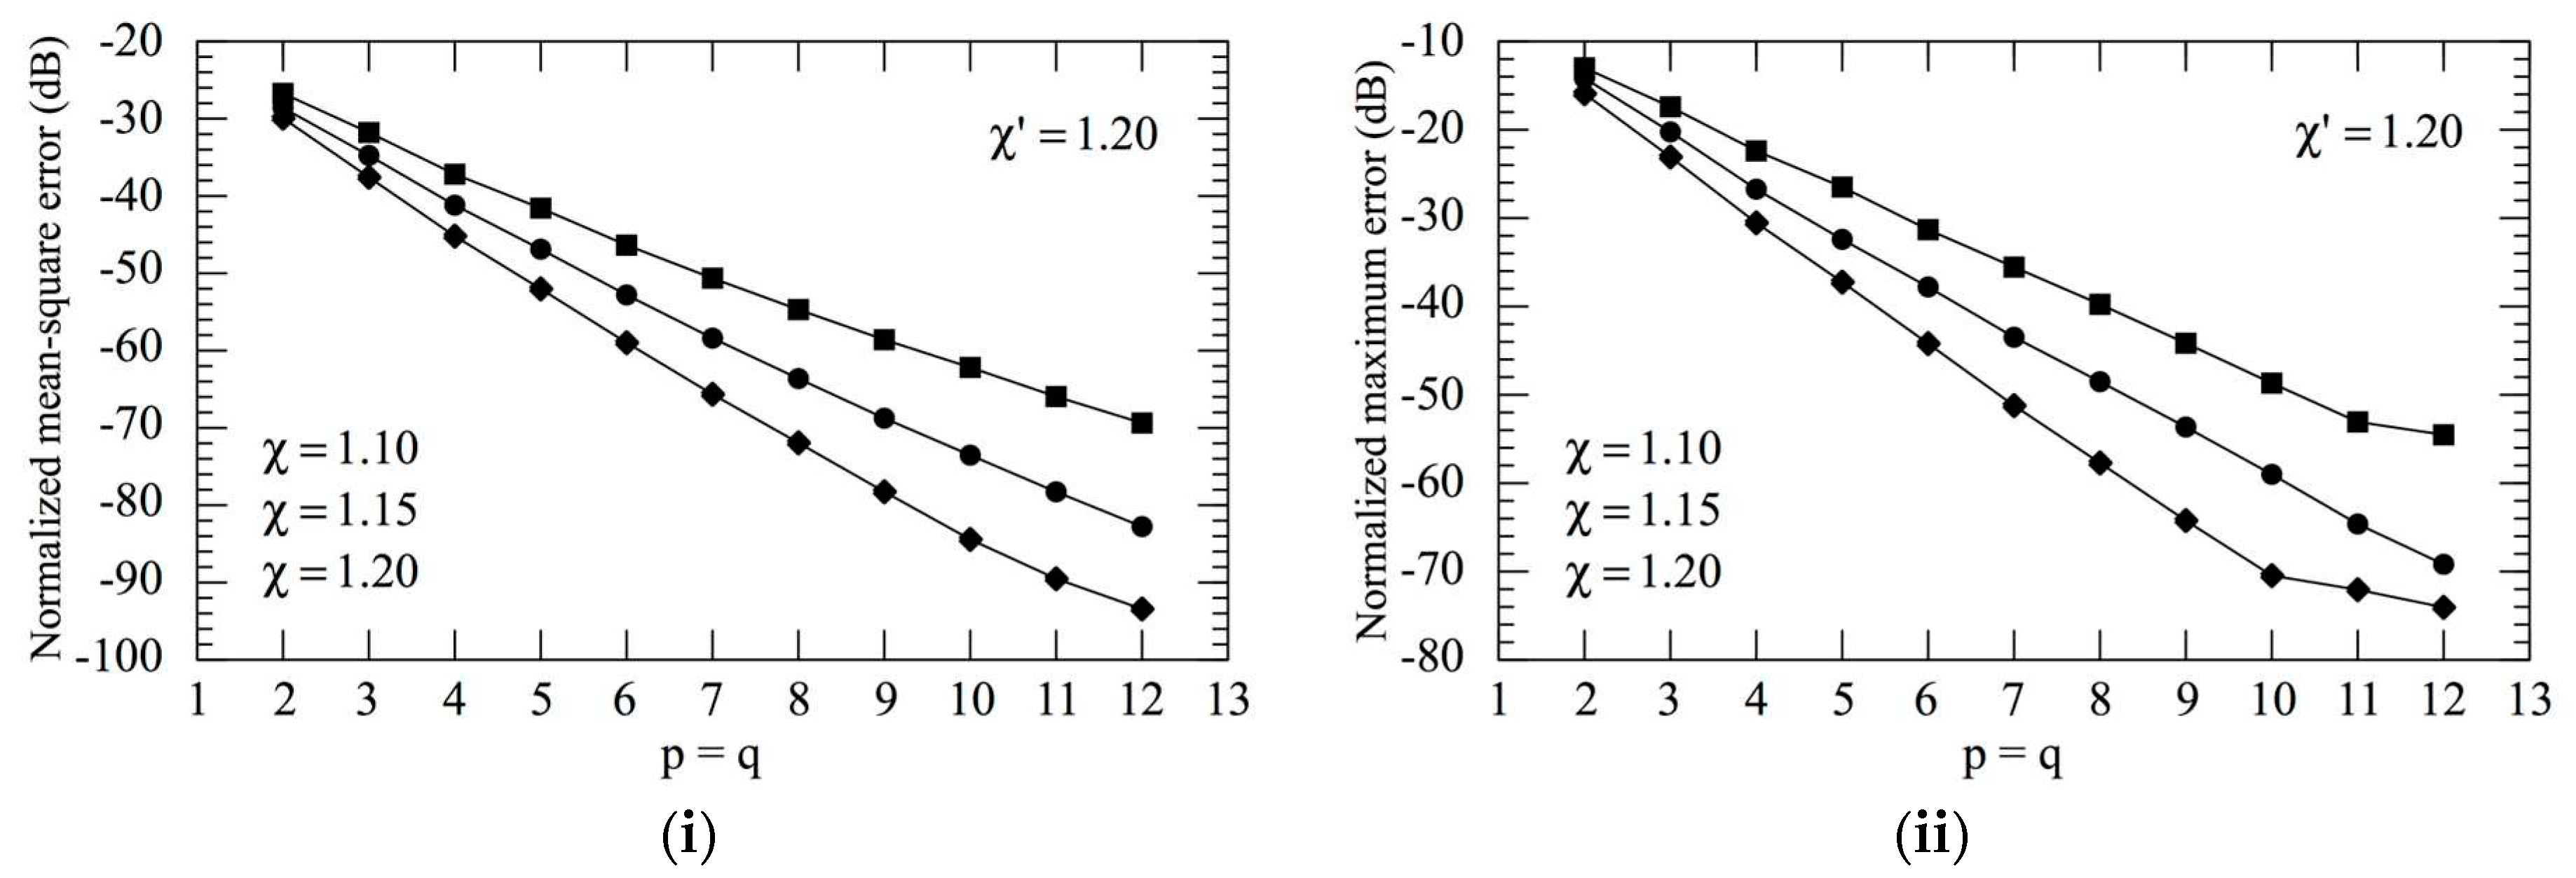
 exact.
  reconstructed from the non-redundant samples: (i) E-Plane; (ii) H-plane.
 exact.
  reconstructed from the non-redundant samples: (i) E-Plane; (ii) H-plane.
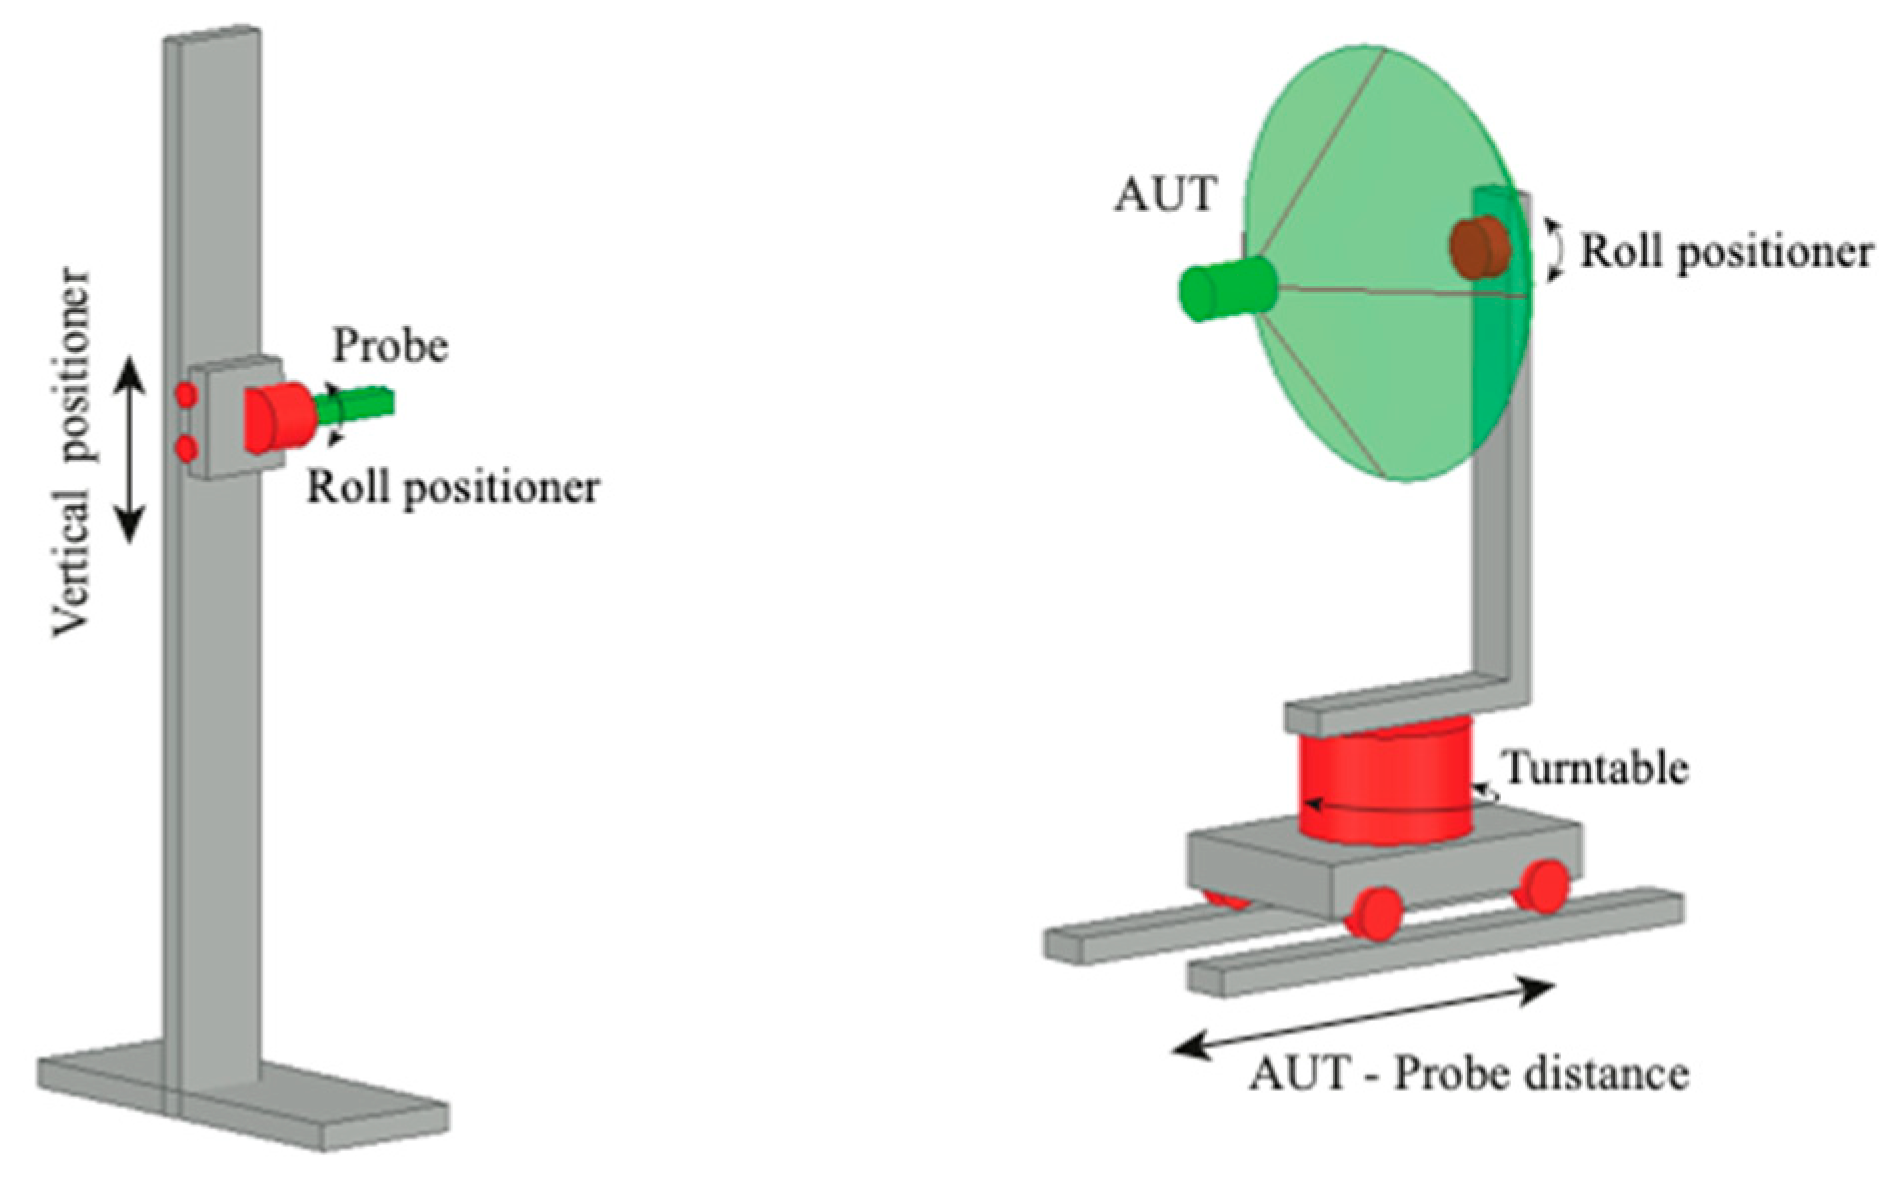
 reference.
  got from the planar spiral NF measurements: (i) Amplitude; (ii) Phase.
 reference.
  got from the planar spiral NF measurements: (i) Amplitude; (ii) Phase.
 reference.
  got from the planar spiral NF measurements: (i) Amplitude; (ii) Phase.
 reference.
  got from the planar spiral NF measurements: (i) Amplitude; (ii) Phase.
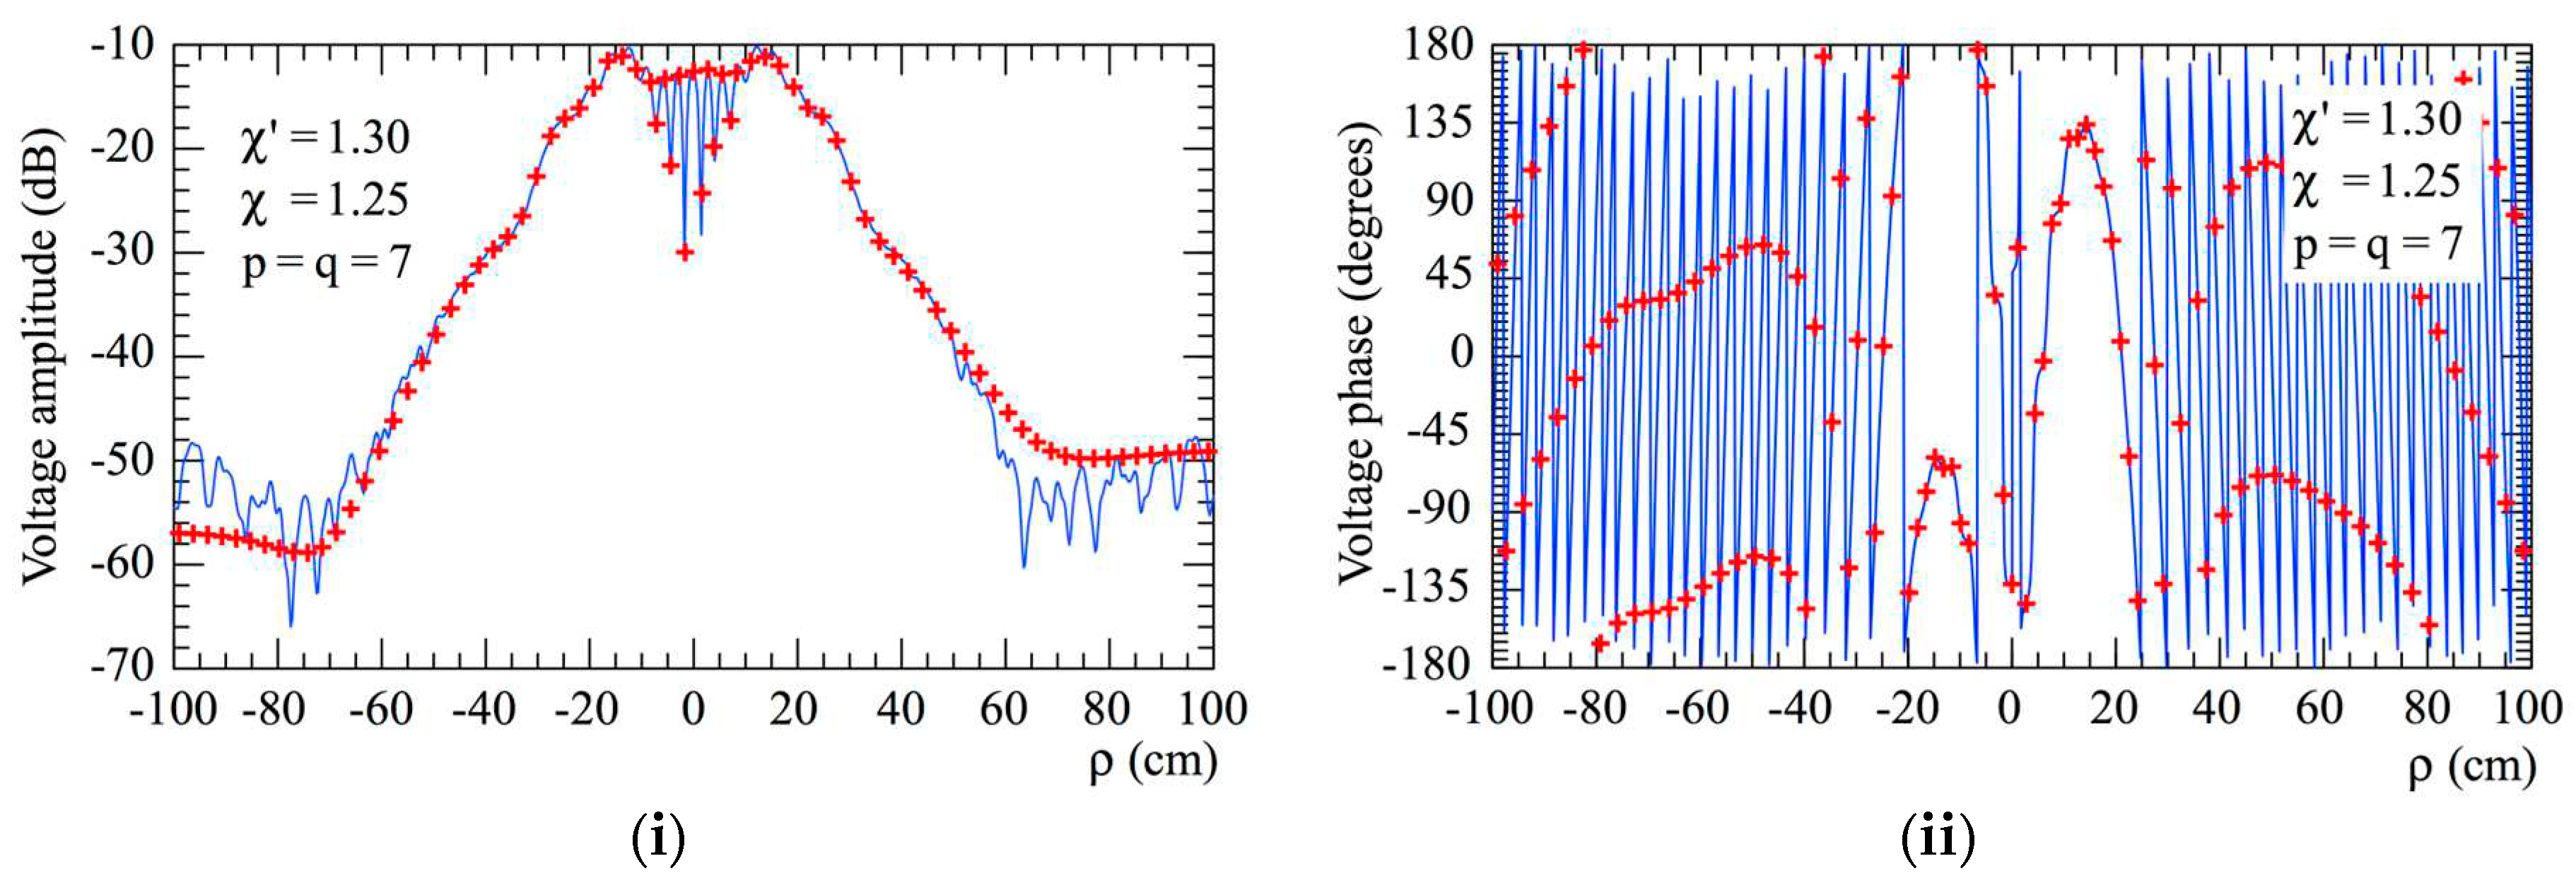
 reference.
  got from the pla nar spiral NF samples: (i) Voltage Vϕ; (ii) Voltage Vϕ.
 reference.
  got from the pla nar spiral NF samples: (i) Voltage Vϕ; (ii) Voltage Vϕ.
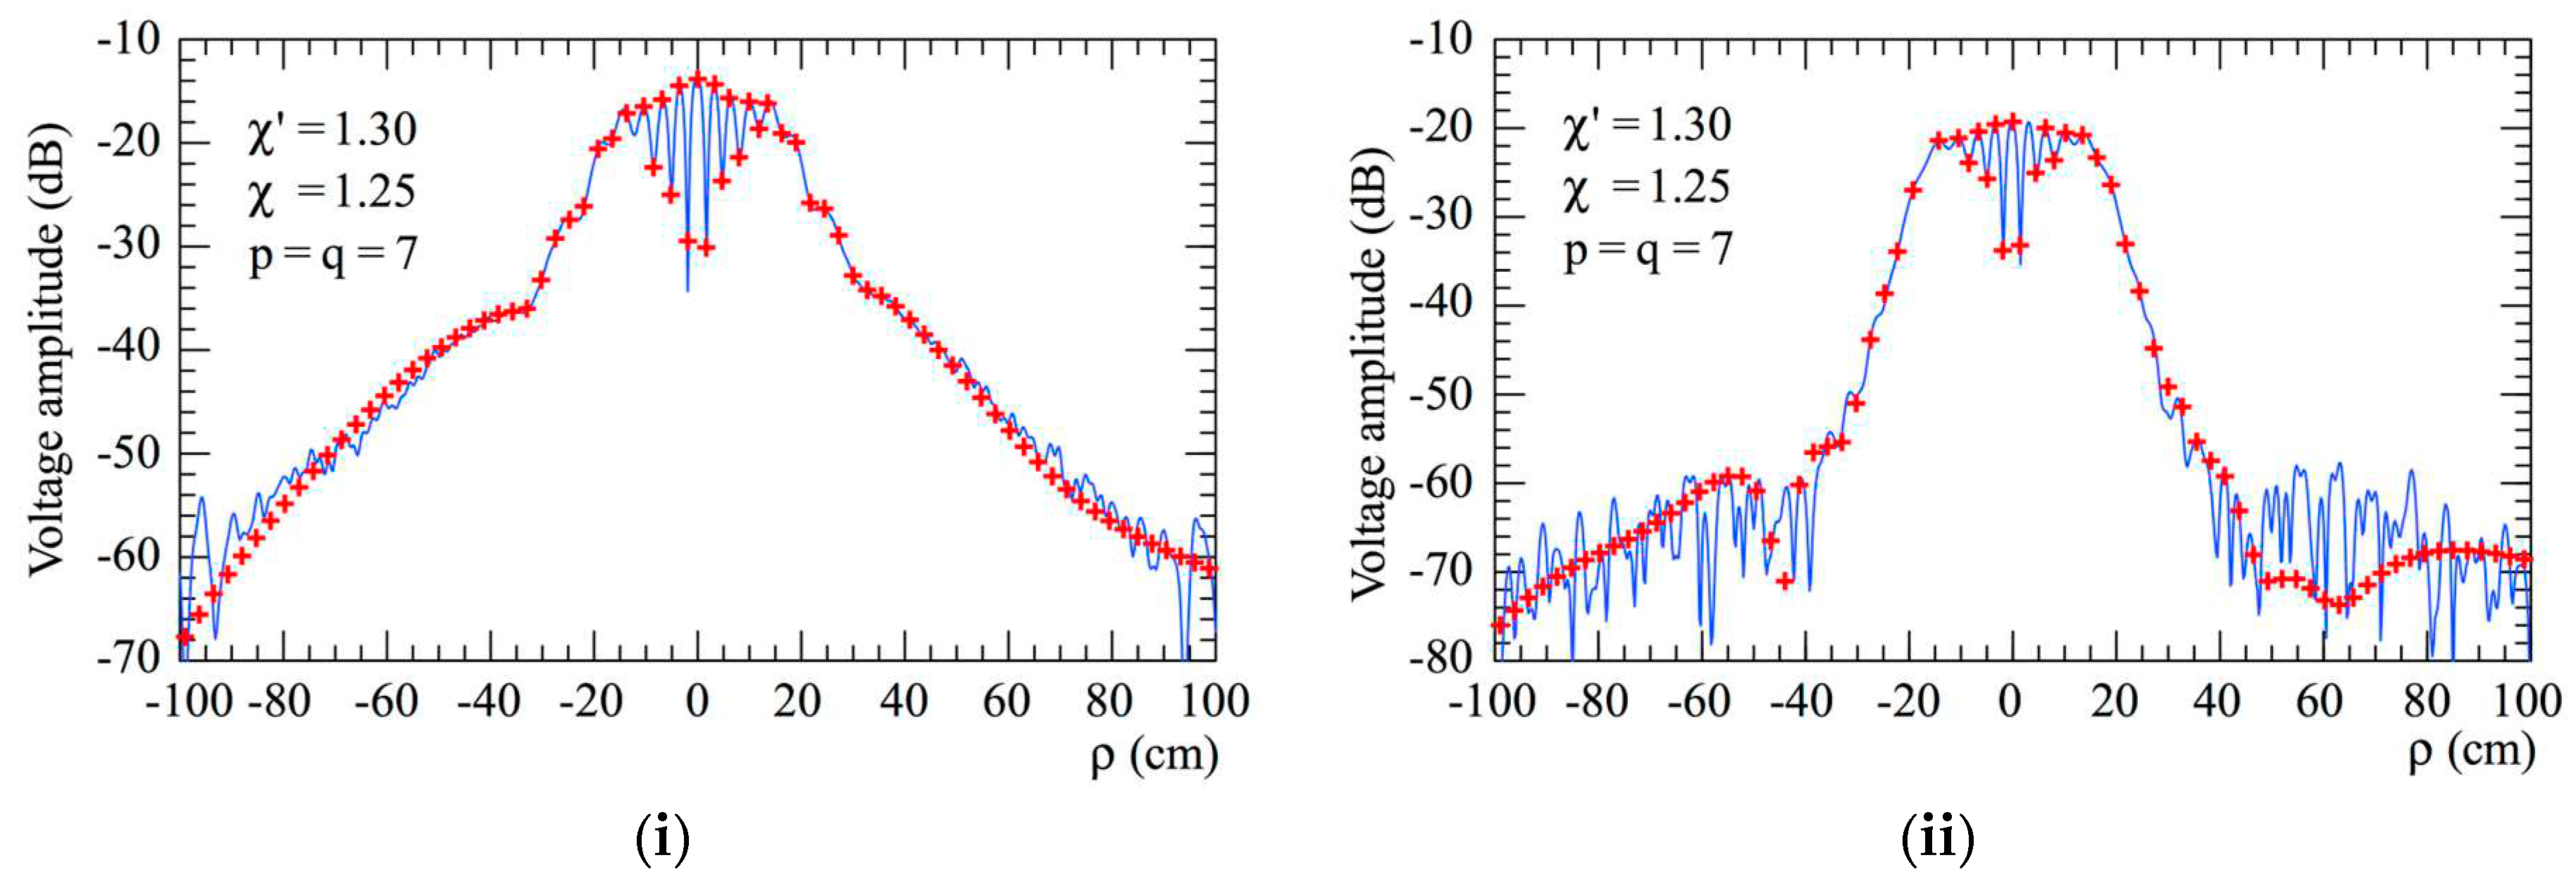
 reference.
  got from the non-redundant samples. Software co-rotation: (i) E-Plane; (ii) H-plane.
 reference.
  got from the non-redundant samples. Software co-rotation: (i) E-Plane; (ii) H-plane.
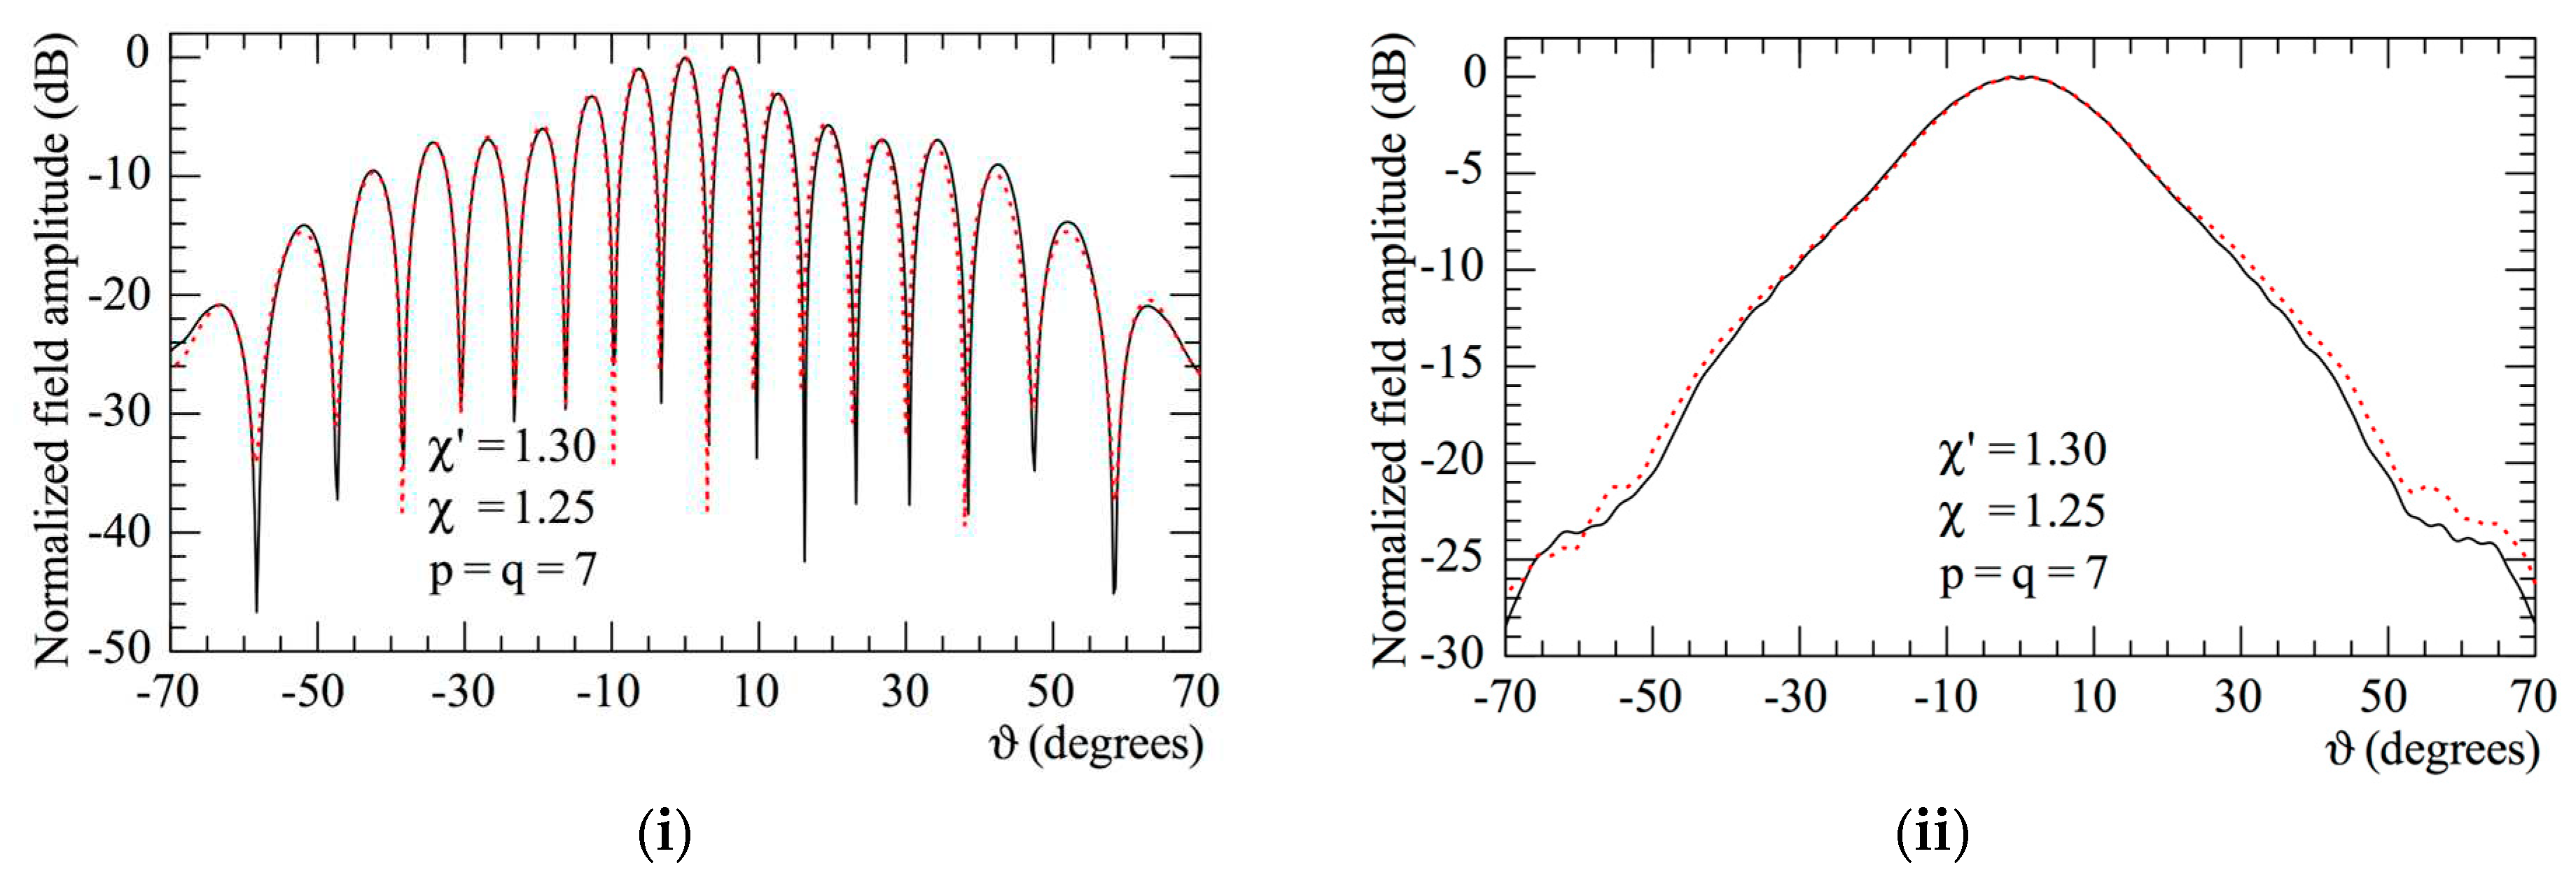
 reference. Hardware co-rotation
  reconstructed from the non-redundant measurements: (i) E-Plane; (ii) H-plane.
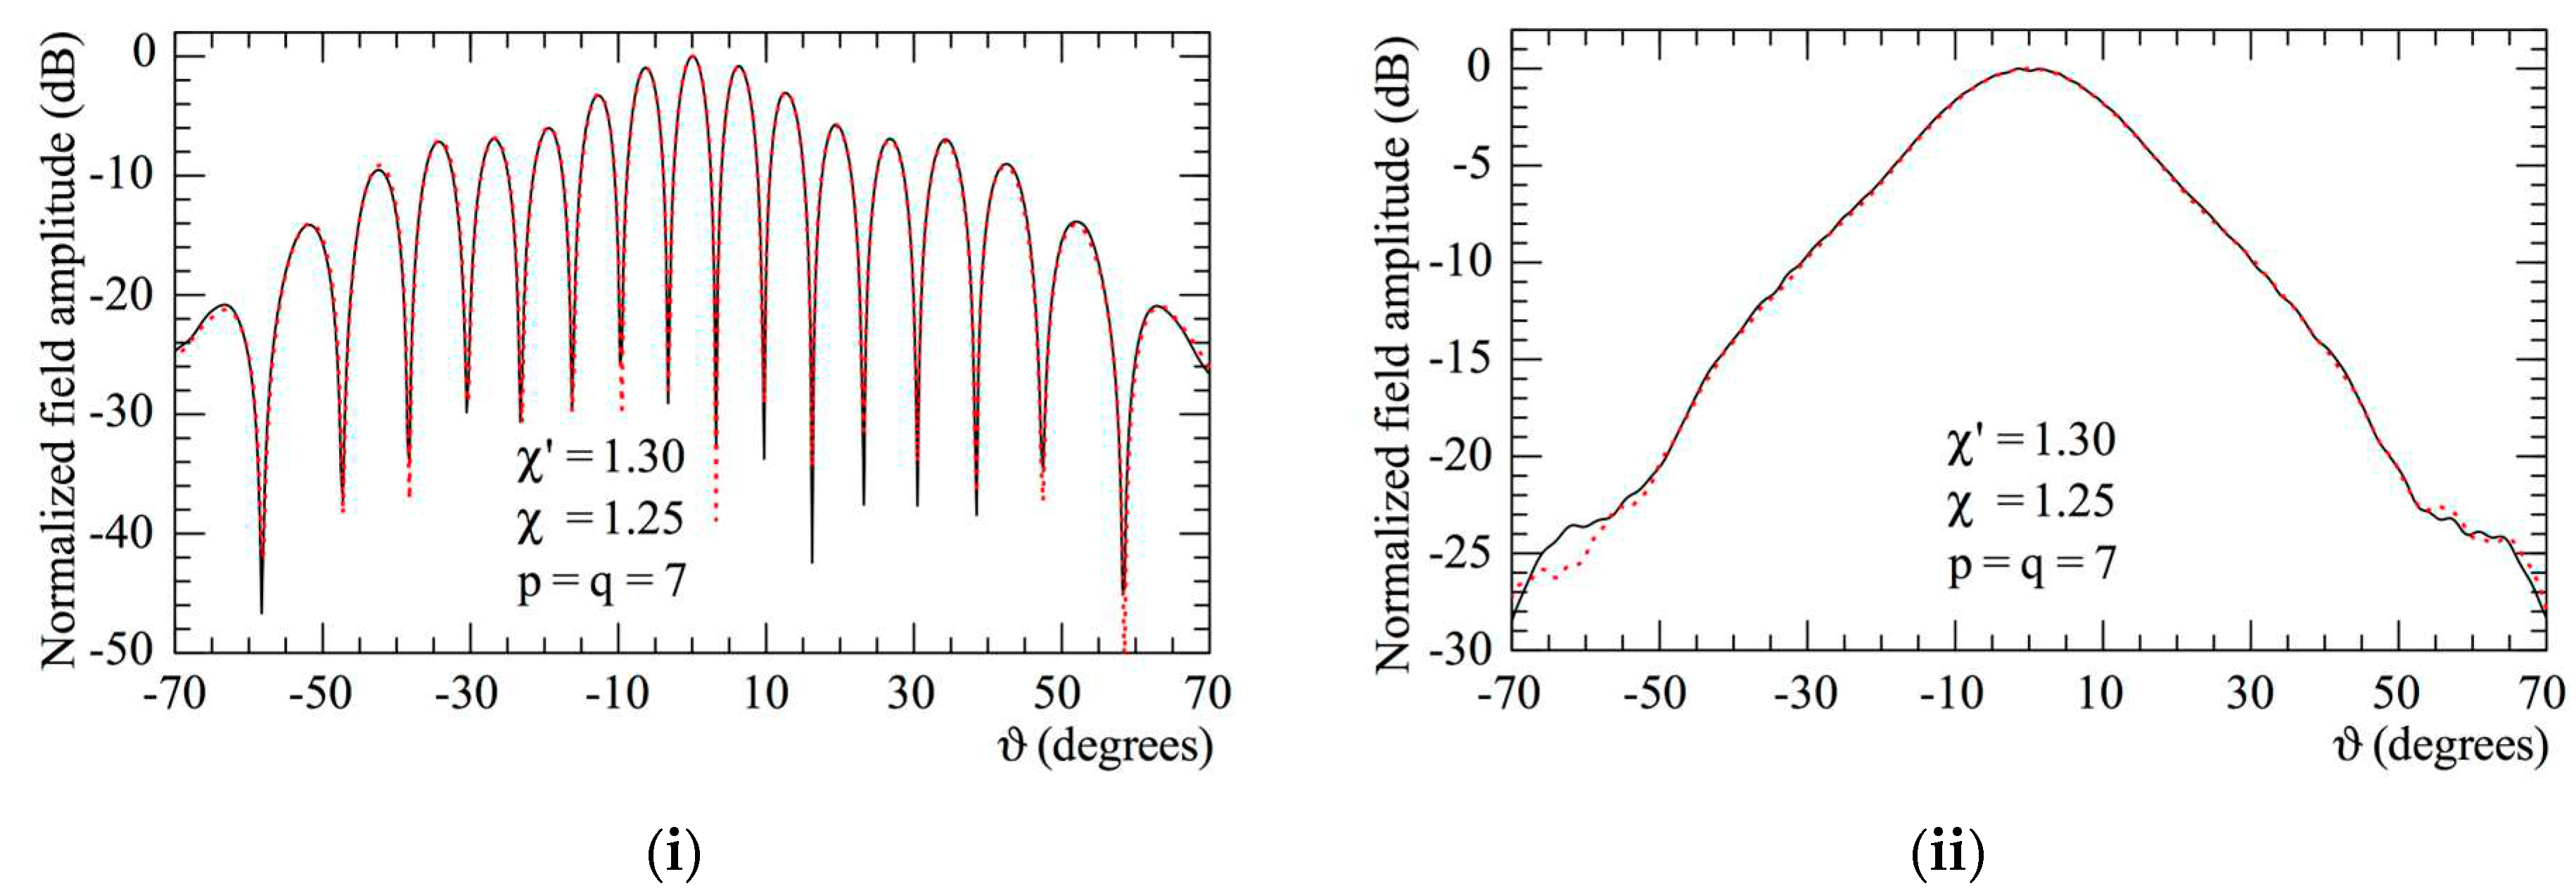
 reference. Hardware co-rotation
  reconstructed from the non-redundant measurements: (i) E-Plane; (ii) H-plane.
Disclaimer/Publisher’s Note: The statements, opinions and data contained in all publications are solely those of the individual author(s) and contributor(s) and not of MDPI and/or the editor(s). MDPI and/or the editor(s) disclaim responsibility for any injury to people or property resulting from any ideas, methods, instructions or products referred to in the content. |
© 2023 by the authors. Licensee MDPI, Basel, Switzerland. This article is an open access article distributed under the terms and conditions of the Creative Commons Attribution (CC BY) license (http://creativecommons.org/licenses/by/4.0/).


