Preprint
Article

Abscisic Acid and Its Receptors LANCL1 and LANCL2 Control Cardiomyocyte Mitochondrial Function, Expression of Contractile, Cytoskeletal and Ion Channel Proteins and Cell Proliferation via ERRα

Altmetrics

Downloads

147

Views

43

Comments

0

A peer-reviewed article of this preprint also exists.

Submitted:

01 August 2023

Posted:

03 August 2023

You are already at the latest version

Alerts
Abstract
The cross-kingdom stress hormone abscisic acid (ABA) and its mammalian receptors LANCL1 and LANCL2 regulate cardiomyocyte response to hypoxia by activating NO generation. Over-expression of LANCL1/2 increases transcription, phosphorylation and activity of eNOS and im-proves cell vitality after hypoxia/reoxygenation via the AMPK/PGC-1α axis. The aim of this study was to investigate whether the ABA/LANCL system also affects mitochondrial oxidative metab-olism and structural proteins. The effect of ABA and of the silencing or overexpression of LANCL1 and LANCL2 were investigated in H9c2 rat cardiomyoblasts on mitochondrial function, cell cycle and expression of cytoskeletal, contractile and ion channel proteins. Overexpression or silencing of LANCL1/2 significantly increased, or conversely decreased, mitochondrial number, oxphos complex I, proton gradient, glucose and palmitate-dependent respiration, transcription of uncoupling proteins, expression of proteins involved in cytoskeletal, contractile and electrical functions. These effects, and LANCL1/2-dependent NO generation, are mediated by the tran-scription factor ERRα, upstream of the AMPK/PGC1-α axis and transcriptionally controlled by the LANCL1/2-ABA system. The ABA-LANCL1/2 hormone-receptors system controls fundamental aspects of cardiomyocyte physiology via an ERRα/AMPK/PGC-1α signaling axis and ABA-mediated targeting of this axis could improve cardiac function and resilience to hypoxic and dysmetabolic conditions.
Keywords: 
Subject: Biology and Life Sciences  -   Biochemistry and Molecular Biology

1. Introduction

Abscisic acid is a terpenoid plant hormone also present and active in mammals, with a cross-kingdom conserved role as stress hormone, regulating cell responses to stimuli as diverse as root water availability and blood glucose levels [1]. The origin of ABA dates back to unicellular algae and bacteria and its conservation in modern, far more complex organisms testifies to its important role in cell and species conservation, allowing adaptation to changing environmental conditions.
ABA and its mammalian receptors LANCL1 and LANCL2 have been recently shown to play a hitherto unrecognized role in the response of cardiomyocytes to hypoxia. The heart is a very well-perfused organ and the necessity to endure severe hypoxia does not occur under physiological conditions, as is instead the case with skeletal muscle, where extreme physical exertion can shift metabolism from the aerobic to the anaerobic condition. Indeed, type II skeletal myocytes are especially adapted to fast and brief bursts of contractile activity that are largely oxygen-, and mitochondria-, independent, while type I skeletal myocytes rely chiefly on oxidative metabolism for energy production during prolonged physical exercise. The cardiac muscle is not as well adaptable to hypoxia as the skeletal muscle; cardiomyocytes have an obligate aerobic metabolism and are thus exposed to the damaging effects of sudden oxygen deprivation.
One of the fundamental players in heart protection from hypoxia-derived damage is the gaseous hormone nitric oxide (NO), also an evolutionarily ancient signal molecule. Indeed, NO protects cardiomyocyte function not just after hypoxia/reoxygenation (a time-limited pathological event), but constitutively, under physiological conditions, improving electrical transmission, contractility, energy metabolism and myocyte growth [2]. Indeed, NO deficiency is associated with heart diseases [3] and NO replacement therapy can improve cardiac performance [4]. In the rat cardiomyocyte cell line H9c2 hypoxia induces production of endogenous ABA and the ABA-LANCL1/2 hormone-receptors system activates a signaling pathway involving AMPK and PGC-1α, which leads to a concerted series of transcriptional and post-transcriptional events leading to an increased NO generation: expression and phosphorylation of eNOS, transcription of the enzyme GTPCH, which synthesizes the coenzyme tetrahydrobiopterin (TBH4), necessary for NO generation, and of the arginine transporter CAT-2A, required for arginine entry into the cells [5]. Interestingly, in LANCL1/2-overexpressing H9c2 the mitochondrial proton gradient (ΔΨ) after hypoxia is conserved to a significantly higher degree compared with LANCL1/2-silenced cells and further improves after reoxygenation. Moreover, exogenous ABA increases the mitochondrial ΔΨ after reoxygenation in LANCL1/2-overexpressing cells and this effect is reduced in the double-silenced cells. These results suggest a role for the ABA-LANCL1/2 system in the maintenance of mitochondrial ΔΨ and consequently in the generation of metabolic energy in cardiomyocytes.
Mitochondrial function is of the utmost importance not only for cardiomyocyte survival to hypoxia, a condition that they do not normally experience, but for the contractile and electrical functions of cardiomyocytes under normoxic conditions. We hypothesized that the ABA/LANCL1-2 system, by increasing mitochondrial ΔΨ under normoxia, as well as after hypoxia/reoxygenation, could increase energy production in cardiomyocytes, improving the structural and metabolic features of the cells, put in a word improve cardiomyocyte “fitness”. In cardiac myocytes mitochondrial function and biogenesis are controlled by the PGC-1α/ERRα team of transcription factors [6,7,8]. In skeletal myocytes, the ABA-LANCL1/2 system controls mitochondrial function, increasing mitochondrial DNA content and respiration via a signaling pathway involving AMPK and PGC-1α [9] and PGC-1α together with ERRα have been shown to control transcription of several genes critical for mitochondrial energy-production in cardiac and skeletal muscle in vivo [7]; moreover, both PGC-1α and ERRα are transcriptionally upregulated in LANCL1/2-overexpressing human brown and beige adipocytes [10]. Starting from these observations, a role for ERRα in the mitochondrial effects of the ABA/LANCL1-2 system in cardiomyocytes can be hypothesized.
The aims of this study were two-fold: i) to compare mitochondrial number, glucose- and palmitate-dependent respiration, oxphos uncoupling, expression of cytoskeletal, contractile and ion channel proteins, cell morphology and doubling time in rat H9c2 cardiomyocytes overexpressing, or silenced for, LANCL1 and LANCL2, cultured in the presence or in the absence of nanomolar ABA; ii) to investigate whether ERRα is involved in the signaling pathway activated by the ABA/LANCL system in cardiomyocytes.

2. Materials and Methods

Cell culture
Rat embryonic cardiomyocyte H9c2 cell line was purchased from ATCC (LGC Standards s.r.l. Milan, Italy) and was cultured in DMEM high glucose (Sigma-Aldrich, Milan, Italy) supplemented with 10% fetal bovine serum (Sigma-Aldrich, Milan, Italy), penicillin (62.5 μg/ml) and streptomycin (100 μg/ml) (Sigma-Aldrich, Milan, Italy). Cells were kept at 37°C in a humidified atmosphere with 5% CO2.
Lentiviral cell transduction
The lentiviral plasmids pLV[shRNA]-Puro-U6 encoding for a control scramble shRNA (SCR), for the shRNA targeting rat LANCL1 (SHL1), for the shRNA targeting rat LANCL2 (SHL2) and for the shRNA targeting rat ERRα (SHERRα) (plasmid ID: VB010000-0005mme, VB181016-1107sen, VB181016-1124zjp, VB221005-1073jxq), were purchased from Vector Builder (Chicago, IL, USA). Overexpression of hLANCL1 (OVL1) and hLANCL2 (OVL2) was obtained in rat H9c2 cardiomyocytes using pBABE vectors constructed as described in [9], with the empty vector pBABE (Addgene) as negative control (PLV). Lentiviral transductions were performed as described in [9].
qPCR analysis
H9c2 cells were incubated with or without 100 nM ABA or 100 μM L-NAME for 4 hours after being serum-starved for 18 hours. Total RNA was extracted from cardiomyocytes using RNeasy Micro Kit (Qiagen, Milan, Italy), according to the manufacturer’s instructions. cDNA was obtained from 1 μg of total RNA by using iScript cDNA Synthesis Kit (Bio-Rad, Milan, Italy) and qPCR reactions were performed in an iQ5 Real-Time PCR detection system (Bio-Rad, Milan, Italy) as described in [10]. Specific primers were designed using Beacon Designer 2.0 software (Bio-Rad, Milan, Italy), and their sequences are listed in Table S1. Values were normalized on hypoxanthine-guanine phosphoribosyltransferase-1 (Hprt1) mRNA expression. Statistical analysis of the qPCR was performed using the iQ5 Optical System Software version 1.0 (Bio-Rad Laboratories, Milan, Italy) by 2-△△Ct method [9]. The dissociation curve for each cycle of amplification was analyzed to confirm the absence of nonspecific PCR products.
Western blot
H9c2 rat cardiomyocytes (1 x 10⁶/well) were seeded in 6-well plates in DMEM with 10% FBS and 1% penicillin/streptomycin. After serum deprivation for 18 hours, cells were washed once in Krebs-Ringer HEPES buffer (KRH) and then incubated in KRH with 5 mM glucose for 60 min at 37° C with or without 100 nM ABA. The supernatant was removed and cells were scraped in 200 μL of 20 mM Tris-HCl pH 7.4, 150 mM NaCl, 1 mM EDTA and 1% NP40 containing a protease inhibitor cocktail. After brief sonication, the protein concentration was determined on an aliquot of each lysate. 25 μg of lysates were loaded on 10% polyacrylamide gel and separated by SDS-PAGE and proteins were transferred to nitrocellulose membranes (Bio-Rad, Milan, Italy), according to standard procedures. Membranes were blocked for 1 hour with TBST containing 5% non-fat dry milk and incubated for 1 hour at room temperature with primary antibodies (Table S2). Following incubation with the appropriate secondary antibodies (Table S2) and ECL detection (GE Healthcare, Milan, Italy), band intensity was quantified with the ChemiDoc imaging system (Bio-Rad, Milan, Italy).
Glucose transport assays
Rat H9c2 cells infected with the empty vector (PLV), overexpressing hLANCL1 and hLANCL2 (OVL1+2), infected with a scramble shRNA (SCR) or silenced for the expression of both rLANCL1 and rLANCL2 (SHL1+2) were cultured overnight at 1 x 10⁴/well in a 96-well plate in DMEM (5 mM glucose) without serum. Cells were washed once with DMEM and then incubated for 30 min at 37°C in DMEM without (controls) or with 100 nM ABA. At the end of incubation, cells were washed with KRH at 37°C. The fluorescently labeled deoxyglucose analog 2-NBDG (50 μM) was added to each well, and after 10 min, the supernatant was removed, wells were washed once with ice-cold KRH, 50 μL KRH was added to each well, and the mean fluorescence (excitation at 480 nm and emission at 540 nm) from 9 acquisitions/well was calculated. Each experimental condition was assayed in at least 6 wells. Unspecific 2-NBDG uptake was subtracted from each experimental value as reported in [11].
JC-1 analysis
Cardiomyocytes were stained with the cationic dye JC-1 (ThermoFisher Scientific, Waltham, MA), with the same method already described in [5]. Briefly, H9c2 cells were seeded at 3 x 10⁴ onto µ-slide wells, treated or not with 4 µM CsA for 2 hours, stained with JC-1 (2,5 µg/ml) for 20 min at 37°C in a 5% CO2 incubator and then imaged live. The red/green ratio, expression of the mitochondrial proton gradient [12], was analyzed after a background subtraction with the ImageJ software (v1.8.0, National Institutes of Health, Bethesda, MD, USA), using a quantitative analysis based on an intensity measurement of specific selected ROIs.
Mitochondrial and cytoskeletal staining
H9c2 cardiomyocytes overexpressing or silenced for the expression of both LANCL proteins were plated on glass coverslips and then stained with MitoTrackerTM Deep Red FM (ThermoFisher, Waltham, MA). After preparing the solution as previously described in [10], H9c2 cells were stained for 40 min at 37°C in a 5% CO2 incubator and then imaged live. Moreover, the actin cytoskeleton (F-actin) was visualized using Phalloidin Alexa Fluor 488 (diluted 1:20, Cell Signaling Technology, Danvers, MA). Rat H9c2 cardiomyocytes, cultured as mentioned above, were also set in 4% paraformaldehyde and permeabilized with 0.1% Triton X-100 (Sigma-Aldrich, Milan, Italy). Detection of cytoskeleton staining was performed with the following antibodies: mouse anti-α-tubulin (diluted 1:1000 in PBS, Sigma-Aldrich, Milan, Italy), rabbit anti β-catenin (diluted 1:100 in PBS, Cell Signaling Technology, Danvers, MA), mouse anti-MYH7 (diluted 1:50, Santa Cruz Biotechnology Inc., California) and mouse anti-Cx43 (diluted 1:100, Santa Cruz Biotechnology Inc., California). The slides were rinsed in PBS and mounted with a ProLong Gold Antifade Mountant (ThermoFisher Scientific, Waltham, MA). Images were acquired on a Leica TCS SP confocal laser scanning microscope, equipped with 476, 488, 543 and 633 excitation lines with a 60X Plan Apo oil objective. Fluorescence signals were then analyzed, after background subtraction, by ImageJ software (v1.8.0, National Institutes of Health, Bethesda, MD, USA) using a semi-manual method based on the delimitation of the cells. Three fields were chosen at random in two slide preparations for each sample.
Seahorse analysis
Oxygen consumption rate (OCR) and extracellular acidification rate (ECAR) were determined using a Seahorse XFp Extracellular Flux Analyzer (Agilent Technologies, Santa Clara, CA, USA). H9c2 cells were replated in XF plates at a density of 6000 cells/well. After 24 hours, cells were incubated at 37°C for 45 min in no-CO2 incubator with Agilent Seahorse DMEM pH 7.4, enriched with glucose (25 mM), glutamine (2 mM) and pyruvate (1 mM). The bioenergetic profile was measured using the Cell Mito Stress Test Kit (Cat. #103010-100) according to the manufacturer’s instructions. Three measurements of OCR and ECAR were taken initially without additions to the cells (basal respiration and basal ECAR) and then after sequential injections of oligomycin (1.5 µM, ATP synthase inhibitor), carbonyl cyanide-4-(trifluoromethoxy) phenylhydrazone (FCCP, 2.0 µM, proton gradient dissipator) and rotenone (0.5 µM, respiratory Complex I inhibitor) plus antimycin A (0.5 µM, respiratory Complex III inhibitor). OCR and ECAR were normalized to total cell number determined directly in the plate, immediately after each experimental run and reported as pmolO2/min and mpH/min, respectively. To determine the intrinsic rate and capacity of cells to oxidize palmitate in the absence or limitation of other exogenous substrates, XF Palmitate Oxidation Stress Test Kit (Cat. #103693-100) was used according to the manufacturer’s instructions. Briefly, H9c2 cardiomyocytes were incubated at 37°C for 45 min in no-CO2 incubator with Agilent Seahorse DMEM pH 7.4, enriched with 1mM Sodium Palmitate/0.17 mM BSA solution (Palm-BSA), 25 mM glucose, 2 mM glutamine and 1 mM pyruvate. The OCR was monitored upon serial injections of etomoxir (4 μM, an inhibitor of long chain fatty acid oxidation) or DMEM, oligomycin (2 μM), FCCP (1 μM) and a rotenone/antimycin A mixture (1 μM). Whole-cell OCR was normalized to the final cell number as determined by manual cell counting.
Determination of intracellular NAD+ and ATP levels
To determine the content of ATP and NAD+, H9c2 were seeded in 6-well plates in DMEM supplemented with 10% FBS. At confluence, the cells were washed in PBS buffer, harvested and deproteinized with 5% TCA. After centrifugation (700xg for 30 sec), the supernatants were neutralized by removing TCA with diethyl ether and were analyzed by HPLC [13]. NAD+ and ATP values were normalized to protein concentrations [14].
Cell volume measurement
To determine cell volume, H9c2 cardiomyocytes overexpressing or silenced for the expression of both LANCL proteins were treated with a solution of 1.25 μg/mL calcein-AM (Sigma-Aldrich, Milan, Italy) in isotonic PBS for 30 min at 37°C and then imaged live. Z-stack imaging series were acquired using a Leica TCS SP2 confocal microscope and a 60X oil objective with a numerical aperture of 1.4 and a pinhole size of 1 Airy unit. To reduce the time for acquiring and to minimize photobleaching, scanning was performed at the fastest scan speed possible. Imaging emission and detection settings were adjusted to an optimal level, minimizing pixel saturation for each channel. The offset and gain of the system were also utilized to minimize background signal. Once imported as TIFF images in FIJI ImageJ, image stacks were then separated into the independent channels, filtered to emphasize the borders and thresholded automatically using the Otsu method from the automatic threshold dropdown box. A region of interest was then selected around each cell and an open-source plugin integrated in FIJI ImageJ (https://visikol.com/blog/2018/11/29/blog-post-loading-and-measurement-of-volumes-in-3d-confocal-image-stacks-with-imagej) was used to calculate the number of voxels in the ROI in the image stack [15,16]. Briefly, the plugin calculates the area of each individual ROI of each section, then sums the areas and multiplies the sum by the depth of each individual section, then showing the outcome.
DNA extraction and determination of mitochondrial levels by qPCR analysis
Total DNA was extracted from cardiomyocytes (1 x 10⁶ cells on 6-cm plates) with the QIAamp DNA Micro Kit (Qiagen, Milan, Italy) according to the manufacturer’s protocol. The purity and quantity of DNA were evaluated with the NanoDrop 1000 (Thermo Fisher Scientific, Waltham, MA). The mitochondrial/genomic DNA ratio was determined using specific primers listed in Table S1 for mitochondrial ND1 (MT-ND1) and genomic/nuclear Hprt1 by qPCR analysis as described in [10].
Statistical analysis
Results were expressed as mean ± SD. Statistical analysis was performed using the GraphPad Prism 7 Software (GraphPad Software Inc). Comparisons were drawn by an unpaired, two-tailed Student’s t-test, if not otherwise indicated. Statistical significance was set at p<0.05.

3. Results

3.1. Mitochondrial number, proton gradient, proton leak and respiration increase in LANCL1/2-overexpressing, and are conversely reduced in LANCL1/2-silenced, H9c2 cardiomyocytes.

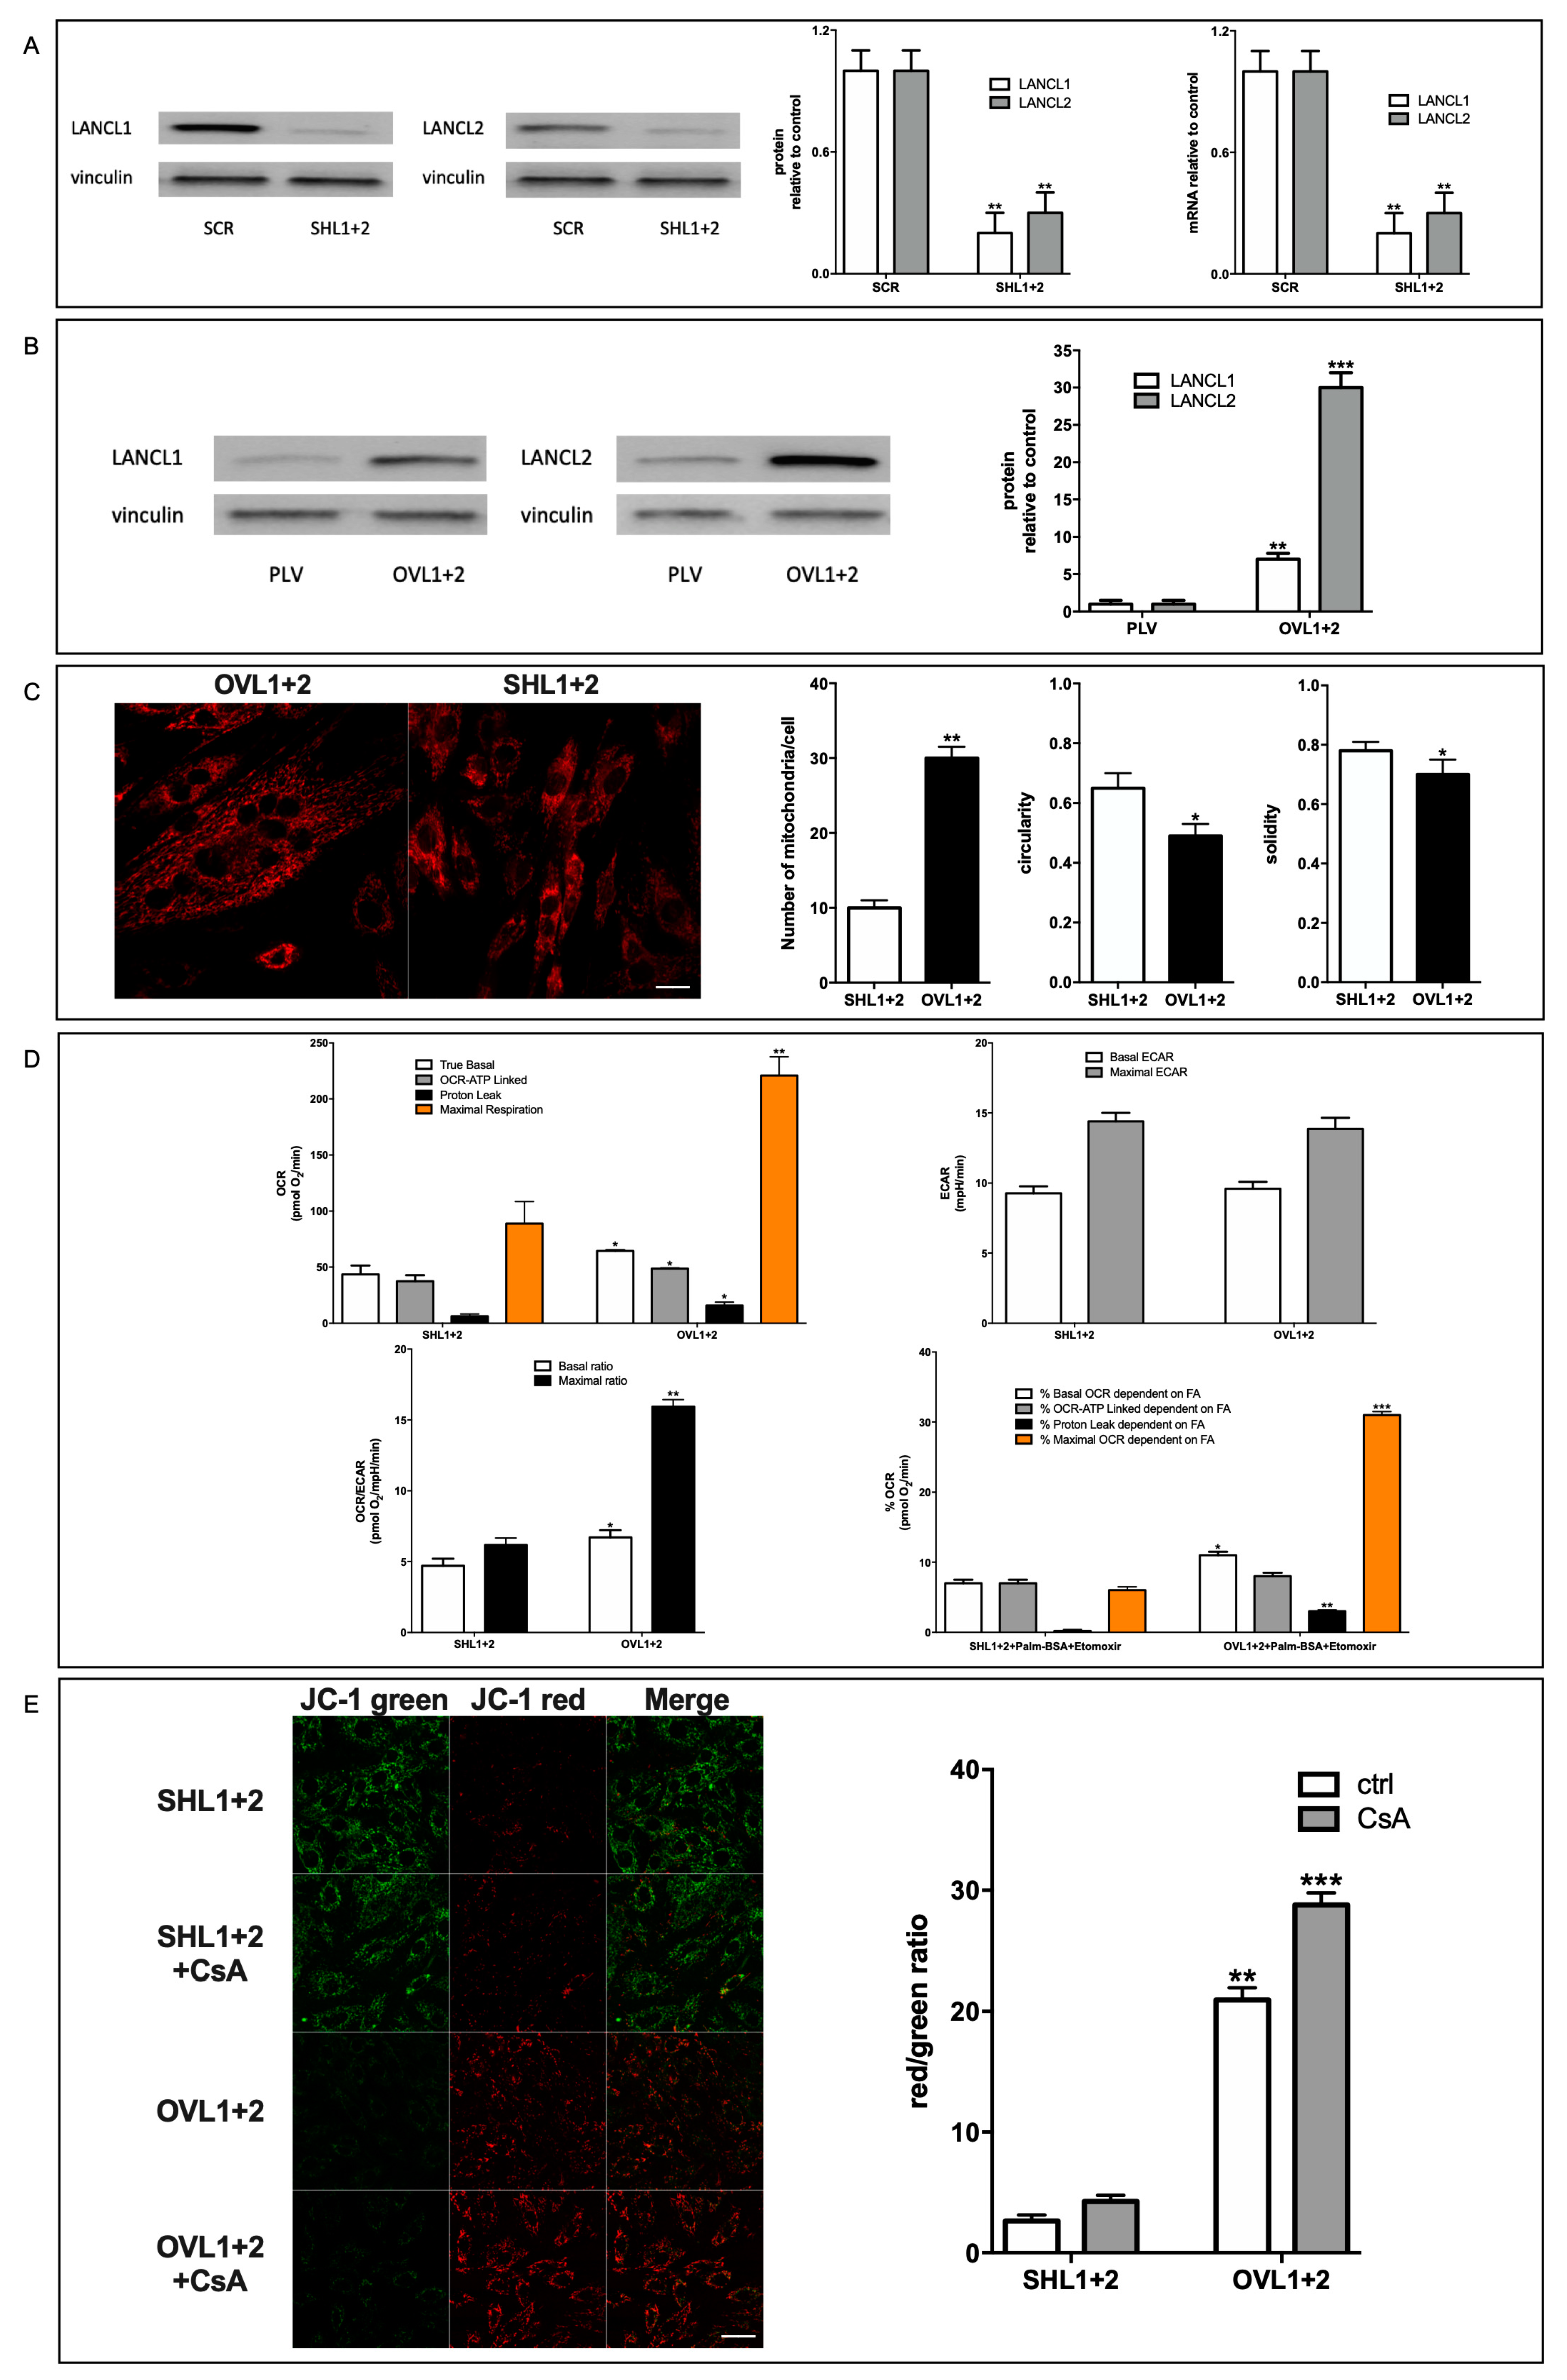
It has been previously reported that the mammalian ABA-LANCL1/2 hormone-receptors system controls fundamental mechanisms in the response of cardiomyocytes to hypoxia/reoxygenation through the activation of the AMPK/PGC-1α axis and of Akt [5]. In order to understand to what extent LANCL proteins affect oxidative metabolism and mitochondrial respiration under physiological, normoxic conditions LANCL1 and LANCL2 were simultaneously silenced or overexpressed in H9c2 cells. The efficiency of shRNA-mediated silencing (SHL1+2) resulted in an approximately 80% reduction of both mRNA and protein levels in cardiomyocytes compared with control cells infected with a scrambled shRNA (SCR) (Figure 1A).
Overexpression of LANCL1 and LANCL2 (OVL1+2) was induced by retroviral infection and was confirmed by Western blot analysis. All experiments were performed on cells expressing approximately 8- and 30-times higher levels of LANCL1 and LANCL2, respectively, than control cells infected with the empty vector (PLV) (Figure 1B). To evaluate whether LANCL1/2-overexpressing cells possessed increased respiratory capacity compared with cells double-silenced for both proteins, mitochondrial proton gradient and respiration were analyzed. No significant difference in any of the parameters explored was observed between cells infected with the empty vector (PLV) used for LANCL1/2-overexpression and cells transfected with the scrambled sequences (SCR) used for LANCL1/2 silencing, indicating that neither vector per se affected mitochondrial number or activity (not shown). In LANCL1/2-overexpressing H9c2 loaded with the mitochondria-specific fluorescent dye MitoTracker total mitochondrial fluorescence showed an approximate 3-fold increase compared with LANCL1/2 double-silenced cells (Figure 1C). In addition, the parameters of circularity and solidity, reflecting mitochondrial morphological but also functional changes, were both significantly decreased in LANCL1/2-overexpressing vs. -silenced cells. Increased cardiac mitochondrial circularity (a value closer to 1.0, as observed in the double-silenced cells, Figure 1C, right panel) has been linked to ischemia/reperfusion and radical-induced stress [17]. Indeed, double-silenced cells showed an approx. 80% increase of mitochondrial ROS compared with over-expressing H9c2, as detected with the mitochondria-targeting, ROS-sensitive probe MitoSox [Spinelli S. et al submitted]. Low solidity (a value closer to 0, as observed in over-expressing cells, Figure 1C, right panel) describes mitochondria which are not uniform in shape and are more subject to branching and subsequent fission [18], possibly indicating a higher tendency to mitochondrial biogenesis in over-expressing cells.
A higher mitochondrial number in LANCL1/2-overexpressing cells also resulted in an increased cell respiration. The oxygen consumption rate (OCR) was measured using the Seahorse XFp Analyzer, with the sequential addition of oligomycin (an inhibitor of the ATP synthase proton channel, which allows to calculate the ATP-linked respiration), FCCP (a proton transporter, which completely dissipates the mitochondrial proton gradient, allowing to calculate the maximal respiration rate) and rotenone/antimycin A (inhibitors of the electron transfer chain, which completely inhibit mitochondrial respiration, allowing to measure baseline, non mitochondrial, oxygen consumption). Basal, ATP-linked and maximal respiration rates all significantly increased in LANCL1/2-overexpressing cells, but not with the same proportion: the basal rate doubled and the maximal tripled in overexpressing vs. silenced cells (Figure 1D, upper left panel). The spare respiratory capacity (SRC), i.e. the ratio between maximal and basal respiration and a measure of mitochondrial capacity to adapt to stress conditions, was consequently 2-fold higher in LANCL1/2-overexpressing vs. double-silenced cells (approx. 4 vs 2). The extracellular acidification rate (ECAR) was instead similar in overexpressing and in double silenced cells (Figure 1D, upper right panel), resulting in a significantly higher OCR-to-ECAR ratio in LANCL1/2-overexpressing vs. double silenced H9c2 (Figure 1D, lower left panel). Finally, the percentage of the OCR dependent on fatty acid oxidation (inhibited by etomoxir) was higher in over-expressing vs. double-silenced cells for both the basal and maximal respiration rates (approx. 2- and 7-times higher, respectively), but it was similar in the two cell types for the ATP-linked respiration (Figure 1D, lower right panel), indicating that the higher fatty acid-dependent OCR in overexpressing cells was not utilized for ATP-generation. Collectively, these results indicate that LANCL1/2-overexpression significantly increases, while their combined silencing reduces mitochondrial number, basal, maximal and fatty acid-dependent respiration rates in cardiomyocytes. Interestingly, the mitochondrial “proton leak” (calculated as the difference between basal and ATP-linked respiration) was also 2-fold higher in LANCL1/2-overexpressing compared with double-silenced cells (Figure 1D).
To directly investigate the magnitude of the ∆Ψ in LANCL1/2-overexpressing or -silenced cardiomyocytes, we used the ∆Ψ-sensitive ratiometric dye JC-1. This fluorescent molecule accumulates within mitochondria and changes its emission from green to red as the ∆Ψ increases [12]. As shown in Figure 1E, left panel, mitochondrial fluorescence was largely red in LANCL1/2-overexpressing cells, while it was predominantly green in cells silenced for both LANCL proteins. The calculated red/green ratio was approx. 1 log higher in LANCL1/2-overexpressing compared with double silenced cells, reflecting a steeper ∆Ψ (Figure 1E, right panel, white bars). H9c2 cells transformed with the two different control vectors (PLV for the overexpression and SCR for the silencing of the LANCL proteins) had similar red/green ratios, and the values were in between those of the overexpressing and the double-silenced cells (not shown). Thus, the marked difference in the mitochondrial ∆Ψ between overexpressing and silenced cells was not attributable to the different viral vectors, but to the overexpression vs. silencing of the LANCL1/2 proteins. Cell treatment with Cyclosporin A (CsA), an inhibitor of both types of proton “leakers”, ATP-synthase [19] and the ATP/ADP translocator ANT-1 [20], further significantly increased (by 37%) the already high ∆Ψ in over-expressing cells (Figure 1 E); the lower percentage increase of the red/green fluorescence ratio in overexpressing vs. double-silenced cells (37% vs. 62%) may indicate presence of other, CsA-insensitive, proton “leakers” in LANCL1/2-overexpressing cardiomyocytes.

3.2. LANCL1/2-silencing reduces, and their overexpression increases, oxidative metabolism gene expression, glucose uptake and NAD/ATP content.

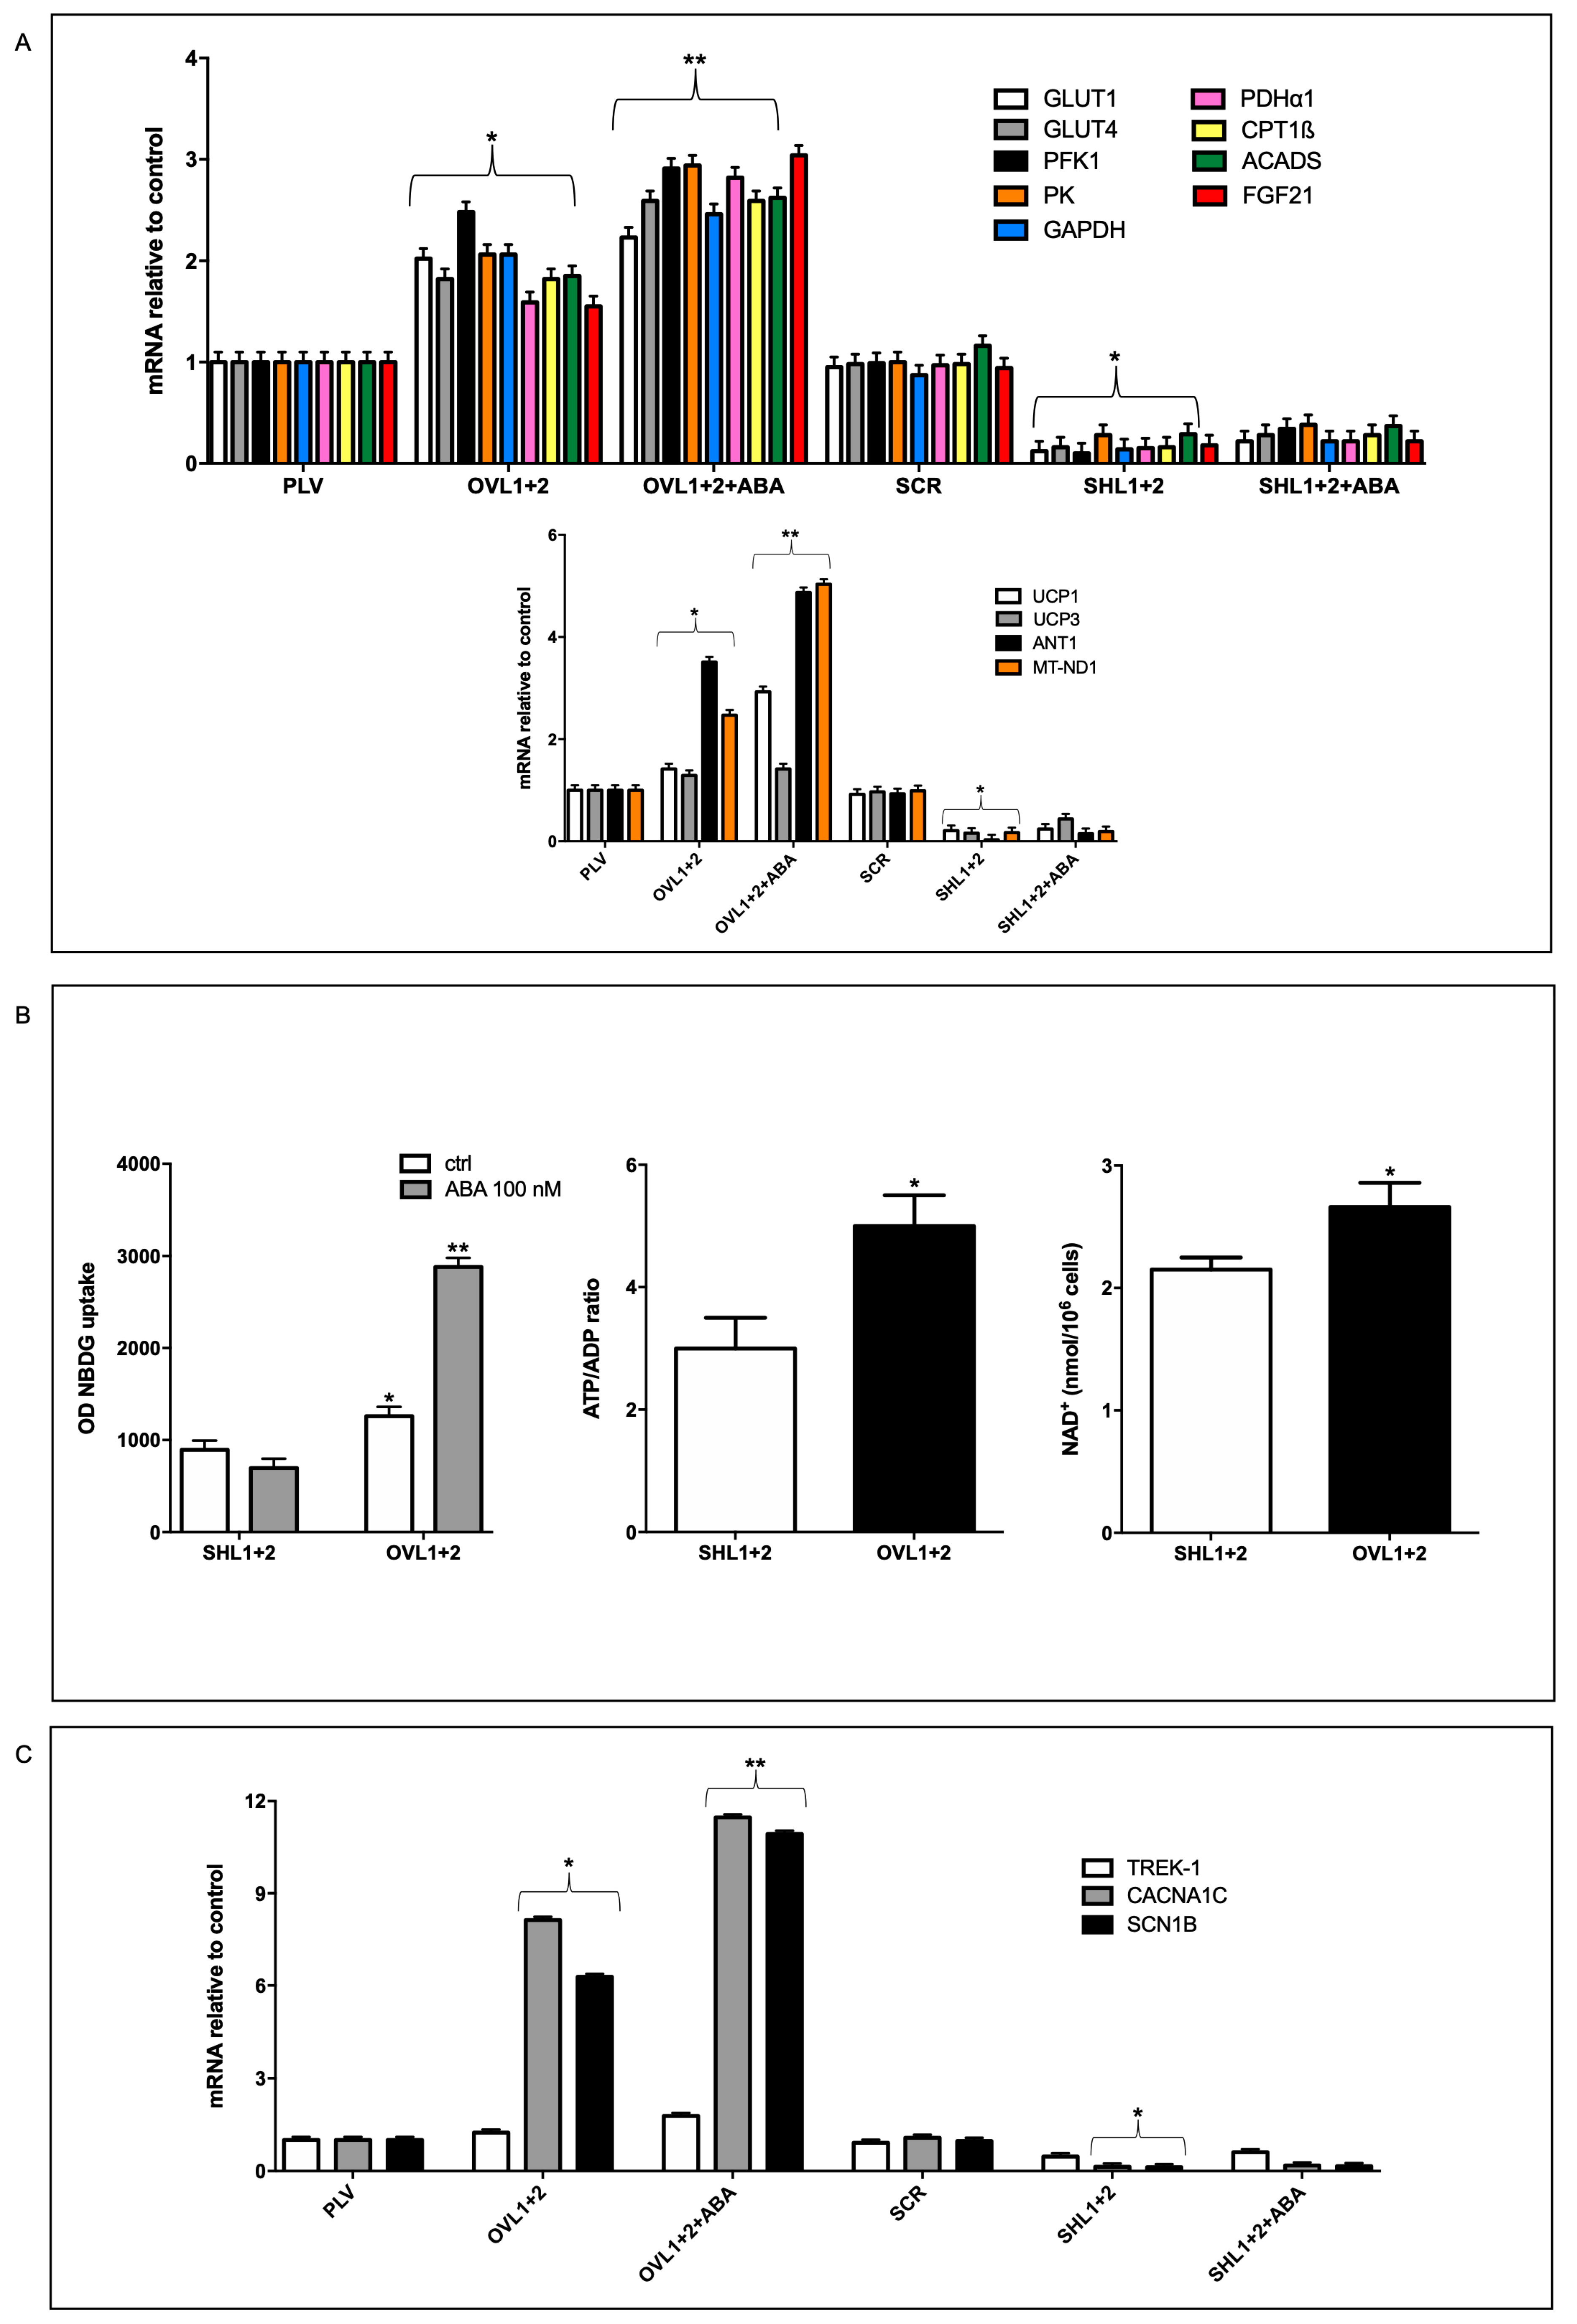
The higher respiration rates, both basal and maximal, observed in LANCL1/2-overexpressing vs. -silenced H9c2 need to be sustained by a higher oxidative metabolic rate. Indeed, transcription of glucose transporters GLUT4 and GLUT1, of glycolytic enzymes (phosphofructokinase-1, PFK1, glyceraldehyde dehydrogenase, GAPDH, pyruvate kinase, PK), of subunit 1 of pyruvate dehydrogenase (PDHα1, required for pyruvate entry into the Krebs cycle), of proteins involved in fatty acid transport (carnitine palmitoyltransferase, CPT1β) and oxidation (acyl-coenzyme A dehydrogenase, ACADS), and of fibroblast growth factor 21 (FGF21), a hormone regulating energy metabolism at a tissue and organismic level, all increased approx 2-fold in LANCL1/2-overexpressing cells compared with their controls, infected with the empty vector PLV and treatment with 100 nM ABA further increased mRNA levels. The same mRNAs were conversely significantly reduced in double-silenced cells compared with their respective controls, transfected with the scrambled sequences (SCR) used for LANCL1/2 silencing (Figure 2A, upper panel).
In addition to these metabolism-controlling genes, transcription of other genes involved in mitochondrial function was also upregulated in LANCL1/2-overexpressing and conversely downregulated in double-silenced H9c2: subunit 1 of complex I of the respiratory chain (MT-ND1), uncoupling proteins 1 and 3 (UCP1, UCP3) and the adenine nucleotide translocator ANT1, which is necessary to allow ADP/ATP exchange across the inner mitochondrial membrane, but also mediates a fatty acid-transport that partly dissipates the proton gradient [20], similarly to UCP3 (Figure 2A, lower panel).
mRNA levels of NAD-Synthesizing NAMPT and of NO-producing eNOS were also significantly upregulated in overexpressing compared with double-silenced cells (approx. 25-fold, not shown) as already observed [10]. The logarithmic increase of the transcription levels of ANT1, UCP1 and UCP3 in LANCL1/2-overexpressing vs. double-silenced H9c2 is in agreement with the higher proton leak observed in these cells compared with the double-silenced cells (Figure 1 D). The mitochondrial-to-genomic DNA ratio increased almost 3 times in LANCL1/2-overexpressing cells compared with their controls (PLV) while it was conversely severely reduced in double-silenced cells; thus, overexpressing cells showed a 12-fold higher mitochondrial/genomic DNA ratio compared with double silenced cells; the fact that mitochondrial fluorescence increased 3-fold while the mitochondrial-to-genomic DNA ratio increased 12-fold in overexpressing vs. double silenced cells may reflect not only an increase in mitochondrial number, but also a higher mitochondrial DNA content. Finally, treatment with 100 nM ABA of over-expressing, but not of double-silenced cells, further significantly increased the mitochondrial/nuclear DNA ratio, which was approx. 25-times higher in over-expressing vs. double-silenced cells (Figure 2A, lower panel).
Figure 2. LANCL1/2-overexpression increases, and their double silencing reduces mRNA levels of oxidative metabolism genes, glucose uptake and NAD/ATP content. (A) qPCR analysis of the transcription of the indicated genes in cells overexpressing or silenced for the expression of LANCL1 and LANCL2 proteins and incubated in the absence or in the presence of 100 nM ABA for 4 hours. Results are expressed relative to control cells (PLV or SCR). Upper panel, GLUT1, GLUT4, PFK1, PK, GAPDH, PDHα1, CPT1β, ACADS and FGF21 mRNA levels; lower panel, UCP1, UCP3, ANT1 and MT_ND1 mRNA levels. *p<0.05 relative to the respective control untreated cells (PLV or SCR) and **p<0.01 relative to OVL1+2 cells by unpaired t-test. Data shown are the mean ± SD of 3 experiments per group, with each value calculated in triplicate. (B) Glucose uptake (left panel), ATP/ADP ratio (central panel) and NAD+ content (right panel) were measured in the same cells. *p<0.05 and **p<0.01 relative to SHL1+2 cells by unpaired t-test. Data shown are the mean ± SD of 4 experiments per group. (C) qPCR analysis of the transcription of TREK-1, CACNA1C and SCN1B in cells overexpressing or silenced for the expression of LANCL1 and LANCL2 proteins and incubated in the absence or in the presence of 100 nM ABA for 4 hours. Results are expressed relative to control cells (PLV or SCR). *p<0.05 relative to the respective control untreated cells (PLV or SCR) and **p<0.01 relative to OVL1+2 cells by unpaired t-test. Data shown are the mean ± SD of 3 experiments per group, with each value calculated in triplicate.
Preprints 81188 g002
In line with the increased transcription of glucose transporters GLUT1 and GLUT4, glucose uptake, as measured with the fluorescent analog 2-NBDG, was higher in LANCL1/2-overexpressing vs. double-silenced cells (by approx 40%) and further significantly increased to 3-times higher values after pre-incubation with 100 nM ABA of the overexpressing, but not of the silenced cells (Figure 2B, left panel). An increased energy production in LANCL1/2-overexpressing vs. silenced H9c2 was also evident from their respective ATP/ADP ratio, which was approx. 5 vs. 3 and their NAD+ content (Figure 2B, central and right panels).
Finally, mRNA levels of three different ion channels critical for cardiomyocyte electrical conductance and contractile activity were investigated: the two-pore domain potassium channel TREK-1, the voltage-gated sodium channel SCN1B and the L-type calcium channel CACNA1c. mRNAs specific for SCN1B and CACNA1c increased approx 8-fold in LANCL1/2-overexpressing vs. control cells and treatment with ABA further increased transcription. By contrast, mRNA levels for TREK-1 were not significantly higher and increased only slightly upon ABA treatment in overexpressing cells. Transcription of SCN1B and CACNA1c was conversely significantly reduced in double-silenced cells compared with their controls (SCR) and again transcription of TREK-1 was not significantly affected by LANCL1/2 silencing (Figure 2C).

3.3. Cell volume and proliferation rate increase in LANCL1/2-overexpressing compared with double-silenced cells.

As observed under a phase contrast microscope during routine cell culture maintenance, LANCL1/2-overexpressing cells appeared visibly larger and more rapidly dividing than double silenced cells. To quantify these visual impressions, cell volume, protein content and doubling time were analyzed.
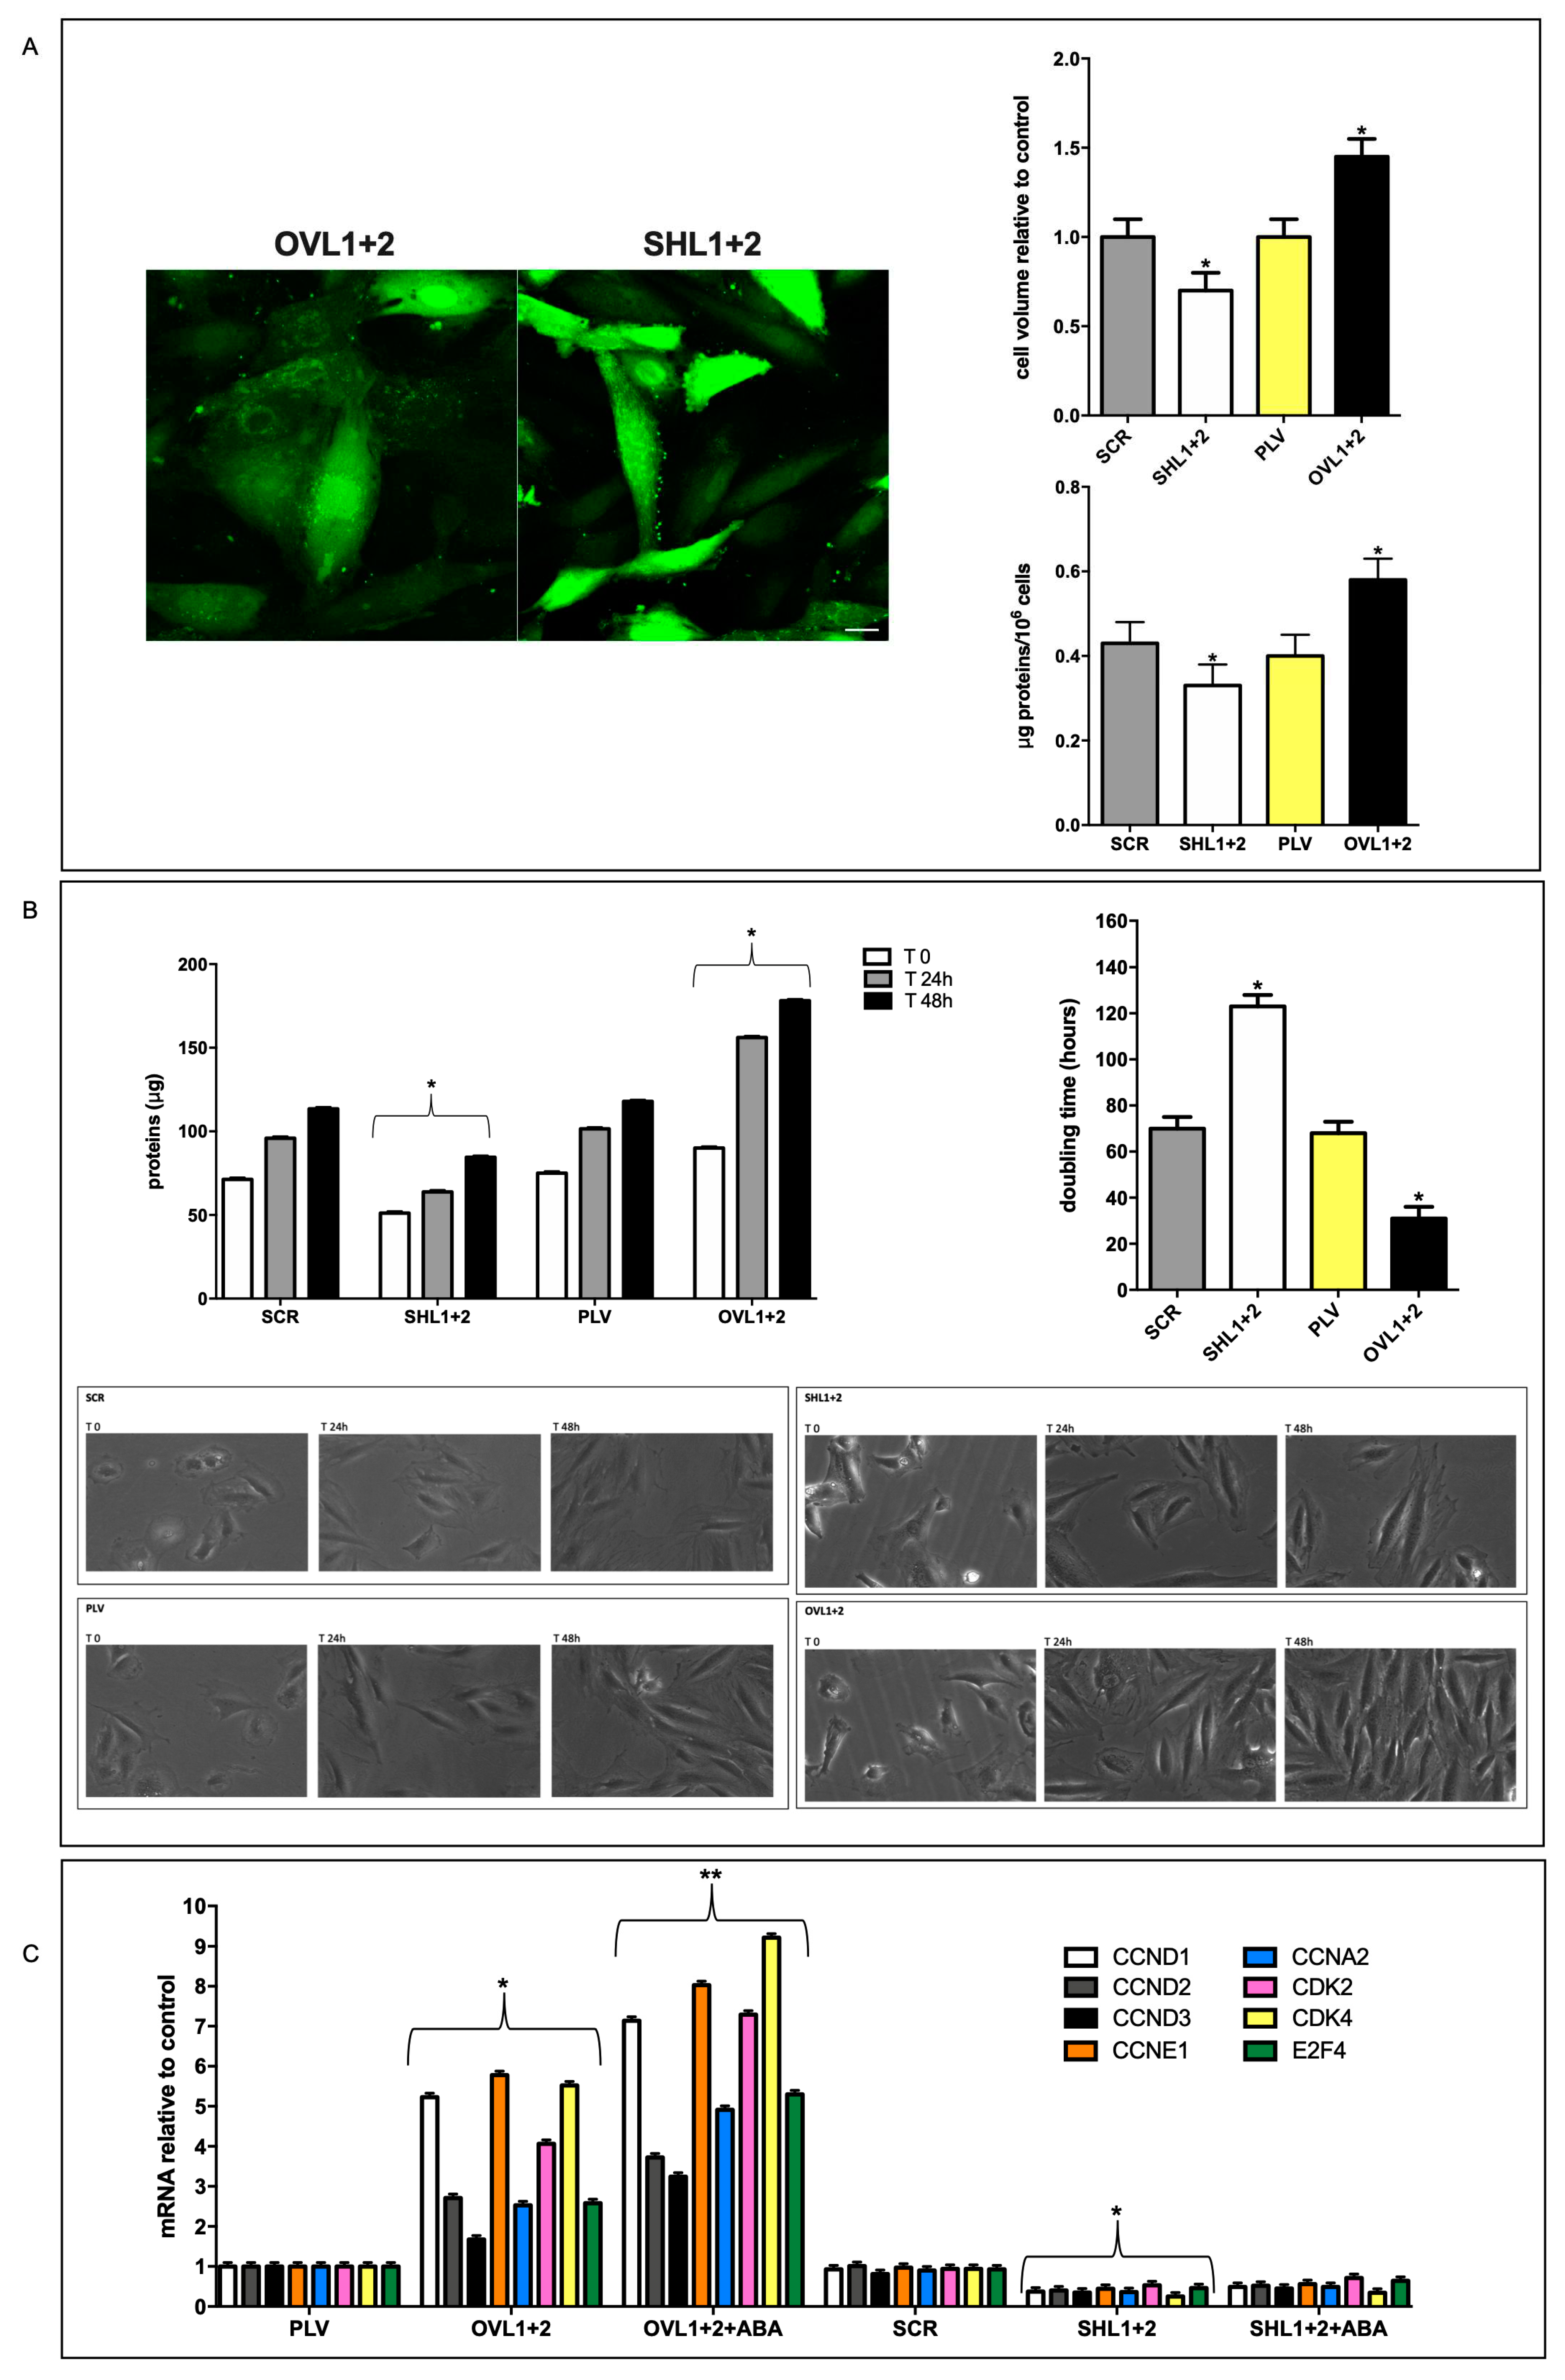
The cell volume was measured by confocal microscopy on calcein-loaded cells (Figure 3A, left panel). While cell volume was not significantly different between control cells, infected with the empty vector (PLV) or with the scrambled sequences used for LANCL1/2-silencing (SCR), LANCL1/2-overexpressing cells were significantly larger (175%) than double-silenced cells; compared with their respective controls, LANCL1/2-overexpressing cells were 45% larger than PLV-infected cells and double-silenced cells were 30% smaller than SCR controls (Figure 3A, upper right panel).
As could be anticipated from the larger cell volume, total cell protein content per 106 cells was also higher in LANCL1/2-overexpressing compared with double-silenced cells (56% higher) and again control cells (SCR and PLV) had a similar protein content (Figure 3A, lower right panel), indicating that the difference in cell volume and in protein content between overexpressing and double silenced cells was not attributable to the different vector used for their transformation.
To evaluate cell doubling time in LANCL1/2-overexpressing vs. double-silenced cells, the time needed to double cell culture proteins relative to time = zero values was compared (Figure 3B, upper left panel). Cell doubling time was similar in control cells (SCR and PLV, approx 70h), conversely it was significantly reduced in LANCL1/2-overexpressing cells (35h) and conversely increased in double-silenced cells (120h) (Figure 3B, upper right panel).
The reduced doubling time of LANCL1/2-overexpressing cells compared with double-silenced cells was also visually evident from photomicrographs taken during the cell culture (Figure 3B, lower right panels), while control cells (SCR and PLV) showed a similar cell density during culture (Figure 3B, lower left panels).
The 4-fold higher growth rate of LANCL1/2-overexpressing vs. double-silenced cells suggested to analyze mRNA levels of a selection of cyclins (CCN) and of cyclin-dependent kinases (CDK) whose overexpression or targeted delivery increases or induces cardiomyocyte proliferation in vitro and in vivo [21,22,23,24,25]. In fact, LANCL1/2-overexpressing cells showed a strongly increased transcription of all CCN and CDK explored compared with their controls, transfected with the empty vector PLV, and treatment with ABA further increased mRNA levels (Figure 3C). Conversely, double silenced cells had a markedly reduced transcription of the same genes, compared with their controls, transfected with scrambled sequences (SCR) and ABA treatment did not induce any increase in gene transcription (Figure 3C). In particular, CCNA2, CCND1 and CDK4 induce cell proliferation when overexpressed in adult cardiomyocytes [24,25].
Figure 3. Effect of LANCL1/2-overexpression or -silencing on cardiomyocyte volume and proliferation. (A) Cell volume by confocal microscopy on calcein-loaded cells and total cell protein content per 106 cells were measured. Left panel, representative confocal microscopy images; upper right panel, densitometric quantitation relative to the respective control untreated cells (PLV or SCR) calculated in at least 3 microscopic fields (scale bar: 20µm) for each experiment; lower right panel, cell protein content reported as µg proteins/106 cells. *p<0.05 relative to the respective control untreated cells (PLV or SCR) by unpaired t-test. Data shown are the mean ± SD of 4 experiments per group, with each value calculated in triplicate. (B) Cell protein content after 24- and 48-hours with respect to time = zero (upper left panel) and doubling time (upper right panel) were calculated. Representative photomicrographs were taken during the cell culture (lower panels, 20x magnification). *p<0.05 relative to the respective control untreated cells (PLV or SCR) by unpaired t-test. Data shown are the mean ± SD of 4 experiments per group, with each value calculated in triplicate. (C) qPCR analysis of the transcription of a selection of cyclins (CCN) and of cyclin-dependent kinases (CDK) in cells overexpressing or silenced for the expression of LANCL1 and LANCL2 proteins and incubated in the absence or in the presence of 100 nM ABA for 4 hours. Results are expressed relative to control cells (PLV or SCR). *p<0.05 relative to the respective control untreated cells (PLV or SCR) and **p<0.01 relative to OVL1+2 cells by unpaired t-test. Data shown are the mean ± SD of 4 experiments per group, with each value calculated in triplicate.
Preprints 81188 g003
Altogether, these results indicate that LANCL1/2-overexpressing cardiomyocytes have an increased protein content, are larger and grow faster than double-silenced cells. All these features are likely supported by the increased energetic proficiency of their mitochondria.

3.4. Quantitative and qualitative differences in the expression of contractile and cytoskeletal proteins in LANCL1/2-overexpressing vs. double-silenced H9c2 cells.

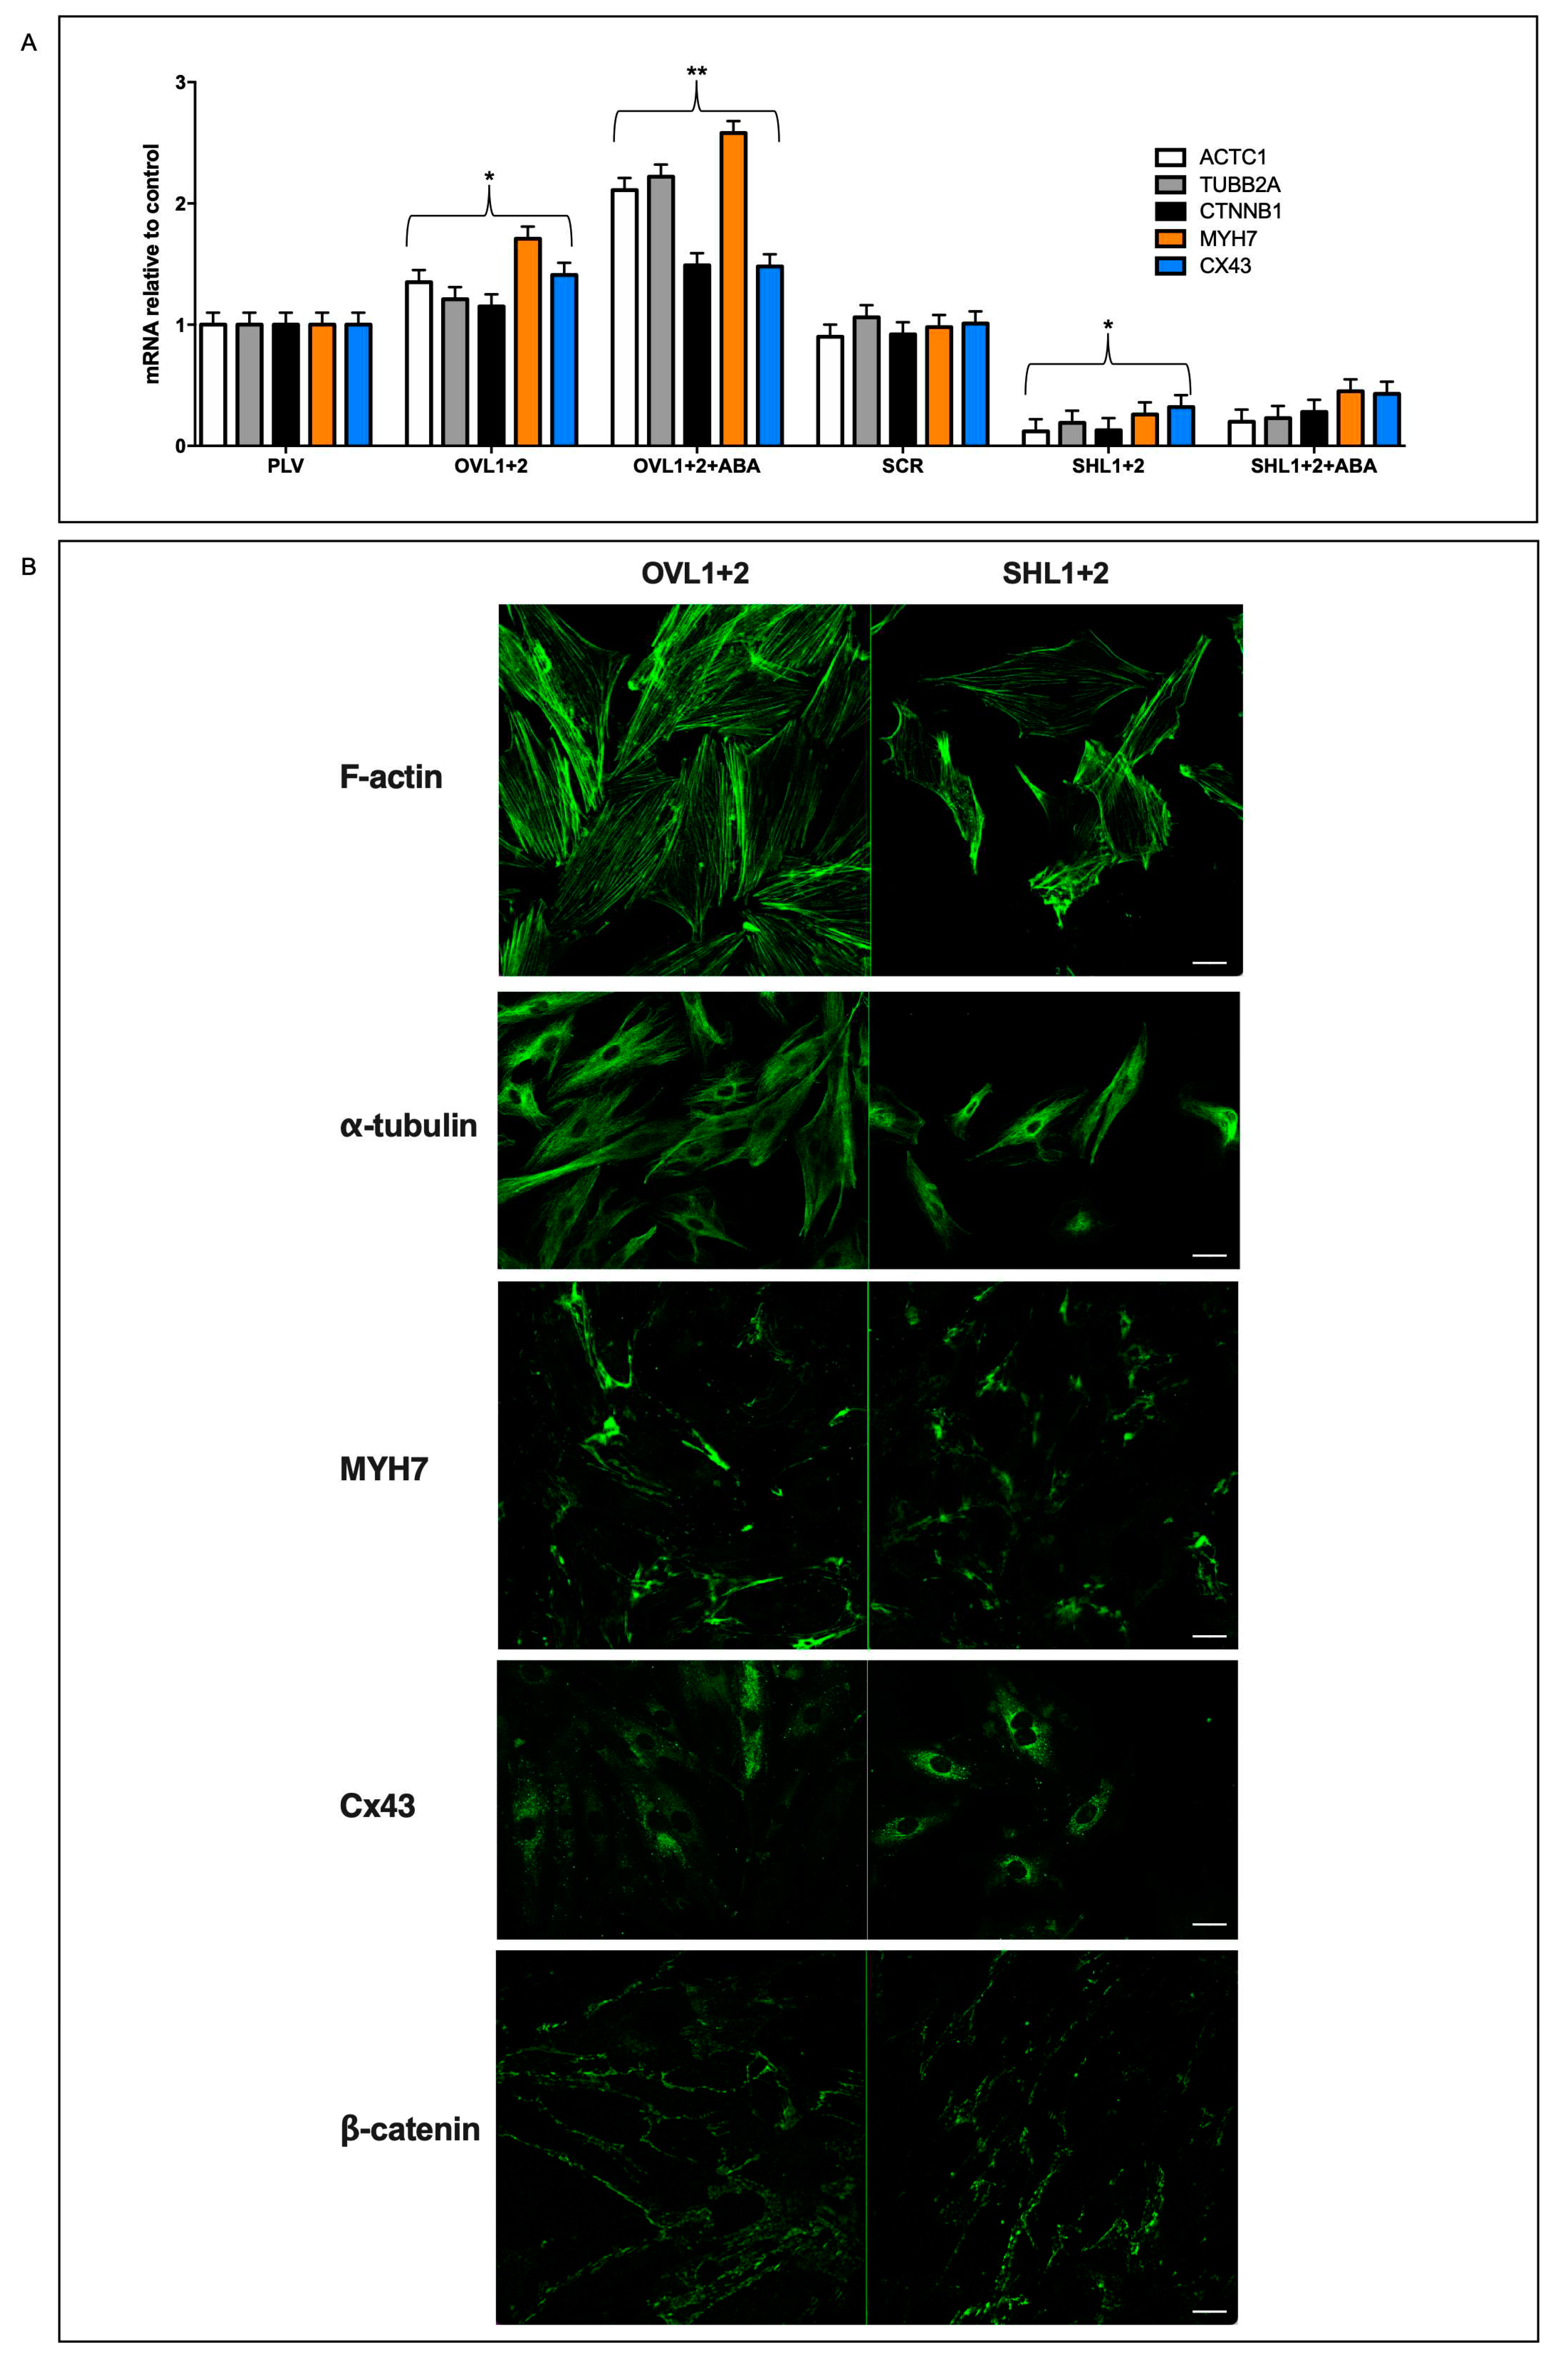
The different cell volume and protein content observed in double-silenced vs. overexpressing cells suggested comparing the cytoskeletal and contractile proteins of the two cell types. Thus, we analyzed transcription and expression of the following functional proteins of cardiomyocytes: cytoskeletal tubulin (TUBB2A), the contractile complex of actin (ACTC1) and heart-specific myosin heavy chain 7 (MYH7), proteins involved in cell-to-cell contact connexin-43 (Cx43) and in cytoskeletal stabilization (β-catenin, CTNNB1). Transcription of the contractile complex genes ACTC1 and MYH7 increased by approx. 40% in OVL1+2 cells compared with controls (PLV) and further increased by approx. 150% in the presence of 100 nM ABA; transcription of these genes was conversely significantly reduced in SHL1+2 compared with their controls (SCR) and ABA treatment of the cells did not induce significant modifications of their transcription (Figure 4A).
mRNA levels of Cx43 and β-catenin increased slightly in overexpressing cells compared with their controls (by approx. 30%) and were instead significantly reduced (by approx. 50%) in double-silenced cells compared with their respective control (Figure 4A).
To confirm the different expression levels of the cytoskeletal and contractile proteins, immunofluorescence was performed by confocal microscopy [26]. As shown in Figure 4B, LANCL1/2-overexpressing cells had more F-actin fibers than double-silenced cells; in the latter cells, filaments also seemed to be less organized. In addition, over-expressing cells also showed increased fluorescence for α-tubulin and MYH7 when compared with double-silenced cells. The cell distribution of β-catenin also appeared to be different in over-expressing vs. double-silenced H9c2; in the latter cells, staining for β-catenin appeared to be more punctate, perhaps as a consequence of some rearrangement of F-actin fibers, which interact with β-catenin at the membrane level [27-Huber et al 2001]. Moreover, the distribution of Cx43, whose trafficking is at least in part regulated by microtubules [28-Giepmans 2001], was also different in LANCL1/2-overexpressing vs. double-silenced cells: in LANCL1/2-overexpressing cells it showed a diffuse staining all over the cytosol, whereas in LANCL1/2-silenced cells it acquired a marked perinuclear localization, suggesting retention of the protein in the Golgi and less protein available for gap junction formation at the plasmamembrane.

3.5. ERRα mediates the transcriptional effects induced by LANCL1/2-overexpression in H9c2.

We previously observed that over-expression of LANCL1/2 in human adipocytes differentiated from immortalized preadipocytes induces a 10- and 5-fold increase of ERRα transcription in brown and beige adipocytes, respectively, compared with similarly differentiated control cells, not overexpressing LANCL proteins [10]. In addition, together with PGC-1α, ERRα controls transcription of several genes involved in mitochondrial energy-production in cardiac and skeletal muscle [7] and may thus be involved in some of the mitochondrial activities stimulated in LANCL1/2-overexpressing H9c2.
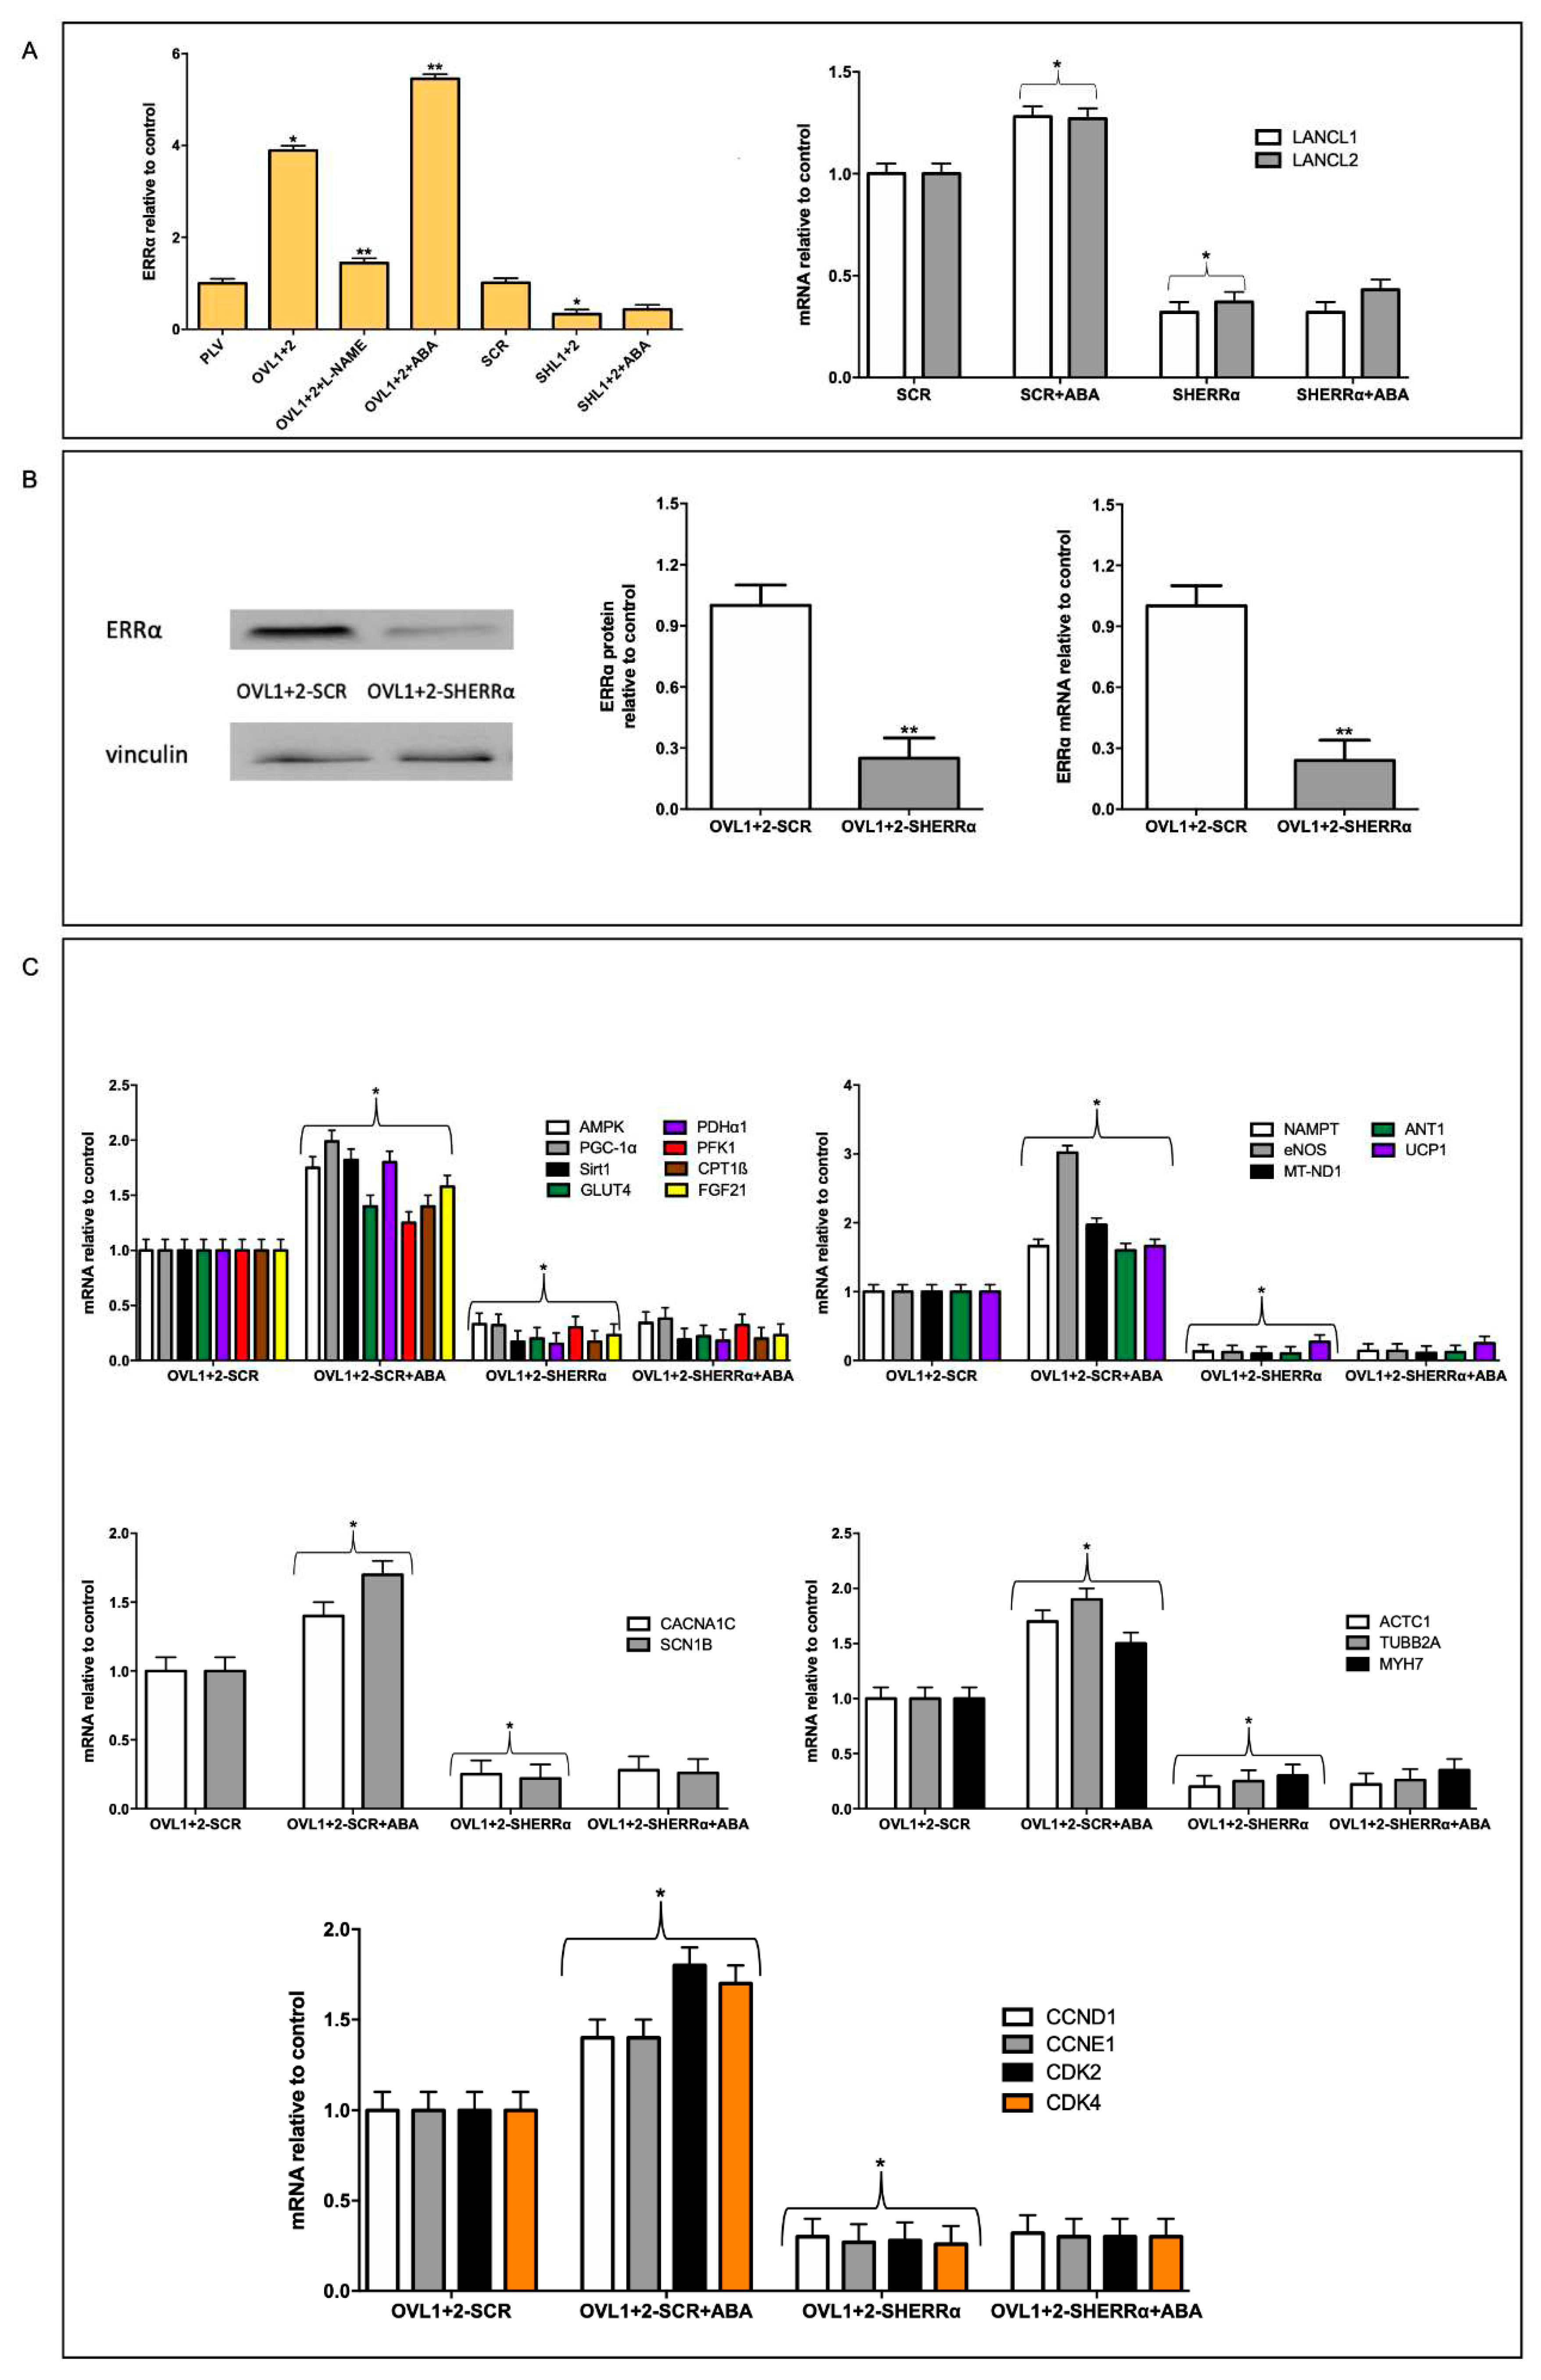
Firstly, we confirmed in H9c2 that overexpression of the LANCL proteins induces an increased transcription of ERRα (4-fold) compared with PLV-infected control cells, and that double silencing of the LANCL proteins instead results in a significantly reduced transcription (by approx. 80%) of ERRα, compared with scrambled-transfected control cells. The combination of these opposite transcriptional trends leads to approx. 20-fold higher mRNA levels of ERRα in LANCL1/2-overexpressing vs. double-silenced cells (Figure 5A, left panel). Silencing of ERRα in untransformed H9c2 cardiomyocytes (SHERRα, not overexpressing LANCL1/2) allowed us to investigate whether there was a reciprocal transcriptional control between ERRα and the LANCL proteins. Indeed, silencing of ERRα significantly reduced (by approx 75%) transcription of endogenous (not overexpressed) LANCL1 and LANCL2 and also abrogated the stimulatory effect of ABA on LANCL1/2 transcription (Figure 5A, right panel). Thus, a reciprocal transcriptional activation links ERRα and the LANCL proteins.
As shown in Figure 5B, knockdown of ERRα in LANCL1/2-overexpressing cells (OVL1+2-SHERRα), where ERRα mRNA levels are spontaneously 4-times higher than in PLV-infected cells, as a consequence of the LANCL proteins overexpression (Figure 5A), was confirmed by both immunoblot (Figure 5B, left and central panels) and by qPCR (Figure 5B, right panel). A similar, approx. 75%, reduction was observed both in protein expression and in mRNA transcription relative to control cells, transfected with the vector containing scrambled silencing sequences (OVL1+2-SCR) (Figure 5B).
We next investigated the effect of ERRα silencing on transcription of the genes that we previously identified as part of the signaling pathway downstream of the ABA/LANCL system in muscle cells, i.e. the AMPK/PGC1α/Sirt1 axis [9]. Transcription of these mRNAs was significantly reduced (by approx. 90%) in LANCL1/2-overexpressing cells silenced for ERRα (OVL1+2-SHERRα) relative to controls, transfected with scrambled sequences (OVL1+2-SCR) (Figure 5C, upper panels).
Figure 5. ERRα-dependent transcriptional effects on LANCL1/2-overexpressing H9c2. (A) Left panel, qPCR analysis of the transcription of ERRα in cells overexpressing LANCL1 and LANCL2 proteins and incubated in the absence or in the presence of 100 nM ABA or 100 μM L-NAME for 4 hours and in cells silenced for the expression of both LANCL1/2 proteins treated or not with 100 nM ABA for 4 hours. Results are expressed relative to control cells (PLV or SCR). *p<0.05 relative to the respective control untreated cells (PLV or SCR) and **p<0.01 relative to OVL1+2 cells by unpaired t-test. Data shown are the mean ± SD of 3 experiments per group, with each value calculated in triplicate. Right panel, mRNA levels of LANCL1 and LANCL2 in untransformed H9c2 cardiomyocytes silenced for the expression of ERRα (SHERRα, not overexpressing LANCL1/2) incubated in the absence or in the presence of 100 nM ABA for 4 hours. *p<0.05 relative to SCR untreated cells by unpaired t-test. Data shown are the mean ± SD of 3 experiments per group, with each value calculated in triplicate. (B) Left panel, representative Western blots of ERRα protein in ERRα-silenced, LANCL1/2-overexpressing H9c2 (OVL1+2-SHERRα) compared with control cells (OVL1+2-SCR); central panel, densitometric quantitation of the ERRα protein relative to OVL1+2-SCR; right panel, ERRα mRNA levels in OVL1+2-SHERRα cells relative to OVL1+2-SCR. Values are normalized against vinculin, as housekeeping protein. **p<0.01 relative to OVL1+2-SCR control cells by unpaired t-test. Data shown are the mean ± SD of 3 experiments per group, with each value calculated in triplicate. (C) qPCR analysis of the transcription of specific genes on OVL1+2-SHERRα H9c2 and incubated in the absence or in the presence of 100 nM ABA for 4 hours. Upper left panel, AMPK, PGC-1α, Sirt1, GLUT4, PDHα1, PFK1, CPT1ß AND FGF21 mRNA levels; upper right panel, NAMPT, eNOS, MT-ND1, ANT1 and UCP1 mRNA levels; central left panel, CACNA1C and SCN1B mRNA levels; central right panel, ACTC1, TUBB2A and MYH7 mRNA levels; lower panel, CCND1, CCNE1, CDK2 and CDK4 mRNA levels. Results are expressed relative to OVL1+2-SCR control cells. *p<0.05 relative to OVL1+2-SCR cells by unpaired t-test. Data shown are the mean ± SD of 3 experiments per group, with each value calculated in triplicate.
Preprints 81188 g005
All other target genes previously shown to be transcriptionally upregulated in LANCL1/2-overexpressing H9c2 (Figure 2A), and lying downstream of the AMPK/PGC-1α/Sirt1 axis, showed a similar, significant (>80%) reduction of their mRNA levels in ERRα-silenced, LANCL1/2-overexpressing H9c2 compared with control cells (OVL1+2-SCR) (Figure 5C, upper panels). In addition, ERRα silencing in LANCL1/2-overexpressing cells caused a very severe reduction of the transcription of those genes relevant to mitochondrial function (NAMPT, eNOS, MT-ND1, ANT1 and UCP1, Figure 5C, upper right panel), which were upregulated in LANCL1/2-overexpressing compared with double-silenced cells (Figure 2A). ERRα proved also essential in mediating the stimulation induced by LANCL1/2 overexpression, and further increased by ABA treatment of the cells, of the transcription of ion channels (Figure 5C, left central panel), of cytoskeletal and contractile proteins (Figure 5C, right central panel) and of cell cycle-controlling cyclins and CDKs (Figure 5C, lower panel). The amplitude of the transcriptional inhibition elicited by its silencing in LANCL1/2-overexpressing H9c2 clearly identifies ERRα as the major transcription factor orchestrating the multifaceted transcriptional regulation exerted by the ABA/LANCL system in cardiomyocytes.

3.6. ERRα mediates the functional effects induced by LANCL1/2-overexpression in H9c2.

To explore the functional consequences of ERRα silencing on LANCL1/2-overexpressing H9c2 we next investigated some of the effects downstream of the regulated genes, i.e. proton gradient amplitude, cell volume and cell proliferation.
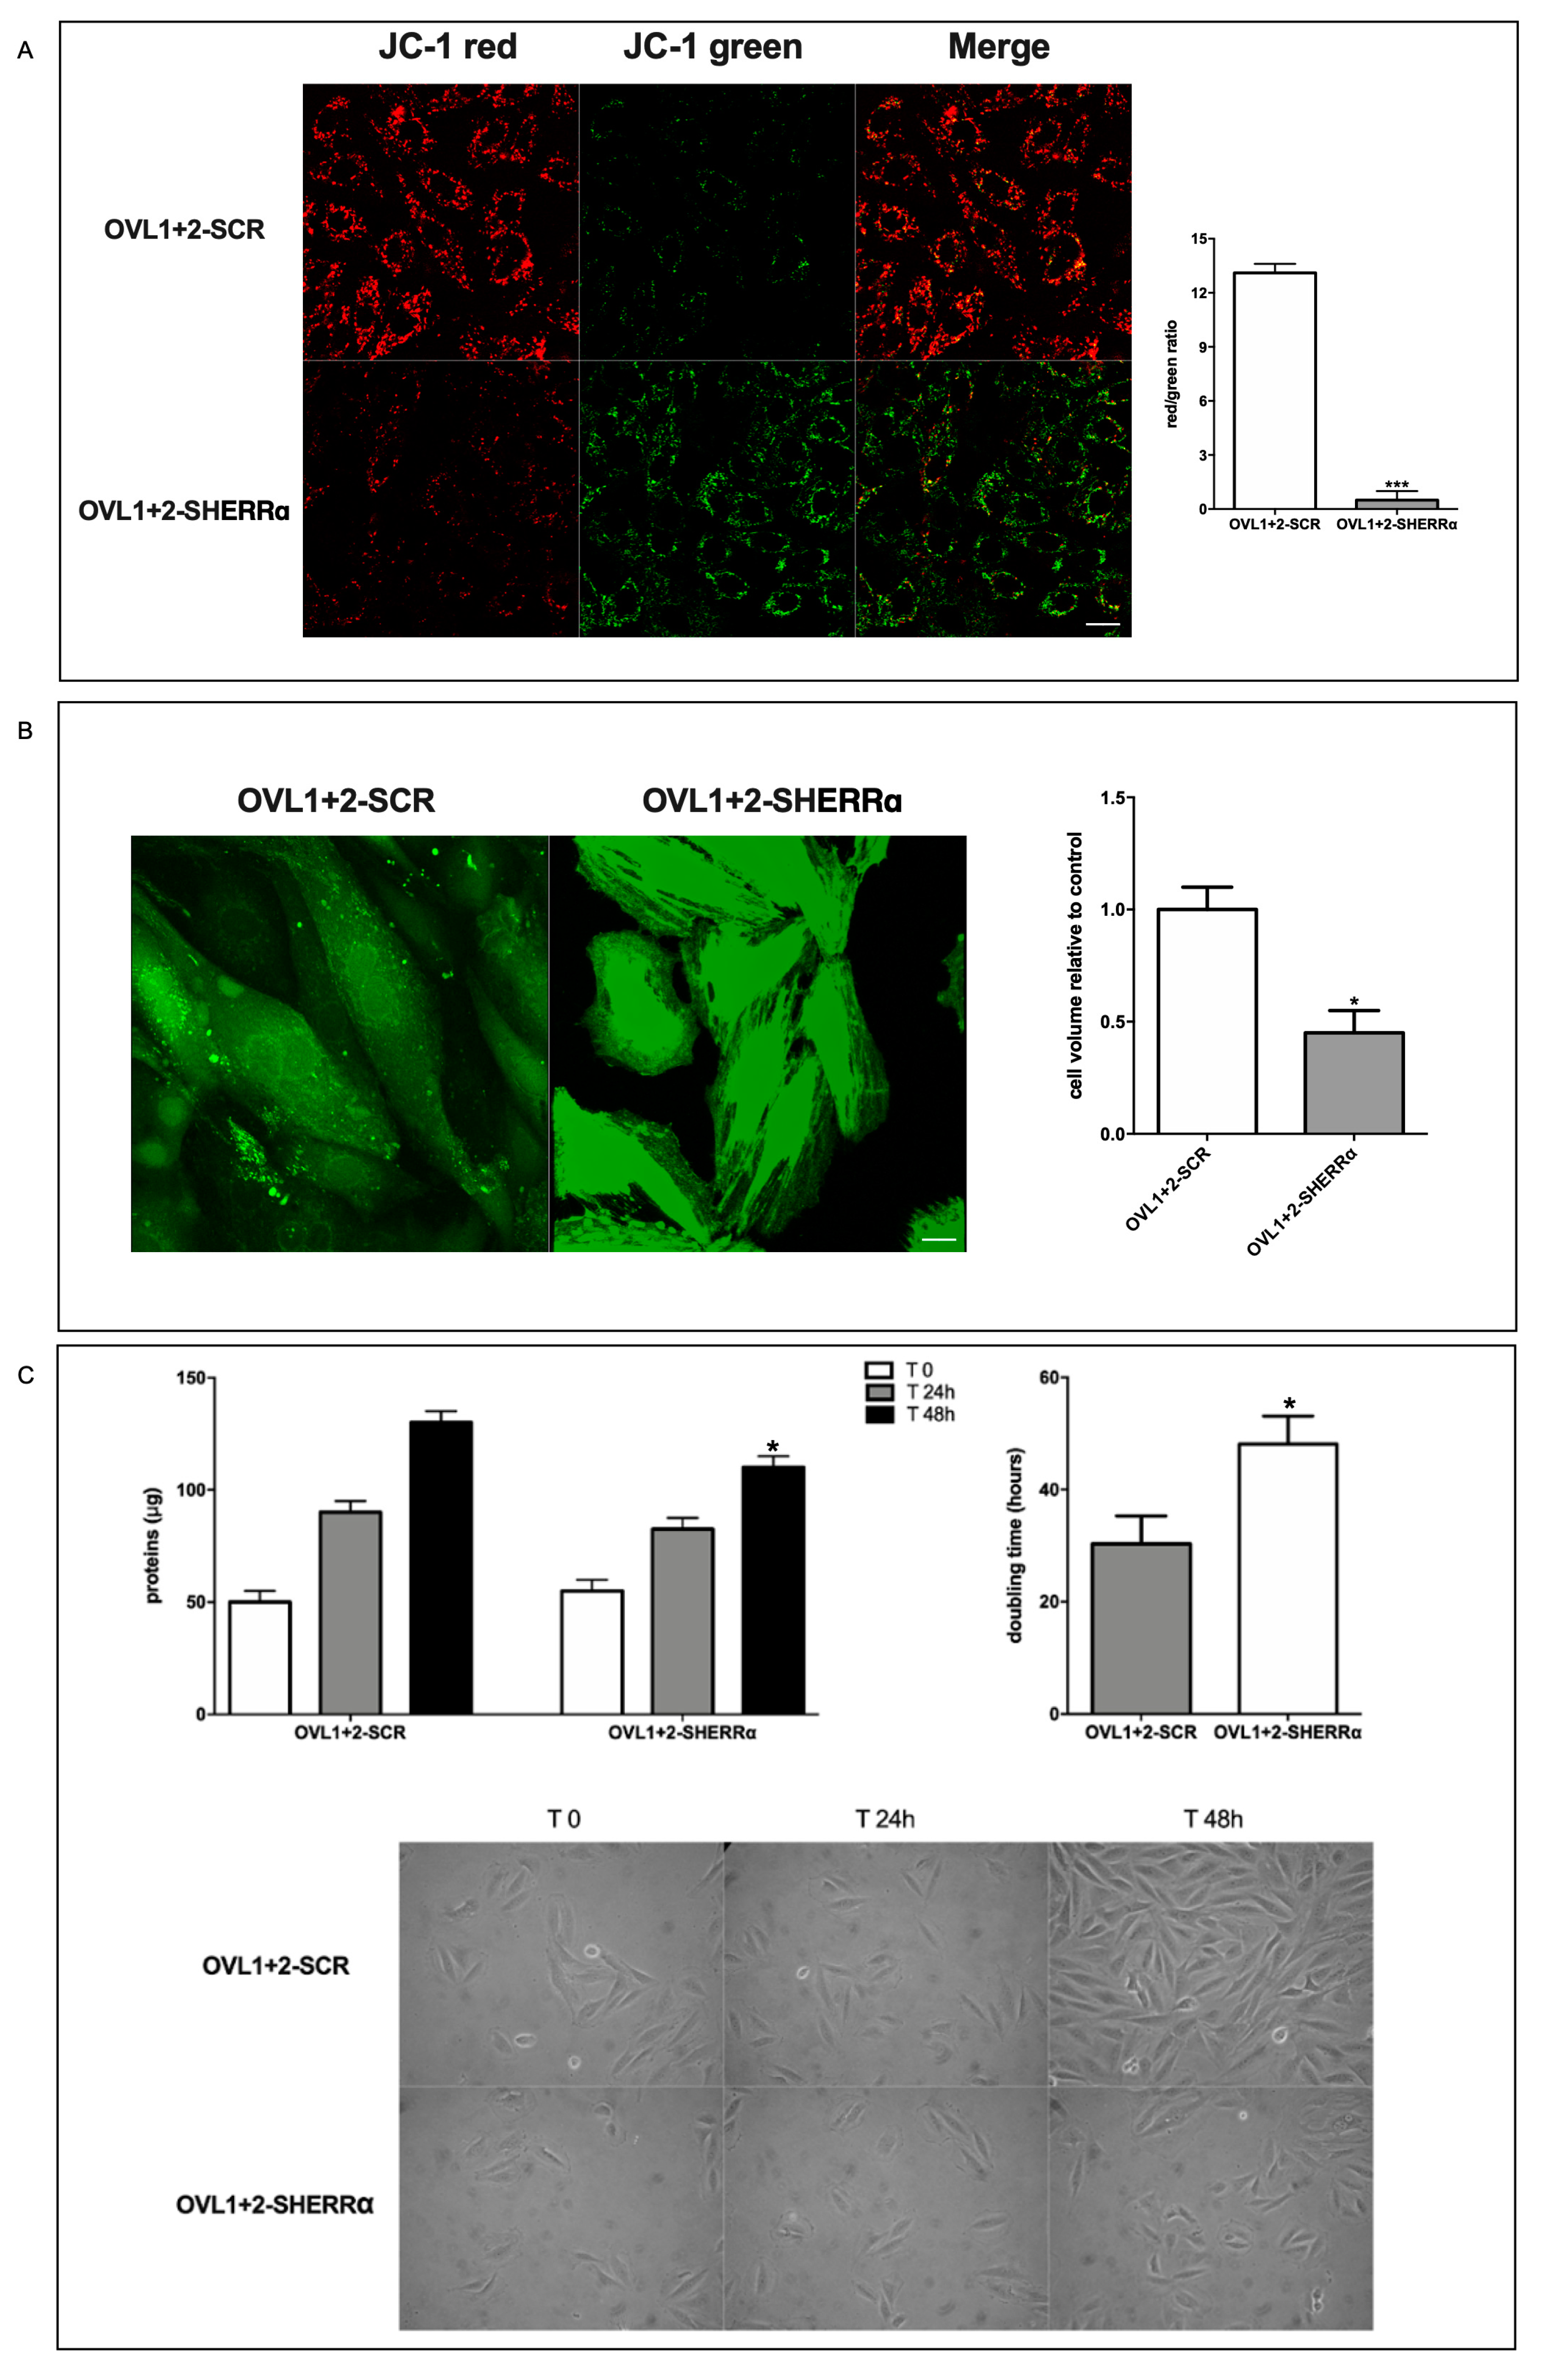
ERRα silencing greatly reduced the proton gradient of native H9c2 (Figure S1, supplementary data) and even more evidently in LANCL1/2-overexpressing cells (OVL1+2-SHERRα), as shown by the predominantly green mitochondrial fluorescence and by the greatly reduced red/green ratio of JC-1-loaded cells compared with LANCL1/2-overexpressing cells transfected with scrambled sequences (SCR) (Figure 6A). The approx. 25-fold reduction of the red/green fluorescence ratio in ERRα-silenced vs. control LANCL1/2-overexpressing H9c2 indicates that ERRα regulates proton gradient formation in LANCL1/2-overexpressing H9c2 cardiomyocytes. Indeed, the reduced transcription of subunit 1 of respiratory complex I (MT-ND1) and of the ADP/ATP translocator ANT1 observed in ERRα-silenced cells (Figure 5C) is expected to negatively affect mitochondrial ∆Ψ. In the face of a reduced mitochondrial proton pumping efficiency, ROS production was instead significantly increased in LANCL1/2-overexpressing cells silenced for ERRα [Spinelli S. et al submitted].
Cell volume was also reduced in ERRα-silenced, LANCL1/2-overexpressing cells compared with controls, as measured using calcein-AM: ERRα silencing reduced cell volume by approx. 60% (Figure 6B).
Finally, cell doubling time was significantly increased in ERRα-silenced, LANCL1/2-overexpressing cells compared with overexpressing cells transfected with the empty vector (controls), as inferred from the time needed to double total protein content of cell cultures (Figure 6C).
We previously observed a causal role for the increased NO generation by LANCL1/2-overexpressing cells in mediating some of the beneficial effects observed in these cells after hypoxia/reoxygenation [5]. Interestingly, transcription of ERRα also appears to be NO-dependent: in the presence of the NOS inhibitor L-NAME mRNA levels for ERRα were significantly reduced (by approx 70%) in LANCL1/2-overexpressing H9c2 (Figure 5A, left panel). Thus, ERRα controls transcription of eNOS (Figure 5C) and NO in turn controls ERRα transcription, generating a feed forward mechanism which may explain the high levels of NO production measured in LANCL1/2-overexpressing H9c2 [5].
Figure 6. ERRα-dependent functional effects in LANCL1/2-overexpressing H9c2. (A) ERRα-silenced, LANCL1/2-overexpressing H9c2 were loaded with the ∆Ψ-sensitive ratiometric fluorescent dye JC-1. Left panel, representative confocal microscopy images; right panel, red/green fluorescence ratio calculated in at least 4 microscopic fields (scale bar: 20µm) for each experiment. ***p<0.005 relative to OVL1+2-SCR cells by unpaired t-test. (B) Cell volume was measured by confocal microscopy on calcein-loaded cells. Left panel, representative confocal microscopy images; right panel, densitometric quantitation relative to OVL1+2-SCR calculated in at least 3 microscopic fields (scale bar: 20µm) for each experiment. *p<0.05 relative to OVL1+2-SCR cells by unpaired t-test. (C) Cell protein content at time = zero (T0) and after 24- and 48-hours (upper left panel) and the calculated doubling time (upper right panel). Representative photomicrographs were taken during the cell culture (lower panel, 20X magnification). *p<0.05 relative to OVL1+2-SCR cells by unpaired t-test. Data shown are the mean ± SD of 3 experiments per group, with each value calculated in triplicate.
Preprints 81188 g006

4. Discussion

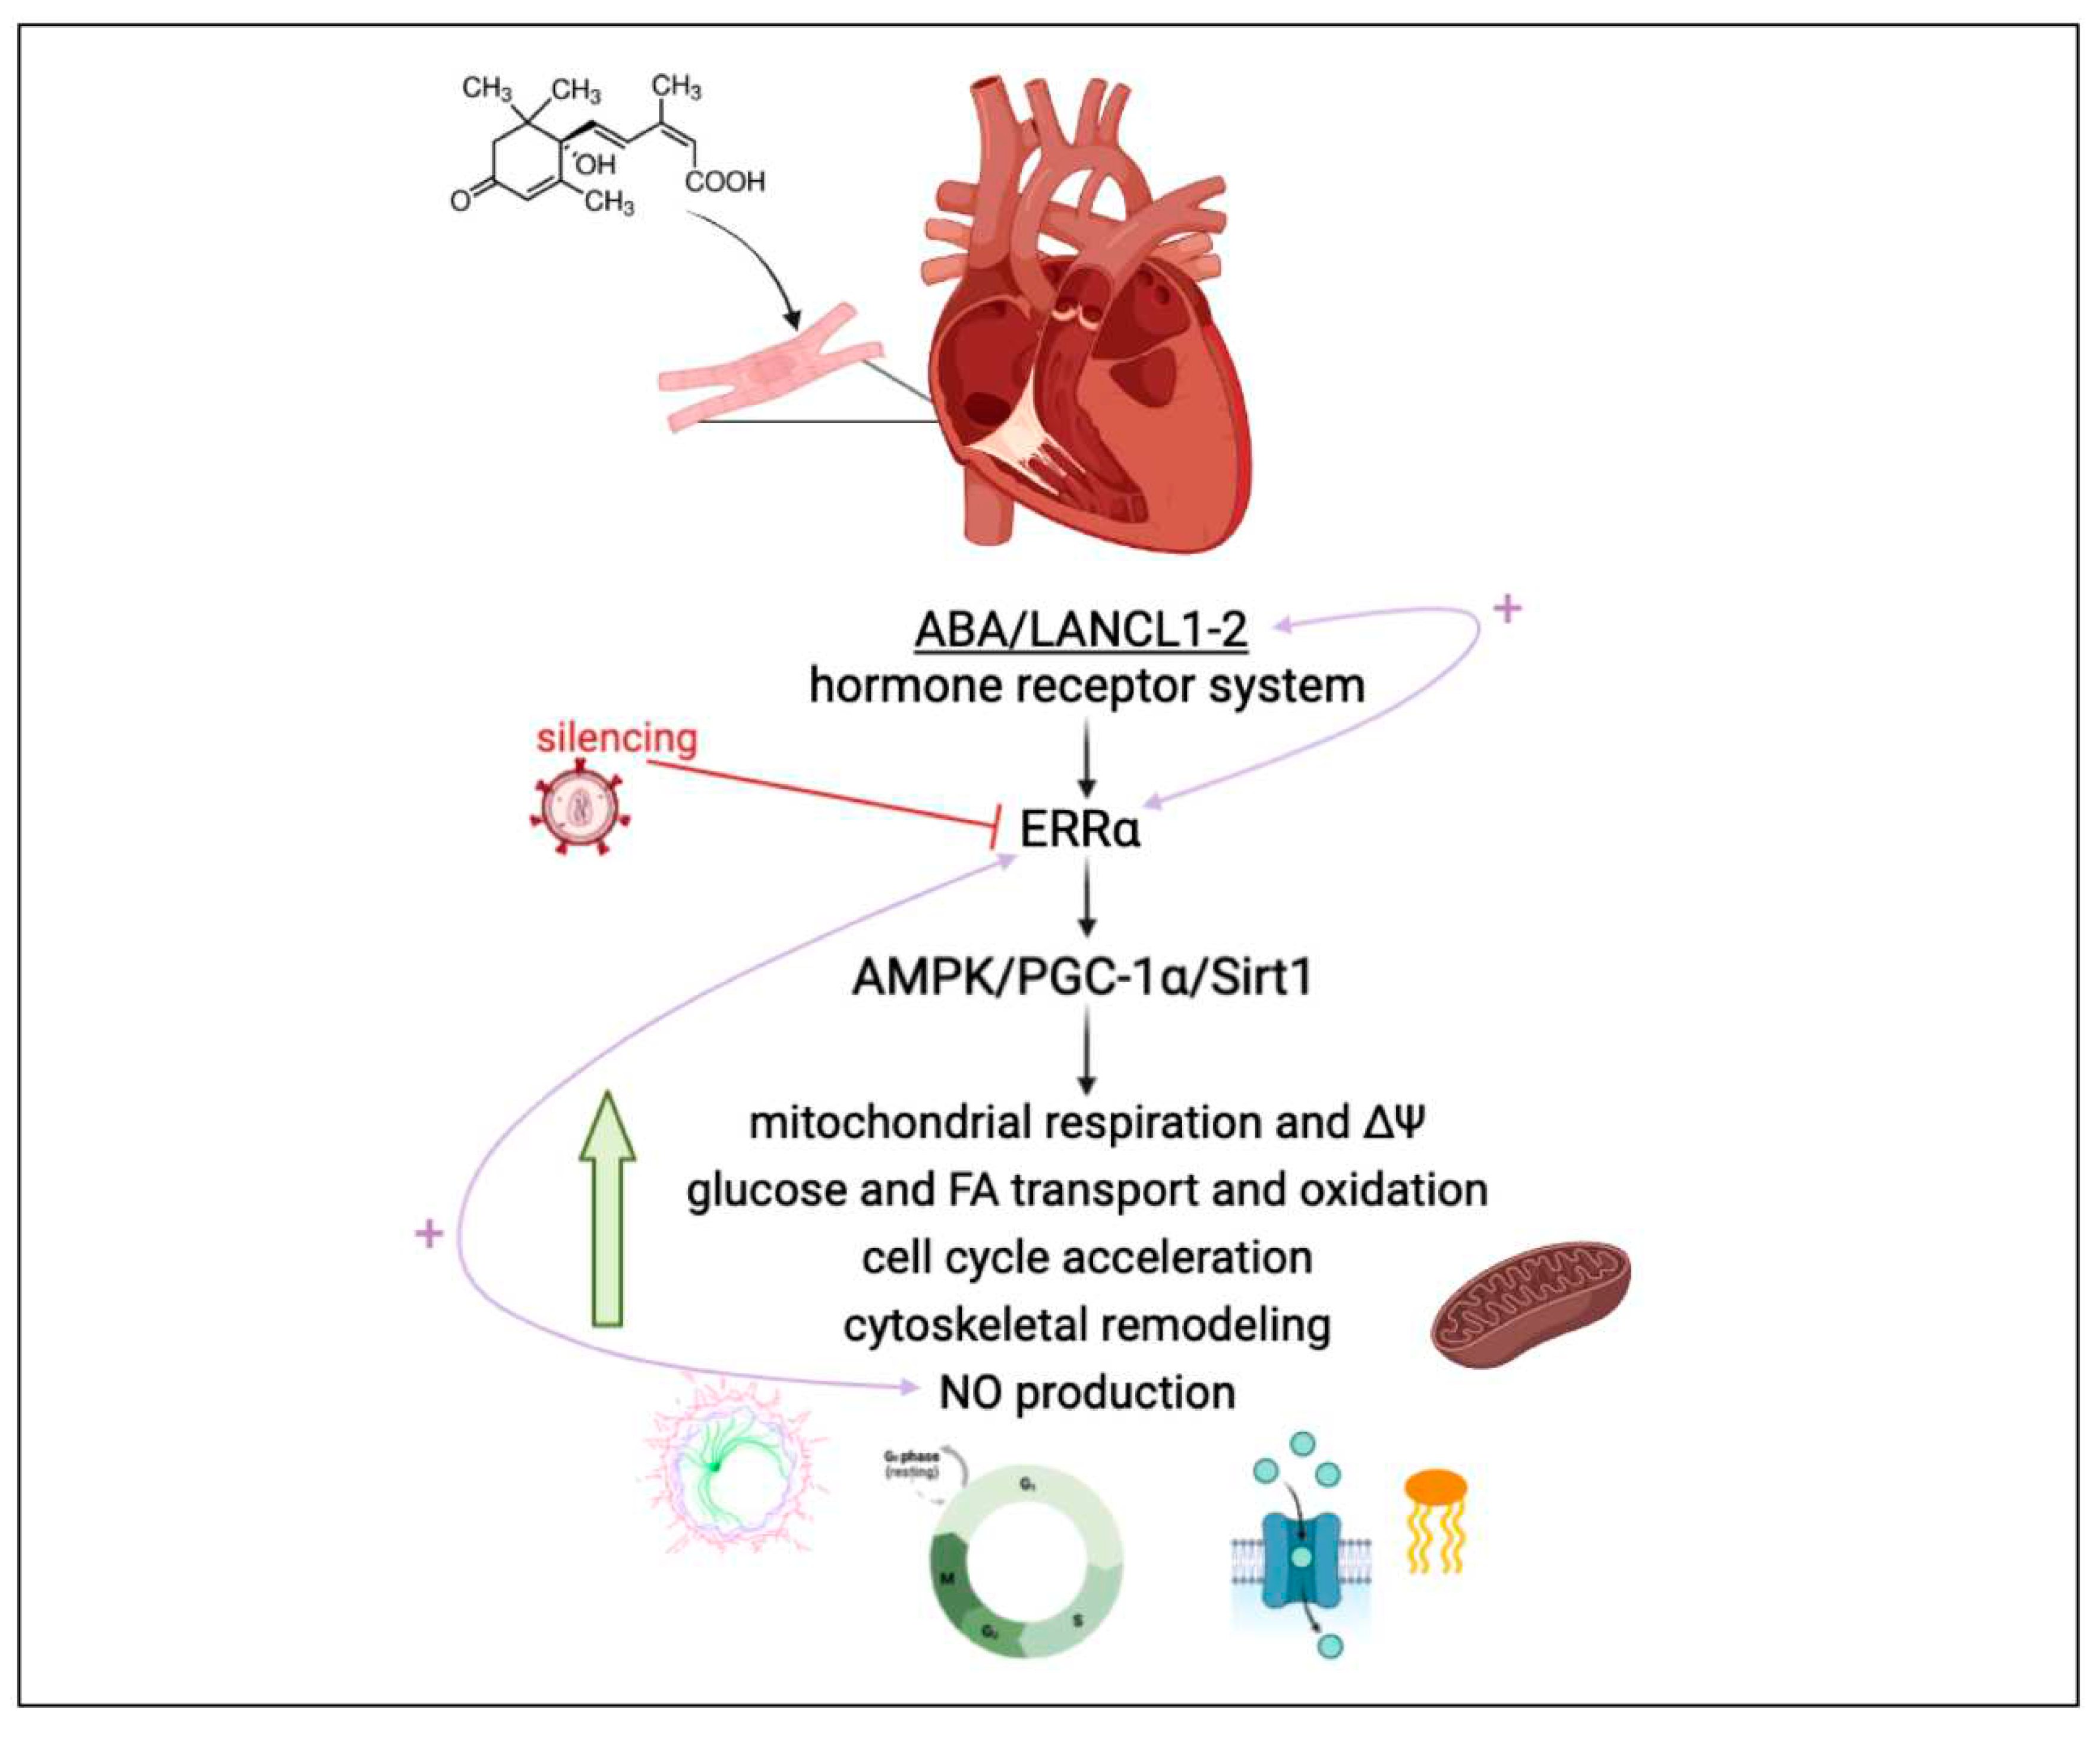
Taken together, results reported in this study allow us to conclude that overexpression of LANCL1/2 significantly improves, while their combined silencing dramatically reduces several key functional features of rat H9c2 cardiomyocytes (Figure 7).
As compared with double-silenced cells, LANCL1/2-overexpressing H9c2 show: i) increased mitochondrial respiration, with higher basal and maximal respiration rates, a doubling of the spare respiratory capacity and a steeper proton gradient (ΔΨ) (Figure 1D, E); ii) increased fatty acid-fueled respiration rate (Figure 1D); iii) increased NO generation [5]; iv) reduced mitochondrial ROS content, higher expression levels of ROS-scavenging and lower levels of ROS-producing enzymes [Spinelli S. et al. submitted]; v) increased transcription and expression of contractile and ion channel proteins (Figure 4); vi) improved resistance to hypoxia/reoxygenation [10]; vii) increased proliferation rate (Figure 3). In short, LANCL1/2 overexpression, and their targeted stimulation by treatment of the cells with ABA, transforms H9c2 cardiomyoblasts into “super-cells”. How are such pleiotropic effects orchestrated?
The AMPK/PGC-1α/Sirt1 axis is known to control energy metabolism and mitochondrial respiration in skeletal muscle [29,30], adipose tissue [31,32] and heart [33,34,35]; thus, the fact that LANCL1/2 overexpression induces the activation of this signaling axis (via transcriptional and post-transcriptional mechanisms) in adipocytes [10], skeletal muscle cells [9] and cardiomyocytes [5] is expected to underlie most of the functional effects observed in overexpressing H9c2. A significant new piece of information added in this study is that the transcription factor ERRα is directly responsible for all transcriptional effects observed in LANCL1/2-overexpressing cells and is functionally linked to the LANCL proteins, with a reciprocal feed-forward mechanism of transcriptional stimulation (Figure 7).
ERRα activity is known to be important for cardiomyocyte mitochondrial function. The critical role of ERRα in cardiomyocyte function starts during myocyte maturation [36] and continues in adult cardiomyocytes, in combination with PGC-1α, with which it shares a reciprocal transcriptional positive regulation [6,37]. Thus, ERRα/PGC-1α control cardiac energy metabolism, metabolic flexibility, mitochondrial respiration and biogenesis. Indeed, pharmacologic targeting of AMPK, which activates ERRα transcription and promoter activity [38] and/or of the ERRα/PGC-1α system [39,40] has been proposed to improve cardiac function in the ailing heart.
Figure 7. The ABA/LANCL1-2 hormone-receptors system controls cardiomyocyte fitness via NO and ERRα. LANCL1/2 overexpression activates the AMPK/PCG-1α/Sirt1 axis in H9c2 rat cardiomyocytes [5-Spinelli Cells 2022], via the orphan-receptor/transcription factor ERRα. A reciprocal transcriptional stimulation links LANCL1/2 and ERRα (right pink arrow). Downstream of this signaling axis several key functional features of H9c2 are stimulated, resulting in a higher energy availability and increased NO production, which in turn activates ERRα transcription (left pink arrow) providing a positive feedback which tends to maintain cells in this energy-proficient state.
Preprints 81188 g007
Here we show that LANCL1/2 overexpression increases, and their double silencing conversely significantly reduces ERRα transcription and expression. In turn, silencing of ERRα reduces endogenous LANCL1/2 mRNA levels in H9c2 and significantly reduces or abrogates all transcriptional and functional effects induced by LANCL1/2-overexpression (Figure 5 and Figure 6). In particular, ERRα silencing abrogates the mitochondrial effects of LANCL1/2 overexpression, reducing the proton gradient (Figure 6A), increasing mitochondrial ROS [Spinelli S. et al submitted] and reducing expression of ROS-scavenging enzymes [Spinelli S. et al submitted]. It may be surprising that silencing just one transcription factor (ERRα) should have such wide-ranging effects on cardiomyocyte physiology; however, one should consider that all transcriptional and functional effects studied here are closely related: an increased oxidative metabolism is needed to allow higher rates of ATP production, in turn allowing increased protein synthesis and accelerated cell proliferation. Indeed, cyclin levels control transcription of several metabolism-related genes, whose enzyme products are necessary for energy production to allow cell duplication [41].
A role for ERRα in the control of cell proliferation has been previously described in lung cancer cells [42]. However, to our knowledge the result reported here (Figure 5C) is the first direct evidence that silencing of ERRα significantly reduces the transcriptional levels of several cyclins and negatively affects cardiomyocyte proliferation (Figure 6).
Although adult cardiomyocytes have lost their proliferative potential, specific cyclin (CCN)/cyclin-dependent kinase (CDK) complexes have been shown to be able to re-start proliferation when overexpressed in adult cardiomyocytes: CDK4/CCND and CDK2/CCND complexes promote entry into G1-S phase [25]; overexpression of CCNA2 induces a proliferative response in adult porcine cardiomyocytes in vivo and in vitro [24]; the targeted expression of cyclin D2 induces cardiomyocyte proliferation and infarct regression in mice [22]. These cell cycle-controlling genes are among the ones whose transcription increases in LANCL1/2-overexpressing, and decreases in double-silenced H9c2 (Figure 3C), indicating a transcriptional control by the LANCL proteins on these cell cycle regulators.
Cell cycle-controlling cyclins, kinases and transcription factors, in particular CCNDs and E2Fs, besides being essential for cell cycle progression, also play important roles in the regulation of energy metabolism [41]: indeed, nutrient availability, metabolic energy production, mitochondrial activity and cell division are tightly linked processes, which need a coordinated regulation. The fact that overexpression of LANCL1/2 significantly increases transcription of several cell cycle- and metabolism-controlling cyclins via ERRα, and that conversely their combined silencing dramatically reduces mRNA levels, identifies the ABA/LANCL1-2/ERRα system as a new regulator of this complex gene system, warranting further studies to deepen our understanding of the role of this hitherto unknown relationship in heart pathological conditions, which may benefit from its pharmacologic stimulation.
An increased mitochondrial respiratory activity is generally considered conducive to an increased ROS production, as all respiratory complexes (RC) can produce ROS when electron flow is excessive, causing an electron “overflow” at the reduced RC, or hampered by a limitation of the terminal electron acceptor, O2. Instead, we observe a higher respiratory capacity in LANCL1/2-overexpressing vs. double-silenced cells, coupled with a reduced mitochondrial ROS production [Spinelli S. et al submitted]. The marked reduction of the mitochondrial proton gradient observed in ERRα-silenced, LANCL1/2-overexpressing cells (Figure 6A) is accompanied by a significant increase of ROS production, as compared with control LANCL1/2-overexpressing cells transfected with the scrambled sequences for ERRα [Spinelli S. et al submitted]. Together, these observations indicate that ERRα is necessary to mediate the beneficial effect of LANCL1/2 on the mitochondrial proton gradient (which increases) and on ROS production (which is instead reduced).
The reduced ROS generation observed in LANCL1/2-overexpressing vs. double-silenced H9c2 may be due at least in part to the increased expression of ROS-scavenging and the reduced expression of ROS-generating enzymes in the overexpressing cells [Spinelli S. et al submitted]. However, other mechanisms may contribute to reducing ROS generation in the face of an increased mitochondrial respiratory activity.
Mild proton leak across the inner mitochondrial membrane has been recently acknowledged as a means to improve respiratory chain function, while at the same time reducing ROS generation [43]. The general consensus is that, by reducing the ΔG for proton pumping, a mild proton leak facilitates electron transport and reduces ROS generation at the RC, at the expense of some ATP. However, we observe both a higher proton leak and an increased ATP-dependent respiration in LANCL1/2-overexpressing vs. double silenced cells (Figure 1D), indicating that the “fine-tuning” of the respiratory chain works better in overexpressing vs. silenced cells, allowing a higher respiration rate and ATP-production and a reduction of mitochondrial ROS content in the face of an increased ΔΨ. Proton transport associated with fatty acid (FA) translocation by ANT1 and with the activity of ATP-synthase have been identified as mechanisms responsible for partial dissipation of the ΔΨ [19,20].
ANT1, whose main function is to translocate ATP and ADP across the inner mitochondrial membrane, also allows a FA-dependent “proton leak” through the inner mitochondrial membrane [20,44]. ANT1 and ATP-synthase are both inhibited by CsA [19] and indeed a quantitatively marked increase of the ΔΨ occurs in CsA-treated LANCL1/2-overexpressing cells, further increasing their already high gradient (Figure 1E). This conspicuous CsA-sensitive proton leak in LANCL1/2-overexpressing cells (Figure 1E) may play a role in “easing” the work of the proton pumps of the respiratory chain. Indeed, overexpressing cells show a significantly higher FA-dependent percentage of proton leak and of maximal OCR than double-silenced cells, while the percentage of FA-dependent ATP-linked OCR is similar in the two cell types (Figure 1D), suggesting that the primary function of FA mitochondrial utilization in overexpressing cells is not to produce ATP. Beside ANT1, transcription of UCP1 and UCP3 is also significantly increased in overexpressing compared with double-silenced cells (approx. 7 and 8- times higher), likely indicating a role also for these proton leakers in the higher oxphos efficiency in overexpressing vs. silenced cells.
Mechanisms allowing an unconstrained and regular flow of electrons from NADH (and FADH2) to oxygen as the terminal electron acceptor (TEA) are also important to prevent ROS production during electron transfer at the RC, since they all can become sites of ROS production through retrograde electron transport, typically under limited oxygen availability [45,46,47]; however, it is reasonable to assume that an increased oxidative metabolic rate may also “overflow” RC with electrons, exceeding their ability of electron transport and resulting in ROS generation. A mechanism “easing” electron flow through RC is availability of other TEAs that can prevent the retrograde electron transport from reduced respiratory complexes, reducing ROS production, while at the same time allowing coenzyme re-oxidation. Fumarate reduction to succinate has long been known as a mechanism capable of alleviating electron “overflow” at the succinate dehydrogenase-coenzyme Q site of the respiratory chain [48] and fumarate has recently been rediscovered as a TEA and an important means to allow complex I proton pumping under conditions of limited O2 availability [49]. By providing an electron “leak” from the respiratory chain, fumarate also prevents ROS production at the RCs while at the same time allowing some proton pumping to occur via complex I. Whether this mechanism of electron leak is more active in LANCL1/2-overexpressing vs. double-silenced cells remains to be investigated.
To sum up, both a proton “leak” from the intermembrane space and an electron “leak” from the respiratory chain flow are mechanisms of oxphos fine tuning, which can be activated in mitochondria to adapt to quantitative changes in the flow of charges in order to maximize energy production and limit ROS generation. The ABA/LANCL system, via ERRα, appears to take advantage of, or to regulate, some of these oxphos fine-tuning mechanisms, as it allows an increased mitochondrial respiration, proton gradient formation, ATP-dependent respiration to occur in H9c2 cardiomyocytes (Figure 1) in the face of a reduced ROS generation [Spinelli S. et al submitted]. Indeed, despite a 2-fold increase of the proton leak in overexpressing cells, the spare respiratory capacity of these cells is approximately twice that of double-silenced cells (Figure 1D).
The term “mitohormesis” is used to describe a complex and so far incompletely understood mitochondrial response to “stress”, such as oxygen deprivation, excess ROS production or nutrient deficiency [50]. Interestingly, several of the transcriptional and functional effects observed in LANCL1/2-overexpressing H9c2 fall within this concerted response. Mild oxphos uncoupling via increased transcription of several H+ transporters (UCP1, UCP3, ANT1, Figure 2A), leading to an increased proton leak (Figure 1D), increased mitokine production (FGF21, Figure 2A), exerting mitochondrial and nuclear autocrine and paracrine effects, are among the keynote features of mitohormesis. This multifaceted response is orchestrated through the activation of AMPK, PGC-1α and Sirt1, which is indeed the main signaling axis activated by the ABA/LANCL system, not only in H9c2 cardiomyocytes [5], but also in human brown adipocytes, where a similar increase of mitochondrial respiration rate and ΔΨ were observed in overexpressing cells [10]. The fact that several keynote mitochondrial responses typical of mitohormesis are among those activated by the ABA/LANCL system allows to hypothesize that this hormone/receptors system controls mitohormesis, whose function may not be limited to the response to mitochondrial “stress” conditions, such as hypoxia, but could more generally serve the purpose of optimizing mitochondrial function under conditions of changing oxygen availability, electron flow intensity and ATP requirement. Indeed, some of these mitochondrial adaptations to increased oxidative metabolism occur in the skeletal muscle and in the heart under conditions of physical exercise, arguably a “physiological” condition.
Several questions arise from the results described in this and in the previous reports [5 and Spinelli S. et al submitted].
Can we use ABA to activate the LANCL1/2-ERRα signaling pathway and improve cardiomyocyte function or resilience to stress conditions? Targeting the PGC-1α/Sirt1/ERRα axis has been proposed as a means to improve cardiomyocyte function in diabetic cardiomyopathy [39]; identification of the ABA/LANCL1-2 system as an essential part of the ERRα activating pathway may provide a new pharmacological agonist (ABA) and new molecular targets (the LANCL proteins) to this end.
Another open question regards the molecular signal that activates endogenous LANCL1/2 transcription in cardiomyocytes. NO may indeed be the first signal initiating the functional responses downstream of the LANCL1/2-ERRα signaling pathway, as it is normally produced by the beating heart and cardiac NO levels are affected by conditions of cardiomyocyte “stress” [51]. NO is apparently involved in a positive feedback mechanism linking eNOS transcription and activity to the expression levels of LANCL1/2 and ERRα. Thus, once activated, a reciprocal feed-forward mechanism maintains a transcriptional activation of LANCL1/2 and ERRα and NO generation in cardiomyocytes (Figure S2, supplementary data).
It is noteworthy that LANCL1/2 overexpression and ABA-treatment in H9c2 also significantly increase transcription of GPTCH [5-Spinelli 2022], the rate-limiting enzyme in the synthesis of TBH4, the coenzyme needed to prevent “uncoupling” of NOS, resulting in ROS instead of NO generation [52]. In addition, TBH4 also stimulates mitochondrial biogenesis and cardiac contractility via PGC-1α [53], possibly participating in the LANCL-ERRα-coordinated improvement of mitochondrial performance.
Supplementary Materials

The following supporting information can be downloaded at the website of this paper posted on Preprints.org, Figure S1: ERRα silencing in wild-type H9c2 reduces the mitochondrial proton gradient; Figure S2: What triggers ERRα and LANCL1/2 activation in the “stressed” heart? Table S1: Primer sequences used to amplify rat target genes. Table S2: Primary and secondary antibodies used for Western blot.

Author Contributions

Conceptualization, S.S., L.S. and E.Z.; validation, S.S., L.G., M.P., M.M. and V.C.; investigation, S.S., L.G., M.P. and M.M.; data curation, S.S.; writing—original draft preparation, S.S., L.S. and E.Z.; writing—review and editing, S.S., L.G., M.P., M.M., V.C., G.S., C.M., L.S., E.Z; visualization, S.S.; supervision, G.S., L.S. and E.Z.; funding acquisition, L.S. and E.Z. All authors have read and agreed to the published version of the manuscript.

Funding

This research was funded by the University of Genova FRA 2023 to LS and EZ.

Conflicts of Interest

“The authors declare no conflict of interest.”

References

  1. Magnone, M.; Sturla, L,; Guida, L.; Spinelli, S.; Begani, G.; Bruzzone, S.; Fresia, C.; Zocchi, E. Abscisic Acid: A Conserved Hormone in Plants and Humans and a Promising Aid to Combat Prediabetes and the Metabolic Syndrome. Nutrients 2020, 12(6):1724-1736. [CrossRef]
  2. Boycott, H.E.; Nguyen, M.N.; Vrellaku, B.; Gehmlich, K.; Robinson, P. Nitric Oxide and Mechano-Electrical Transduction in Cardiomyocytes. Front Physiol 2020, 11:606740. [CrossRef]
  3. Carlström, M. Nitric oxide signalling in kidney regulation and cardiometabolic health. Nat Rev Nephrol 2021, 17(9), 575-590. [CrossRef]
  4. Pisarenko, O.; Studneva, I. Modulating the Bioactivity of Nitric Oxide as a Therapeutic Strategy in Cardiac Surgery. J Surg Res 2021, 257, 178-188. [CrossRef]
  5. Spinelli, S.; Guida, L.; Vigliarolo, T.; Passalacqua, M.; Begani, G.; Magnone, M.; Sturla, L.; Benzi, A.; Ameri, P.; Lazzarini, E.; Bearzi, C.; Rizzi, R.; Zocchi, E. The ABA-LANCL1/2 Hormone-Receptors System Protects H9c2 Cardiomyocytes from Hypoxia-Induced Mitochondrial Injury via an AMPK- and NO-Mediated Mechanism. Cells 2022, 11(18):2888. [CrossRef]
  6. Ramjiawan, A.; Bagchi, R.A.; Blant, A.; Albak, L.; Cavasin, M.A.; Horn, T.R.; McKinsey, T.A.; Czubryt, M.P. Roles of histone deacetylation and AMP kinase in regulation of cardiomyocyte PGC-1α gene expression in hypoxia. Am J Physiol Cell Physiol 2013, 304(11):C1064-72. [CrossRef]
  7. Huss, J.M.; Kopp, R.P.; Kelly, D.P. Peroxisome proliferator-activated receptor coactivator-1alpha (PGC-1alpha) coactivates the cardiac-enriched nuclear receptors estrogen-related receptor-alpha and -gamma. Identification of novel leucine-rich interaction motif within PGC-1alpha. J Biol Chem 2002, 277(43):40265-74. [CrossRef]
  8. Oka, S.I.; Sreedevi, K.; Shankar, T.S.; Yedla, S.; Arowa, S.; James, A.; Stone, K.G.; Olmos, K.; Sabry, A.D.; Horiuchi, A.; Cawley, K.M.; O'very, S.A.; Tong, M.; Byun, J.; Xu, X.; Kashyap, S.; Mourad, Y.; Vehra, O.; Calder, D.; Lunde, T.; Liu, T.; Li, H.; Mashchek, J.A.; Cox, J.; Saijoh, Y.; Drakos, S.G.; Warren, J.S. PERM1 regulates energy metabolism in the heart via ERRα/PGC-1α axis. Front Cardiovasc Med 2022, 9, 1033457. [CrossRef]
  9. Spinelli S, Begani G, Guida L, Magnone M, Galante D, D'Arrigo C, Scotti C, Iamele L, De Jonge H, Zocchi E, Sturla L. LANCL1 binds abscisic acid and stimulates glucose transport and mitochondrial respiration in muscle cells via the AMPK/PGC-1α/Sirt1 pathway. Mol Metab 2021, 53, 101263. [CrossRef]
  10. Spinelli, S.; Cossu, V.; Passalacqua, M.; Hansen, J.B.; Guida, L.; Magnone, M.; Sambuceti, G.; Marini, C.; Sturla, L.; Zocchi, E. The ABA/LANCL1/2 Hormone/Receptor System Controls Adipocyte Browning and Energy Expenditure. Int J Mol Sci 2023, 24(4):3489. [CrossRef]
  11. Magnone, M.; Emionite, L.; Guida, L.; Vigliarolo, T.; Sturla, L.; Spinelli, S.; Buschiazzo, A.; Marini, C.; Sambuceti, G.; de Flora, A.; et al. Insulin-independent stimulation of skeletal muscle glucose uptake by low-dose abscisic acid via AMPK activation. Sci. Rep 2020, 10, 1454. [CrossRef]
  12. Chen, G.; Yang, Y.; Xu, C.; Gao, S. A Flow cytometry-based assay for measuring mitochondrial membrane potential in cardiac myocytes after hypoxia/reoxygenation. J Vis Exp 2018, 137, 57725. [CrossRef]
  13. Guida, L.; Franco, L.; Zocchi, E.; De Flora, A. Structural role of disulfide bridges in the cyclic ADP-ribose related bifunctional ectoenzyme CD38. FEBS Lett 1995, 368, 481–484. [CrossRef]
  14. Bradford, M.M. Rapid and sensitive method for quantitation of microgram quantities of protein utilizing principle of protein-dye binding. Anal. Biochem 1976, 72, 248–254. [CrossRef]
  15. Davidson, A.F.; Higgins, A.Z. Detection of volume changes in calcein-stained cells using confocal microscopy. J Fluoresc 2013, 23(3):393-8. [CrossRef]
  16. Dismuke, W.M.; Mbadugha, C.C.; Ellis, D.Z. NO-induced regulation of human trabecular meshwork cell volume and aqueous humor outflow facility involve the BKCa ion channel. Am J Physiol Cell Physiol 2008, 294(6):C1378-86. Am J Physiol Cell Physiol 2008, 294(6):C1378-86. [CrossRef]
  17. Kalkhoran, S.B.; Munro, P.; Qiao, F.; Ong, S.B.; Hall, A.R.; Cabrera-Fuentes, H.; Chakraborty, B.; Boisvert, W.A.; Yellon, D.M.; Hausenloy, D.J. Unique morphological characteristics of mitochondrial subtypes in the heart: the effect of ischemia and ischemic preconditioning. Discoveries (Craiova) 2017, 5(1):e71. [CrossRef]
  18. Westrate, L.M.; Drocco, J.A.; Martin, K.R.; Hlavacek, W.S.; MacKeigan, J.P. Mitochondrial morphological features are associated with fission and fusion events. PLoS One 2014, 9(4):e95265. [CrossRef]
  19. Carrer, A.; Tommasin, L.; Šileikytė, J.; Ciscato, F.; Filadi, R.; Urbani, A.; Forte, M.; Rasola, A.; Szabò, I.; Carraro, M.; Bernardi, P. Defining the molecular mechanisms of the mitochondrial permeability transition through genetic manipulation of F-ATP synthase. Nat Commun 2021, 10, 12(1):4835. [CrossRef]
  20. Kreiter, J.; Rupprecht, A.; Škulj, S.; Brkljača, Z.; Žuna, K.; Knyazev, D.G.; Bardakji, S.; Vazdar, M.; Pohl, E.E. ANT1 Activation and Inhibition Patterns Support the Fatty Acid Cycling Mechanism for Proton Transport. Int J Mol Sci 2021, 22(5):2490. [CrossRef]
  21. Tamamori-Adachi, M.; Ito, H.; Sumrejkanchanakij, P.; Adachi, S.; Hiroe, M.; Shimizu, M.; Kawauchi, J.; Sunamori, M.; Marumo, F.; Kitajima, S.; Ikeda, M.A. Critical Role of Cyclin D1 Nuclear Import in Cardiomyocyte Proliferation. Circ Res 2003, 10; 92(1):e12-9. [CrossRef]
  22. Pasumarthi, K.B.; Nakajima, H.; Nakajima, H.O.; Soonpaa, M.H.; Field, L.J. Targeted expression of cyclin D2 results in cardiomyocyte DNA synthesis and infarct regression in transgenic mice. Circ Res 2005, 96(1), 110-8. [CrossRef]
  23. Chaudhry, H.W.; Dashoush, N.H.; Tang, H.; Zhang, L.; Wang, X.; Wu, E.X.; Wolgemuth, D.J. Cyclin A2 Mediates Cardiomyocyte Mitosis in the Postmitotic Myocardium. J Biol Chem 2004, 279(34):35858-35866. [CrossRef]
  24. Shapiro, S.D.; Ranjan, A.K.; Kawase, Y.; Cheng, R.K.; Kara, R.J.; Bhattacharya, R.; Guzman-Martinez, G.; Sanz, J.; Garcia, M.J.; Chaudhry, H.W. Cyclin A2 induces cardiac regeneration after myocardial infarction through cytokinesis of adult cardiomyocytes. Sci Transl Med 2014, 6(224):224ra27. [CrossRef]
  25. Mohamed, T.M.A.; Ang, Y.S.; Radzinsky, E.; Zhou, P.; Huang, Y.; Elfenbein, A.; Foley, A.; Magnitsky, S.; Srivastava, D. Regulation of Cell Cycle to Stimulate Adult Cardiomyocyte Proliferation and Cardiac Regeneration. Cell 2018, 173(1):104-116.e12. [CrossRef]
  26. Hidayat, B.J.; Weisskopf, C.; Felby, C.; Johansen, K.S.; Thygesen, L.G. The binding of cellulase variants to dislocations: a semi-quantitative analysis based on CLSM (confocal laser scanning microscopy) images. AMB Express 2015, 5(1):76. [CrossRef]
  27. Huber, A.H.; Weis, W.I. The structure of the beta-catenin/E-cadherin complex and the molecular basis of diverse ligand recognition by beta-catenin. Cell 2001, 105(3):391-402. [CrossRef]
  28. Giepmans, B.N.; Verlaan, I.; Moolenaar, W.H. Connexin-43 interactions with ZO-1 and alpha- and beta-tubulin. Cell Commun Adhes 2001, 8(4-6):219-23. [CrossRef]
  29. Gu, M.; Wei, Z.; Wang, X.; Gao, Y.; Wang, D.; Liu, X.; Bai, C.; Su, G.; Yang, L.; Li, G. Myostatin Knockout Affects Mitochondrial Function by Inhibiting the AMPK/SIRT1/PGC1α Pathway in Skeletal Muscle. Int J Mol Sci 2022, 23(22), 13703. [CrossRef]
  30. Iwabu, M.; Okada-Iwabu, M.; Kadowaki, T.; Yamauchi, T. Elucidating exercise-induced skeletal muscle signaling pathways and applying relevant findings to preemptive therapy for lifestyle-related diseases. Endocr J 2022, 69(1), 1-8. [CrossRef]
  31. Yang, X.; Liu, Q.; Li, Y.; Tang, Q.; Wu, T.; Chen, L.; Pu, S.; Zhao, Y.; Zhang, G.; Huang, C.; Zhang, J.; Zhang, Z.; Huang, Y.; Zou, M.; Shi, X.; Jiang, W.; Wang, R.; He, J. The diabetes medication canagliflozin promotes mitochondrial remodelling of adipocyte via the AMPK-Sirt1-Pgc-1α signalling pathway. Adipocyte 2020, 9(1), 484-494. [CrossRef]
  32. Lee, G.H.; Peng, C.; Lee, H.Y.; Park, S.A.; Hoang, T.H.; Kim, J.H.; Sa, S.; Kim, G.E.; Han, J.S.; Chae, H.J. D-allulose ameliorates adiposity through the AMPK-SIRT1-PGC-1α pathway in HFD-induced SD rats. Food Nutr Res 2021, 65. [CrossRef]
  33. Chen, Y.; Huang, Q.; Feng, Y. Exercise improves cardiac function in the aged rats with myocardial infarction. Physiol Res 2023, 72(1), 27-35. [CrossRef]
  34. Tian, L.; Cao, W.; Yue, R.; Yuan, Y.; Guo, X.; Qin, D.; Xing, J.; Wang, X. Pretreatment with Tilianin improves mitochondrial energy metabolism and oxidative stress in rats with myocardial ischemia/reperfusion injury via AMPK/SIRT1/PGC-1 alpha signaling pathway. J Pharmacol Sci 2019, 139(4), 352-360. [CrossRef]
  35. Guo, Z.; Wang, M.; Ying, X.; Yuan, J.; Wang, C.; Zhang, W.; Tian, S.; Yan, X. Caloric restriction increases the resistance of aged heart to myocardial ischemia/reperfusion injury via modulating AMPK-SIRT1-PGC1a energy metabolism pathway. Sci Rep 2023, 13(1), 2045. [CrossRef]
  36. Sakamoto, T.; Matsuura, T.R.; Wan, S.; Ryba, D.M.; Kim, J.U.; Won, K.J.; Lai, L.; Petucci, C.; Petrenko, N.; Musunuru, K.; Vega, R.B.; Kelly, D.P. A Critical Role for Estrogen-Related Receptor Signaling in Cardiac Maturation. Circ Res 2020, 126, 1685-1702. [CrossRef]
  37. Huss, J.M.; Imahashi, K.; Dufour, C.R.; Weinheimer, C.J.; Courtois, M.; Kovacs, A.; Giguère, V.; Murphy, E.; Kelly, D.P. The nuclear receptor ERRalpha is required for the bioenergetic and functional adaptation to cardiac pressure overload. Cell Metab 2007, 6, 25-37. [CrossRef]
  38. Hu, X.; Xu, X.; Lu, Z.; Zhang, P.; Fassett, J.; Zhang, Y.; Xin, Y.; Hall, J.L.; Viollet, B.; Bache, R.J.; Huang, Y.; Chen, Y. AMP activated protein kinase-α2 regulates expression of estrogen-related receptor-α, a metabolic transcription factor related to heart failure development. Hypertension 2011, 58, 696-703. [CrossRef]
  39. Ma, S.; Feng, J.; Zhang, R.; Chen, J.; Han, D.; Li, X.; Yang, B.; Li, X.; Fan, M.; Li, C.; Tian, Z.; Wang, Y.; Cao, F. SIRT1 Activation by Resveratrol Alleviates Cardiac Dysfunction via Mitochondrial Regulation in Diabetic Cardiomyopathy Mice. Oxid Med Cell Longev 2017, 2017, 4602715. [CrossRef]
  40. Lu, Y.; Lu, X.; Wang, L.; Yang, W. Resveratrol attenuates high fat diet-induced mouse cardiomyopathy through upregulation of estrogen related receptor-α. Eur J Pharmacol 2019, 843, 88-95. [CrossRef]
  41. Huber, K.; Mestres-Arenas, A.; Fajas, L.; Leal-Esteban, L.C. The multifaceted role of cell cycle regulators in the coordination of growth and metabolism. FEBS J 2021, 288(12):3813-3833. [CrossRef]
  42. Wang, J.; Wang, Y.; Wong, C. Oestrogen-related receptor alpha inverse agonist XCT-790 arrests A549 lung cancer cell population growth by inducing mitochondrial reactive oxygen species production. Cell Prolif 2010, 43(2), 103-13. [CrossRef]
  43. Cadenas, S. Mitochondrial uncoupling, ROS generation and cardioprotection. Biochim Biophys Acta Bioenerg 2018, 1859(9):940-950. [CrossRef]
  44. Karch, J.; Bround, M.J.; Khalil, H.; Sargent, M.A.; Latchman, N.; Terada, N.; Peixoto, P.M.; Molkentin, J.D.Inhibition of mitochondrial permeability transition by deletion of the ANT family and CypD. Sci Adv 2019, 5(8), eaaw4597. [CrossRef]
  45. Scialò, F.; Fernández-Ayala, D.J.; Sanz, A. Role of Mitochondrial Reverse Electron Transport in ROS Signaling: Potential Roles in Health and Disease. Front Physiol 2017, 8, 428. [CrossRef]
  46. Ramírez-Camacho, I.; Flores-Herrera, O.; Zazueta, C. The relevance of the supramolecular arrangements of the respiratory chain complexes in human diseases and aging. Mitochondrion 2019, 47, 266-272. [CrossRef]
  47. Ramzan, R.; Vogt, S.; Kadenbach, B. Stress-mediated generation of deleterious ROS in healthy individuals - role of cytochrome c oxidase. J Mol Med (Berl) 2020, 98(5):651-657. [CrossRef]
  48. Kröger, A. Fumarate as terminal acceptor of phosphorylative electron transport. Biochim Biophys Acta 1978, 505(2), 129-45. [CrossRef]
  49. Spinelli, J.B.; Rosen, P.C.; Sprenger, H.G.; Puszynska, A.M.; Mann, J.L.; Roessler, J.M.; Cangelosi, A.L.; Henne, A.; Condon, K.J.; Zhang, T.; Kunchok, T.; Lewis, C.A.; Chandel, N.S.; Sabatini, D.M. Fumarate is a terminal electron acceptor in the mammalian electron transport chain. Science 2021, 374(6572), 1227-1237. [CrossRef]
  50. Klaus, S. and Ost, M. Mitochondrial uncoupling and longevity – A role for mitokines? Exp Gerontol 2020, 130, 110796. [CrossRef]
  51. Ghasemi, A.; Jeddi, S. Quantitative aspects of nitric oxide production in the heart. Mol Biol Rep 2022, 49(11):11113-11122. [CrossRef]
  52. Alkaitis, M.S.; Crabtree, M.J. Recoupling the cardiac nitric oxide synthases: tetrahydrobiopterin synthesis and recycling. Curr Heart Fail Rep 2012, 9(3), 200-10. [CrossRef]
  53. Kim, H.K.; Jeon, J.; Song, I.S.; Heo, H.J.; Jeong, S.H.; Long, L.T.; Thu, V.T.; Ko, T.H.; Kim, M.; Kim, N.; Lee, S.R.; Yang, J.S.; Kang, M.S.; Ahn, J.M.; Cho, J.Y.; Ko, K.S.; Rhee, B.D.; Nilius, B.; Ha, N.C.; Shimizu, I.; Minamino, T.; Cho, K.I.; Park, Y.S., Kim, S.; Han, J. Tetrahydrobiopterin enhances mitochondrial biogenesis and cardiac contractility via stimulation of PGC1α signaling. Biochim Biophys Acta Mol Basis Dis 2019, 1, 1865(11):165524. [CrossRef]
  54. Lee, S.R.; Nilius, B.; Han, J. Gaseous Signaling Molecules in Cardiovascular Function: From Mechanisms to Clinical Translation. Rev Physiol Biochem Pharmacol 2018, 174, 81-156. [CrossRef]
  55. Boycott, H.E.; Nguyen, M.N.; Vrellaku, B.; Gehmlich, K.; Robinson, P. Nitric Oxide and Mechano-Electrical Transduction in Cardiomyocytes. Front Physiol 2020, 11, 606740. [CrossRef]
  56. Sakamuri, S.S.V.P.; Sperling, J.A.; Evans, W.R.; Dholakia, M.H.; Albuck, A.L.; Sure, V.N.; Satou, R.; Mostany, R.; Katakam, P.V.G. Nitric oxide synthase inhibitors negatively regulate respiration in isolated rodent cardiac and brain mitochondria. Am J Physiol Heart Circ Physiol 2020, 318, H295–H300. [CrossRef]
  57. Sumi, D.; Ignarro, L.J. Estrogen-related receptor alpha 1 up-regulates endothelial nitric oxide synthase expression. Proc Natl Acad Sci USA 2003, 100(24), 14451-6. [CrossRef]
  58. Vigliarolo, T.; Guida, L.; Millo, E.; Fresia, C.; Turco, E.; de Flora, A.; Zocchi, E. Abscisic acid transport in human erythrocytes. J Biol Chem 2015, 290, 13042–13052. [CrossRef]
Figure 1. LANCL1/2 overexpression increases and their double-silencing reduces mitochondrial proton gradient and respiration in H9c2 cardiomyocytes. LANCL1 and LANCL2 proteins were stably silenced (A) or overexpressed (B) in H9c2 rat cardiomyocytes by viral infection. (A) Left panels, representative Western blots of LANCL1/2 proteins in cells silenced for both LANCL1 and LANCL2 (SHL1+2); central panel, densitometric quantitation of the LANCL proteins relative to control cells, transfected with the vector containing scrambled silencing sequences (SCR); right panel, LANCL1/2 mRNA levels in LANCL1/2-silenced cells relative to SCR. Values are normalized against vinculin, as housekeeping protein. **p<0.01 relative to SCR control cells by unpaired t-test. Data shown are the mean ± SD of 3 experiments per group, with each value calculated in triplicate. (B) Left panels, representative Western blots of LANCL1/2 proteins in cells overexpressing both LANCL1 and LANCL2 (OVL1+2); right panel, densitometric quantitation of the LANCL proteins relative to control cells, transfected with the empty vector (PLV). Values are normalized against vinculin, as housekeeping protein. **p<0.01 and ***p<0.005 relative to PLV control cells by unpaired t-test. Data shown are the mean ± SD of 3 experiments per group, with each value calculated in triplicate. The mitochondrial number was evaluated by MitoTracker analysis in OVL1+2 and SHL1+2 cells. (C) Left panels, representative confocal microscopy images of overexpressing and silenced cardiomyocytes; the mean number of mitochondria per cell was calculated by counting mitochondria in approx. 50 cells per type; right panels, morphological parameters of circularity and solidity in the same cells. The mean ± SD of the relative mitochondrial fluorescence was always calculated in at least 4 microscopic fields (scale bar: 20µm). *p<0.05 and **p<0.01 relative to SHL1+2 cells by unpaired t-test. Respiration measurements were performed using the Seahorse XFp Analyzer, with the sequential addition of oligomycin, FCCP and rotenone/antimycin A. (D) Oxygen consumption rates (OCR, upper left panel), extracellular acidification rate (ECAR, upper right panel), OCR/ECAR ratio (lower left panel) and the percentage of the OCR dependent on fatty acid oxidation (lower right panel) were measured in SHL1+2 and OVL1+2 cells. *p<0.05, **p<0.01 and ***p<0.005 relative to SHL1+2 cells (untreated for upper panels and lower left panel or treated with Palm-BSA+Etomoxir for lower right panel) by unpaired t-test. Data shown are the mean ± SD of 4 experiments per group, with each value calculated in triplicate. Cardiomyocytes were loaded with the ∆Ψ-sensitive ratiometric fluorescent dye JC-1 and cultured with or without 4 µM CsA for 2 hours. (E) Left panel, representative confocal microscopy images; right panel, red/green fluorescence ratio calculated in at least 4 microscopic fields (scale bar: 20µm) for each experiment. **p<0.01 and ***p<0.005 relative to SHL1+2 cells by unpaired t-test.
Preprints 81188 g001
Figure 4. Effect of LANCL1/2-overexpression or -silencing on cardiomyocyte structural proteins. (A) qPCR analysis of the transcription of cytoskeletal and contractile proteins (ACTC1, TUBB2A, CTNNB1, MYH7 and CX43) on H9c2 cardiomyocytes overexpressing or silenced for the expression of LANCL1 and LANCL2 proteins and incubated in the absence or in the presence of 100 nM ABA for 4 hours. Results are expressed relative to control cells (PLV or SCR). *p<0.05 relative to the respective control untreated cells (PLV or SCR) and **p<0.01 relative to OVL1+2 cells by unpaired t-test. Data shown are the mean ± SD of 3 experiments per group, with each value calculated in triplicate. (B) Representative confocal microscopy images taken in at least 3 microscopic fields (scale bar: 20µm) of the same proteins analyzed in (A) in OVL1+2 and SHL1+2 H9c2 cardiomyocytes.
Preprints 81188 g004
Disclaimer/Publisher’s Note: The statements, opinions and data contained in all publications are solely those of the individual author(s) and contributor(s) and not of MDPI and/or the editor(s). MDPI and/or the editor(s) disclaim responsibility for any injury to people or property resulting from any ideas, methods, instructions or products referred to in the content.
Copyright: This open access article is published under a Creative Commons CC BY 4.0 license, which permit the free download, distribution, and reuse, provided that the author and preprint are cited in any reuse.
Prerpints.org logo

Preprints.org is a free preprint server supported by MDPI in Basel, Switzerland.

Subscribe

© 2024 MDPI (Basel, Switzerland) unless otherwise stated