Submitted:
03 August 2023
Posted:
04 August 2023
You are already at the latest version
Abstract
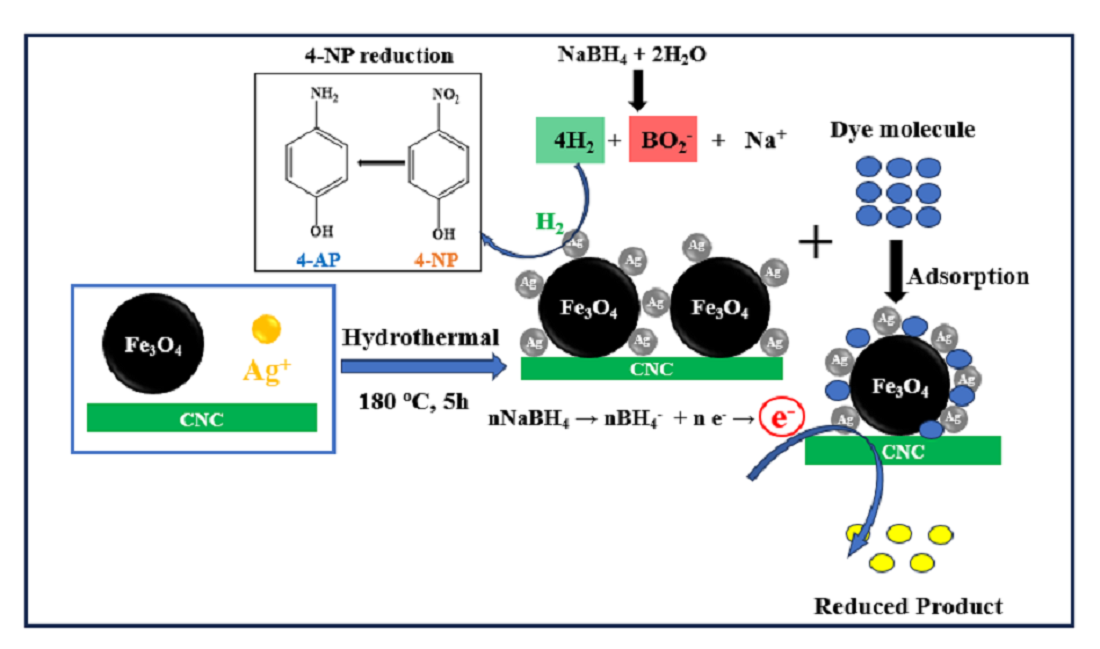
Keywords:
1. Introduction
2. Materials and Methods
2.1. Materials
2.2. Isolation of Cellulose from Coconut Fiber and Hydrolysis to Generate CNC
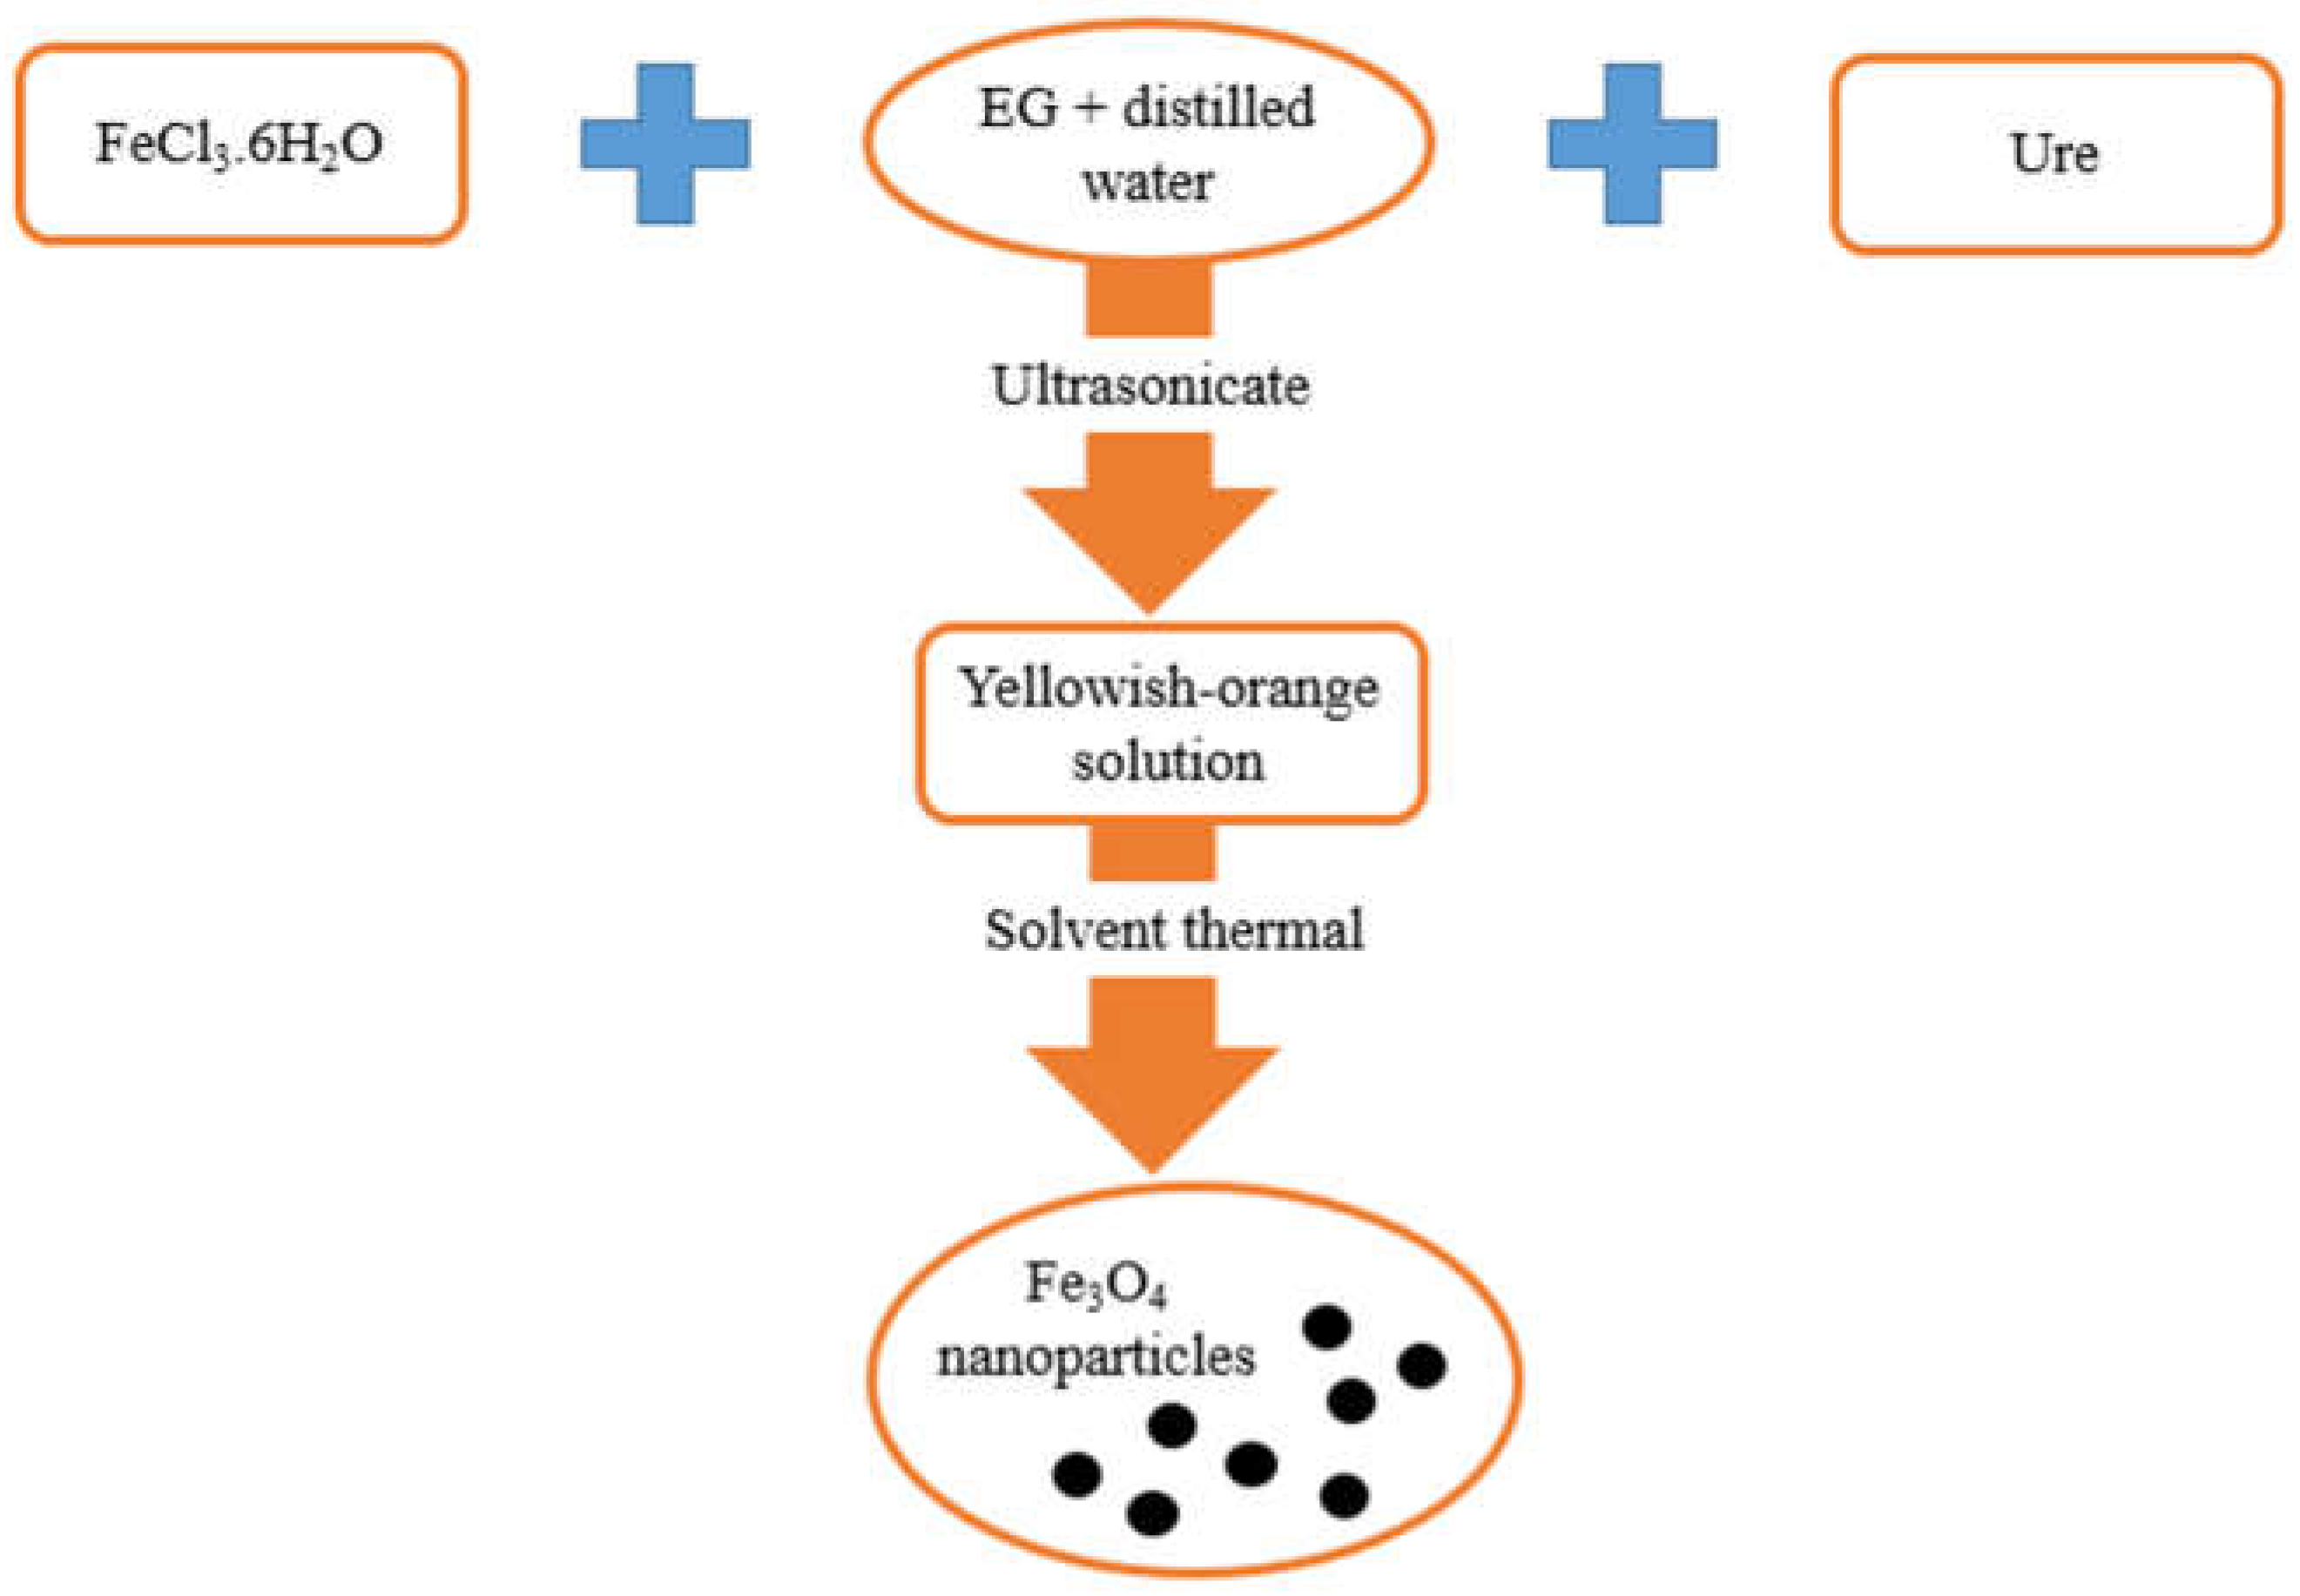
2.3. Preparation of Fe3O4 Nanoparticles by Solvothermal Method
2.4. Preparation of Ag/Fe3O4/CNC Nanocomposite by Hydrothermal Method
2.5. Characterization
2.6. Catalytic Study
2.6.1. Catalytic Reduction of 4-NP
2.6.2. Catalytic Reduction of MO and MB Dyes
3. Results and Discussion
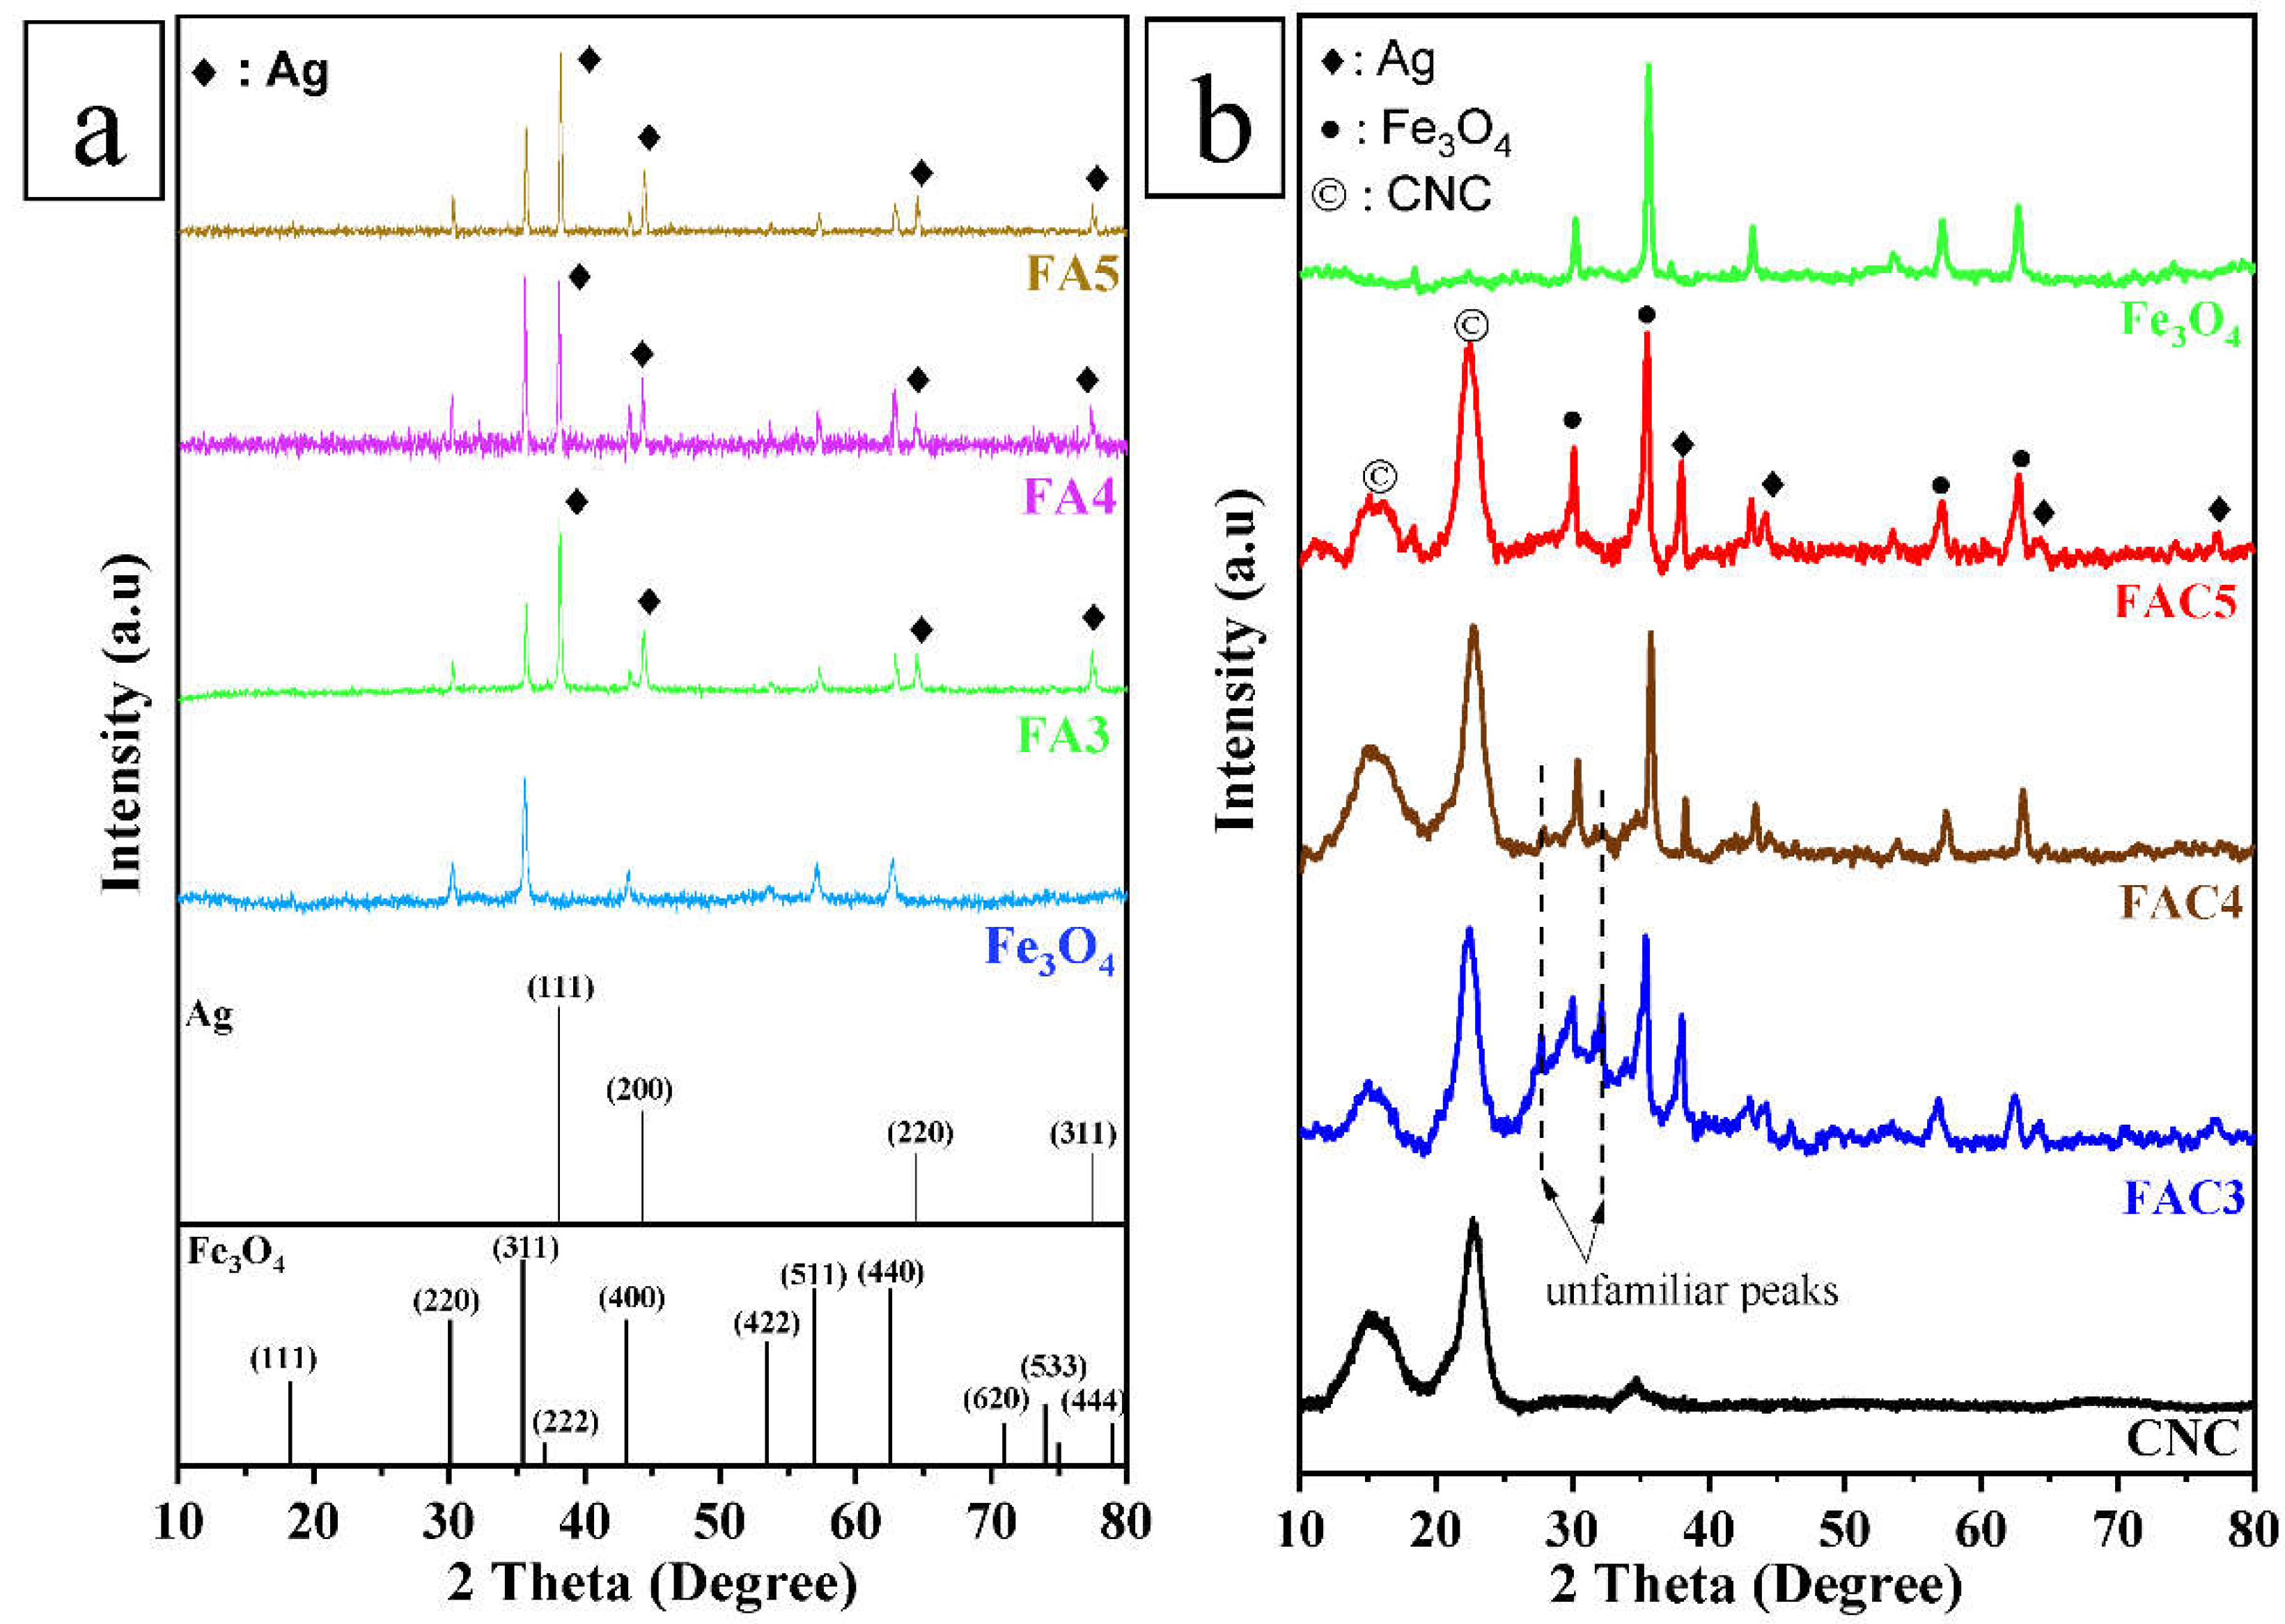
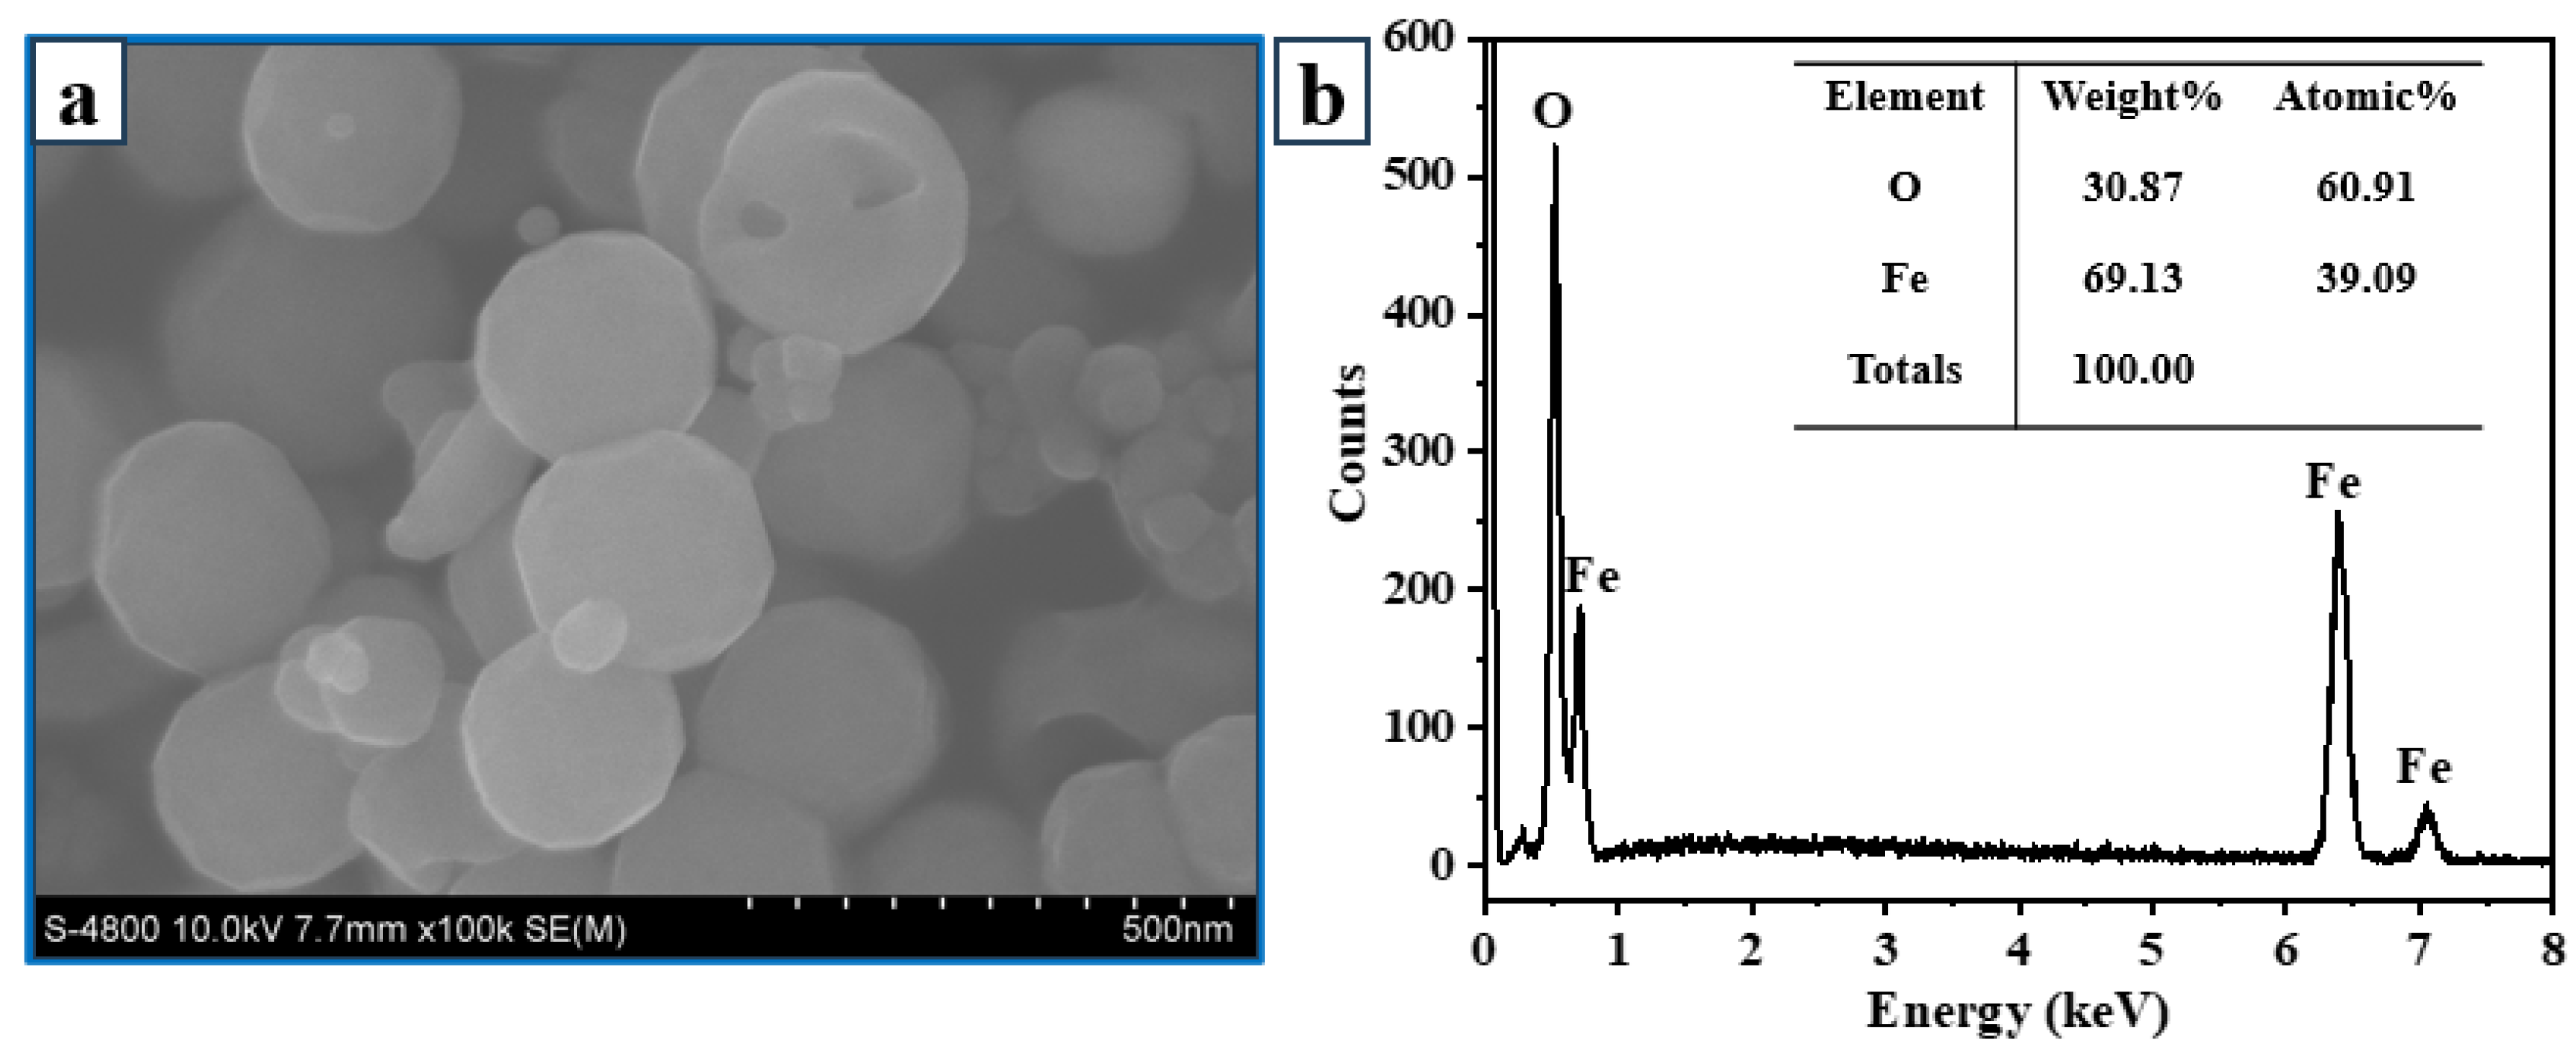
3.1. Characterization
3.2. Catalytic Reduction of 4-NP
3.3. Removal of MO and MB via Adsorption Process and Catalytic Reduction
4. Conclusions
Author Contributions
Data Availability Statement
Acknowledgment
Conflicts of Interest
References
- Zhang, H.; Chen, D.; Lv, X.; Wang, Y.; Chang, H.; Li, J. Energy-Efficient Photodegradation of Azo Dyes with TiO2 Nanoparticles Based on Photoisomerization and Alternate UV−Visible Light. Environ. Sci. Technol. 2010, 44, 1107–1111. [Google Scholar] [CrossRef] [PubMed]
- Mou, F.; Guan, J.; Ma, H.; Xu, L.; Shi, W. Magnetic Iron Oxide Chestnutlike Hierarchical Nanostructures: Preparation and Their Excellent Arsenic Removal Capabilities. ACS Appl. Mater. Interfaces 2012, 4, 3987–3993. [Google Scholar] [CrossRef] [PubMed]
- Ma, Y.; Wu, X.; Zhang, G. Core-shell Ag@Pt nanoparticles supported on sepiolite nanofibers for the catalytic reduction of nitrophenols in water: Enhanced catalytic performance and DFT study. Appl. Catal. B: Environ. 2017, 205, 262–270. [Google Scholar] [CrossRef]
- Hai, F.I.; Yamamoto, K.; Fukushi, K. Hybrid Treatment Systems for Dye Wastewater. Crit. Rev. Environ. Sci. Technol. 2007, 37, 315–377. [Google Scholar] [CrossRef]
- Martínez-Huitle, C.A.; Brillas, E. Decontamination of wastewaters containing synthetic organic dyes by electrochemical methods: A general review. Appl. Catal. B: Environ. 2009, 87, 105–145. [Google Scholar] [CrossRef]
- Gupta, A.K.; Pal, A.; Sahoo, C. Photocatalytic degradation of a mixture of Crystal Violet (Basic Violet 3) and Methyl Red dye in aqueous suspensions using Ag+ doped TiO2. Dye. Pigment. 2006, 69, 224–232. [Google Scholar] [CrossRef]
- Yang, J.; Pan, B.; Li, H.; Liao, S.; Zhang, D.; Wu, M.; Xing, B. Degradation of p-Nitrophenol on Biochars: Role of Persistent Free Radicals. Environ. Sci. Technol. 2016, 50, 694–700. [Google Scholar] [CrossRef]
- Yi, S.; Zhuang, W.-Q.; Wu, B.; Tay, S.T.-L.; Tay, J.-H. Biodegradation of p-Nitrophenol by Aerobic Granules in a Sequencing Batch Reactor. Environ. Sci. Technol. 2006, 40, 2396–2401. [Google Scholar] [CrossRef]
- Shen, J.; Xu, X.; Jiang, X.; Hua, C.; Zhang, L.; Sun, X.; Li, J.; Mu, Y.; Wang, L. Coupling of a bioelectrochemical system for p-nitrophenol removal in an upflow anaerobic sludge blanket reactor. Water Res. 2014, 67, 11–18. [Google Scholar] [CrossRef]
- Deka, P.; Deka, R.C.; Bharali, P. In situ generated copper nanoparticle catalyzed reduction of 4-nitrophenol. New J. Chem. 2014, 38, 1789–1793. [Google Scholar] [CrossRef]
- Liu, H.; Bi, Z.; Sun, X.-G.; Unocic, R.R.; Paranthaman, M.P.; Dai, S.; Brown, G.M. Mesoporous TiO2–B Microspheres with Superior Rate Performance for Lithium Ion Batteries. Adv. Mater. 2011, 23, 3450–3454. [Google Scholar] [CrossRef]
- Chang, J.; Sun, J.; Xu, C.; Xu, H.; Gao, L. Template-free approach to synthesize hierarchical porous nickel cobalt oxides for supercapacitors. Nanoscale 2012, 4, 6786–6791. [Google Scholar] [CrossRef]
- He, K.; Chen, G.; Zeng, G.; Chen, A.; Huang, Z.; Shi, J.; Huang, T.; Peng, M.; Hu, L. Three-dimensional graphene supported catalysts for organic dyes degradation. Appl. Catal. B: Environ. 2018, 228, 19–28. [Google Scholar] [CrossRef]
- Astruc, D.; Lu, F.; Aranzaes, J.R. Nanoparticles as Recyclable Catalysts: The Frontier between Homogeneous and Heterogeneous Catalysis. Angew. Chem. Int. Ed. 2005, 44, 7852–7872. [Google Scholar] [CrossRef]
- Ji, T.; Chen, L.; Schmitz, M.; Bao, F.S.; Zhu, J. Hierarchical macrotube/mesopore carbon decorated with mono-dispersed Ag nanoparticles as a highly active catalyst. Green Chem. 2015, 17, 2515–2523. [Google Scholar] [CrossRef]
- Huang, Z.; Zeng, Z.; Chen, A.; Zeng, G.; Xiao, R.; Xu, P.; He, K.; Song, Z.; Hu, L.; Peng, M.; Huang, T.; Chen, G. Differential behaviors of silver nanoparticles and silver ions towards cysteine: Bioremediation and toxicity to Phanerochaete chrysosporium. Chemosphere 2018, 203, 199–208. [Google Scholar] [CrossRef]
- He, J.; Ji, W.; Yao, L.; Wang, Y.; Khezri, B.; Webster, R.D.; Chen, H. Strategy for Nano-Catalysis in a Fixed-Bed System. Adv. Mater. 2014, 26, 4151–4155. [Google Scholar] [CrossRef]
- Dai, Y.; Zheng, W.; Li, X.; Chen, B.; Wang, L.; He, G. Highly active catalysis–membrane system: Enhanced recyclability, durability and longevity properties for H2 generation. Chem. Eng. J. 2016, 293, 252–258. [Google Scholar] [CrossRef]
- Warner, C.L.; Addleman, R.S.; Cinson, A.D.; Droubay, T.C.; Engelhard, M.H.; Nash, M.A.; Yantasee, W.; Warner, M.G. High-Performance, Superparamagnetic, nanoparticle-based heavy metal sorbents for removal of contaminants from natural waters. ChemSusChem 2010, 3, 749–757. [Google Scholar] [CrossRef]
- Liu, Y.; Chen, J.-F.; Bao, J.; Zhang, Y. Manganese-Modified Fe3O4 Microsphere Catalyst with Effective Active Phase of Forming Light Olefins from Syngas. ACS Catal. 2015, 5, 3905–3909. [Google Scholar] [CrossRef]
- Das, R.; Sypu, V.S.; Paumo, H.K.; Bhaumik, M.; Maharaj, V.; Maity, A. Silver decorated magnetic nanocomposite (Fe3O4@PPy-MAA/Ag) as highly active catalyst towards reduction of 4-nitrophenol and toxic organic dyes. Appl. Catal. B: Environ. 2019, 244, 546–558. [Google Scholar] [CrossRef]
- Liu, Y.; Zhang, Y.; Kou, Q.; Wang, D.; Han, D.; Lu, Z.; Chen, Y.; Chen, L.; Wang, Y.; Zhang, Y. Fe3O4/Au binary nanocrystals: Facile synthesis with diverse structure evolution and highly efficient catalytic reduction with cyclability characteristics in 4-nitrophenol. Powder Technol. 2018, 338, 26–35. [Google Scholar] [CrossRef]
- Yılmaz Baran, N.; Baran, T.; Menteş, A. Production of novel palladium nanocatalyst stabilized with sustainable chitosan/cellulose composite and its catalytic performance in Suzuki-Miyaura coupling reactions. Carbohydr Polym 2018, 181, 596–604. [Google Scholar] [CrossRef] [PubMed]
- Wang, G.; Chen, Y.; Xu, G.; Pei, Y. Effective removing of methylene blue from aqueous solution by tannins immobilized on cellulose microfibers. Int J Biol Macromol 2019, 129, 198–206. [Google Scholar] [CrossRef] [PubMed]
- Ibnu Abdulwahab, M.; Khamkeaw, A.; Jongsomjit, B.; Phisalaphong, M. Bacterial Cellulose Supported Alumina Catalyst for Ethanol Dehydration. Catal. Lett. 2017, 147, 2462–2472. [Google Scholar] [CrossRef]
- Rodrigues, D.M.; Hunter, L.G.; Bernard, F.L.; Rojas, M.F.; Vecchia, F.D.; Einloft, S. Harnessing CO2 into Carbonates Using Heterogeneous Waste Derivative Cellulose-Based Poly(ionic liquids) as Catalysts. Catal. Lett. 2018, 149, 733–743. [Google Scholar] [CrossRef]
- Peng, S.; Gao, F.; Zeng, D.; Peng, C.; Chen, Y.; Li, M. Synthesis of Ag–Fe3O4 nanoparticles supported on polydopamine-functionalized porous cellulose acetate microspheres: catalytic and antibacterial applications. Cellulose 2018, 25, 4771–4782. [Google Scholar] [CrossRef]
- Guo, L.; Duan, B.; Zhang, L. Construction of controllable size silver nanoparticles immobilized on nanofibers of chitin microspheres via green pathway. Nano Res. 2016, 9, 2149–2161. [Google Scholar] [CrossRef]
- Maleki, A.; Movahed, H.; Ravaghi, P. Magnetic cellulose/Ag as a novel eco-friendly nanobiocomposite to catalyze synthesis of chromene-linked nicotinonitriles. Carbohydr. Polym. 2016, 156. [Google Scholar] [CrossRef]
- Shojaei, S.; Ghasemi, Z.; Shahrisa, A. Cu(I)@Fe3O4 nanoparticles supported on imidazolium-based ionic liquid-grafted cellulose: Green and efficient nanocatalyst for multicomponent synthesis of N-sulfonylamidines and N-sulfonylacrylamidines. Appl. Organomet. Chem. 2017, 31, e3788. [Google Scholar] [CrossRef]
- Pei, Y.; Zhao, J.; Shi, R.; Wang, X.; Li, Z.; Ren, J. Hierarchical Porous Carbon-Supported Copper Nanoparticles as an Efficient Catalyst for the Dimethyl Carbonate Synthesis. Catal. Lett. 2019, 149, 3184–3193. [Google Scholar] [CrossRef]
- Karami, S.; Zeynizadeh, B.; Shokri, Z. Cellulose supported bimetallic F… Cu nanoparticles: a magnetically recoverable nanocatalyst for quick reduction of nitroarenes to amines in water. Cellulose 2018, 25, 3295–3305. [Google Scholar] [CrossRef]
- Cai, J.; Liu, Y.; Zhang, L. Dilute solution properties of cellulose in LiOH/urea aqueous system. J. Polym. Sci. Part B: Polym. Phys. 2006, 44, 3093–3101. [Google Scholar] [CrossRef]
- Wang, G. Selective hydrothermal degradation of cellulose to formic acid in alkaline solutions. Cellulose 2018, 25, 5659–5668. [Google Scholar] [CrossRef]
- Luo, X.; Liu, S.; Zhou, J.; Zhang, L. In situ synthesis of Fe3O4/cellulose microspheres with magnetic-induced protein delivery. J. Mater. Chem. 2009, 19, 3538–3545. [Google Scholar] [CrossRef]
- Nang An, V.; Chi Nhan, H.T.; Tap, T.D.; Van, T.T.T.; Van Viet, P.; Van Hieu, L. Extraction of High Crystalline Nanocellulose from Biorenewable Sources of Vietnamese Agricultural Wastes. J. Polym. Environ. 2020, 28, 1465–1474. [Google Scholar] [CrossRef]
- Xing, Y.; Jin, Y.-Y.; Si, J.-C.; Peng, M.-L.; Wang, X.-F.; Chen, C.; Cui, Y.-L. Controllable synthesis and characterization of Fe3O4/Au composite nanoparticles. J. Magn. Magn. Mater. 2015, 380, 150–156. [Google Scholar] [CrossRef]
- Xing, Y.; Gao, Q.; Zhang, Y.; Ma, L.; Loh, K.Y.; Peng, M.; Chen, C.; Cui, Y. The improved sensitive detection of C-reactive protein based on the chemiluminescence immunoassay by employing monodispersed PAA-Au/Fe3O4 nanoparticles and zwitterionic glycerophosphoryl choline. J. Mater. Chem. B 2017, 5, 3919–3926. [Google Scholar] [CrossRef]
- Xiong, R.; Lu, C.; Wang, Y.; Zhou, Z.; Zhang, X. Nanofibrillated cellulose as the support and reductant for the facile synthesis of Fe3O4/Ag nanocomposites with catalytic and antibacterial activity. J. Mater. Chem. A 2013, 1, 14910–14918. [Google Scholar] [CrossRef]
- Khan, F.S.A.; Mubarak, N.M.; Khalid, M.; Walvekar, R.; Abdullah, E.C.; Mazari, S.A.; Nizamuddin, S.; Karri, R.R. Magnetic nanoadsorbents’ potential route for heavy metals removal—A review. Environ. Sci. Pollut. Res. 2020, 27, 24342–24356. [Google Scholar] [CrossRef]
- Wang, G.; Li, F.; Li, L.; Zhao, J.; Ruan, X.; Ding, W.; Cai, J.; Lu, A.; Pei, Y. In Situ Synthesis of Ag–Fe3O4 Nanoparticles Immobilized on Pure Cellulose Microspheres as Recyclable and Biodegradable Catalysts. ACS Omega 2020, 5, 8839–8846. [Google Scholar] [CrossRef] [PubMed]
- Babu, A.T.; Sebastian, M.; Manaf, O.; Antony, R. Heterostructured Nanocomposites of Ag Doped Fe3O4 Embedded in ZnO for Antibacterial Applications and Catalytic Conversion of Hazardous Wastes. J. Inorg. Organomet. Polym. Mater. 2019. [Google Scholar] [CrossRef]
- Alvarez, V.A.; Vázquez, A. Thermal degradation of cellulose derivatives/starch blends and sisal fibre biocomposites. Polym. Degrad. Stab. 2004, 84, 13–21. [Google Scholar] [CrossRef]
- Kargarzadeh, H.; Ishak, b.; Ahmad, I.; Abdullah, I.; Dufresne, A.; Siti, b.; Zainudin, Y.; Rasha, B.; Sheltami, M. Effects of hydrolysis conditions on the morphology, crystallinity, and thermal stability of cellulose nanocrystals extracted from kenaf bast fibers. Cellulose 2012, 19, 855–866. [Google Scholar] [CrossRef]
- Choi, Y.; Bae, H.S.; Seo, E.; Jang, S.; Park, K.H.; Kim, B.-S. Hybrid gold nanoparticle-reduced graphene oxide nanosheets as active catalysts for highly efficient reduction of nitroarenes. J. Mater. Chem. 2011, 21, 15431–15436. [Google Scholar] [CrossRef]
- Veerakumar, P.; Chen, S.-M.; Madhu, R.; Veeramani, V.; Hung, C.-T.; Liu, S.-B. Nickel Nanoparticle-Decorated Porous Carbons for Highly Active Catalytic Reduction of Organic Dyes and Sensitive Detection of Hg(II) Ions. ACS Appl. Mater. Interfaces 2015, 7, 24810–24821. [Google Scholar] [CrossRef]
- Mignani, A.; Fazzini, S.; Ballarin, B.; Boanini, E.; Cassani, M.C.; Maccato, C.; Barreca, D.; Nanni, D. Mild fabrication of silica-silver nanocomposites as active platforms for environmental remediation. RSC Adv. 2015, 5, 9600–9606. [Google Scholar] [CrossRef]
- Hu, B.; Zhao, Y.; Zhu, H.-Z.; Yu, S.-H. Selective Chromogenic Detection of Thiol-Containing Biomolecules Using Carbonaceous Nanospheres Loaded with Silver Nanoparticles as Carrier. ACS Nano 2011, 5, 3166–3171. [Google Scholar] [CrossRef]
- Rajesh, R.; Kumar, S.S.; Venkatesan, R. Efficient degradation of azo dyes using Ag and Au nanoparticles stabilized on graphene oxide functionalized with PAMAM dendrimers. New J. Chem. 2014, 38, 1551–1558. [Google Scholar] [CrossRef]
- Carregal-Romero, S.; Pérez-Juste, J.; Hervés, P.; Liz-Marzán, L.M.; Mulvaney, P. Colloidal Gold-Catalyzed Reduction of Ferrocyanate (III) by Borohydride Ions: A Model System for Redox Catalysis. Langmuir 2010, 26, 1271–1277. [Google Scholar] [CrossRef]
- Chishti, A.N.; Ma, Z.; Zha, J.; Ahmad, M.; Wang, P.; Gautam, J.; Chen, M.; Ni, L.; Diao, G. Preparation of novel magnetic noble metals supramolecular composite for the reduction of organic dyes and nitro aromatics. Chin. Chem. Lett. 2023, 34, 108122. [Google Scholar] [CrossRef]
- Singh, S.; Sharma, S.; Manhas, U.; Qadir, I.; Atri, A.K.; Singh, D. Different Fuel-Adopted Combustion Syntheses of Nano-Structured NiCrFeO4: A Highly Recyclable and Versatile Catalyst for Reduction of Nitroarenes at Room Temperature and Photocatalytic Degradation of Various Organic Dyes in Unitary and Ternary Solutions. ACS Omega 2022, 7, 19853–19871. [Google Scholar] [CrossRef] [PubMed]
- Mallick, K.; Witcomb, M.; Scurrell, M. Silver nanoparticle catalysed redox reaction: An electron relay effect. Mater. Chem. Phys. 2006, 97, 283–287. [Google Scholar] [CrossRef]
- Nautiyal, A.; Shukla, S.R. Silver nanoparticles catalyzed reductive decolorization of spent dye bath containing acid dye and its reuse in dyeing. J. Water Process Eng. 2018, 22, 276–285. [Google Scholar] [CrossRef]
- He, L.; Zhou, Z.; Liu, Z.; Nan, X.; Wang, T.; Sun, X.; Bai, P. Morphology design and synthesis of magnetic microspheres as highly efficient reusable catalyst for organic dyes. Colloids Surf. A: Physicochem. Eng. Asp. 2023, 656, 130542. [Google Scholar] [CrossRef]
- Hunge, Y.M.; Yadav, A.A.; Kang, S.-W.; Kim, H. Facile synthesis of multitasking composite of Silver nanoparticle with Zinc oxide for 4-nitrophenol reduction, photocatalytic hydrogen production, and 4-chlorophenol degradation. J. Alloys Compd. 2022, 928, 167133. [Google Scholar] [CrossRef]
- Pande, S.; Jana, S.; Basu, S.; Sinha, A.K.; Datta, A.; Pal, T. Nanoparticle-Catalyzed Clock Reaction. J. Phys. Chem. C 2008, 112, 3619–3626. [Google Scholar] [CrossRef]
- Jia, Z.; Sun, H.; Du, Z.; Lei, Z. Catalytic bubble-free hydrogenation reduction of azo dye by porous membranes loaded with palladium nanoparticles. J. Environ. Sci. 2014, 26, 478–482. [Google Scholar] [CrossRef]
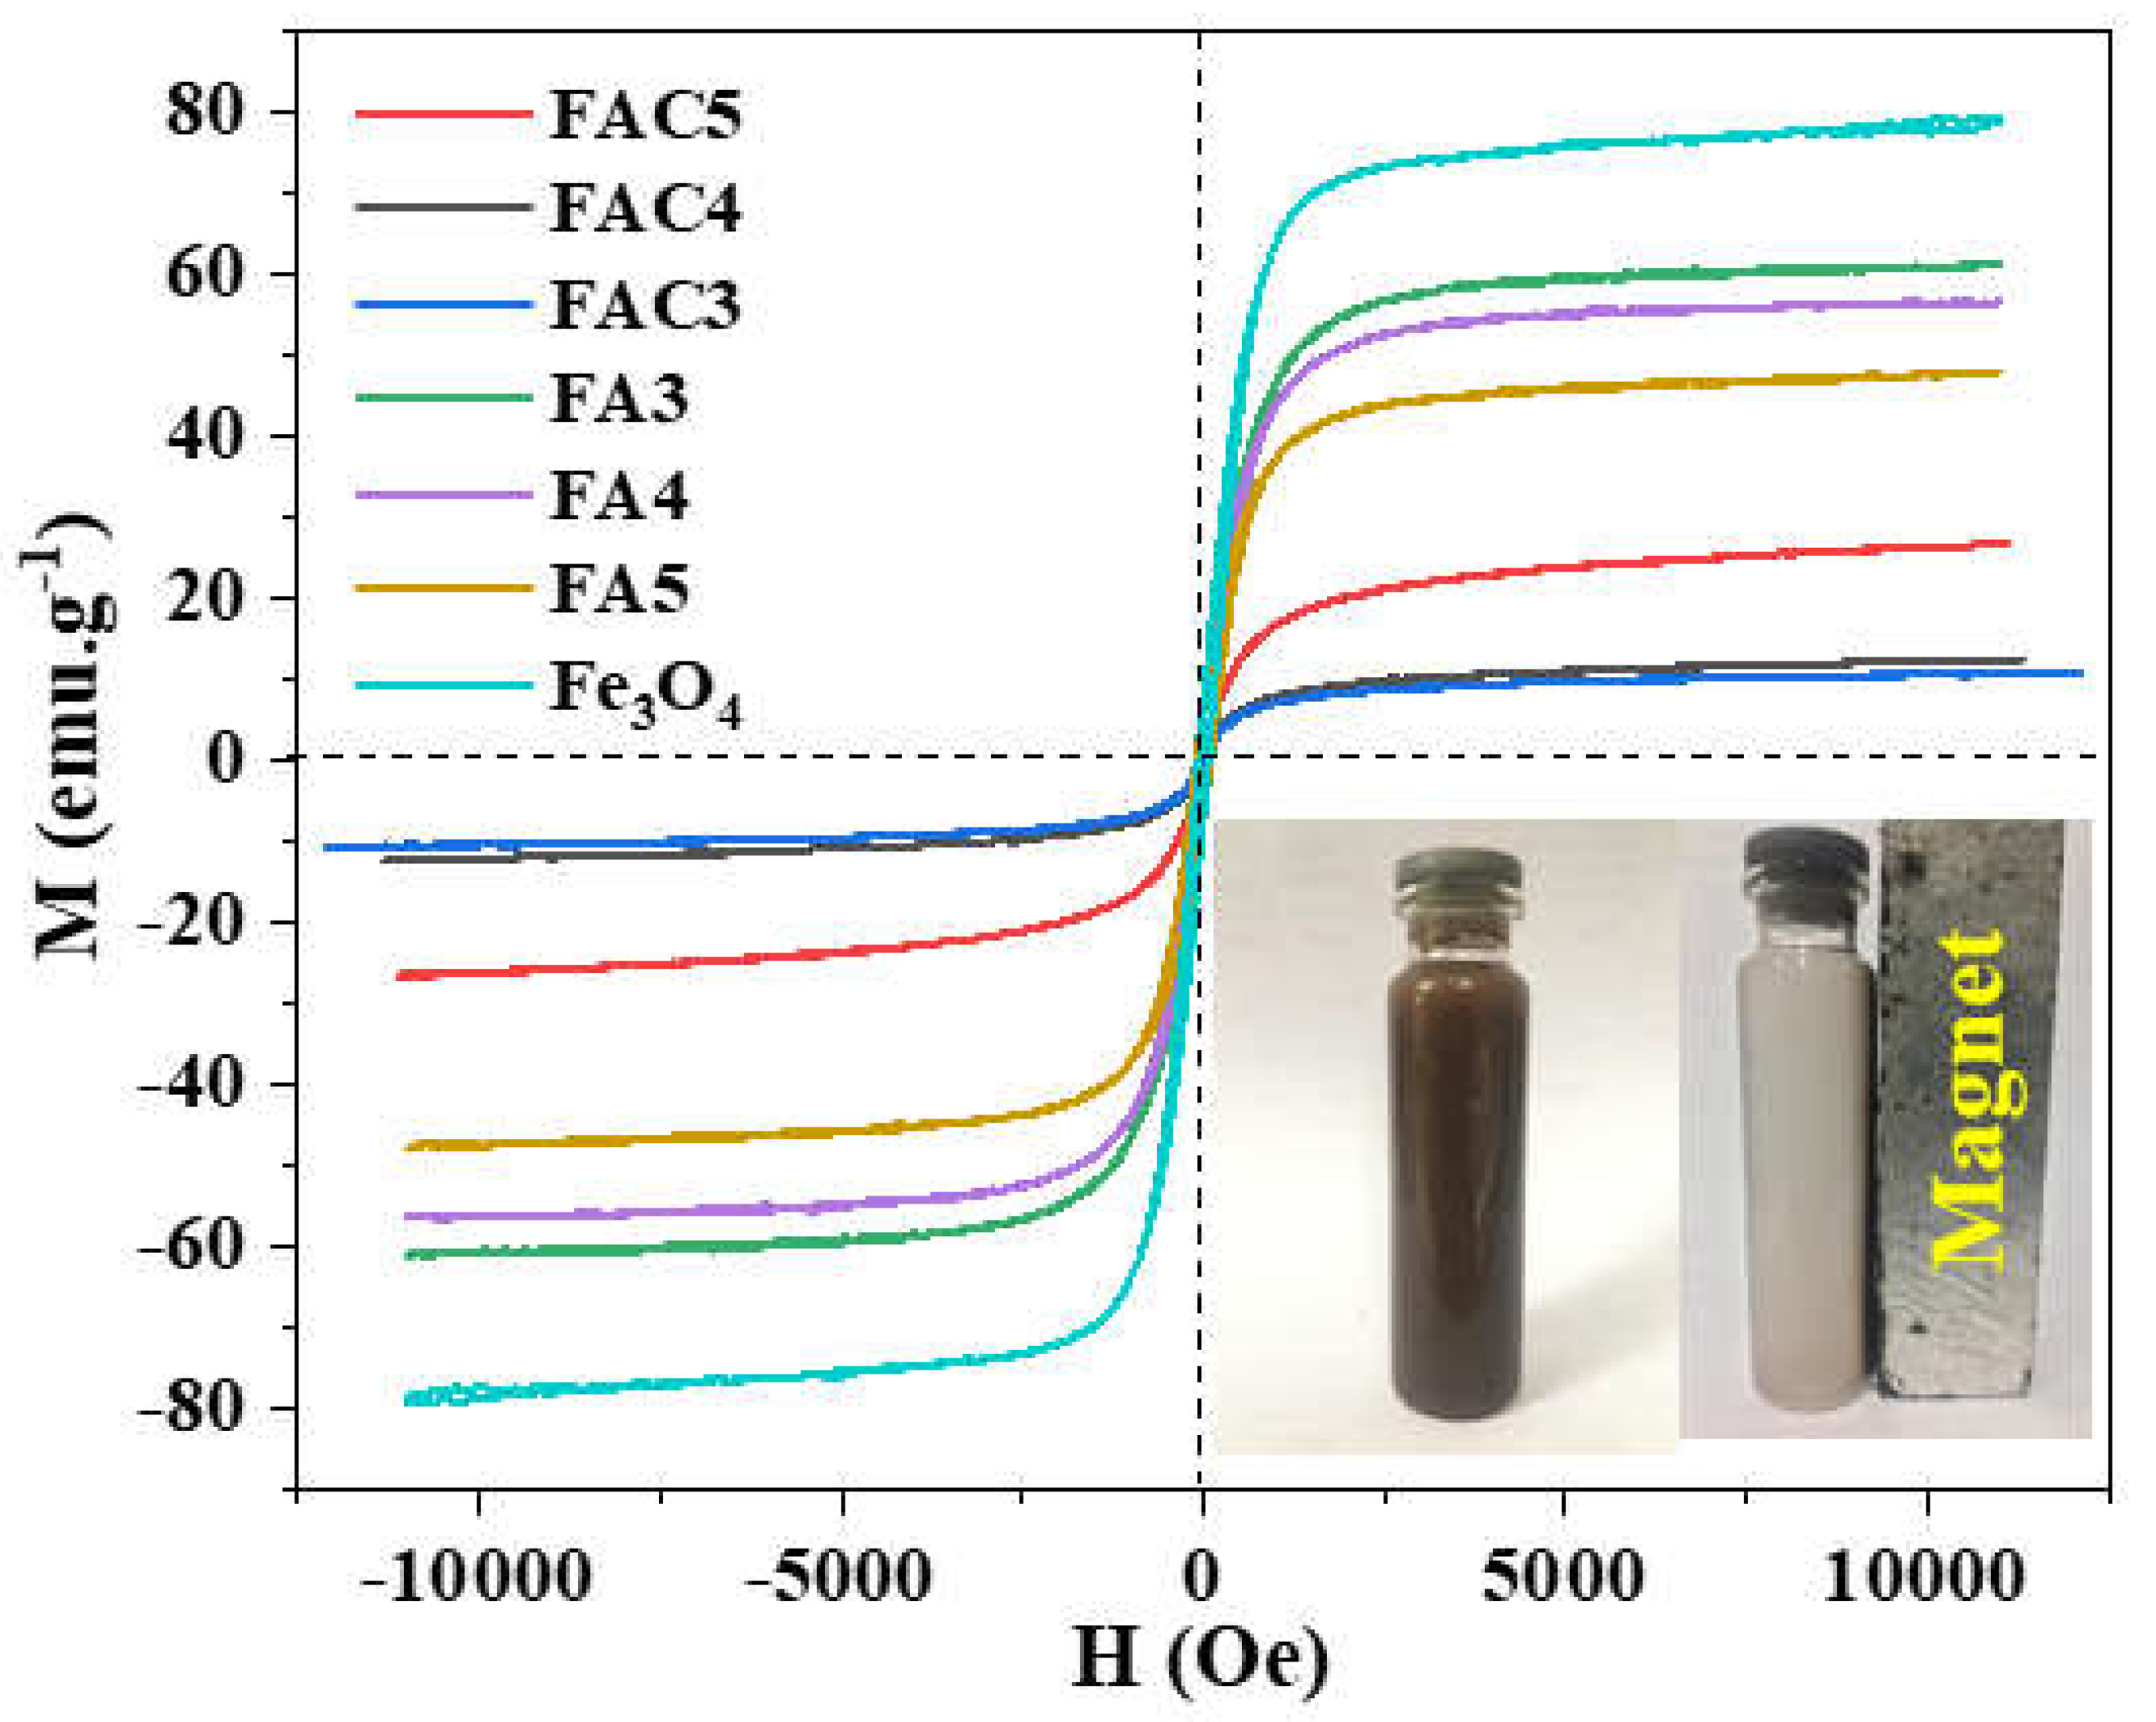
| No. | Sample | Ms (emu/g) | Mr (emu/g) | Hc (Oe) |
|---|---|---|---|---|
| 1 | Fe3O4 | 78.5 | 6.5 | 61.6 |
| 2 | FA3 | 61.1 | 7.7 | 102.6 |
| 3 | FA4 | 56.4 | 5.9 | 75.2 |
| 4 | FA5 | 47.7 | 5.9 | 82.1 |
| 5 | FAC3 | 10.6 | 0.1 | 6.8 |
| 6 | FAC4 | 12.4 | 0.2 | 15.9 |
| 7 | FAC5 | 26.6 | 0.4 | 6.8 |
Disclaimer/Publisher’s Note: The statements, opinions and data contained in all publications are solely those of the individual author(s) and contributor(s) and not of MDPI and/or the editor(s). MDPI and/or the editor(s) disclaim responsibility for any injury to people or property resulting from any ideas, methods, instructions or products referred to in the content. |
© 2023 by the authors. Licensee MDPI, Basel, Switzerland. This article is an open access article distributed under the terms and conditions of the Creative Commons Attribution (CC BY) license (http://creativecommons.org/licenses/by/4.0/).


