1. Introduction
The contribution of glial cells in the central nervous system (CNS) is essential to normal function and to the formation of pathological conditions. One area where glial dysfunction has been implicated is in the development of neuropsychiatric disorders such as anxiety and depression [
1,
2]. For example, the pathways that are dysregulated in these mood disorders include glutamate homeostasis, cell-cell interaction through various metabolites, and inflammation, all of which are strictly regulated by glial cells and their morphogenesis [
1,
2]. Oligodendrocytes (also called oligodendroglial cells) are a type of CNS glial cell controlling these functions that also play a critical role in forming the myelin sheath [
1,
2,
3,
4]. Recent studies on CNS function and dysfunction show that various intracellular and extracellular signaling molecules and molecules modulating cell morphologenesis in oligodendroglial cells are critically associated with neuropsychiatric disorders [
1,
2,
3,
4].
The molecules underling neuropsychiatric disorders include small GTPases, some of which mediate cell morphological changes. Rnd2 is one such small GTPase, belonging to the Rho family of small GTPases [
5]. Rho GTPases are generally bound to GTP or GDP and normally function as on/off switches for signal transducers to control various situations in many cell types [
6,
7]. The former form is active and the latter is inactive in Rho GTPases [
5,
6,
7,
8]. However, because Rnd family members Rnd1, Rnd2, and Rnd3 have no or little GTPase activity, guanine-nucleotide switching reactions are unlikely to occur. Therefore, cellular activities of Rnd family members, including those of Rnd2, are thought to be regulated at the transcriptional or posttranslational levels; that is, expression levels may control Rnd family activities [
5,
6,
7,
8].
Recent findings have shown that deficiency of the
rnd2 gene is associated with anxiety-related behaviors [
5,
8]. We previously showed, using immunohistochemical techniques, that Rnd2 is primarily expressed in oligodendroglial cells in the brain [
9]. In fact, the
rnd2 gene, encoding Rnd2, is one of the genes upregulated in primary oligodendroglial cells following the induction of differentiation. Despite the unique regulation of Rnd2 in oligodendroglial cell myelination [
9], the question of whether Rnd2 itself has the ability to trigger differentiation in oligodendroglial cells before wrapping neuronal axons with their differentiated plasma membranes remains to be elucidated. Thus, we explored whether signaling through Rnd2 is involved in the regulation of differentiation using the FBD-102b cell line, a commonly used mouse oligodendroglial cell differentiation model [
10]. We further explore whether hesperetin, a citrus flavonoid with protective effects on oligodendroglial and neuronal cells, had the ability to recover certain defective situations.
2. Materials and methods
2.1. Antibodies and chemicals
The antibodies and chemicals used in this experiment are listed in
Table 1.
2.2. Synthetic siRNAs and DNA primers
The 19-mer short interfering (si)RNAs with tandem deoxythymidine dinucleotides (dTdT; synthesized by Fasmac, Kanagawa, Japan, or Santa Cruz Biotechnology, Santa Cruz, CA, USA) and DNA fragments or primers (Fasmac) are described in the supplemental figures.
2.3. Reverse transcription-polymerase chain (RT-PCR) reaction
The cDNAs were prepared from Isogen (Nippon Gene, Tokyo, Japan)-extracted total RNA with the PrimeScript RT Master Mix kit (Takara Bio, Kyoto, Japan) in accordance with the manufacturer’s instructions.
PCR amplification from reverse transcription products was performed using Gflex DNA polymerase (Takara Bio) with 30 to 36 cycles, each consisting of a denaturation reaction at 98°C (0.2 min), an annealing reaction at 56 to 65°C (0.25 min) depending on the annealing temperature, and an extension reaction at 68°C (0.5 min). The resultant PCR products were loaded onto 1% to 2% agarose gels (Nacalai Tesque, Kyoto, Japan; Fujifilm, Tokyo, Japan).
2.4. Cell culture and differentiation
FBD-102b cells, which belong to the mouse oligodendroglial precursor cell line, were cultured on cell culture dishes (Nunc brand, Thermo Fisher Scientific, Waltham, MA, USA) in Dulbecco’s modified Eagle’s medium (DMEM)/F-12 mixed medium (Nacalai Tesque) containing 10% heat-inactivated fetal bovine serum (FBS; Gibco brand, Thermo Fisher Scientific) and penicillin-streptomycin solution (Thermo Fisher Scientific) in 5% CO2 at 37°C.
To induce differentiation, cells were cultured on polylysine (Nacalai Tesque)-coated cell culture dishes in culture medium without FBS for 0 to 5 days in 5% CO
2 at 37°C in the presence or absence (vehicle control) of hesperetin chemicals (15 mM for hesperetin and 25 mM for monoglucosyl hesperidine; Fujifilm). Cells with myelin membrane-like widespread membranes (cells large enough to contain a circle with a diameter of ≥50 mm) were considered to represent the differentiated phenotype. Cell morphologies were captured using microscopic systems equipped with i-NTER LENS (Micronet, Saitama, Japan) and i-NTER software (Micronet). The resultant images were analyzed with Image J software (
https://imagej.nih.gov/).
2.5. siRNA and DNA transfection
Cells were transfected with the respective synthesized 21-mer siRNAs with dTdT or plasmids (Addgene Gene No. 237577 or Takara Bio Gene No. X06980) encoding CasRx or guide RNA (gRNA) using the ScreenFect siRNA or ScreenFect A transfection kit (Fujifilm) in accordance with the manufacturer’s instructions, respectively. The medium was replaced 4 hours after transfection and generally used for ≥48 hours after transfection for biochemical experiments. In these conditions, attached cells incorporating trypan blue (Nacalai Tesque) were estimated to be <5% in each experiment 48 hours after transfection.
2.6. Polyacrylamide gel electrophoresis and immunoblotting following immunoprecipitation
Cells were lysed in lysis buffer (50 mM HEPES-NaOH, pH 7.5, 150 mM NaCl, 3 mM MgCl
2, 1 mM dithiothreitol, 1 mM phenylmethane sulfonylfluoride, 1 μg/ml leupeptin, 1 mM EDTA, 1 mM Na
3VO
4, 10 mM NaF, and 0.5% NP-40; Nacalai Tesque). For denatured conditions, cell lysates were denatured in sample buffers (Fujifilm). The denatured samples and denatured ones of immunoprecipitated complexes composed of primary antibody-captured antigen and Protein G resin (Thermo Fisher Scientific) were separated on premade sodium dodecylsulfate-polyacrylamide gel (Nacalai Tesque). The electrophoretically separated proteins were transferred to a polyvinylidene fluoride membrane (Fujifilm), blocked with Blocking One (Nacalai Tesque), and immunoblotted using primary antibodies, followed by peroxidase enzyme-conjugated secondary antibodies. The peroxidase-reactive bands were captured using an image scanner (Canon, Tokyo, Japan) and scanned using CanoScan software (Canon). We performed some sets of experiments in immunoblotting studies and quantified other immunoreactive bands with the control sample’s immunoreactive band as 100% with Image J software (URL:
https://imagej.nih.gov/).
2.7. Statistical analyses
Values are means ± SD from separate experiments. Intergroup comparisons were performed using the unpaired t-test with the Student’s or Welch’s correction in Excel software (Microsoft Corp., Redmond, WA, USA). We transformed the data to relative values compared to other data and analyzed the data using the T.DIST.2T function in Excel. For more than 3 samples, one-way analysis of variance (ANOVA) was followed by a Fisher’s protected least significant difference (PLSD) test as a post hoc comparison (PHC) using StatPlus software (AnalystSoft Inc., Walnut, CA, USA).
Differences were considered significant at p < 0.05. For all analyses, the investigator was blinded to the sample conditions.
2.8. Ethics statement
Techniques using genetically modified cells and related techniques were performed in accordance with a protocol approved by the Tokyo University of Pharmacy and Life Sciences Gene and Animal Care Committee (Approval Nos. LS28-20 and LSR3-011).
4. Discussion
All Rnd proteins (Rnd1, Rnd2, and Rnd3) are unusual in that they bind to GTP but are almost incapable of hydrolysis of GTP. It is thus believed that Rnd proteins are not regulated by conformational switches for GTP- and GDP-binding forms on small GTPases. It is likely that the activities of Rnd proteins are primarily regulated by expression levels during development. Transfection of Rnd proteins is known to change the formation of actin stress fibers in fibroblasts and epithelial cells [
6,
7,
8]. Rnd proteins often act antagonistically to RhoA (a cytoskeletal regulator) by modulating the downstream signaling of RhoA. RhoA and downstream signaling promote stress fiber formation, specifically inhibiting myelination following differentiation in oligodendroglial cells [
6,
7,
8,
24]. It is therefore presumed that Rnd proteins promote myelination. This hypothesis is supported by results showing that Rnd2 and Rnd3 are involved in the regulation of myelination, at least in part [
9,
25]. It is known that expression of Rnd2 protein increases as development proceeds [
9]. In contrast, it is unclear whether Rnd1 or Rnd3 is upregulated as development proceeds.
In mouse brain, Rnd2 is expressed in oligodendroglial cells but rarely expressed in neuronal cells of many brain regions [
9]. Thus, it was thought that Rnd2 had specific or unique role(s) in oligodendroglial cells. Of interest, Rnd2 has dual roles depending on the developmental period in myelination by oligodendroglial cells; Rnd2 acts as a positive regulator during the early myelination period and as a negative regulator during the late developing period. As the positive role of Rnd2 in cell morphogenesis is known [
26], we investigated whether and how Rnd2-mediated signaling directly promotes morphological differentiation of oligodendrocytes before myelination. In the present study, we demonstrated that Rnd2 promotes oligodendroglial cell morphological differentiation in FBD-102b cells. Knockdown of Rnd2 using the specific gRNA-based RNA editing or siRNA technique inhibited morphological differentiation. Similarly, knockdown of its downstream effector cascade molecules Prag1 and Fyn also inhibited differentiation, revealing the positive role of signaling pathway coupling Rnd2 to Prag1 and Fyn in differentiation and, in turn, possible myelination.
In contrast, functional loss of Rnd2 and the possible effector signaling pathway underlying Rnd2 are related to anxiety-related behaviors, which are often associated with unhealthy oligodendroglial cell differentiation and possible myelination [
1,
2,
3,
4,
5]. Indeed, Rnd2 is weakly but specifically expressed in some neuronal cells in hippocampal regions [
26]. It is conceivable that neuronal cells act cooperatively with oligodendroglial cells to form normal brain structures including hippocampal regions, probably triggering a normally stabilizing mood. It is therefore possible that in the developing brain, signaling centered on Rnd2 is involved in forming the whole structures through normal neuronal differentiation as well as oligodendroglial cell differentiation, sometimes cooperatively and sometimes independently.
We did not observe negative roles of Rnd2 and the effector molecules in morphological differentiation in FBD-102b cells, as seen in the case of the late developing period [
9]. This might be because long-term observation is not suitable for experiments using the
in vitro system. Thus, the experiment ended before negative effects of Rnd2 were apparent in cells. Alternatively, the effector molecules of Rnd2 themselves differ depending on the respective developmental periods: an early period centered on cell differentiation and a late period centered on dynamic morphological changes such as myelination. In either case, it is clear that molecules associated with signaling through Rnd2 are likely critically involved in the regulation of oligodendrocyte fate from differentiation to myelination.
Prag1 was originally identified as an actin cytoskeletal regulatory protein with the ability to bind to Rnd2 [
6]. At present, it is thought that Prag1, acting by capturing or isolating Csk [
14,
15,
16,
17], results in activation of non-receptor-type tyrosine kinase Fyn, which is the master regulator of oligodendroglial cell morphogenesis [
14,
15,
16,
17]. It is therefore believed that Prag1, which exhibits Rnd2-dependent changes localized to the plasma membrane, is an adaptor protein for non-receptor-type tyrosine kinases including Fyn. Furthermore, evidence indicates that Fyn has many potential substrates, including a variety of cytoskeletal and structural proteins [
27]. Fyn may directly contribute to cytoskeletal changes to trigger cellular
morphogenesis in oligodendroglial cells. Additionally, Prag1, acting downstream of Rnd2, may directly regulate actin cytoskeletal proteins to modulate morphological differentiation. In the BioGRID website (
https://thebiogrid.org/), evidence shows that Prag1 has some potential interaction proteins, including cytoskeletal and structural proteins [
14,
15]. It is thus suggested that Rnd2 and Prag1 regulate cellular morphogenesis through more complicated molecular mechanisms than previously thought.
Flavonoids, including hesperidin (often called vitamin P) and its aglycon hesperetin, are known to have functions to inhibit the neuroinflammation involved in the progression of neurodegenerative disorders such as Alzheimer’s disease, Parkinson’s disease, amyotrophic lateral sclerosis, and multiple sclerosis [
18,
19]. Their inhibitory activities could delay progression of CNS neuropathies. Although it is unlikely that flavonoids such as hesperetin directly inhibit the degeneration of neuronal and glial cells [
18,
19], target or binding proteins of hesperetin include some signaling molecules. For example, hesperetin directly binds to tyrosine phosphatase 1B (PTP1B). PTP1B is known to be a negative regulator belonging to signaling molecules phosphorylating insulin receptor substrate 1 (IRS1) and Akt kinase phosphorylating signaling [
28,
29,
30]. Signaling through Akt plays a key role in oligodendroglial cell differentiation and myelination [
28,
29,
30]. It is conceivable that modulation of PTP1B activities by hesperetin, acting through Akt signaling, can promote oligodendroglial cell morphological differentiation; however, it still remains unclear whether hesperetin directly inhibits the activities of PTP1B. Furthermore, if the relationship between hesperetin and dephosphorylating enzymes is a general molecular mechanism, hesperetin might promote morphological differentiation by inhibiting the dephosphorylation of Fyn downstream of Rnd2 and Prag1, even in pathological conditions such as anxiety-related diseases.
Herein, we showed that knockdown of the different molecules of possible mood-stabilizing Rnd2/Prag1/Fyn signaling inhibits oligodendroglial cell morphological differentiation in FBD-102 cells. In contrast, hesperetin can recover defective morphological differentiation by knockdown of these molecules. Further studies are needed to increase our understanding of the detailed molecular mechanisms, not only of how possible mood-stabilizing Rnd2/Prag1/Fyn signaling is required for oligodendroglial cell morphological differentiation and in turn myelination but also of how the Rnd2/Prag1/Fyn signaling underlying normal oligodendroglial cell differentiation is linked to mood-stabilizing cooperatively with neuronal cells at the molecular and cellular levels. Additionally, these studies would lead to a better understanding of which signaling pathway is affected by hesperetin and to elucidating how these molecular candidates interact with hesperetin in oligodendroglial cells
in vivo as well as
in vitro. Studies in this direction might allow us to develop new target-specific medicines for anxiety-related diseases in oligodendroglial cells [
31,
32,
33,
34] and potential applications of hesperetin for diseases.
Figure 1.
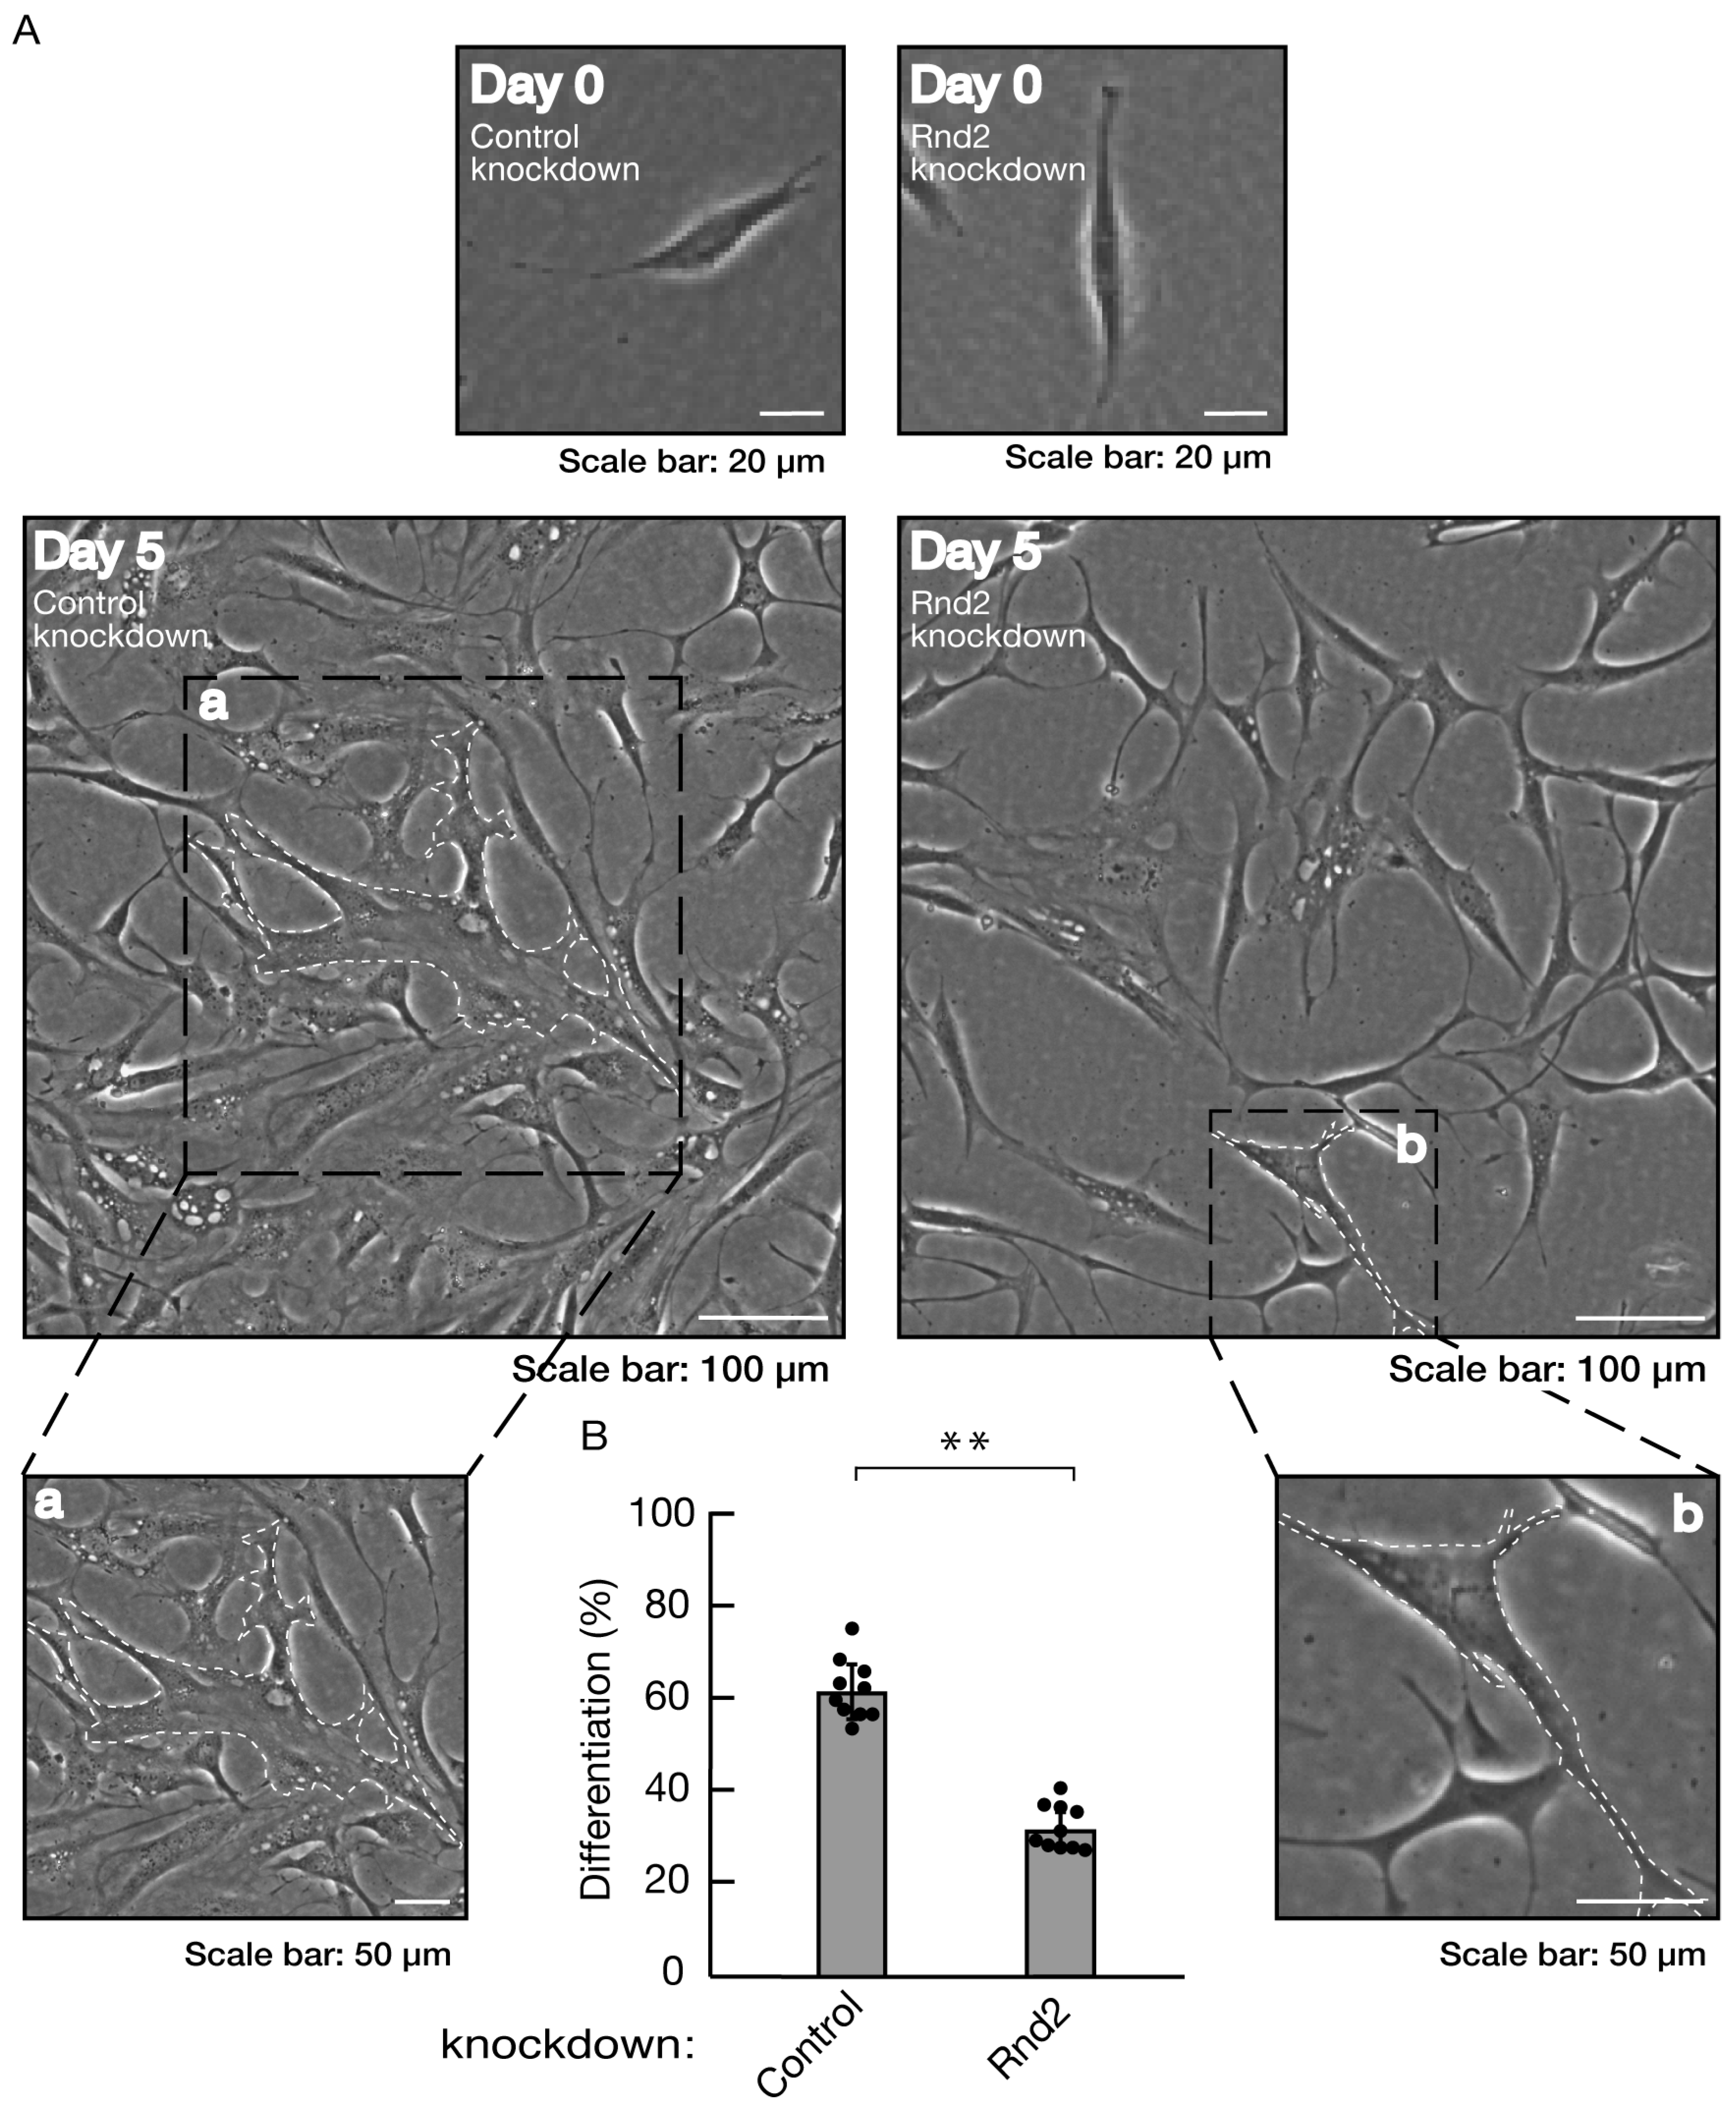
Knockdown of Rnd2 using the CRISPR/CasRx system inhibits morphological differentiation. (A, B) FBD-102b cells were transfected with the plasmids encoding CasRx and gRNA for control (luciferase) or Rnd2 for knocking down Rnd2. Following the induction of differentiation, the respective, cell morphologies at 0 and 5 days were placed as the representative images, analyzed, and statistically depicted (** p<0.01; n = 10 fields). Cells with myelin membrane-like widespread membranes (cells large enough to contain a circle with a diameter of 50 μm or more) were considered to be the differentiated ones. The typical cells with widespread membranes were surrounded with white dotted lines. The black dotted squares (a and b) in large images were placed below as the magnified images (a and b).
Figure 2.
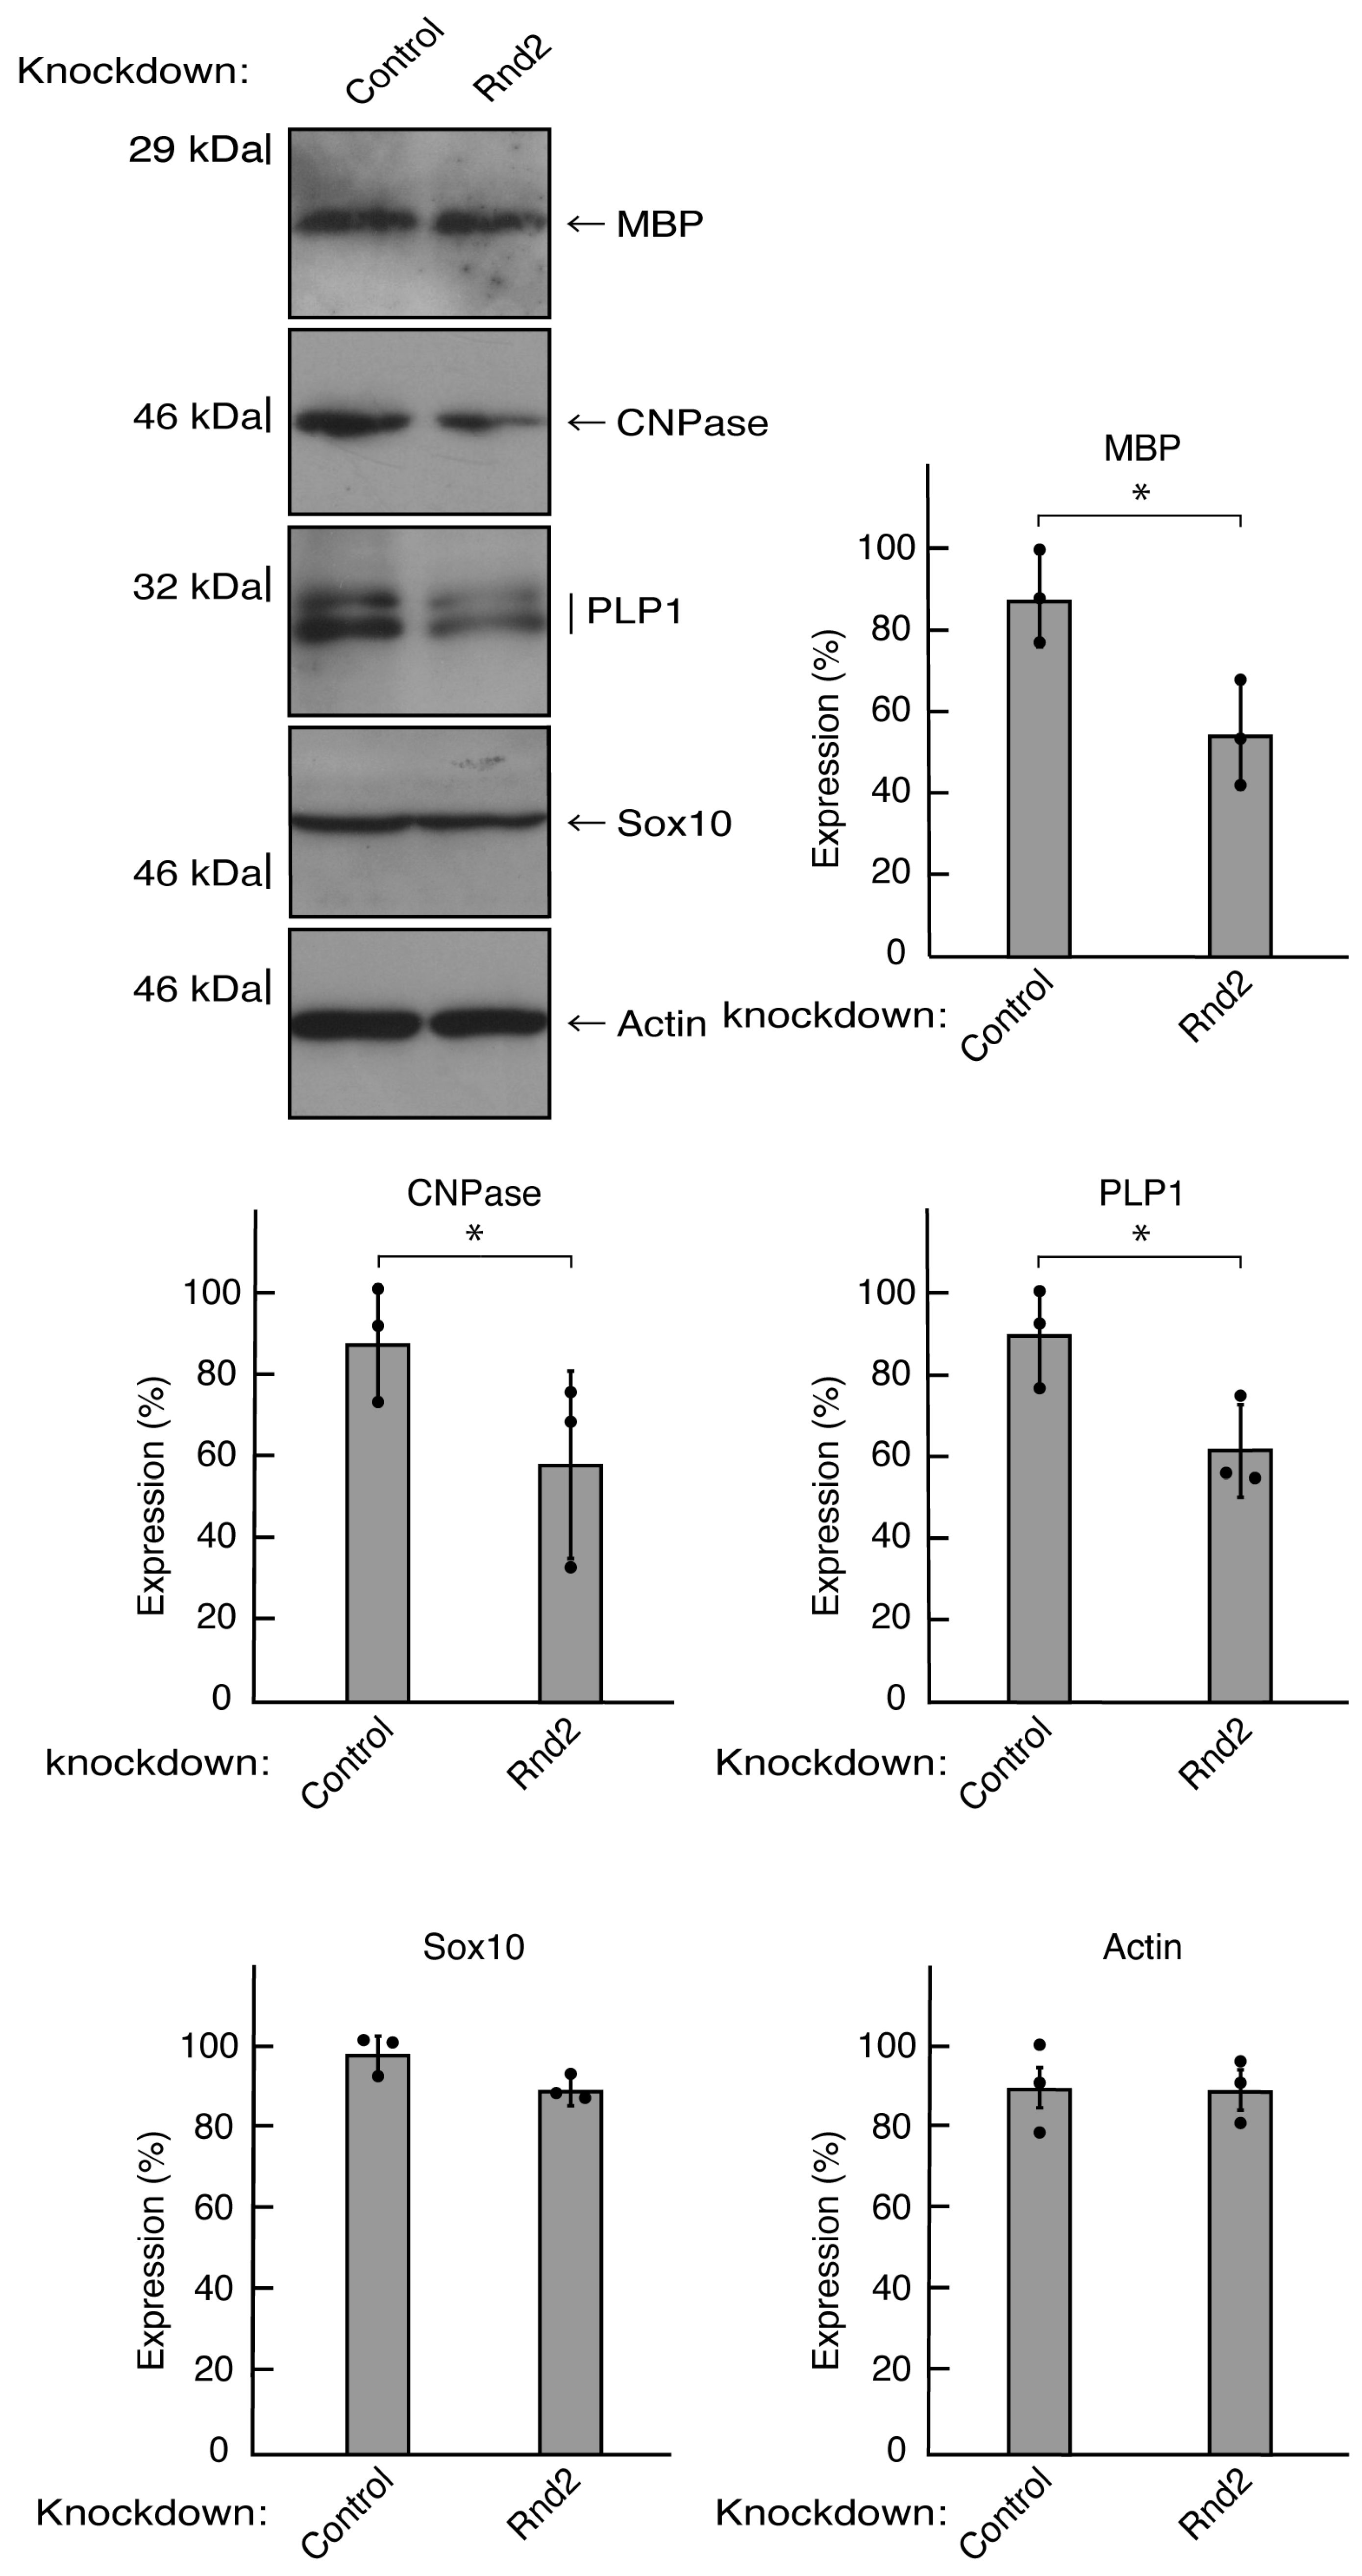
Knockdown of Rnd2 using the CRISPR/CasRx system decreases the expression levels of myelination/differentiation markers. FBD-102b cells were transfected with the plasmids encoding CasRx and gRNA for control (luciferase) or Rnd2. Following the induction of differentiation, the respective immunoblots (MBP, CNPase, PLP1, Sox10, and actin) at 5 days were placed as the representative images, analyzed, and statistically depicted (* p<0.05; n = 3 blots).
Figure 3.
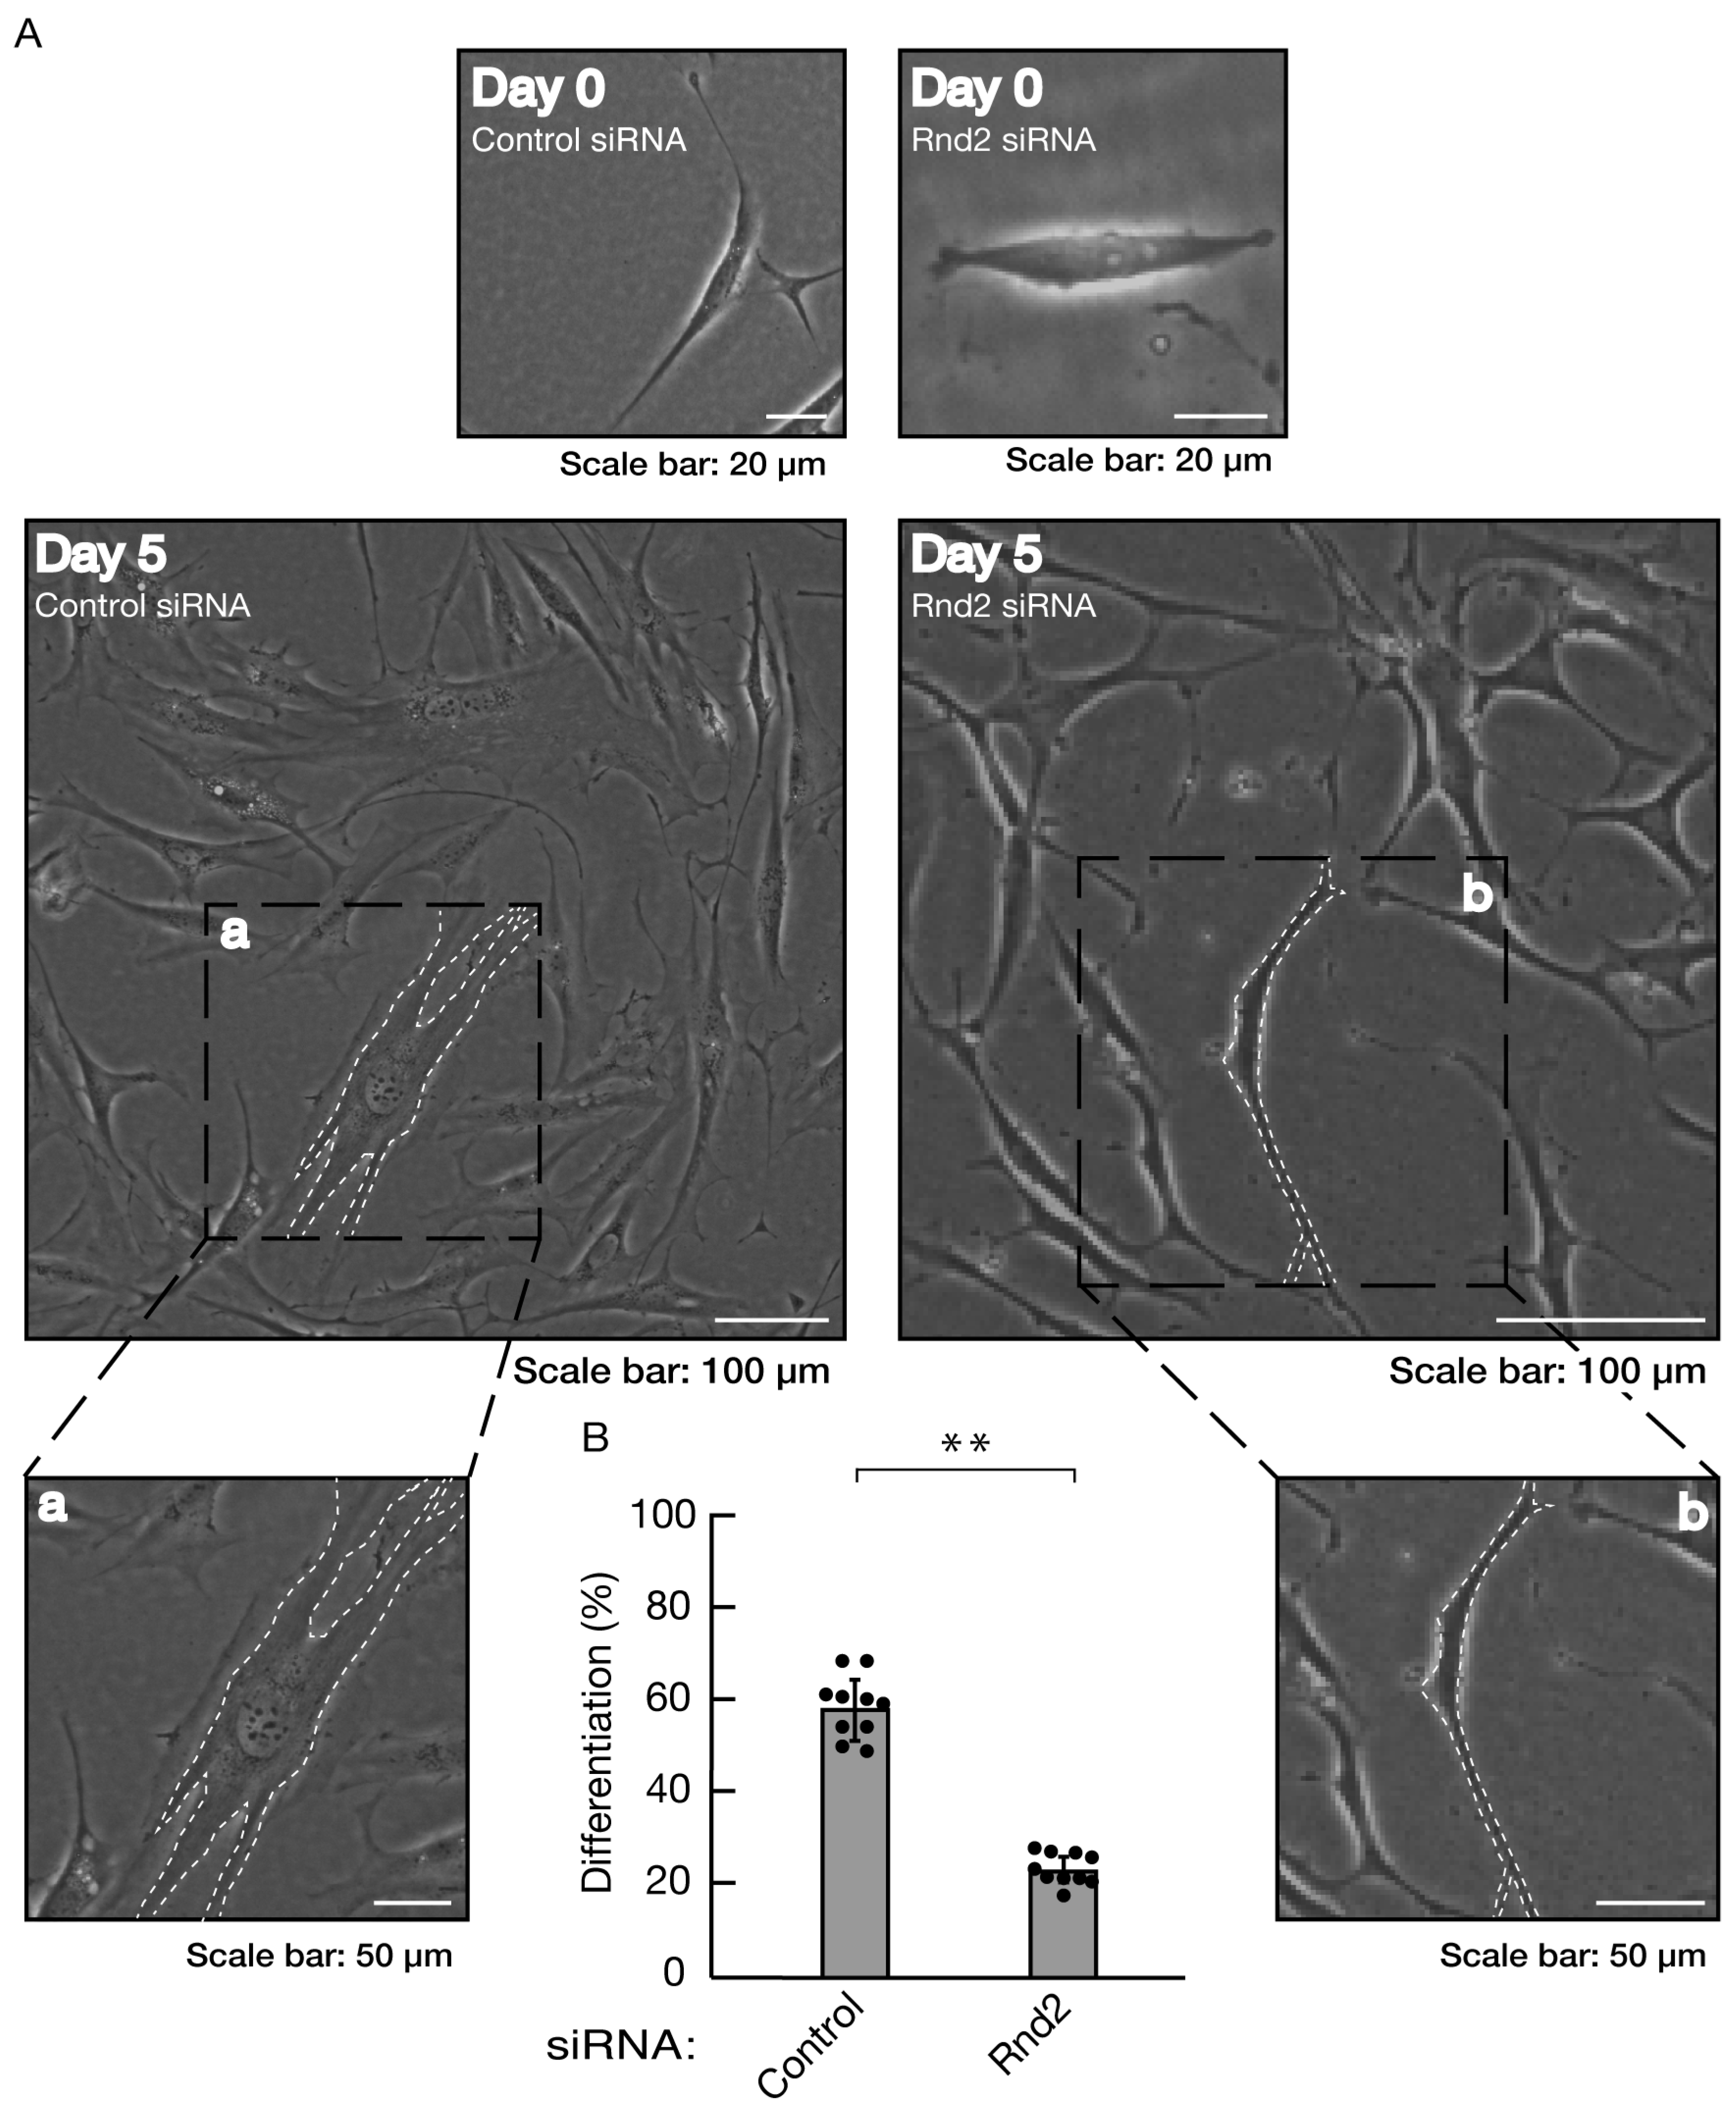
Knockdown of Rnd2 using the RNA interference technique inhibits morphological differentiation. (A, B) Cells were transfected with siRNA for control (luciferase) or Rnd2. Following the induction of differentiation, the respective, cell morphologies at 0 and 5 days were placed as the representative images, analyzed, and statistically depicted (** p<0.01; n = 10 fields). The typical cells with widespread membranes were surrounded with white dotted lines. The black dotted squares (a and b) in large images were placed below as the magnified images (a and b).
Figure 4.
Knockdown of Rnd2 using the RNA interference technique decreases the expression levels of differentiation markers. Cells were transfected with the plasmids encoding CasRx and gRNA for control (luciferase) or Rnd2. Following the induction of differentiation, the respective immunoblots at 5 days were placed as the representative images, analyzed, and statistically depicted (* p<0.05; n = 3 blots).
Figure 5.
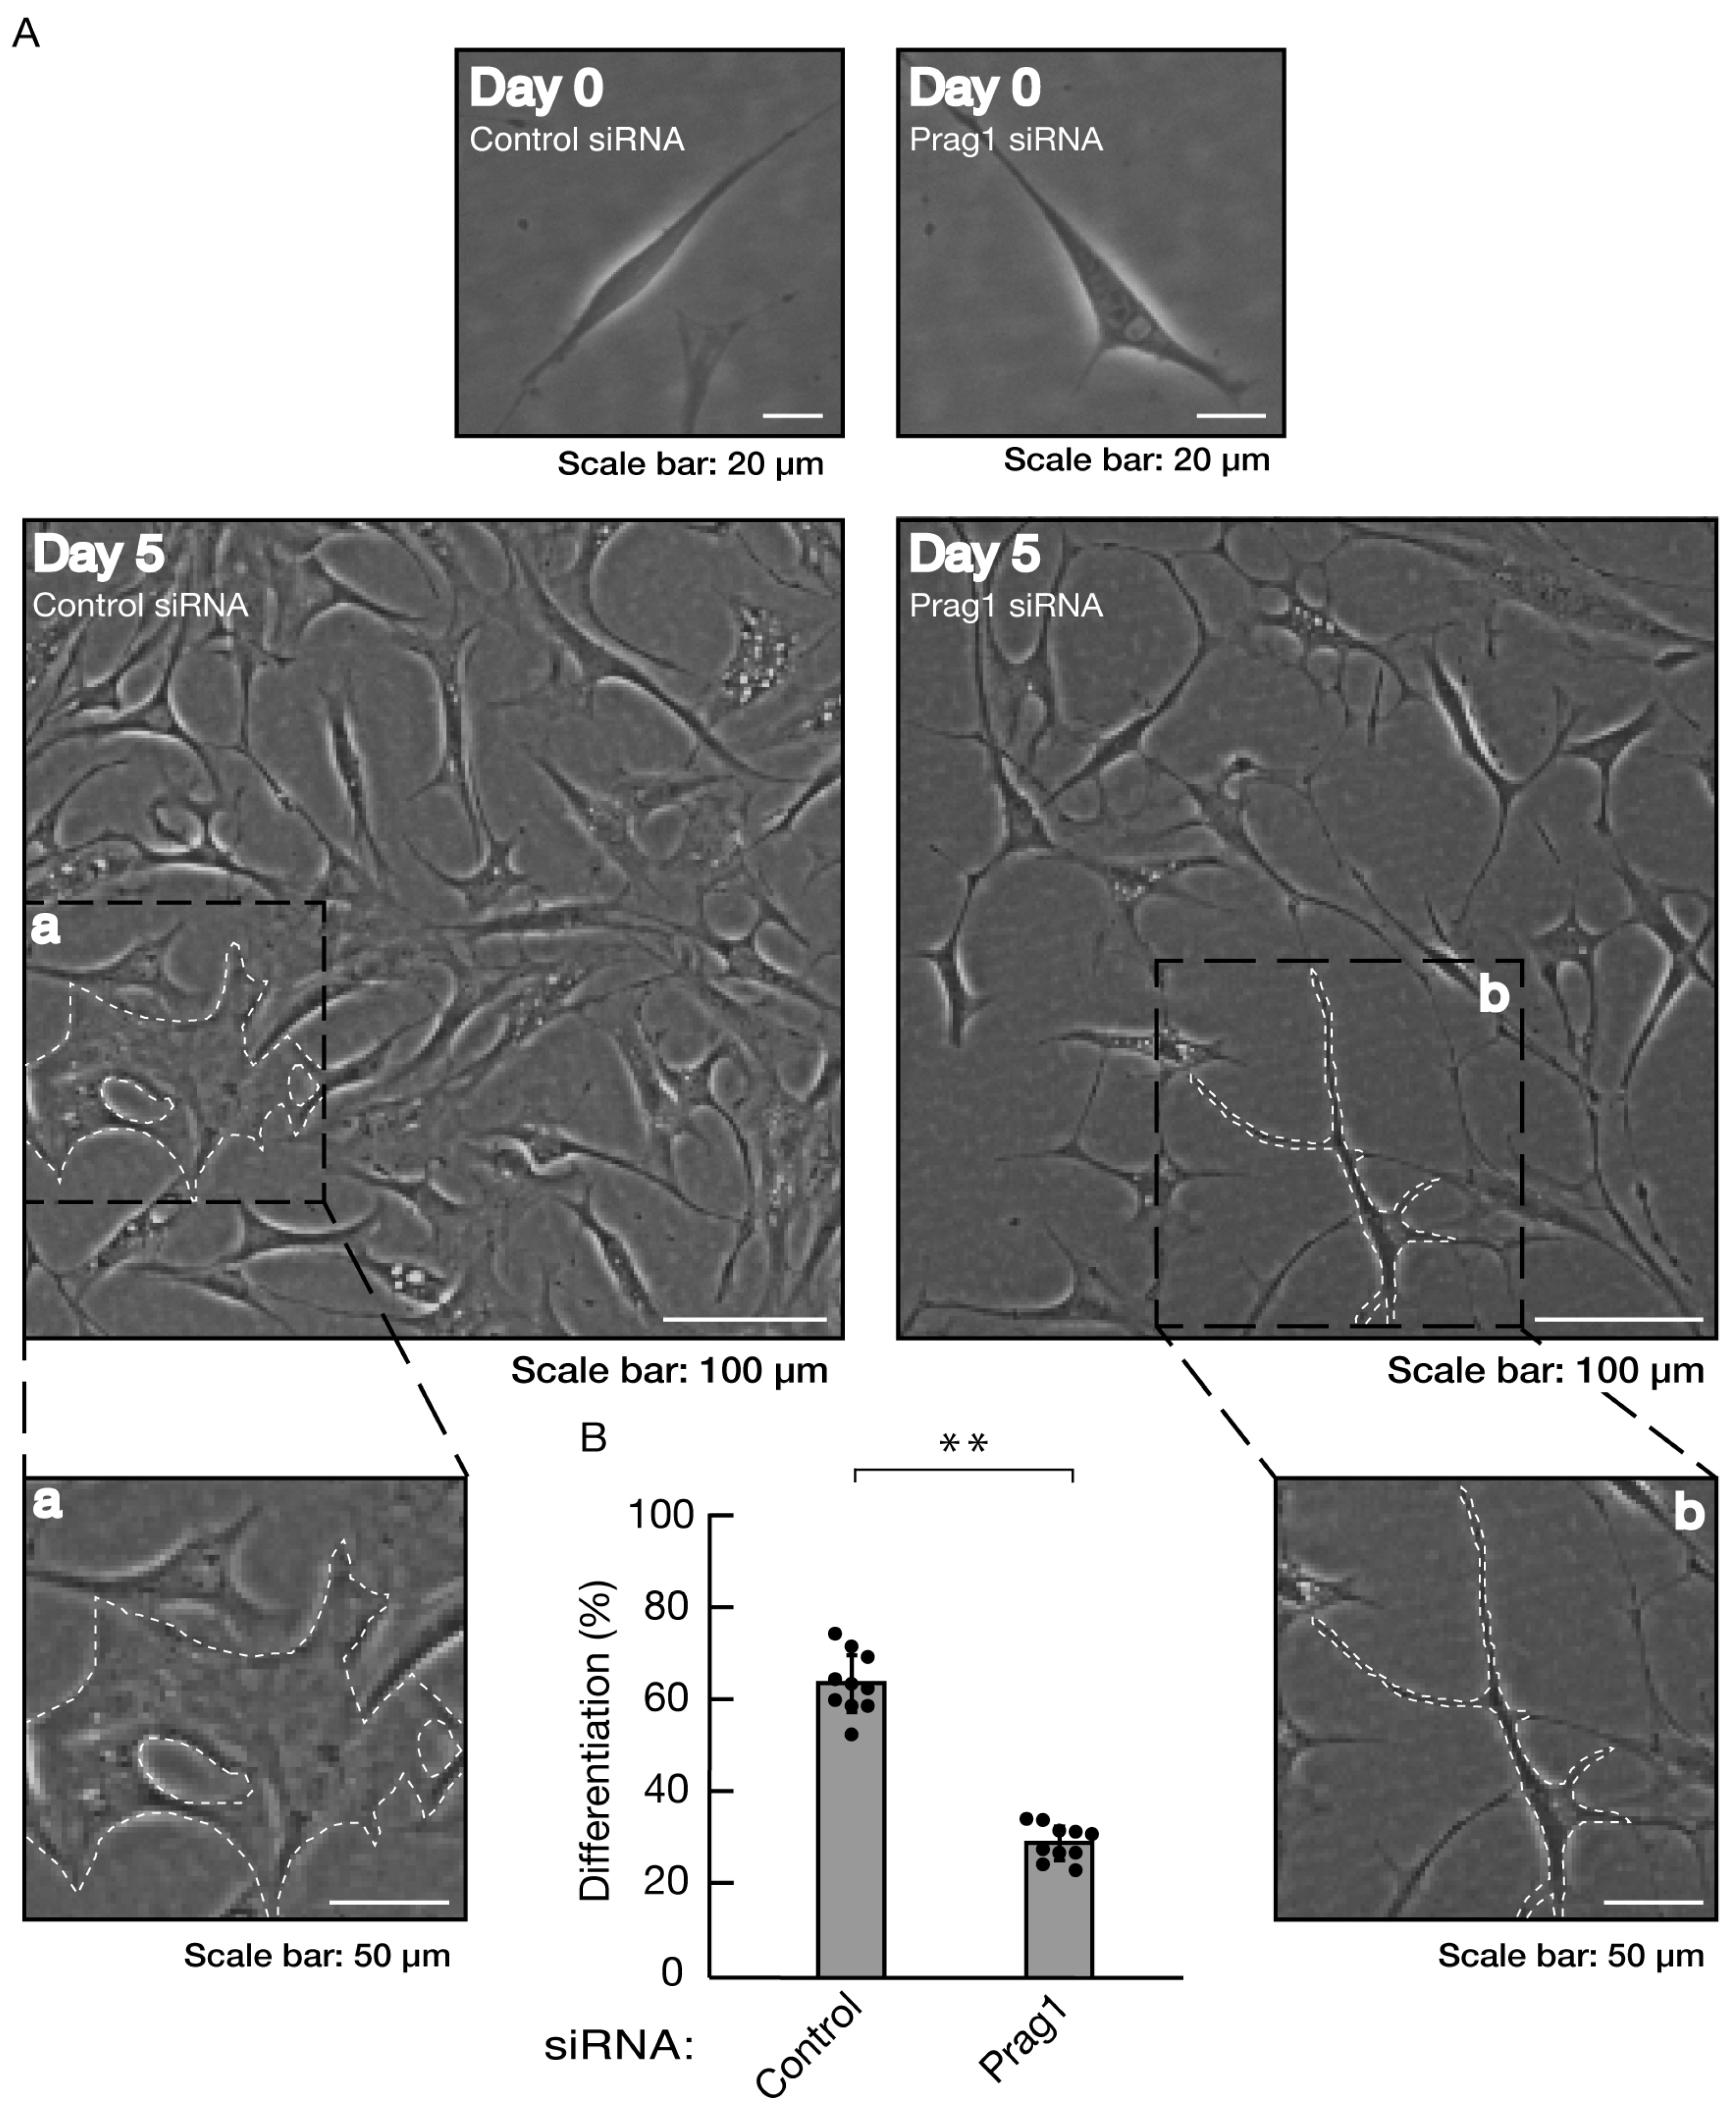
Knockdown of Prag1 inhibits morphological differentiation. (A, B) Cells were transfected with siRNA for control or Prag1. Following the induction of differentiation, the respective, cell morphologies at 0 and 5 days were placed as the representative images, analyzed, and statistically depicted (** p<0.01; n = 10 fields). The typical cells with widespread membranes were surrounded with white dotted lines. The black dotted squares (a and b) in large images were placed below as the magnified images (a and b).
Figure 6.
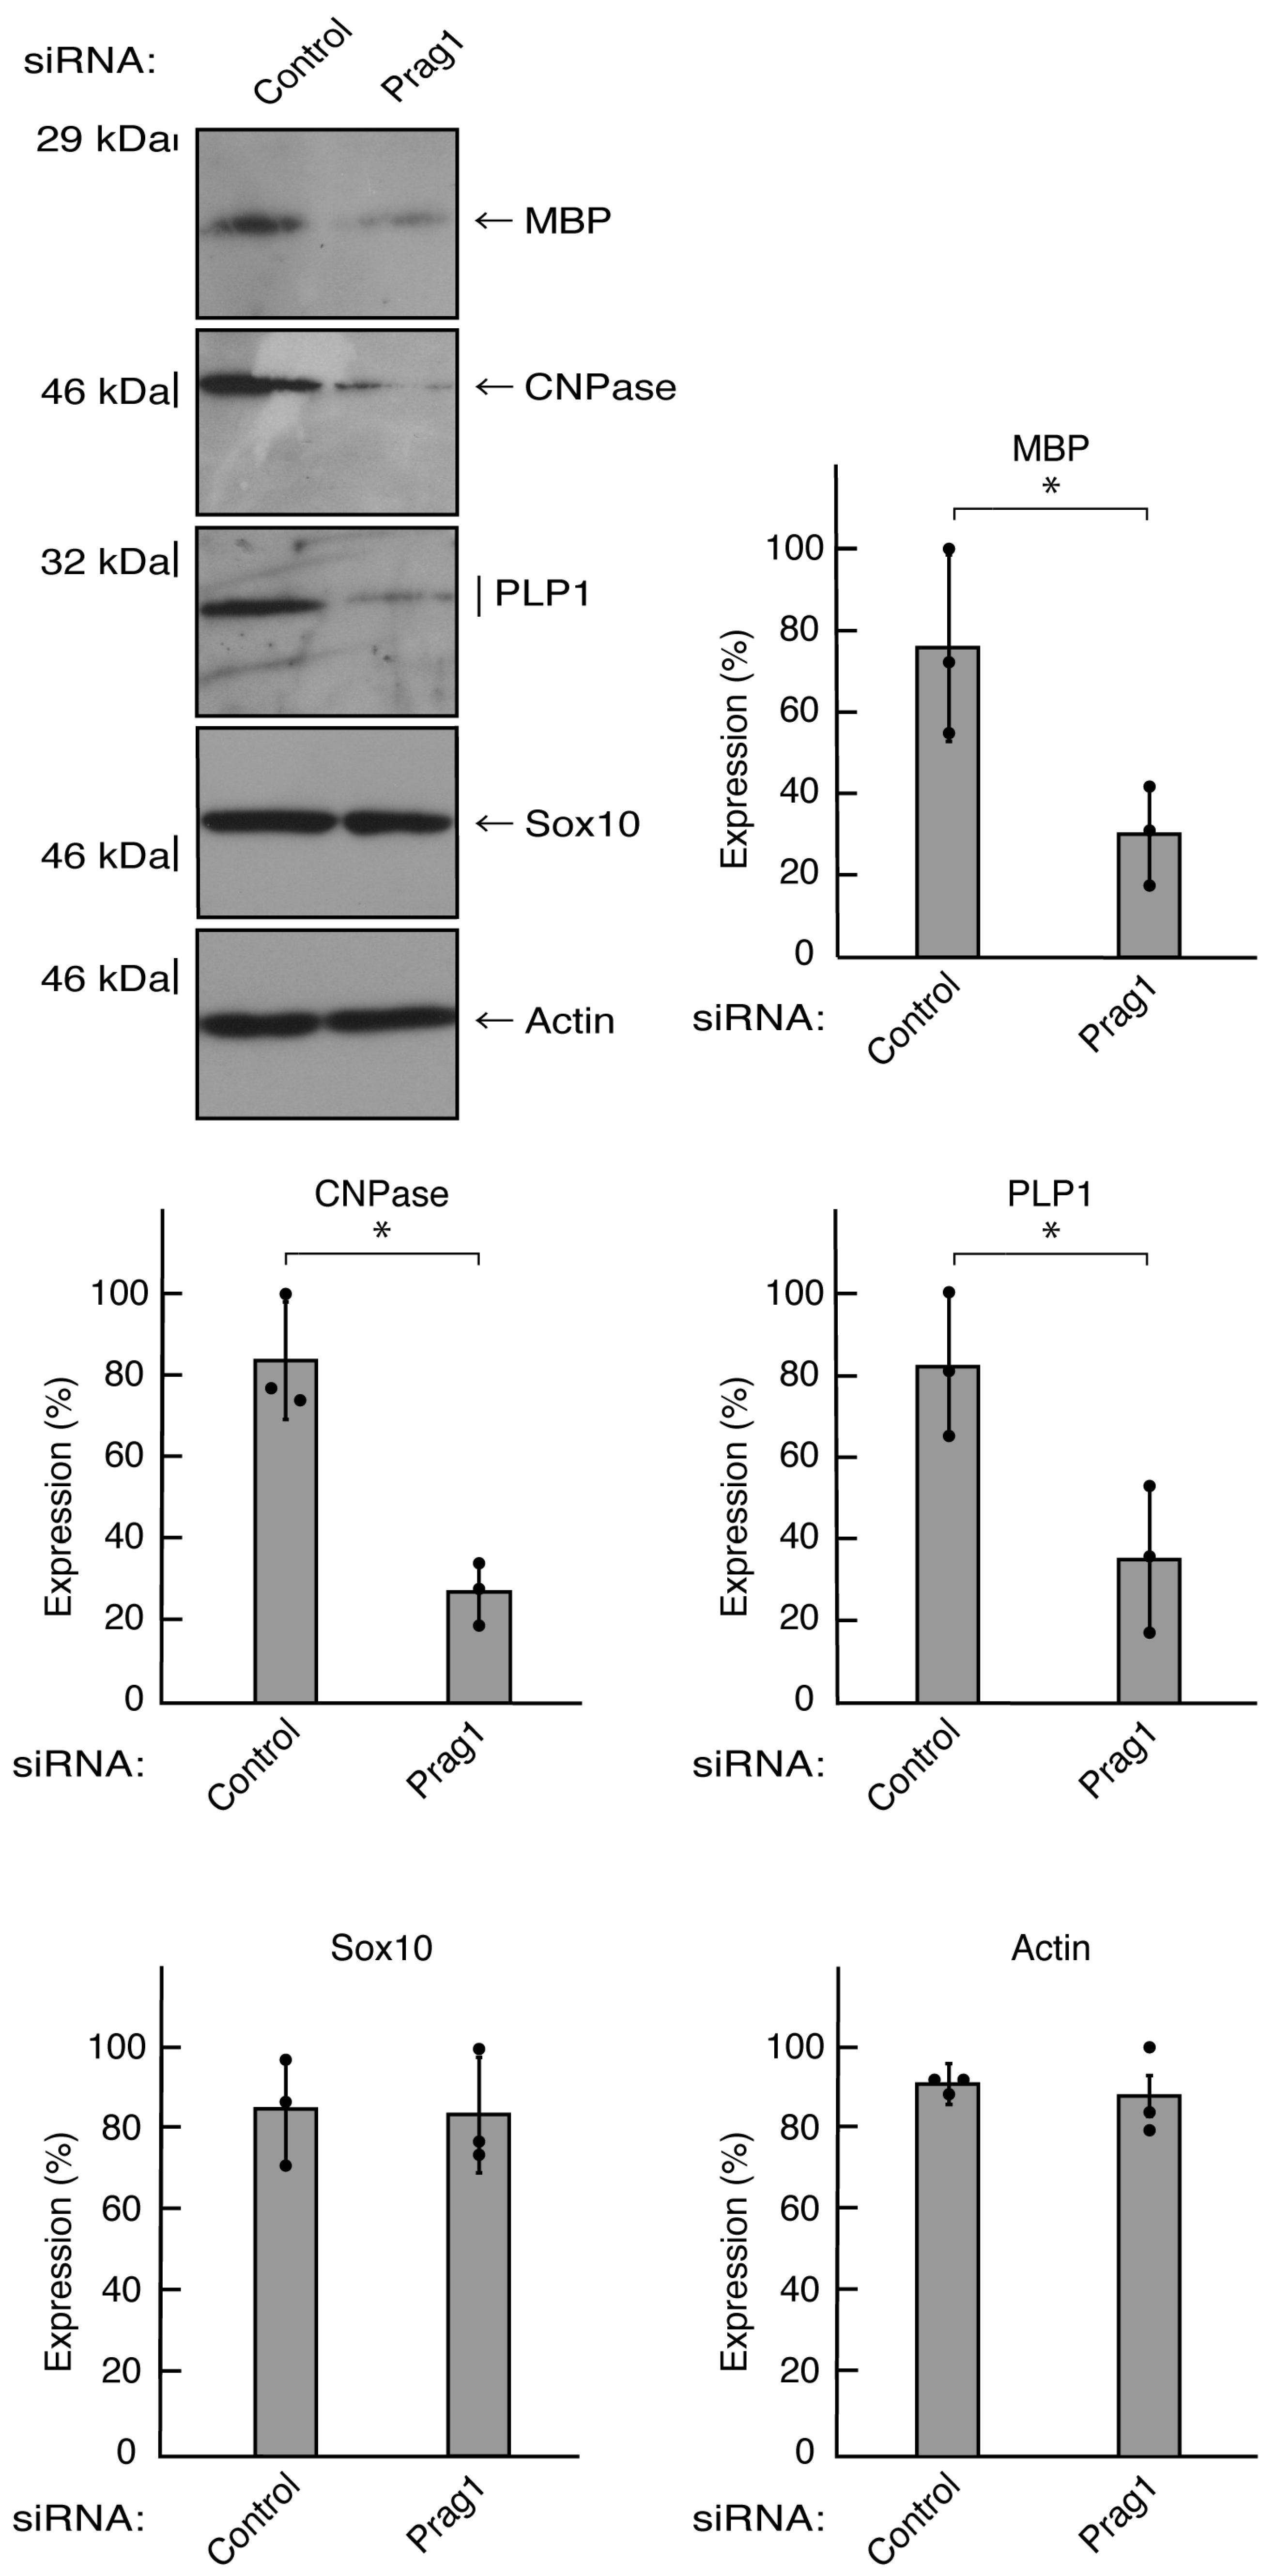
Knockdown of Prag1 decreases the expression levels of differentiation markers. Cells were transfected with the plasmids encoding CasRx and gRNA for control or Prag1. Following the induction of differentiation, the respective immunoblots at 5 days were placed as the representative images, analyzed, and statistically depicted (* p<0.05; n = 3 blots).
Figure 7.
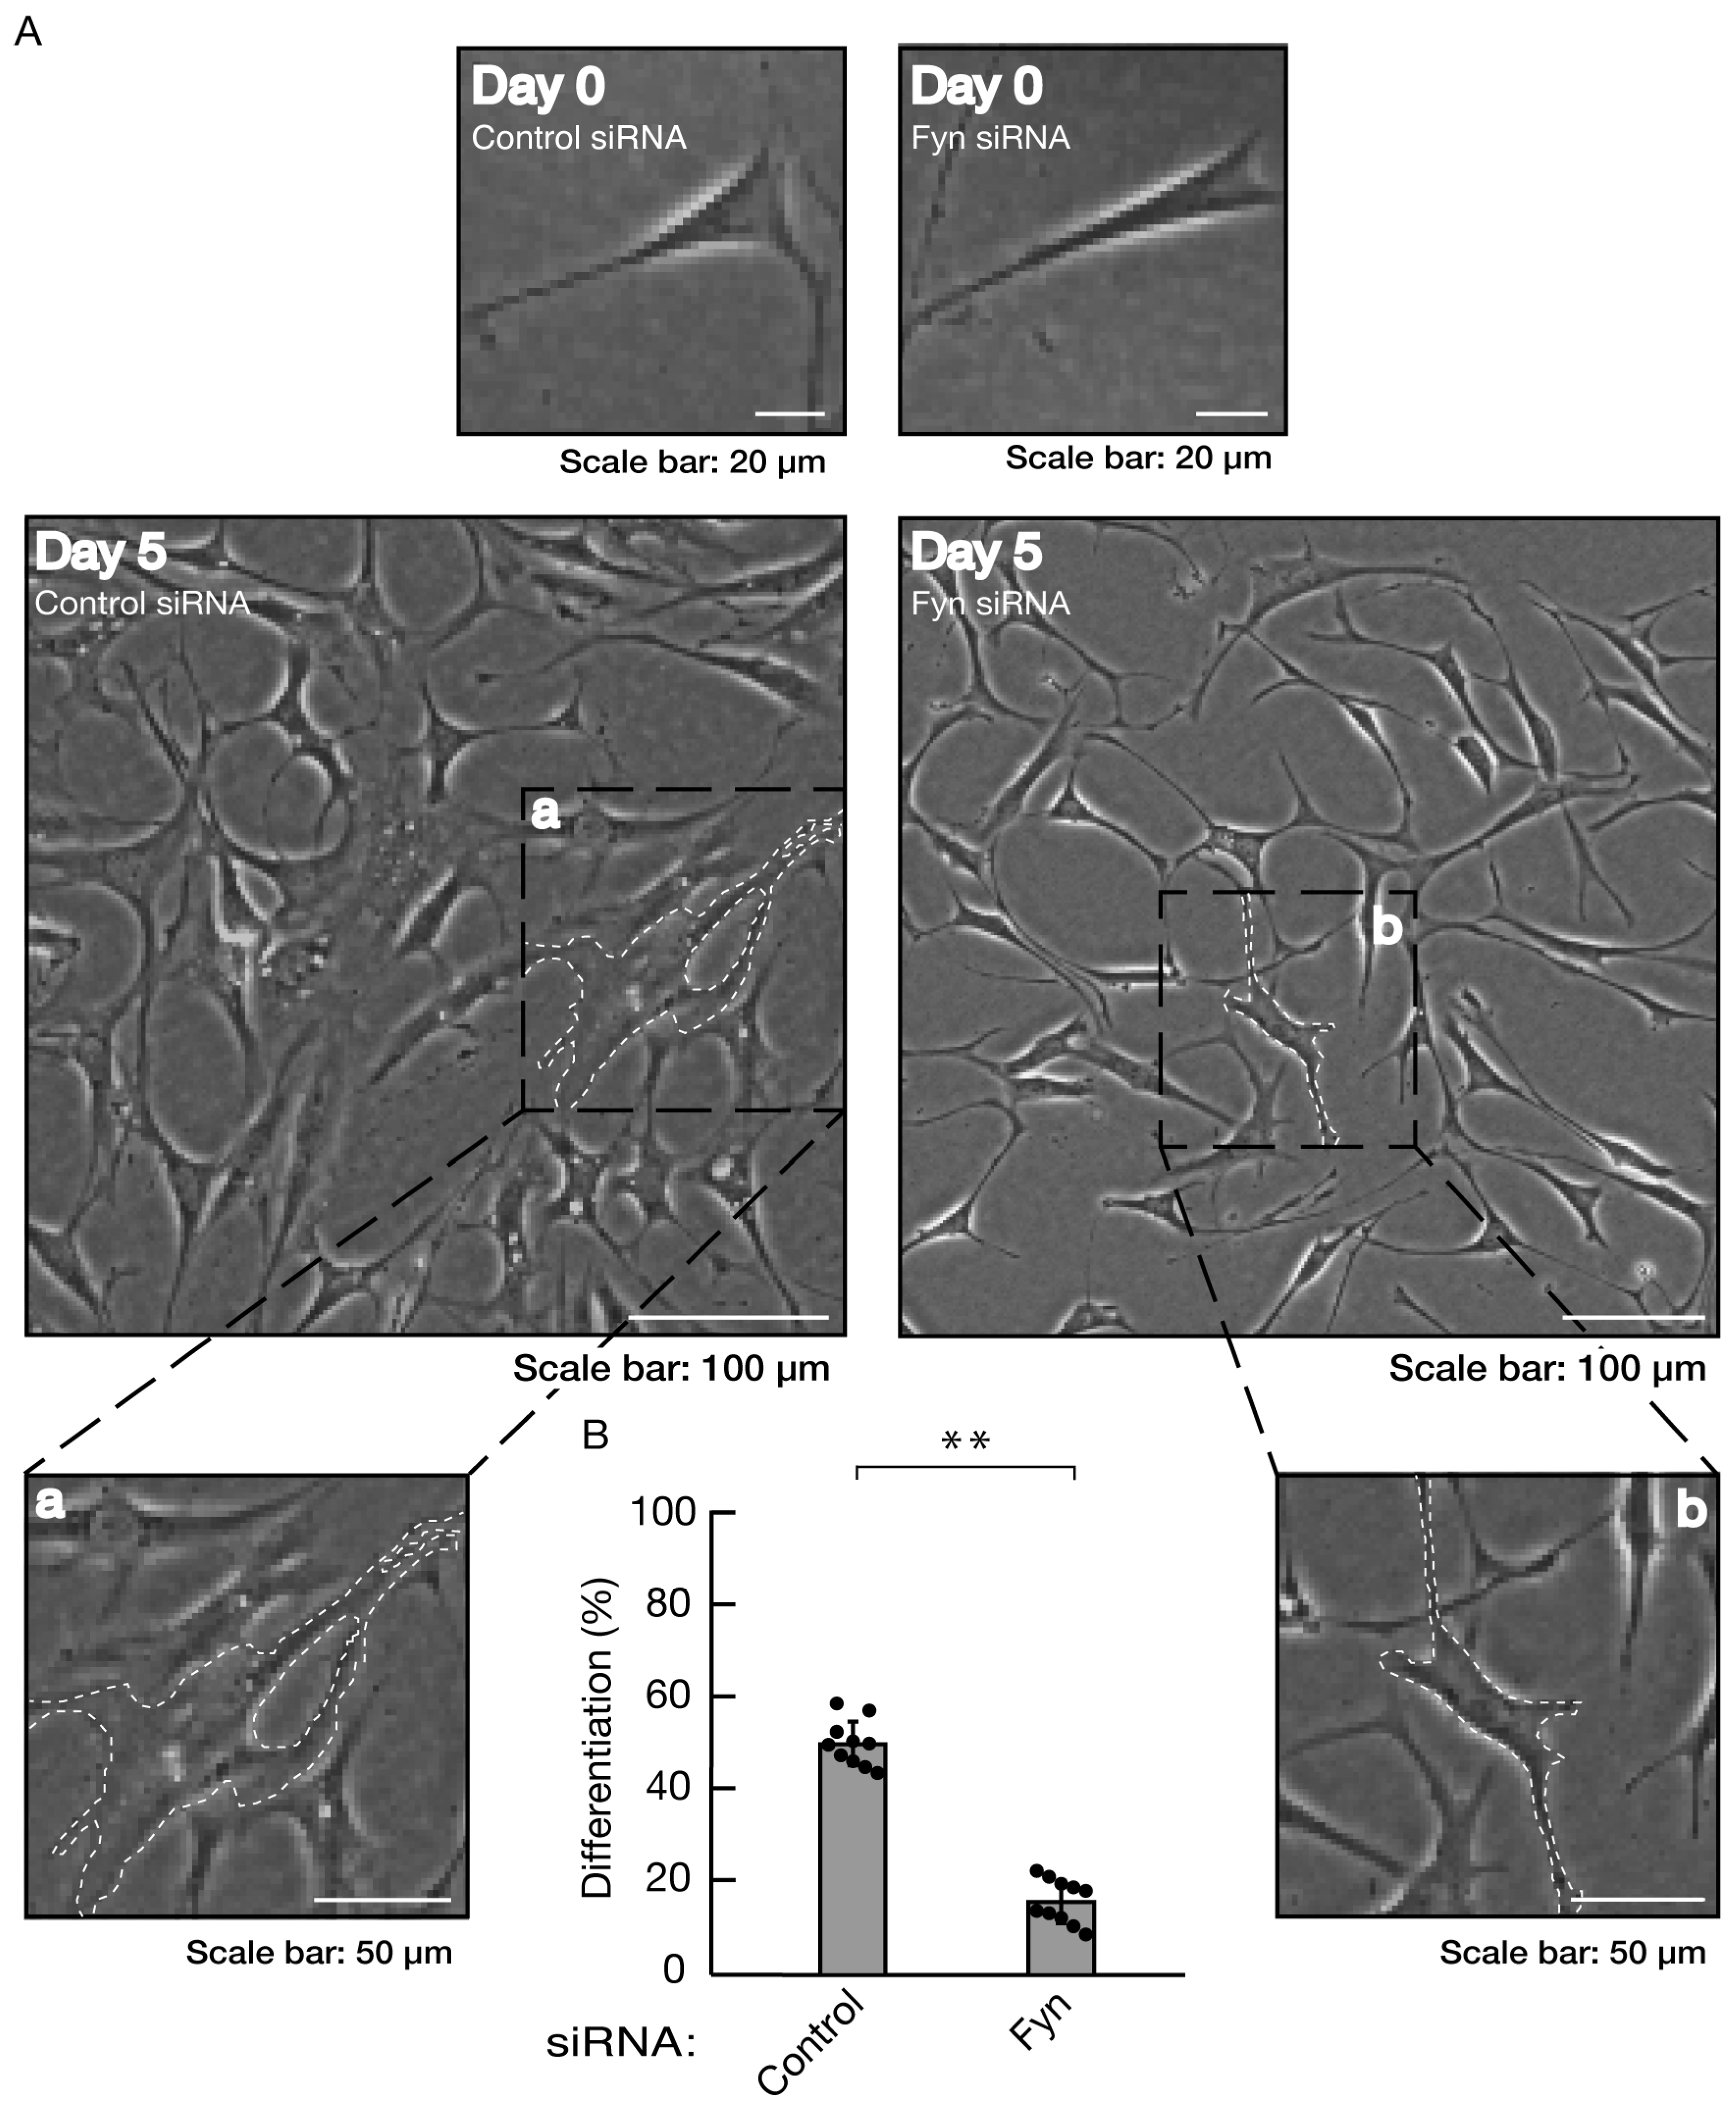
Knockdown of Fyn inhibits morphological differentiation. (A, B) Cells were transfected with siRNA for control or Fyn. Following the induction of differentiation, the respective, cell morphologies at 0 and 5 days were placed as the representative images, analyzed, and statistically depicted (** p<0.01; n = 10 fields). The typical cells with widespread membranes were surrounded with white dotted lines. The black dotted squares (a and b) in large images were placed below as the magnified images (a and b).
Figure 8.
Knockdown of Fyn decreases the expression levels of differentiation markers. Cells were transfected with the plasmids encoding CasRx and gRNA for control or Fyn. Following the induction of differentiation, the respective immunoblots at 5 days were placed as the representative images, analyzed, and statistically depicted (* p<0.05; n = 3 blots).
Figure 9.
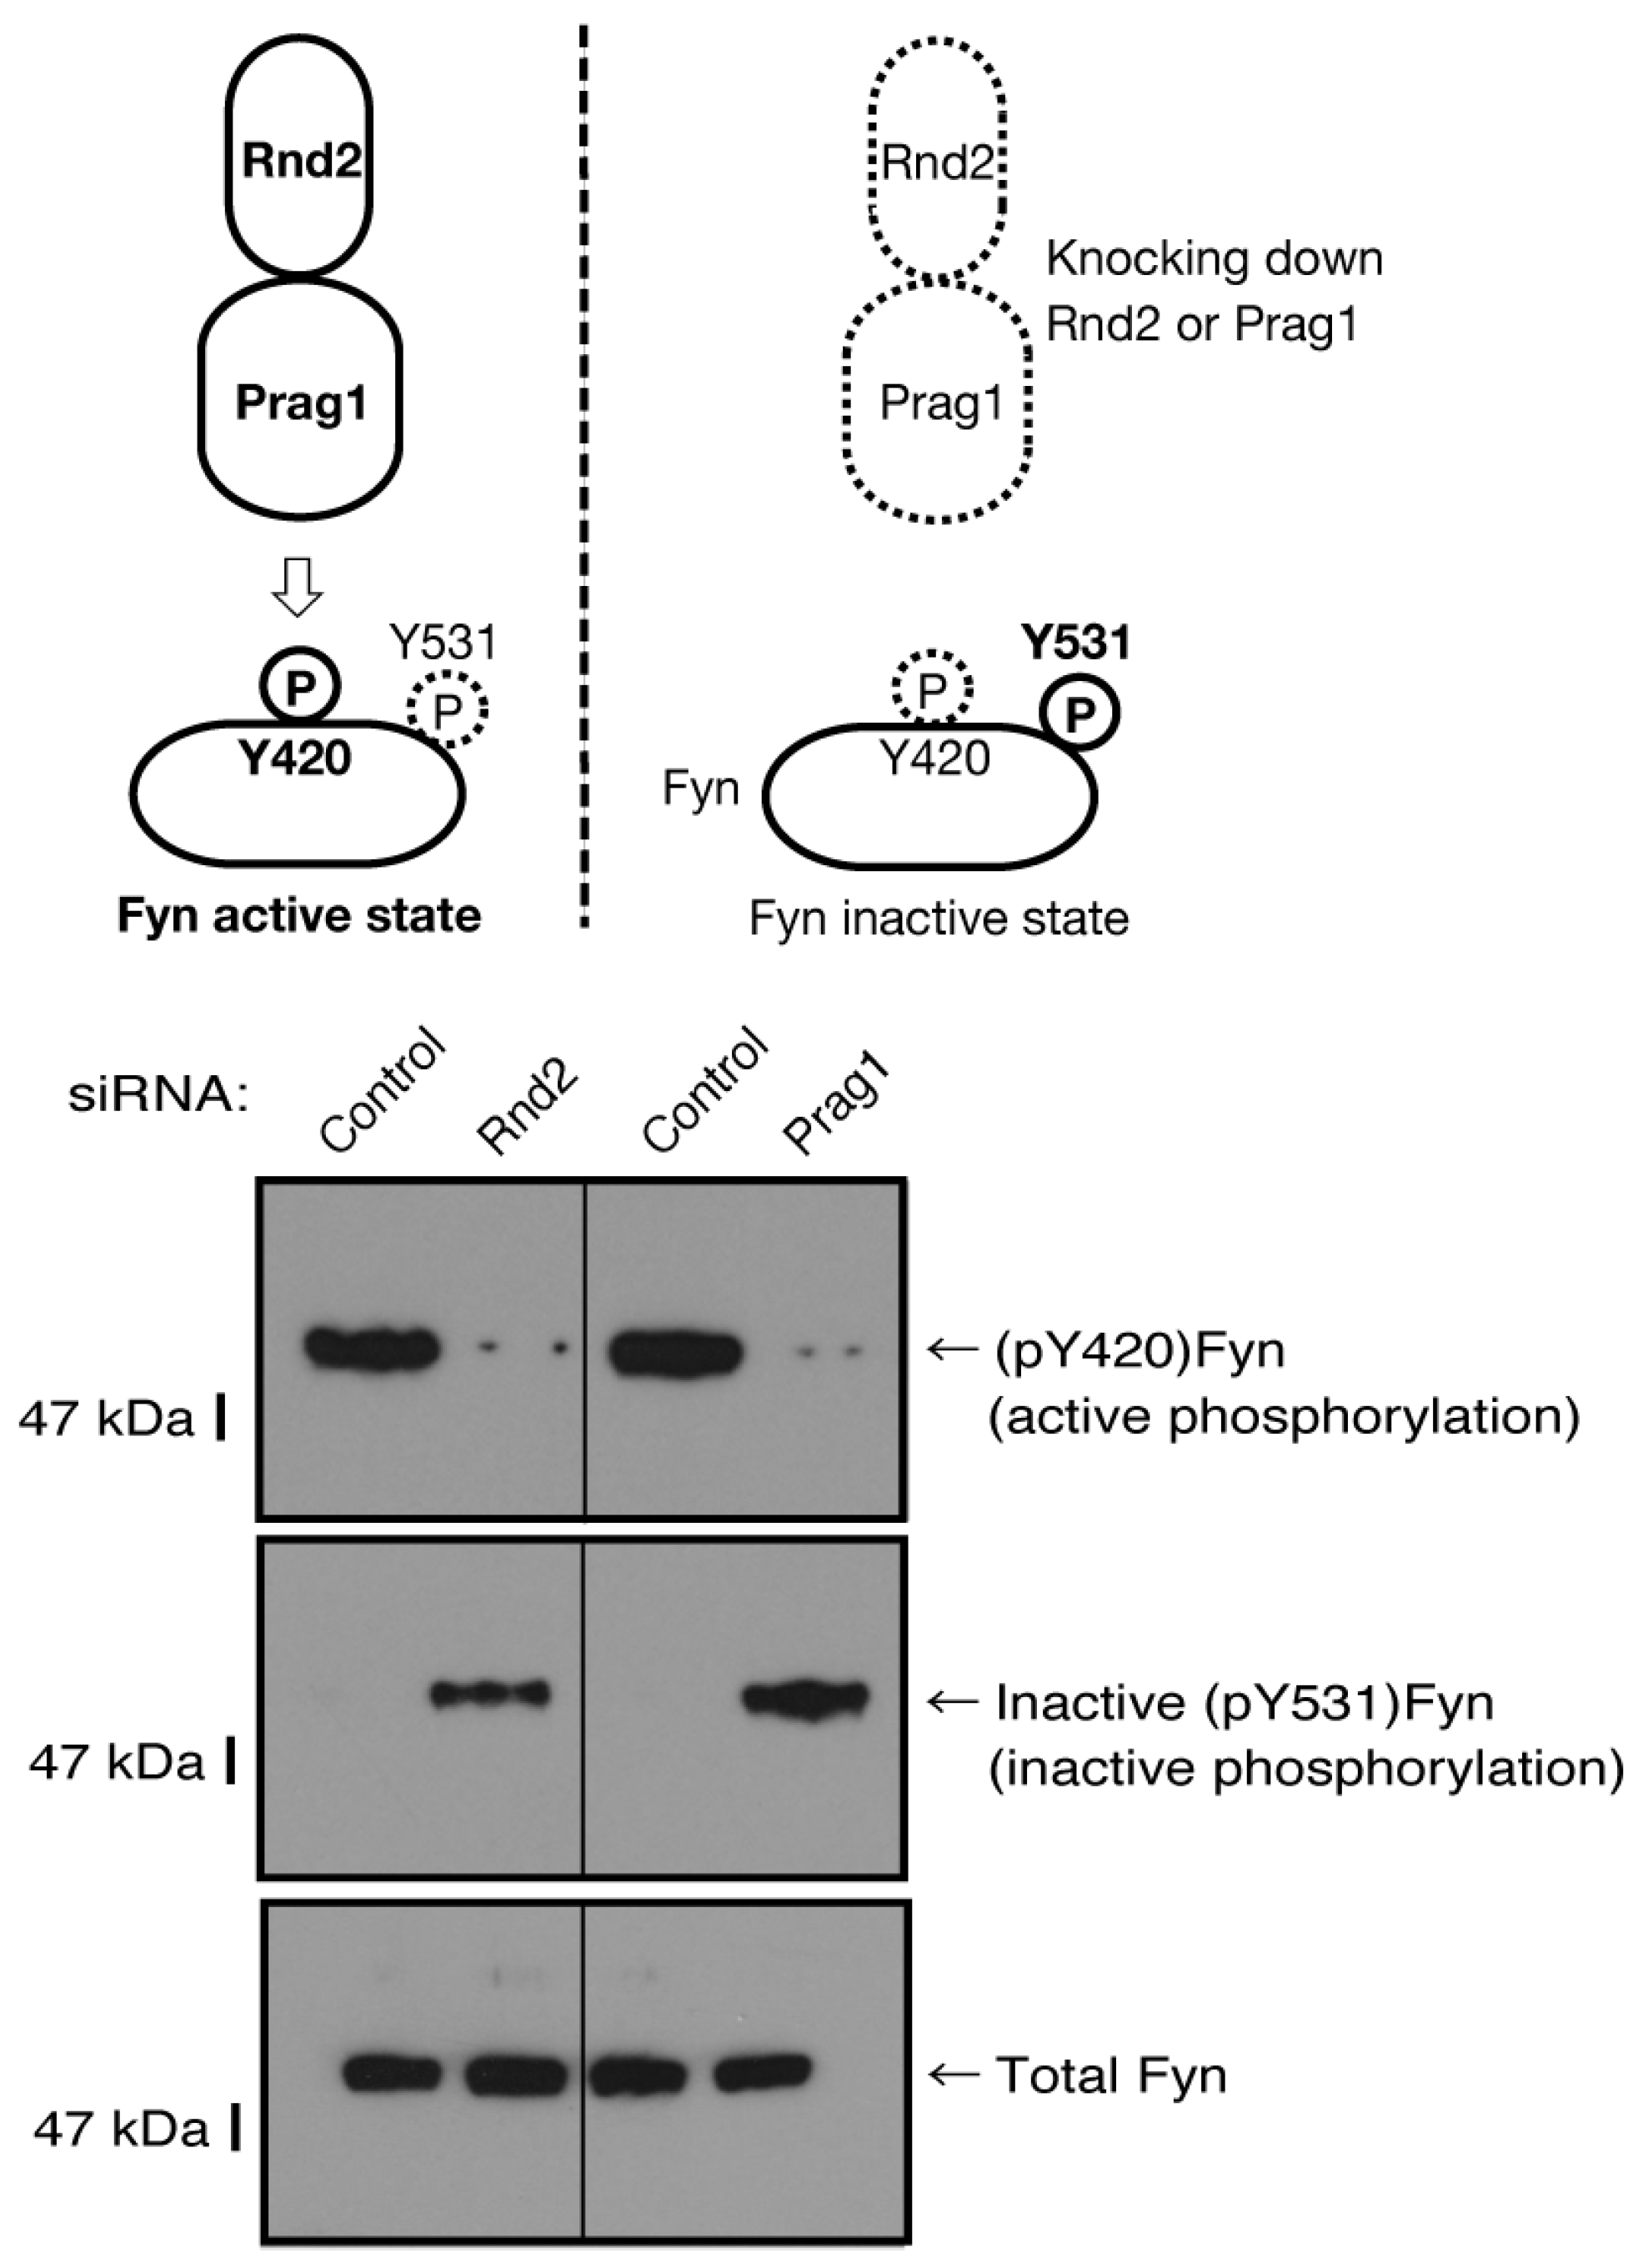
The effects of knockdown of Rnd2 or Parg1 on Fyn phosphorylation states. Cells were transfected with siRNA for control or Rnd2; and also with siRNA for control or Prag1. The respective immunoblots for (pTyr[Y]420)Fyn (active phosphorylation of Y420) or inactive (pY531)Fyn (inactive phosphorylation of Y531) in Fyn immune-precipitates as well as Fyn (total Fyn) were placed as the representative images of 3 blots.
Figure 10.
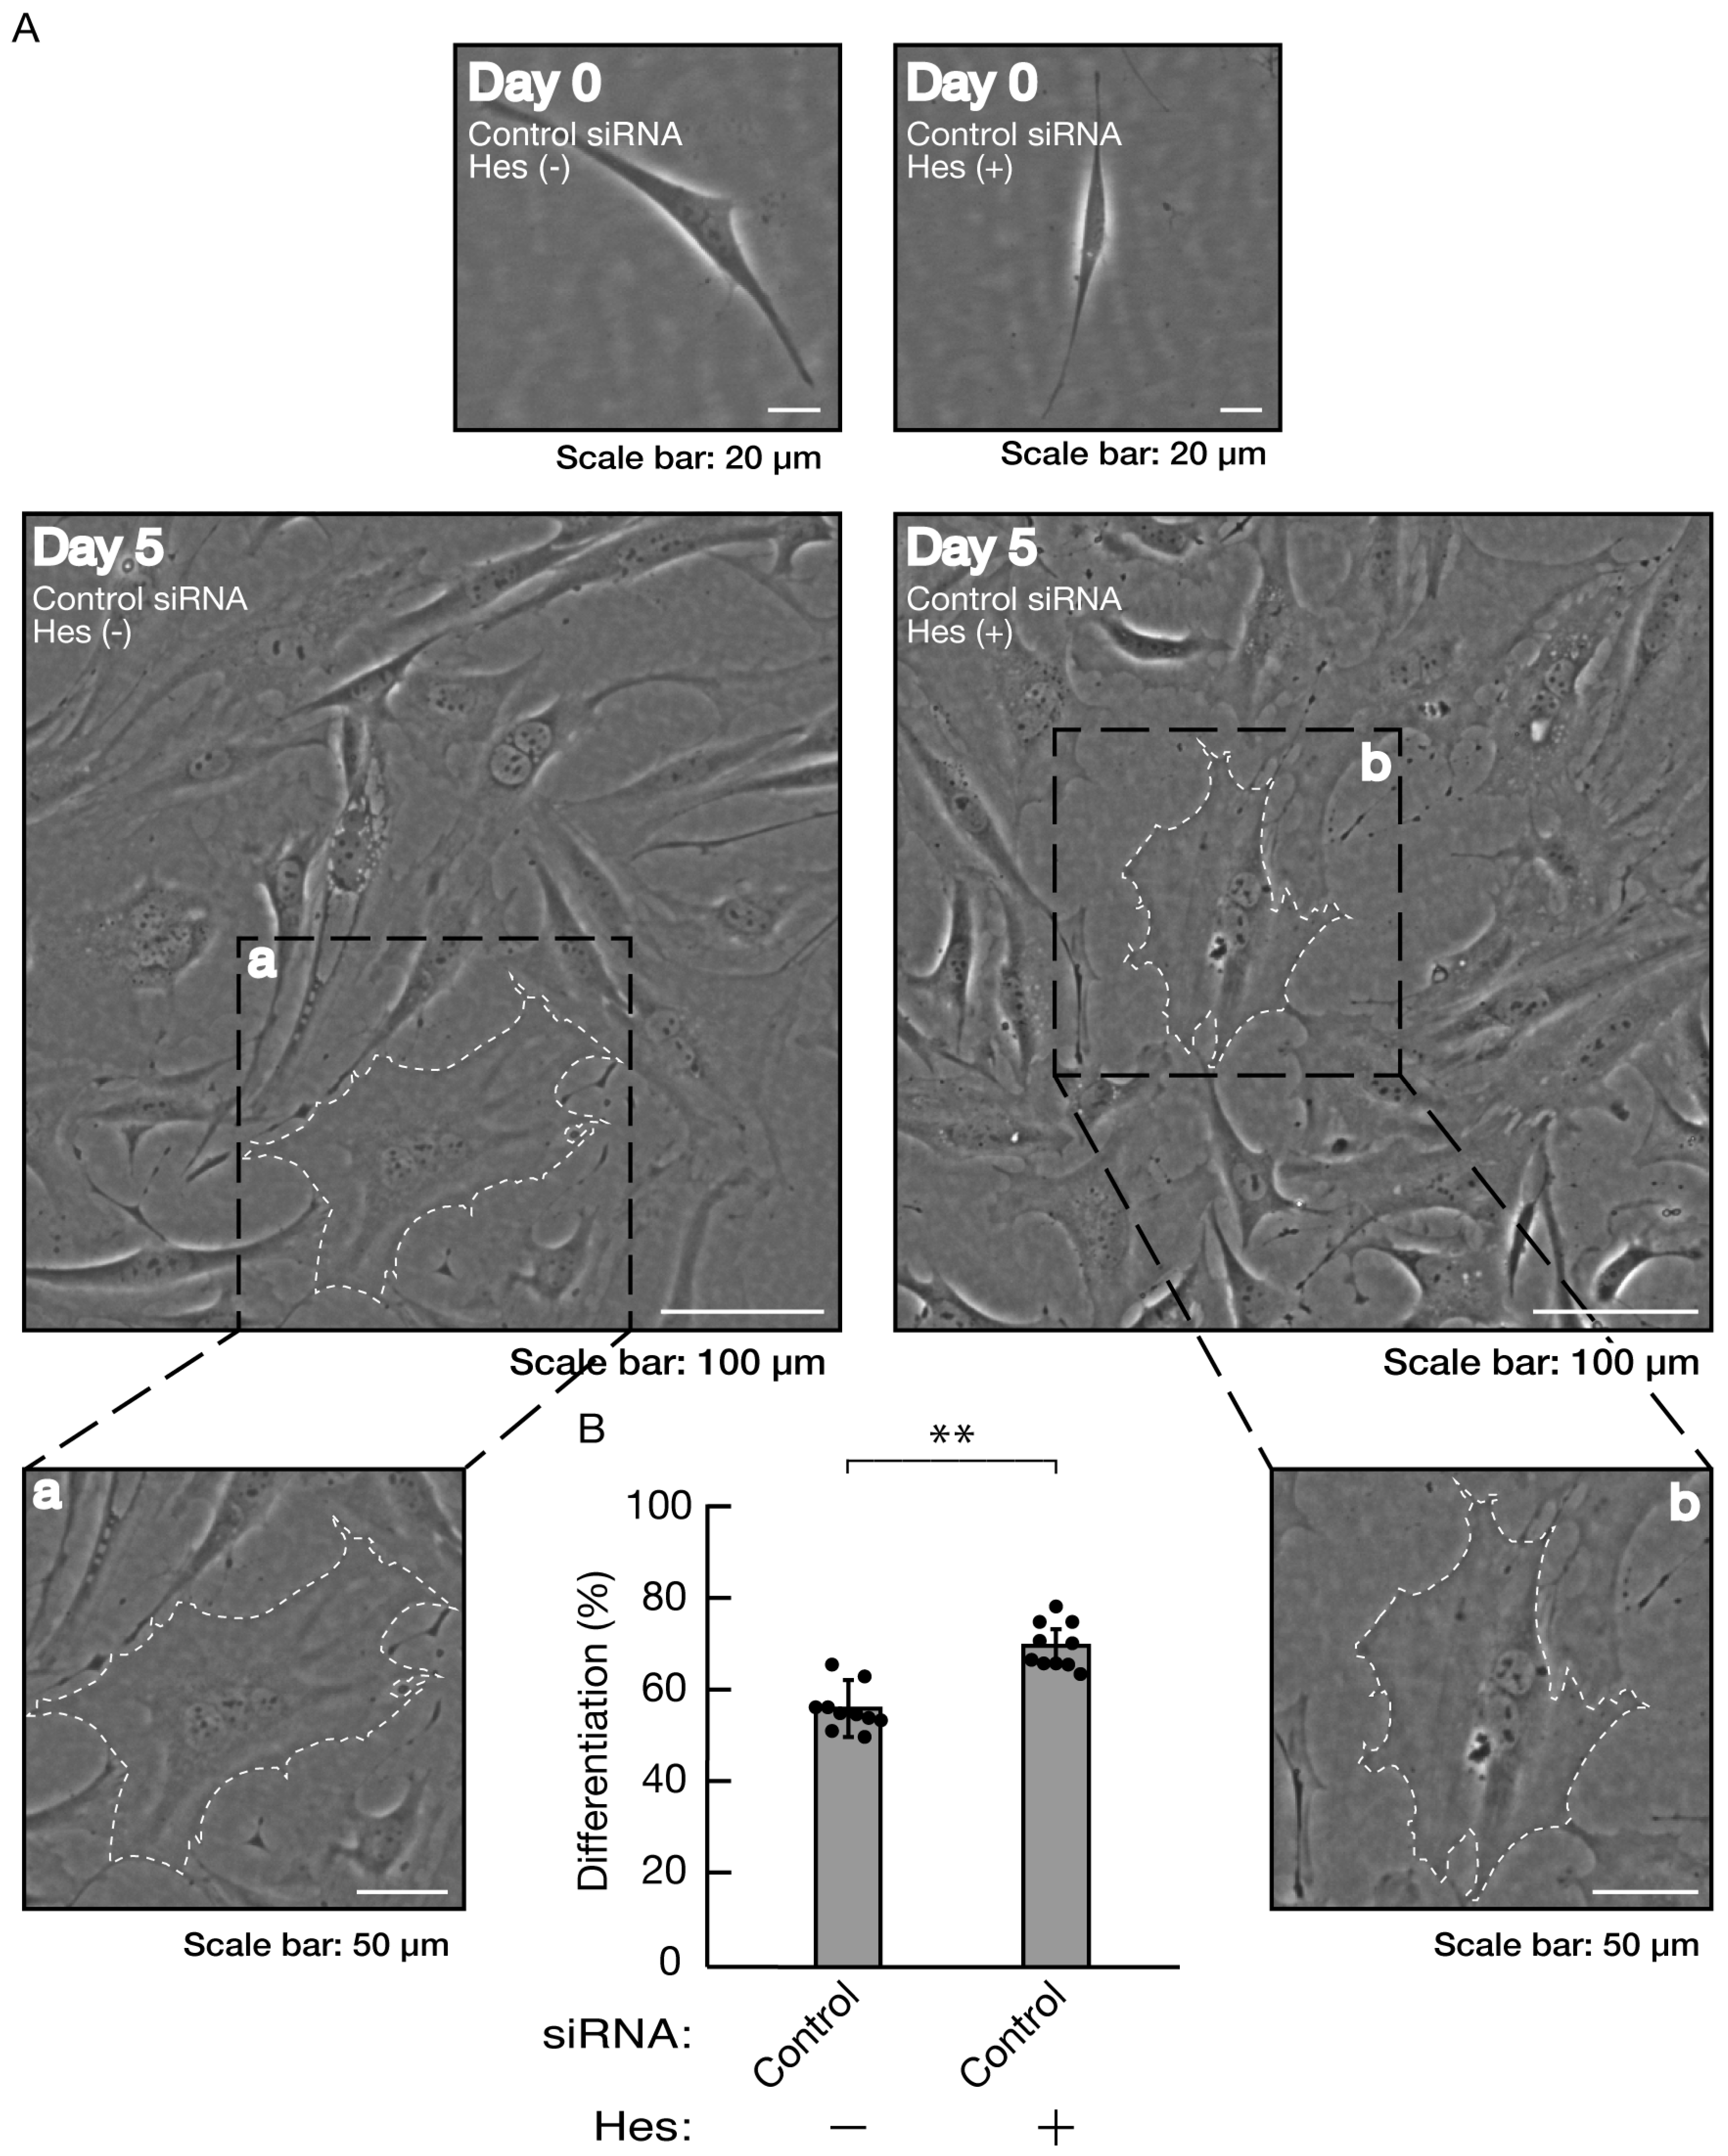
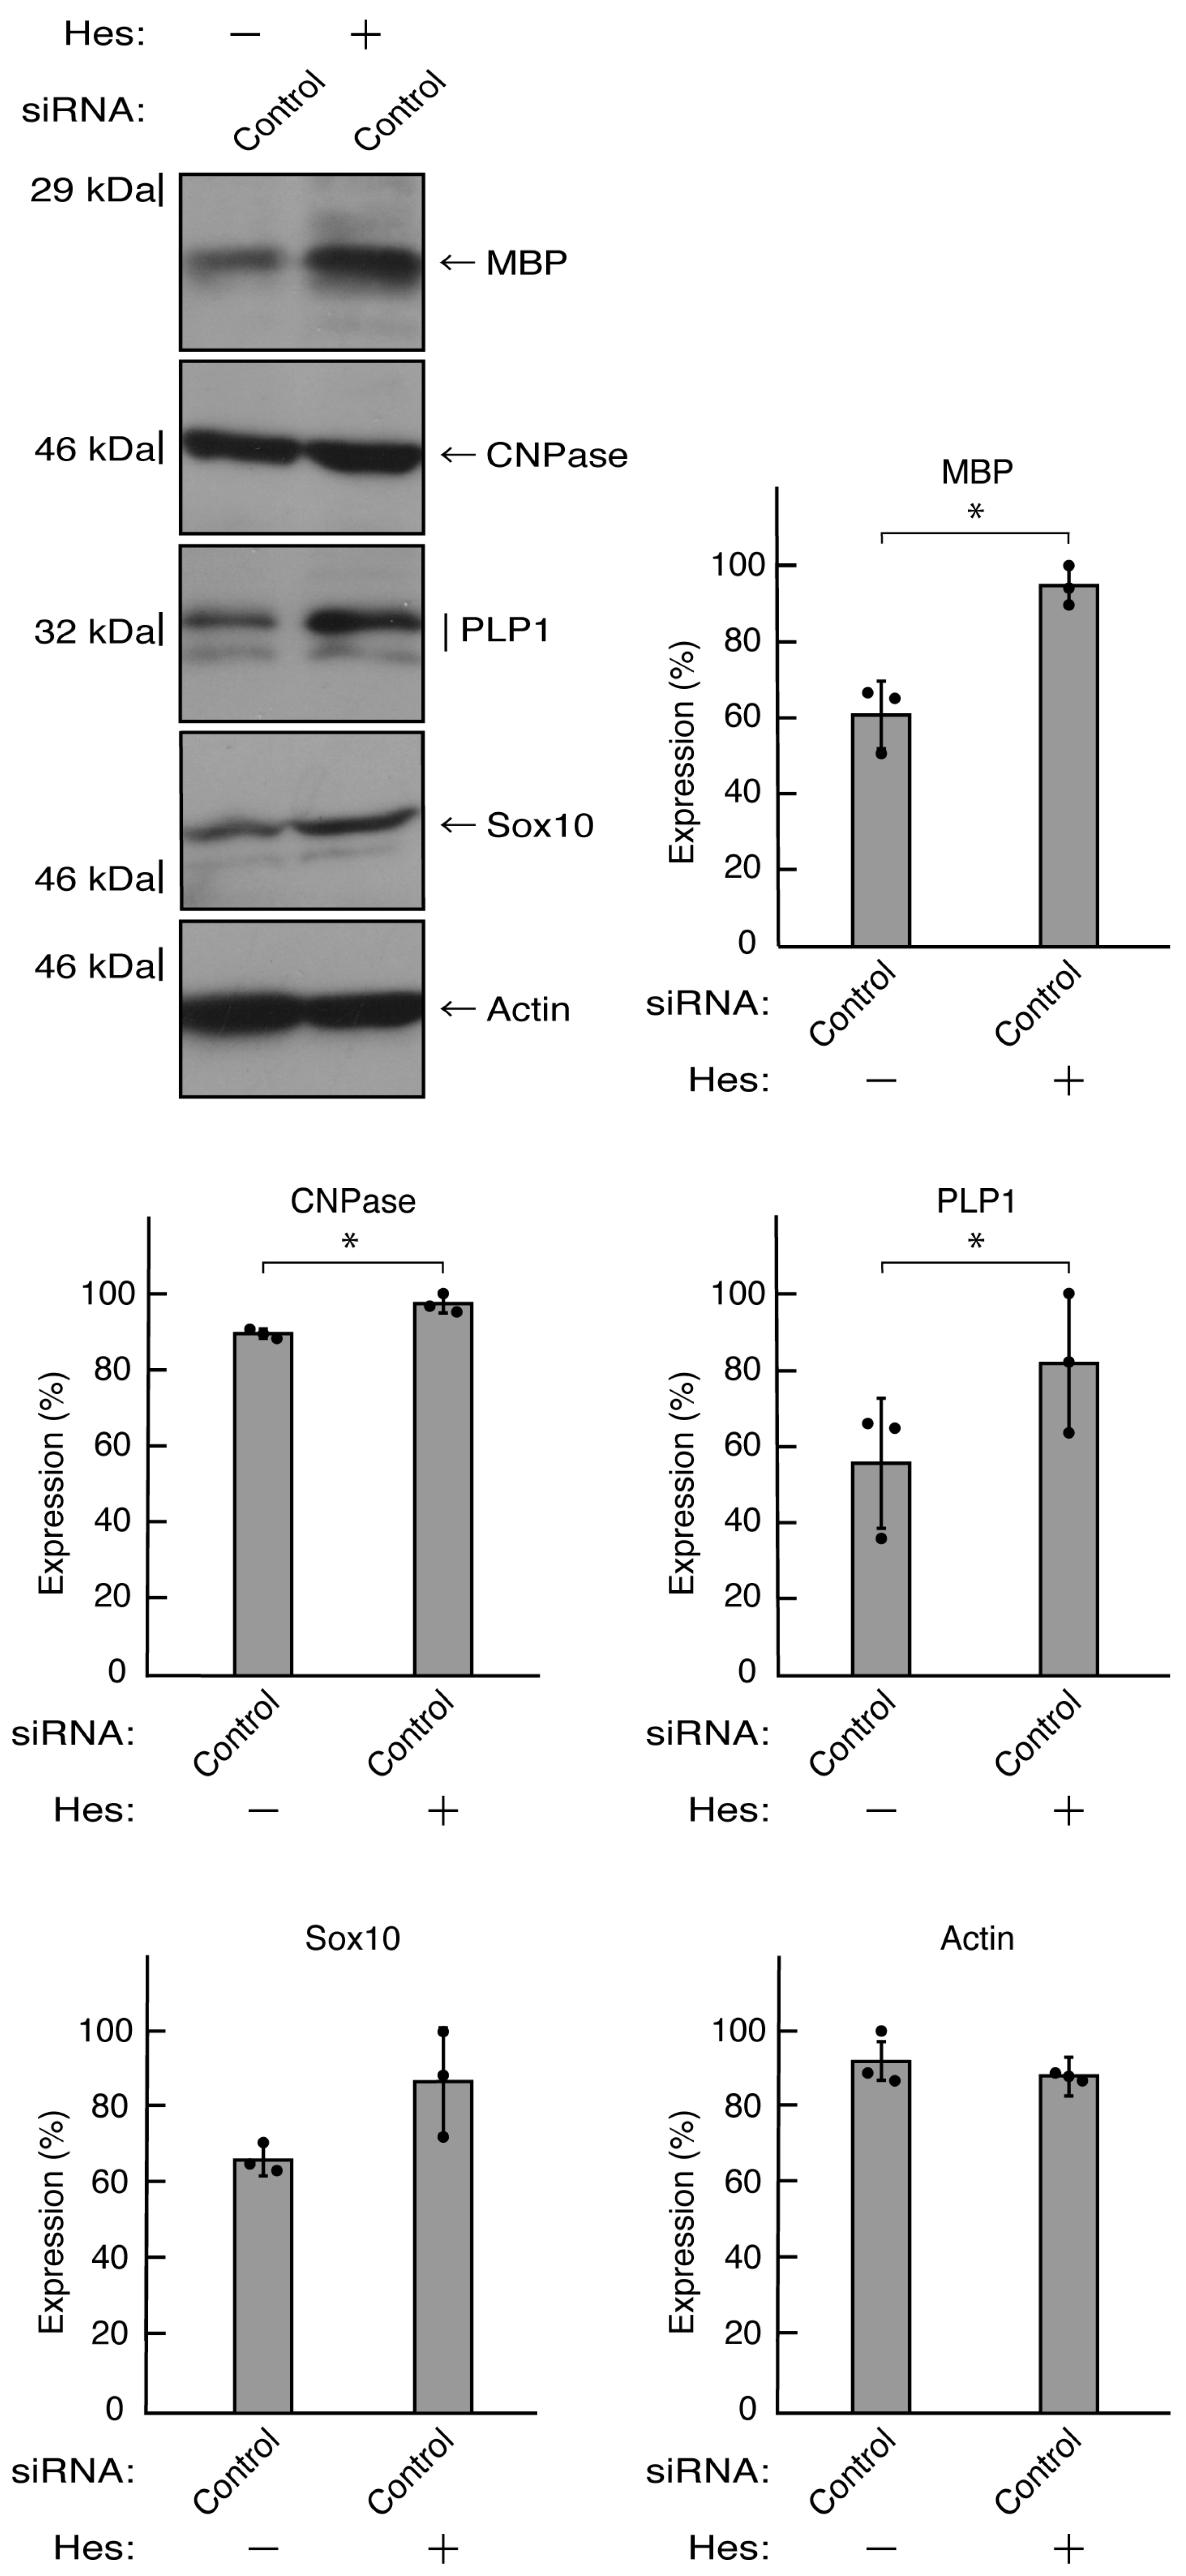
The effects of hesperetin on morphological differentiation in control knockdown conditions. (A, B) Cells were transfected with siRNA for control (luciferase) in the presence or absence (vehicle control) of hesperetin (Hes). Following the induction of differentiation, the respective, cell morphologies at 0 and 5 days were placed as the representative images, analyzed, and statistically depicted (** p<0.01; n = 10 fields). The typical cells with widespread membranes were surrounded with white dotted lines. The black dotted squares (a and b) in large images were placed below as the magnified images (a and b).
Figure 11.
The effects of hesperetin on the expression levels of differentiation markers in control knockdown conditions. Cells were transfected with siRNA for control (luciferase) in the presence or absence (vehicle control) of hesperetin (Hes). Following the induction of differentiation, the respective immunoblots at 5 days were placed as the representative images, analyzed, and statistically depicted (* p<0.05; n = 3 blots).
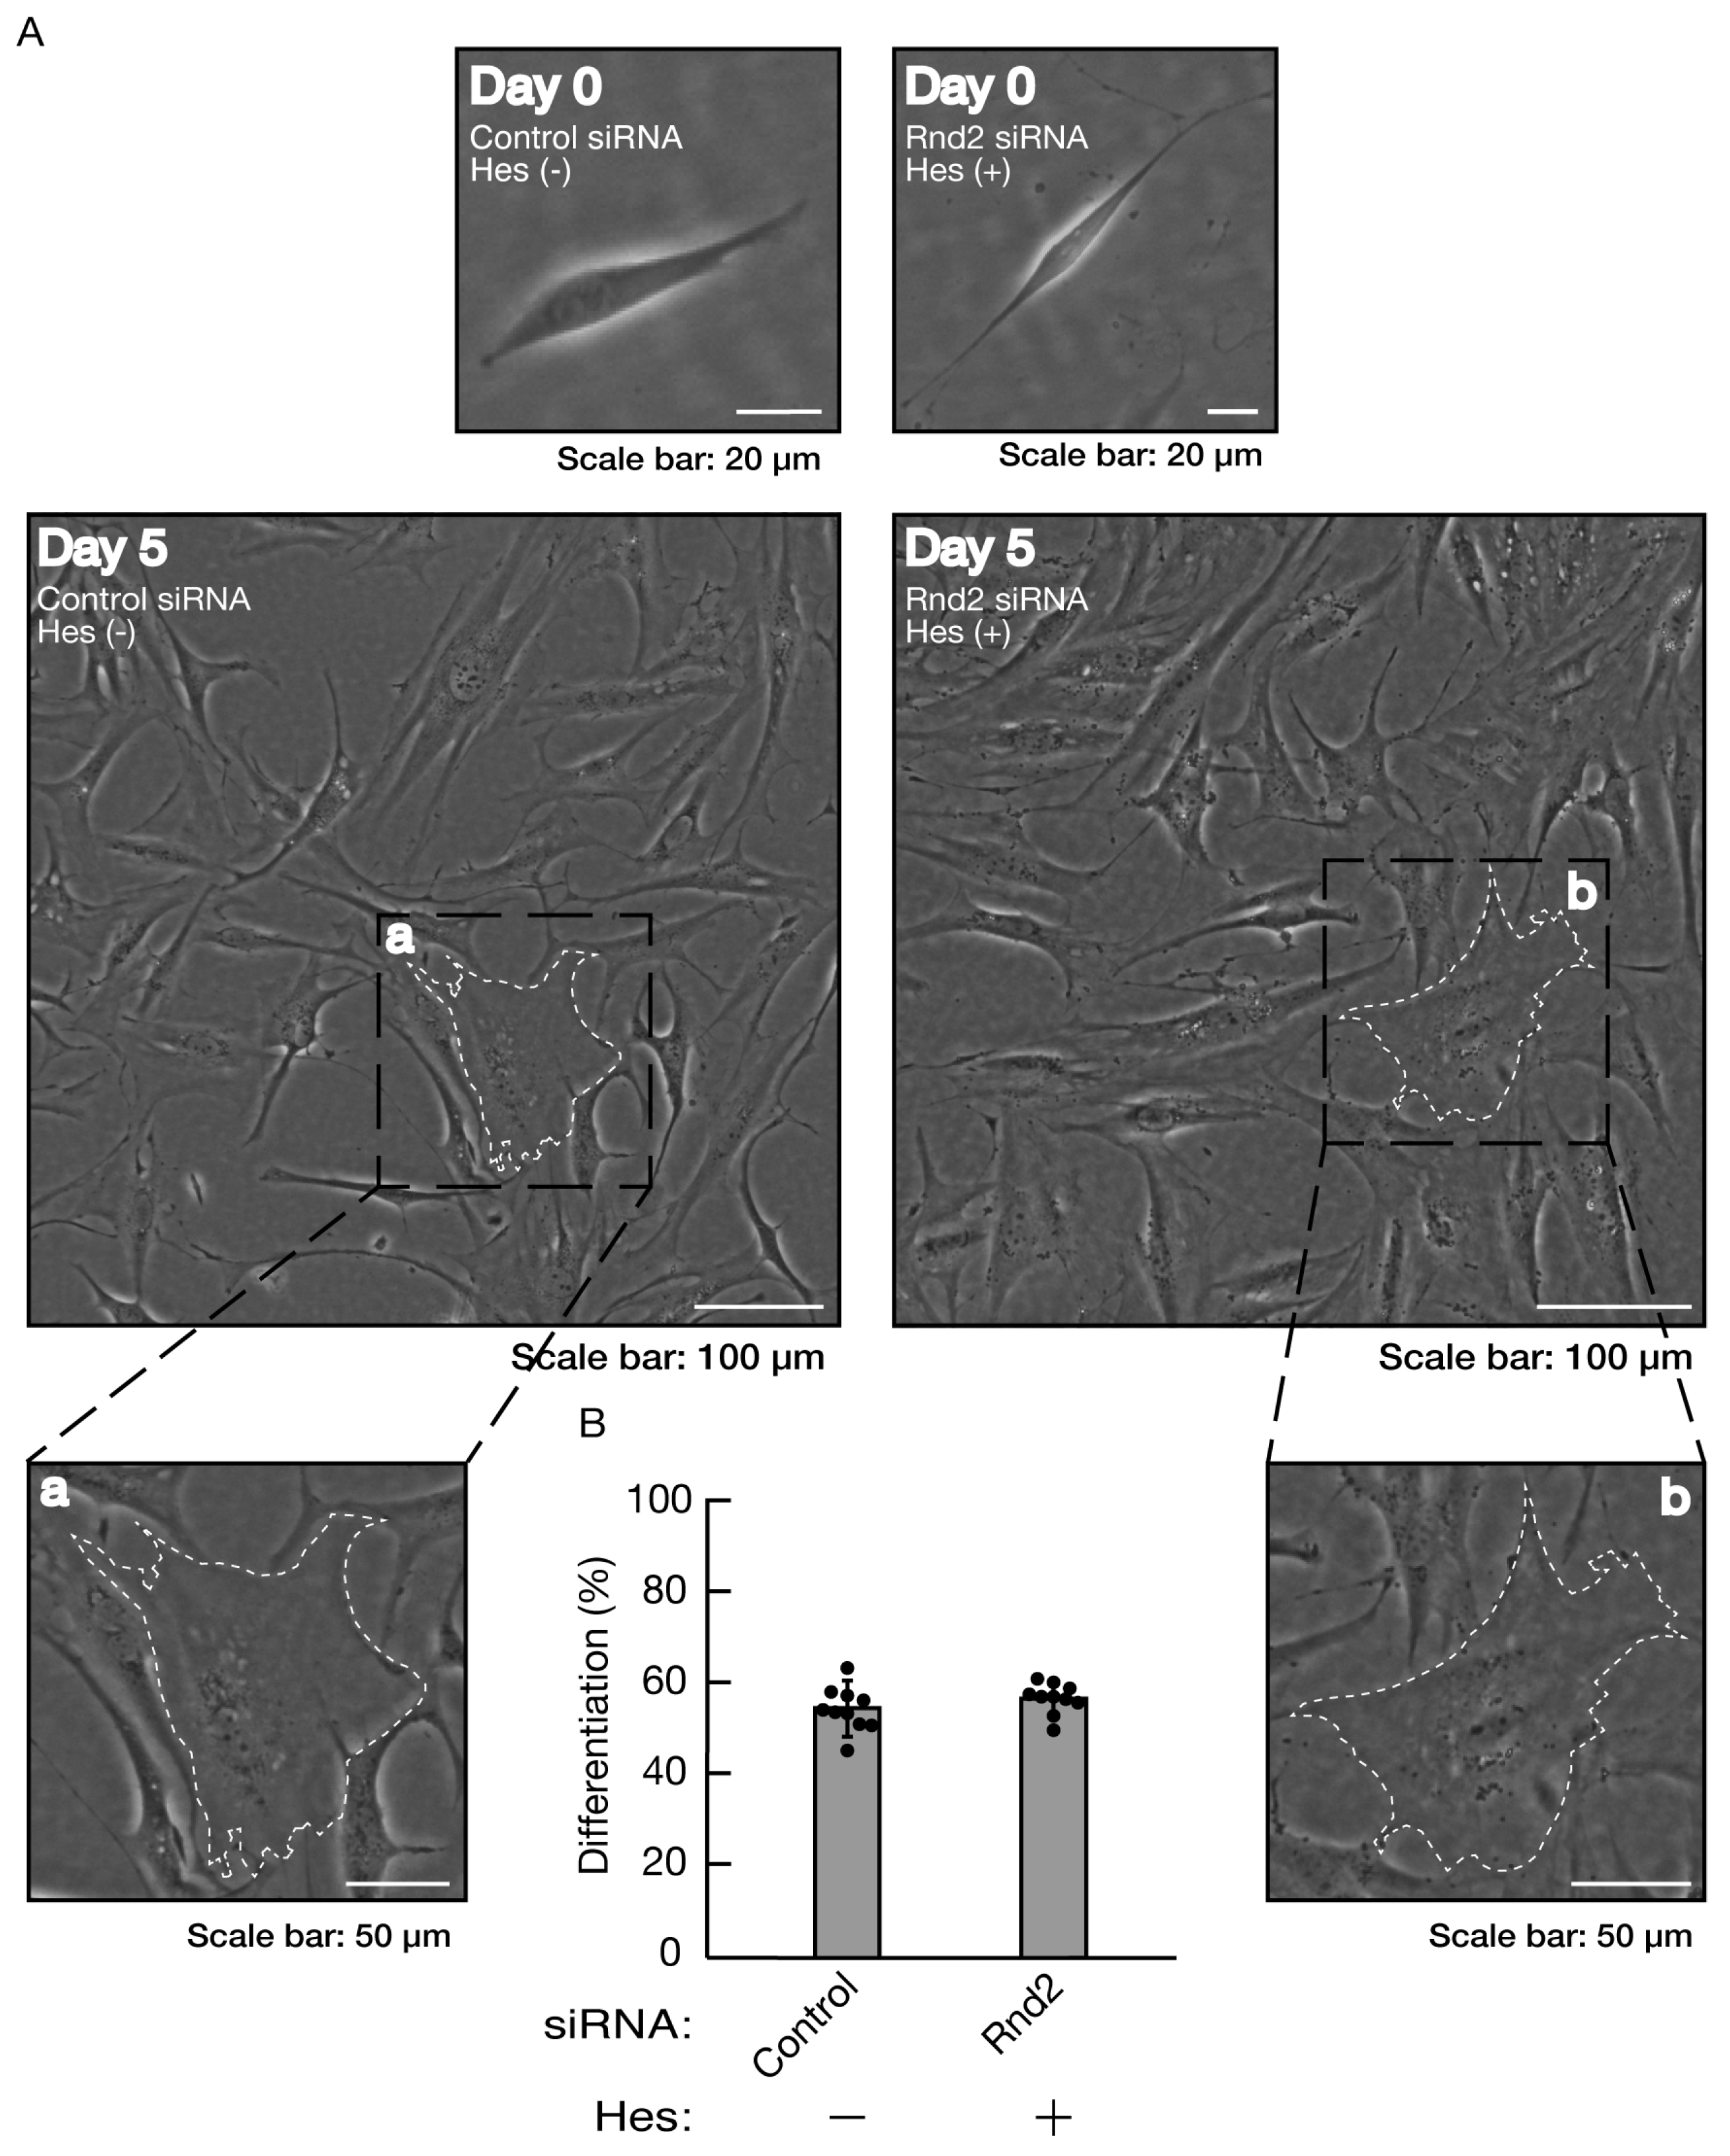
Figure 12.
Hesperetin recovers inhibition of morphological differentiation by knockdown of Rnd2. (A, B) Cells were transfected with siRNA for control or Rnd2 in the presence or absence of hesperetin (Hes). Following the induction of differentiation, the respective, cell morphologies at 0 and 5 days were placed as the representative images, analyzed, and statistically depicted (n = 10 fields). The typical cells with widespread membranes were surrounded with white dotted lines. The black dotted squares (a and b) in large images were placed below as the magnified images (a and b).
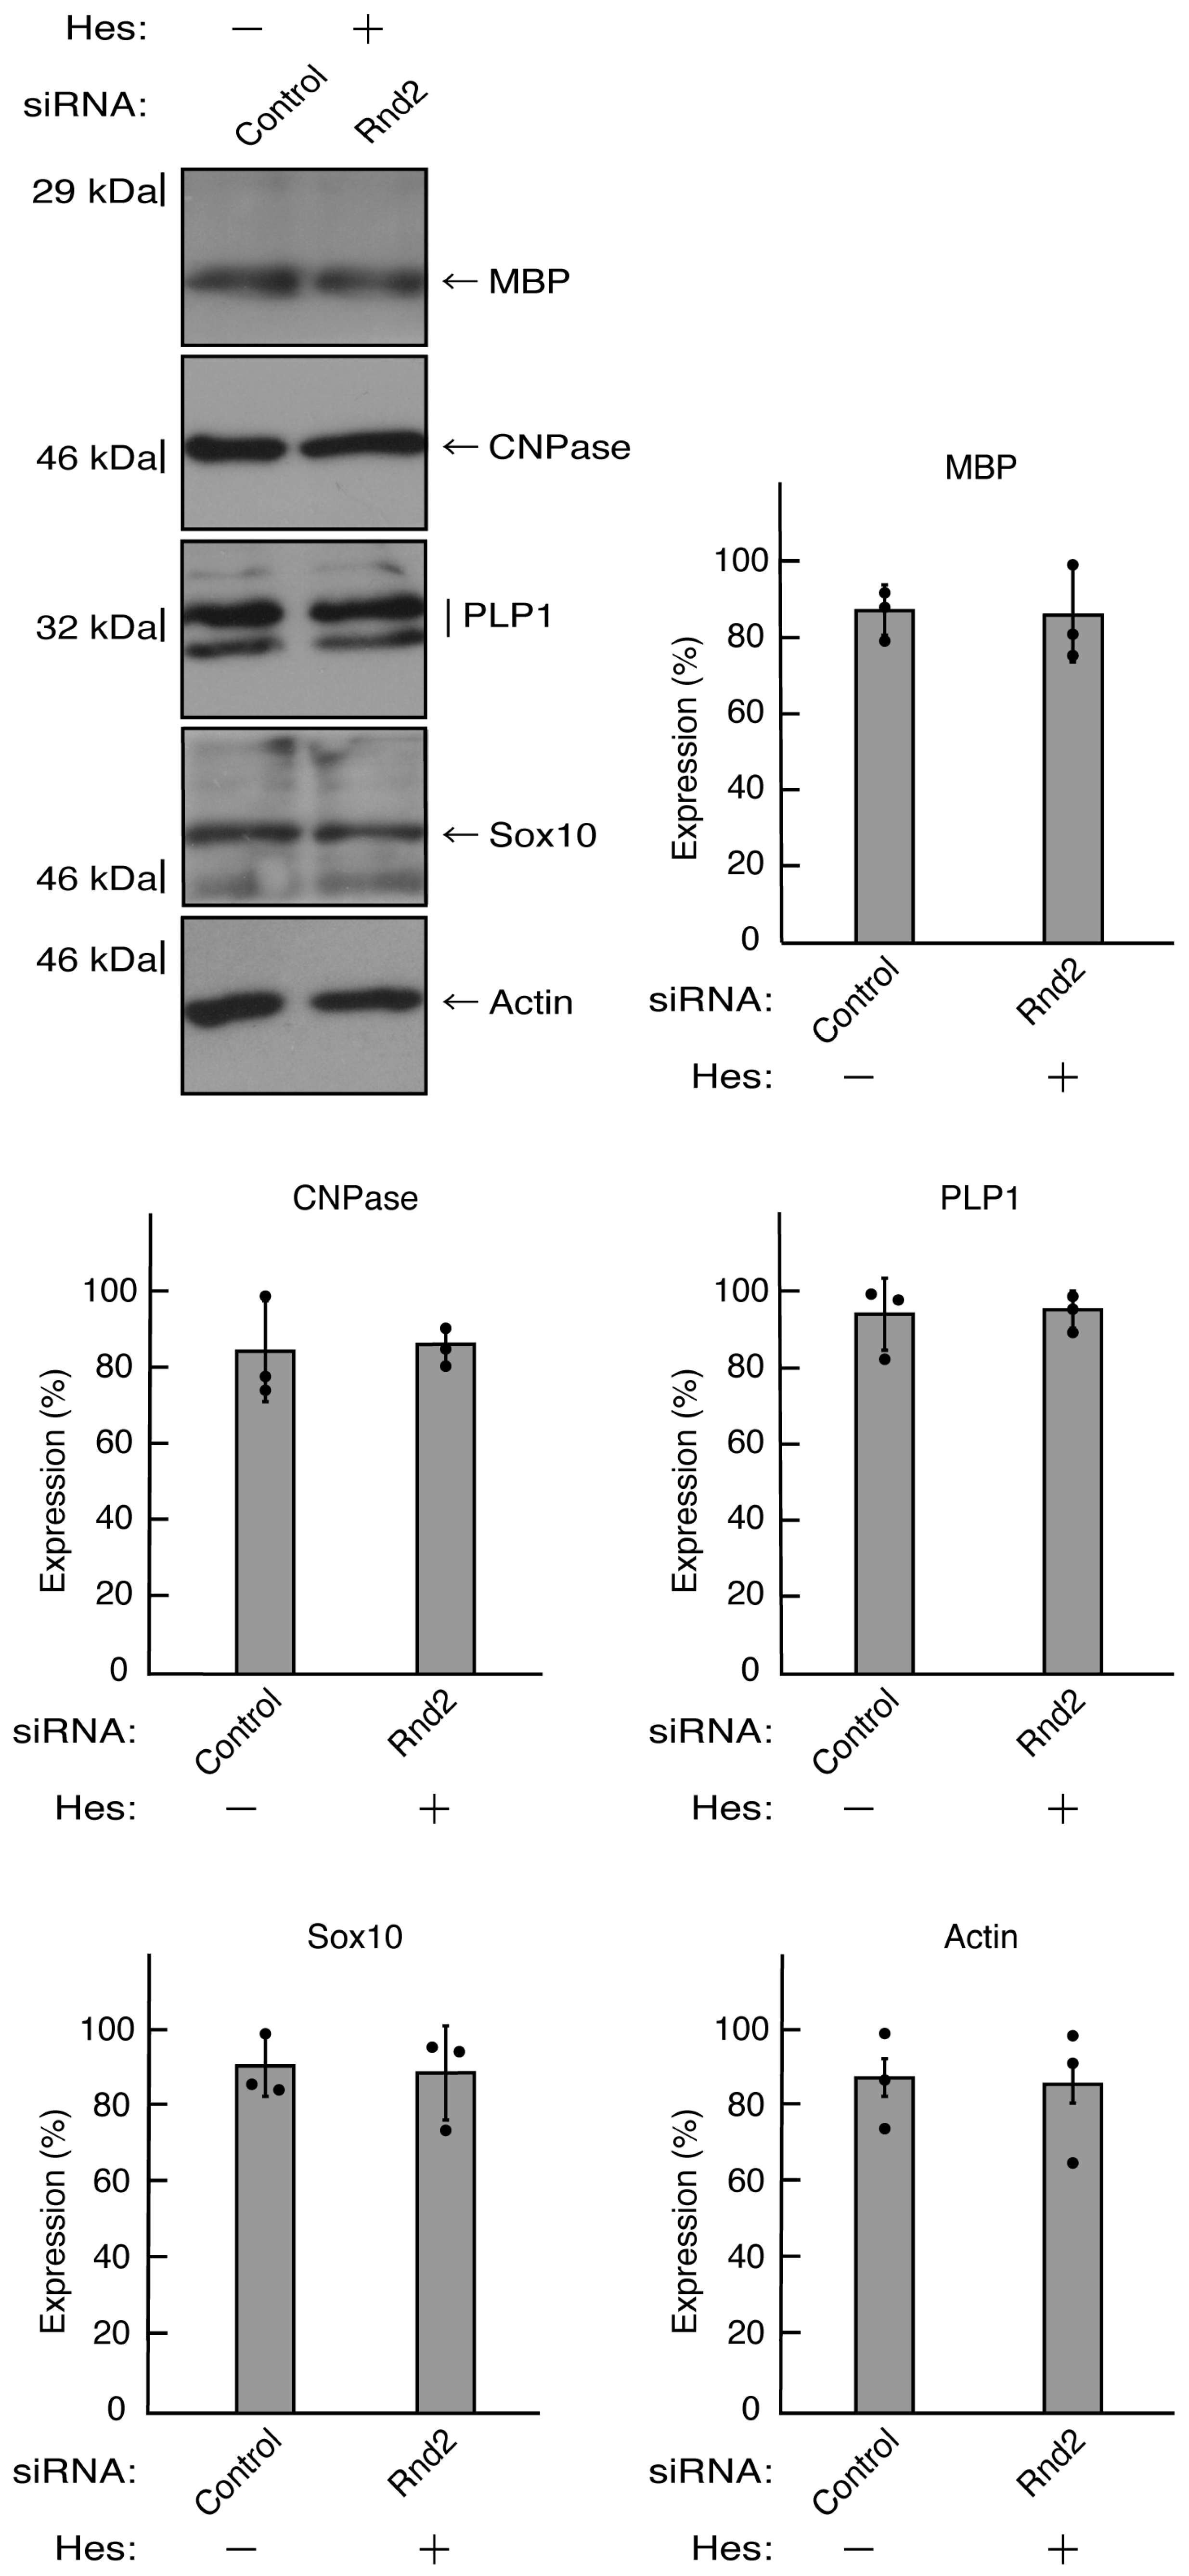
Figure 13.
Hesperetin recovers decreased expression levels of differentiation markers by knockdown of Rnd2. Cells were transfected with siRNA for control or Rnd2 in the presence or absence of hesperetin (Hes). Following the induction of differentiation, the respective immunoblots at 5 days were placed as the representative images, analyzed, and statistically depicted (n = 3 blots).
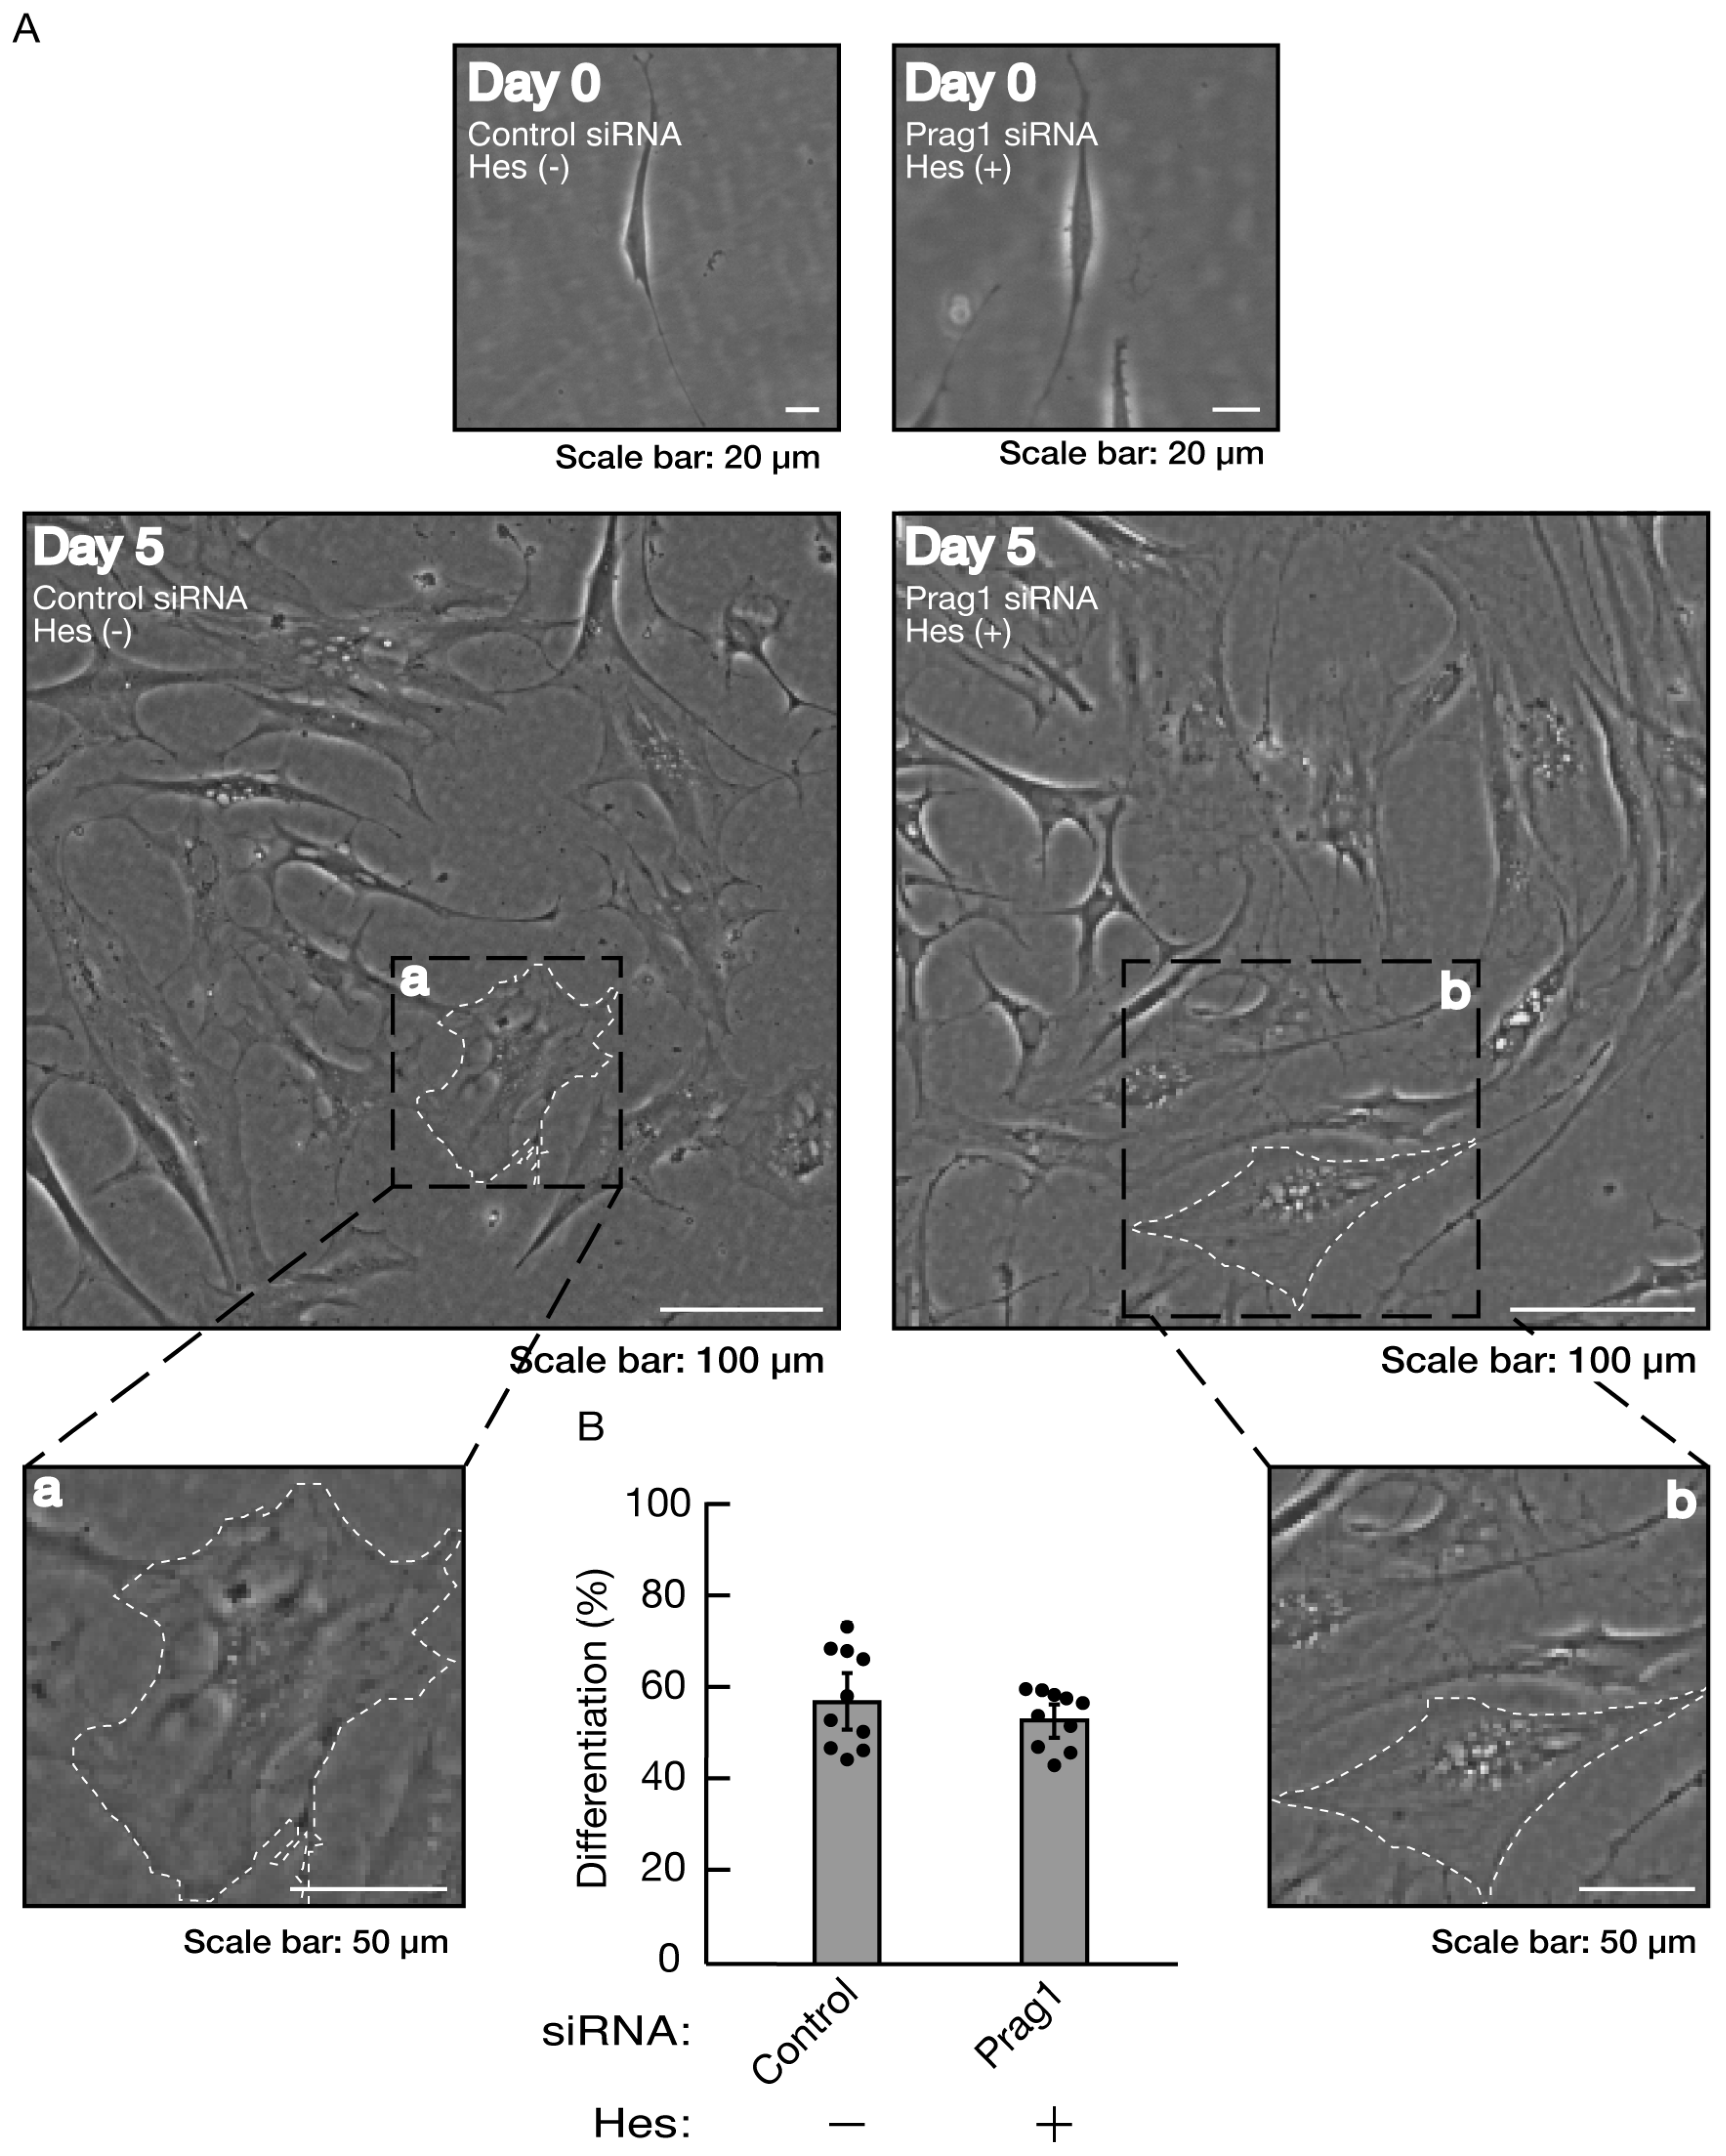
Figure 14.
Hesperetin recovers inhibition of morphological differentiation by knockdown of Prag1. (A, B) Cells were transfected with siRNA for control or Prag1 in the presence or absence of hesperetin (Hes). Following the induction of differentiation, the respective, cell morphologies at 0 and 5 days were placed as the representative images, analyzed, and statistically depicted (n = 10 fields). The typical cells with widespread membranes were surrounded with white dotted lines. The black dotted squares (a and b) in large images were placed below as the magnified images (a and b).
Figure 15.
Hesperetin recovers decreased expression levels of differentiation markers by knockdown of Prag1. Cells were transfected with siRNA for control or Prag1 in the presence or absence of hesperetin (Hes). Following the induction of differentiation, the respective immunoblots at 5 days were placed as the representative images, analyzed, and statistically depicted (n = 3 blots).
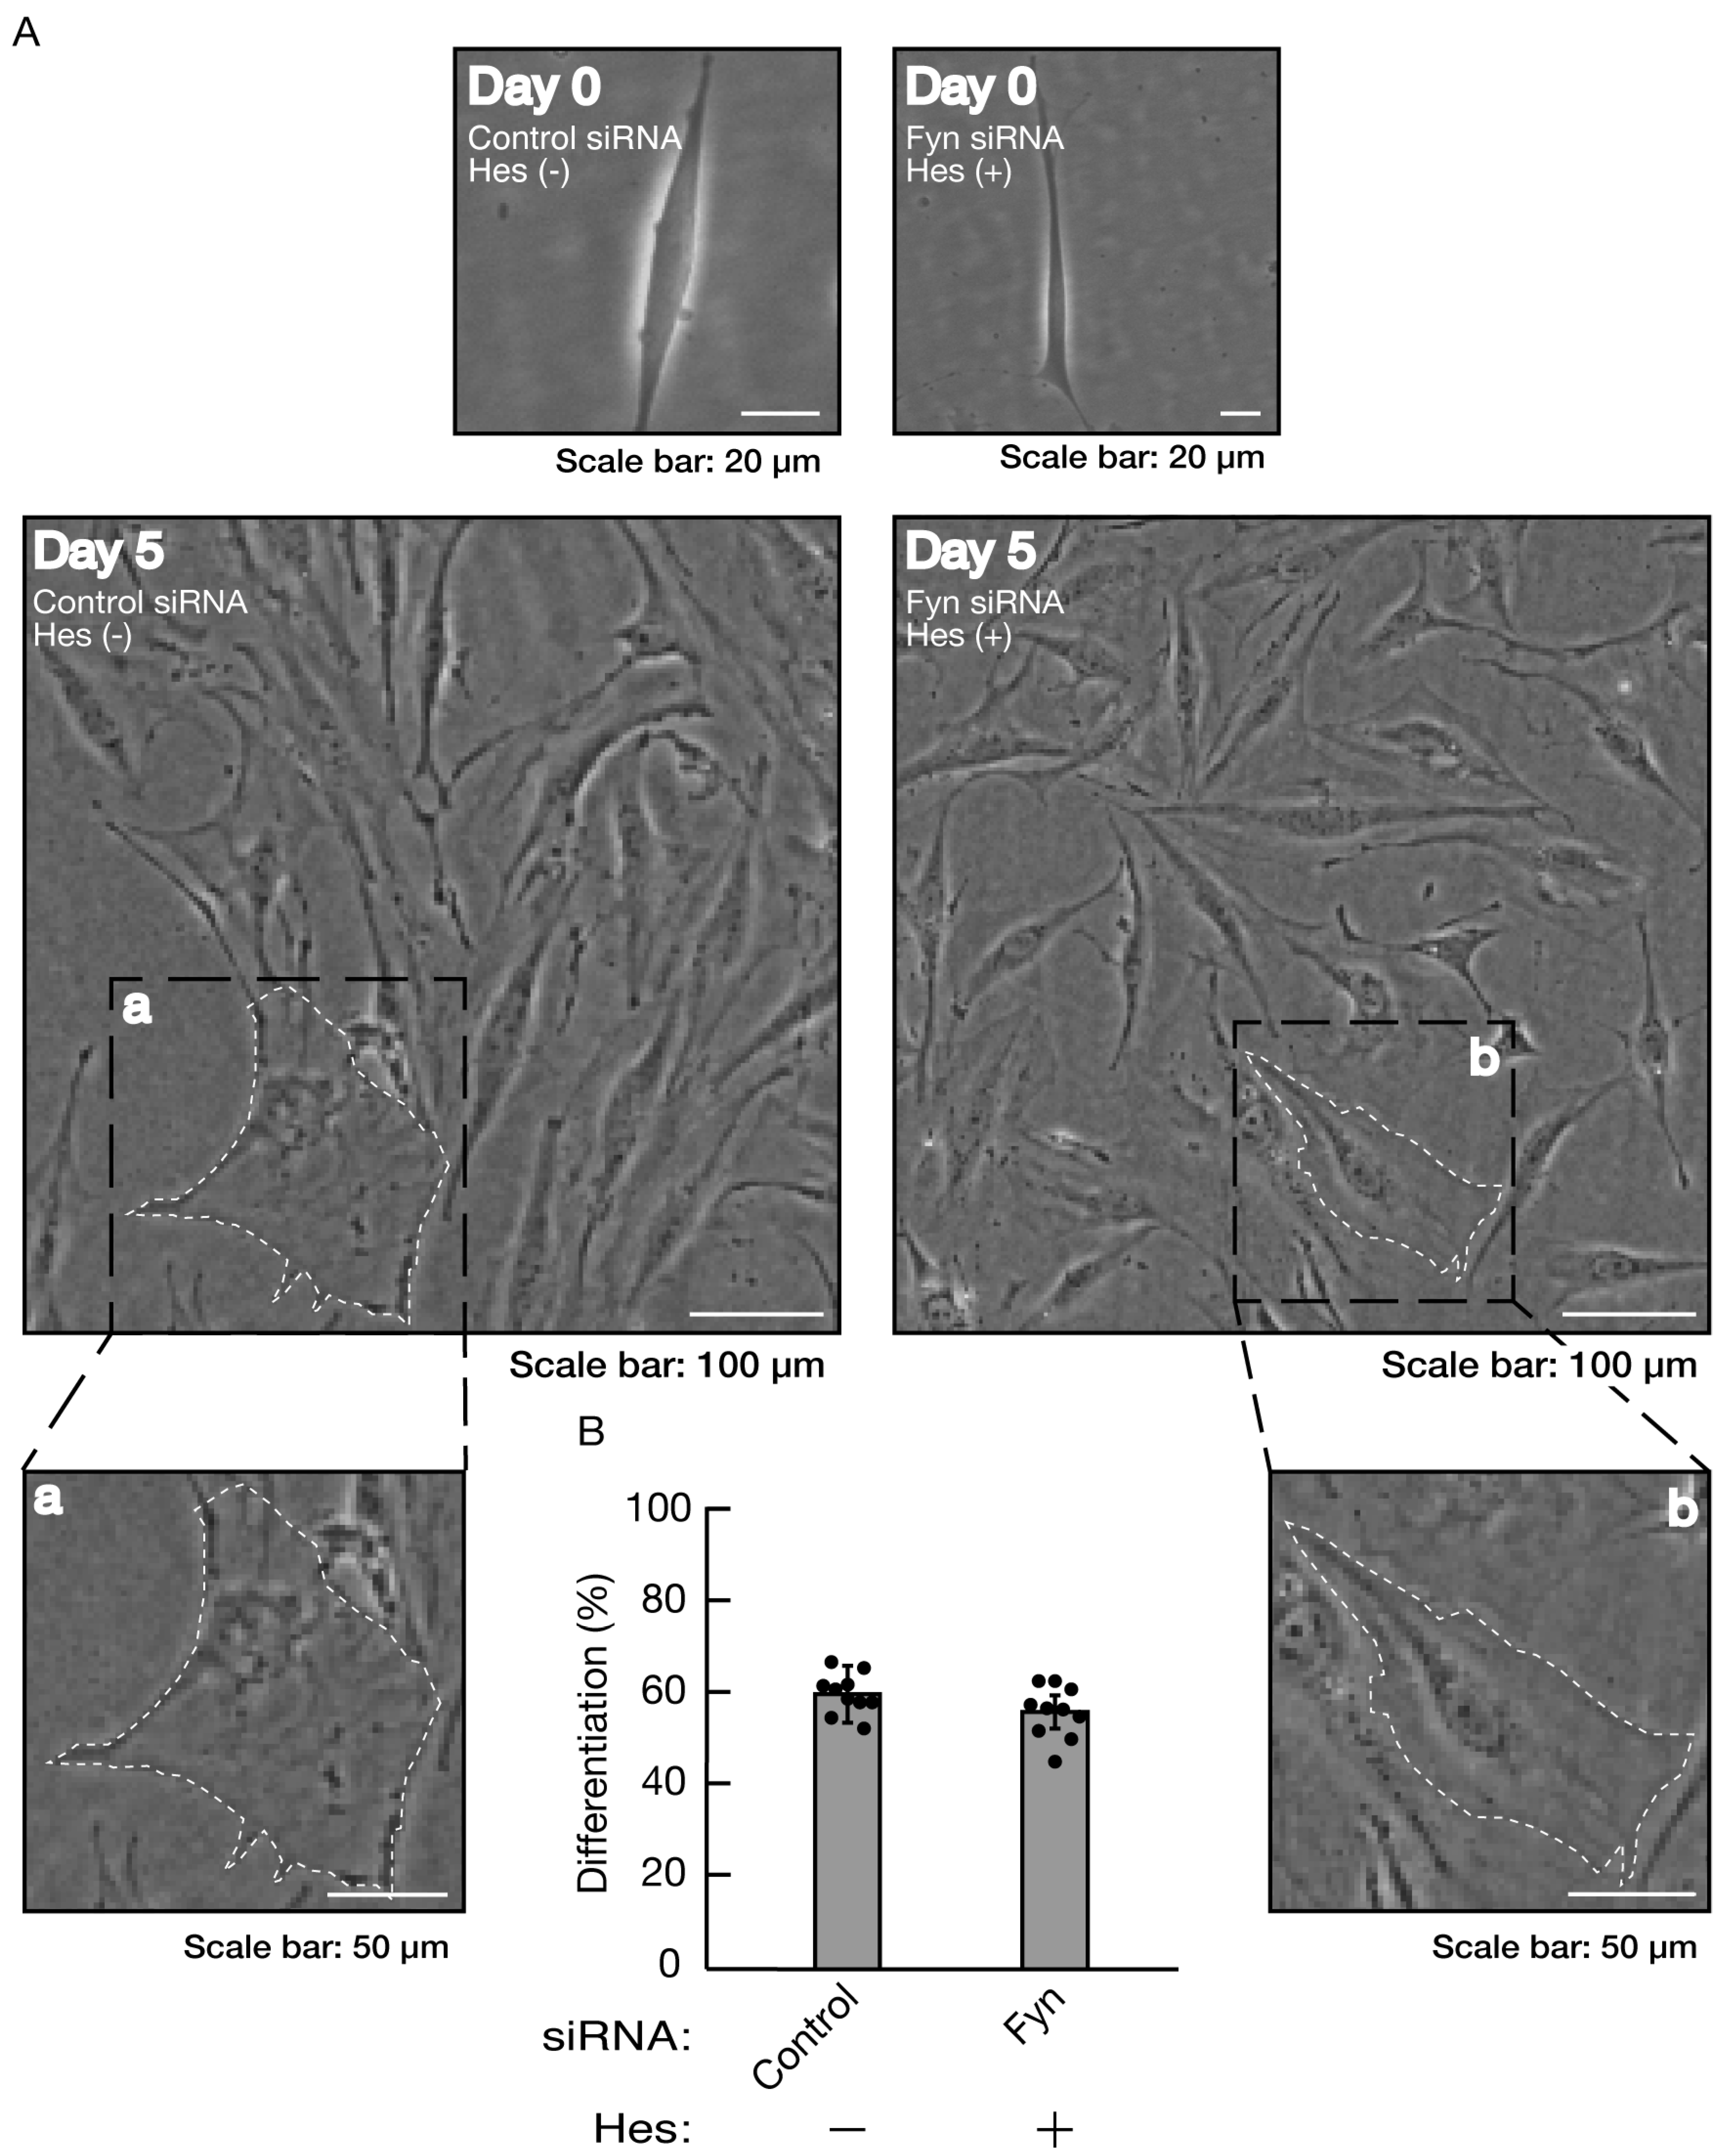
Figure 16.
Hesperetin recovers inhibition of morphological differentiation by knockdown of Fyn. (A, B) Cells were transfected with siRNA for control or Fyn in the presence or absence of hesperetin (Hes). Following the induction of differentiation, the respective, cell morphologies at 0 and 5 days were placed as the representative images, analyzed, and statistically depicted (n = 10 fields). The typical cells with widespread membranes were surrounded with white dotted lines. The black dotted squares (a and b) in large images were placed below as the magnified images (a and b).
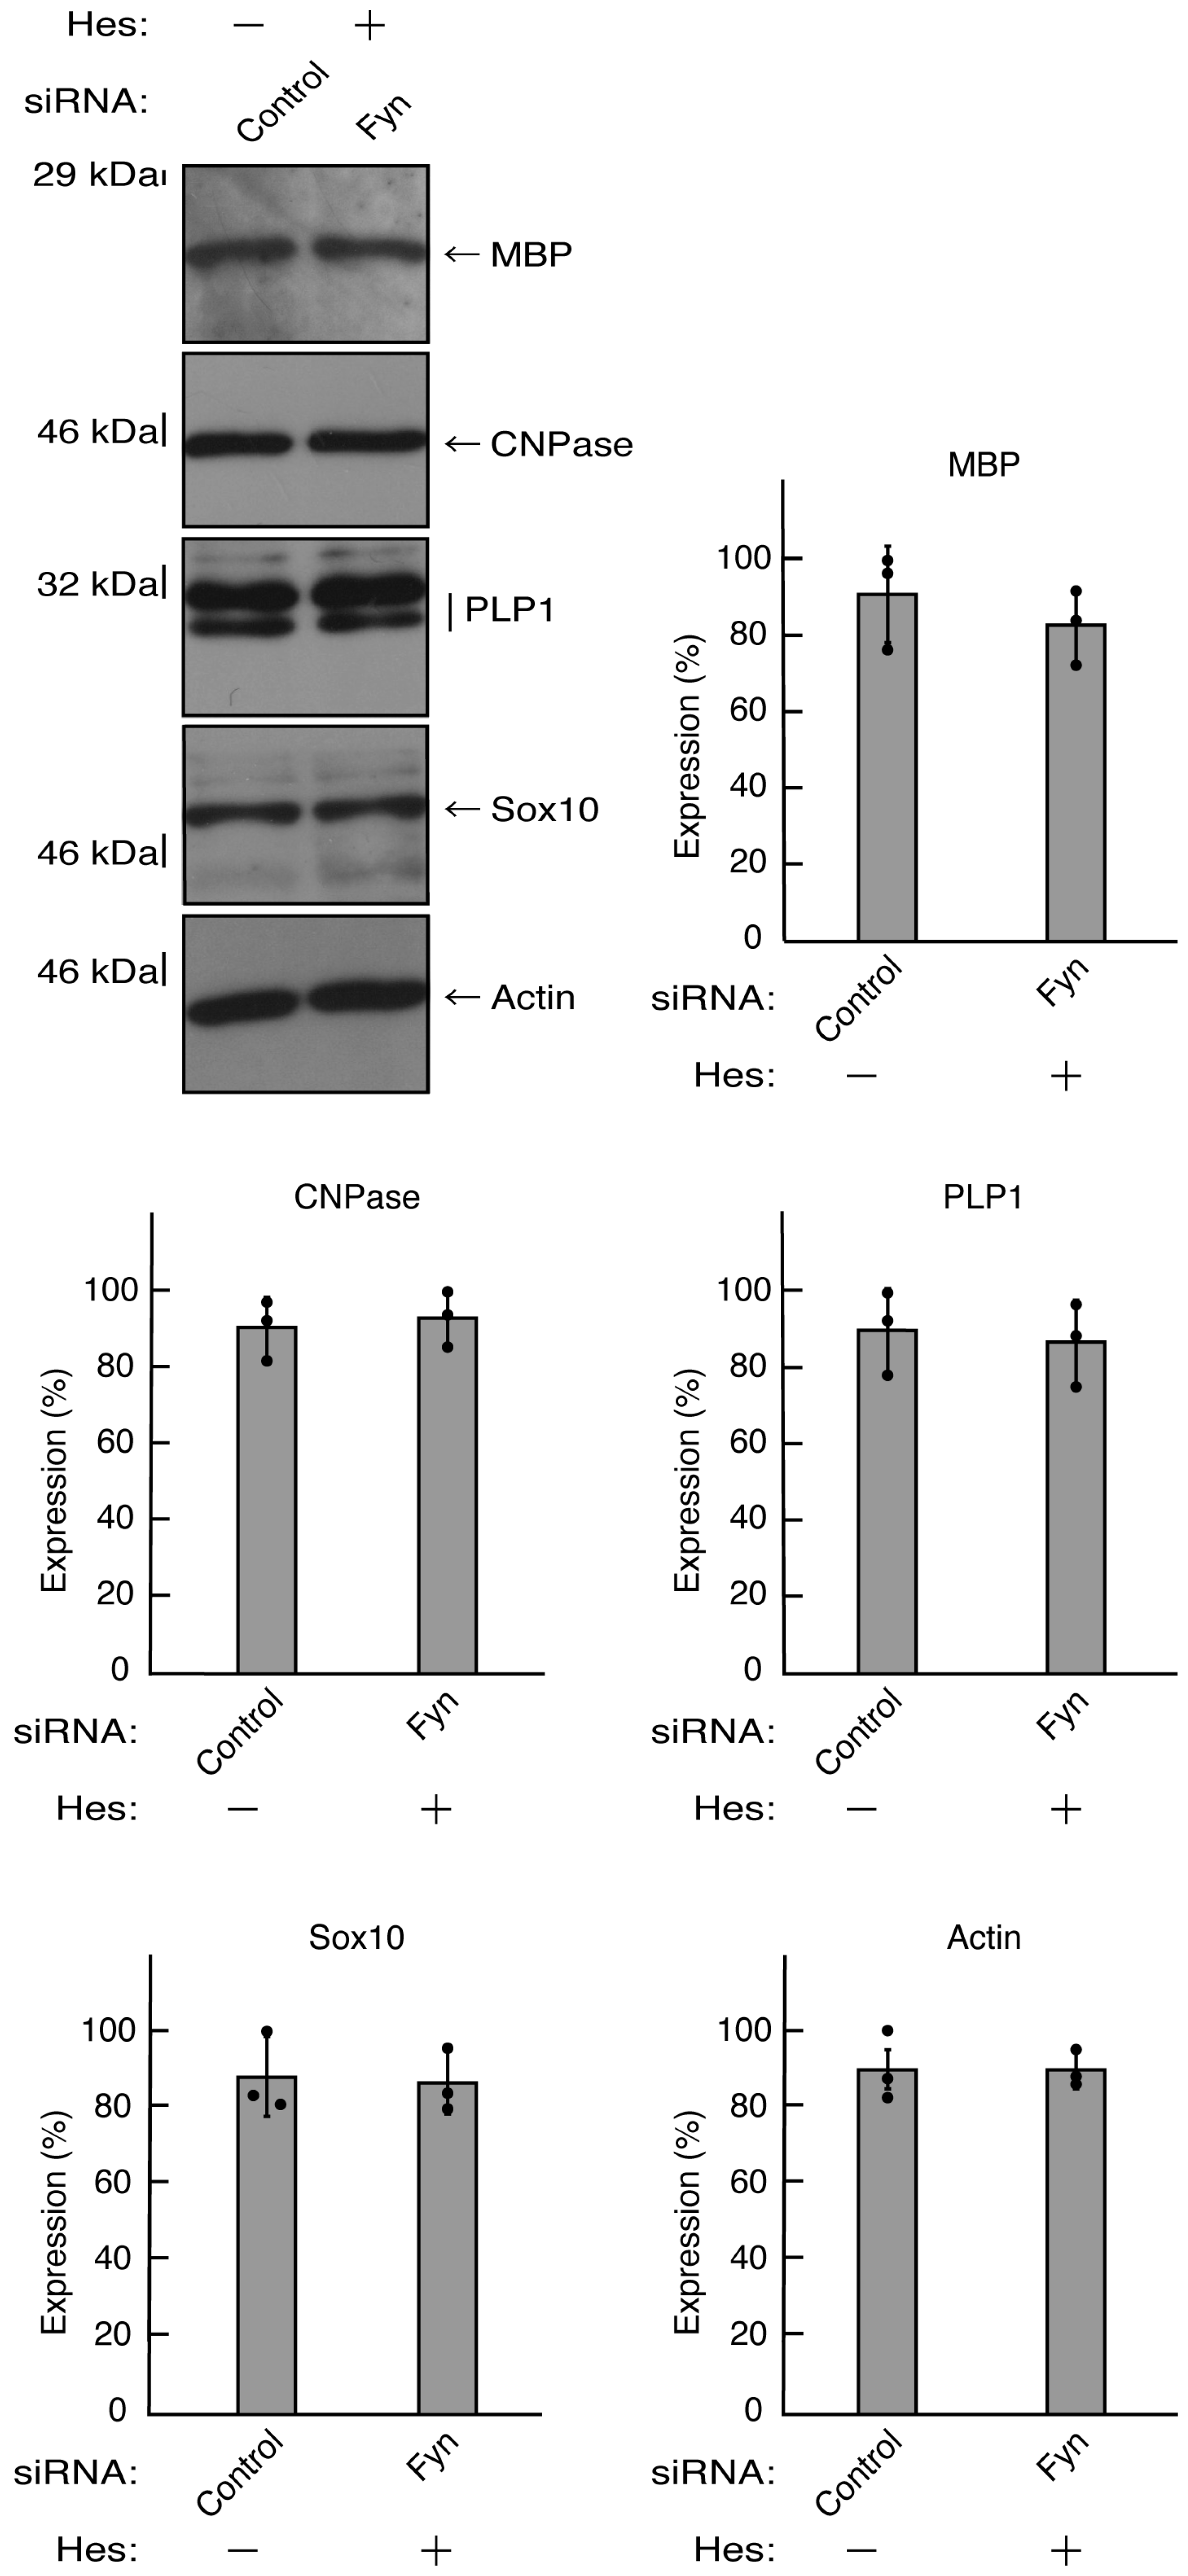
Figure 17.
Hesperetin recovers decreased expression levels of differentiation markers by knockdown of Fyn. Cells were transfected with siRNA for control or Fyn in the presence or absence of hesperetin (Hes). Following the induction of differentiation, the respective immunoblots at 5 days were placed as the representative images, analyzed, and statistically depicted (n = 3 blots).
Table 1.
Key antibodies and chemicals used here.
Table 1.
Key antibodies and chemicals used here.
| Reagents or sources |
Company or source |
Cat. No. |
Lot. No. |
Concentration used |
| Antibodies |
|
|
|
|
| Anti-proteolipid protein 1 (PLP1) |
Atlas Antibodies |
HPA004128 |
8115828 |
Immunoblotting (IB), 1/500 |
| Anti-myelin basic protein (MBP) |
BioLegend |
836504 |
B225469 |
IB, 1/500 |
| Anti-2',3'-cyclic nucleotides to 2'-nucleotides (CNPase) |
Santa Cruz Biotechnology |
sc-166559 |
A1514 |
IB, 1/5,00 |
| Anti-Sox10 |
Santa Cruz Biotechnology |
sc-365692 |
F1621 |
IB, 1/5,00 |
| Anti-actin (also called pan-b type actin) |
MBL |
M177-3 |
007 |
IB, 1/5,000 |
| Anti-Sox10 |
Santa Cruz Biotechnology |
sc-365692 |
F1621 |
IB, 1/5,00 |
| anti-Fyn |
Atlas Antibodies |
HPA023887 |
A75443 |
IB, 1/5,00; immunopresipitation (IP), 0.1 mg for 3,00 mg proteins of the respective cell lysates |
| anti-p-c-Src (9A6), which corresponds to anti-(pY420)Fyn |
Santa Cruz Biotechnology |
sc-81521 |
F2122 |
IB, 1/1,00 |
| anti-p-c-Src (H3), which corresponds to anti-(pY531)Fyn |
Santa Cruz Biotechnology |
sc-166860 |
I2921 |
IB, 1/1,00 |
| Anti-IgG (H+L chain) (Rabbit) pAb-HRP |
MBL |
458 |
353 |
IB, 1/5,000 |
| Anti-IgG (H+L chain) (Mouse) pAb-HRP |
MBL |
330 |
365 |
IB, 1/5,000 |
| Key chemicals |
|
|
|
|
| Hesperitin (Hes) |
FUJIFILM Wako Pure Chemical Corporation |
087-10001 |
DLK5755 |
15 mM (final concentration) |
| Monoglucosyl hesperidine (M.Hes) |
FUJIFILM Wako Pure Chemical Corporation-Hayashibara Co., Ltd. |
638-07361 |
191127 |
25 mM (final concentration) |
| Dimethyl sulfoxide (DMSO) |
FUJIFILM Wako Pure Chemical Corporation |
047-29353 |
CDN0170 |
Less than 0.1% (final concentration) |
