Preprint
Hypothesis

Environmental Parameters and Carbon Sequestration Potential of Mangrove Forest in Kaingen Riverine Ecosystem, Kawit, Cavite, Philippines

Altmetrics

Downloads

358

Views

538

Comments

0

Submitted:

02 August 2023

Posted:

04 August 2023

You are already at the latest version

Alerts
Abstract
Mangroves play an important role as a carbon sink and in mitigation of climate change. This study aimed to assess the anthropogenic activities, water and soil quality, mangrove diversity, and carbon sequestration potential of mangrove trees in the Kaingen River, Kawit, Cavite. The sampling period was conducted from November 2022 to March 2023 with the established three sampling sites. The DENR Administrative Order (DAO)- 2016-08 was used as a standard for water quality parameters, except for phosphates which used DAO-2021-19. The soil parameters were identified using the soil test kit from the Bureau of Soil and Water Management (BSWM) and at the BSWM laboratory. Mangrove species were identified using The Field Guide for Philippine Mangroves and were verified by experts. The carbon sequestration potential was obtained using an allometric equation for Southeast Asian mangroves. There are three mangrove species found in Kaingen Riverine such as Rhizophora mucronata, Avicennia alba, and Xylocarpus granatum. Based on species importance value Rhizophora mucronata is the dominant mangrove species. The result for carbon sequestration of each mangrove species showed that Rhizophora mucronata yielded the highest carbon stored (35.16 tC/ha) and carbon sequestered (128.92 tCO2/ha). Among all the sampling sites, site 3 yielded the highest carbon stored (30.76 tC/ha) and carbon sequestered (112.81 tCO2/ha) in Kaingen River. Overall, the results of the study showed that Kaingen River can potentially store carbon at 71.89 tC/ha and CO2 sequestered at 263.62 tCO2/ha. This urges to practice conservation and protection measures for the mangroves forest of Kaingen River.
Keywords: 
Subject: Environmental and Earth Sciences  -   Environmental Science

Chapter I

INTRODUCTION

The rising demand for agricultural expansion, industrialization, and urbanization have significantly increased the concentrations of atmospheric pollutants, specifically the atmospheric Carbon dioxide (CO2), which put pressure on the world's mangrove ecosystems to reduce the problem brought by climate change. Because of this, the extensive impact of climate change on the environment and to society has become a worldwide concern such as rising sea level, unpredictable weather patterns, weather extremes like intense precipitation and higher surface temperatures which contributes to global warming. Among the countries that are most vulnerable to the repercussions of global warming is the Philippines. The Philippines is one of the several countries in Southeast Asia that has a diverse mangrove forest ecosystem, in which 46 out of 70 known species of salt-tolerant mangrove species that have been accounted for in the world are found in the country. Mangroves live and thrive in transition zones where land and ocean meet. They play a significant role in the ecosystem, serving as the natural barrier against storm surges, promote marine biodiversity by acting as a nursing ground for small marine animals, and help in mitigating the effects of climate change.
One way to mitigate the effect of climate change is by reducing the concentration of greenhouse gases such as CO2 in the atmosphere. Carbon sequestration is the term used in reducing CO2 in the air, which the role is fulfilled by the forests. And unlike other types of forests, mangroves are known as powerful carbon sinks and sequester a significant amount of CO2 in the atmosphere and store it in their roots, branches, the soil beneath them, and to the biomass.
Carbon sink refers to the natural ecosystem, both aquatic and terrestrial, that is capable of absorbing carbon emitted into the atmosphere. The Blue Carbon Initiative as an organization stated that protecting the aquatic ecosystem comprising mangrove forests will remove and store more carbon from the air. However, if the mangrove ecosystem is destroyed or degraded, the carbon dioxide stored can be released back into the air. Mangrove trees are beneficial in many ways such as raw materials for building and construction and block the waves that will hit the seaside coast. Aside from that, mangroves help in mitigating the negative effects brought by climate change and global warming by storing and sequestering carbon from the atmosphere that mainly comes from the increasing demand of anthropogenic activities which opted the researchers to conduct the study.
In this research study, the mangrove forest present in Kaingen River was assessed, and its potential in storing and sequestering CO2 from the atmosphere.

Objectives of the Study

This study aimed to determine the species diversity, carbon sequestration potential of the mangrove ecosystem, and environmental quality of Kaingen River, Kawit, Cavite, Philippines.
Specifically, the study attempted to determine:
1. The anthropogenic activities in the Kaingen River,
2. The water quality of Kaingen River in terms of:
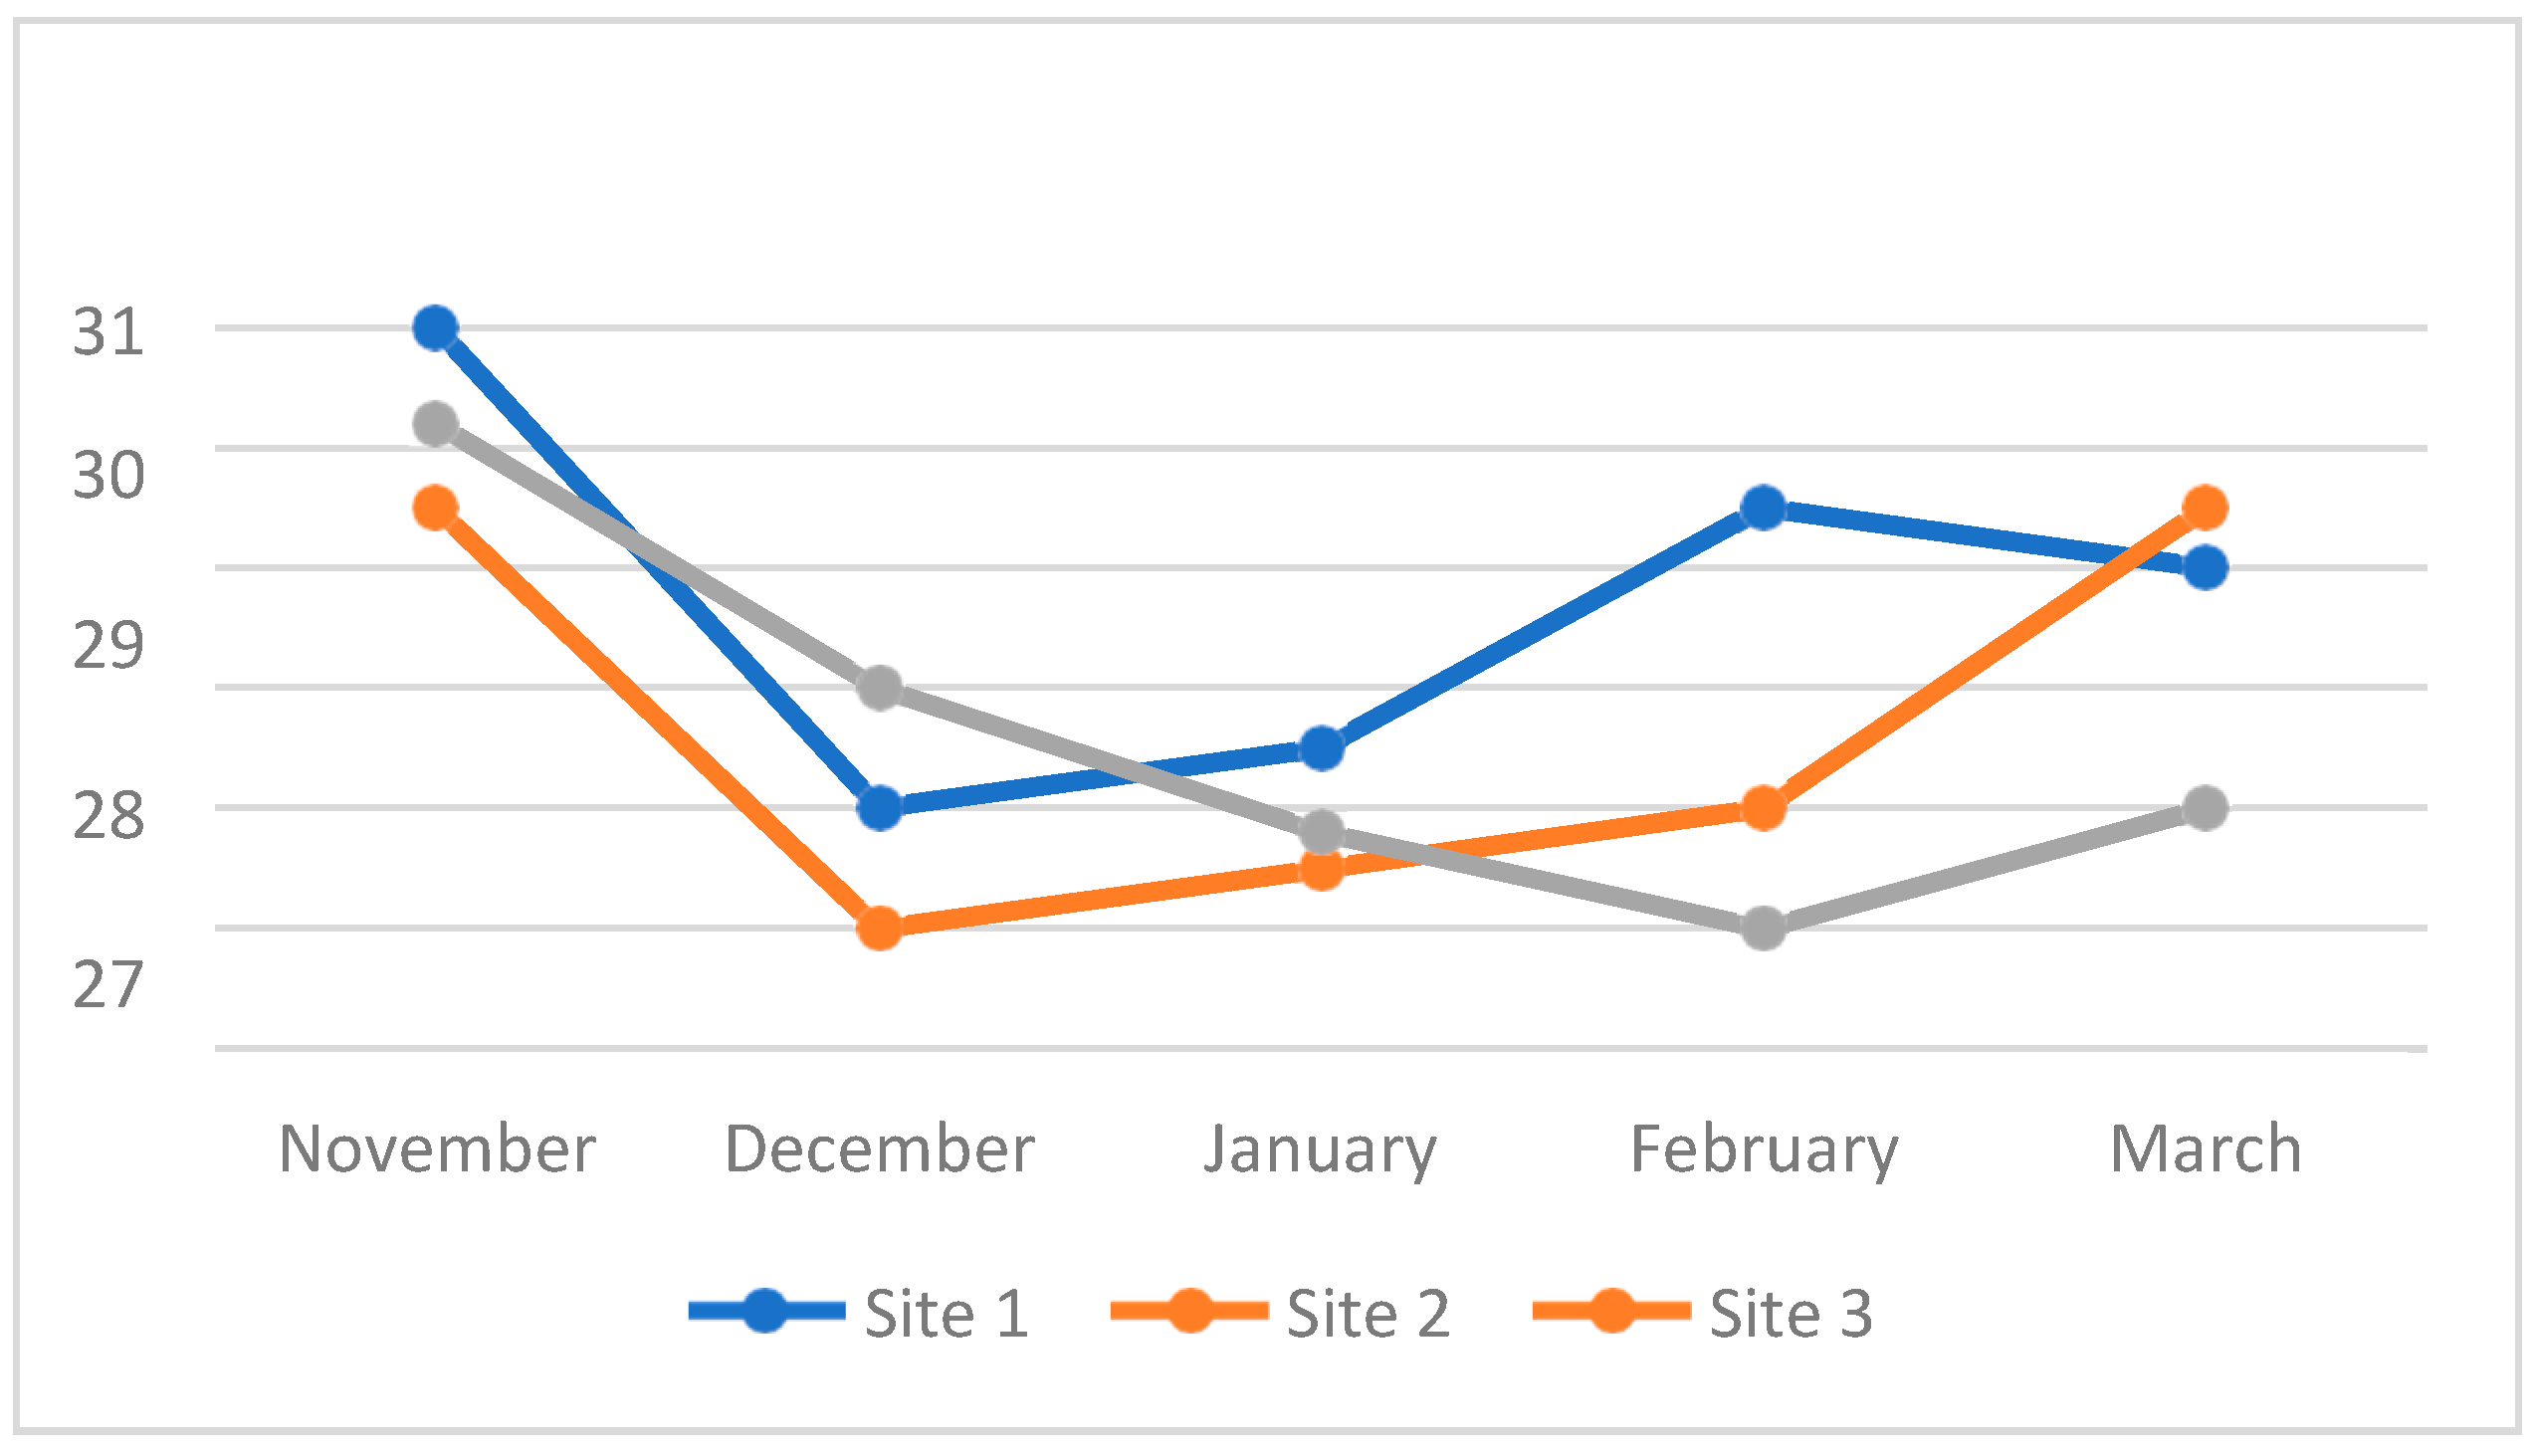
   2.1 temperature,
   2.2 turbidity,
   2.3 total dissolved solids (TDS),
   2.4 salinity,
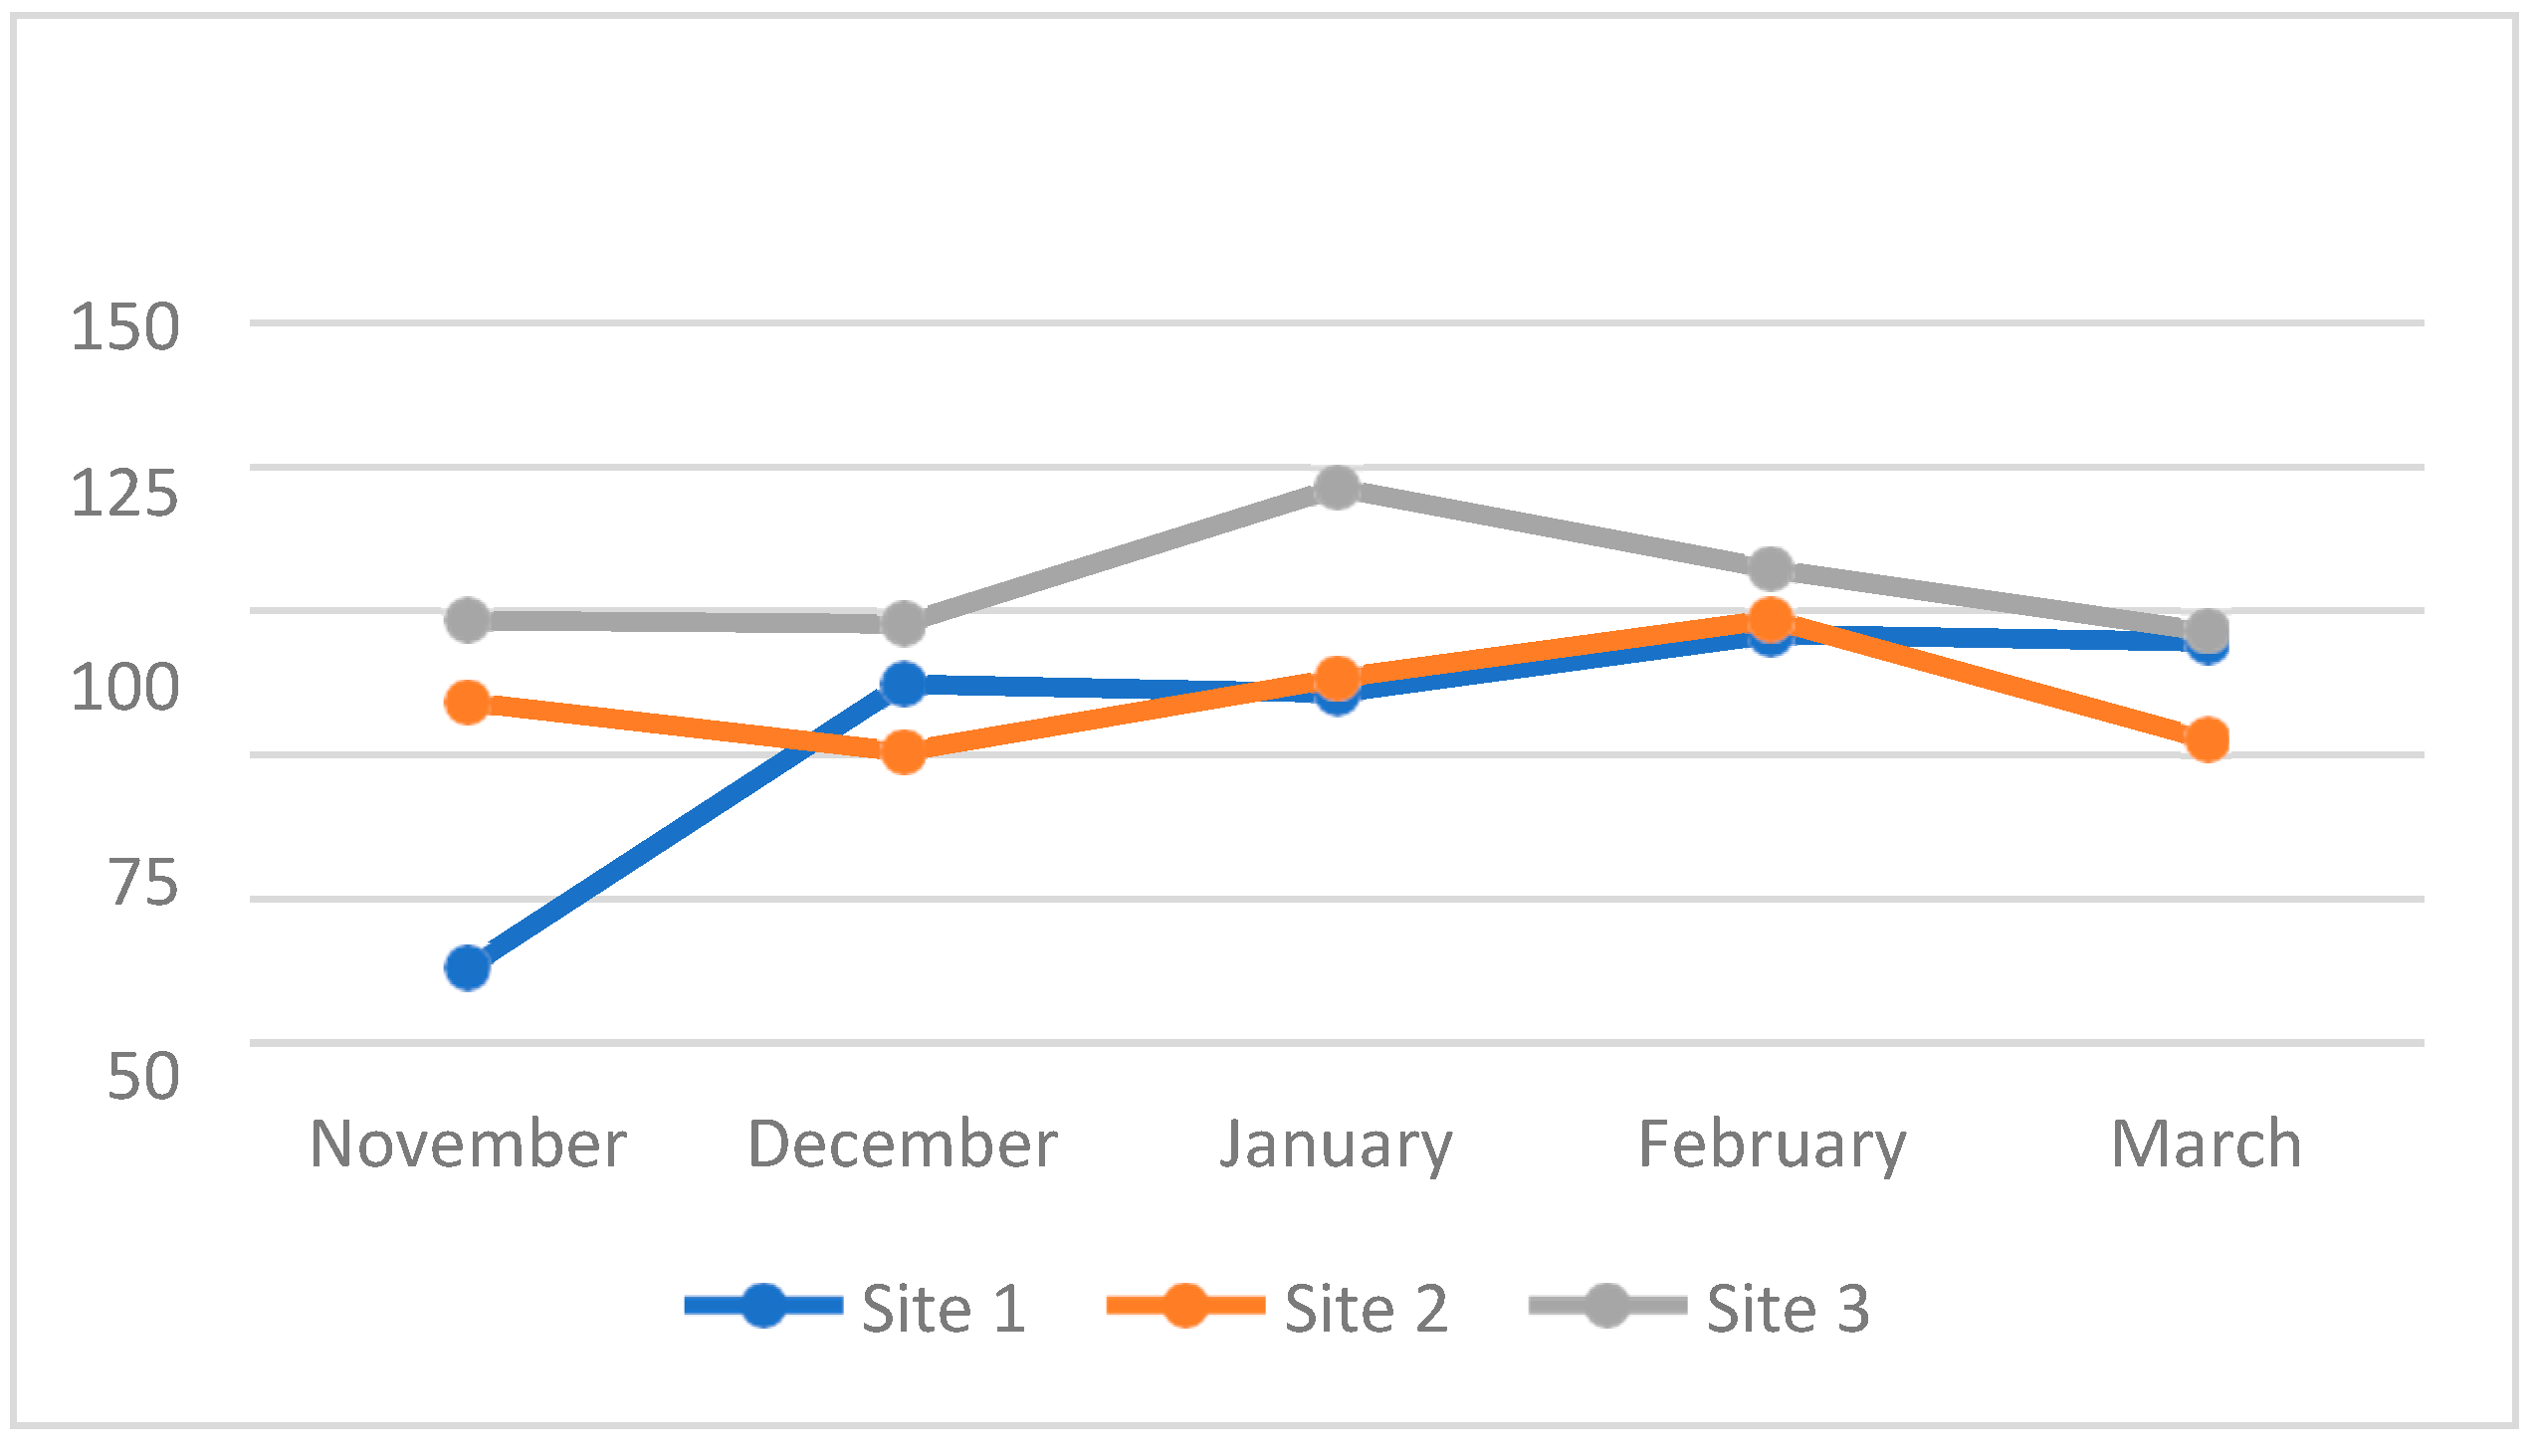
   2.5 conductivity,
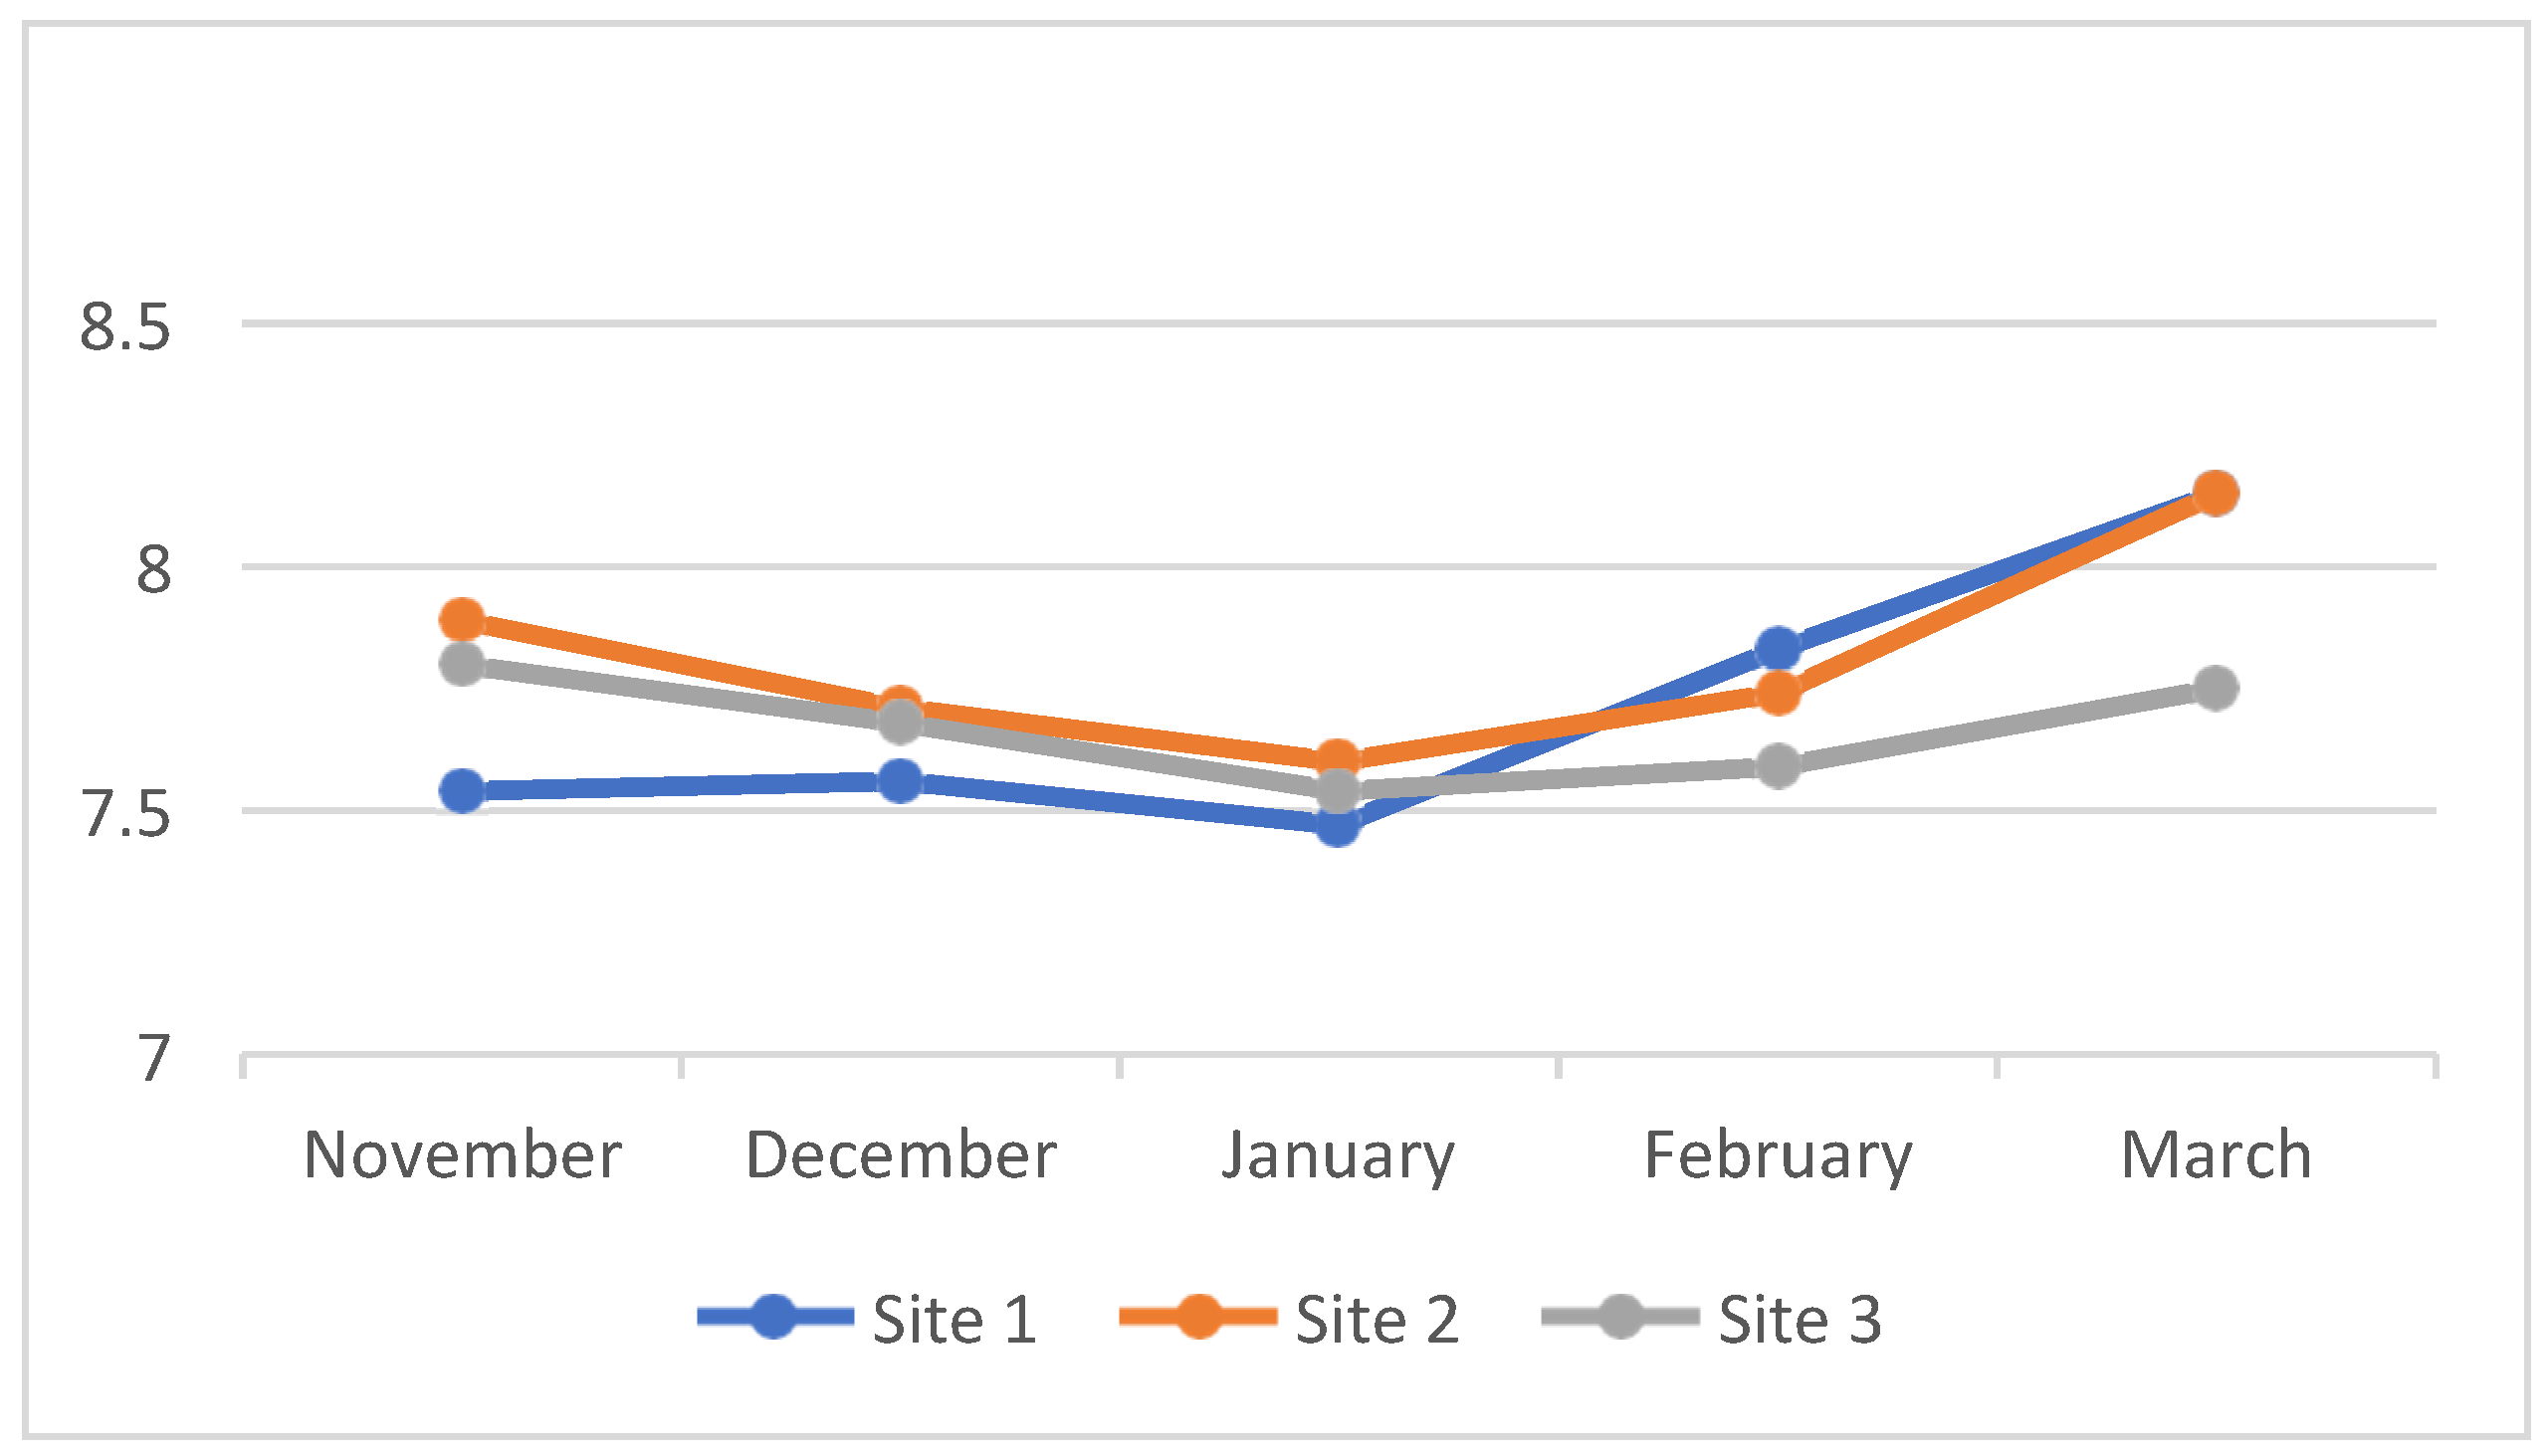
   2.6 pH,
   2.7 dissolved oxygen,
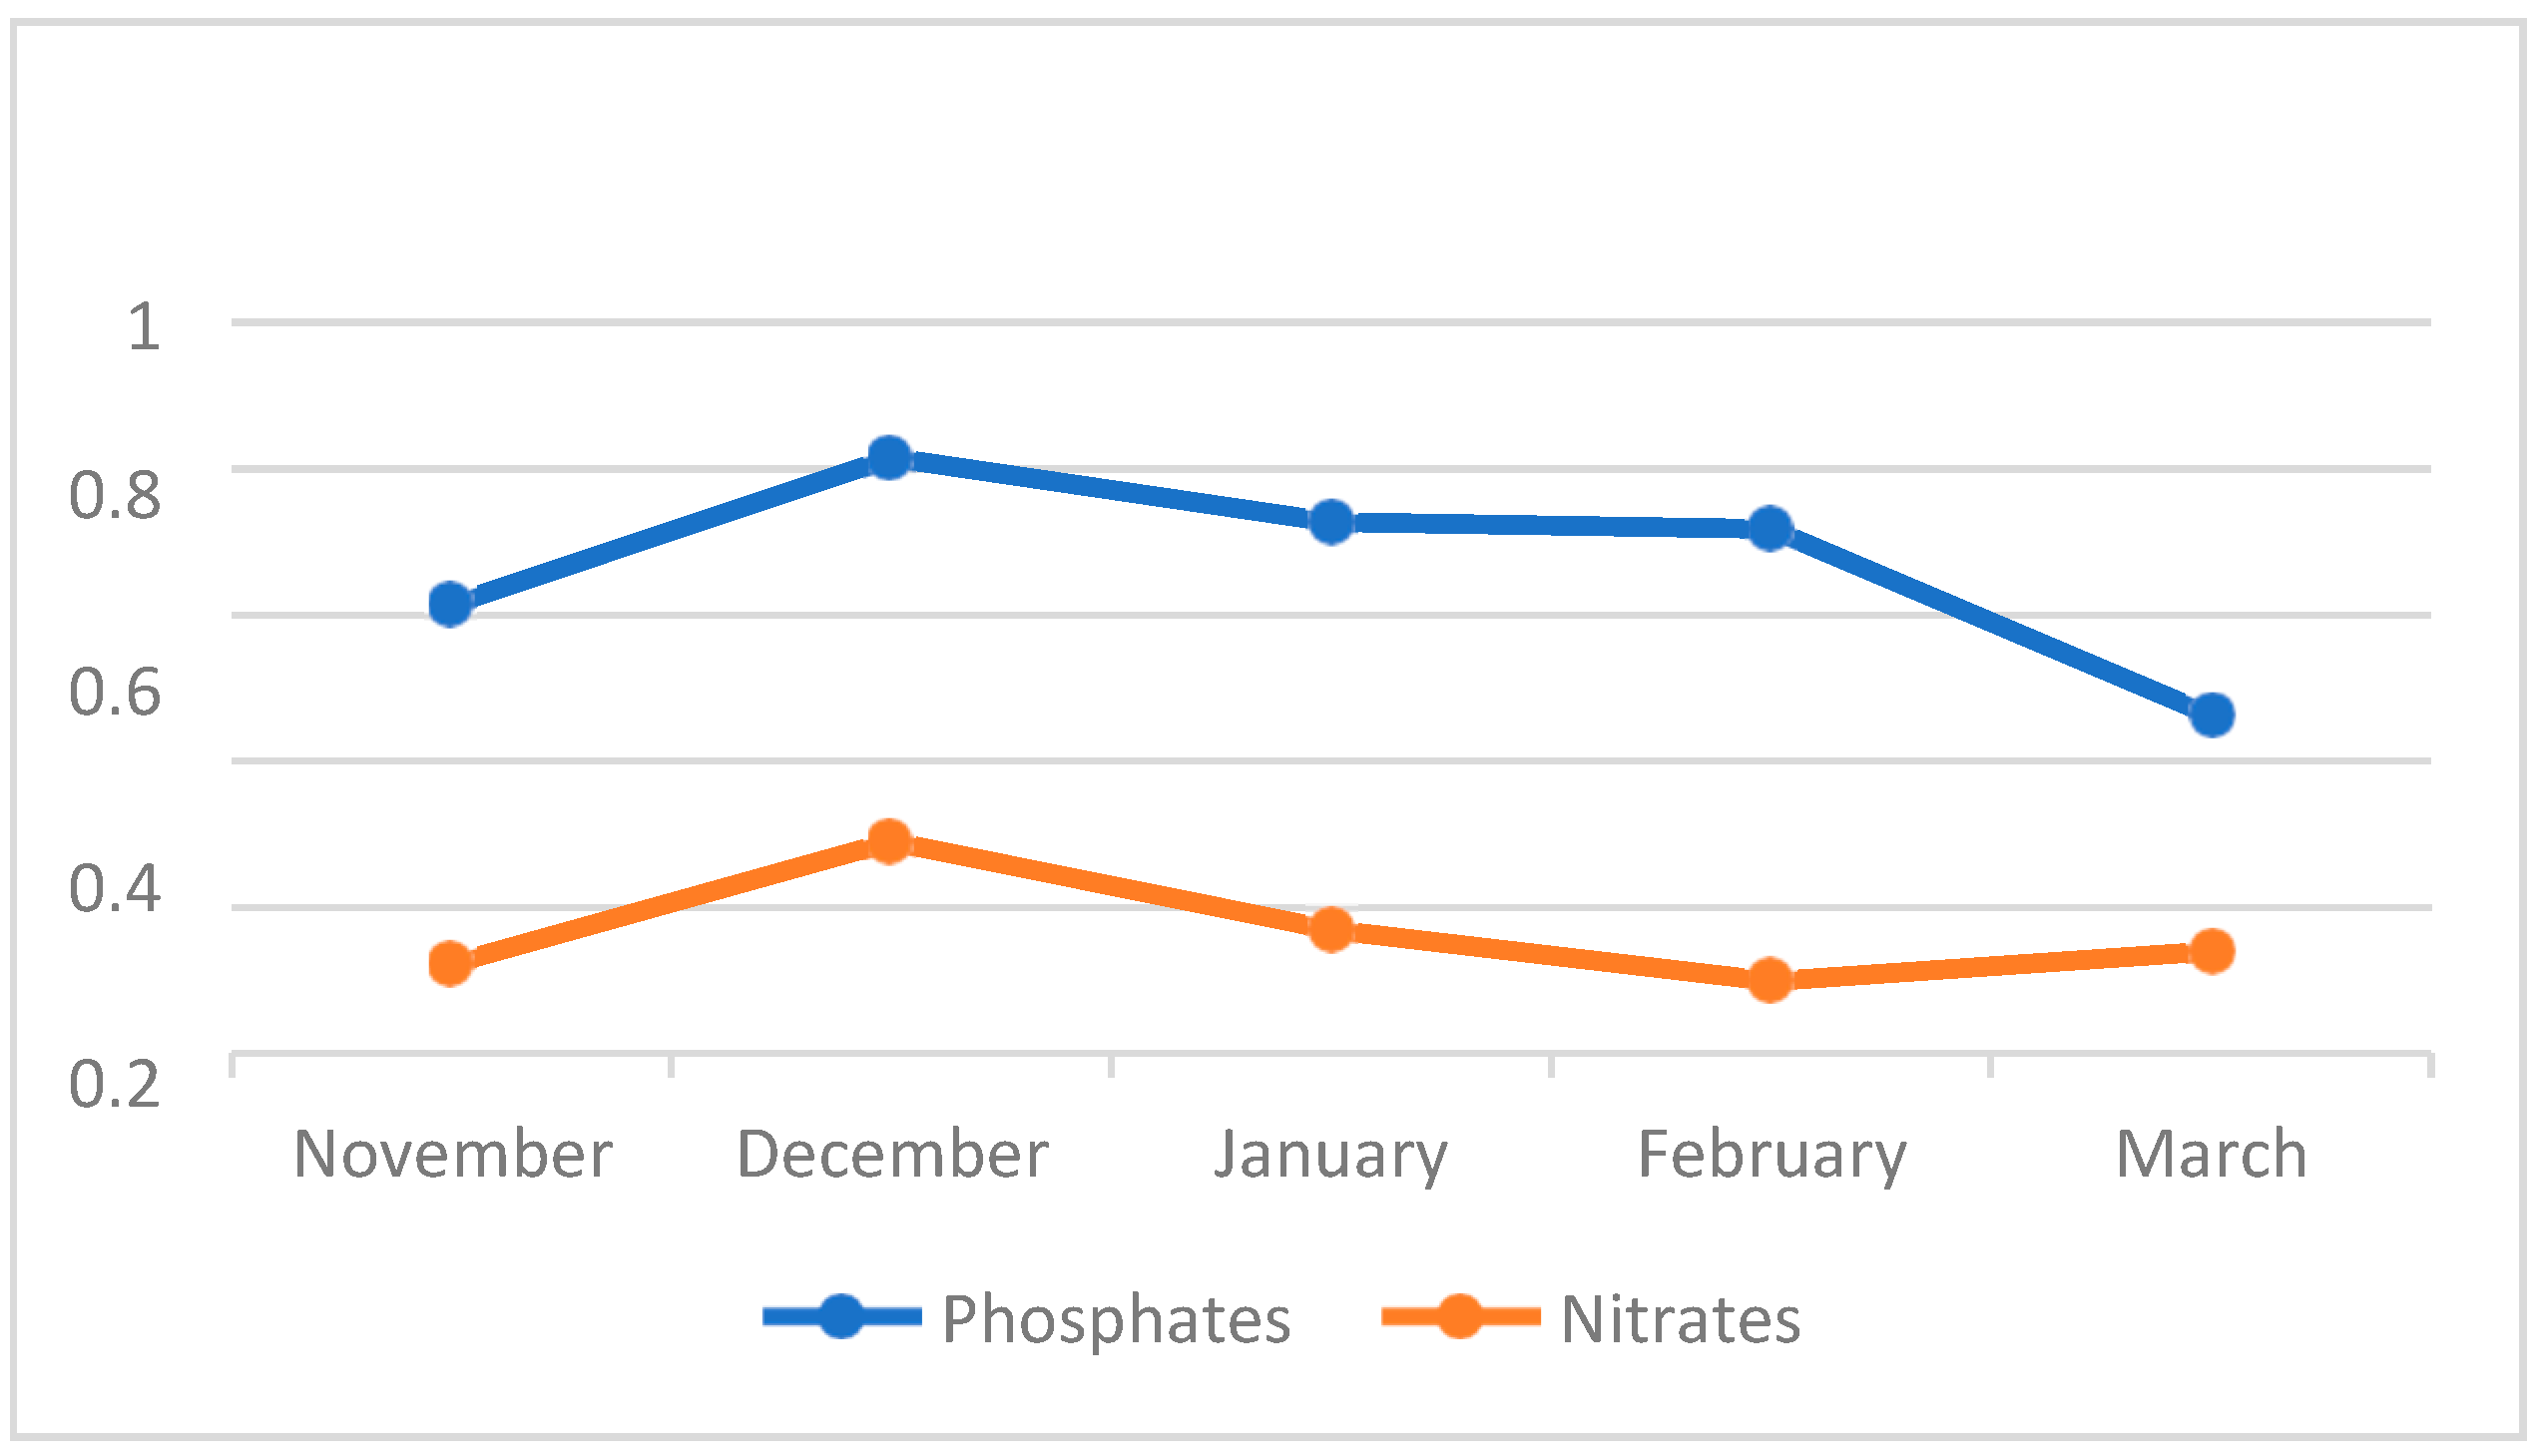
   2.8 phosphates, and
   2.9 nitrates
3. The soil quality of Kaingen River through physicochemical parameters in terms of:
   3.1 soil texture,
   3.2 water holding capacity,
   3.3 soil temperature,
   3.4 soil pH,
   3.5 organic matter,
   3.6 organic carbon,
   3.7 nitrogen, phosphorus, and potassium (NPK)
4. The species diversity of mangroves present in the Kaingen Riverine ecosystem
5. The amount of carbon dioxide stored and sequestered by the mangrove trees using allometric equations.
6. If there is a significant difference in the water and soil quality collected in:
   6.1 three sampling sites per sampling month, and;
   6.2 each site across the five-month sampling period.
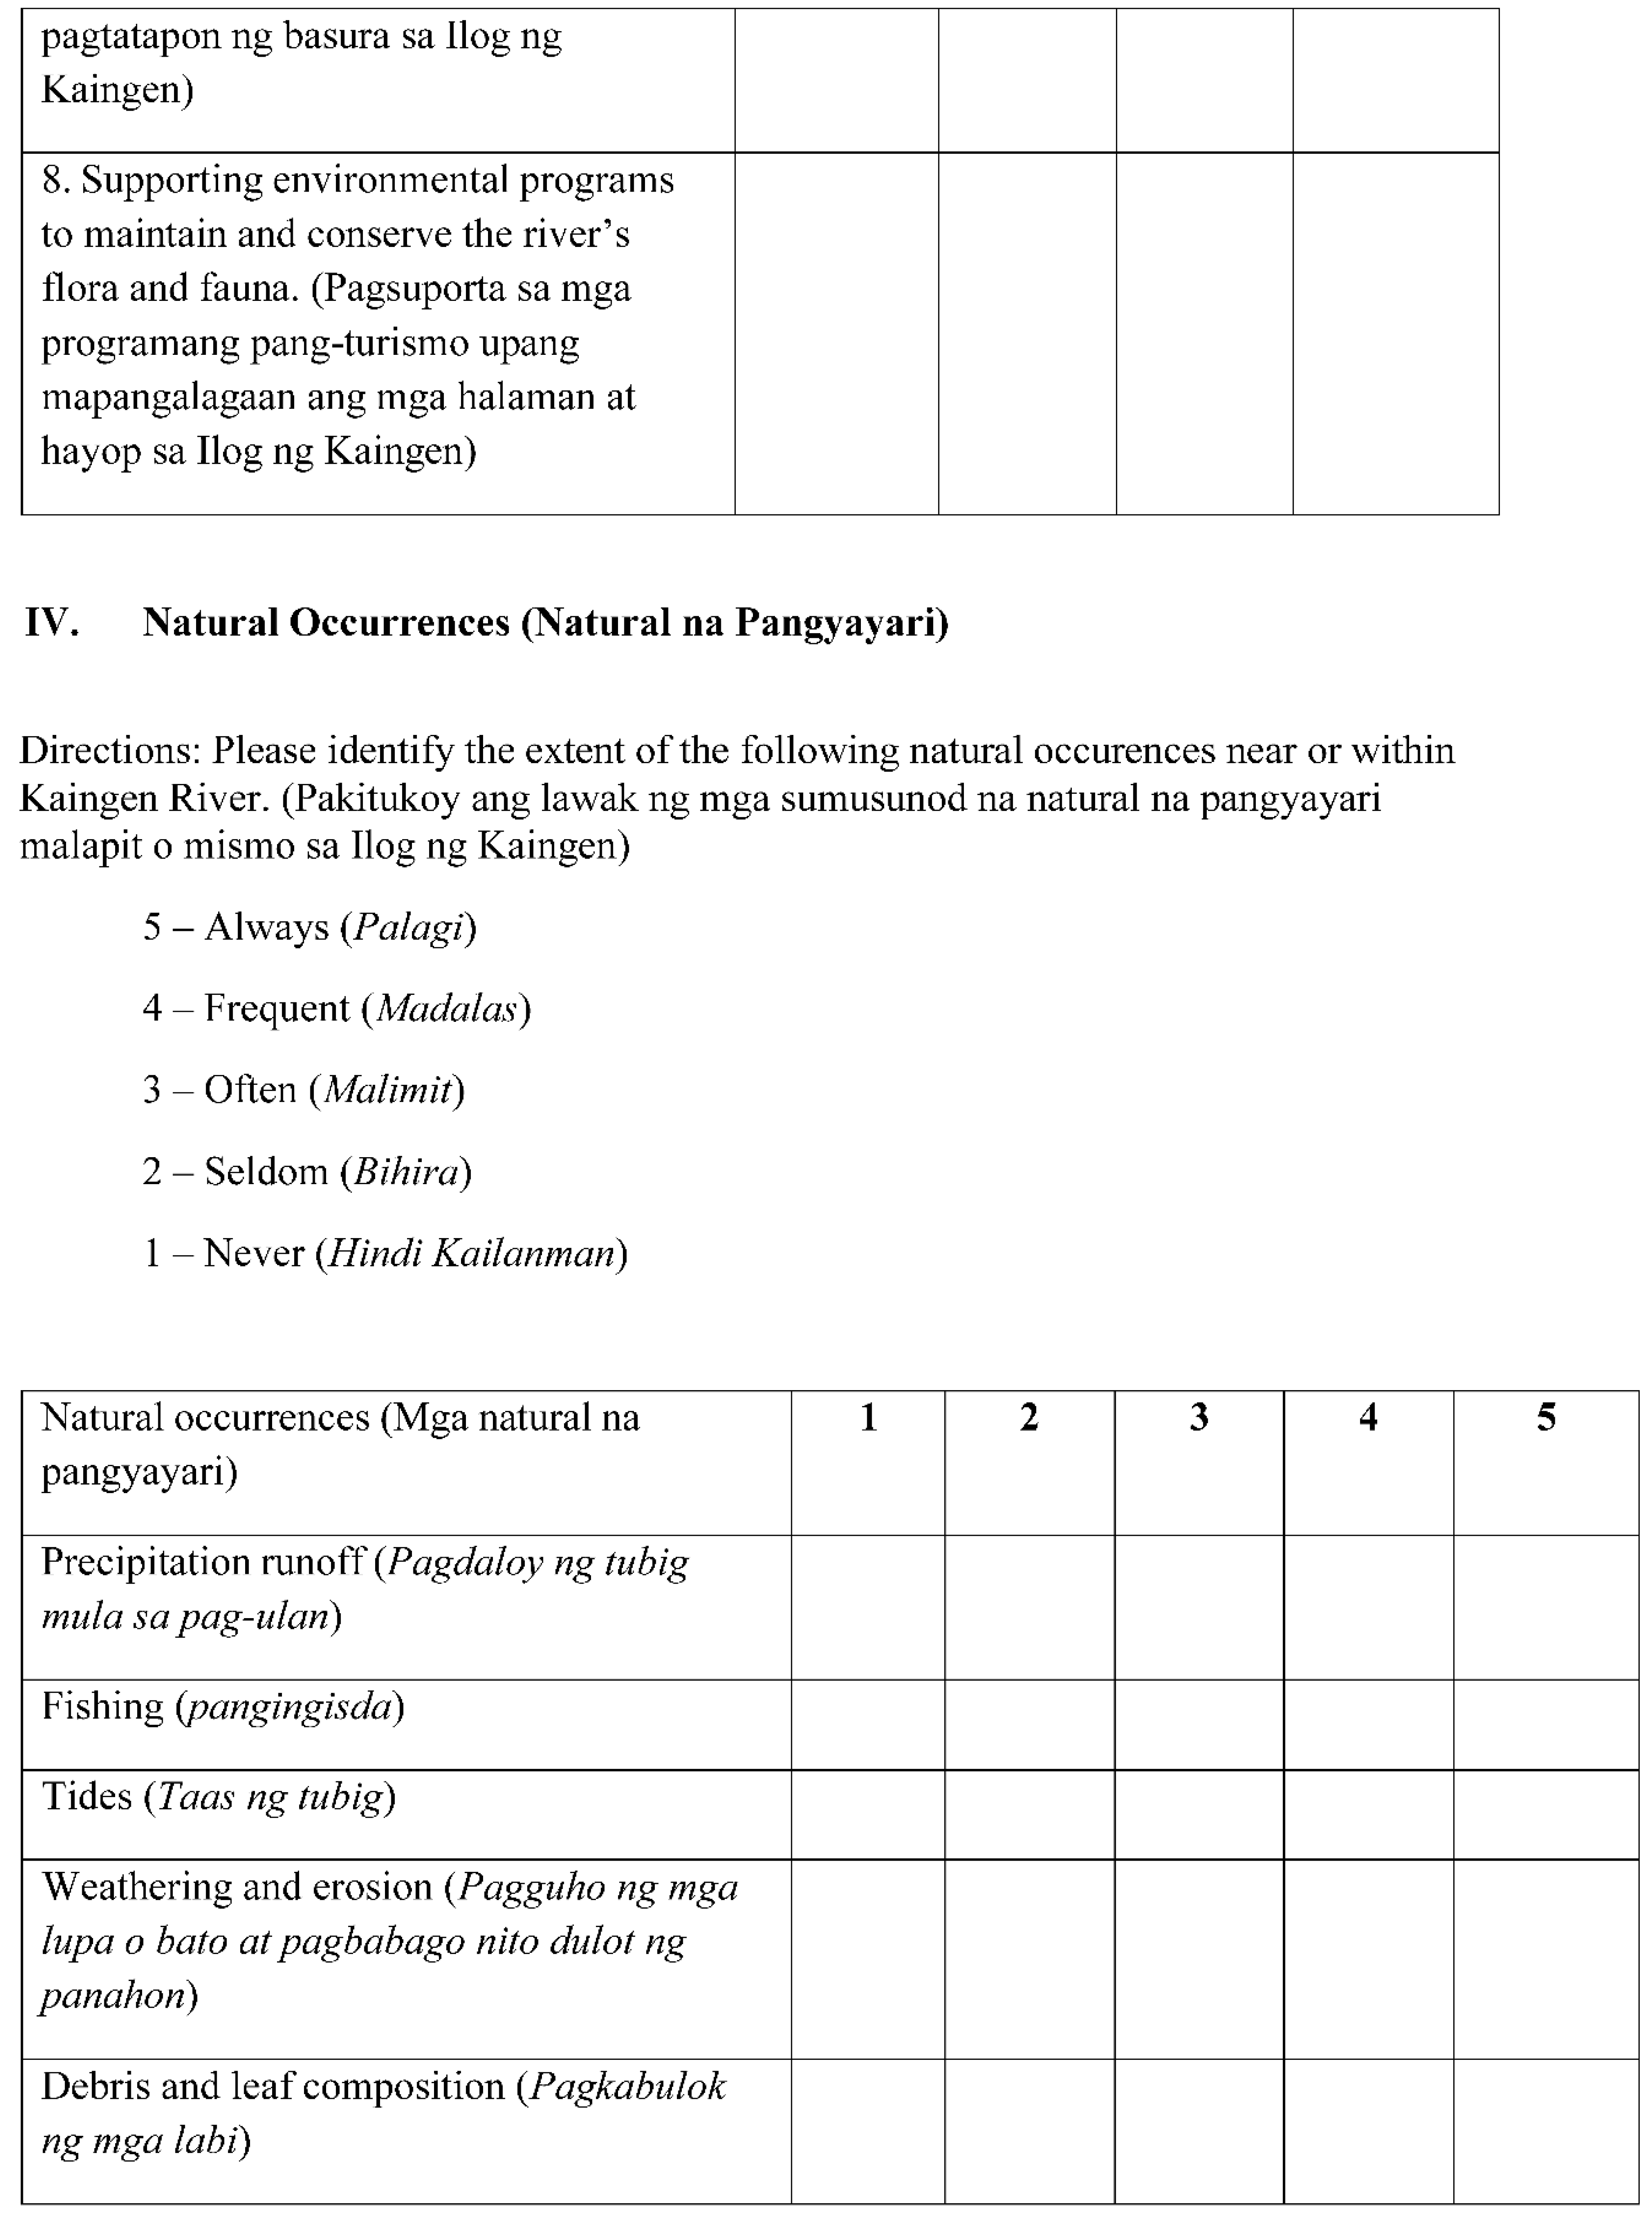
7. If there is a significant relationship in the water and soil quality with the abundance of mangroves.

Significance of the Study

The study focused on mangrove diversity and its potential in storing and sequestering CO2 in the Kaingen Riverine ecosystem. The study also served as a baseline for quantifying how anthropogenic activities affect the mangrove forest.
This study serves as a reference for the Local Government Unit (LGU) of Cavite, the National Government Unit (NGU), advocates, and educators to provide public awareness on protecting, managing, and conserving the mangrove ecosystem. It shall deepen the understanding of the significant role of mangrove forests in mitigating the impacts of climate change.
Furthermore, this study also serves as a reference for further research which aims to conduct a similar study about the mangrove ecosystem in the Philippines.

Scope and Limitations

The major focus of this study is to determine the mangrove species diversity, the amount of carbon stored and sequestered by the mangrove community, and environmental quality limited to water quality and soil quality only, of the Kaingen River, Kawit, Cavite, Philippines in five (5) months. Other environmental parameters, particularly air quality, and other anthropogenic activities such as electrical consumption, vehicle emission, and carbon footprint were not included in the study.
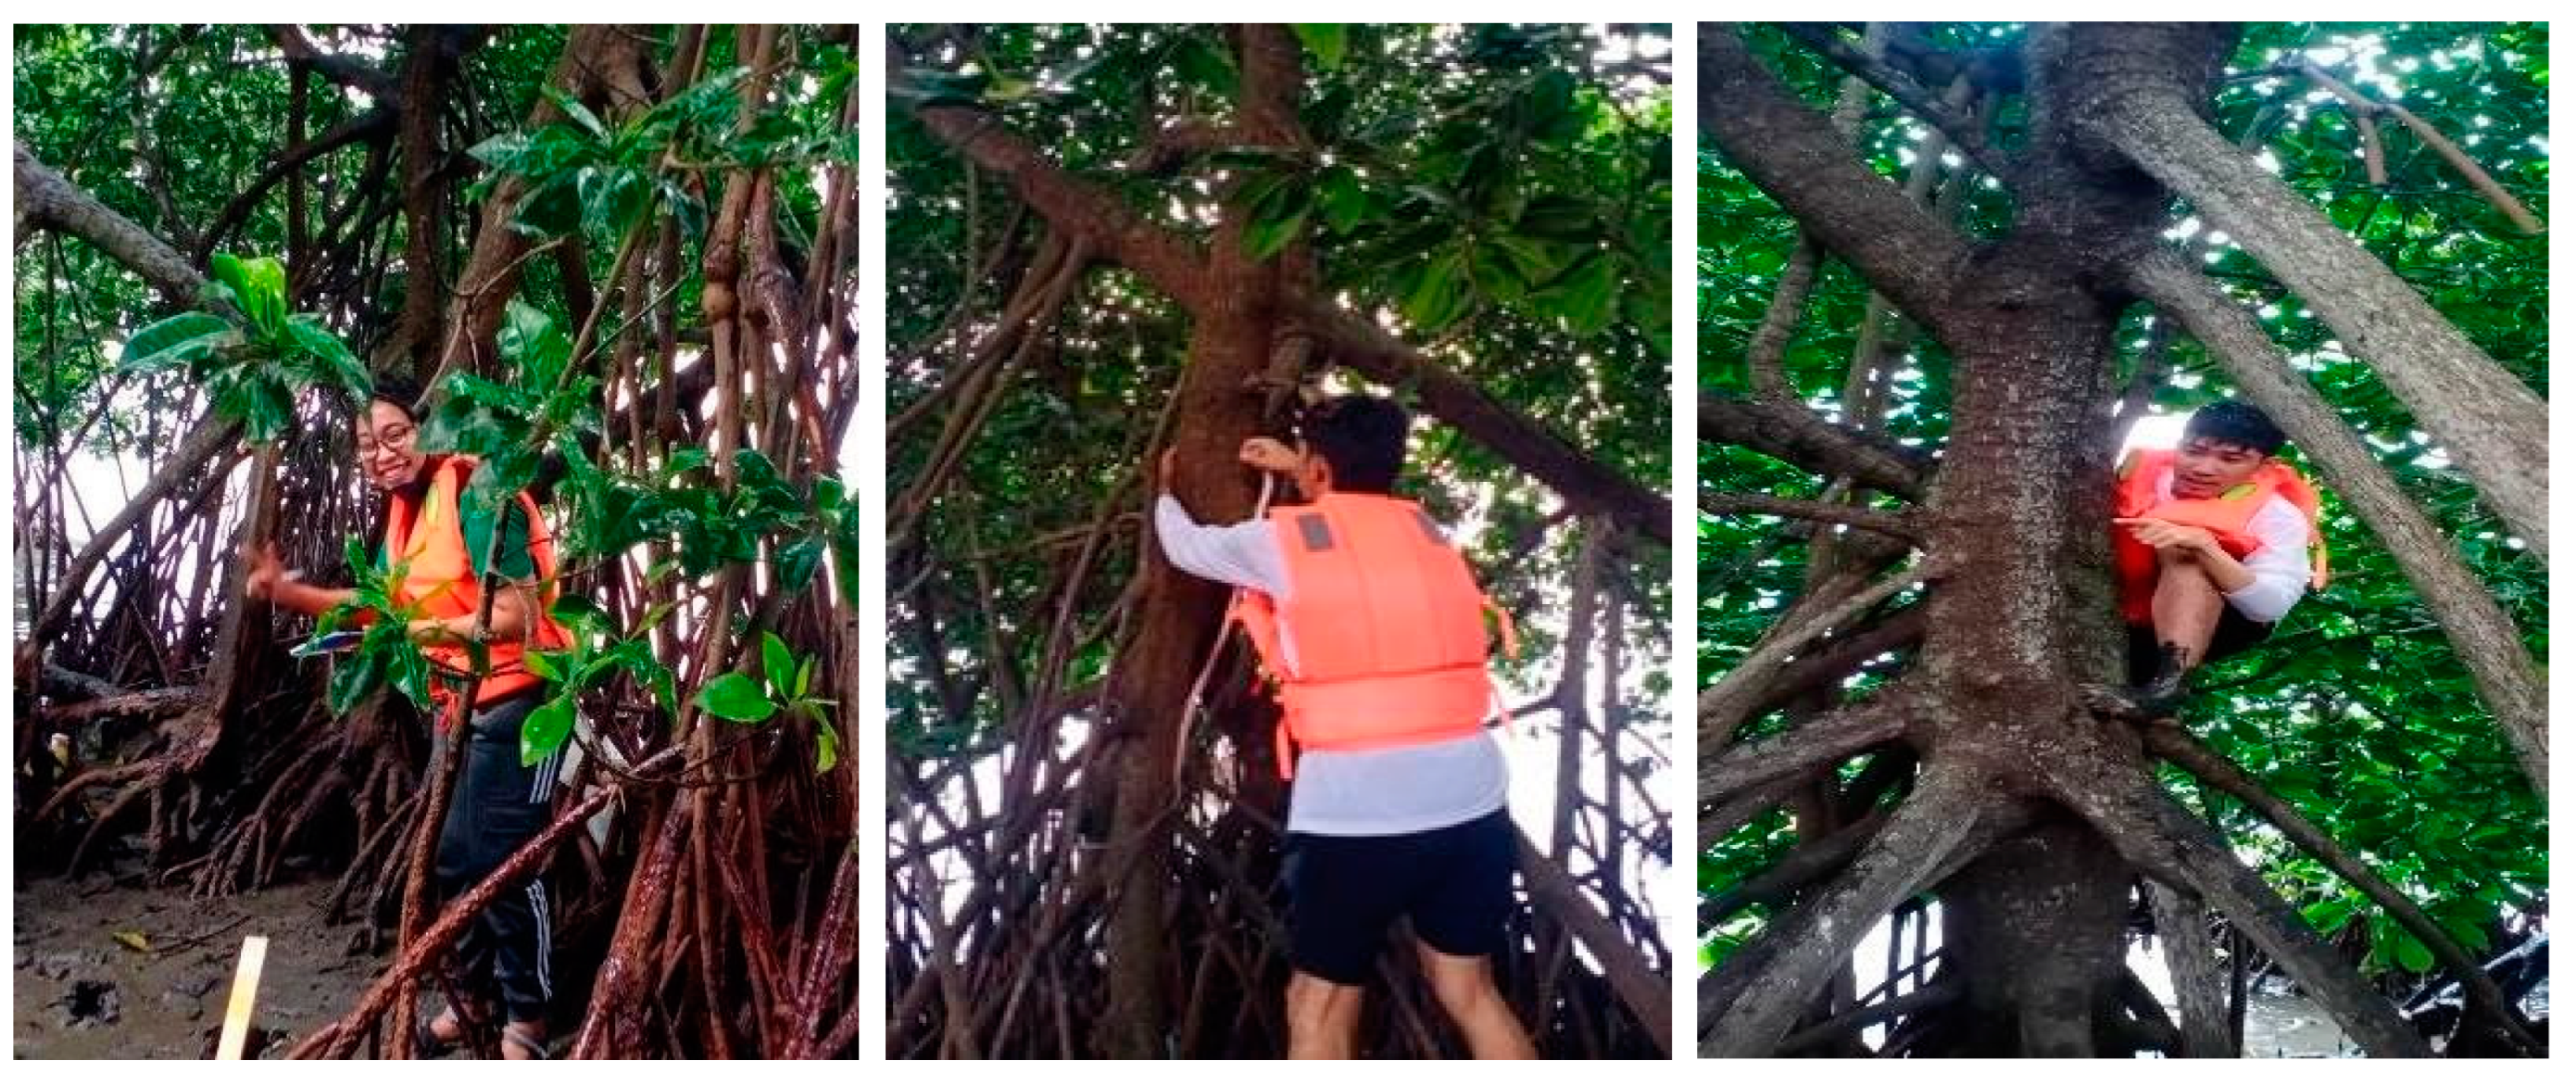
The collection of representative mangrove species in each of the three established vegetated sites was done using the continuous line transect method measuring 100 meters in length and 27.62 meters in width, equivalent to 2,762 m2 using a 100-m measuring tape. The mangrove species were identified using the manual Field Guide to Philippine Mangroves (2009) and (2022). It was verified by the Jose Vera Santos Memorial Herbarium, Institute of Biology in the University of the Philippines - Diliman, and Dr. Jurgenne H. Primavera for professional certification. In terms of carbon-storing and sequestration, the estimation for the amount of carbon stored and sequestered is only exclusive for the three established sampling sites within Kaingen River, given that the amount of carbon stored and sequestered was computed separately per site using a non- destructive method of data gathering. In quantifying the species identified, species abundance was calculated using the Shannon-Wiener Index, Simpson Diversity Index, and Sorensen's Similarity Index.
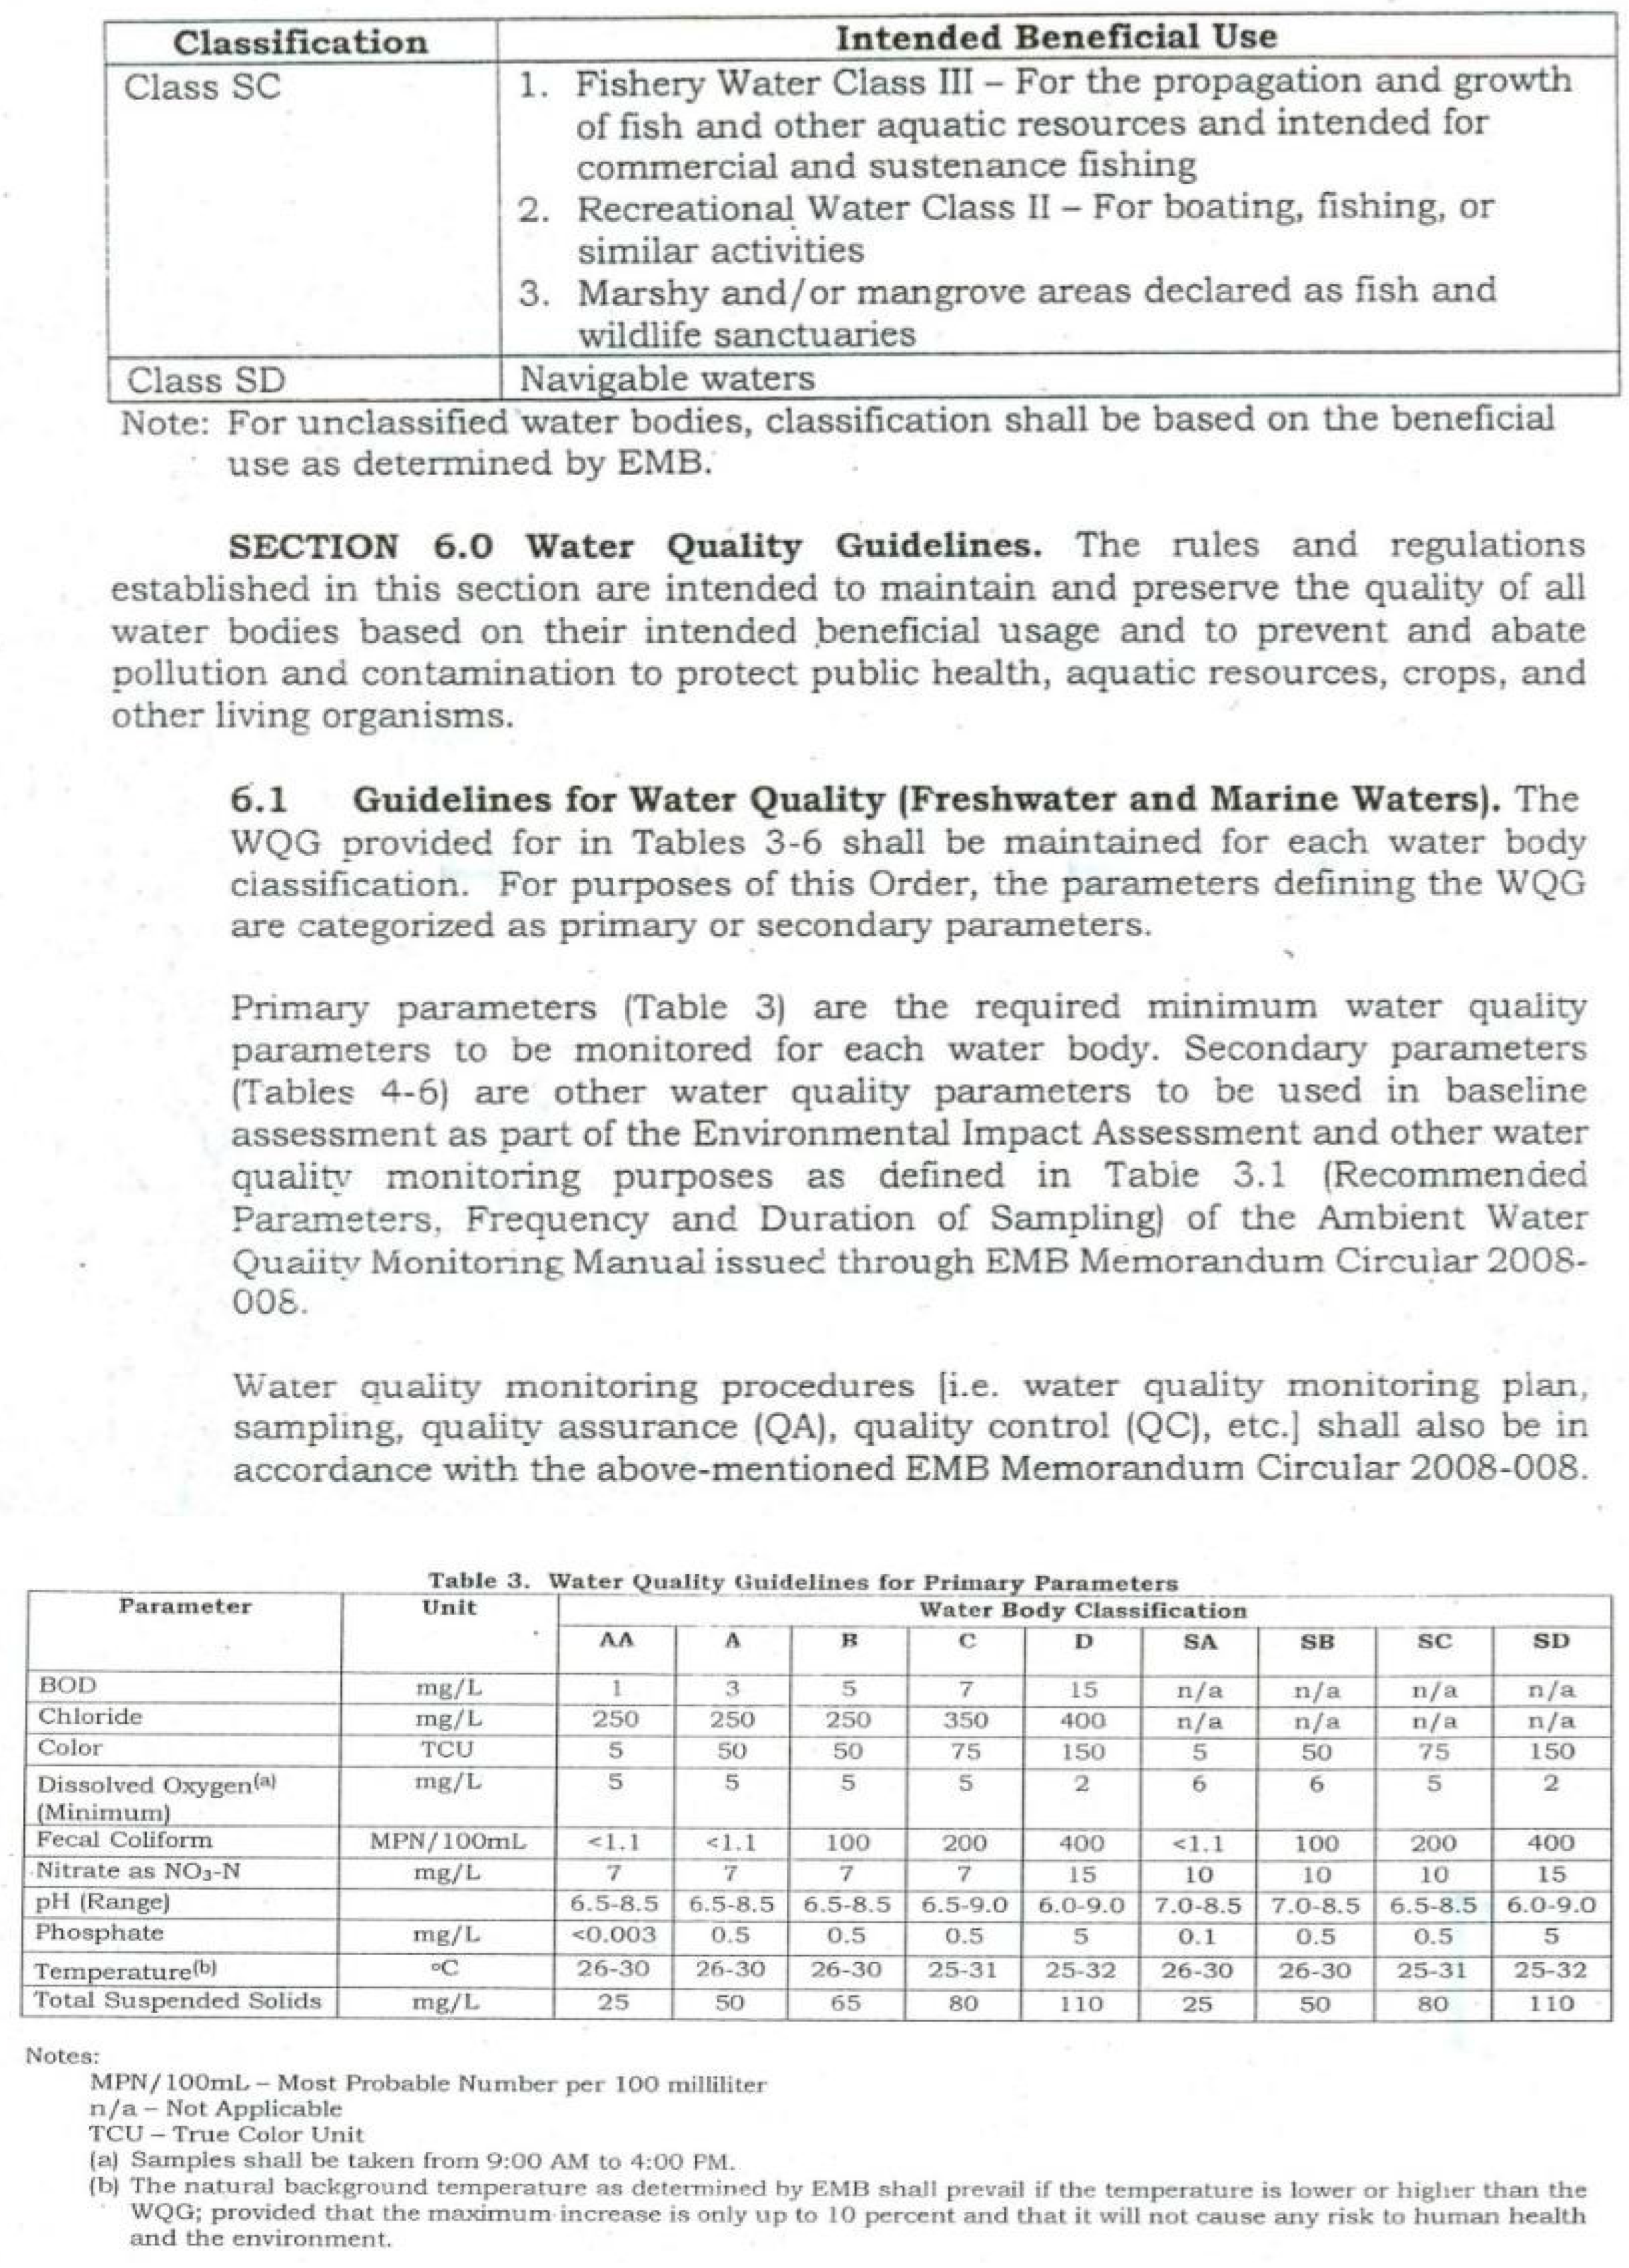
The method of water collection was conducted using grab sampling for parameters including temperature, turbidity, total dissolved solids (TDS), salinity, conductivity, pH level, and dissolved oxygen, while phosphates and nitrates were collected using composite sampling method. The assessment of the quality of water only focuses on measuring the concentration of the physicochemical parameters following the standard procedure of Department of Environment and Natural Resources Administrative Order (DAO) No. 2016-08 entitled “Water Quality Guidelines and General Effluent Standards of 2016” and the updated guidelines of the DAO-2021-19 for phosphates. It does not include the assessment of other parameters such as the concentration of trace metals and the amount of microbiological activity, as they do not relate to the growth of mangrove trees.
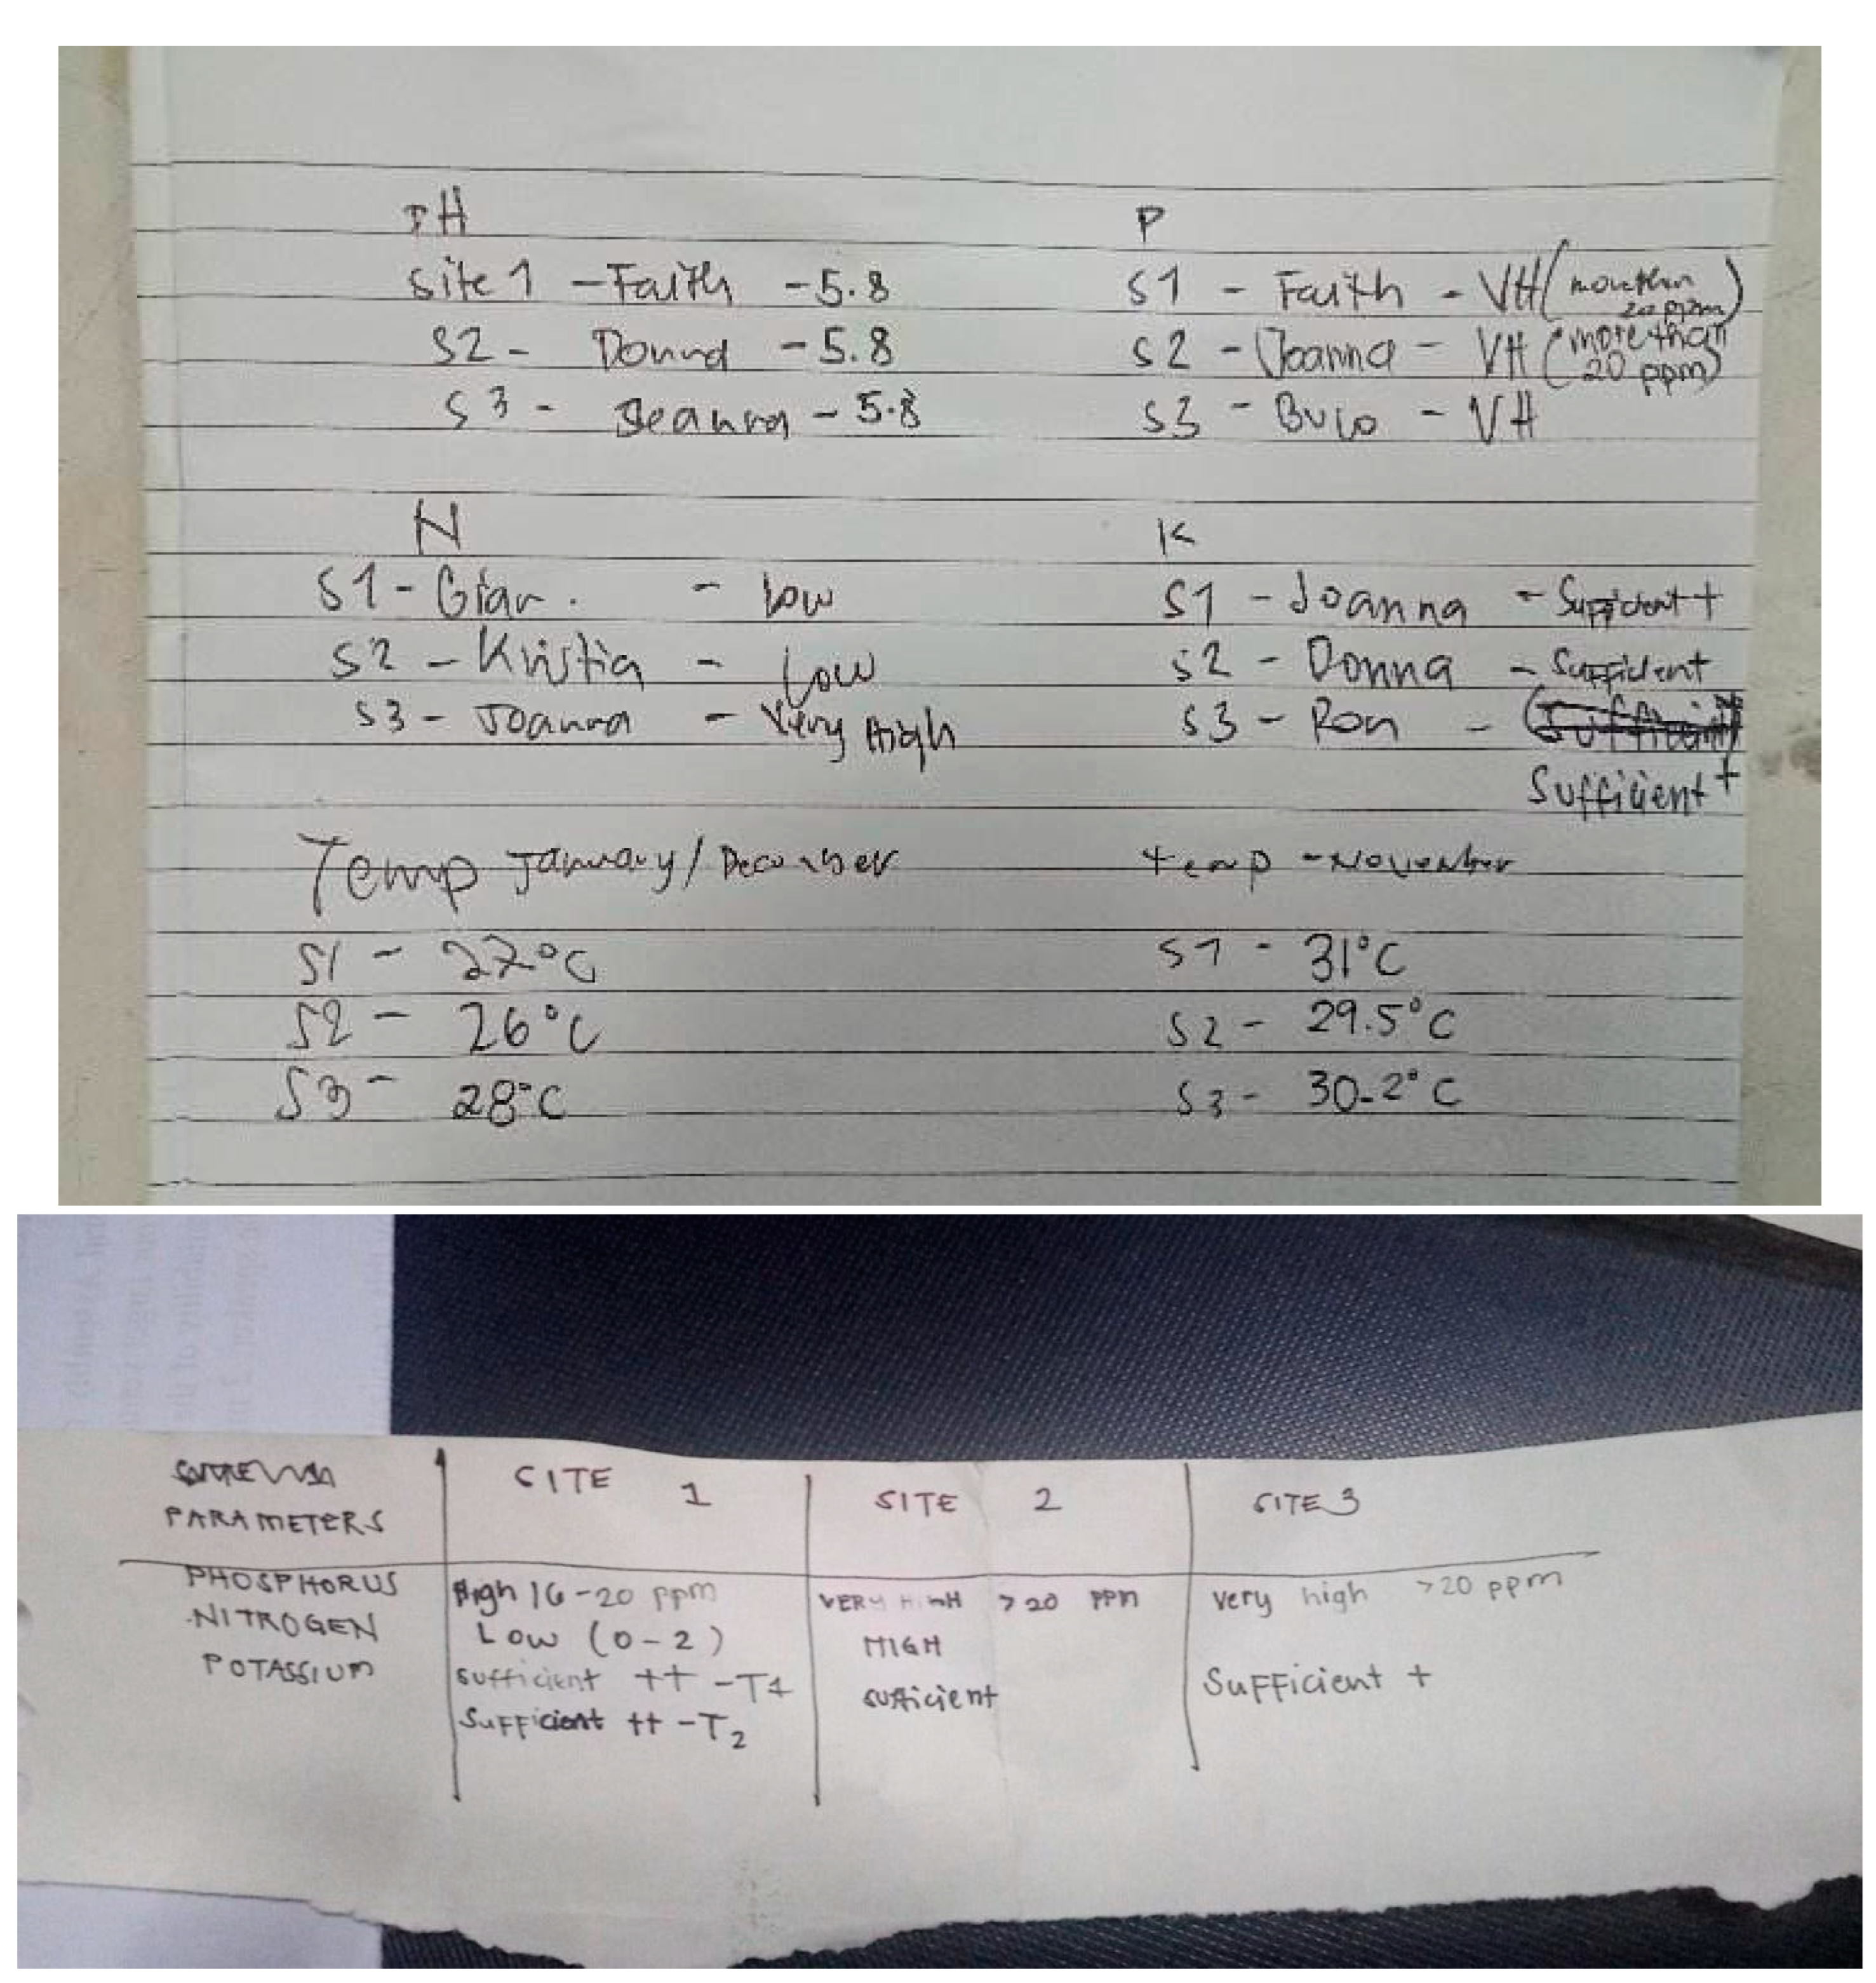
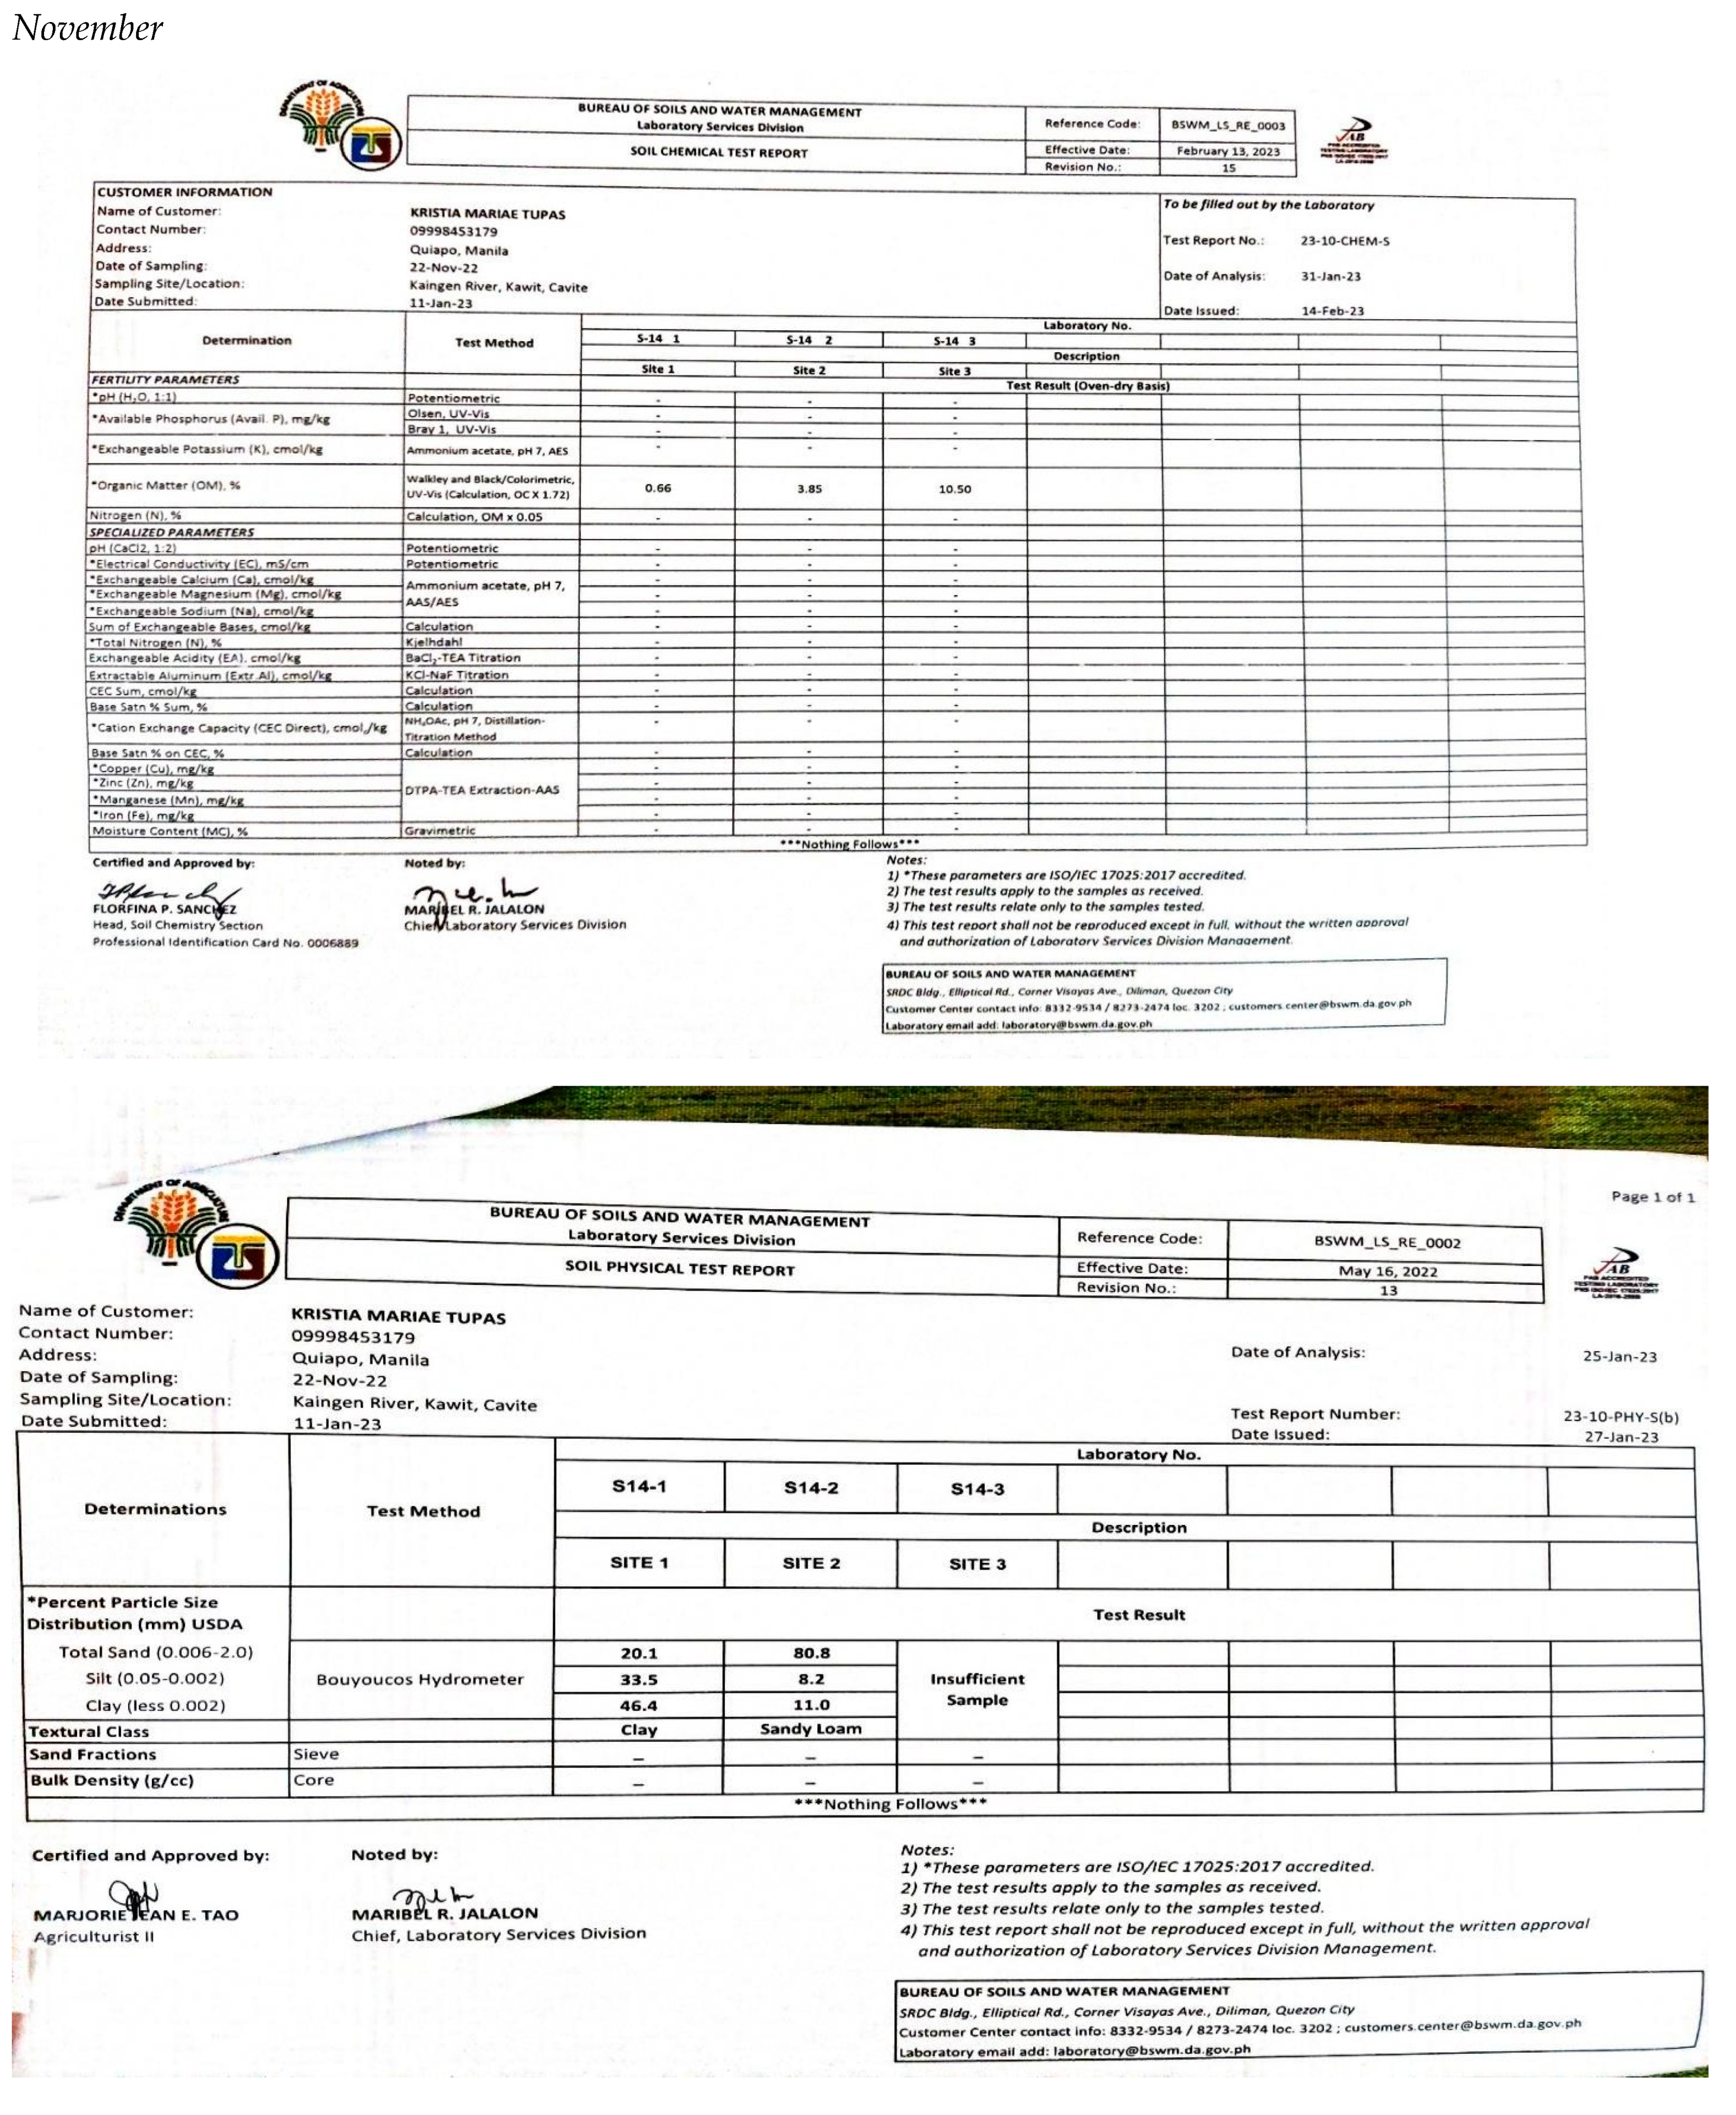
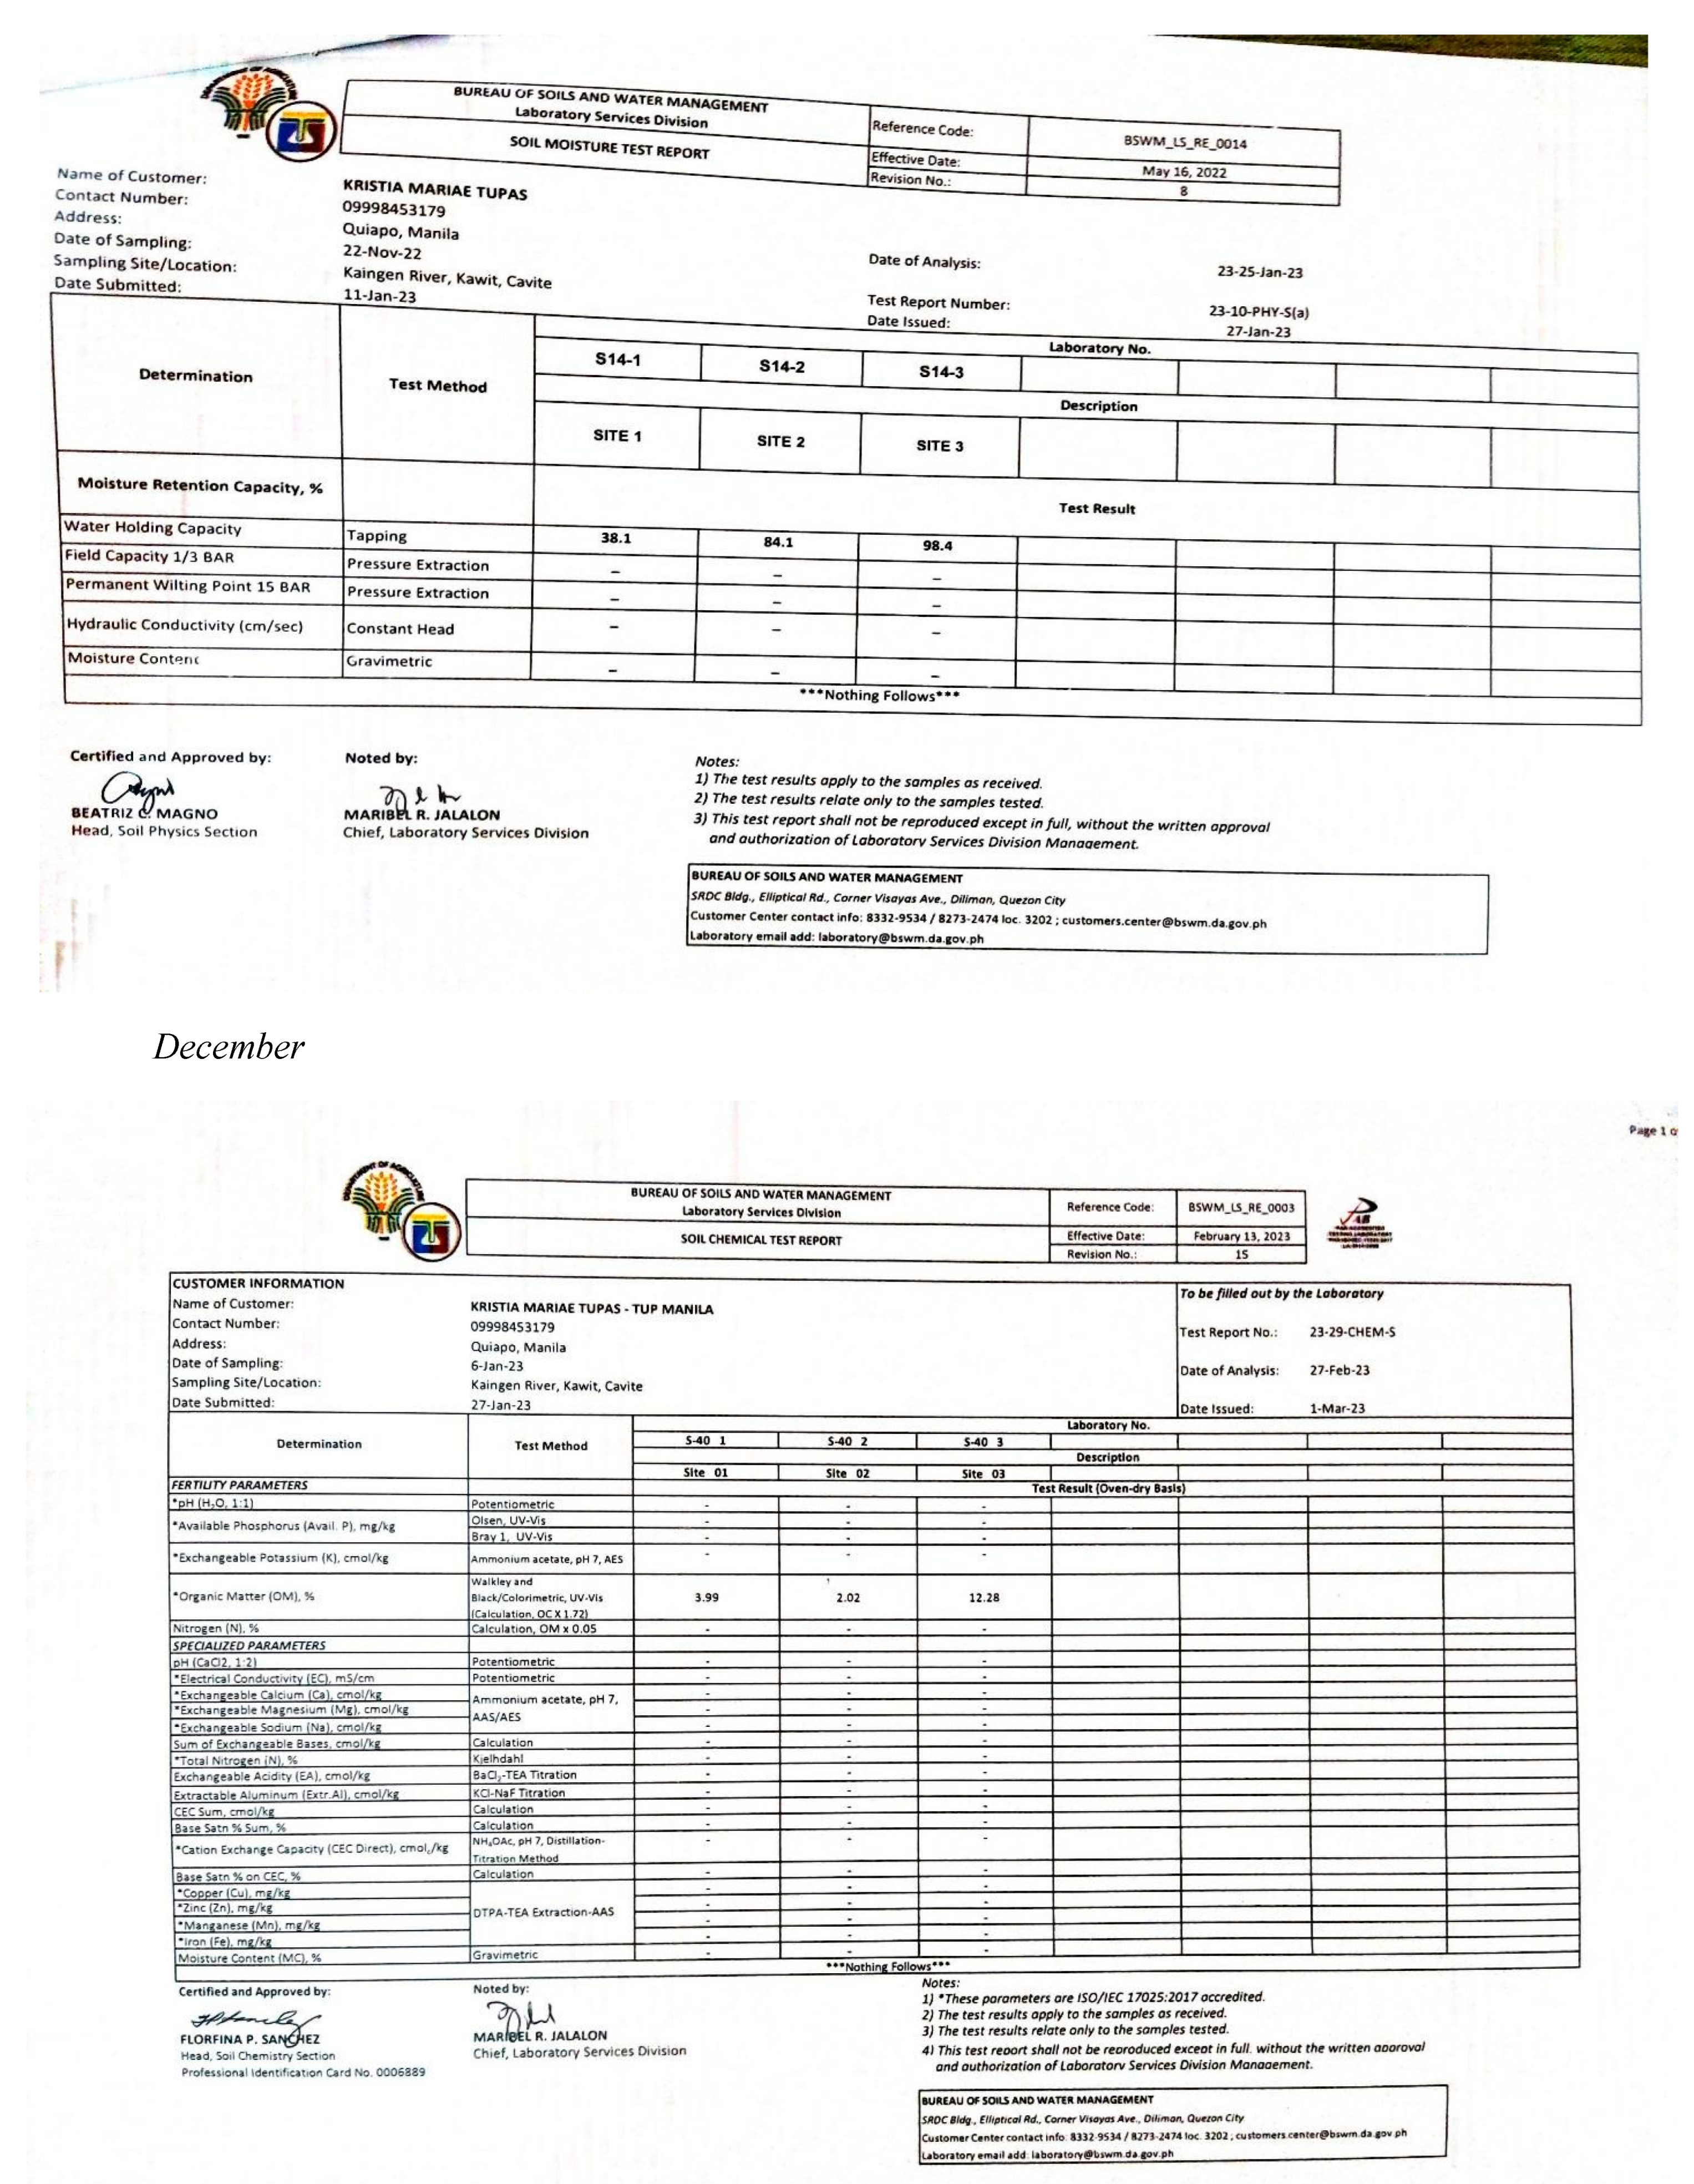
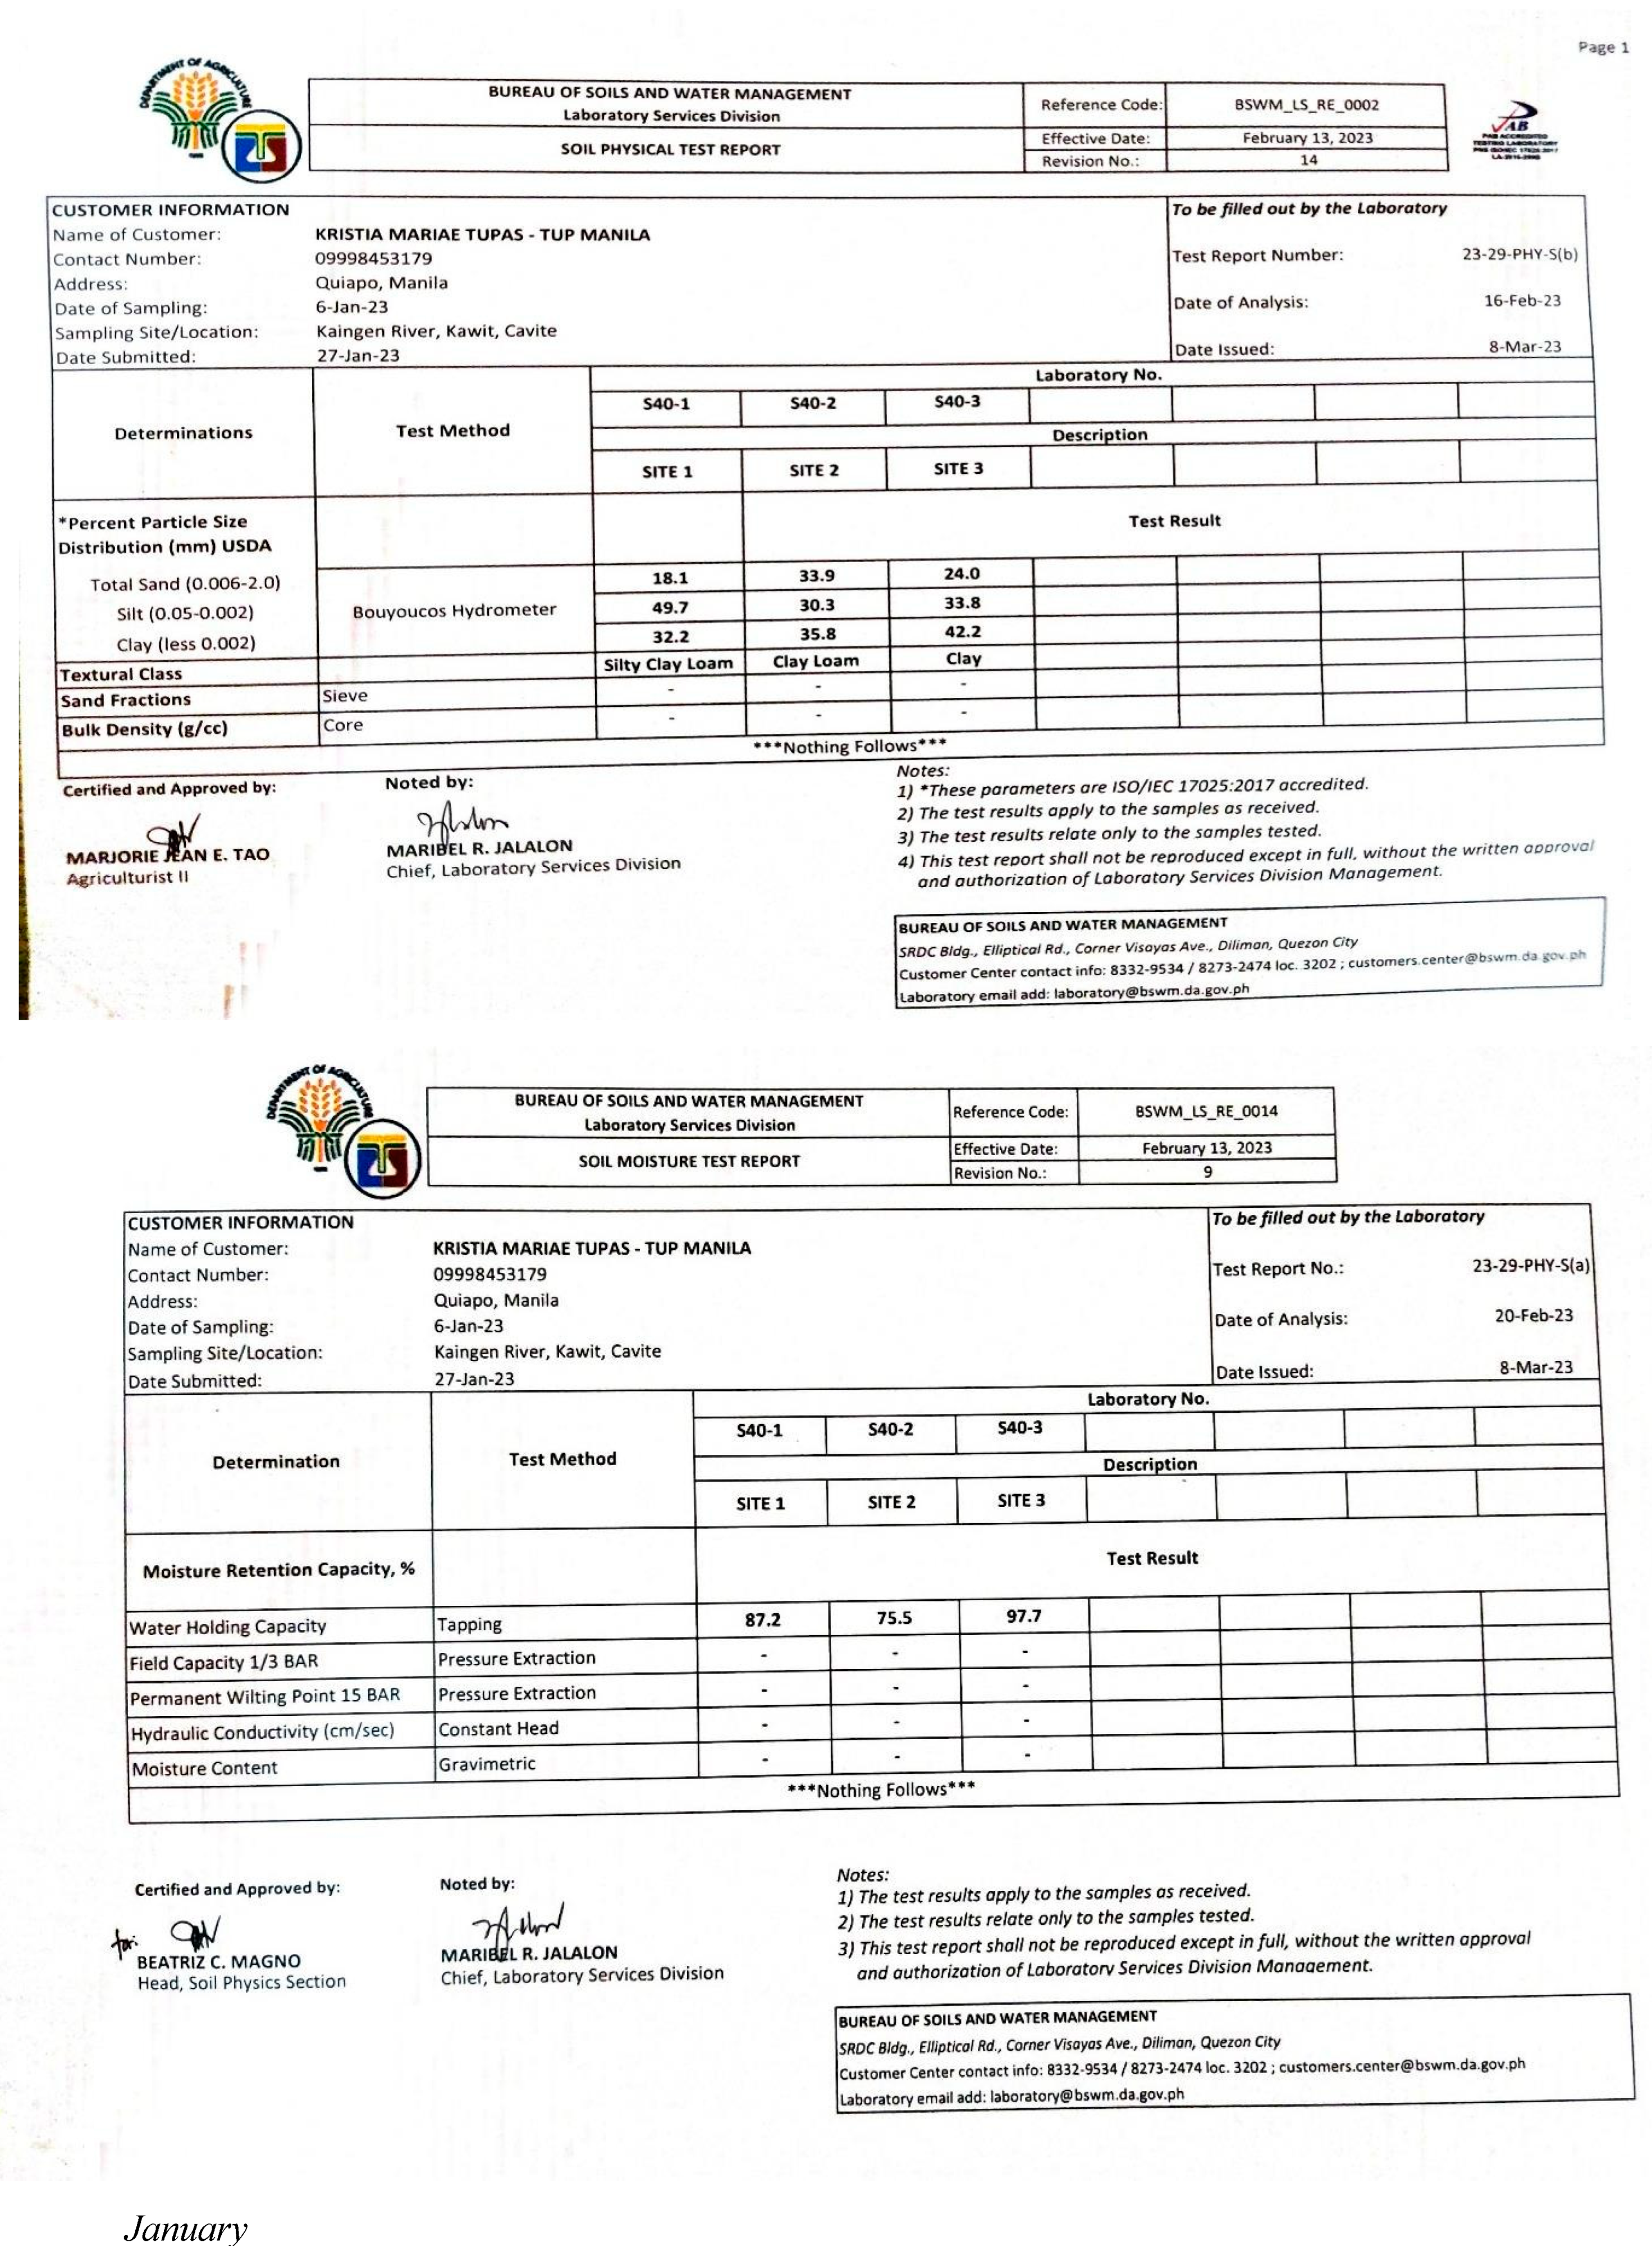
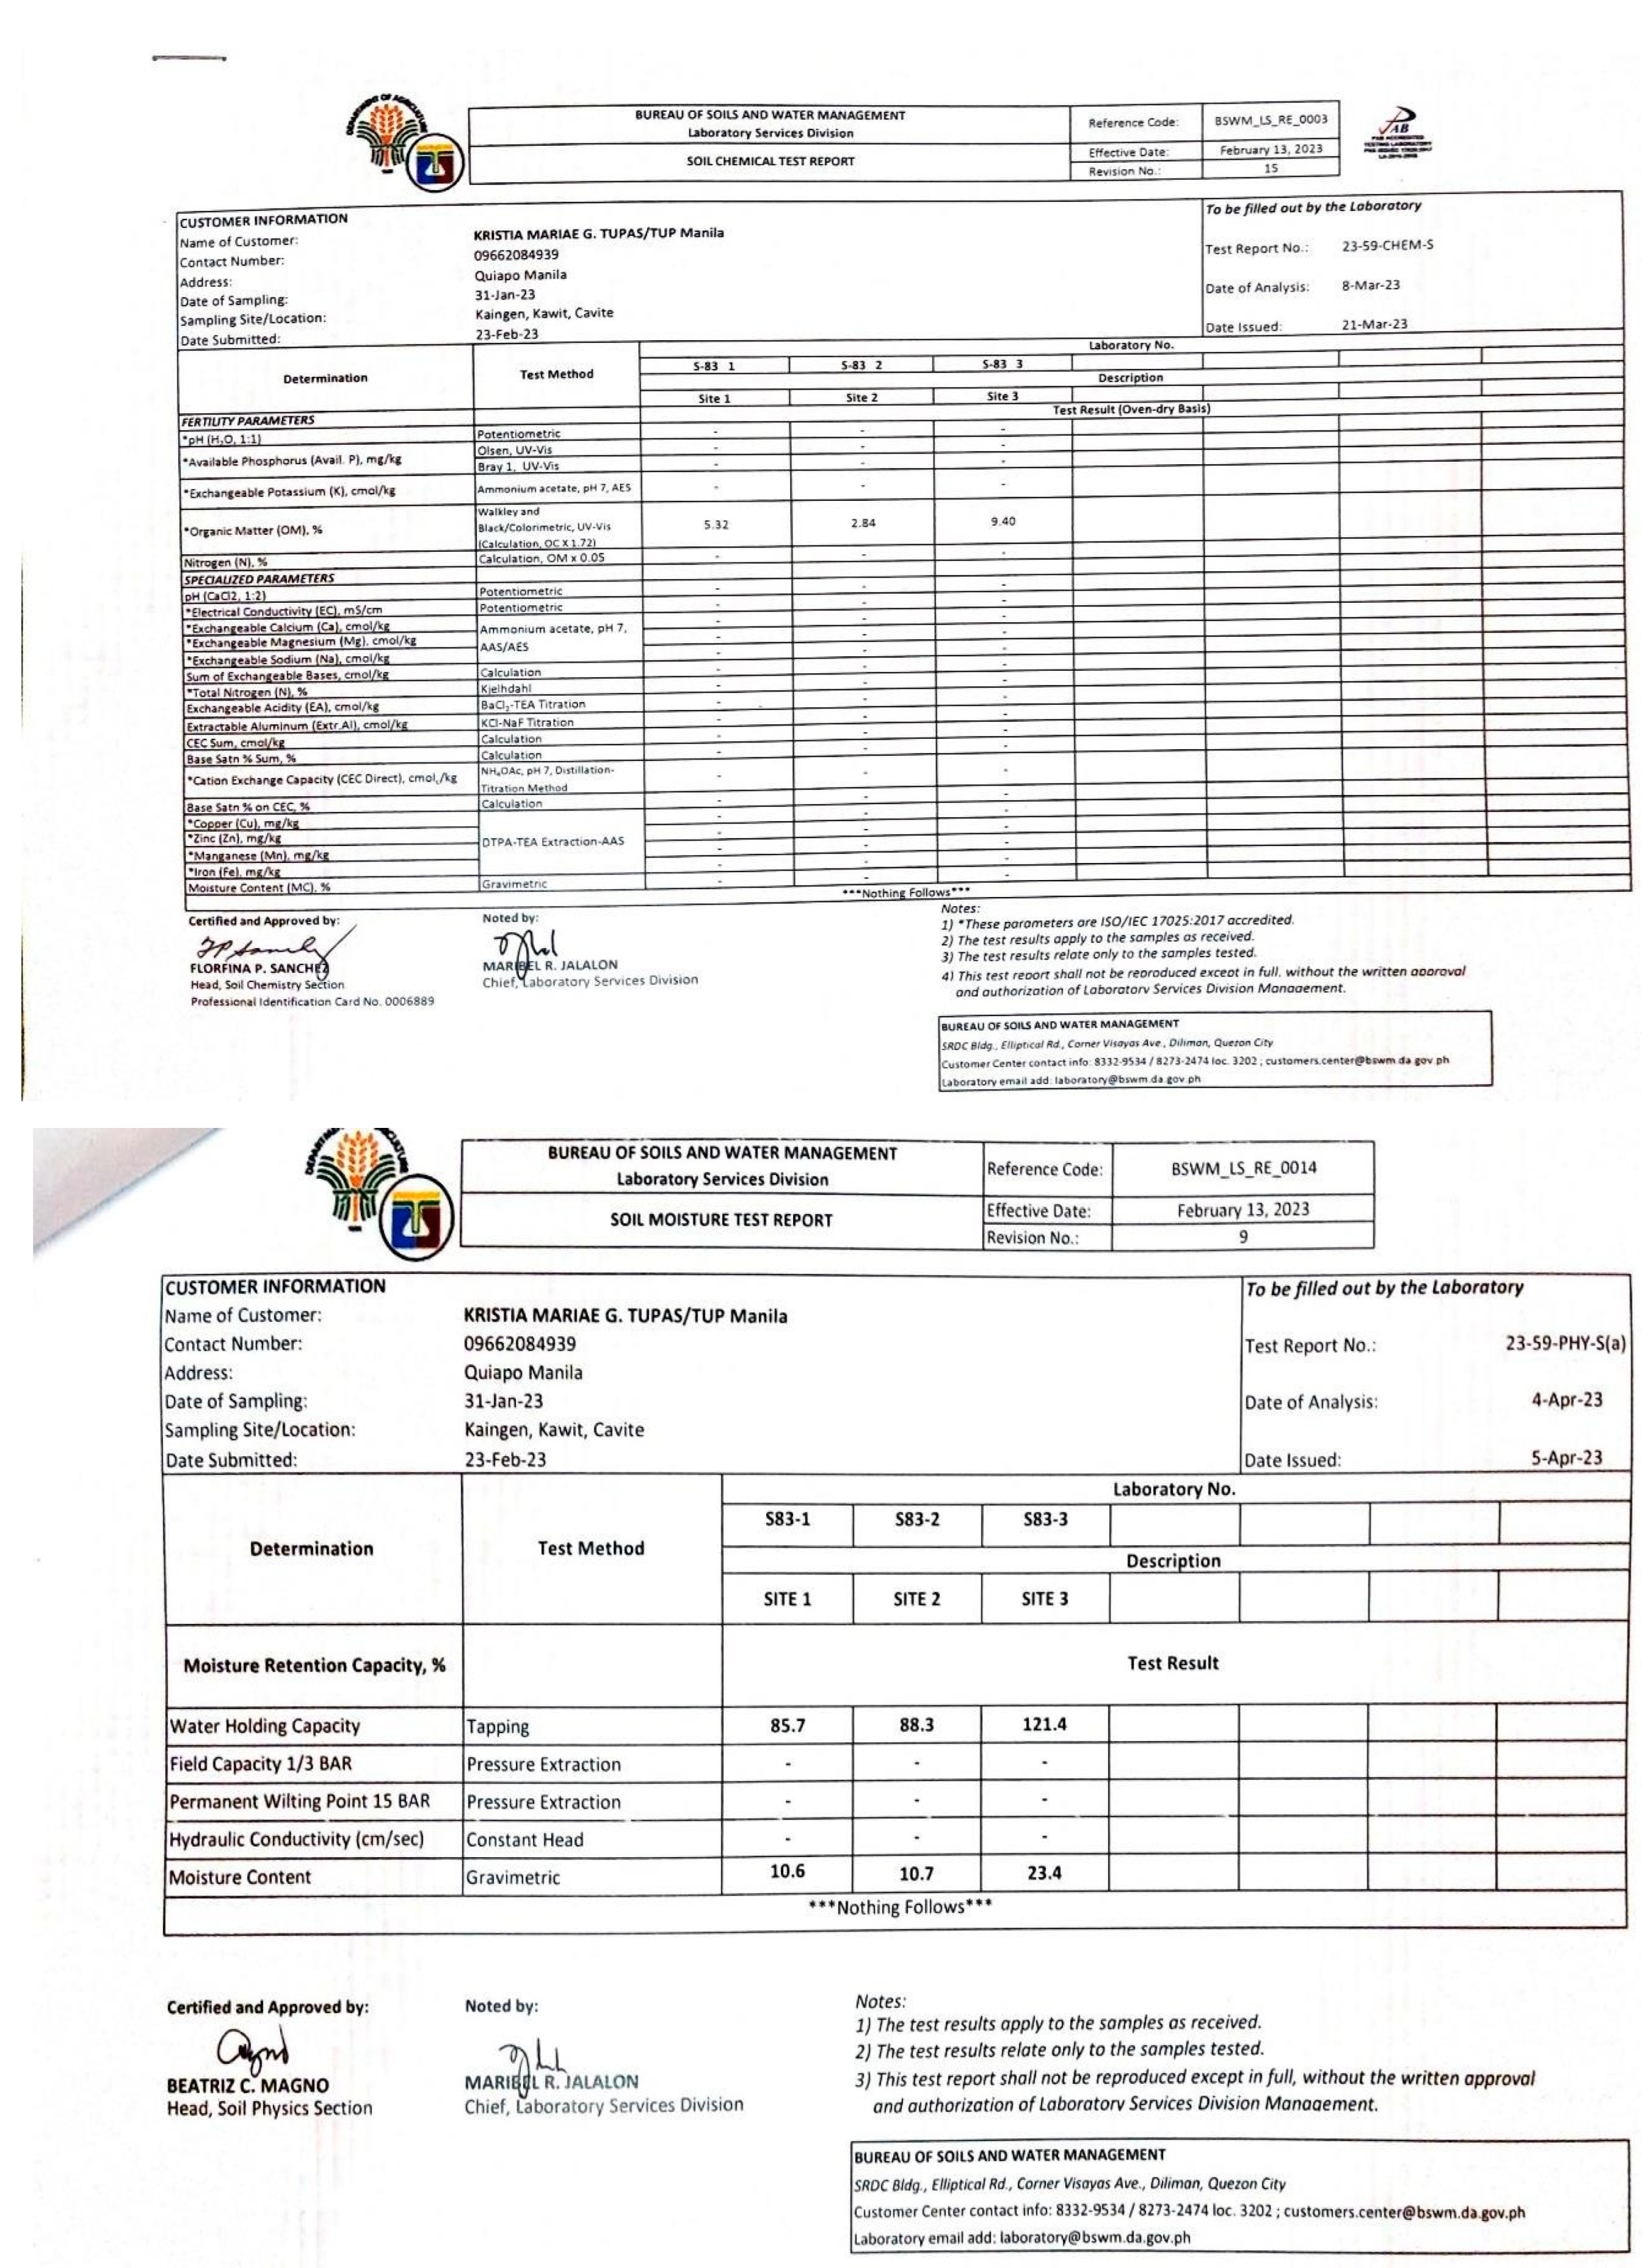
The soil sampling method was adopted from the Bureau of Soils and Water Management (BSWM) and only focuses on the following parameters including the soil texture, water holding capacity, soil temperature, soil pH, organic matter, organic carbon, and NPK (nitrogen, phosphorus, and potassium). Additionally, parameters such as soil pH and NPK were tested using the BSWM Soil Test Kit; therefore, results were compared based on the standard classification indicated in the manual wherein tests for available potassium do not include numerical values for the results. Qualitative analysis was used for NPK and its qualitative data was quantified through ranking for statistical analysis under the IBM SPSS version 26 software. Interpretation of results for NPK was based solely on the soil test kit manual, while further interpretation was not readily available on the official site of BSWM. In addition, the results of each parameter in each site were compared monthly of three sampling sites based on the Kruskal Wallis test and the five sampling periods per site based on the Friedman test. While the relationship between water and soil quality parameters with the abundance of mangroves was determined using Pearson’s r Correlation.

Chapter II

REVIEW OF RELATED LITERATURE AND STUDIES

2.1. Kaingen Riverine Ecosystem
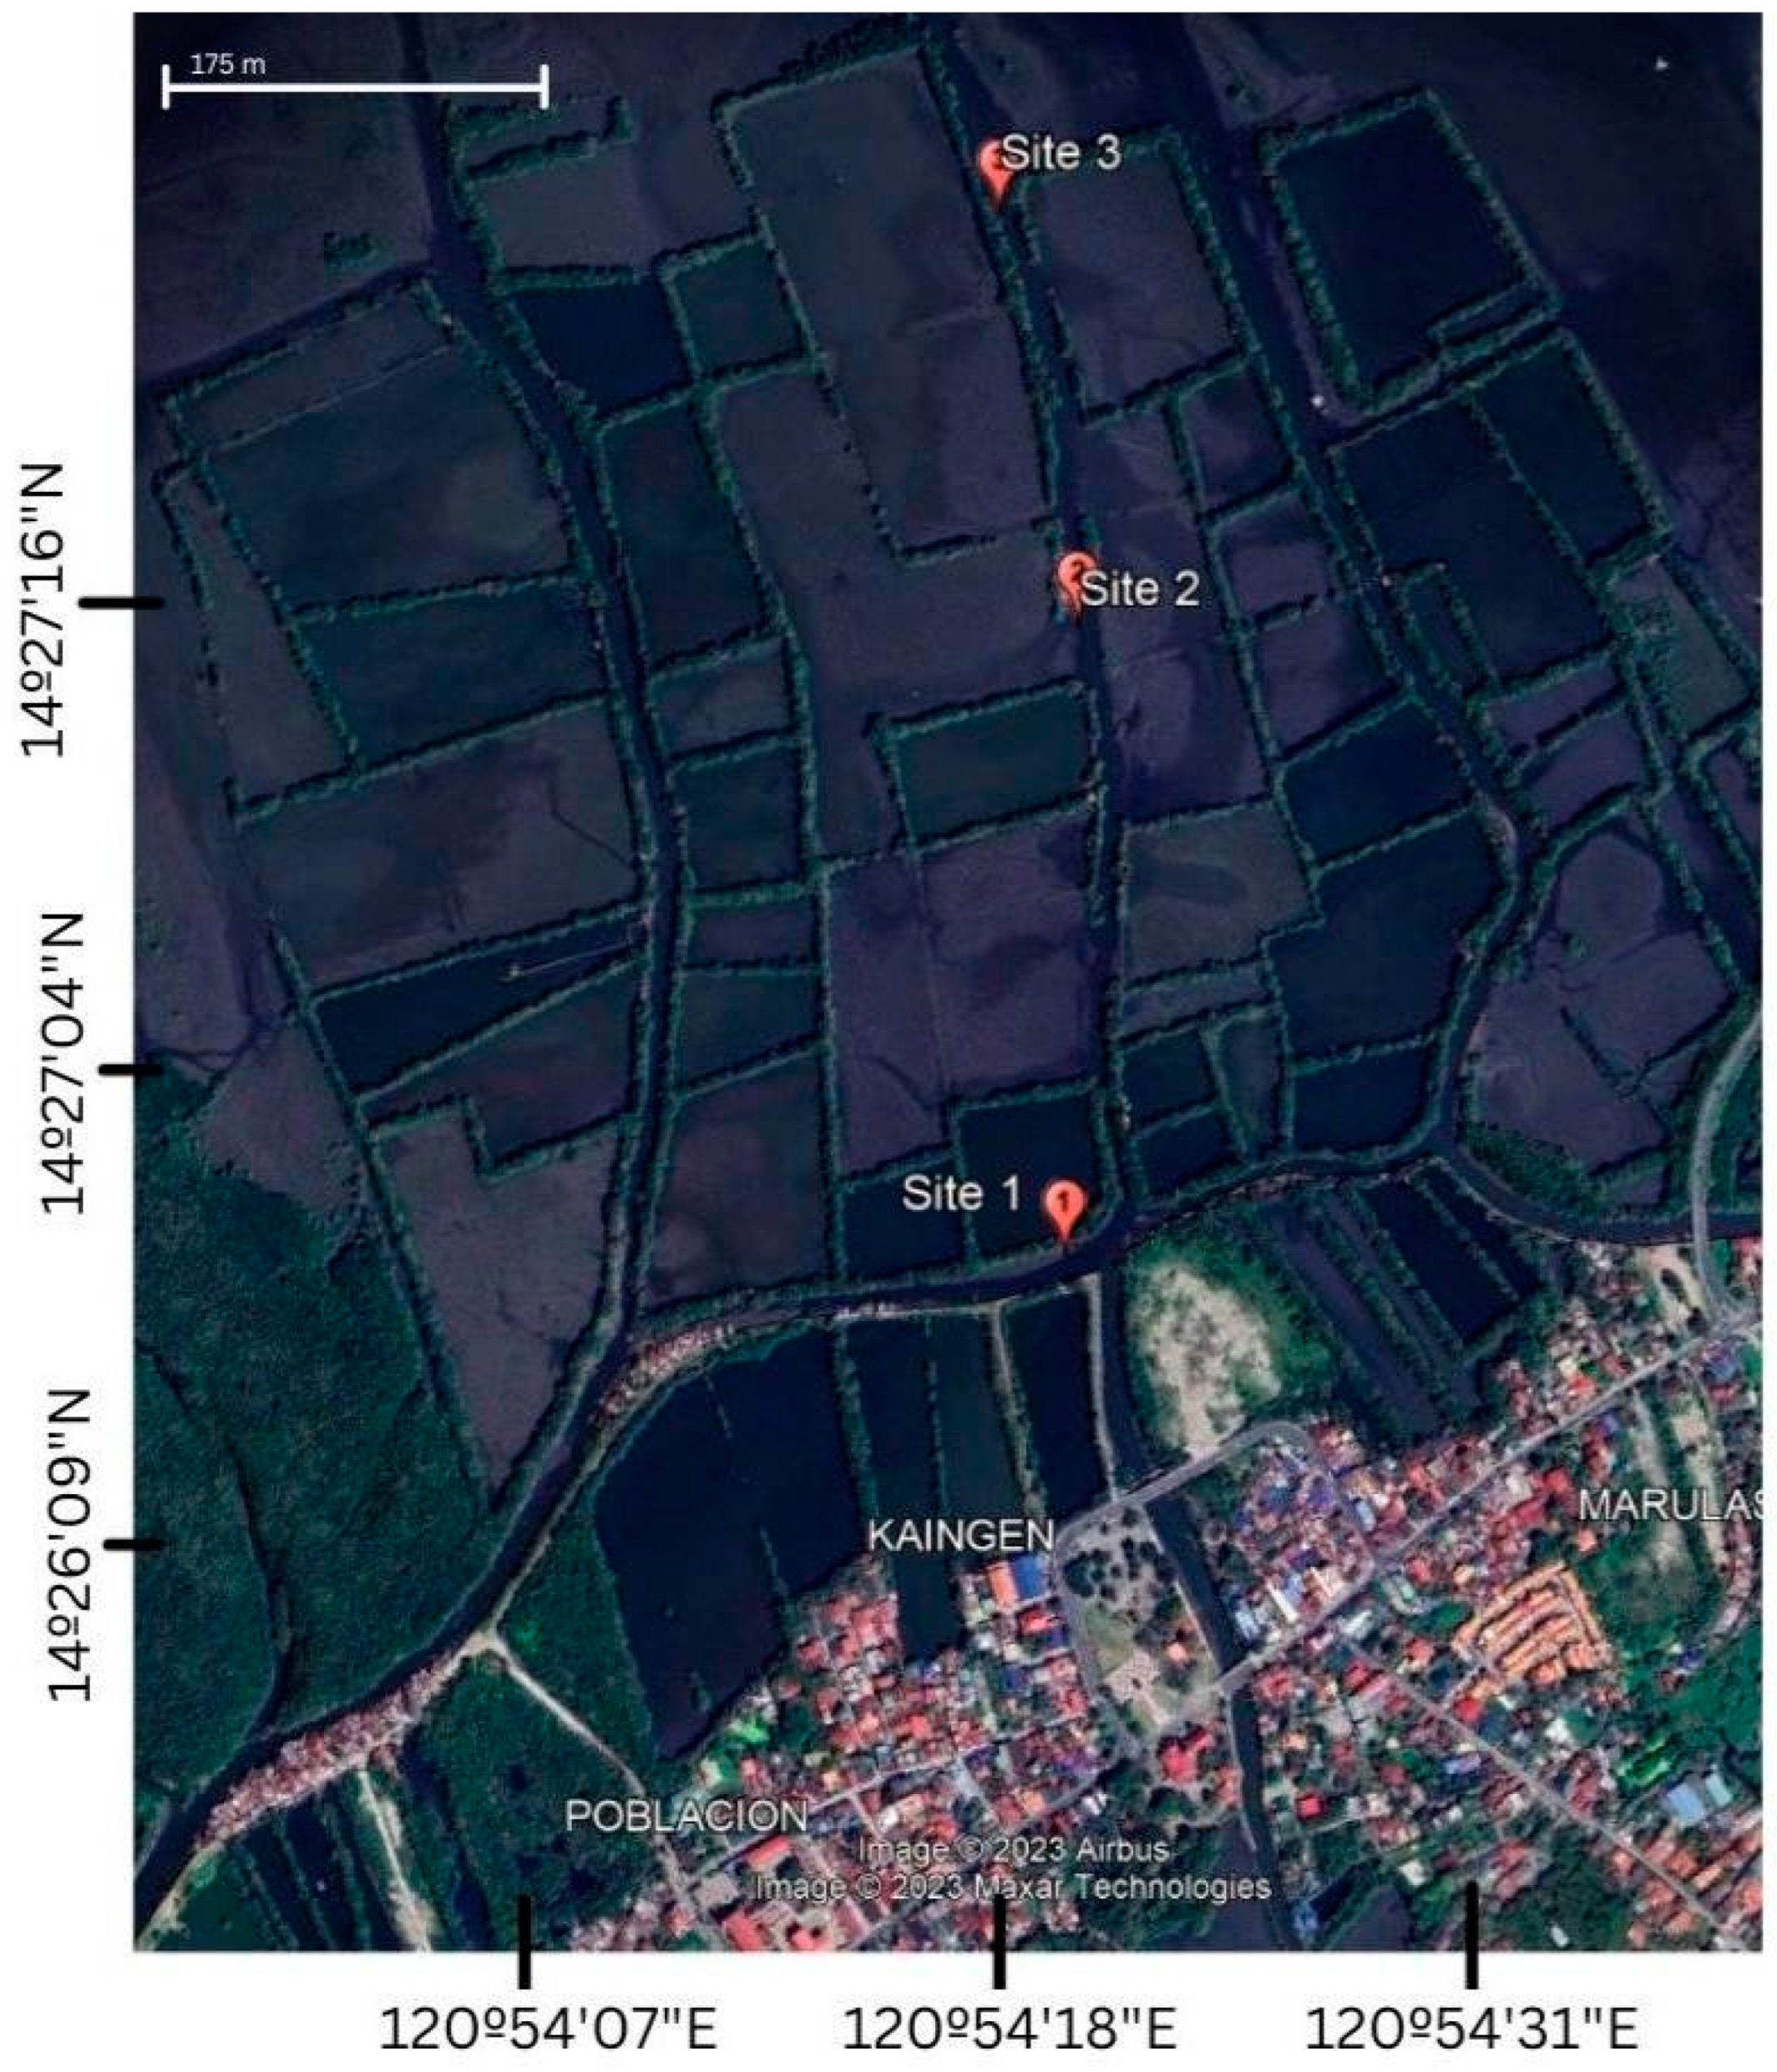
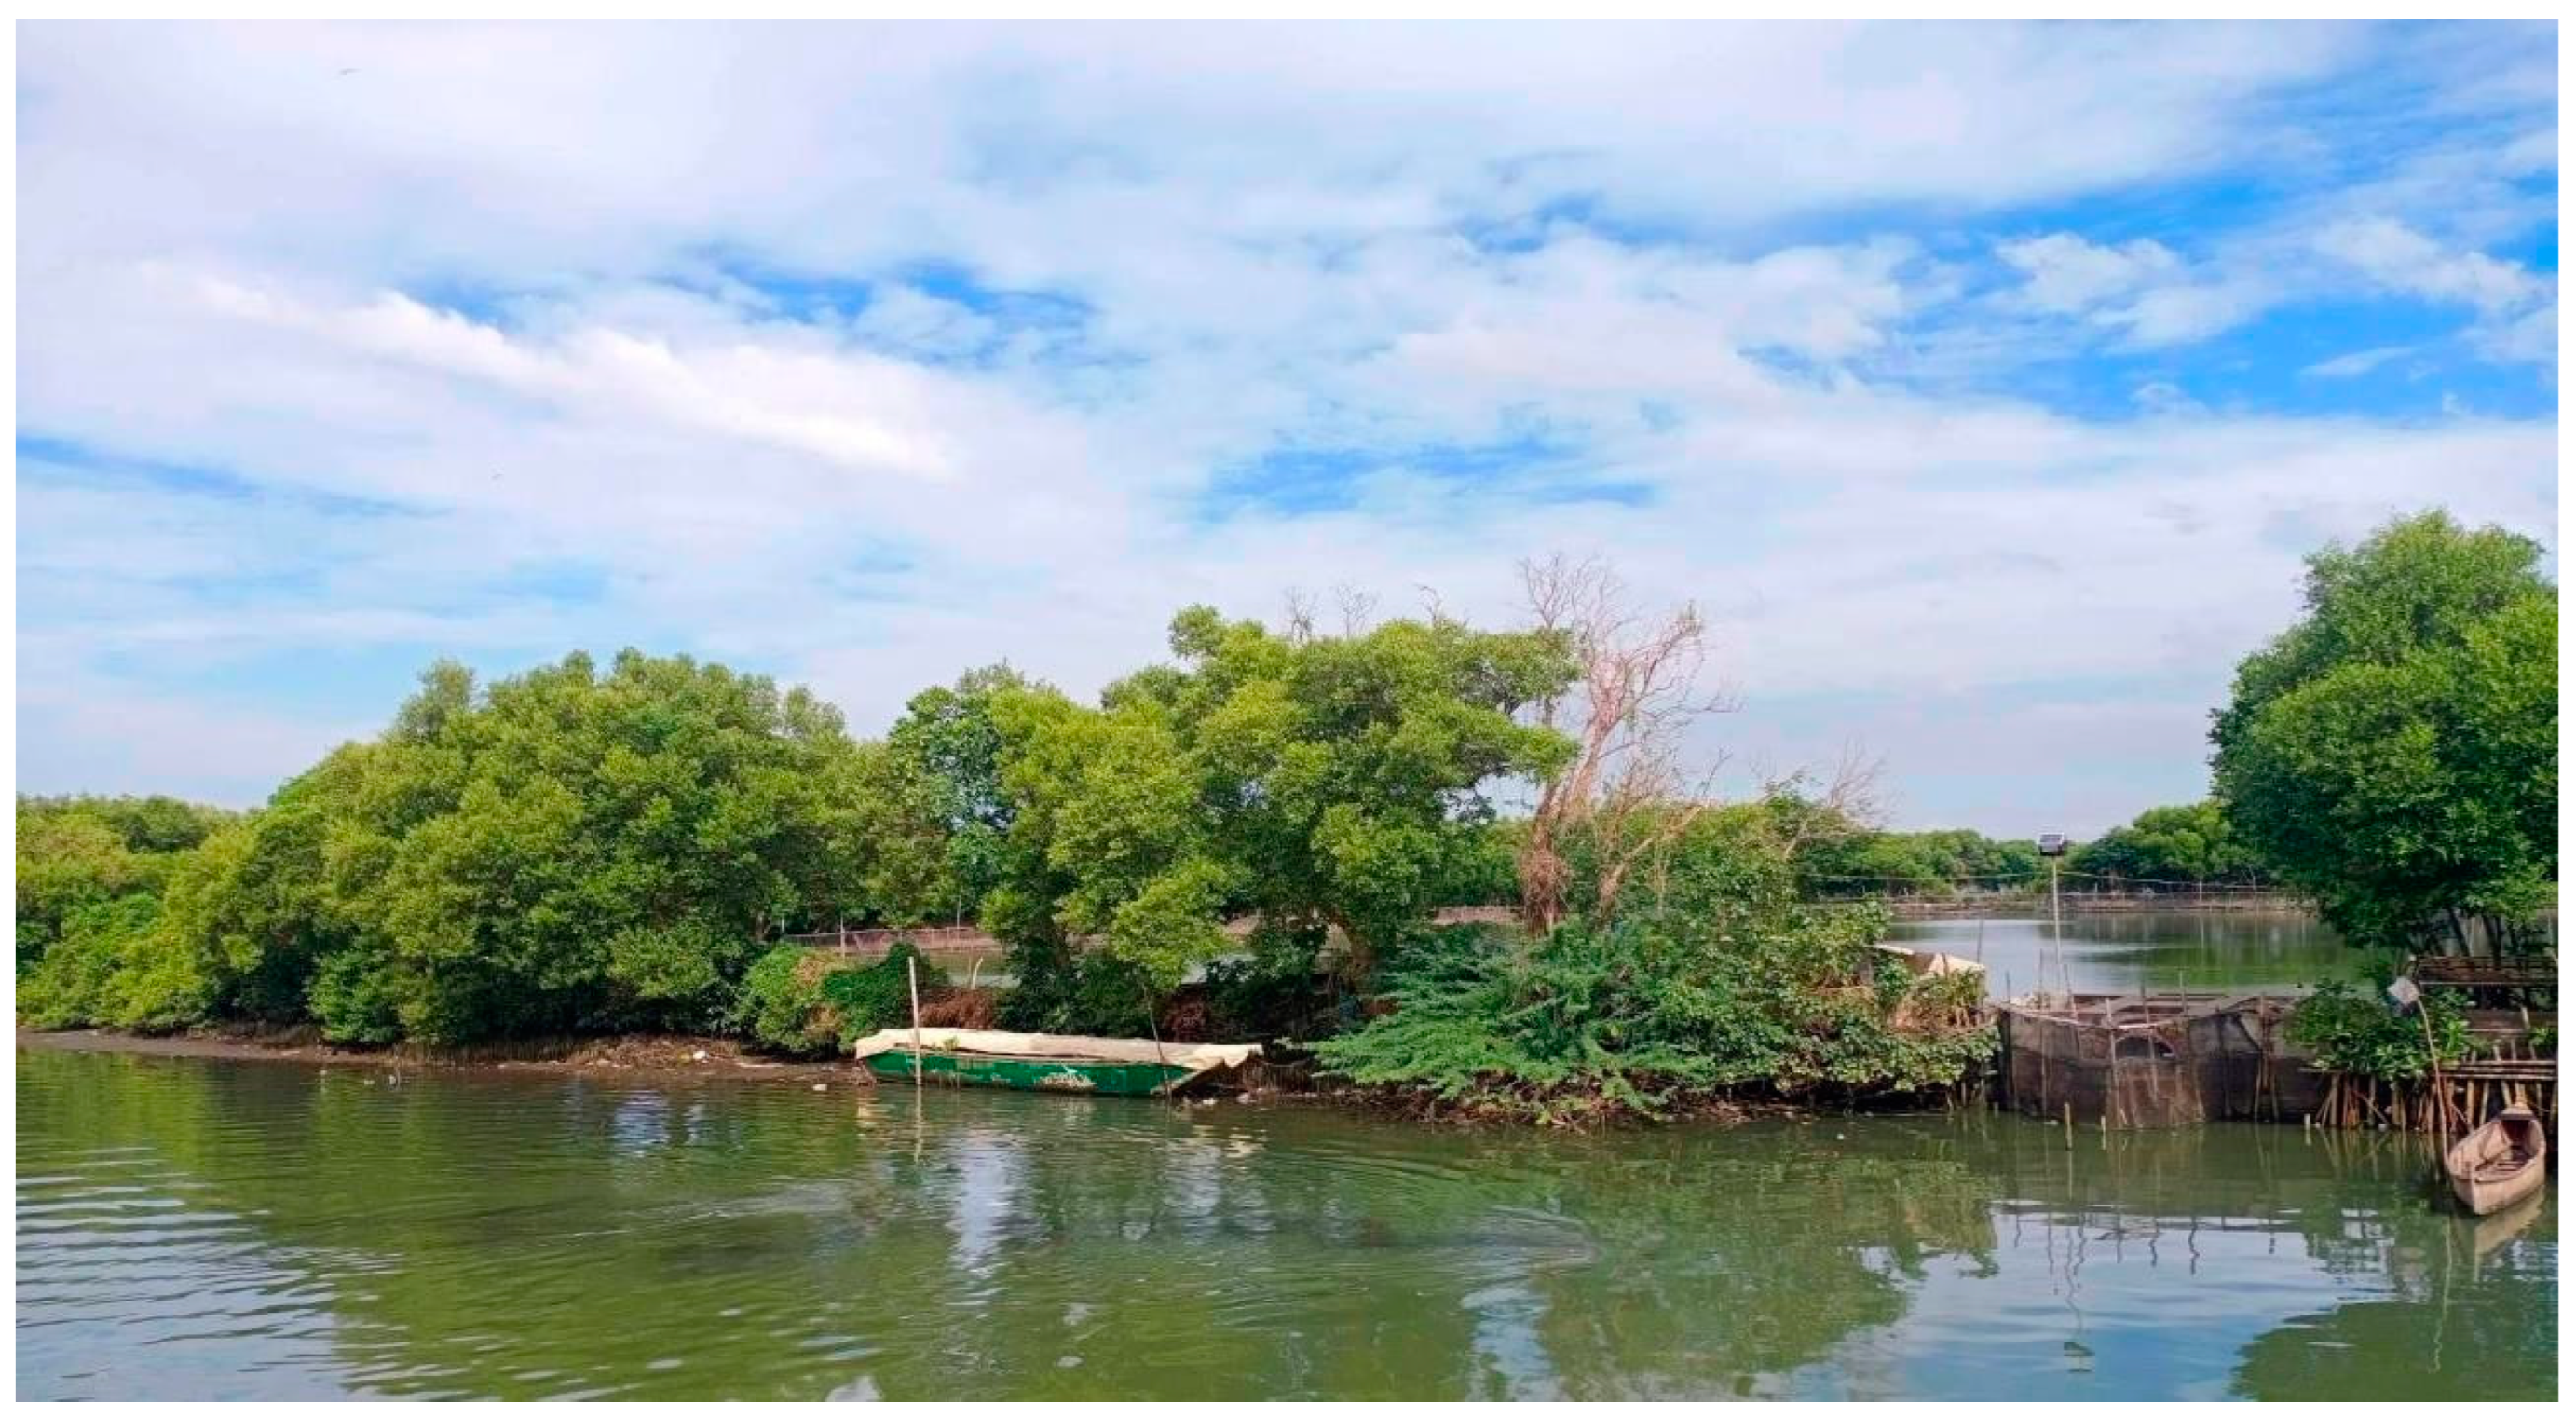
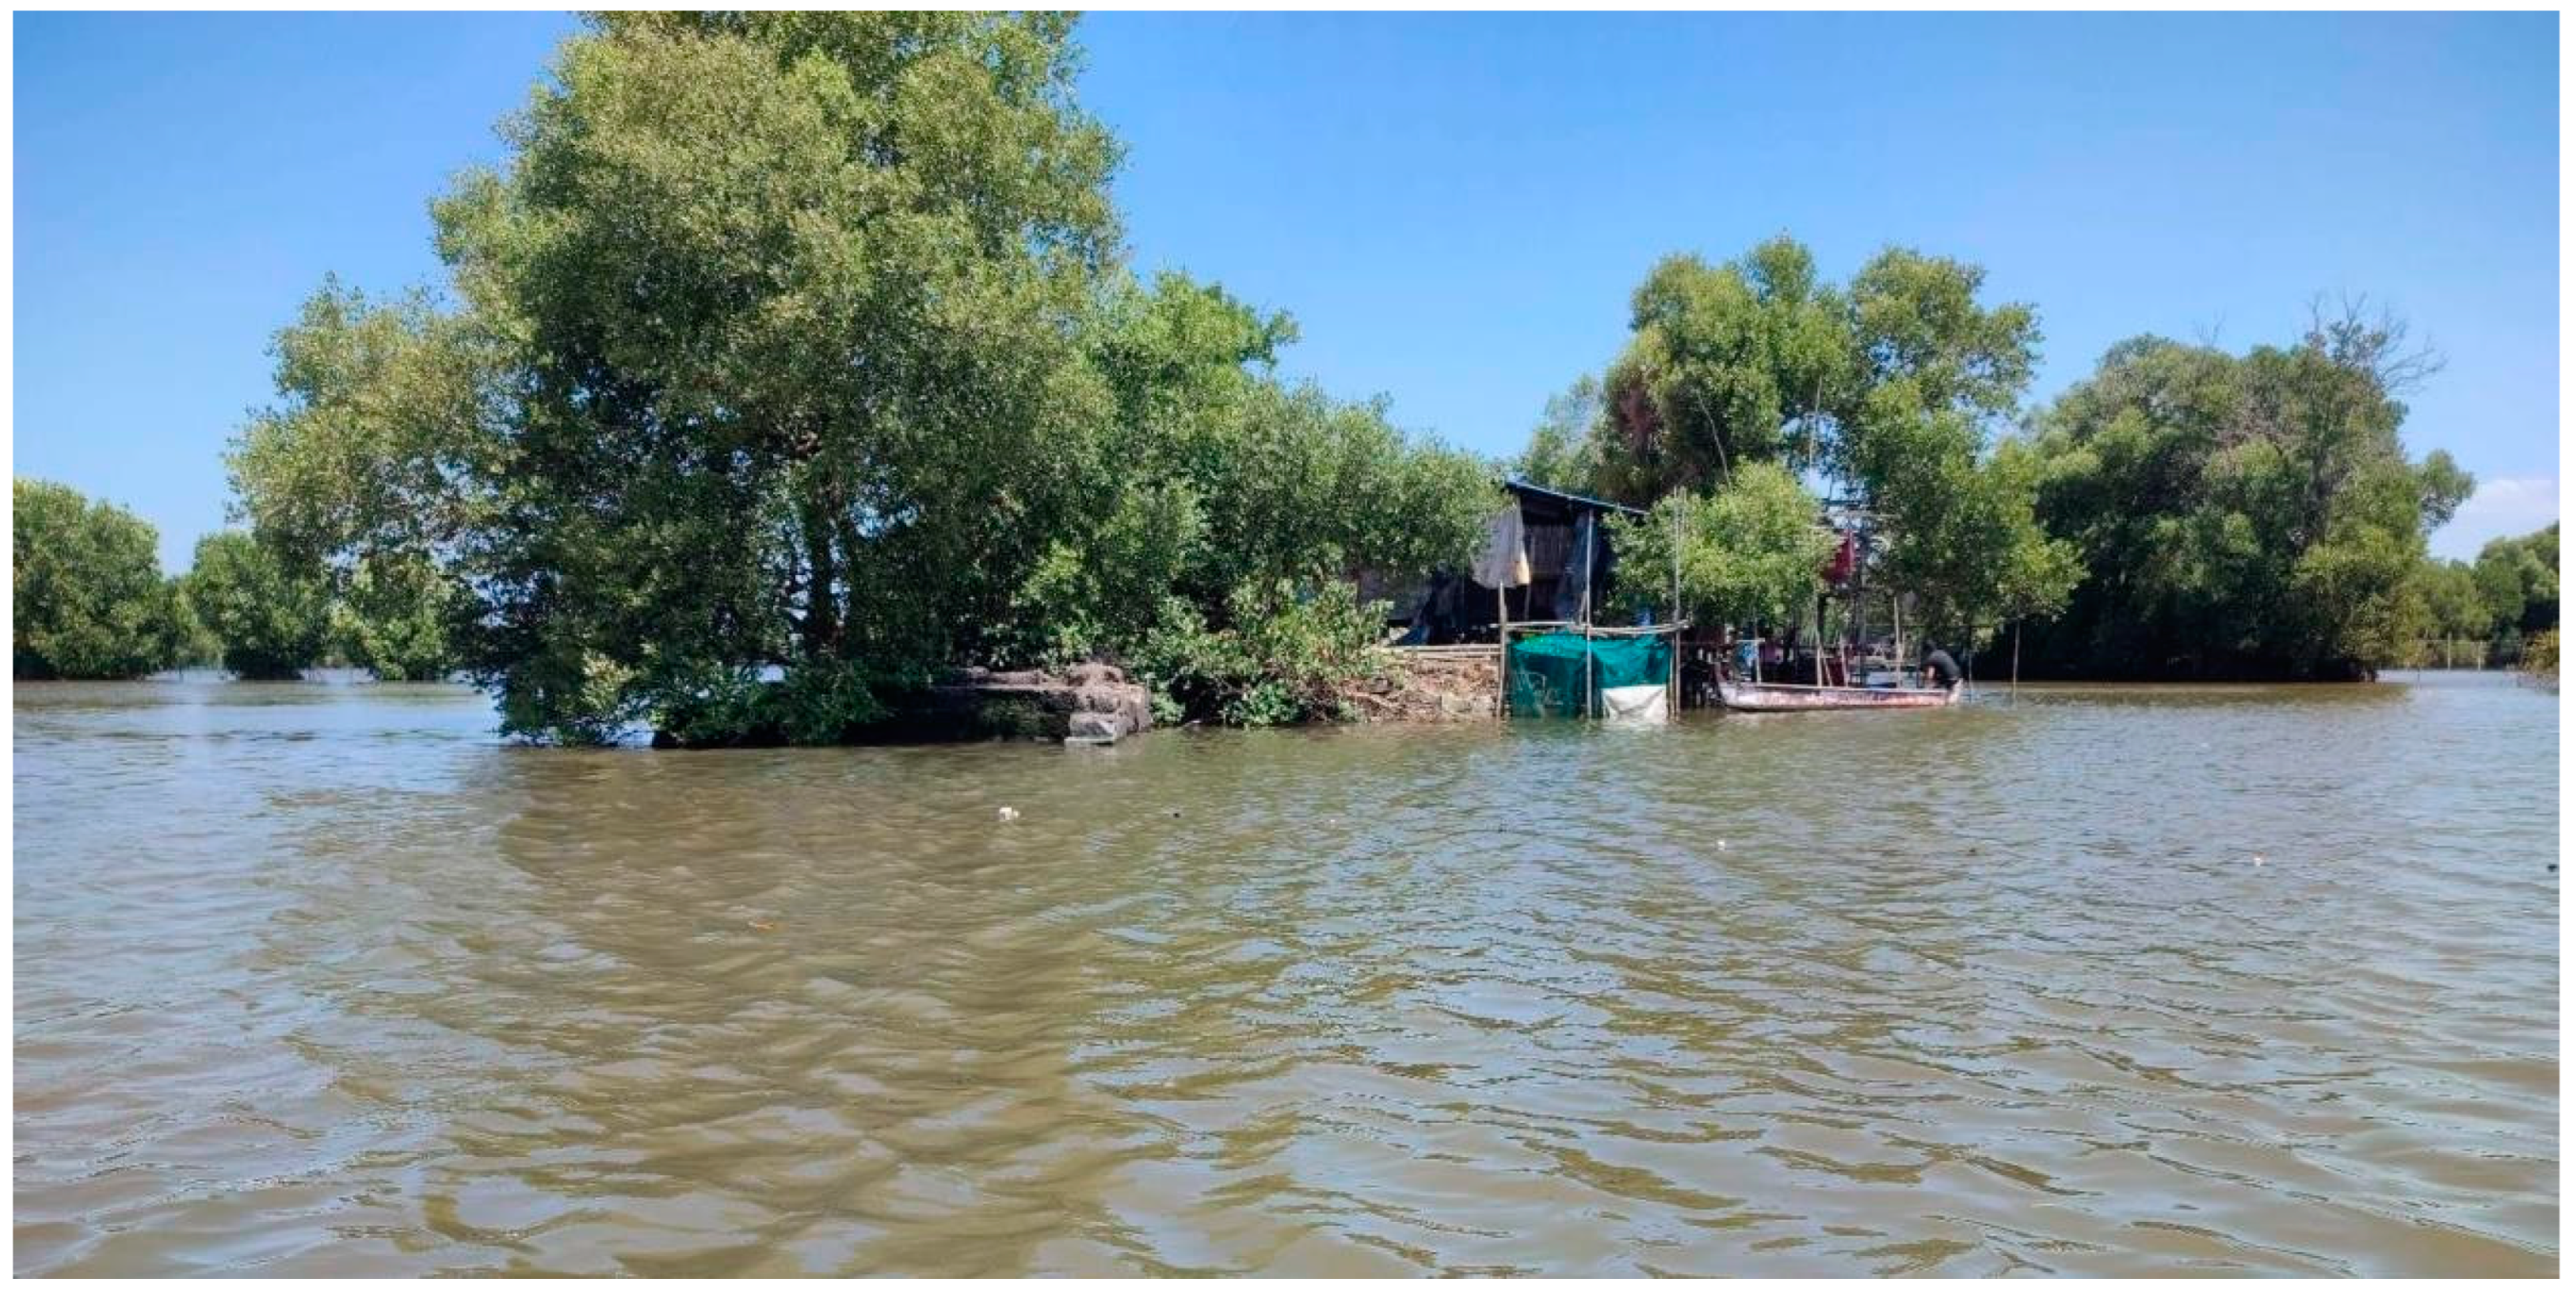
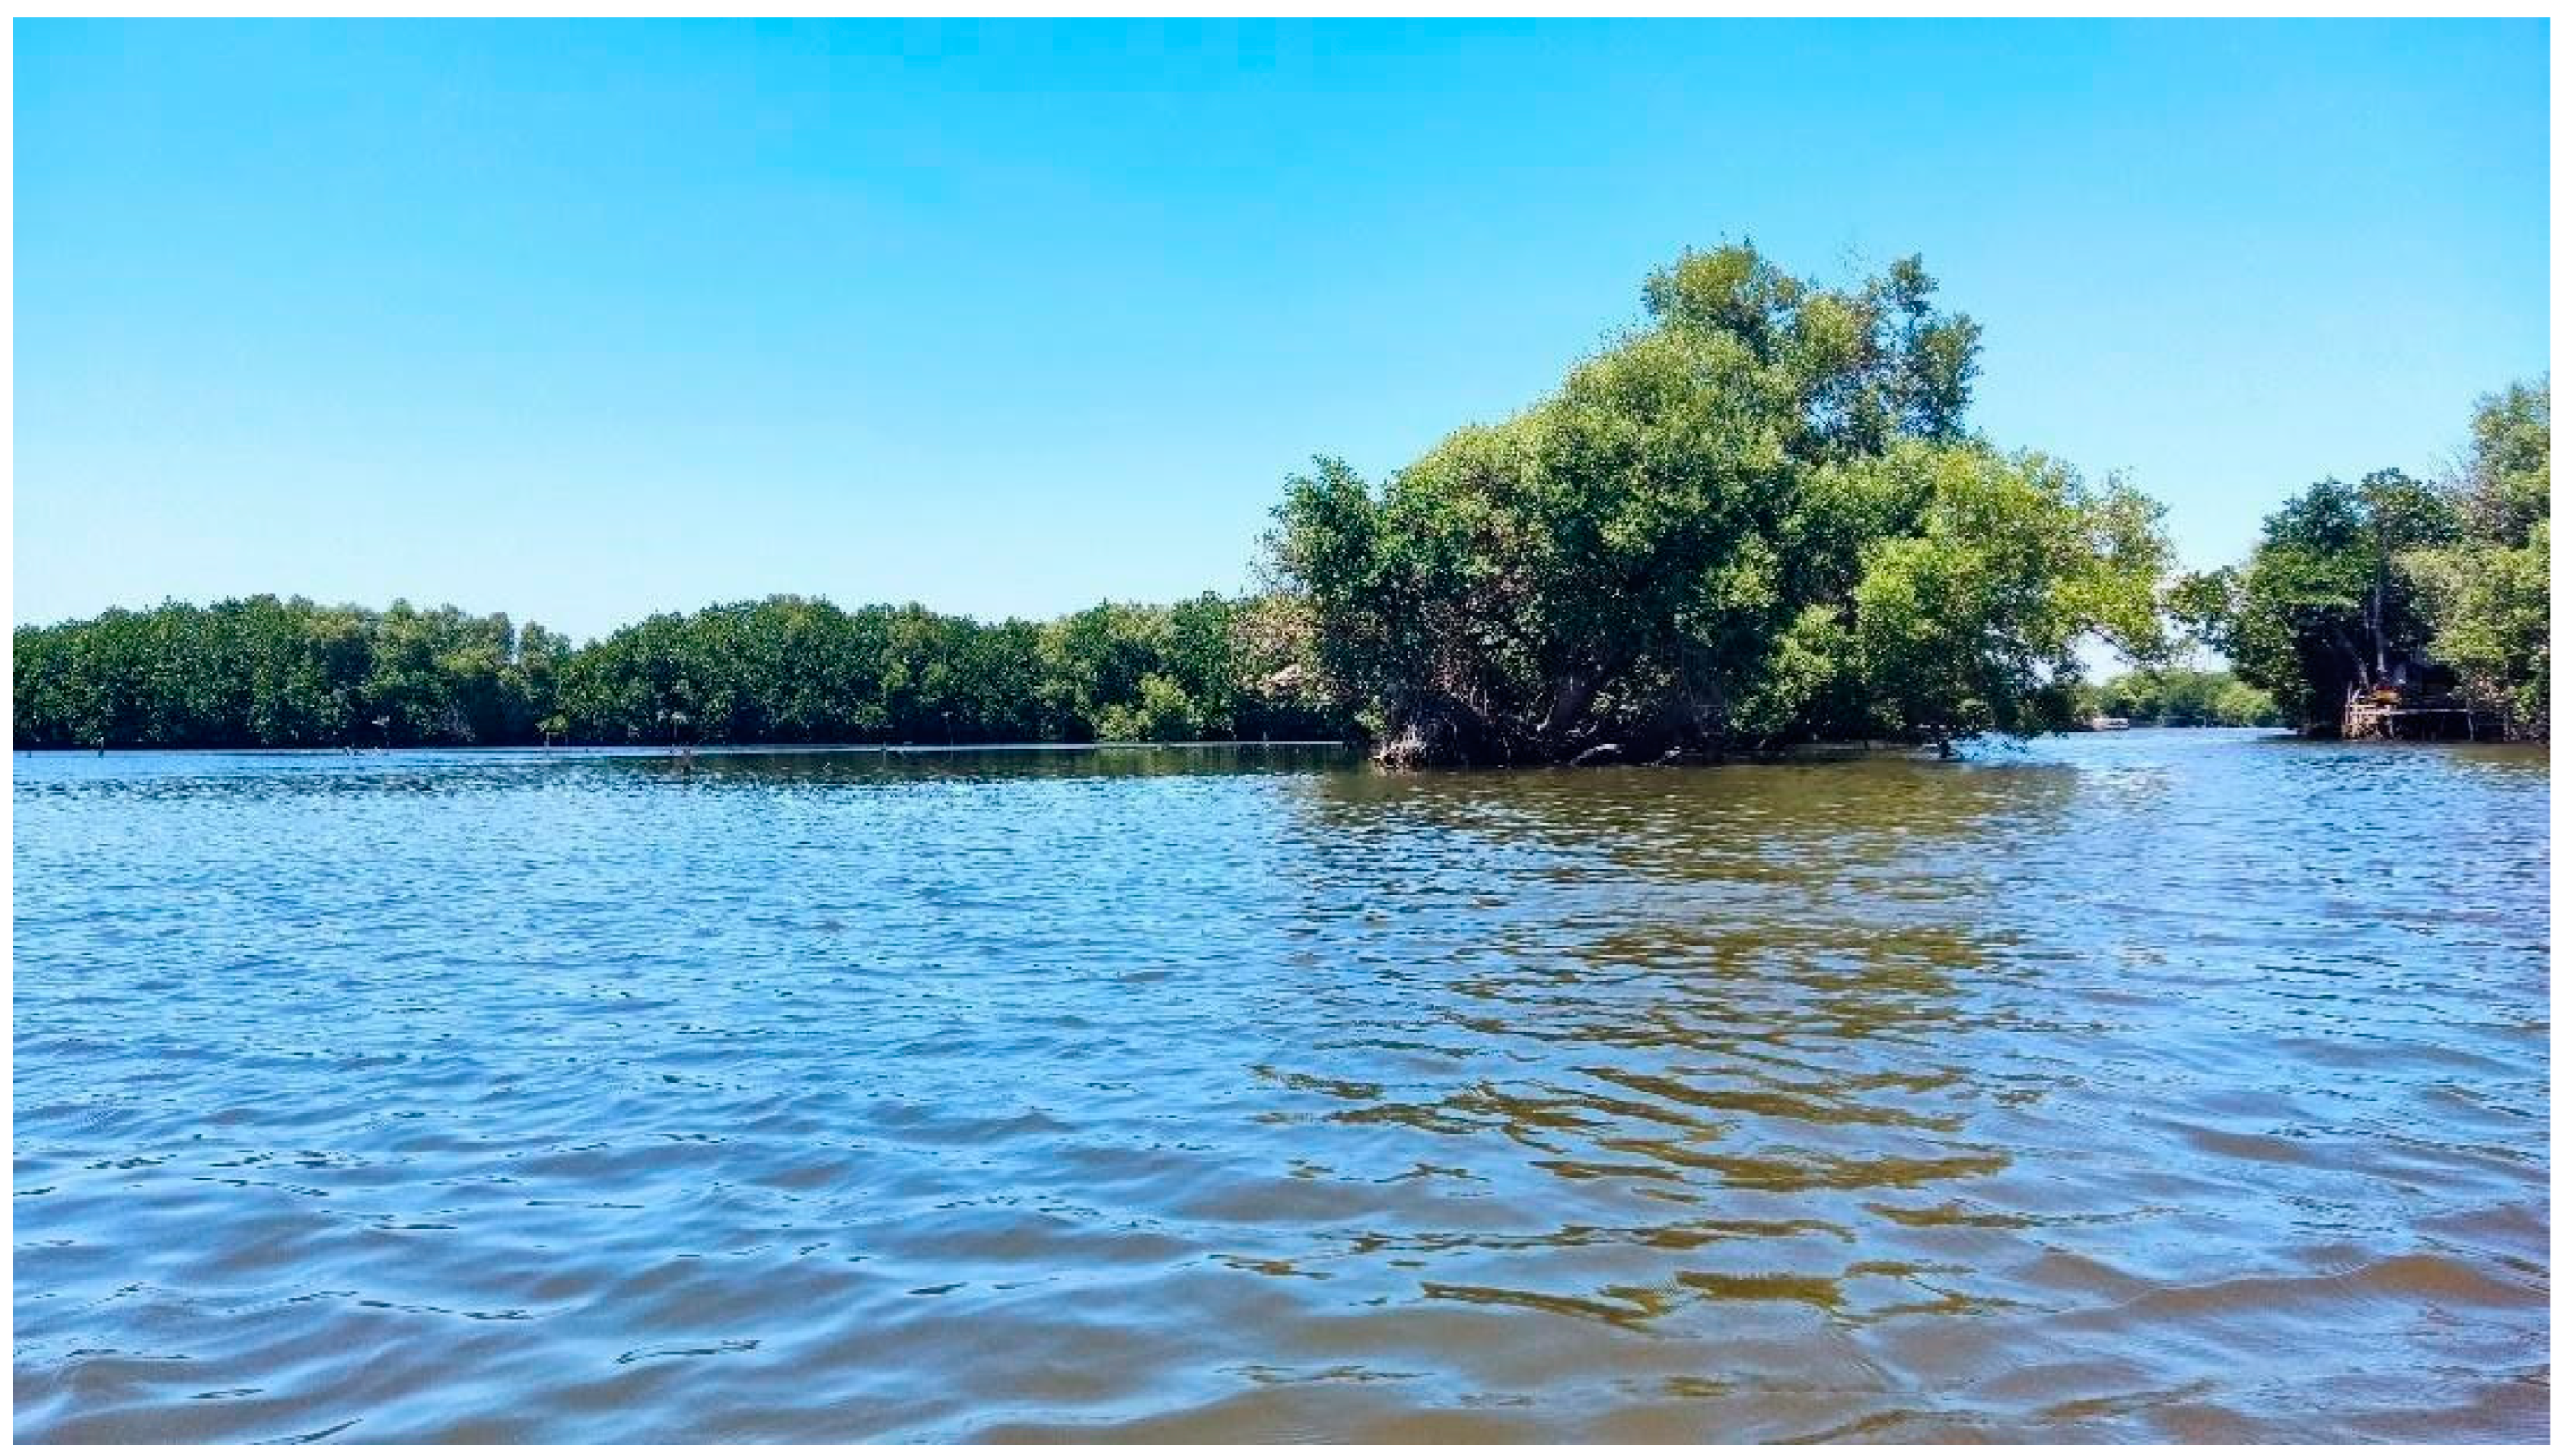
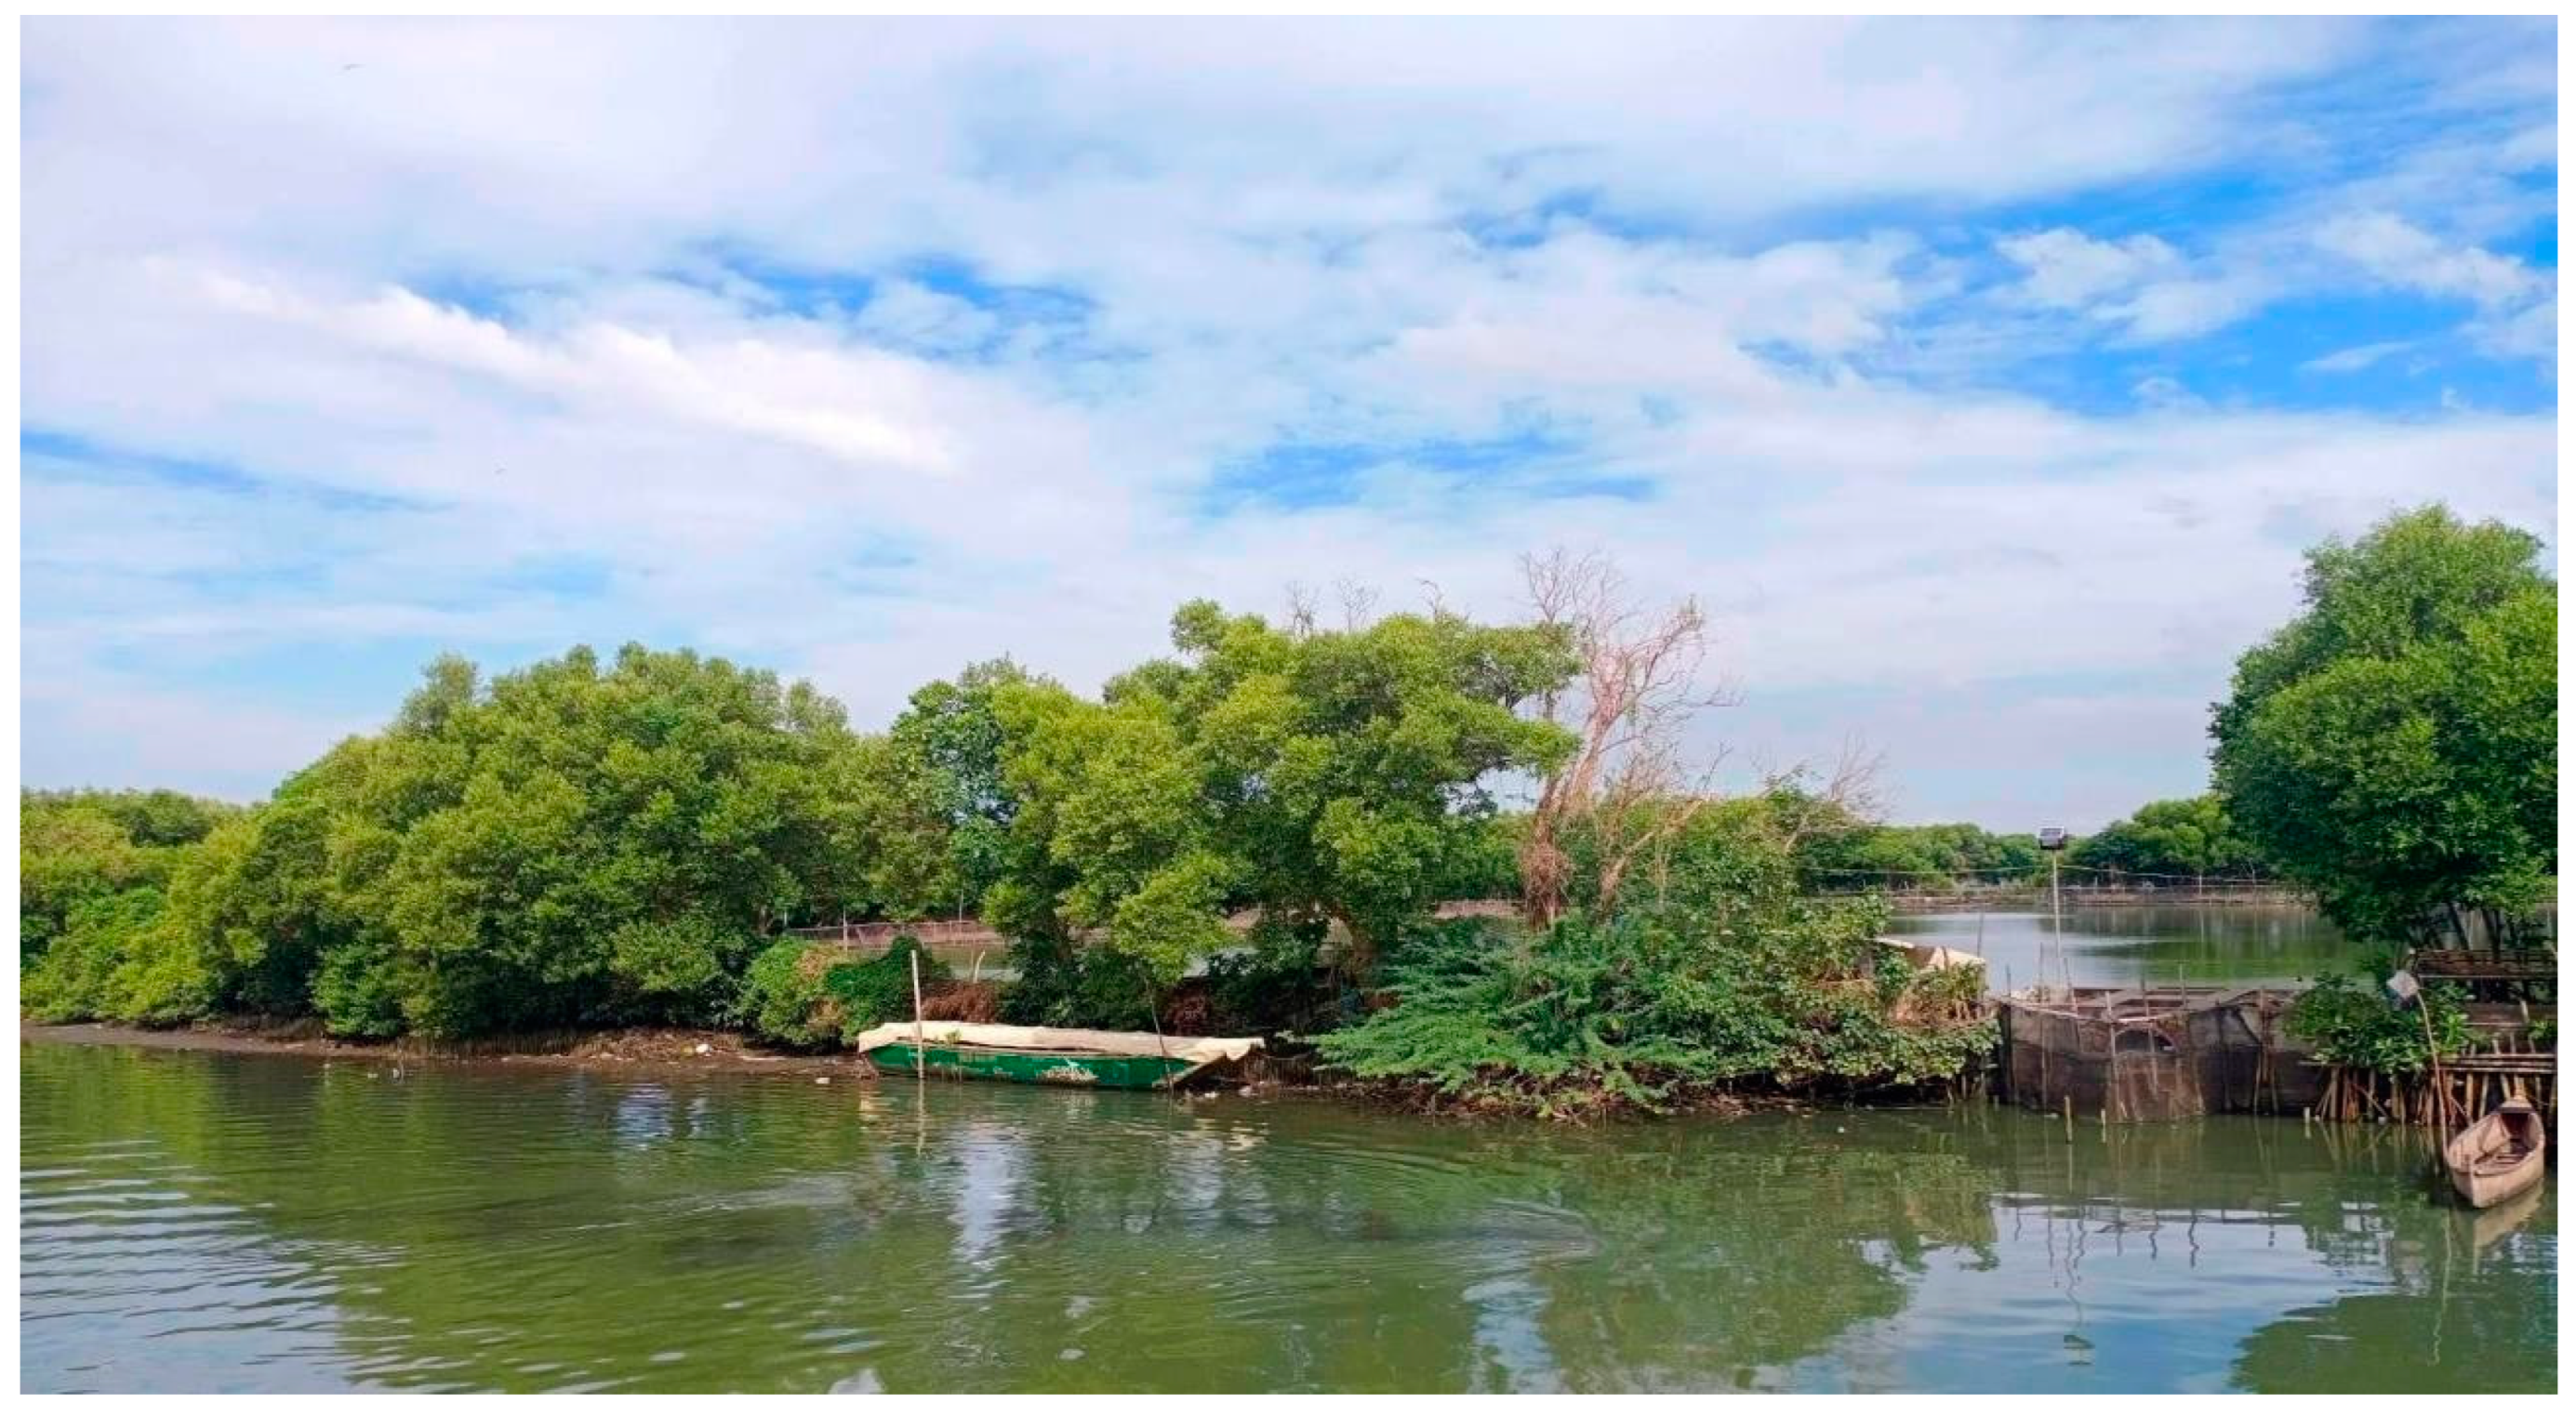
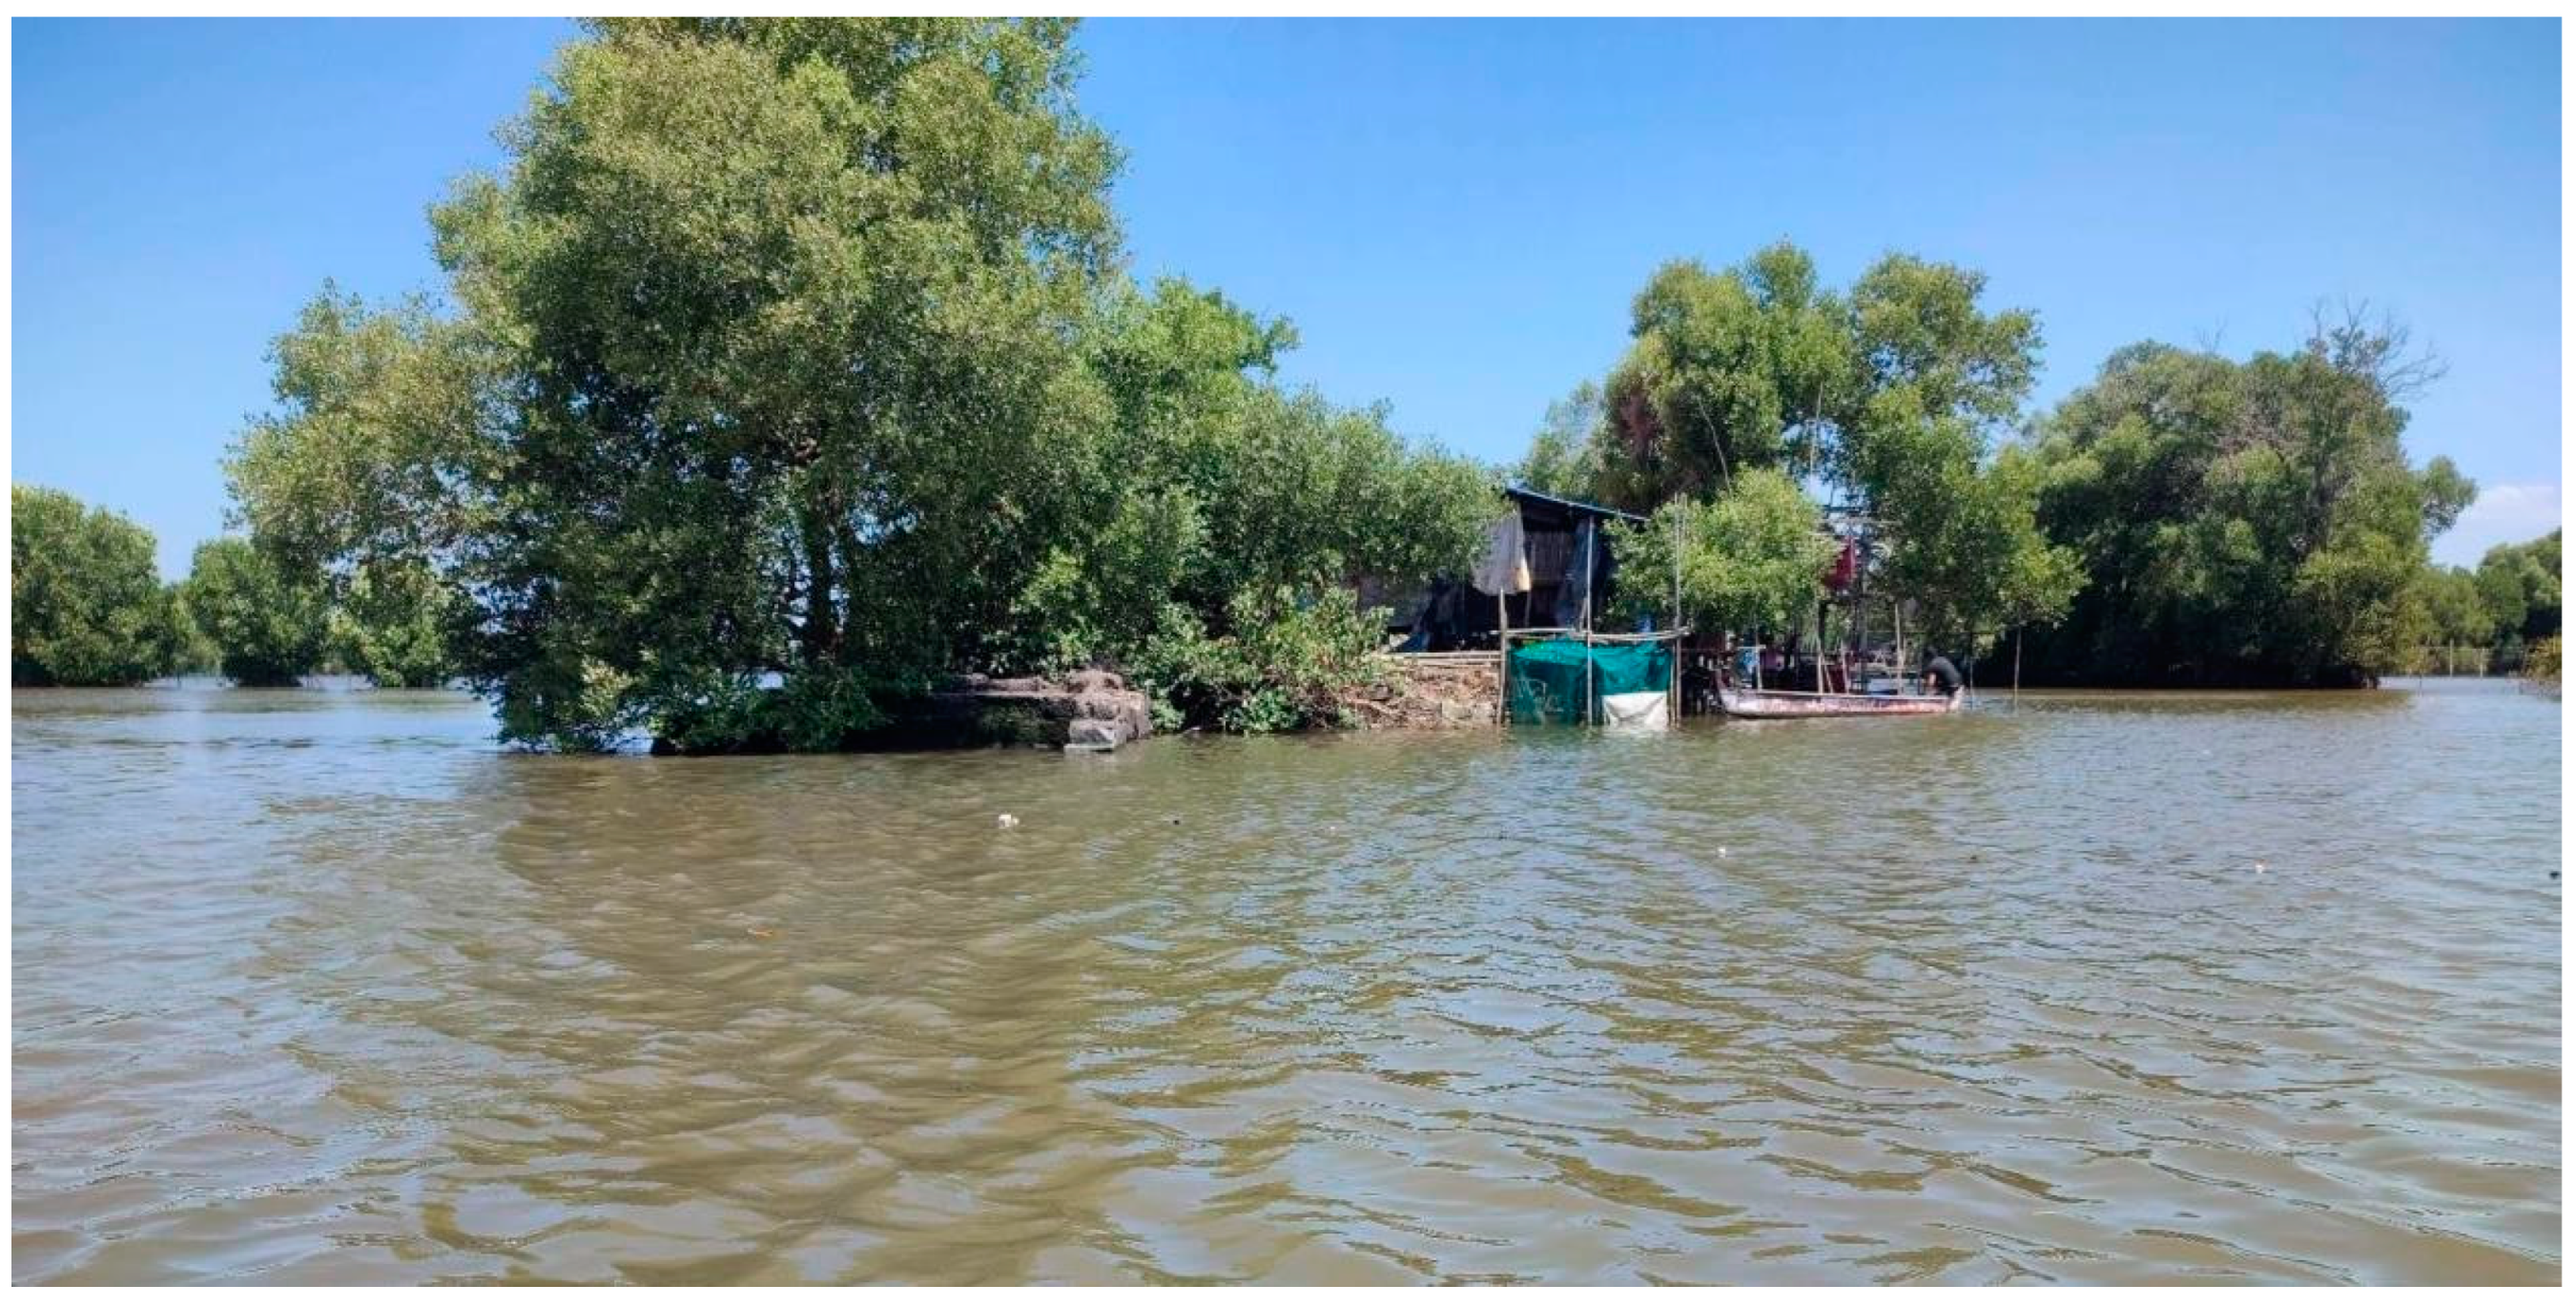
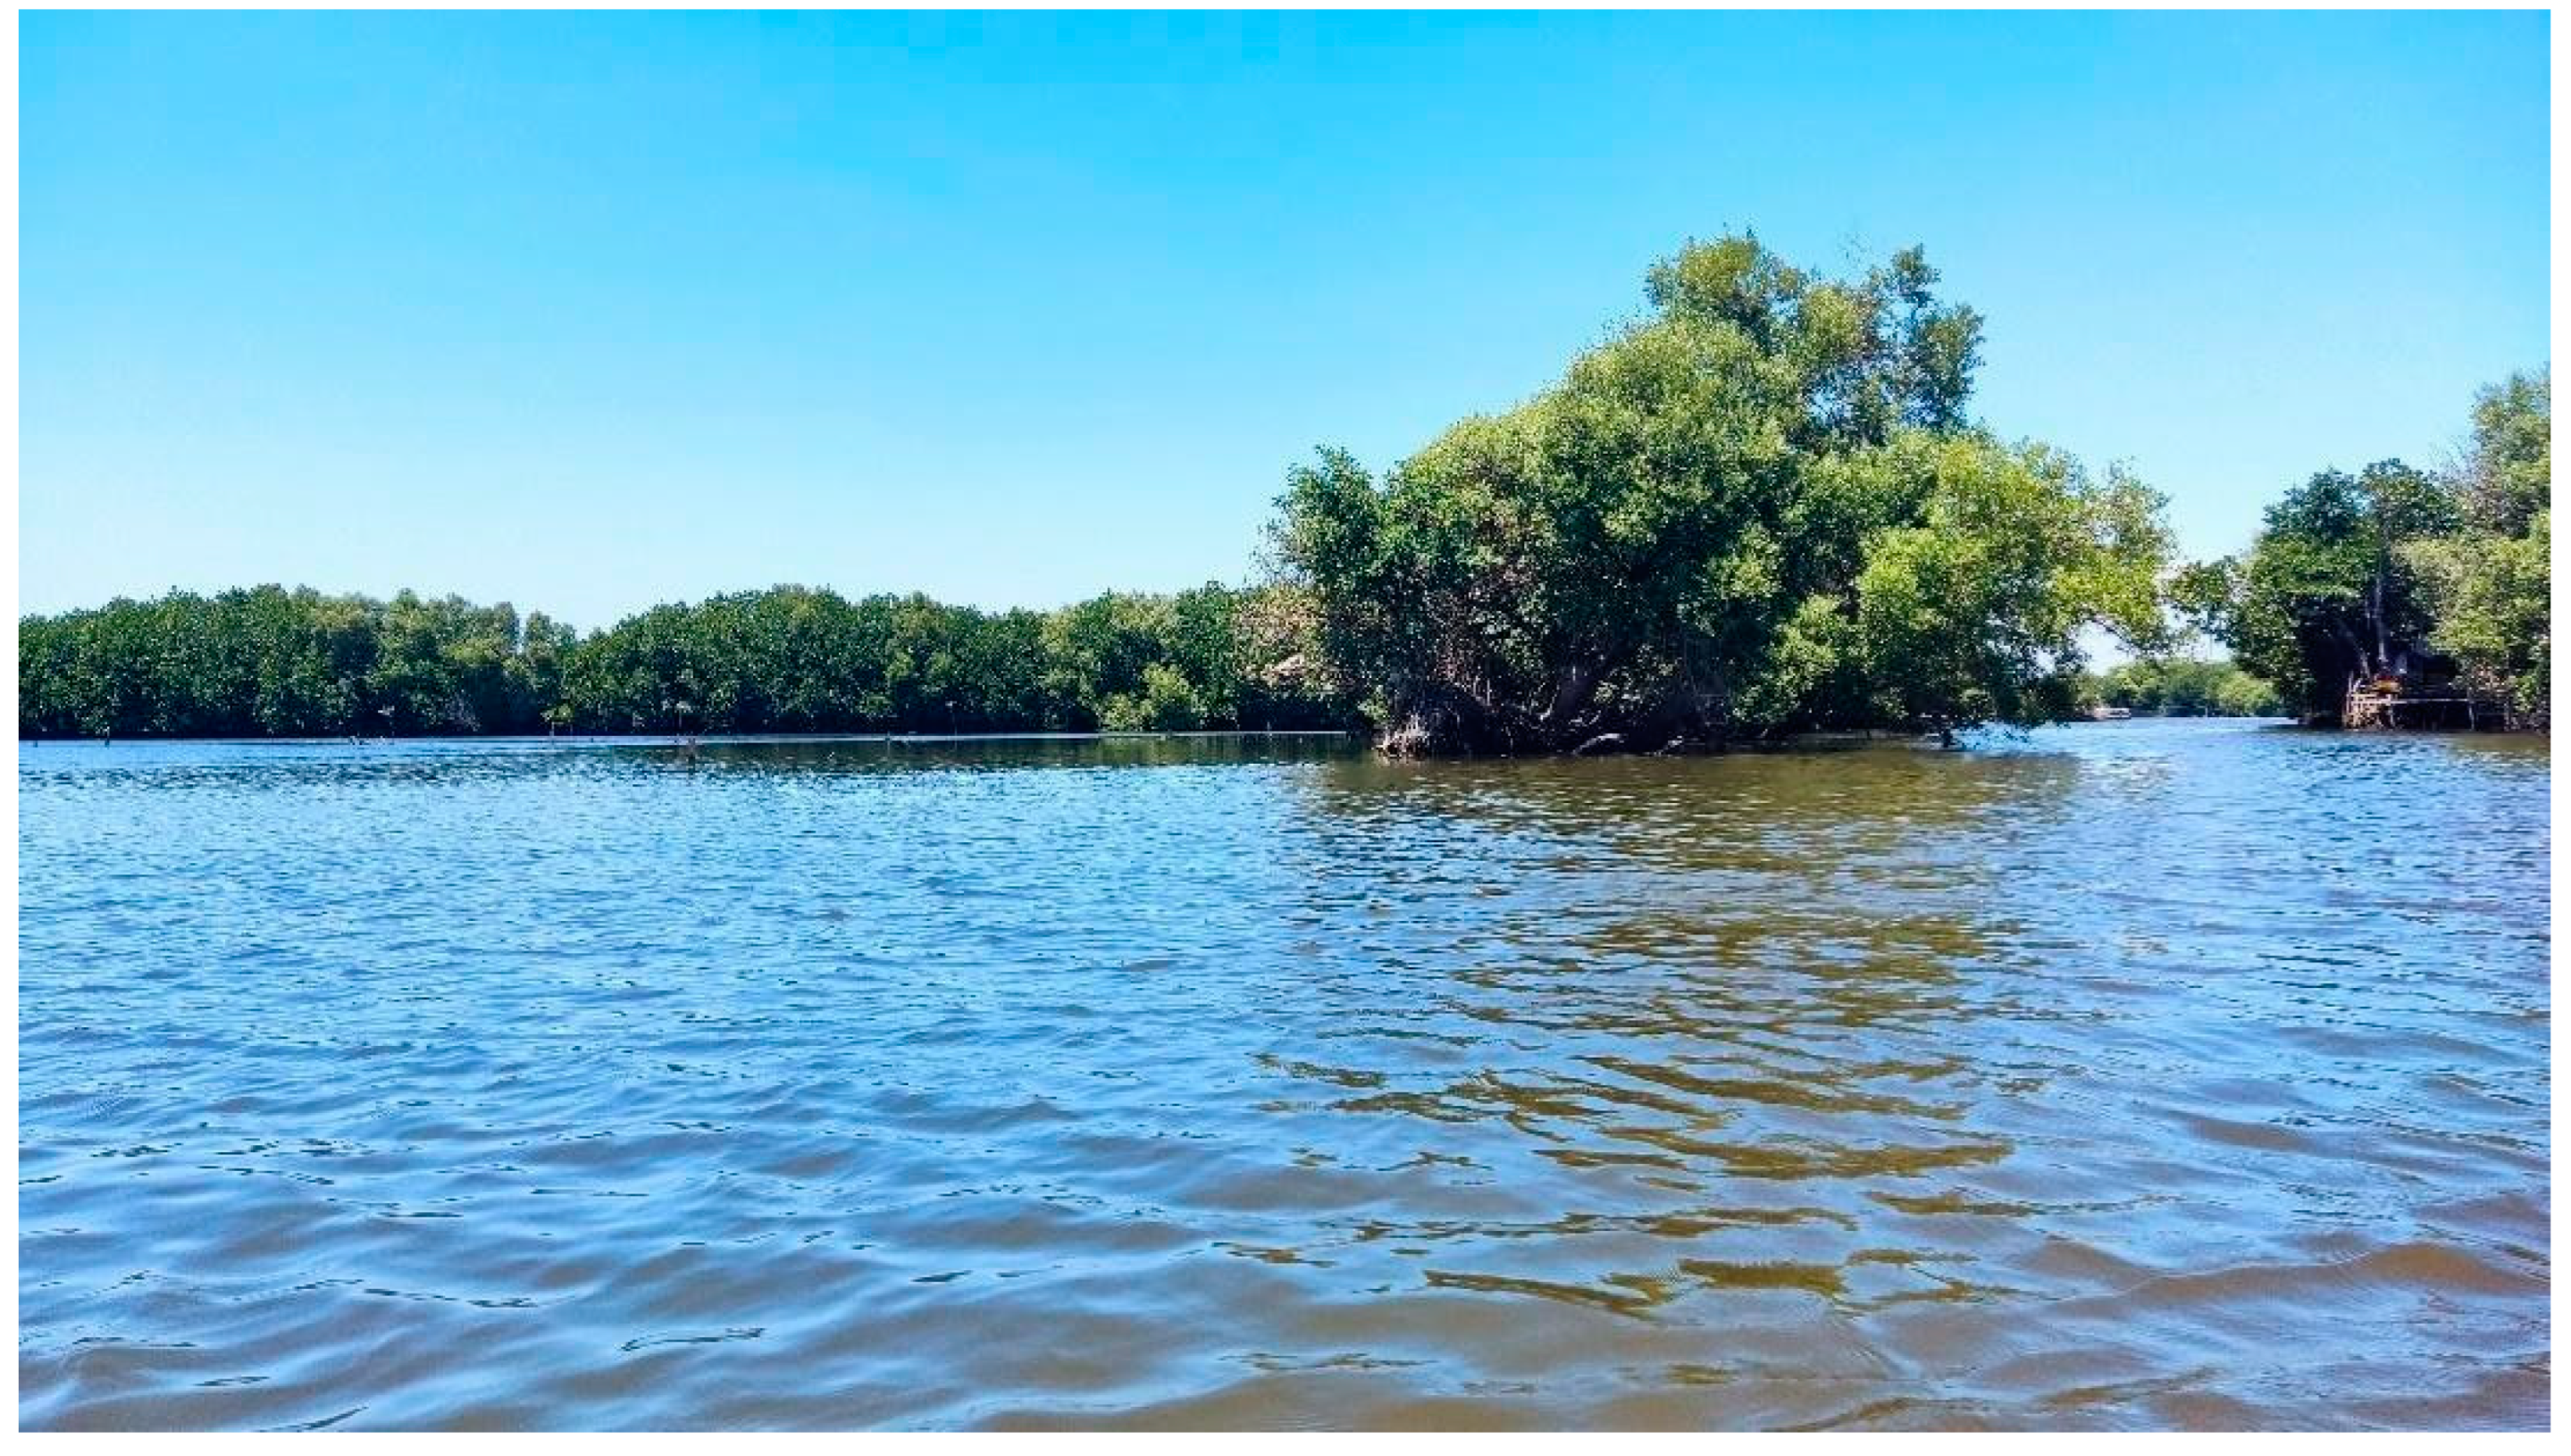
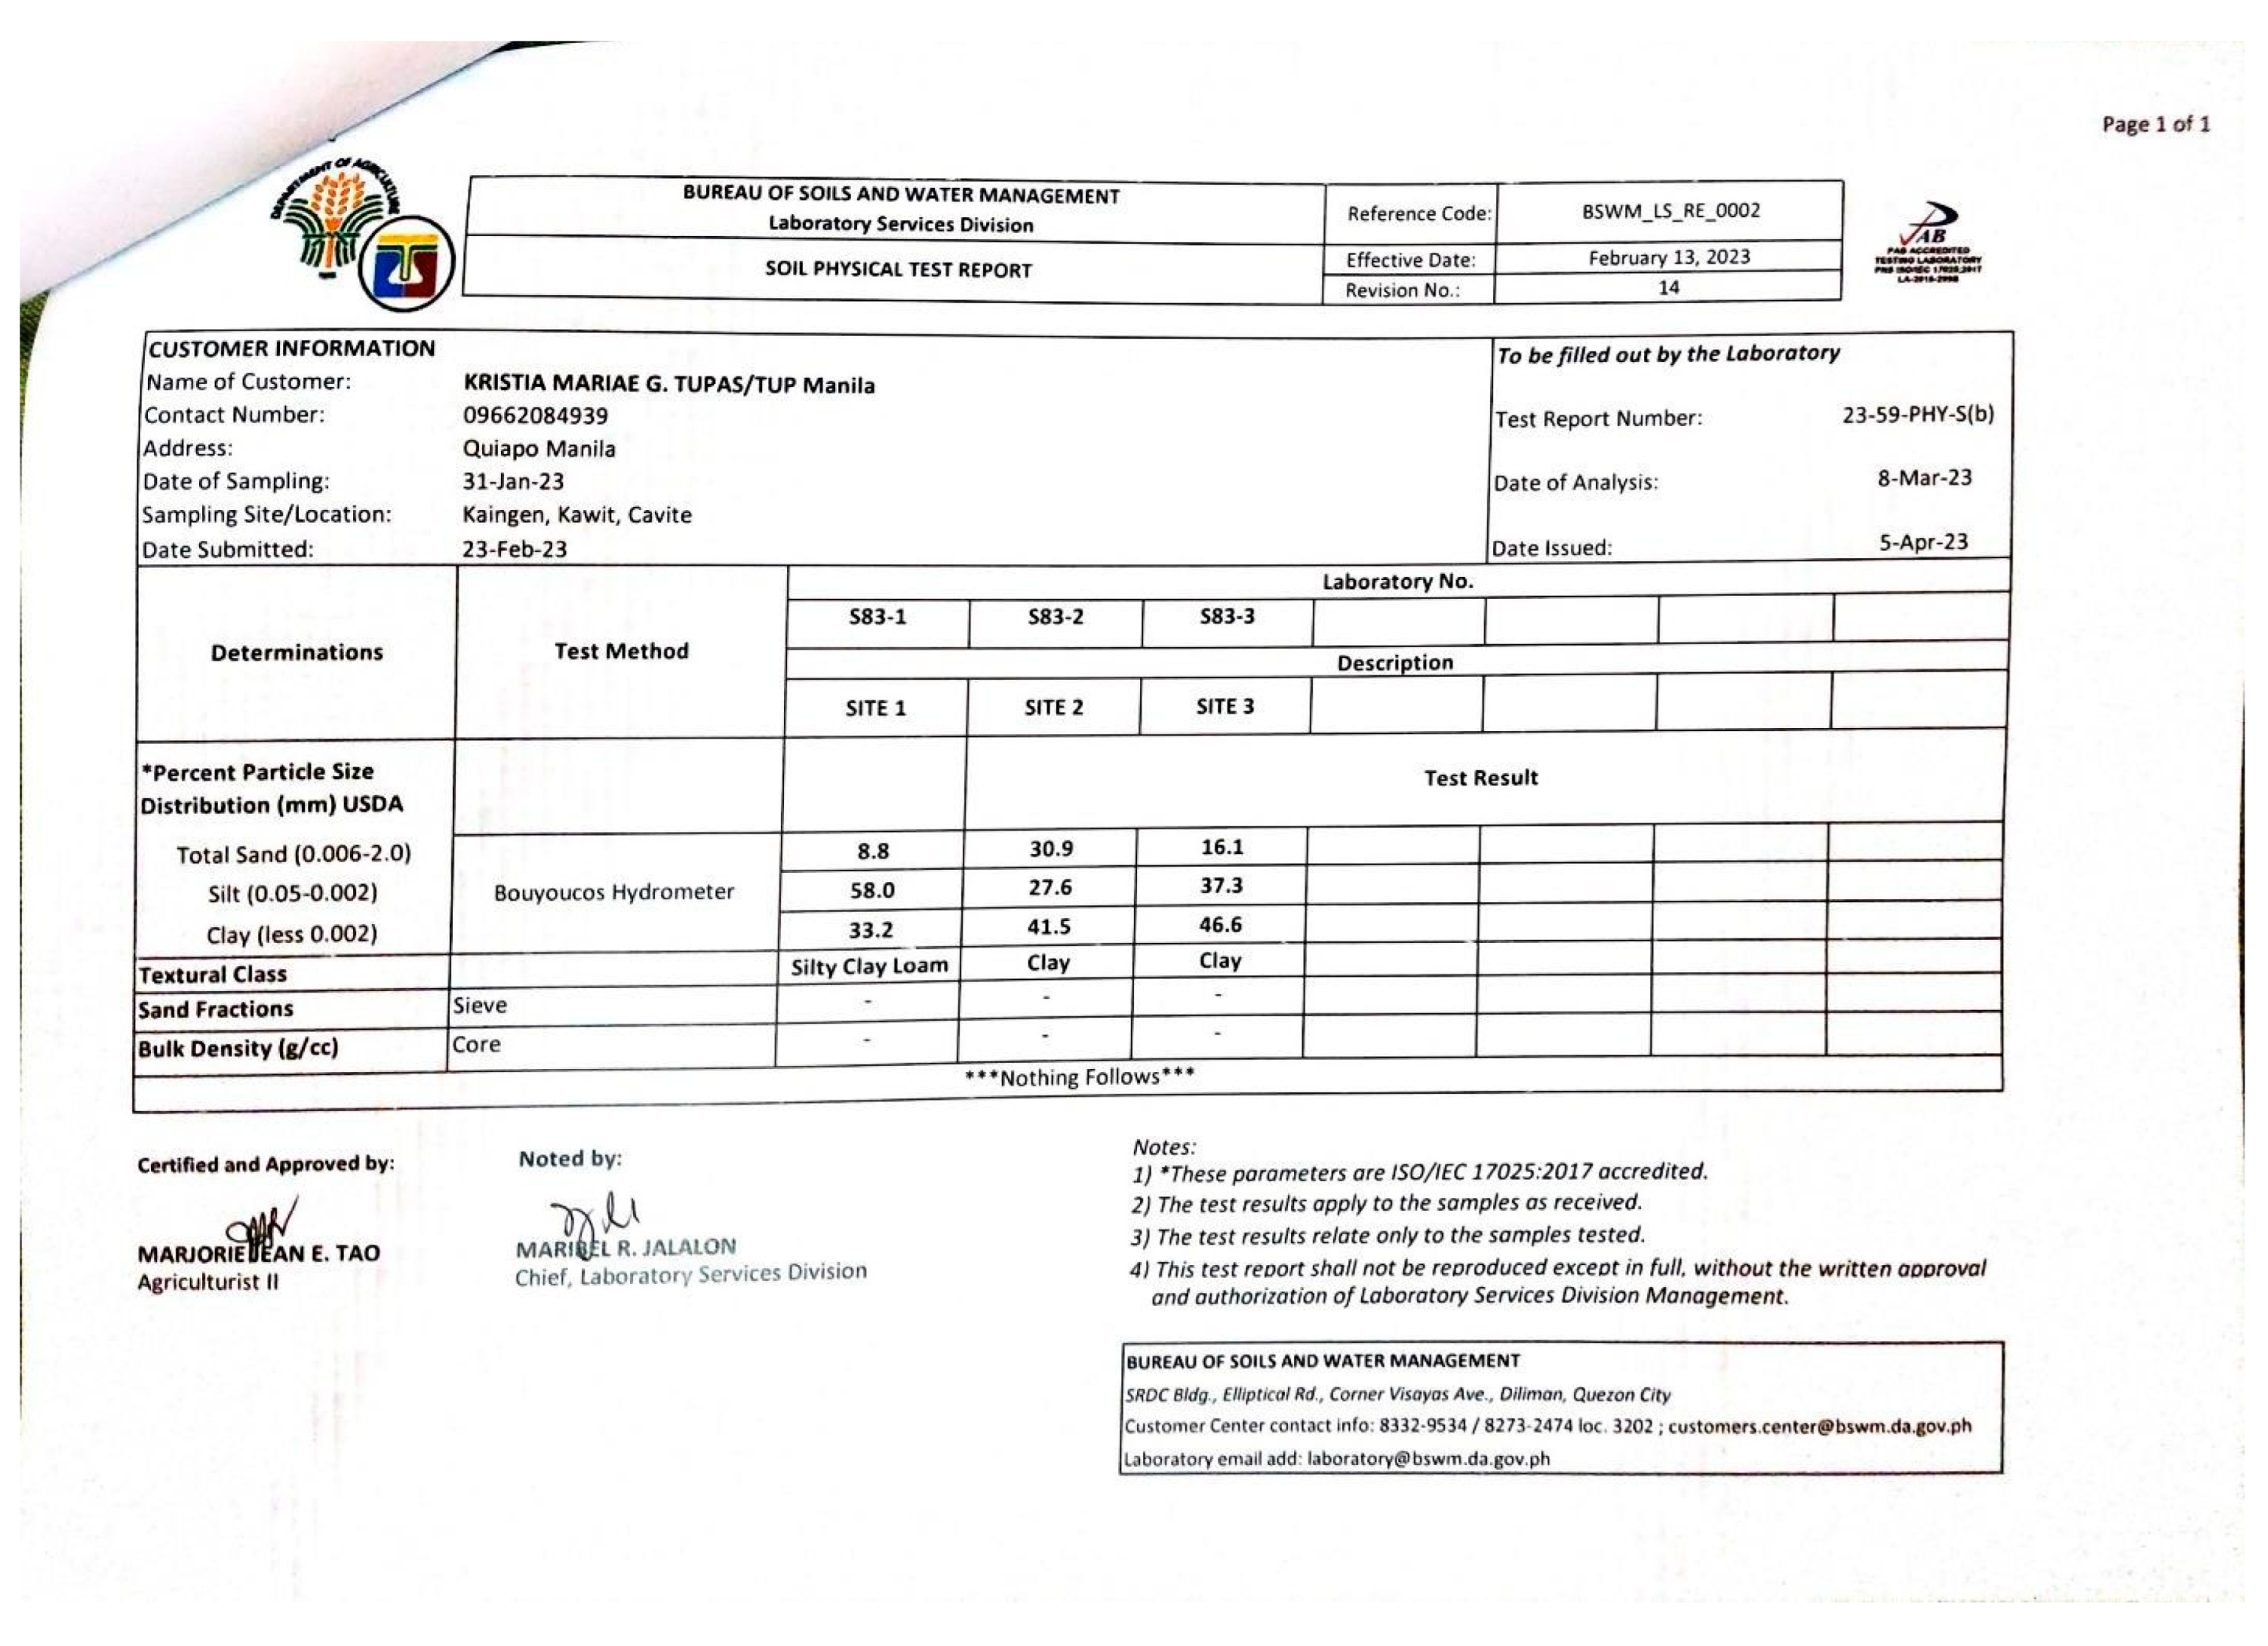
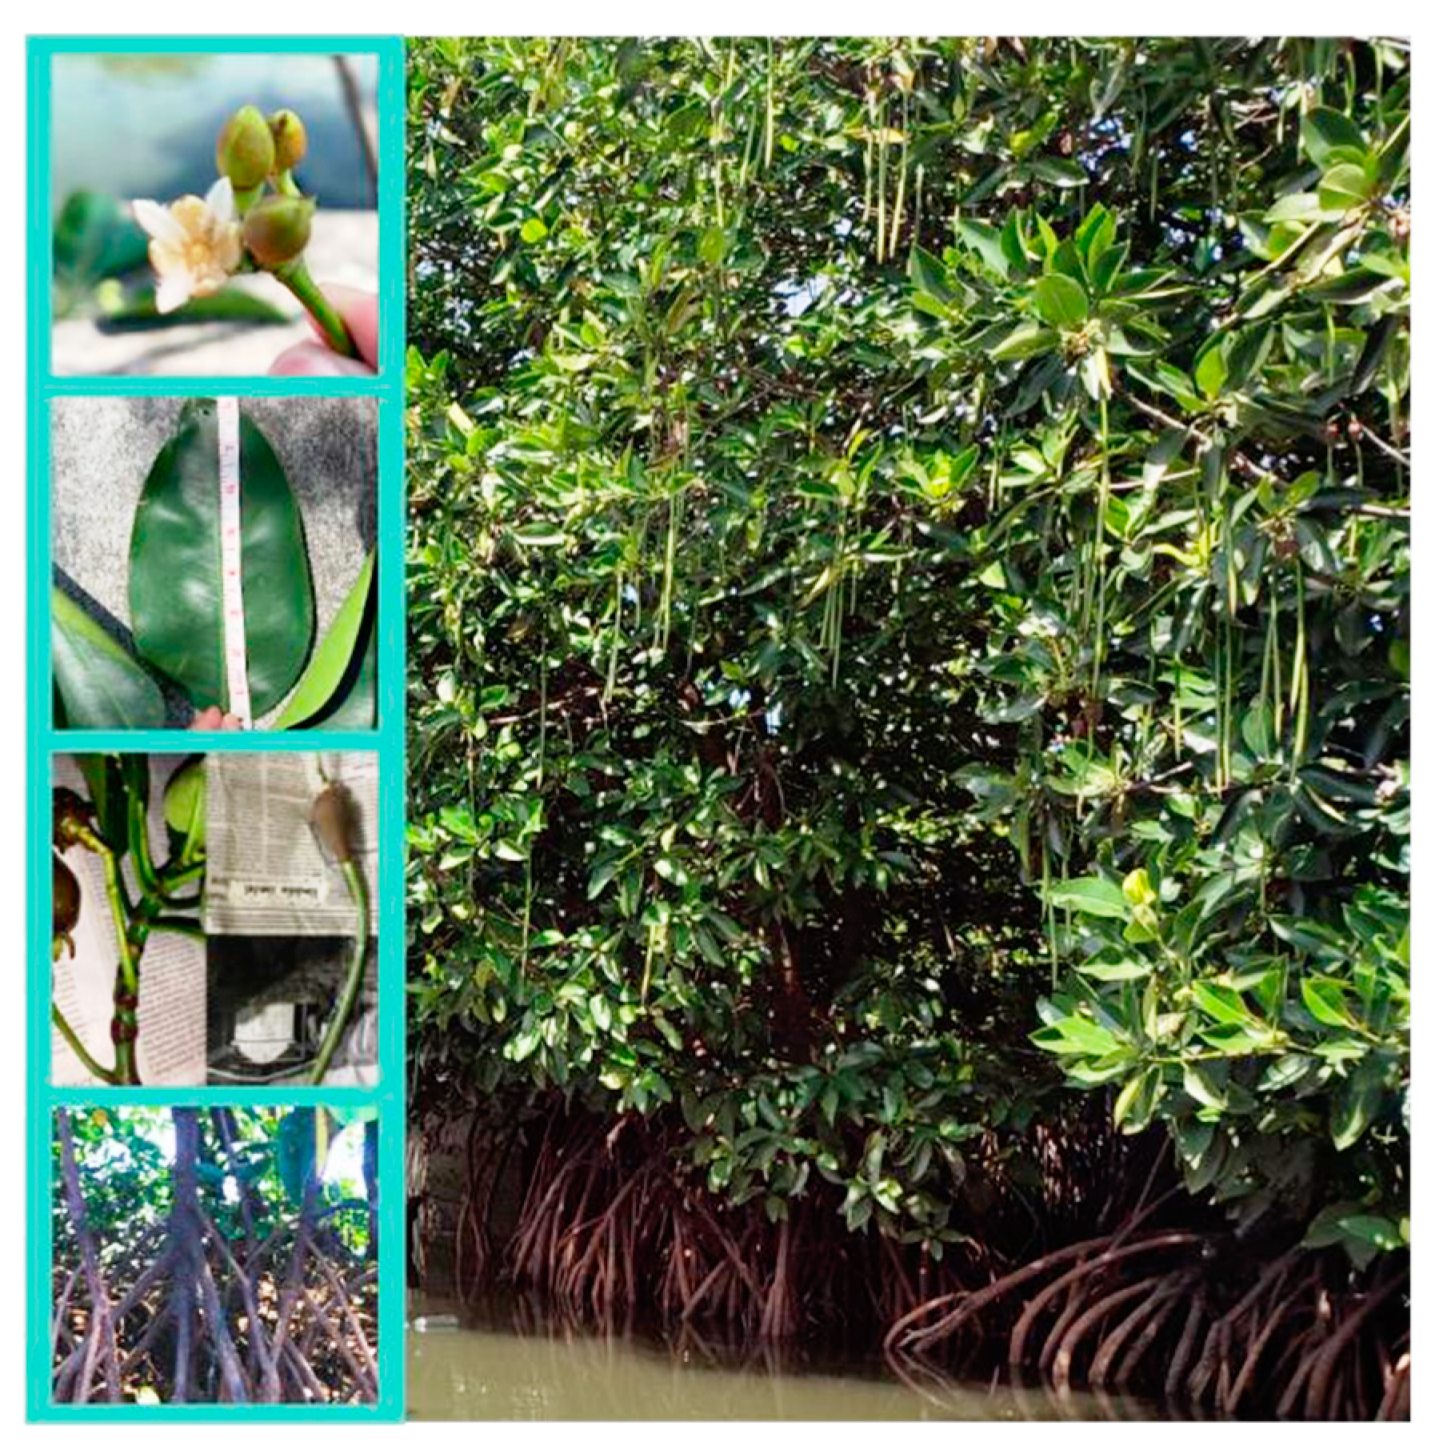
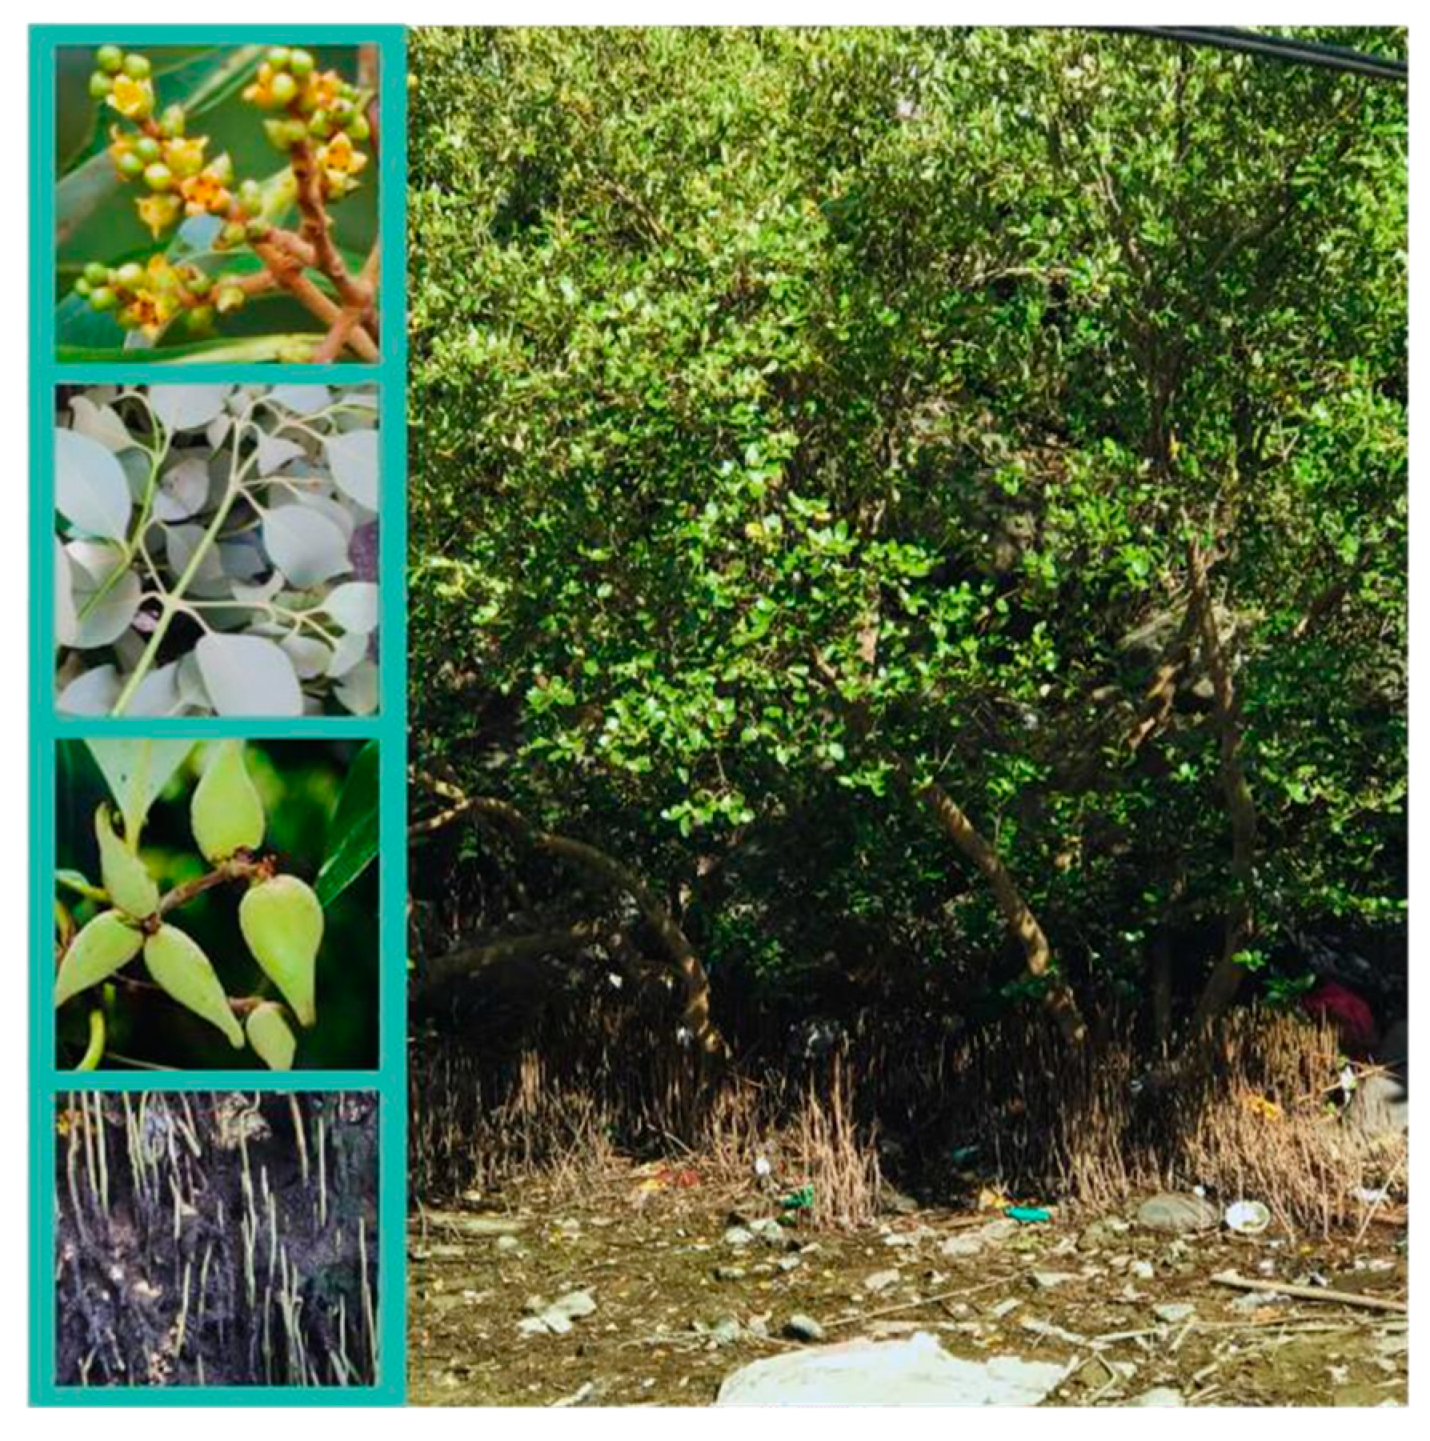
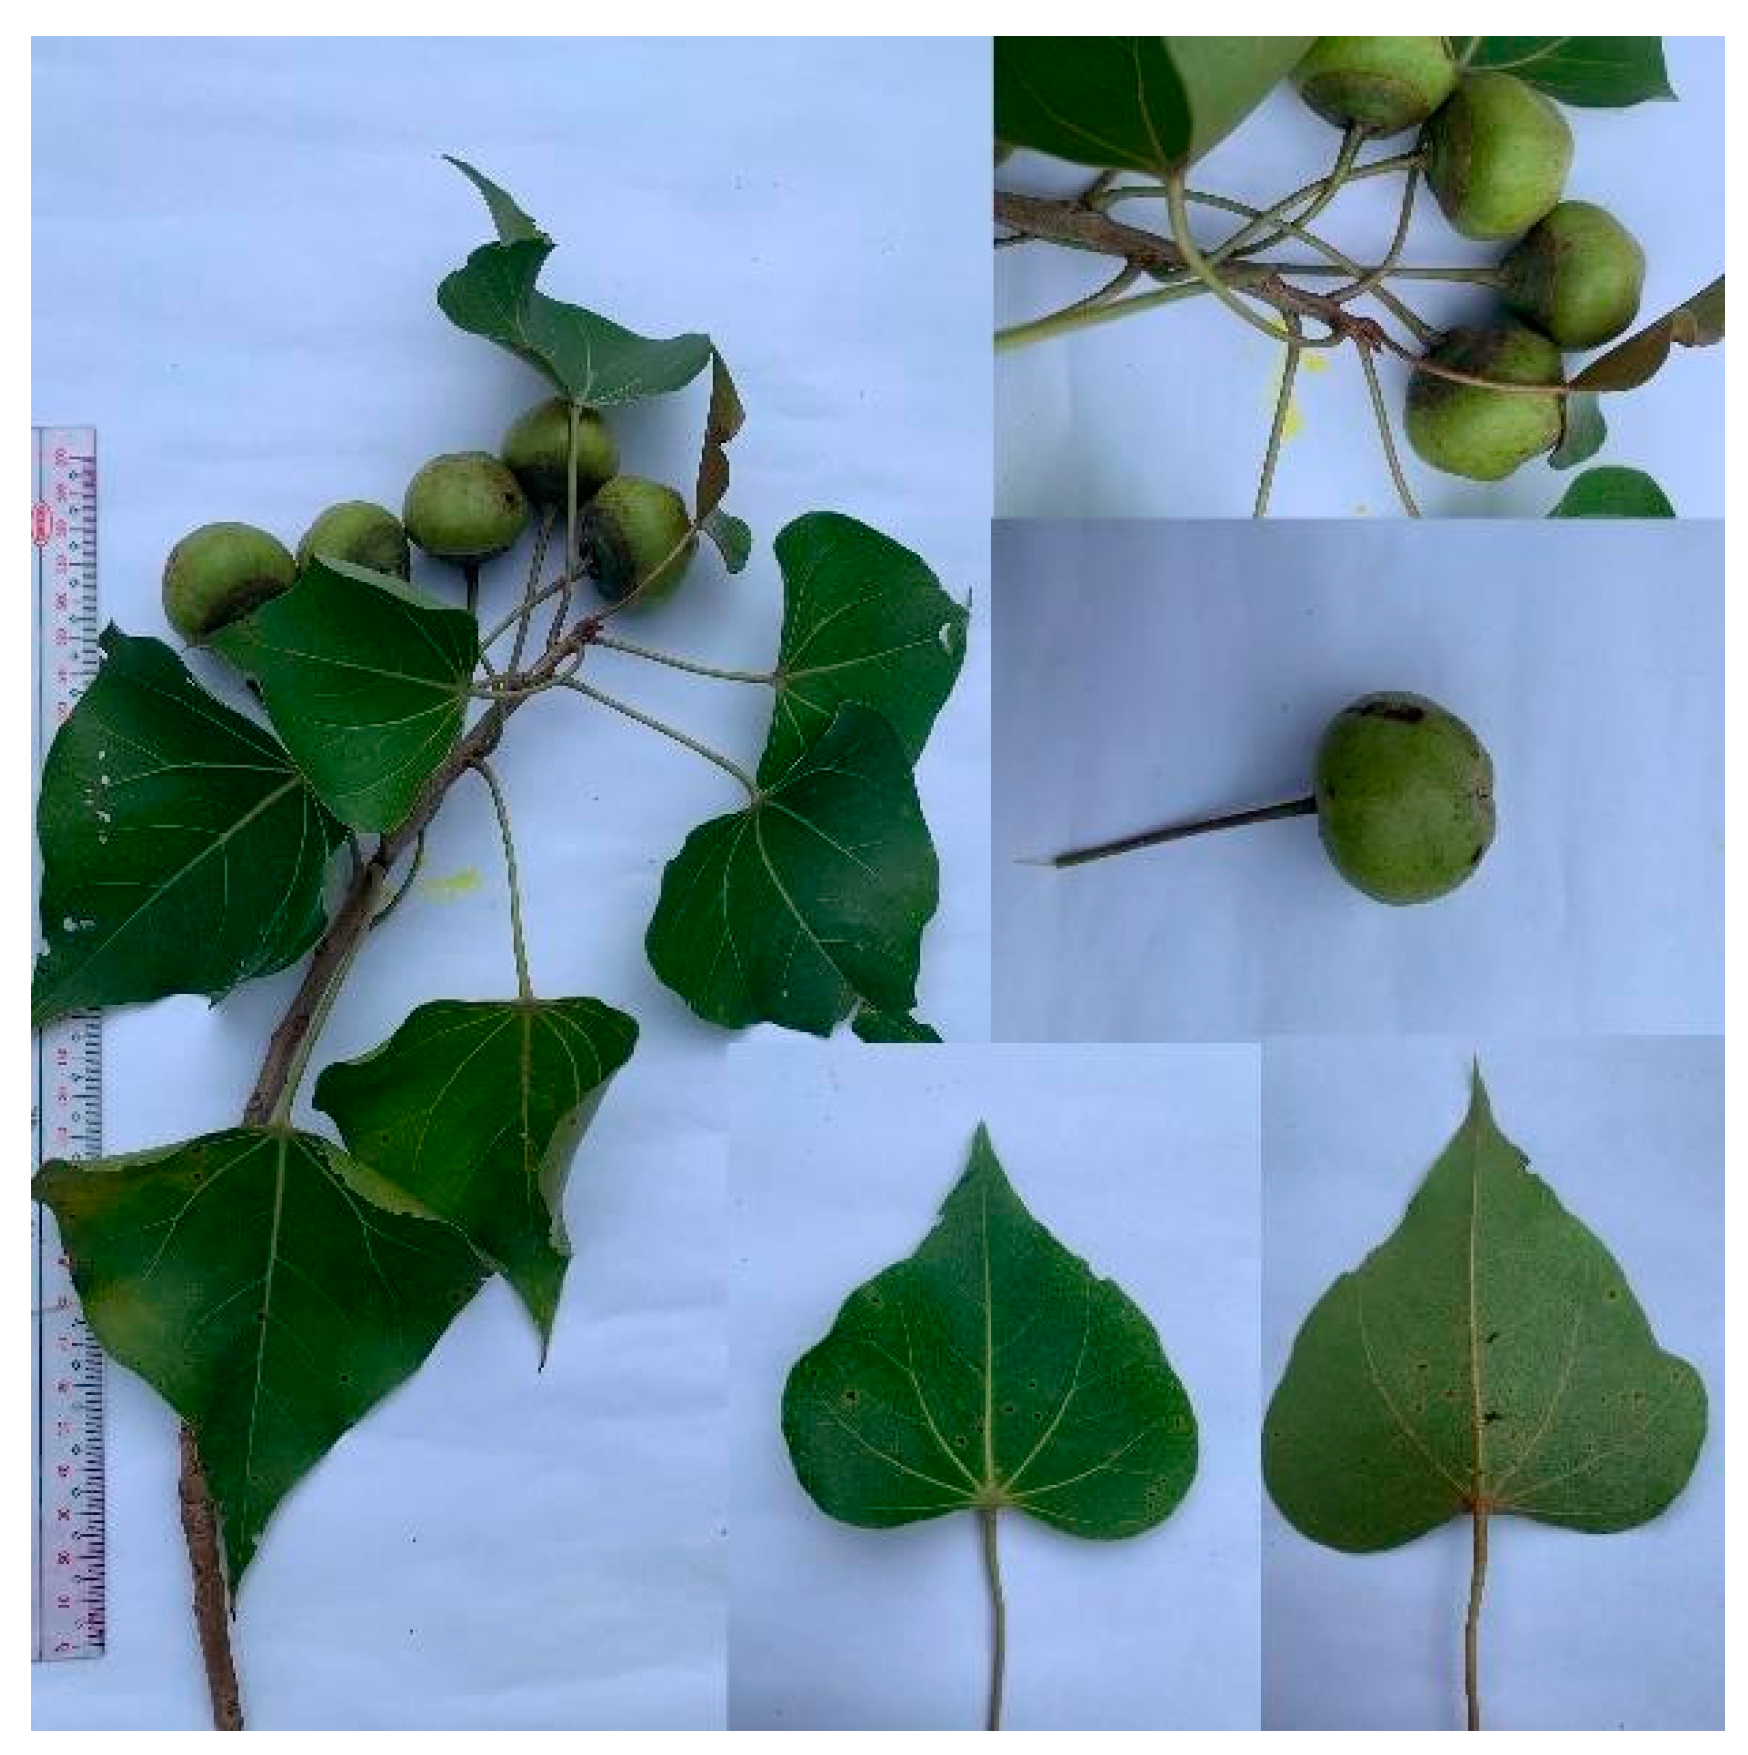
Kaingen is one of 23 barangays in the municipality of Kawit, in the province of Cavite, belonging to Region IV-A (CALABARZON), with an estimated elevation above the sea level of 7.5 meters (24.6 feet). According to the 2020 census, the population in the area was 1,723, which represents 1.60% of the municipality's total population. The researchers examined three sites within the mangrove community, measuring an area of 2,762 m2 for each site, using a 100-m field tape measure – Site 1 (14°26'55" N 120°54'26" E) is located near the aquaculture site of barangay Kaingen and residential area, Site 2 (14°27'16" N 120°54'32" E) is located near the aquaculture sites along Kaingen River, and Site 3 (14°27'21" N 120°54'33" E) is located next to Site 2 and end of Kaingen River.
Figure 1. Location map of Kaingen River in Kawit, Cavite, Philippines with the three (3) sampling sites.
Preprints 81428 g001
Figure 2. Sampling Site 1 is located near the aquaculture site of barangay Kaingen and the residential area.
Preprints 81428 g002
Figure 3. Sampling Site 2 is located in between the aquaculture sites along the Kaingen River.
Preprints 81428 g003
Figure 4. Sampling Site 3 is located next to Sampling Site 2 and end of the Kaingen River.
Preprints 81428 g004

2.2. Mangrove Ecosystem

Mangroves are considered taxonomically diverse and salt-tolerant species. They grow in transition or intertidal zones, a part of the ocean where it meets the land, and on the fringing tropical and subtropical coastlines. Mangroves are known for their relationships within terrestrial and marine habitats due to their physical, biochemical, and biological interactions in the environment. They serve as a breeding ground, shelter, and feeding habitat for various aquatic animals (Primavera et al., 2018). Mangroves are distinguishable from other plant species due to their ability to withstand changes in salinity and allow oxygen exchange in sediments (Feller, 2018). Furthermore, mangroves have two categories: true and associate mangroves (Pototan et al., 2020).
In the Philippines, there are 42 mangrove species representing 18 families with a rich number of true mangrove species (Abino et al., 2013). In the study by Thomas et al. (2017), Southeast Asia accounted for the most mangrove deforestation per year between 2000 and 2012. The mangrove diversity's pronounced loss was due to the conversion of aquaculture (30%) and rice agriculture (22%) (Primavera et al., 2018).
Garcia et al. (2014) found that, quantitatively and qualitatively, the Philippines possess a high level of biodiversity. Due to its remote location, varied ecosystems, and high endemism rates, it is considered one of the seventeen countries with "mega biodiversity." Out of roughly 65 species of mangroves in the world, at least half can be found in the Philippines. However, the country is gradually losing its rich biodiversity resources, including mangroves, because of anthropogenic and natural disturbances.

2.3. Carbon Sequestration

Carbon sequestration is a process done by aquatic and terrestrial trees in capturing and storing CO2 in the atmosphere. Among different forests, mangroves comprised most of the carbon-rich ecosystems due to their ability to store five times more carbon per unit area, as Ahmed et al. (2022) studied. Quantifying the potential storage sequestered by the mangrove ecosystem is crucial, especially in reducing the effects of climate change, as supported by Nesperos et al. (2021).
Mangrove forests rapidly lost the carbon stored in their tree biomass due to cutting, human consumption, decomposing, and carbon export to neighboring ecosystems. Alongi (2014) stated that most carbon sequestered for future use is underground. The quadrat technique is a non-destructive method used to determine a mangrove tree's carbon sequestration at a specific sampling location. Species were determined, and baseline measurements were taken, including height and the circumference of a tree's base. Komiyama's allometric equations were used to determine a tree's aboveground and belowground biomass. Biomass above ground consists of stems, branches, and leaves. All individual biomass values were added together to arrive at the total biomass. The calculated mean total biomass was then multiplied by the carbon conversion factor for mangroves (0.50 for woody and dry biomass matter) from the Intergovernmental Panel on Climate Change. Nesperos et al. (2021), reported that the amount of carbon sequestered was calculated by multiplying the amount of carbon stored by 3.667 to obtain the number of carbon dioxide (CO2) emissions.

2.4. Water Quality

Mangroves are good indicators of water quality. It is known to provide good water quality by filtrating harmful pollutants in water through its aboveground roots and providing a habitat for aquatic species. The following physicochemical parameters were quantified to determine the water quality in Kaingen Riverine.

2.4.1. Temperature

Water temperature is a physical property that can influence how well mangroves thrive in their natural environment. The study of Ward et al. (2016) showed that the increase in Temperature influenced the mangroves, specifically in the form of shifts in species composition and phenological patterns such as the timing of flowering. At the same time, the fluctuations in the temperature of water were attributed to various factors such as air temperature, sediment thermal conductivity, wind speed, solar radiation, and artificial heat (Chen & Fang, 2015). However, it was noted that the water temperature must not surpass the upper threshold as it may cause the mangrove range to expand in higher latitudes, where more mangrove species are distributed. As supported by Collins et al. (2013), anthropogenic activities contributed to the increase of greenhouse gas levels attributed to the global temperature in which bodies of water store substantial amounts of additional heat.

2.4.2. Turbidity

The turbidity scale evaluates the visibility of water. It is a sign that light is making its way through the water. When turbidity is high, the scattered light is bright; otherwise, the turbidity is low. The presence of inorganic and organic matter, clay, silt, algae, plankton, and other microorganisms can cause water to appear turbid, making it appear cloudy or opaque (Water Science School, 2019). Water turbidity is a measure of how clear the water is. High turbidity is an indicator of dissolved solids and soil erosion. Increased turbidity, as mentioned by Sari and Soeprobowati (2021) suggests that waste and pollution in water are being disturbed due to anthropogenic activities, which stresses the mangrove population and reduces its abundance and diversity. Climate change and human activity are two additional causes of turbidity changes. Runoff from the surface, movement of streams, surface flow, and waves and turbulence caused by the waves and winds cause excessive turbidity in natural waters (Pawar, 2013).

2.4.3. Total Dissolved Solids

Total dissolved solids, also known as TDS, are a measurement that can be used to determine the number of various substances dispersed in water. These substances include metals, principal minerals, organic matter, and salts. Total dissolved solids, like total suspended solids, contribute to the cloudiness or murkiness of water. Hence, higher concentrations of TDS decrease the clarity of the water. When this occurs, a limited amount of sunlight can pass through the water bodies that aquatic plants can utilize for their photosynthetic activities. Changes in concentrations of TDS threaten the sensitive mangroves in the mangal community due to the change in salinity and ionic composition, as well as their corresponding toxicity ion (Sari & Soeprobowati, 2021).
Additionally, TDS increases the risk of combining heavy materials and metals that can elevate water temperature. According to Chen et al. (2021), the rise in TDS concentrations was caused by emissions from homes and businesses in the bay's vicinity, which released inorganic salts like potassium, calcium, bicarbonate, sulfates, and so on. High organic salt content or effluent inflow from sewage plants or industries was also responsible for a high TDS value, as stated by Pawar (2013).

2.4.4. Salinity

Salinity is the dissolved salt content in the bodies of water. It is one of the physical characteristics of water, wherein its concentrations are highly valuable for aquatic life. It can determine whether a study site is categorized as freshwater or marine water. As supported by Liu et al. (2020), low salinity level in the water is caused by precipitation.
One of the characteristics of mangroves is their ability to adapt to the salinity of water. Thus, mangroves are categorized as salt secretors and non- secretors. Salt secretors (halophytes) are mangroves that rid their tissue of salt, while non-secretors (glycophytes) do not allow the salt of seawater to enter their tissue (Reef & Lovelock, 2015). According to Feller of Smithsonian Ocean (2018), mangrove species such as Kacang-kacang (Aegiceras corniculata), Api-api (Avicennia species), and Jeruju (Acanthus species) were categorized as salt secretors. They excrete salt through the salt glands of leaves and become salt crystals that can be washed away with seawater. Mangroves categorized as non- secretors avoid high salts in their tissue through ultrafiltration in plant roots. A red mangrove (Rhizophora) and oriental mangroves (Bruguiera) that possess a stilt root system create a barrier that excludes 90% of salts by not allowing the seawater to pass through to its roots (impermeable) or vascular system. Hence, the roots acted as a filtration system, and the barrier was created against osmosis, whereas a species whose salt accumulated at their shoot excreted salt using their older leaves and bark prone to shedding.
On the other hand, mangroves thrive in bodies of water with oligohaline to weak mesohaline salinity that ranges from 0.5 to 35 parts per thousand (ppt). Saltwater intrusion in the coastal area could also affect the salinity level (Halder, 2023). In addition, saltwater intrusion could happen through sea level rise and excessive pumping of groundwater, which could be observed where a water pump is present or when the groundwater recharge reduces (Bayabil et al., 2021).
Anthropogenic pressure, which causes an increase in water's conductivity, directly affects freshwater's salinization. A high conductivity caused by agricultural activities, mining, de-icing roads, and wastewater discharge disrupts the temporal dynamics of salinity in the water. It deteriorates its ability to sustain aquatic organisms (Salcedo et al., 2022).

2.4.5. Conductivity

Conductivity, as stated by Alsumaiti and Shahid (2018), is a significant factor in the condition of water and an indirect indicator of salinity. The electrical conductivity of water varies with the concentration of salt in it. The electrical conductivity was also measured with an EC meter calibrated against a standard, and the results were given in micro siemens per centimeter (S/cm). According to Kluáková (2018), organic compounds like oil and humic acid, derived from decaying organic materials, contribute to the monthly variation in conductivity and are directly correlated with TDS and salinity.
High conductivity was observed in a river system heavily impacted by agriculture, mining, de-icing roads, and wastewater discharge (Salcedo et al., 2022). Water quality needed to be maintained since elevated conductivity increased freshwater salinization.

2.4.6. pH

The pH indicates the basicity or acidity of bodies of water. Strongly acidic water ranges from 0 to 4, while strongly basic water ranges from 9 to 14 pH. Mangrove trees' most optimum value for their growth responds to pH ranging from 6.7 to 7.3. The acidity and alkalinity of water are both influenced by the pH balance of water. Calcium, magnesium, and potassium levels decrease when water has excessive acidity. Calcium is essential for cellular expansion, magnesium for chlorophyll synthesis, and potassium to produce proteins. Calcium deposit occurs when the water has a pH that is too alkaline; it essentially blocks the uptake of nutrients by plant roots. As stated by Rugebregt and Nurhati (2020), There is an inverse relationship between the pH of the water and its temperature, with higher temperatures causing a lower pH in a given water sample.

2.4.7. Dissolved Oxygen

The level of oxygen in the water, known as dissolved oxygen (DO), is crucial for the survival of aquatic organisms. In a well-established mangrove ecosystem, the DO in the water increases due to oxygen exchanged at the mangrove roots. According to Pawar (2013), higher DO increases photosynthetic activity at lower temperatures due to wind velocity and monsoon influence. Several anthropogenic activities, such as effluent from treatment plants, agricultural runoff, and industrial wastes, resulted in lower dissolved oxygen. Low dissolved oxygen levels harm aquatic life and reduce water quality (US EPA, 2023).

2.4.8. Phosphates and Nitrates

Nitrogen and phosphorus are limiting nutrients to the growth of mangroves. Nitrogen and phosphorus do not directly meet mangrove needs as they are used by symbiotic organisms competing with one another. Nitrates are usually denitrified by bacteria, supported by mangrove roots that convert ammonium into nitrate. The natural process of denitrification, in which microorganisms convert nitrates into nitrogen gas, is the primary cause of low nitrate levels in the river, as stated by Singh and Singh (2022). Microorganisms are detectable, as even a faint green tint in the water. Phosphates, however, can be immobile and unavailable for mangroves. Thus, organisms capable of solubilizing phosphorus are essential for plants, especially in a nutrient-limited environment.
Both nitrates and phosphates determine the stability of vegetation growth of mangrove trees, such as the species of Rhizophora, as mentioned in the study conducted by Santoso and Soenardjo (2018). Low levels of nitrates and phosphates could result in low density of mangroves. In contrast, high levels of nitrates and phosphates could lead to eutrophication. In their same study, it was highlighted that nitrates and phosphate have a direct relationship with anthropogenic activities, especially in once-aquaculture sites where there was a presence of fertilizers with rich nitrogen and phosphorus content.

2.5. Soil Quality

Soil is known as the largest terrestrial carbon sink; it can supply significant amounts of nutrients for the growth and development of plants, as well as mangroves. Mangroves are known to store more carbon than any terrestrial forests. Due to the carbon sequestration ability of mangroves, it increases soil productivity, hence, improves the soil quality by increasing the volume of soil and adding its organic matter such as leaves, woody material, and roots. The following soil quality was quantified to calculate the potential of mangroves in the Kaingen Riverine to store carbon.

2.5.1. Soil texture

Soil texture is another factor that affects the growth of mangroves. According to Ghosh et al. (2018), it is found in the Indian Sundarbans Tiger Reserve that a high concentration of sand is found in soil covered with the amount of clay, making the soil texture loamy. Since mangroves are commonly found near the shore, the composition and texture of the soil in the mangrove zone, like that of the study, according to the study, is likely to be observed. Among the soil textural compositions, loamy soil is the best medium for more diverse mangrove species.
According to Alsumaiti and Shahid (2018), the physical property of soil that holds tremendous significance is its texture, as it could impact the potential for water flow, water retention capacity, and fertility potential. In addition, the biological stability of organic matter can be affected by soil texture due to its impact on factors such as water and oxygen availability and the accumulation and isolation of organic matter from decomposition.

2.5.2. Water Holding Capacity

The ability of soil to retain water in a saturated state or without evaporation is measured by its water-holding capacity. The soil's power to store water largely depends on its texture and the amount of decaying matter in it. Percentages can be used to express its significance. Soil texture and organic matter content are the two most essential factors in determining water-holding capacity. Human-induced activities, such as land-use change, altered soil texture and, in turn, the soil's ability to retain water, as Dror et al. (2021) reported. However, agricultural practices increased the soil's organic matter content, increasing the soil water holding capacity; this is because agricultural practices have increased biological activity, which has led to an increase in macropores responsible for transporting dissolved nutrients and micropores accountable for regulating capillary water distribution in the soil (Easton & Bock, 2016). The water-holding capacity of the earth is a measurement of the soil's ability to store water for later use by plants; a higher value indicates a greater capacity to store water (Zhang et al., 2021). Enhanced soil water holding capacity means more available water for mangroves to use in their development and maintenance. Therefore, better water storage is suitable for the proliferation of mangrove trees of various species.

2.5.3. Soil Temperature

Ward et al. (2016) found that mangrove productivity, phenology, composition, and latitudinal range of distribution are all impacted by rising temperatures. Due to constraints in biochemical reactions, it reduces mangroves' capacity to take in atmospheric carbon. Plant cover and solar radiation absorption are two factors that affect soil temperature (Onwuka & Mang, 2018).
Soil temperature has a weak direct correlation with the carbon flux of mangrove forests in Southwestern Japan, which is greatest during the warm season. The study also demonstrated how seasonal changes in Temperature and the tides would influence the carbon flux. Thus, to learn more about the mangrove forest's role as a carbon sink, it is crucial to consider the relationship between soil temperature and the amount of carbon exchange from the forest floor (Tomotsune et al., 2018).
Another factor affecting the soil temperature was anthropogenic activities that resulted in land with disrupted vegetation cover and plowing. As supported by Kiselev et al. (2019), disrupted vegetation cover and plowing caused an increase in the soil thawing, warming the soil to its 320 cm depth. The soil warmed up faster during the warm period, increasing the soil temperature to 2-5 °C. Whereas, during the cold period surface level of soil tends to have a minimum temperature of 11.3 °C and -1.2 °C at a depth of 320 cm. On the other hand, there was no increase in soil temperature in the undisrupted land with more vegetation cover. These showed that land with vegetation cover has a much-controlled temperature during the warm period because trees and other plants use the energy from the sun in their photosynthetic reaction.

2.5.4. Soil pH

Soil pH is a significant environmental physicochemical variable that affects the nutrient composition of soils, which is essential for the growth of mangroves. It is a chemical indicator where pH level can determine mangrove soil's acidity and geochemical process. In the study of Jimenez et al. (2022), geochemical processes within mangrove soil may reveal whether the mangroves are thriving or degrading. The study revealed that mature mangroves thrive with pH levels ranging from 6.3 to 7.7. Hence, they are typical for mangrove soils and plausible for mangrove ecosystems. Is supported by Alsumaiti and Shahid (2018), in which it was claimed that mangroves could not withstand soils with extreme pH that are not within the 5.16 to 7.72 pH range. The study also found that tides, excrement from roots, fermentation, natural carbonate, and redox fluctuation affect mangrove soil pH ranging from 6.5 to 7.0.
Aside from that, anthropogenic activity, such as improper garbage dumping in the soil, could affect the soil pH. The leachate from the garbage was composed of inorganic contaminants, soluble organic compounds, suspended solids, or even heavy metals seeping down the ground pores affecting the chemical composition of the soil (Wdowczyk & Szymańska-Pulikowska, 2021). In terms of natural occurrence, the low soil pH could be attributed to acid deposition in fog, rain, smog, or any particulate matter that is acidic. Chen et al. (2020) found that acid rain occurred during periods of high atmospheric concentrations of sulfur dioxide (SO2) and nitrogen oxide (NOx), two pollutants known to acidify the environment. Soil pH will be lowered when precipitation containing these compounds occurs.

2.5.5. Organic matter

Carbon-based organic matter is a storehouse of nutrients for plants, and it can be derived from the wastes, residues, or decomposition of any living matter. Soil organic matter deposits determine how well mangroves store carbon and how well they can withstand rising sea levels (Arnaud et al., 2020). The capacity of soil to hold and retain water is crucial for the growth of mangroves. The study by Fukumasu et al. (2020) demonstrated a positive correlation between soil organic carbon and pore size distribution in soil. In addition, Wei et al. (2014) cited that organic matter rates increase as the clay increases. Hence, the conservation of carbon stocks for adult mangroves revealed that it depends on the accumulated complex soil organic matter (Jimenez et al., 2021). On the other hand, the accumulation of organic matter yielded by mangroves is apparent in soil and may be transferred to neighboring bodies of water. Studies conducted in seagrass meadows near mangrove communities also showed that most organic carbon comes from the organic matter of mangroves (Azkab et al., 2017).
Clearing mangroves or allowing them to degrade could make the organic carbon stored in their soils more amenable to mineralization, which could release carbon dioxide emissions. Even small changes in the size of the soil's pool of organic carbon can result in significant carbon dioxide emissions into the atmosphere, especially in mangrove ecosystems. Soil organic carbon pools are particularly susceptible to mineralization following disturbance, but it is unclear how much of this vulnerability can be attributed to the depth of disturbance (Santos- Andrade et al., 2021).

2.5.6. Organic Carbon

Organic carbon is a form of carbon obtained from living or dead matter (Hancock et al., 2022), such as livestock and plants, animal bones, and dry leaves, and maintains the quality of soil as well as the inorganic carbon produced by soil formation (Gangopadhyay et al., 2021). As supported by Yang et al. (2021), soils with higher organic carbon are associated with finer soil grain size and higher water content. Soil organic carbon (SOC) is essential to the biogeochemical cycles that can counteract the organic carbon loss brought on by deforestation (Bonner et al., 2019). In addition, mangrove ecosystems have the potential to store 5-10.4 Pg of SOC worldwide; this accounts for 71-98% of total carbon storage in estuarine areas and 49-90% in marine mangrove areas (Wang et al., 2021).
On the other hand, the long-term impact of organic carbon stocks in soils can be influenced by both natural processes and anthropogenic disturbances. The impact of severe weather phenomena such as hurricanes, heat waves, and droughts on mangrove ecosystems can lead to substantial modifications, causing a reduction in both above and belowground carbon reserves and raising carbon dioxide emissions (Santos-Andrade et al., 2021).

2.5.7. Nitrogen, Phosphorus, and Potassium (NPK)

Nutrients like nitrogen, phosphorus, and potassium are crucial to a plant's development and growth. Mangrove forests almost entirely cover the world's tropical and subtropical coastlines. Mangrove forest structure and productivity are affected by nutrient availability, similarly to other plant communities. According to Pradipta et al. (2021), nitrogen and phosphorus are nutrients that influence mangrove development. As supported by Geng et al. (2017), soil nutrients respond directly to temperature, with a higher temperature causing a faster rate of nutrient accumulation. Nitrogen influences the number of photosynthetic processes that occur in mangroves. Increasing the leaf's nitrogen concentration improves electron transport during photosynthesis. Although plants contain less phosphorus than nitrogen, the latter is more widely recognized as essential to plant growth. Reduced phosphorus uptake can reduce plant tissue volume and darken leaf color. Reduced soil nitrogen and phosphorus levels may lead to mangrove tree dwarfism, according to research by Alhassan et al. (2021).
Potassium is essential for regulating osmotic pressure, activating enzymes, protein synthesis, and photosynthesis in plant cells. Lack of potassium causes a decline in chlorophyll and photosynthetic activity in mangroves. According to Sofawi et al. (2017), potassium is used for fertilizers, increasing soil fertility and acting as an indicator of healthy plants. A lack of potassium in soil may lead to unhealthy plant growth.
For the interpretation of soil phosphorus (P) and potassium (K) levels, four soil classifications are used to determine how concentrated the amount of P and K are in the soil sample, namely as low, medium, optimum, and excessive having soil test values (in FIV) of 0-25 (low), 26-50 (medium), 51-100 (optimum), and > 100 (excessively), respectively. Low P and K concentrations are categorized as inadequate nutrients to support plant growth. However, medium concentrations in soils that have adequate P and K nutrients can support plant growth, but there is a need to increase in optimum level to secure stable plant production. On the other hand, optimum concentration levels of P and K are the recommended range to support plants. Excessive P and K concentration in soil endangers water quality, resulting in soil erosion, runoff, and leaching of P and K to the bodies of water. Furthermore, the result of the study shows that as the amount of P increases, the productivity of the soil increases. Like P, the productivity of soil increases as the amount of K increases. According to Lal and Kumar (2022), soil temperatures directly correlate with the potassium concentration in the soil's nutrient availability. However, excessive P and K could adversely affect the environment, disrupt soil quality, and negatively affect water quality.

2.6. Related Studies

The following are studies reviewed to serve as the basis of the study.

2.6.1. Local Studies

Abino et al. (2013) conducted a study in Botoc, Pinabacdao, Samar, Philippines, to analyze the species composition and carbon storage of a native mangrove. The chosen sampling site was based on the accessibility and safety of
the natural mangrove stand. As a result, data was collected using a non-destructive approach known as quadrat sampling. Samples of mangrove stems and branch bark were also taken into a research laboratory to test the carbon content. Therefore, comparing mangrove tree diversity in different environments is reasonable using the Shannon-Weiner and allometric equations index using a 47% carbon conversion value, or 0.47, to obtain the carbon stock recommended by the Intergovernmental Panel on Climate Change (IPCC). Also, twelve (12) plots spanning approximately 10 m × 10 m were used in the analysis. The Shannon-Wiener index yielded a value of 1.6365 for species diversity, indicating an insufficient variation in species of nearby mangrove stands. As a result, 74% of the biomass was derived from growth above ground, whereas 26% was derived from the roots of the plants. Further, the biomass and carbon density can store up to 188.50 t C ha-1 of carbon sequestration and storage. Climate change and unsustainable anthropogenic activities could hurt the assessed value.
On the other hand, Pototan et al. (2020) researched Banaybanay, Davao Oriental, Philippines, to investigate the diversity of mangrove tree species and their composition and structural properties. The standard procedure for evaluating mangroves was developed as a foundation, with Canizares and Seronay (2016) contributing their changes. In addition, the mangrove species samples were collected in three (3) quadrats measuring 10 m × 10 m each. The Shannon-Weiner, Peilou's Index of Evenness, Simpson's Index of Dominance, and Simpson's Index of Diversity indices were utilized to ascertain each species' richness, diversity, evenness, and dominance under the mangrove family. The evaluations of the mangroves were based on the sampling area, which had a total of 33 plant species spanning 14 groups. The 33 plant species were divided into two groups: true mangroves (94% of the total) and mangrove associates (6%). The study was utilized to ascertain whether the mangroves are classified as true or associated species. The Shannon-Wiener Index of Diversity was found to have a value of 3.145, Pielou's Index of Evenness has a value of 0.89, which indicates that there is high species evenness in the area, Simpson's Index of Dominance has a value of 0.05, which suggests that there is low dominance, and Simpson's Index of Diversity has a value of 0.11, which indicates that there is a low diverseness of species in the area. It showed that no species predominated over other mangrove species in the area.
In the study conducted by Cañizares and Seronay (2016), both the composition and diversity of tree species of mangrove in Barangay Imelda, located in Dinagat Island, Philippines, were assessed to promote the protection as well as the conservation status of the mangrove community. Methods used in the study include the line transect sampling and measurements of the mangroves' basal diameter in two appointed sampling stations, each with five (5) 10 m x 10 m plots. The procedure was adopted in the mentioned study for the diameter at breast height. At the same time, mangrove species were identified using the Philippine Mangroves, a manual field guide by Dr. Jurgenne H. Primavera. Mangrove regeneration included the construction of 1 m x 1 m subplots to count samplings and seedlings, and plant maturity was also identified. The data analysis in the study included the use of diversity indices with species richness, relative abundance, and the inclusion of Shannon-Weiner diversity index and evenness. The mangrove community's vegetation was also analyzed using the following parameters: frequency, relative frequency, population density, relative density, dominance, relative dominance, and importance value for each mangrove species. The habitat assessment of the area was analyzed by calculating the crown cover percentage, regeneration for every m², and average height. The findings revealed that the mangrove diversity of Barangay Imelda in Dinagat Island was shallow, which falls under the category H' equivalent to 1.856, wherein ten mangrove species belong to six families of the taxonomic classification. Three species were recorded to have the highest population density, relative frequency, relative dominance, and importance value indices, while one species had the lowest among those values. The crown cover of the site was classified as "fair" at 40.16%. In the same year, Dolorosa et al. (2016) investigated the mean height and regeneration per m² of mangroves having values of 5.87 and 3.6, respectively, and were classified as "excellent."
The study of Nesperos et al. (2021) presented the determination of the amount of carbon dioxide (CO2) sequestered by multiplying the weight of C by the value of 3.667. The value was obtained by computing the ratio of Carbon dioxide (CO2) to Carbon C by dividing the weight of carbon dioxide, which is 44 by 12, resulting in 3.667 as presented by the United States Environmental Protection Agency (US EPA) based from Greenhouse Gases Equivalencies Calculator - Calculations and References (2022).

2.6.2. Foreign Studies

The study by Chunkao et al. (2012) aimed to assess the water quality treated by the mangrove forest in Phetchaburi Province, Thailand. The sampling site chosen by the researchers is known for its wastewater dumping by the municipality of Phetchaburi Province. The study used six parameters to monitor the water quality: pH, water temperature, dissolved oxygen (DO), phosphate, nitrate, and ammonia. The experimental setup of this study was divided into three (3) sampling sites: (A) a tideland located between the pond and mangrove forest; (B) an area of mangrove forest; and (C) a sea area. According to the study, the mangrove forest chosen as a site has a mono-dominant species named Avicennia marina. The density of the tree, average height in meters, diameter at breast height (DBH), biomass, and sapling density are among the measured parameters within the forest.
Furthermore, they used the grab and composite sampling method to collect water samples for the three sampling sites. The result of the study shows that mangrove forests can improve the quality of water in Phetchaburi Province, Thailand, by increasing the dissolved oxygen (DO) by 32.39% and lowering phosphates (88.23%), ammonia (73.77%), and nitrates (64.28%). The roots caused the increase in dissolved oxygen—the mechanism of the Avicennia marina where it exchanges oxygen to allow it to breathe and prevent drowning. Furthermore, the decrease in water's phosphates, nitrates, and ammonia content was caused by three abiotic processes: sedimentation, absorption, and precipitation, as well as the exchange process between soil and water. The pH of water also decreased in sites B and C due to fermentation of organic matter, and the Temperature of water at site
B was observed to be lower compared to sites A and C, as mangroves covered it and a limited amount of sunlight can reach the water surface.
Alsumaiti and Shahid (2018) conducted a study whose main goal was to understand the critical characteristics of soils in the Eastern Lagoon Mangrove National Park in Abu Dhabi, UAE. The study also evaluated the variability of soil properties, which was accomplished by testing soil physicochemical properties such as pH, Temperature, Nitrogen, Phosphorus, Potassium, Organic Carbon, Organic Matter, and Soil Texture. Soil samples were collected using a combination of randomness and stratification with a frequent interval in which a hole with a depth of 0-50 cm and 50-100 cm was dug in the swaps. A kilogram of samples was also collected from each sample site, then placed in a clean plastic bag and labeled. The samples were sent to the lab for analysis to determine their essential physical and chemical properties.
In determining the amount of carbon stored and sequestered in a tree, the girth (GBH) of each species of mangrove tree was obtained by measuring the circumference of a trunk 1.37 m from the ground, which pertains to the tree's breast height (Harishma et al. 2020). The circumference of each tree was measured using a tape measure in centimeters (cm) as the standard unit, then divided the value obtained by the value of pi (π), 3.1416, which converted the GBH into diameter at breast height (DBH). The DBH was used to measure a tree's aboveground and belowground biomass using allometric equations established by Komiyama et al. for species of mangroves particular to the Southeast Asian region. The study used an equation of wagb=0.251ρD2.46 in kilogram (kg) to estimate aboveground biomass.
In contrast, wr=0.199ρ0.899D2.22 (kg) was used to estimate belowground or root biomass, where ρ pertains to the wood density of specific mangrove species. At the same time, D indicates the diameter measured at 1.37 m from the ground of each tree. While the wood density required to compute the estimated aboveground and belowground biomass was obtained as provided by the database of the World Agroforestry Center (2017). The total carbon biomass was then obtained by taking the sum of computed aboveground and belowground biomass of each tree. After that, the total biomass of each tree per plot for all plots was summed up before being divided into the average area of all plots used to obtain the average total carbon biomass, then converting the unit into t/ha. Hence, to obtain the carbon stock, the average total carbon biomass was multiplied by the carbon conversion factor at the 0.5 value, as proposed by the Intergovernmental Panel on Climate Change IPCC (2006). The study also excluded herbs and seedlings for the estimation of carbon stocks. The results revealed that the mean mangrove biomass in the study location was 117.12 ± 1.02 t/ha; the highest biomass belonged to the species Avicennia marina with a 108.23 t/ha biomass. Kerala's average aboveground biomass (AGB) revealed an estimation of 80.23 ± 15.95 t/ha, while mean biomass for belowground (BGB) showed 36.90 ± 6.23 t/ha. The carbon stock for vegetation was also recorded and revealed to be 58.56 ± 0.51 t C/ha, and soil carbon stock resulted in an average of 81.26 ± 10.16 t C/ha. In comparison, the carbon stock of the site's ecosystem was estimated at 139.82 ± 10.67 t C/ha. Hence, results revealed that the location, Kerala, India, can sequester 139.82 t C/ha of carbon.
According to the study of Sahu and Kathiresan (2019), significant variations of the carbon sequestration potential of mangroves of varying ages were observed from age 7 with a carbon sequestration potential of 143.62 ± 36.08 to the natural plot, which sequestered approximately 282.72 ± 23.62 gCm-2a-1. It can be deduced from the results obtained from this study that the age and carbon sequestration potential of mangroves were directly proportional to each other; that is, as the age of mangroves increased, the carbon sequestered also increased.
Indrayani et al. (2021) also used allometric equations presented by Komiyama et al. (2005); however, the study referred to multiple references for specific allometric equations for estimating aboveground and belowground biomass per individual species of mangroves. A non-destructive data collection method was also used to measure the diameter of the mangrove's breast height. In contrast, the wood density for mangrove species was acquired from the World Agroforestry Center (2017). Total biomass was obtained by adding aboveground and belowground biomass and then taking the average to get the mean biomass of mangroves. The carbon factor value 0.50 study also referenced the Intergovernmental Panel on Climate Change. The results showed that five total species of mangrove trees were found in the study location. The results also showed that the average aboveground biomass obtained in the area was estimated to be 117.62 ± 45.68 t/ha.
In comparison, the average belowground biomass was 56.58 ± 22.49 t/ha, making aboveground biomass higher compared to the belowground biomass. Among the mangrove species, the mangrove biomass was highest in Rhizophora apiculata and lowest in Sonneratia caseolaris. Lastly, the average carbon stock of the location's ecosystem revealed an estimation of 87.10 ± 34.07 tC/ha.
The study conducted by Pawar (2013), in the mangrove ecosystem located in Uran, Navi Mumbai, on the western coast of India, evaluated the impact of human activities on the quality of water in mangrove ecosystems concerning tidal and seasonal variability. The study selected two sites, Sheva Creek and Dharamtar Creek, sites 1 and 2, with three stations each at 1 km apart, and was conducted for two years — from April 2009 to March 2011. On the other hand, four true mangrove species, representing three genera and 3 families, were dominant in the area. According to the resulting data, the coastal ecosystem of Uran was significantly strained due to industrialization, urbanization, and reclamation in the area. Disposing of untreated domestic waste and industrial effluents contributed to the destruction of the coastal ecosystem, public health risks, and reduced marine and coastal biodiversity. Furthermore, the water quality parameters from the mangrove ecosystem are intensely polluted.
Mangroves have unique root systems that adapt well to changing environmental conditions. It includes changes in salinity – through fluctuation of tides, soil compaction, and natural phenomena such as storm surges, storms, and strong winds, as cited in the study of Chen et al. (2015). Some mangrove species have developed modified root systems for their changing environment. It includes propping, stilt, or buttress roots, which vary in their morphological structure and function. In addition, the adaptation also helped mangrove trees, in terms of stability, especially for species that stood along the shoreline composed of soft soil.
Furthermore, the thigmomorphogenetic response of a modified root system of mangroves helped in resisting the tension inflicted by strong winds to the crown, which made mangroves able to withstand the destructive force that some tree species might not be able to endure. Rhizophora mangle and Rhizophora apiculata were observed to have prop roots descending from their trunks and branches, which provided the mangroves with a robust support system. Moreover, The submerged prop roots anchored the trees and accumulated debris and silt, which formed the soil beneath the tree per se. Further, the root system of Rhizophora mangle, containing prop roots or buttress roots from trunks, was proven to help mitigate the damages the storm surges may inflict and was higher than that of what other mangrove species can sustain. It only showed that mangroves were well adapted to their varying environment; otherwise, they will be prone to destruction.
The growth rate of mangroves is affected by salinity in a way that their growth pattern decreases as the mangroves approach more saline regions according to the values obtained for different variables such as tree basal area, average tree height, and diameter at breast height (DBH), except the stand density. Moreover, the lowest value for these variables was found in strong saline areas (Ahmed et al., 2022). The study of Basyuni et al. (2014) to the comparison of the growth rate of two species, Avicennia marina and Rhizophora stylosa seedings, one of which is salt-secretor species – the Avicennia marina, while the latter is not, it was shown that the said species have only certain level of salinity can be tolerated, that is, 2.00% salt concentration (equivalent to 75% natural seawater) was the maximum salt content for Avicennia marina to thrive, while 0.50% was the maximum for
Rhizophora stylosa. Further increase in salinity level will result in a decrease in the growth rate of these two species. Thus, although mangroves could tolerate varying salinity levels, their growth will still be affected by the changes in salt concentration.
As the 21st century approaches, mangrove forests have been threatened by deforestation for land conversion and timber, overexploitation of resources, and pollution. Climate change induces biophysical pressure on mangroves by affecting the following environmental factors — soil erosion, cyclones, sea-level rise, and salinization. The salinity of water may change due to a rise in sea level; an increase in salinity will increase the vulnerability of mangroves in tropical regions.

2.6.3. Synthesis

Measurement for carbon sequestration, mainly in mangroves, could vary depending on their environment. Specifically, factors such as location, anthropogenic activities, soil quality, and water quality could affect mangroves' growth, which further affects their capacity to sequester and store atmospheric carbon.
This study shared similarities to the study of the following researchers: The studies of Abino et al. (2013), Harishma et al. (2020), and Indrayani et al. (2021) in terms of carbon storage and use of allometric equations to determine the CO2 sequestered and stored, as well as utilizing World Agroforestry Center database (2017) for the species' wood density and using 0.50 value as a conversion factor for
carbon in attaining the carbon stocks; The use of Simpson's index of dominance and Peilou's index of evenness in the study of Pototan et al. (2020); The study of Basyuni et al. (2014) which focused on the salt-secretor species of mangrove namely Avicennia marina and Rhizophora stylosa which can tolerate maximum salinity level of 2.00% and 0.50% respectively. On the other hand, this study differs from the study of the following researchers: The use of the Cray-Curtice equation in the study of Dolorosa et al. (2016); Chunkao et al. (2012) includes six water quality parameters, namely water pH, water temperature, dissolved oxygen (DO), phosphates, nitrates, and ammonia; Pawar (2013) considered tidal and seasonal variability together with anthropogenic activities in assessing water quality in mangrove ecosystem; And the study of Chen et al. (2015) which discussed the ability of root system of mangroves to adapt in a changing environmental condition such as changes in salinity level.
In addition, the study by Sahu and Kathiresan (2019) discussed the ability of mangroves to sequester carbon which varies from their age. Mangroves increase CO2 sequestration and storage as they mature, resulting in a direct relationship.

Chapter III

METHODOLOGY

3.1. Administration of Anthropogenic Activities Questionnaire

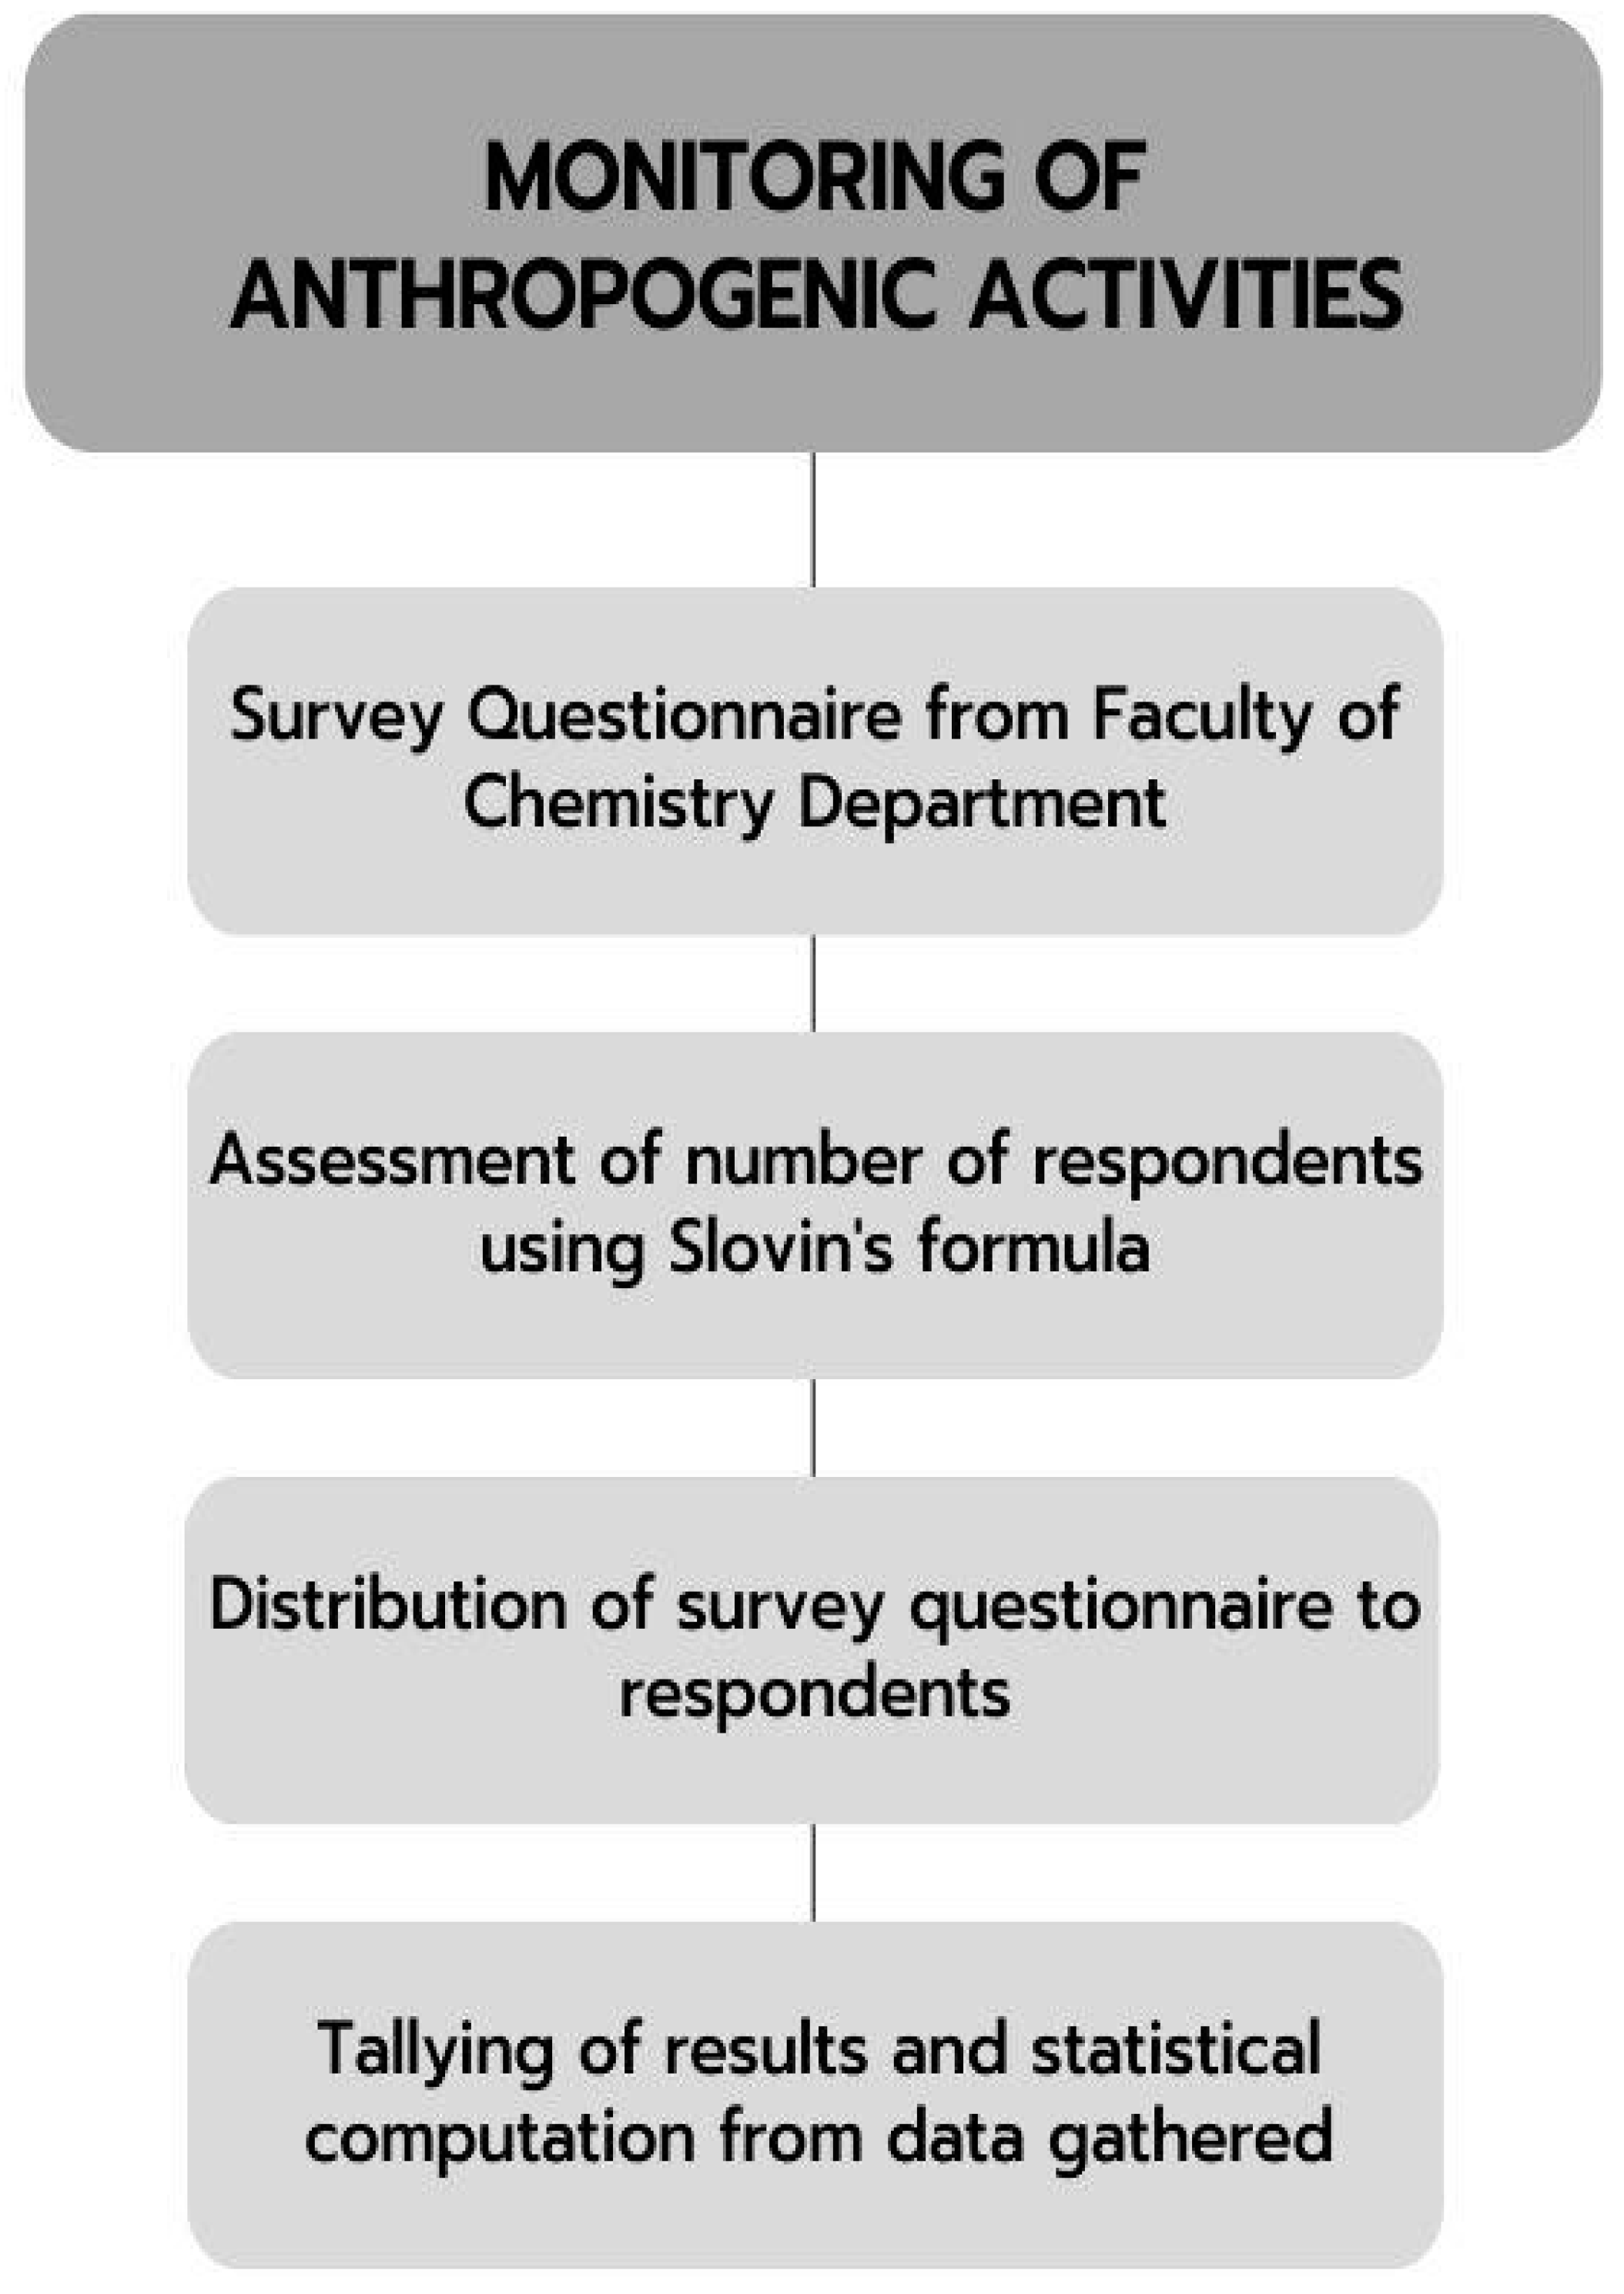
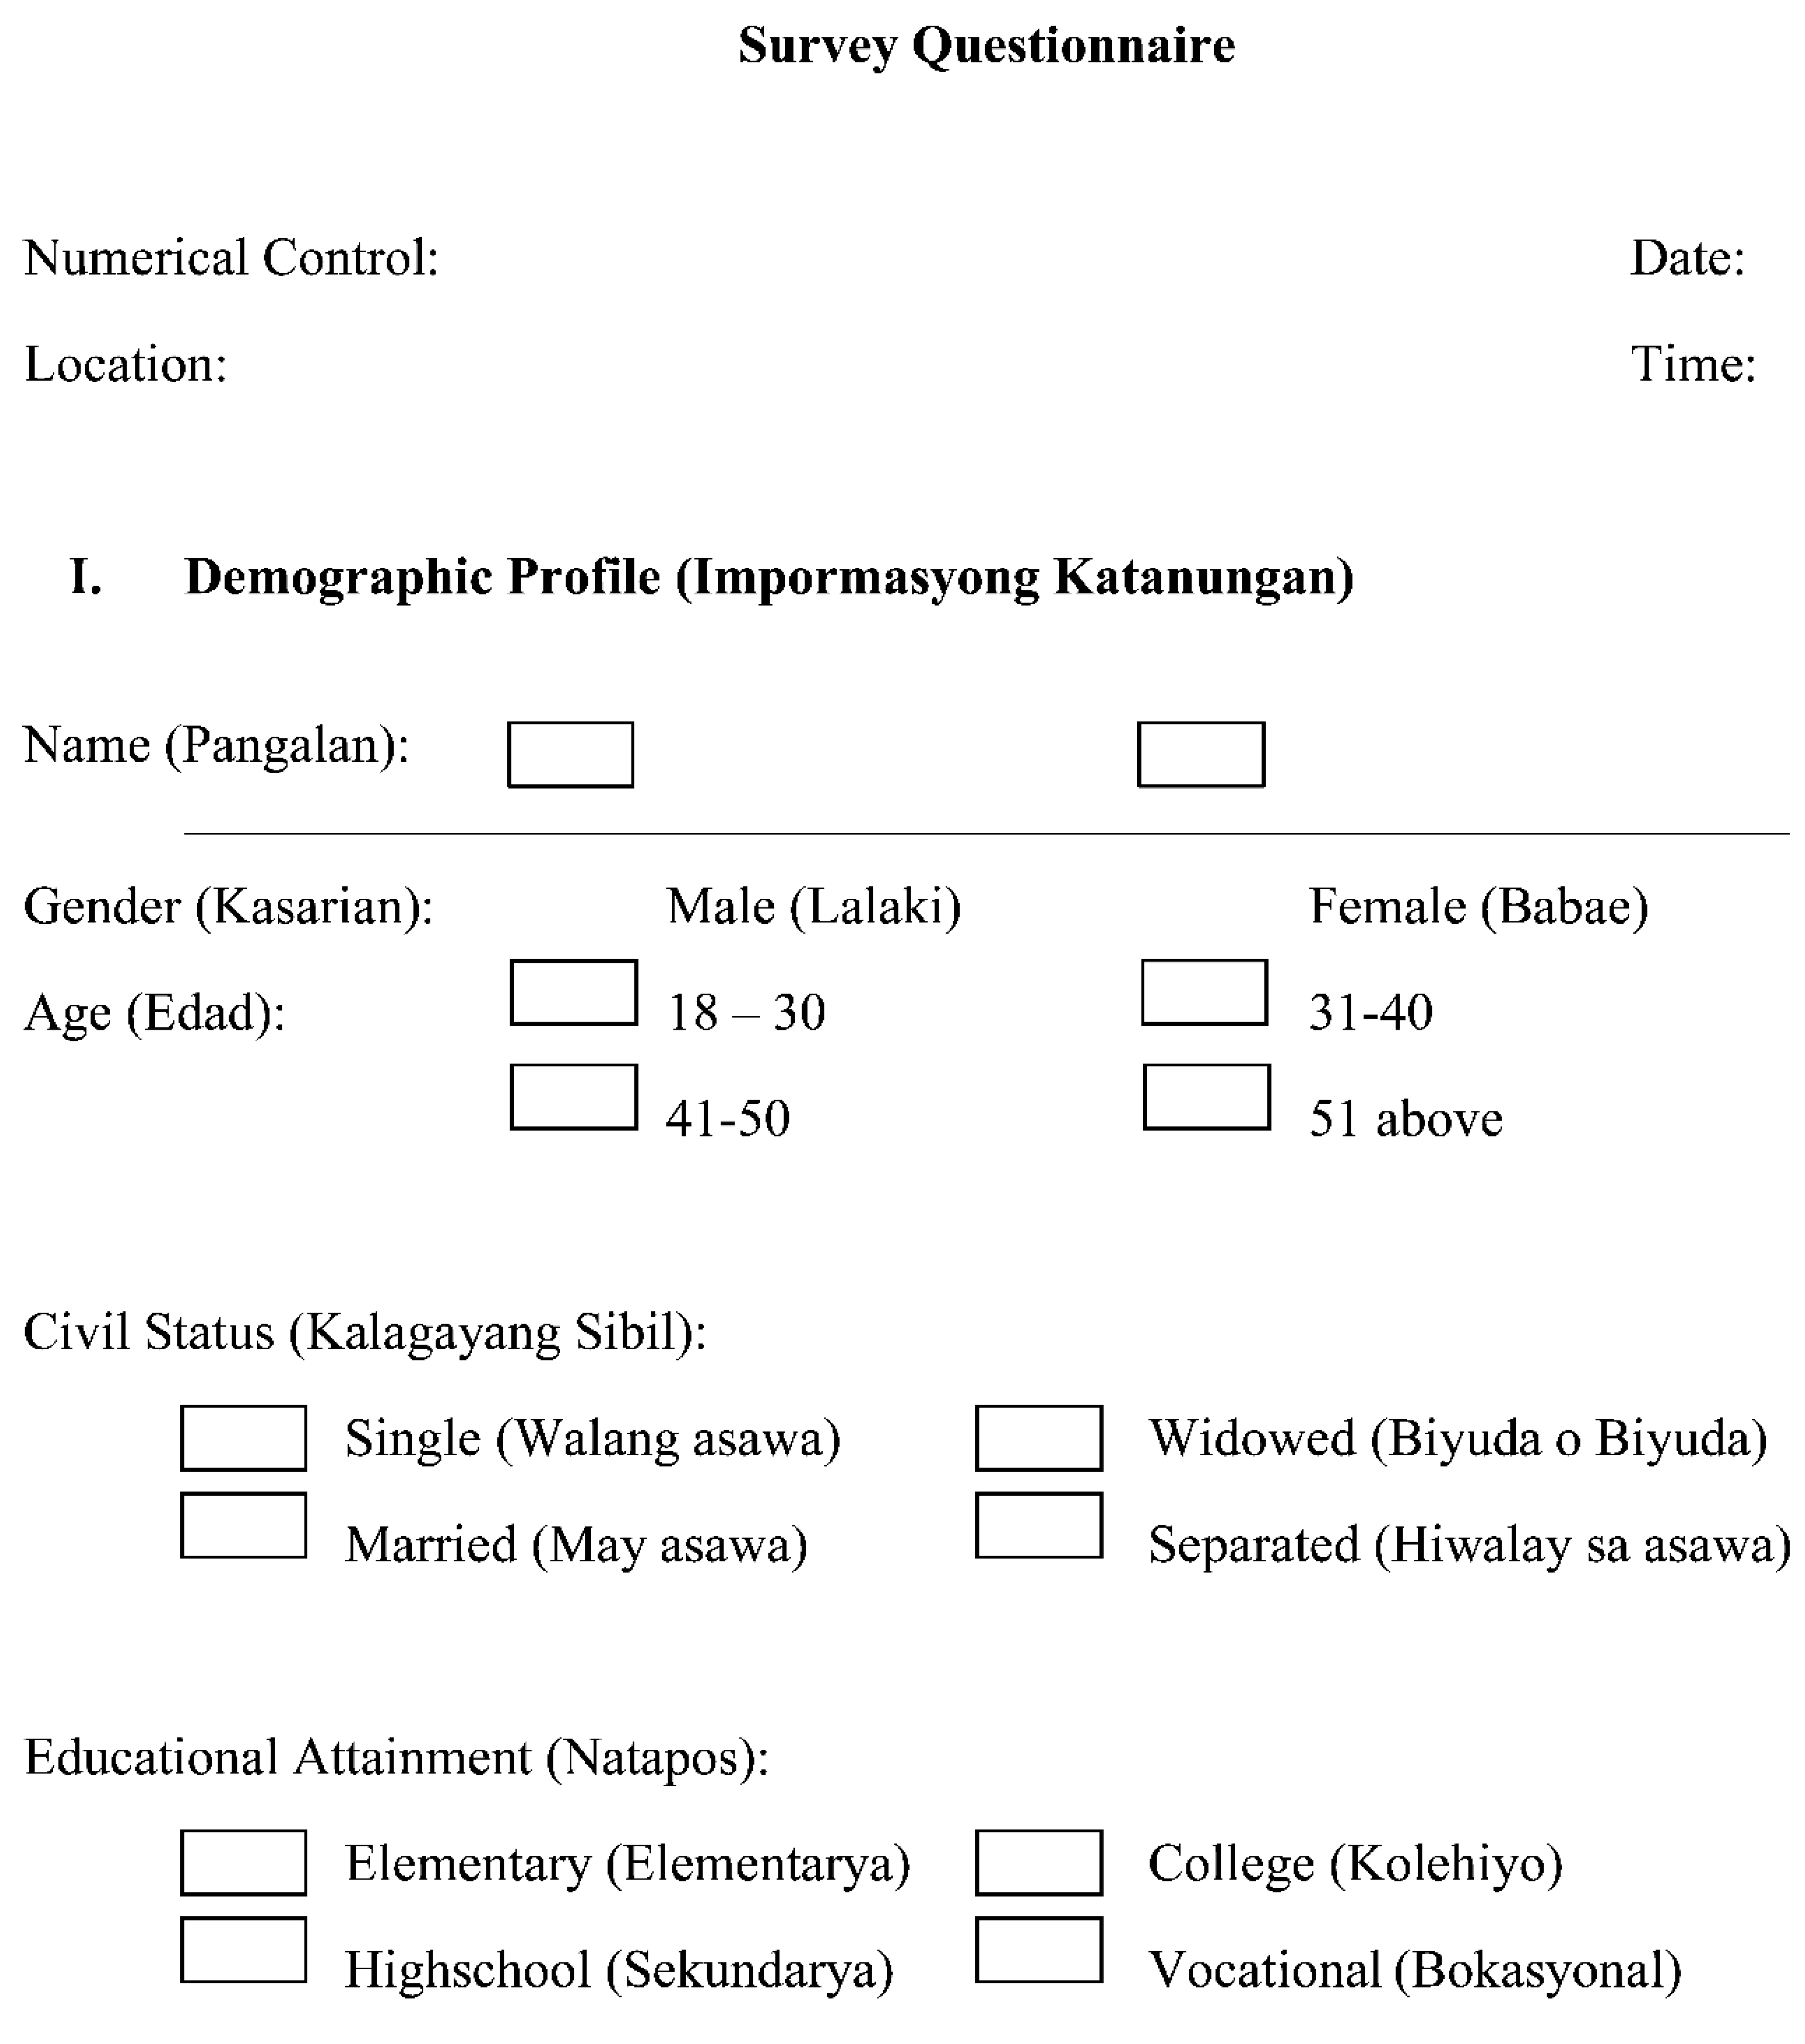
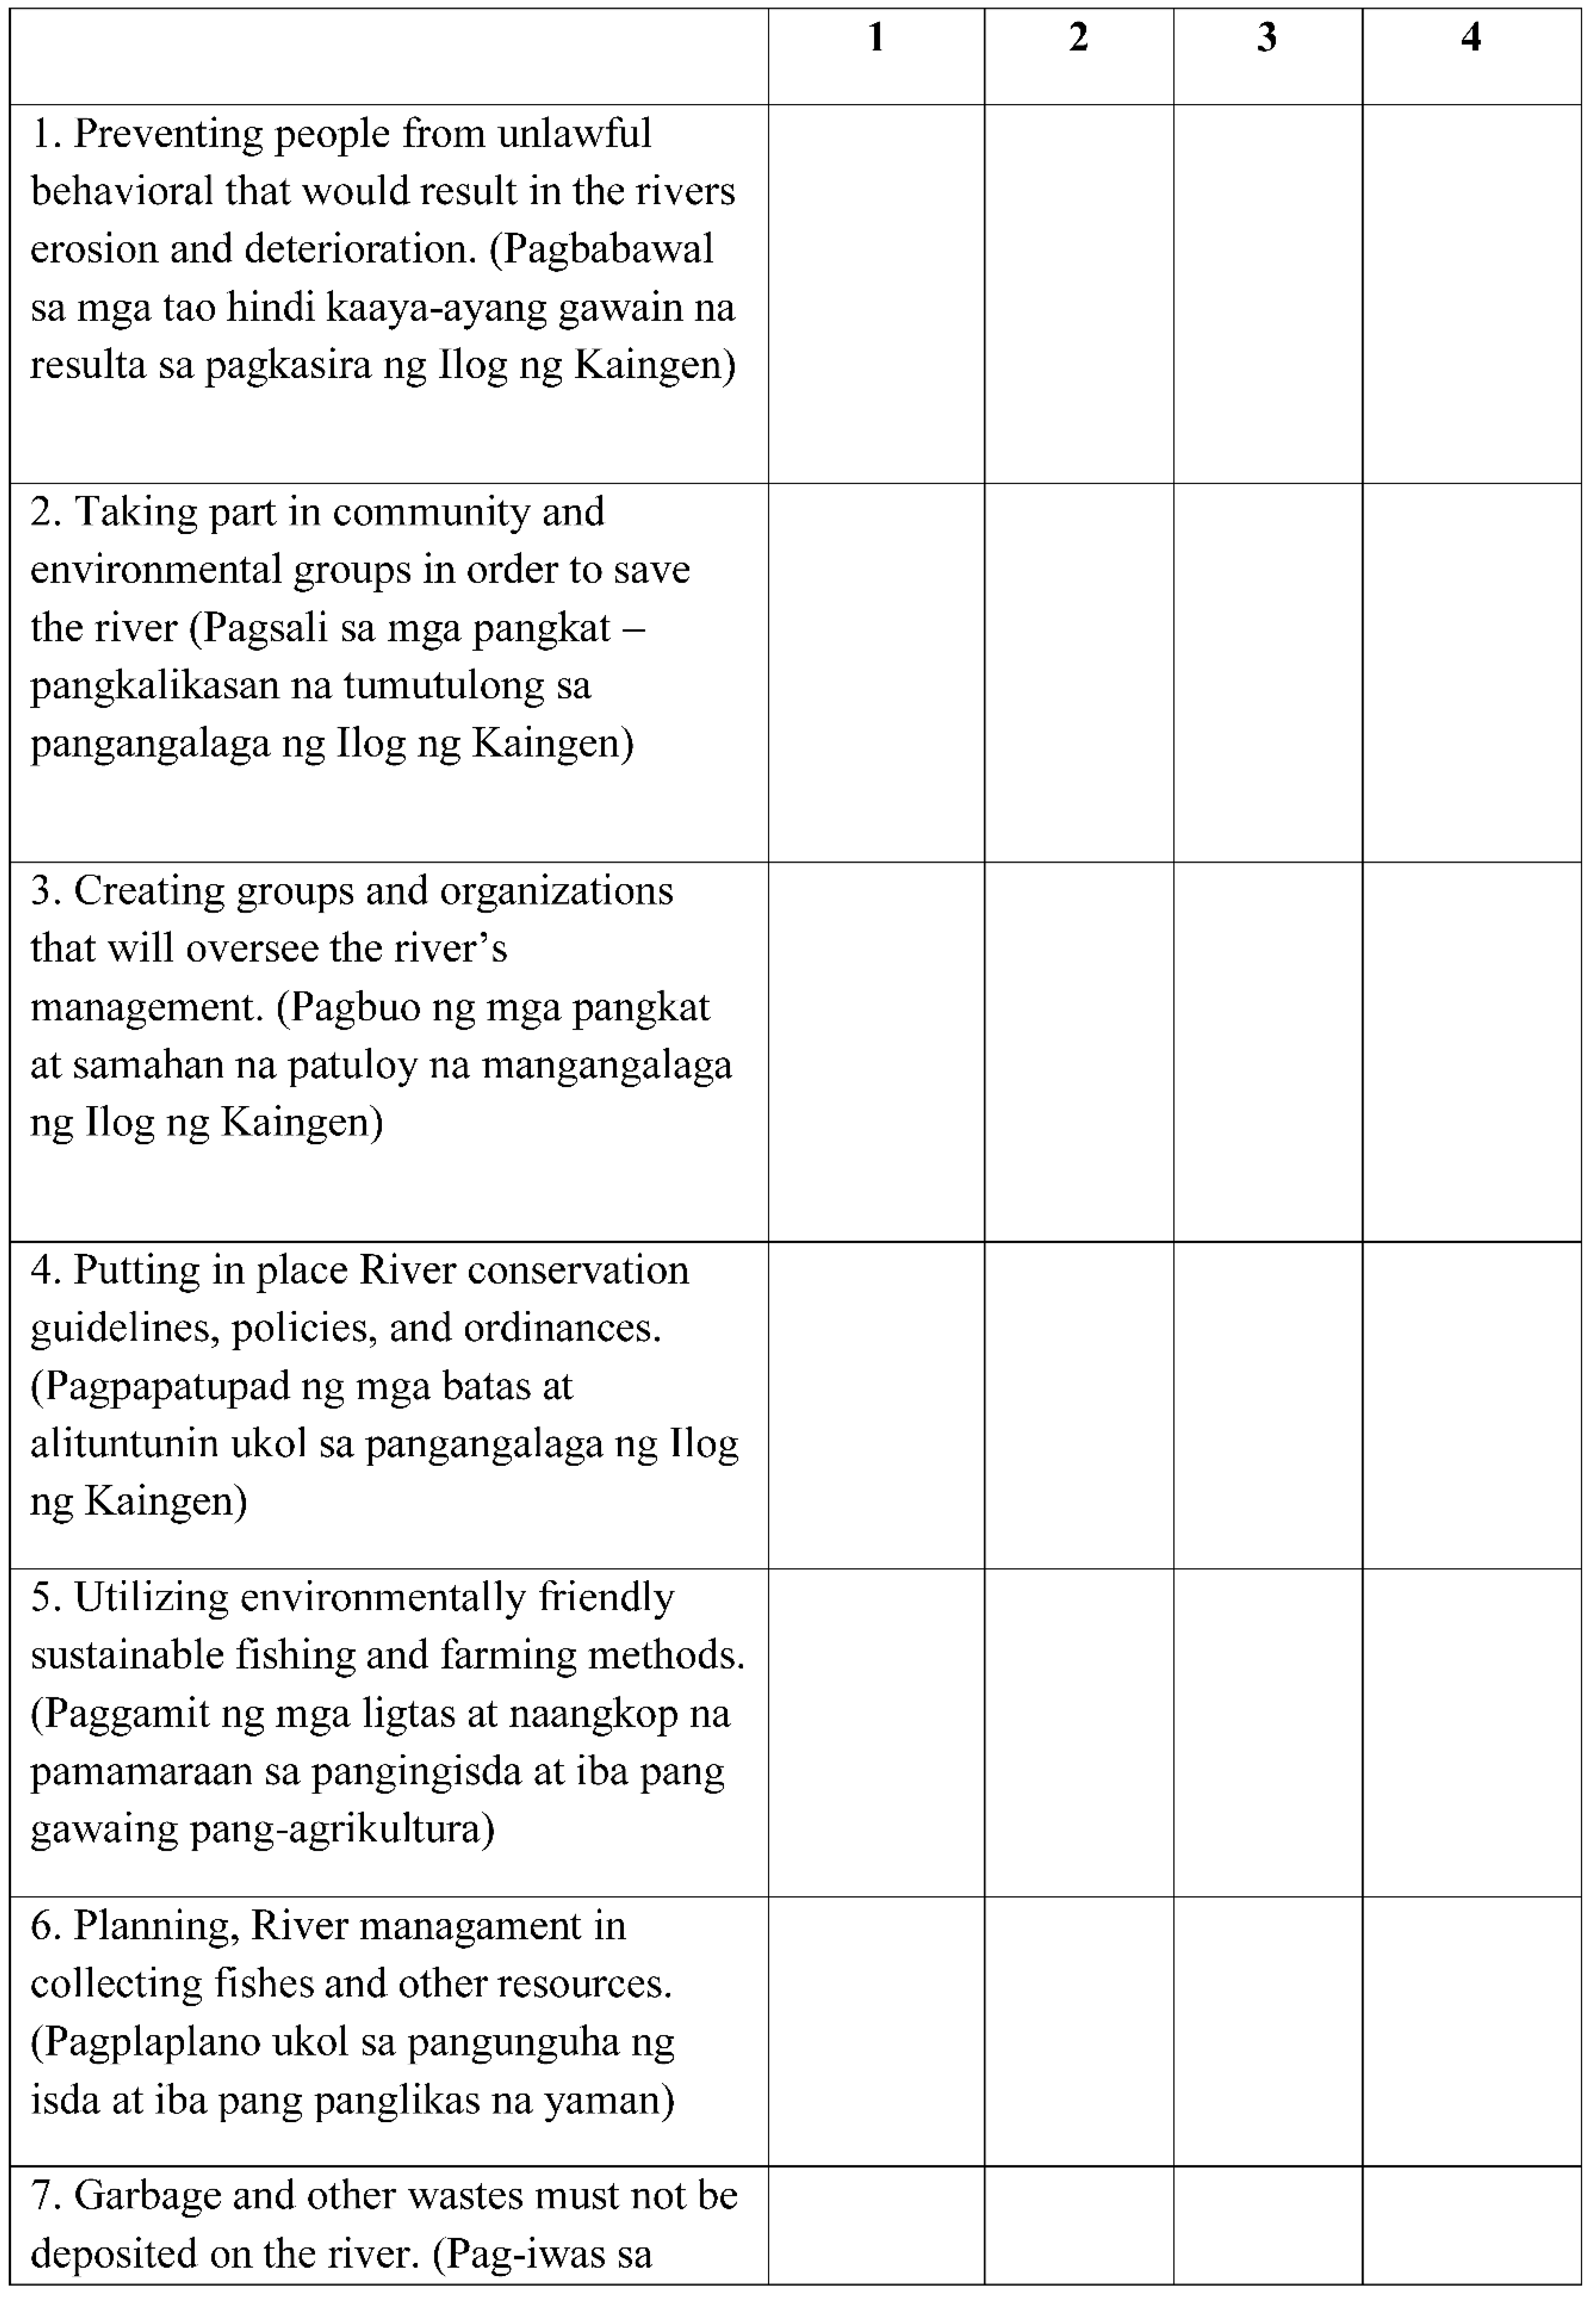
Anthropogenic activities in Kaingen River, Kawit, Cavite, Philippines, were determined through interviews and survey forms handed to the residents of Barangay Kaingen, Kawit, Cavite. Written consent was provided to the residents to ensure that the data obtained would remain confidential and intended only for academic purposes following Republic Act No. 10173 or the Data Privacy Act of 2012. The total number of respondents was determined using Slovin’s formula.
Slovin’s Formula
n = N 1 + N e 2
where:
  • N = the size of the population
  • i>e = the desired margin of error

3.2. Water Quality Analysis

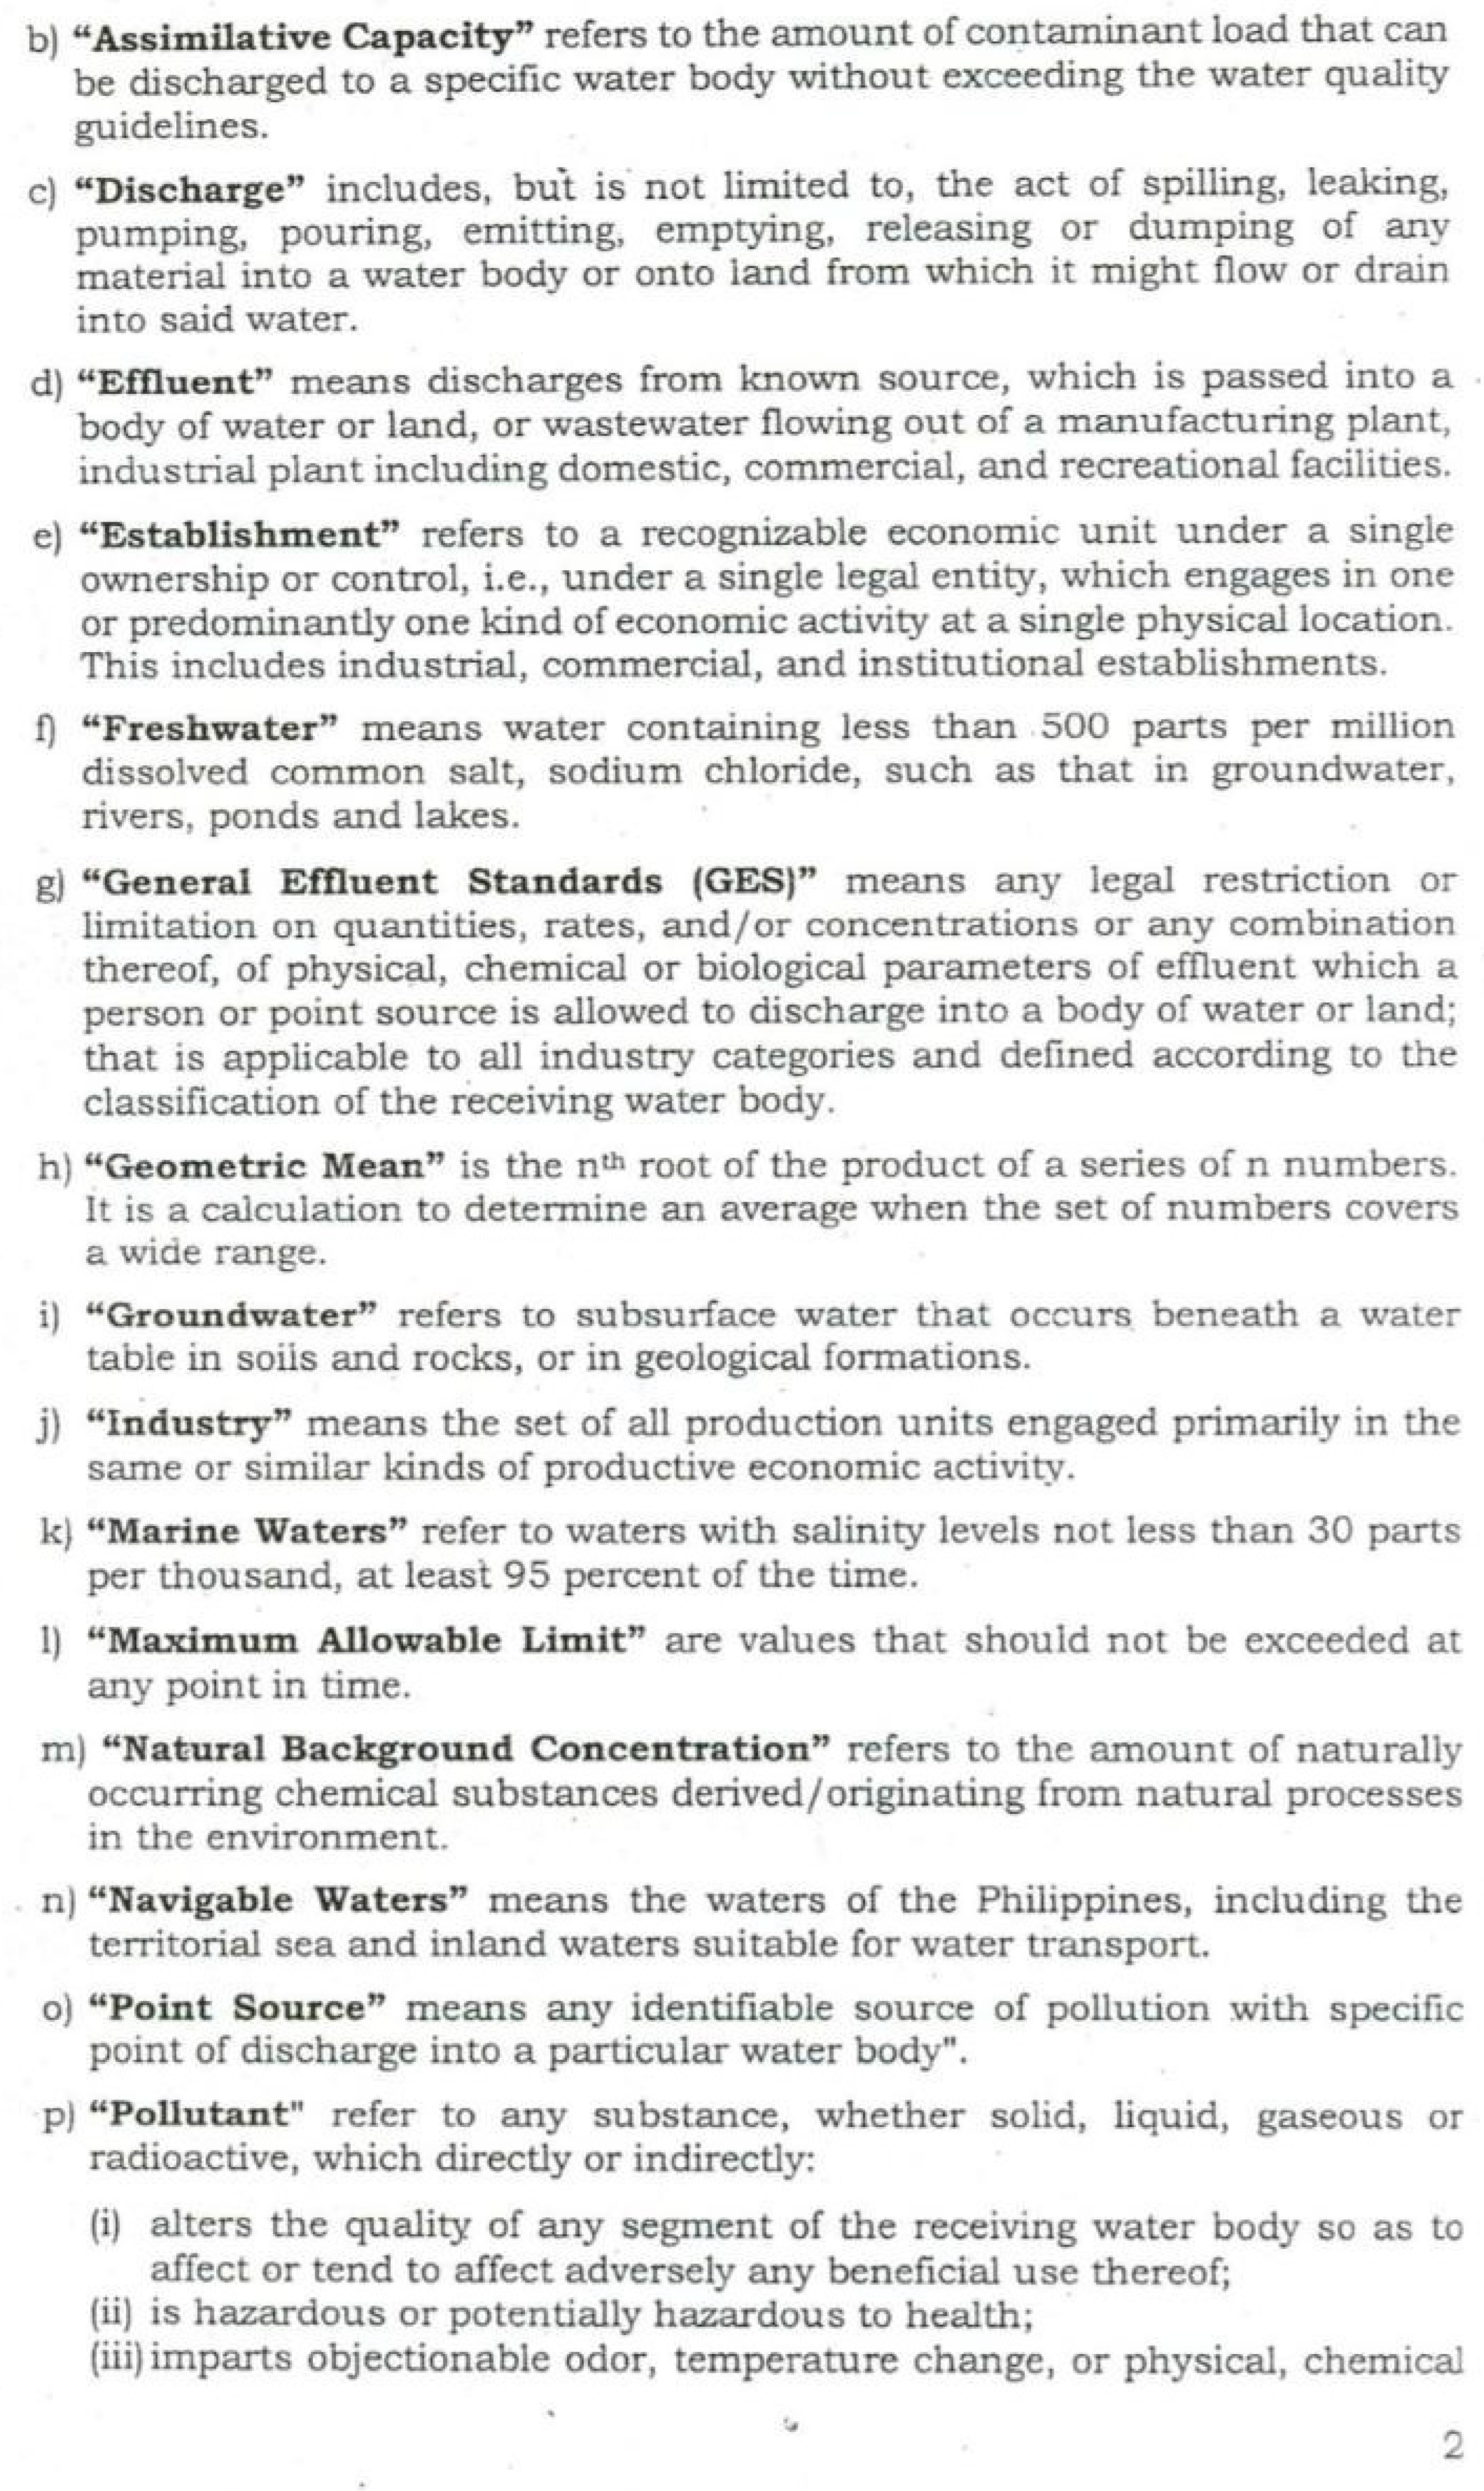
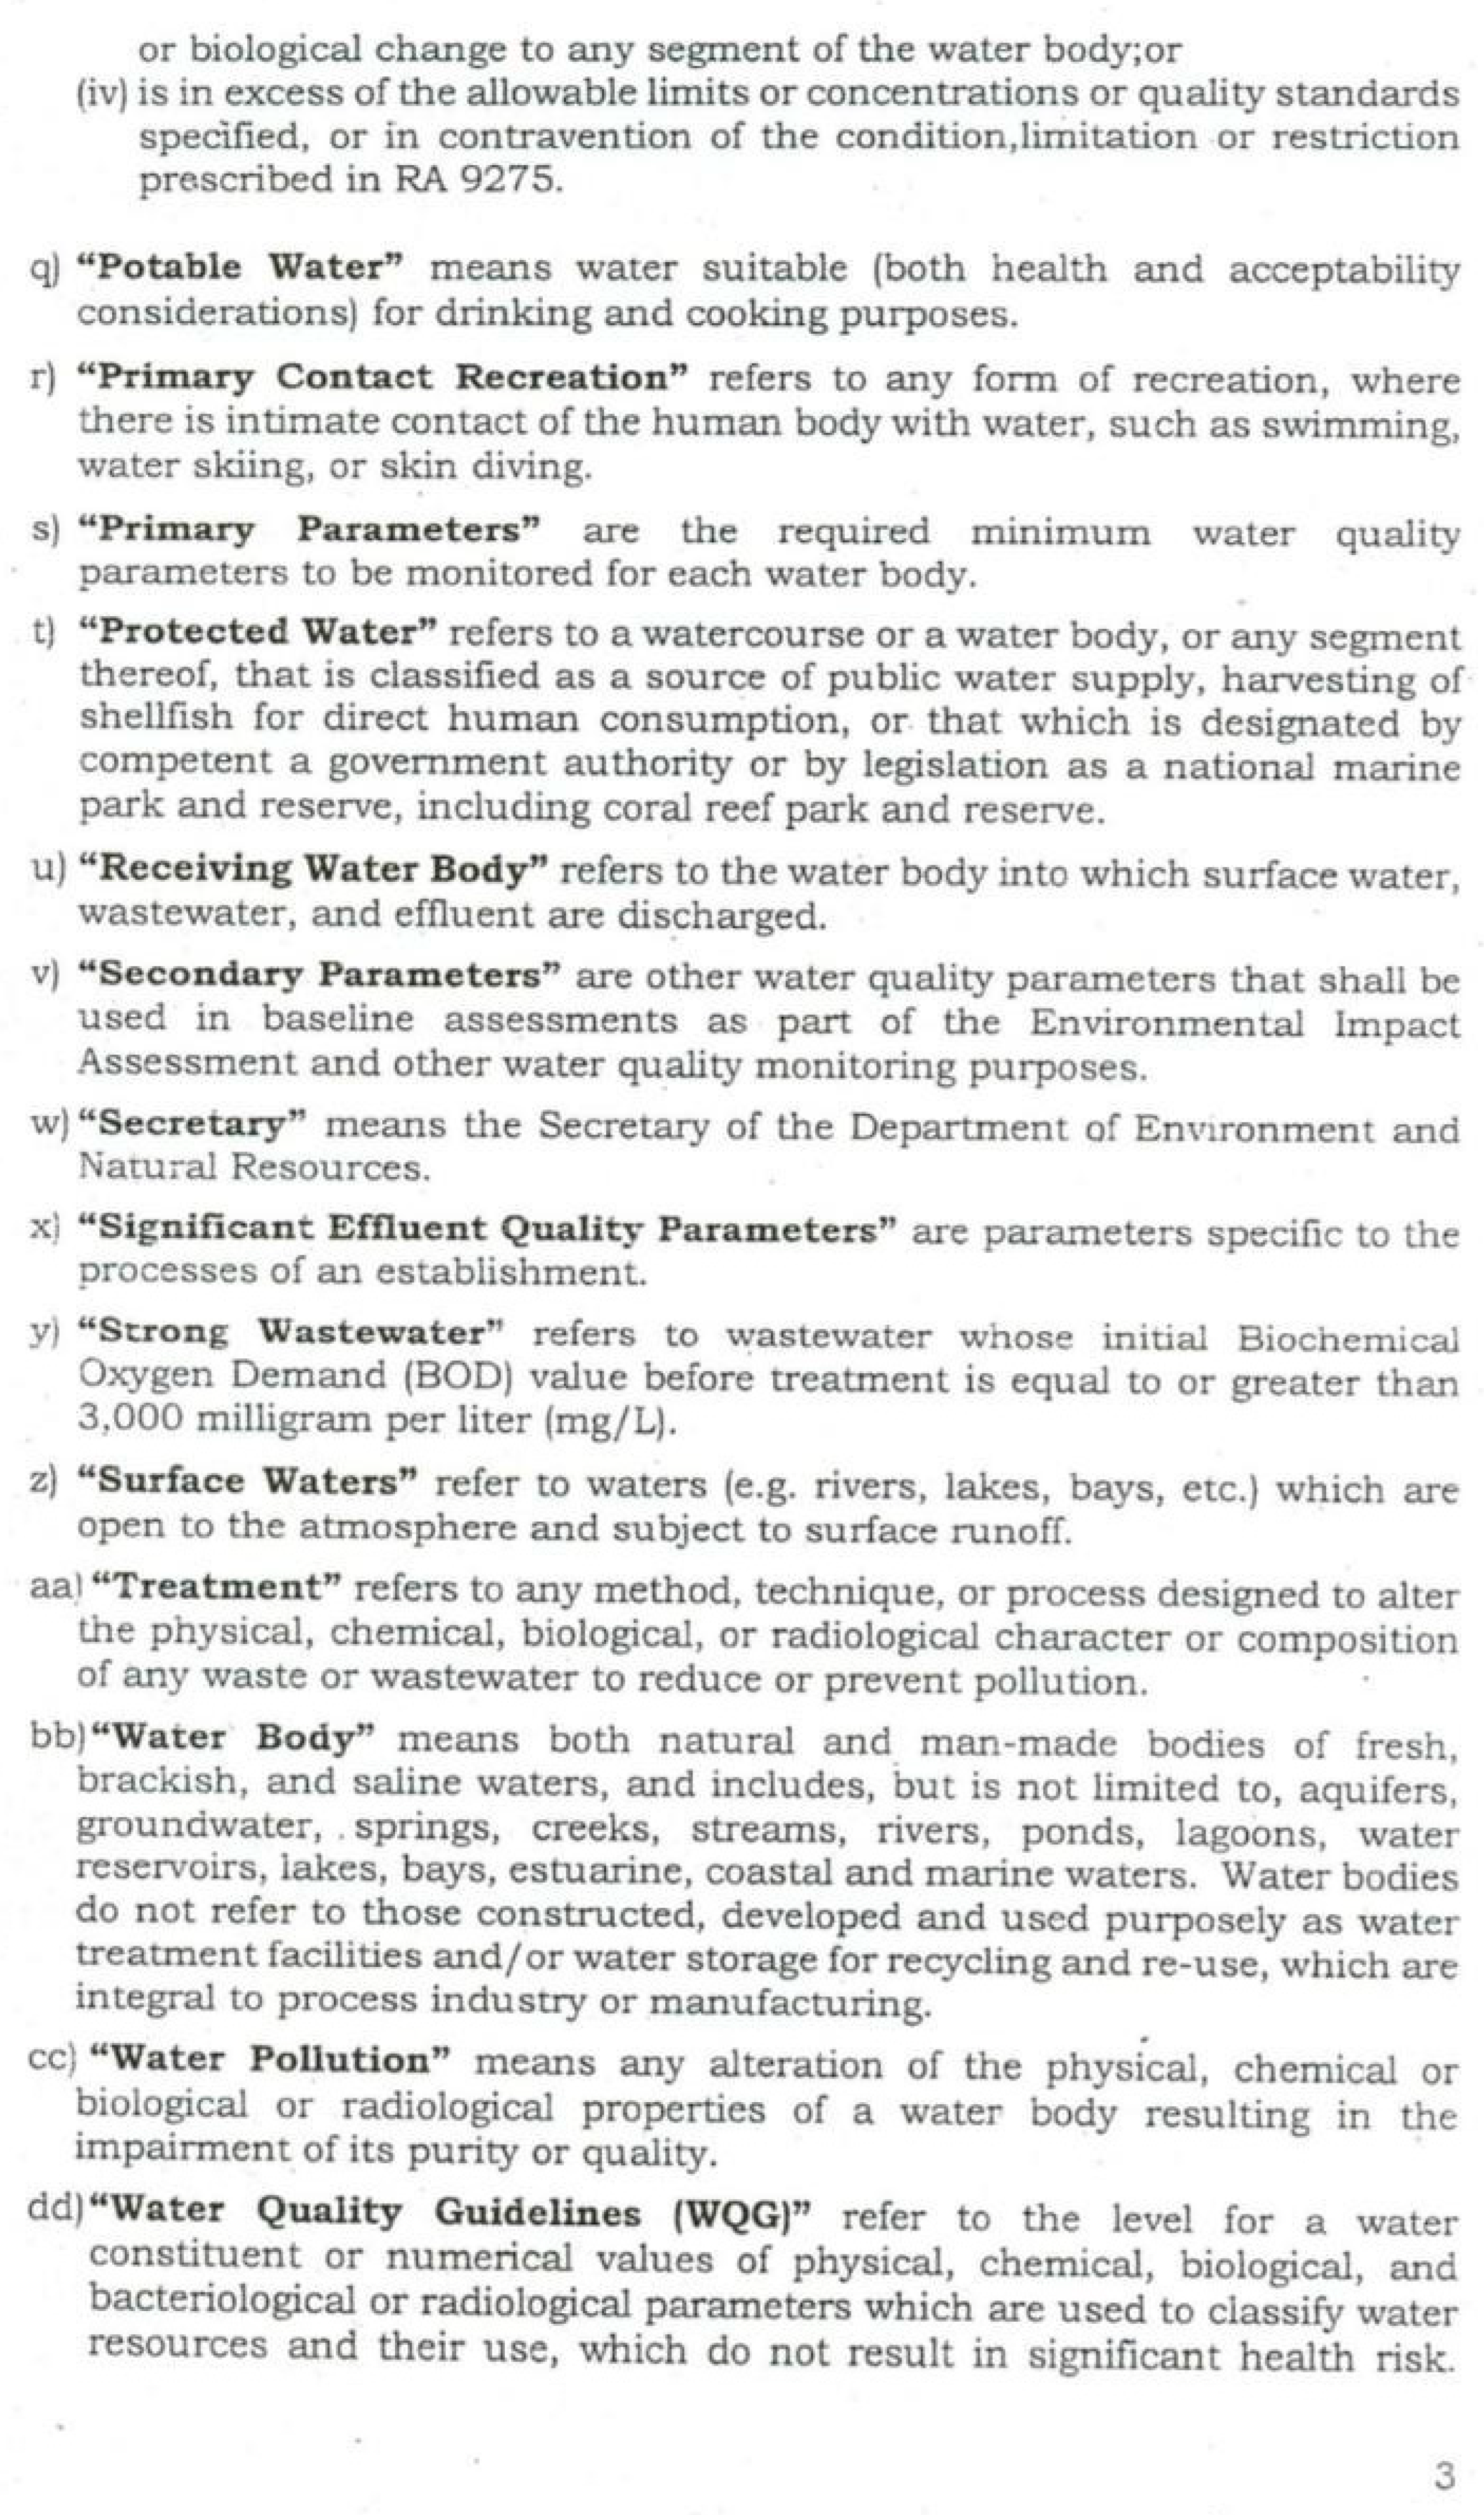
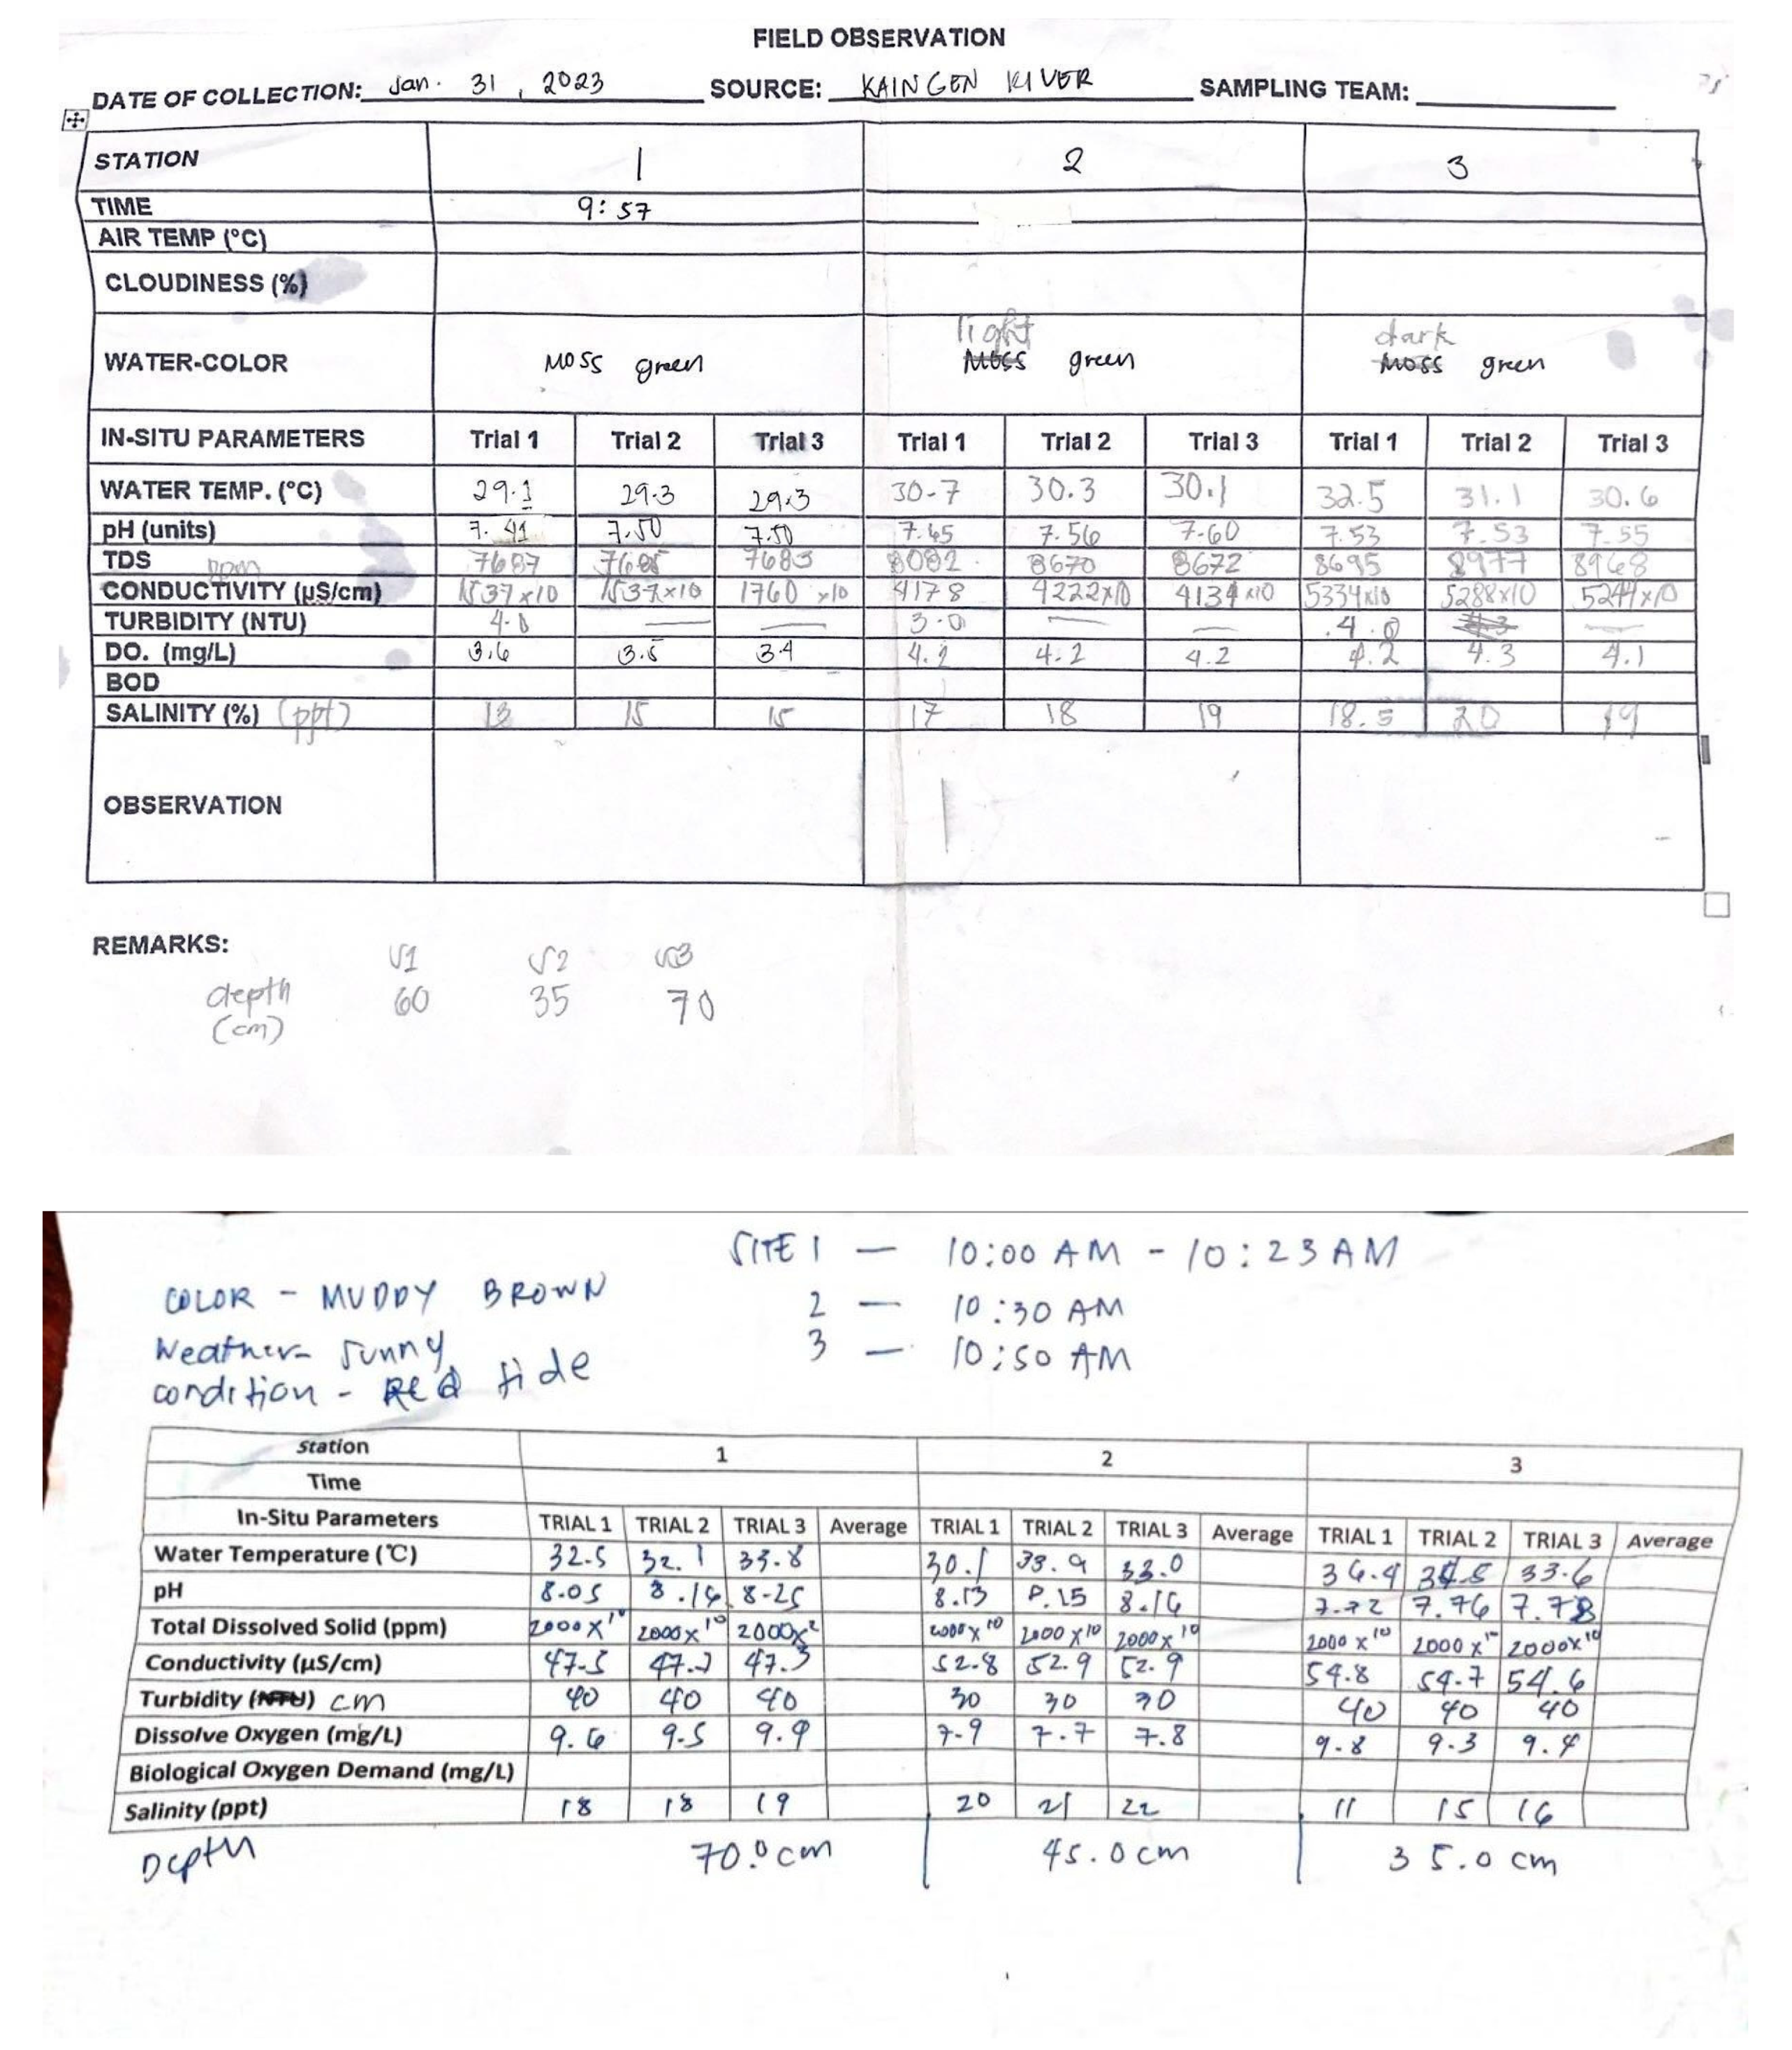
The samples of water were collected using grab and composite sampling methods following the standard procedure of Department of Environment and Natural Resources Administrative Order (DAO) No. 2016-08, entitled “Water Quality Guidelines and General Effluent Standards of 2016” and DAO No. 2021-19, entitled “Updated Water Quality Guidelines (WQG) and General Effluent Standards (GES) for Selected Parameters”. Grab
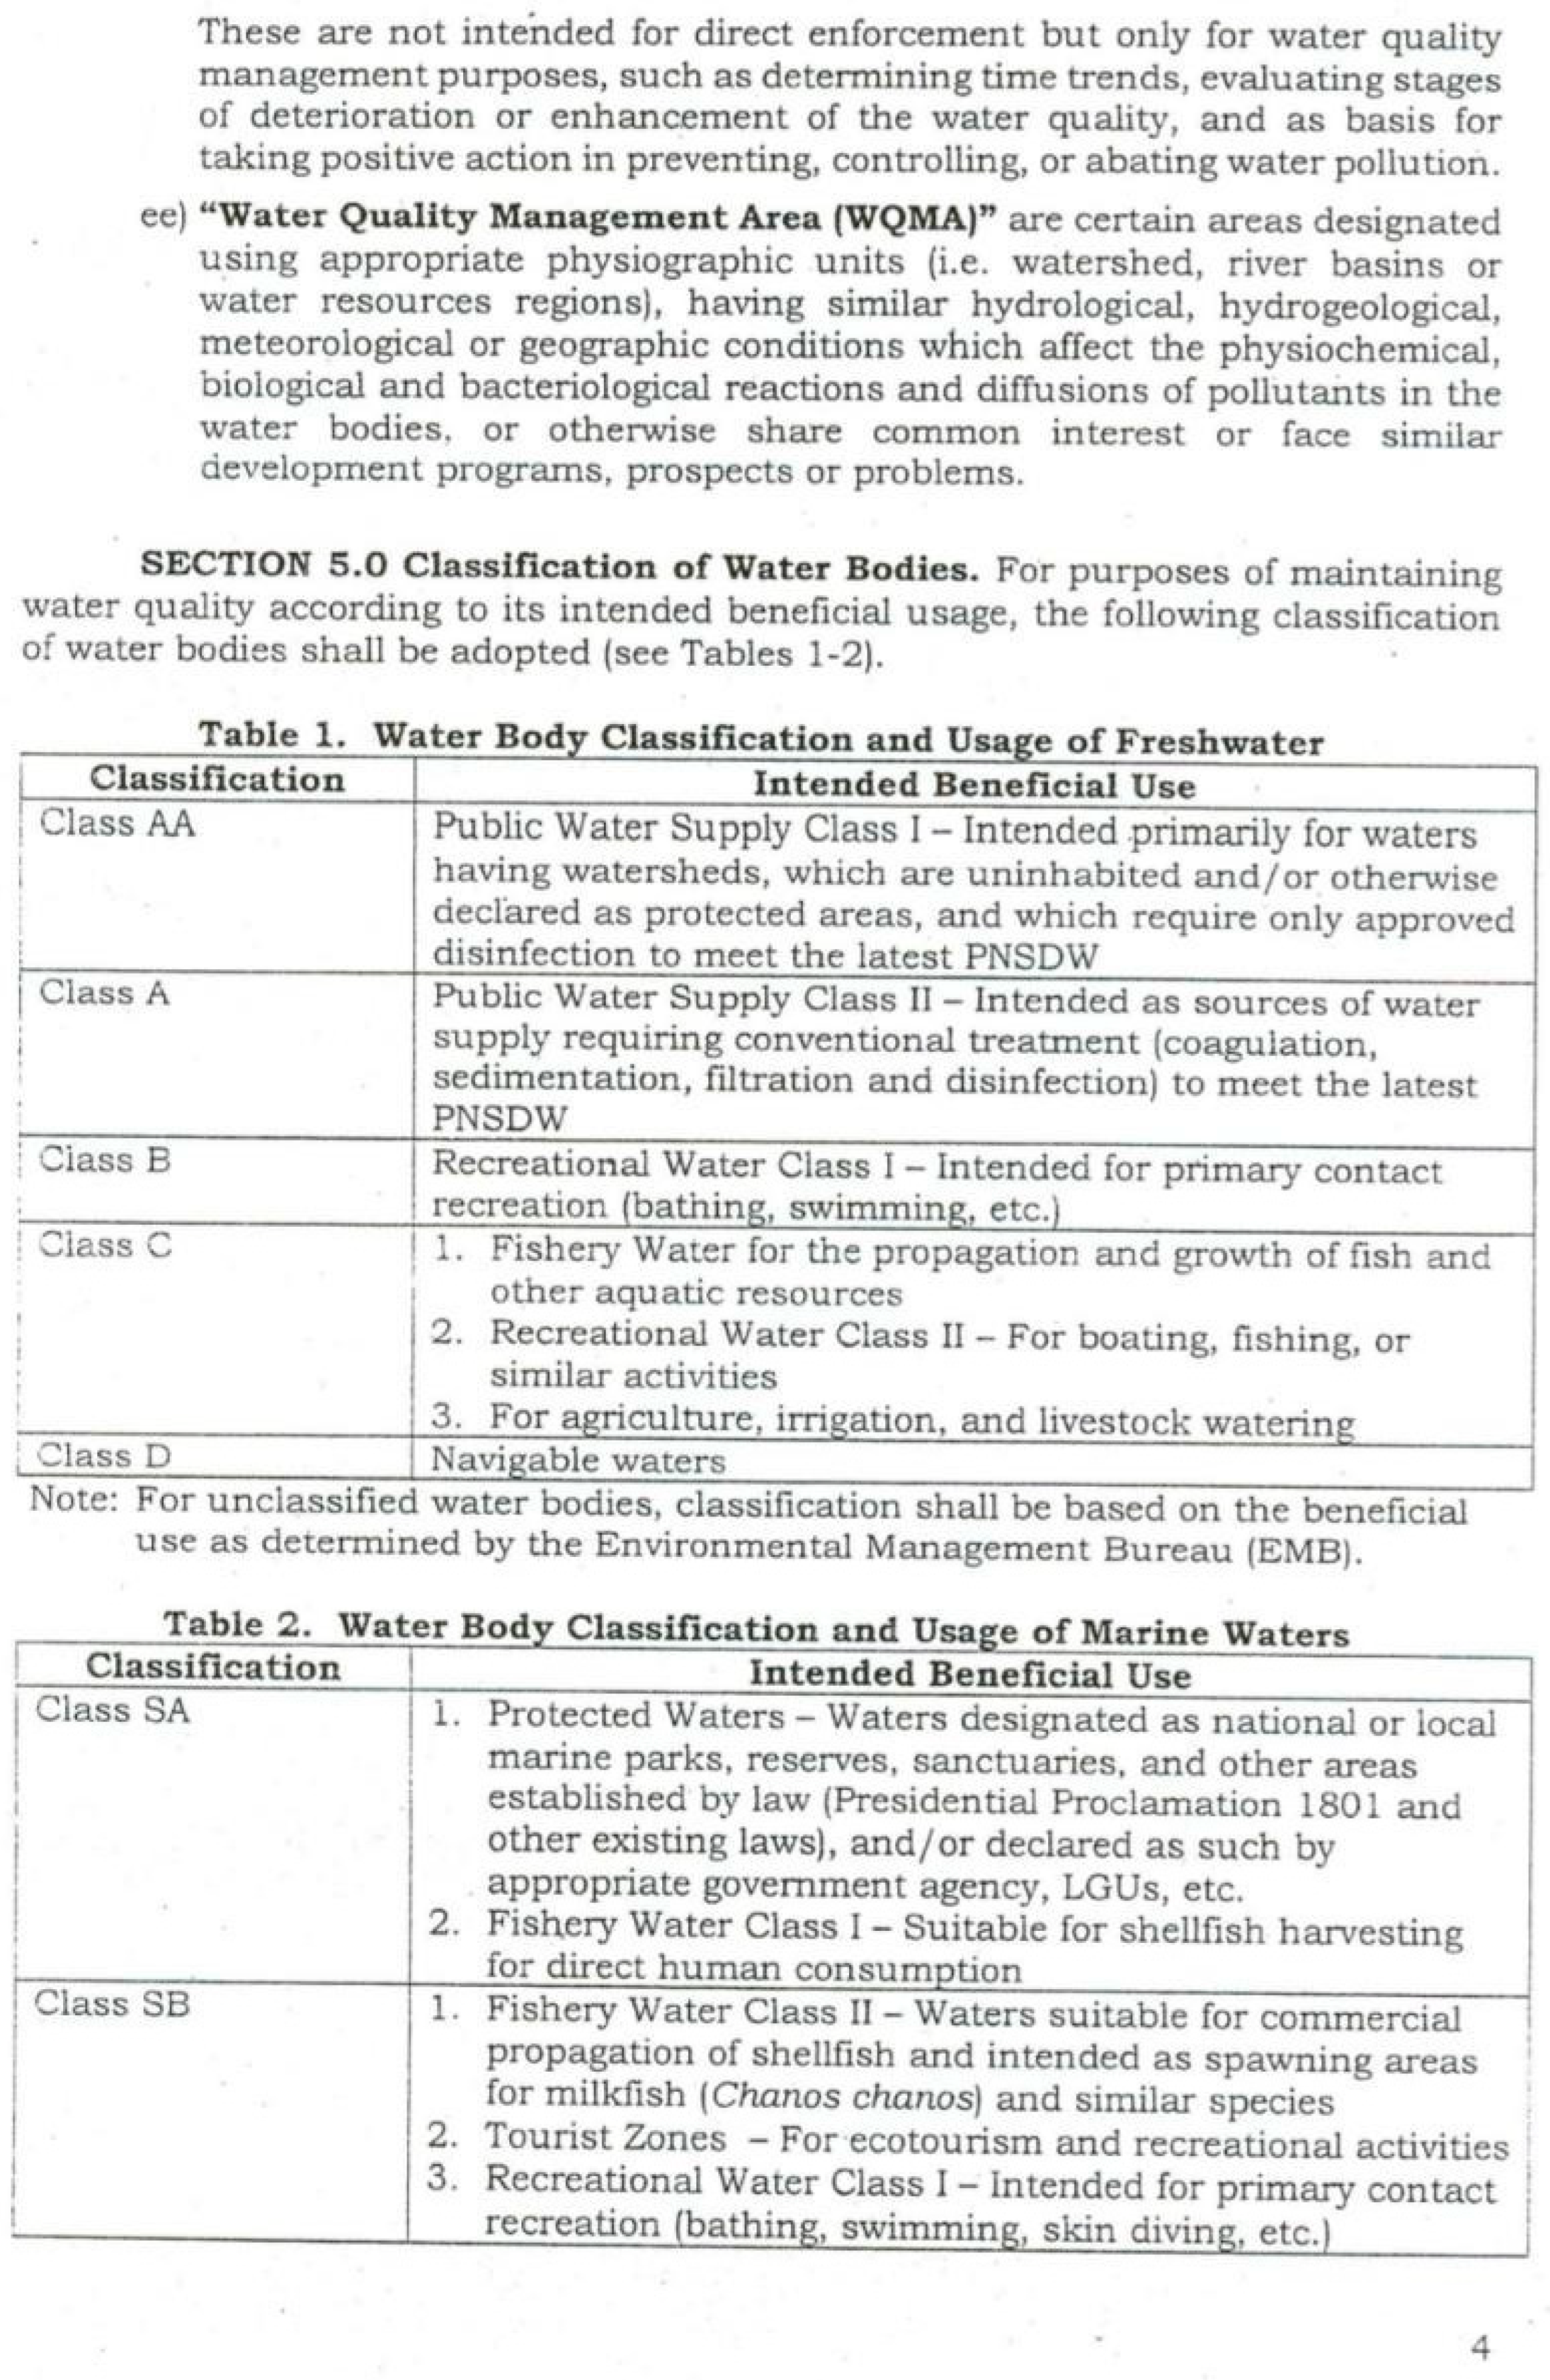
samples of some physicochemical parameters were measured in-situ such as temperature, turbidity, total dissolved solids (TDS), salinity, pH, and dissolved oxygen. At the same time, composite samples of phosphates and nitrates were sent to the laboratory for analysis. The water body classification of the three sites in the sampling location was categorized as Class C, which is intended for beneficial use for fish growth and propagation, including other aquatic resources as well as Recreational Water Class II.

3.2.1. Temperature

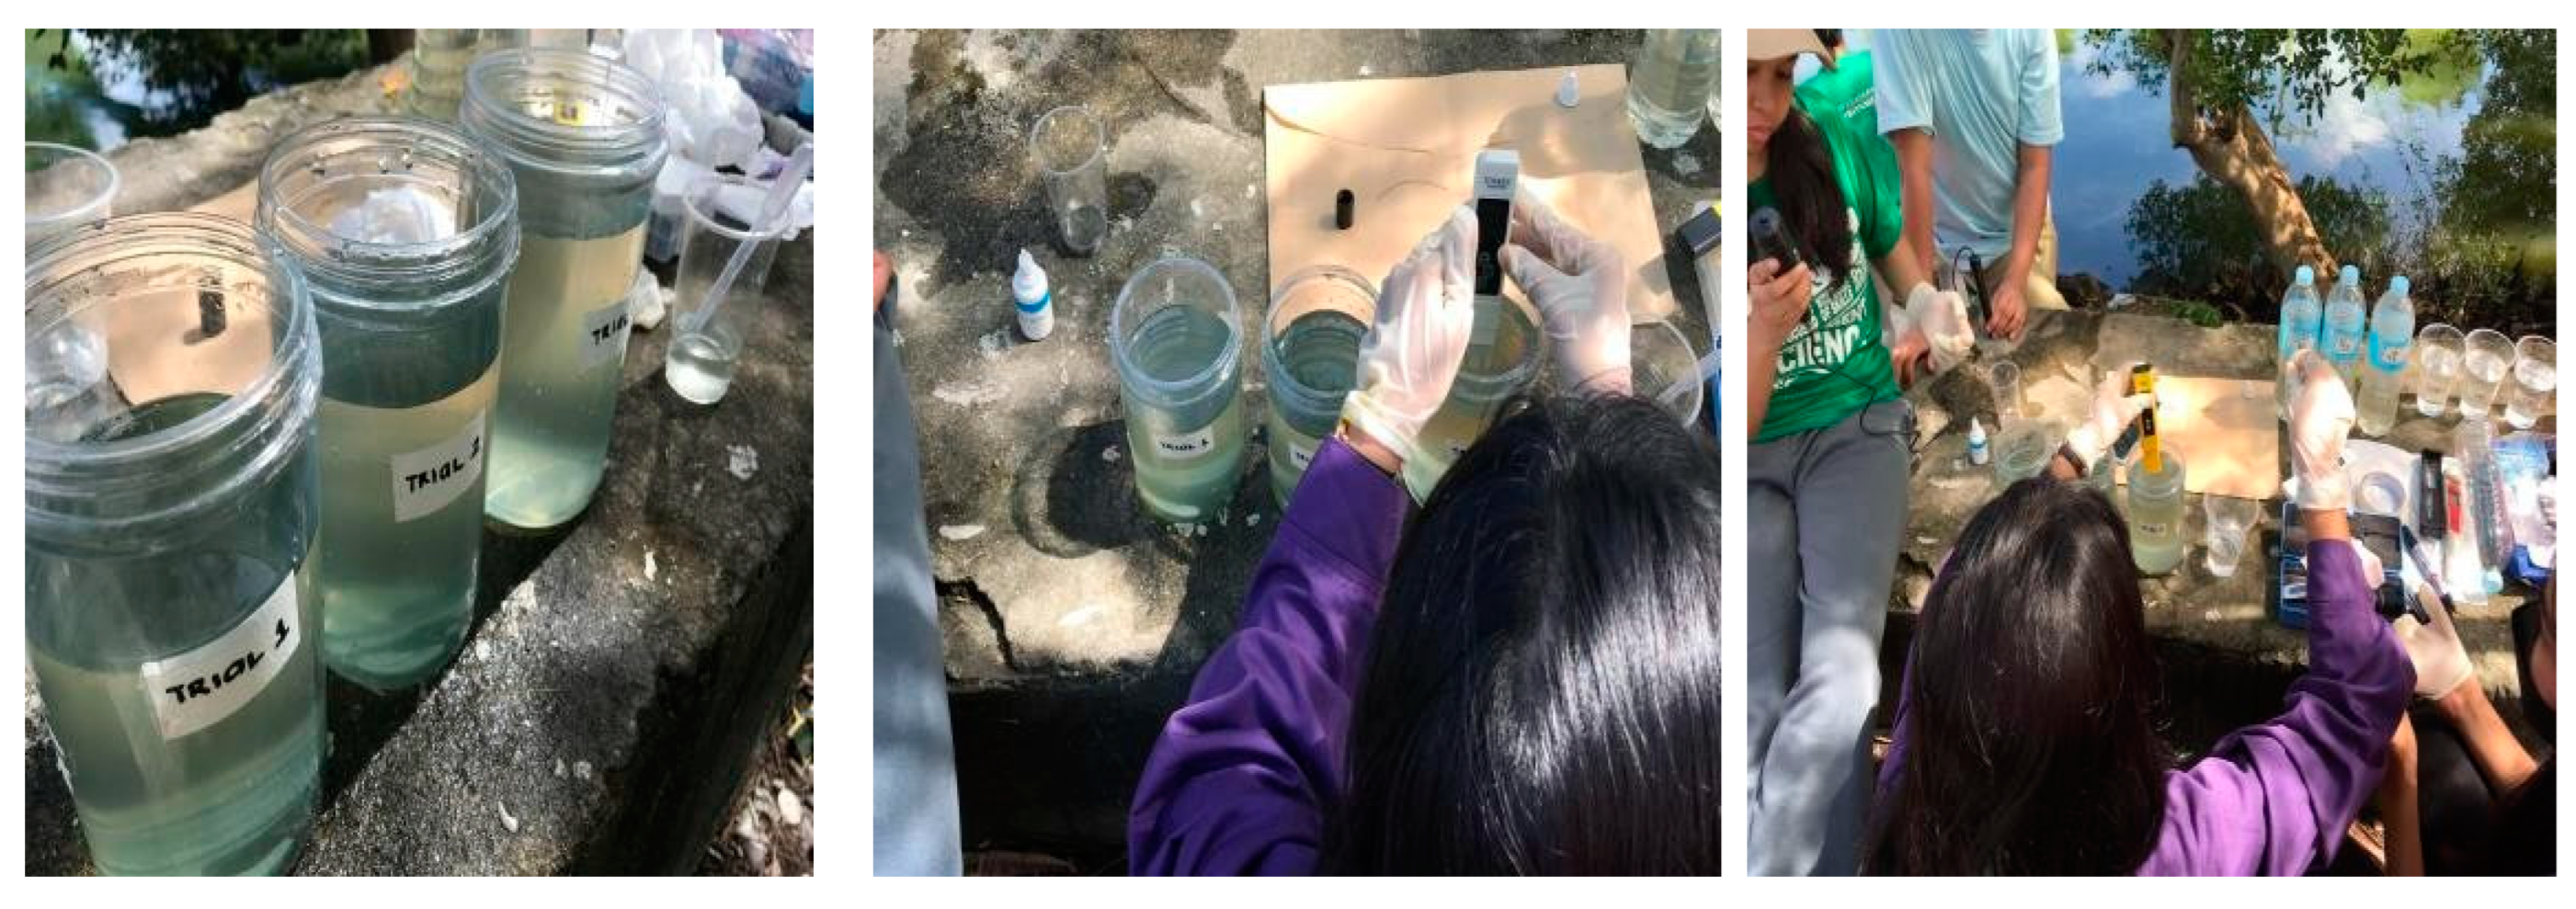
The temperature was measured on-site using a laboratory thermometer. It was done in triplicates and the average was computed and recorded.

3.2.2. Turbidity

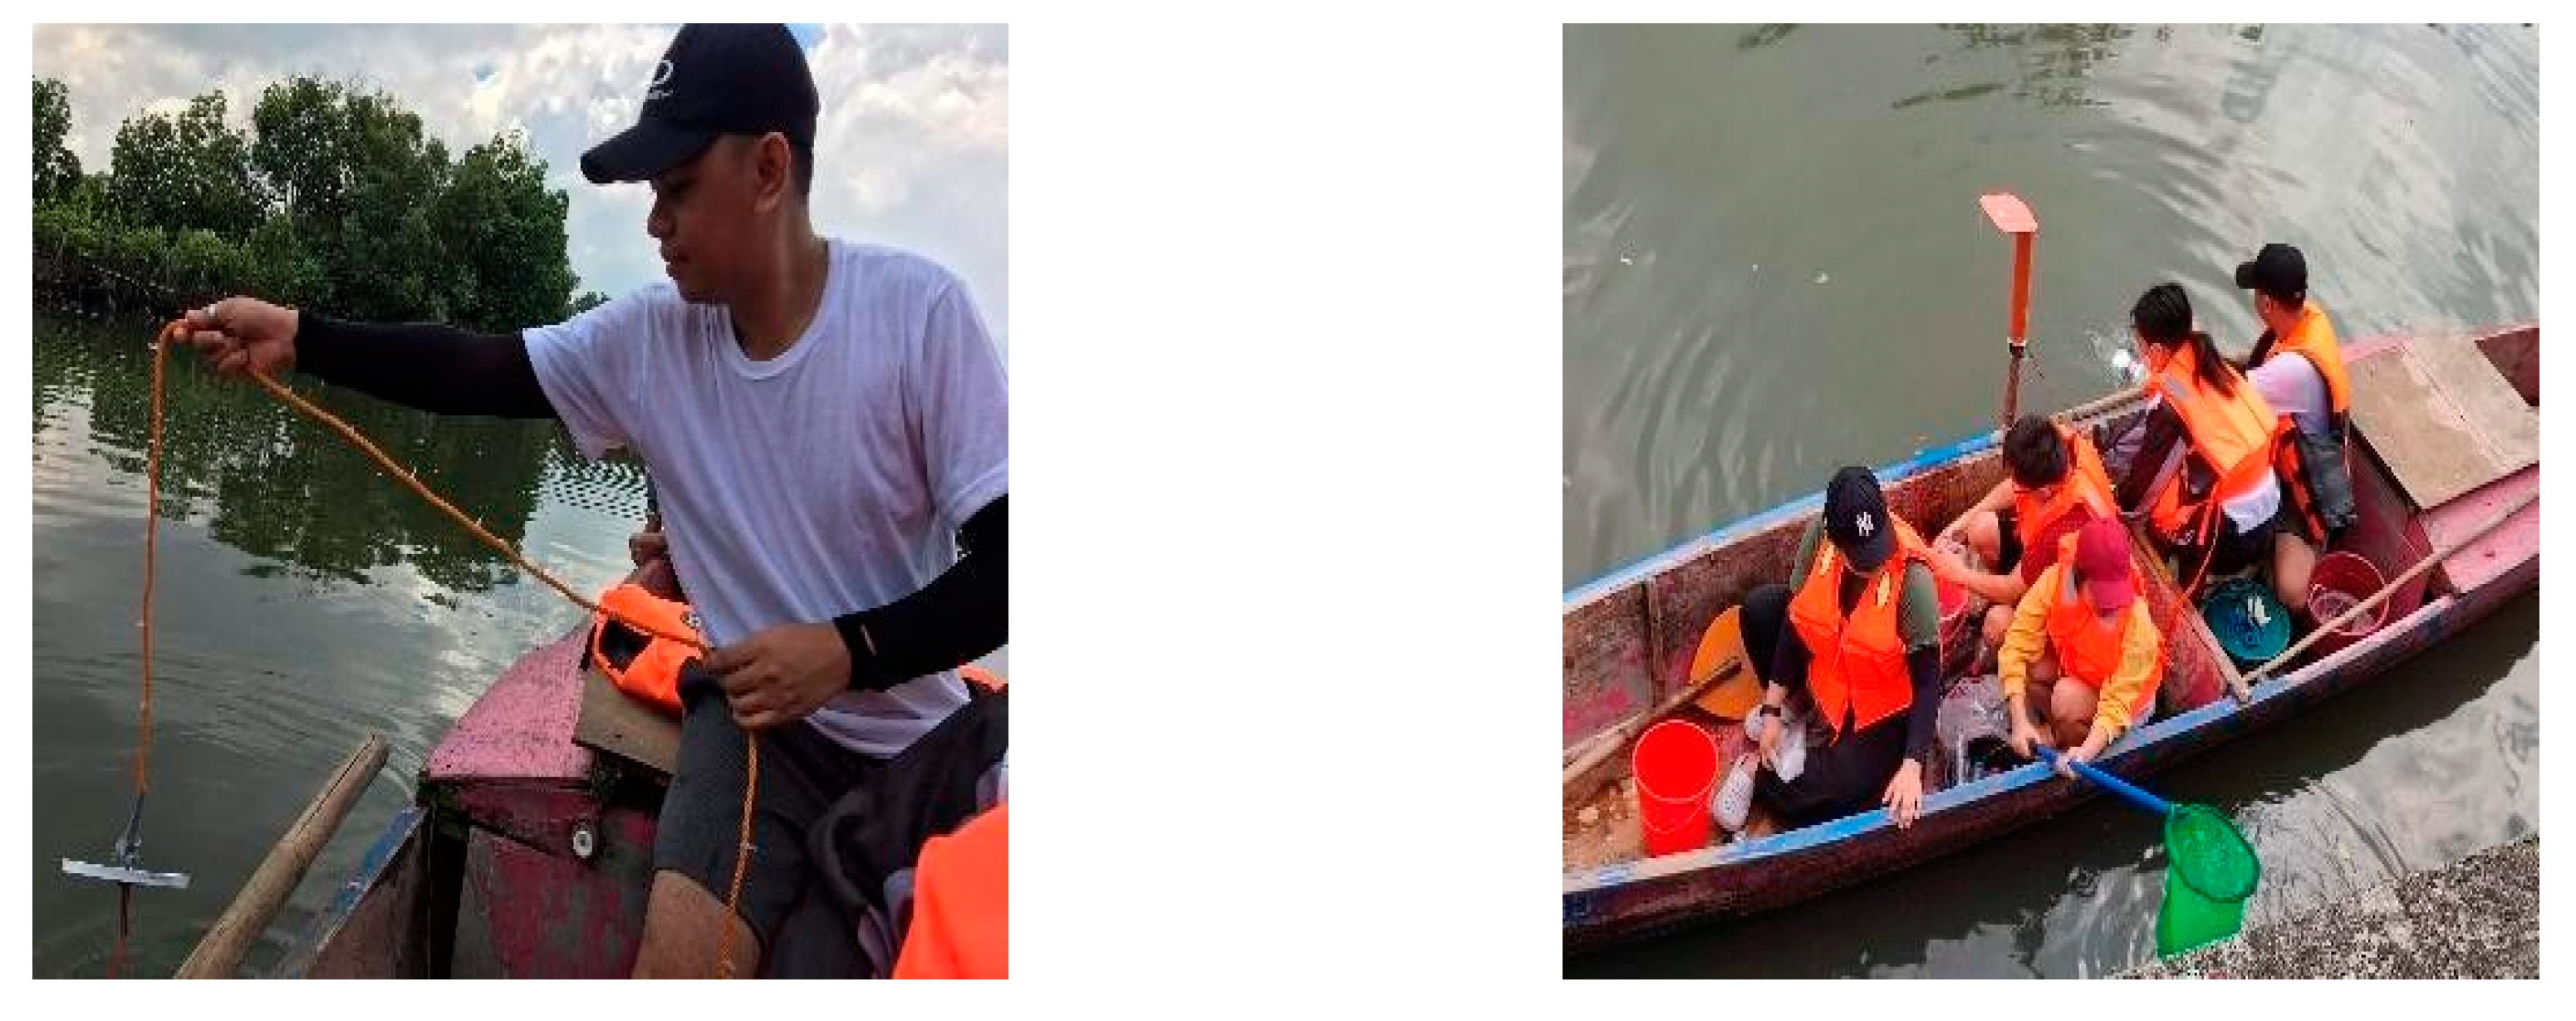
The turbidity of the sample was measured using a calibrated Secchi disk. The Secchi disk was submerged in water until it was barely visible. The measured turbidity in centimeters (cm) was converted into Nephelometric Turbidity Unit (NTU). The NTU measurement for turbidity was obtained using the turbidity conversion chart from cm to NTU wherein there was a designated NTU measurement for a certain depth range in cm (Irvine, 2017). On the other hand, the total depth was calculated using a tape measure.

3.2.3. Total Dissolved Solids (TDS)

Total Dissolved Solids or TDS represented the concentration of the dissolved organic and inorganic substance that was presented in water with a unit of milligrams per liter (mg/L). Using a TDS Meter, the tester probes were submerged in the water until the meter was stabilized, then the results were recorded. The concentration for TDS was calculated using the measured value of conductivity in µS/cm with a formula: TDS = 0.65 x EC.

3.2.4. Salinity

The sample's salinity was measured with the HRS28-T salinity meter. It was calibrated with distilled water based on the instructions provided in the manual. 2- 3 drops of the liquid sample were placed on the prism, and covered with the cover plate to spread the sample until no air bubbles were present. After 30 seconds, the results were seen through the eyepiece of the salinity meter. The initial value from the salinity was calculated using the measured value of conductivity in µS/cm with a formula: Salinity = 0.50 x EC.

3.2.5. Conductivity

The conductivity of the water samples was determined using a probe and a meter. The water sample was tested by submerging the probe with two electrodes, wherein a voltage was applied across them. In addition, micro-Siemens per centimeter (µS/cm) is the fundamental unit of conductivity measurement. According to Rusydi (2018), the measured value for conductivity was used to determine the value of salinity and TDS.

3.2.6. pH

The pH of water indicates the basicity or the acidity of the aquatic environment. The scale ranges from 0 to 14, with pH 7 being neutral. A pH below 7 infers that the sample is acidic, while a pH above 7 indicates the basicity of the sample. The pH is an essential indicator of a chemical change occurring in water because chemicals in water can affect it.
The pH meter was calibrated using three buffer solutions (4.0, 6.86/7.00, and 9.18/10.0). The pH was determined using a pen-type pH meter. The cap of the meter was removed before its usage, then turned on. The probe was dipped into the samples for two minutes, then the hold button was pressed when the reading stopped. The procedure was repeated for two (2) more trials.

3.2.7. Dissolved Oxygen (DO)

A bottle covered with black cartolina paper and the electrical tape were used for the DO/BOD bottle. The DO meter was used to measure the dissolved oxygen concentration present in the water, then was recorded.

3.2.8. Phosphates and Nitrates

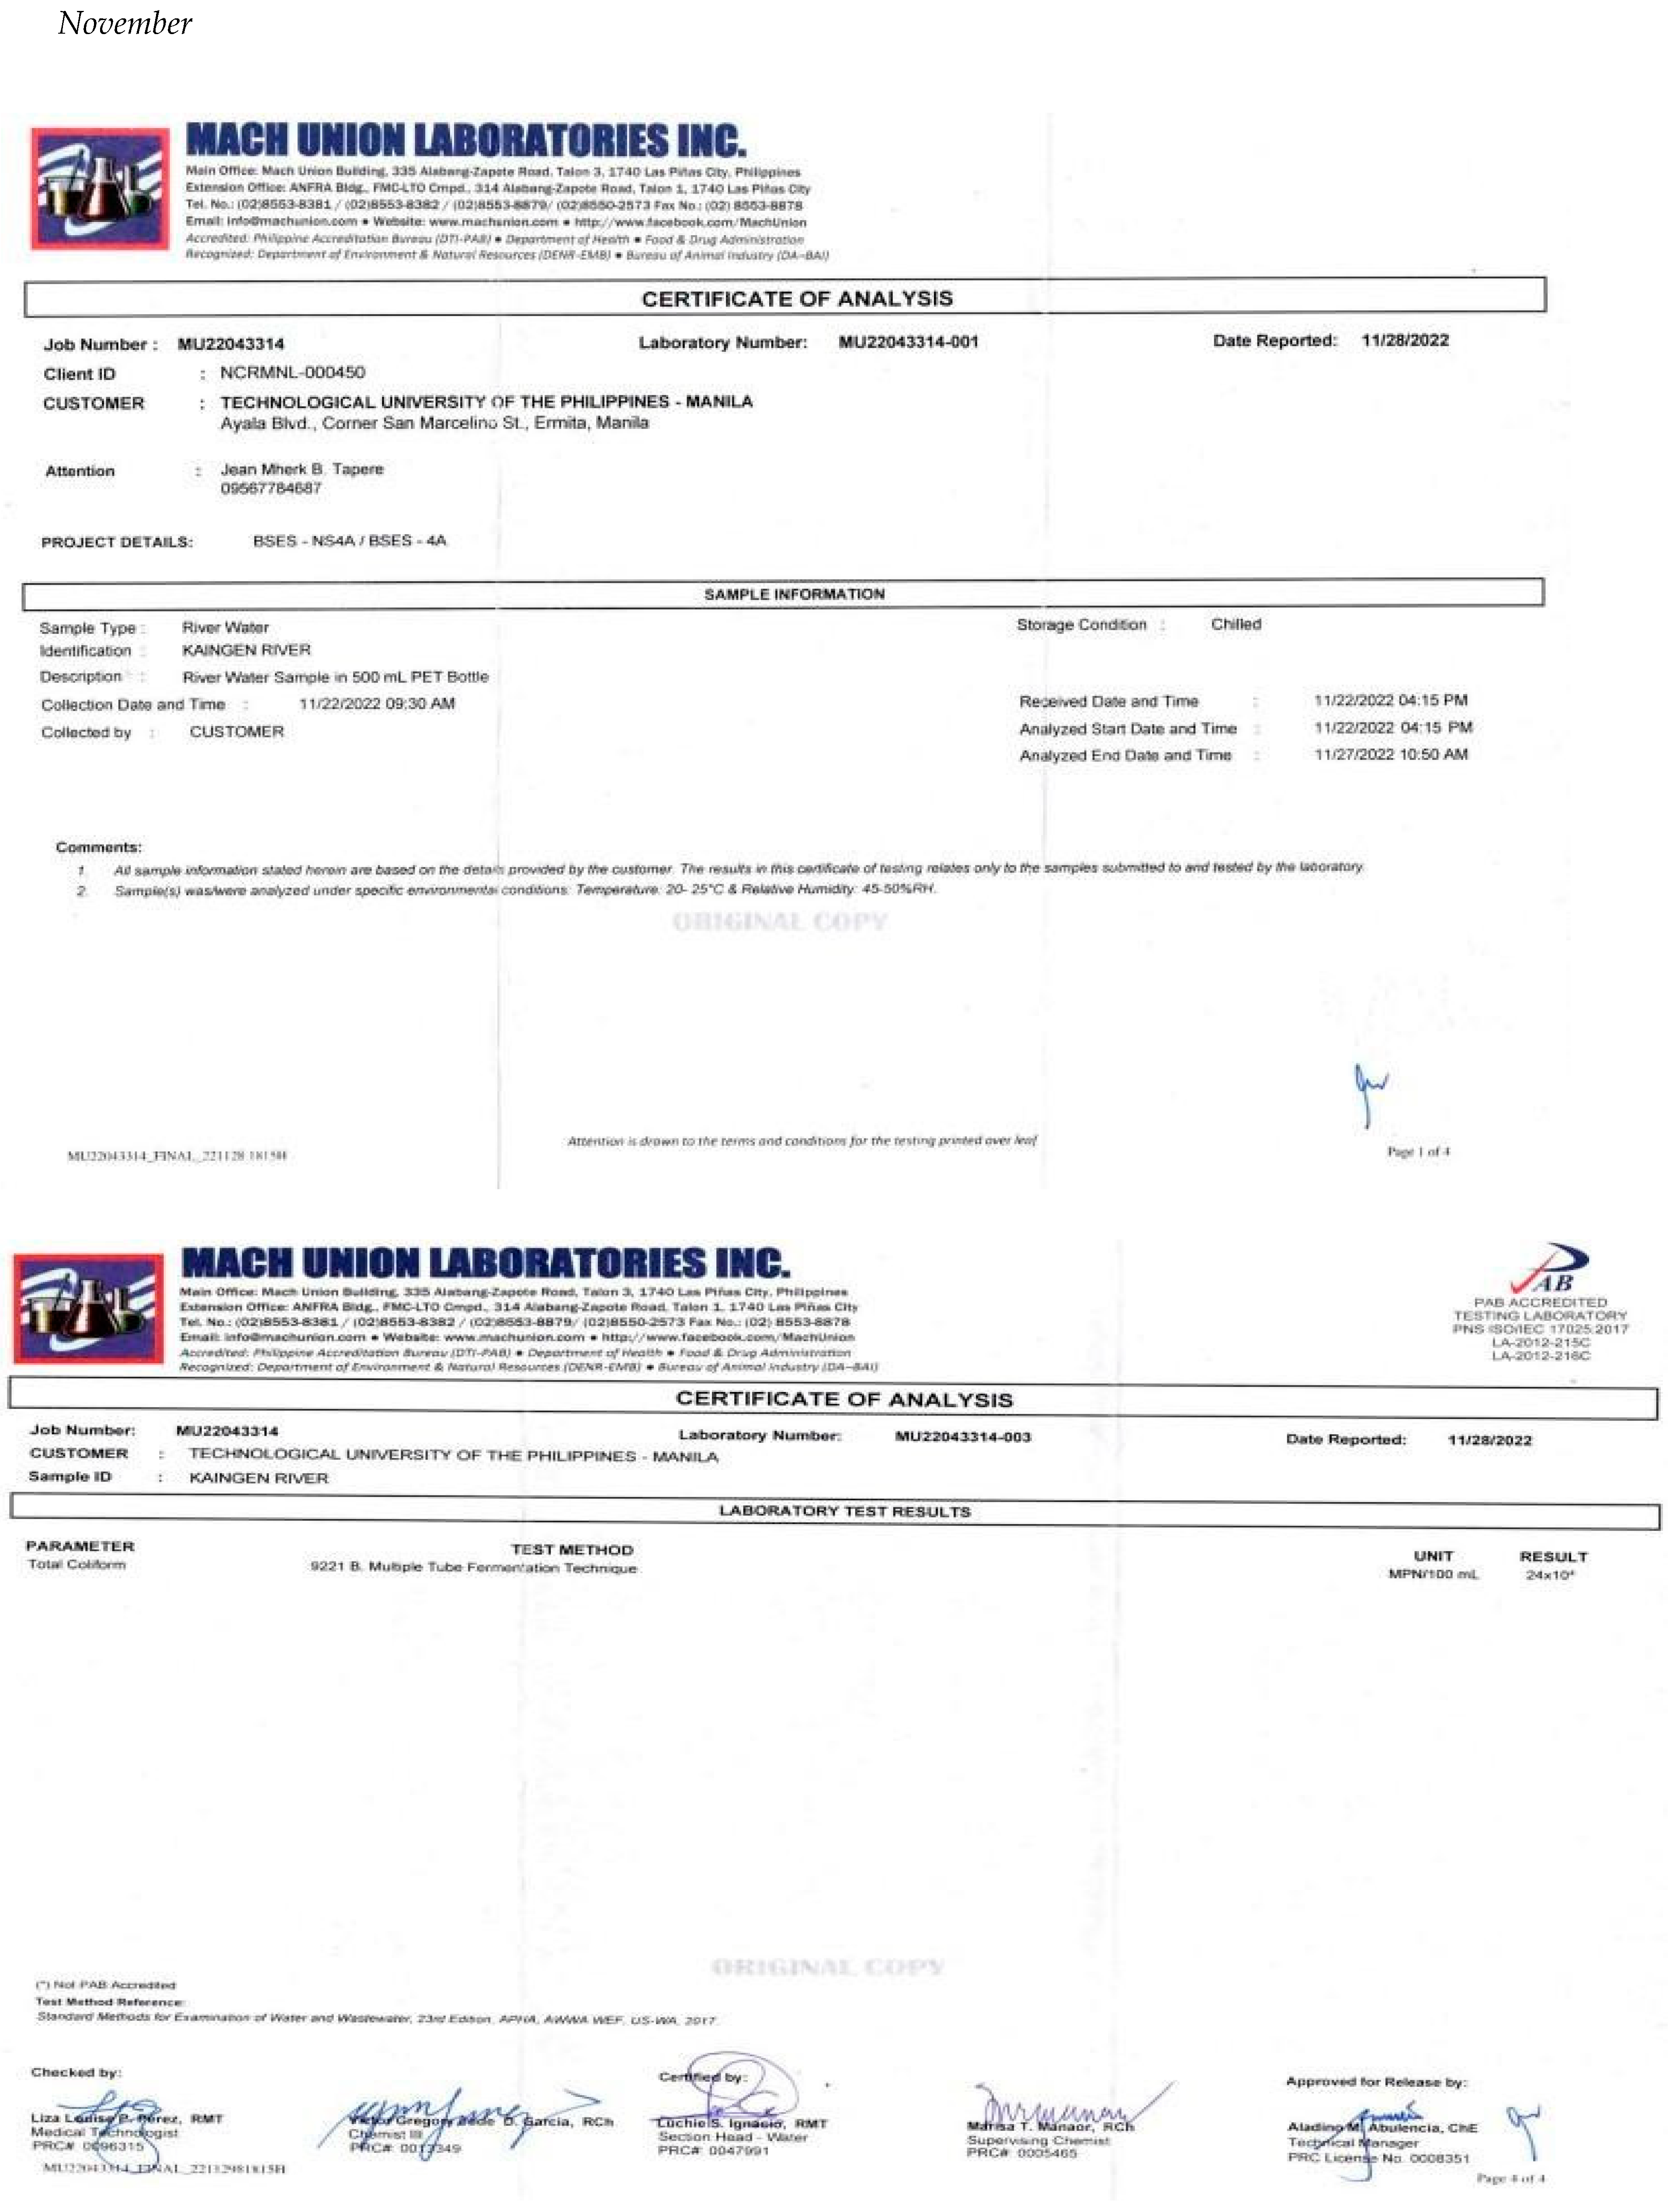
The water samples for Nitrate and Phosphate testing were transported and analyzed at the Mach Union Laboratory. The reference material for laboratory testing was the Standard Methods for Water and Wastewater, 23rd edition, and Methods for Chemical Analysis of Water and Wastes.
The standard method used for nitrates was the Brucine Method of Colorimetric Method, and nitrates (NO3-) concentration was analyzed using UV- Vis Spectrophotometer. On the other hand, the standard phosphates (PO₄³⁻) method was the Stannous Chloride Method of the Colorimetric Method and was analyzed using UV-Vis Spectrophotometer.
For nitrates, the pH sample was changed with acetic acid (pH 6.7) or sodium hydroxide (pH 6.8) to get it to about 7. Then, 10 mL of standards and water samples were added to the sample tube with a pipette. After that, a 10.0 mL solution of sulfuric acid was added with a pipette into the tube and swirled. 0.5 mL of brucine- sulfanilic acid reagent was poured into each tube and carefully swirled it. The tube rack was put into a 25-minute water bath reaching 100°C. Afterward, the tube rack was taken out of the water bath and was put in a cold-water bath and waited until the temperature reaches the thermal equilibrium of 20–25°C. Lastly, a 1 cm square cuvette was used to measure the absorbance with the blank reagent measuring at 410 nm.
For the preliminary treatment of the sample, a 100 mL sample containing Phosphorus not exceeding 200g was added with 0.05 mL of phenolphthalein indicator. The color development was determined upon the addition of a molybdate
reagent I measuring 4.0 mL and a stannous chloride reagent measuring 0.5 mL into the sample accompanied by careful mixing every time a reagent was added. Samples, standards, and reagents were held within 2°C of one another at the temperature that ranged from 20°C to 30°C. For color measurement, it was measured photometrically at 690 nm after 10 minutes upon positioning into the spectrometer but not exceeding 12 minutes. The result was compared with a calibration curve, using a distilled water blank. (Baird et al., 2017)

3.3. Determining the Water Quality Index
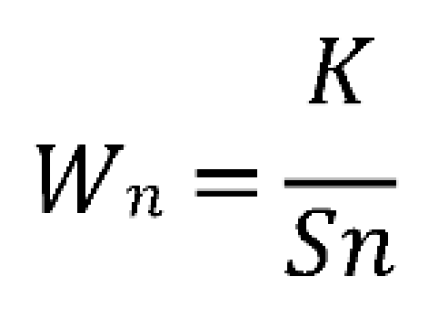
The Water Quality Index (WQI) was calculated with the use of the Weighted Arithmetic Method (Banaag & Velasco, 2021) using Microsoft Excel. The unit weight (Wn) factor of each of the water parameter was :
Preprints 81428 i001
where:
  • K = Proportionality constant; is obtained using the following formula:
Preprints 81428 i002
  • Sn = Standard desirable value of the nth parameters
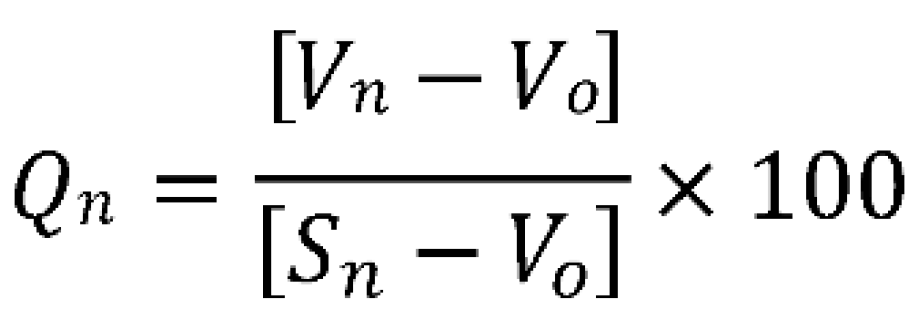
On the totality of all chosen parameters’ unit weight factor, Wn = 1 (unity). After calculating the proportionality constant (K), the Sub-Index (Qn) value was computed using the formula as follows:
Preprints 81428 i003
where:
  • Vn = monthly data of each site per nth parameter
  • Sn = Standard acceptable value of the nth parameter
  • VO = The parameters’ ideal value in pure water
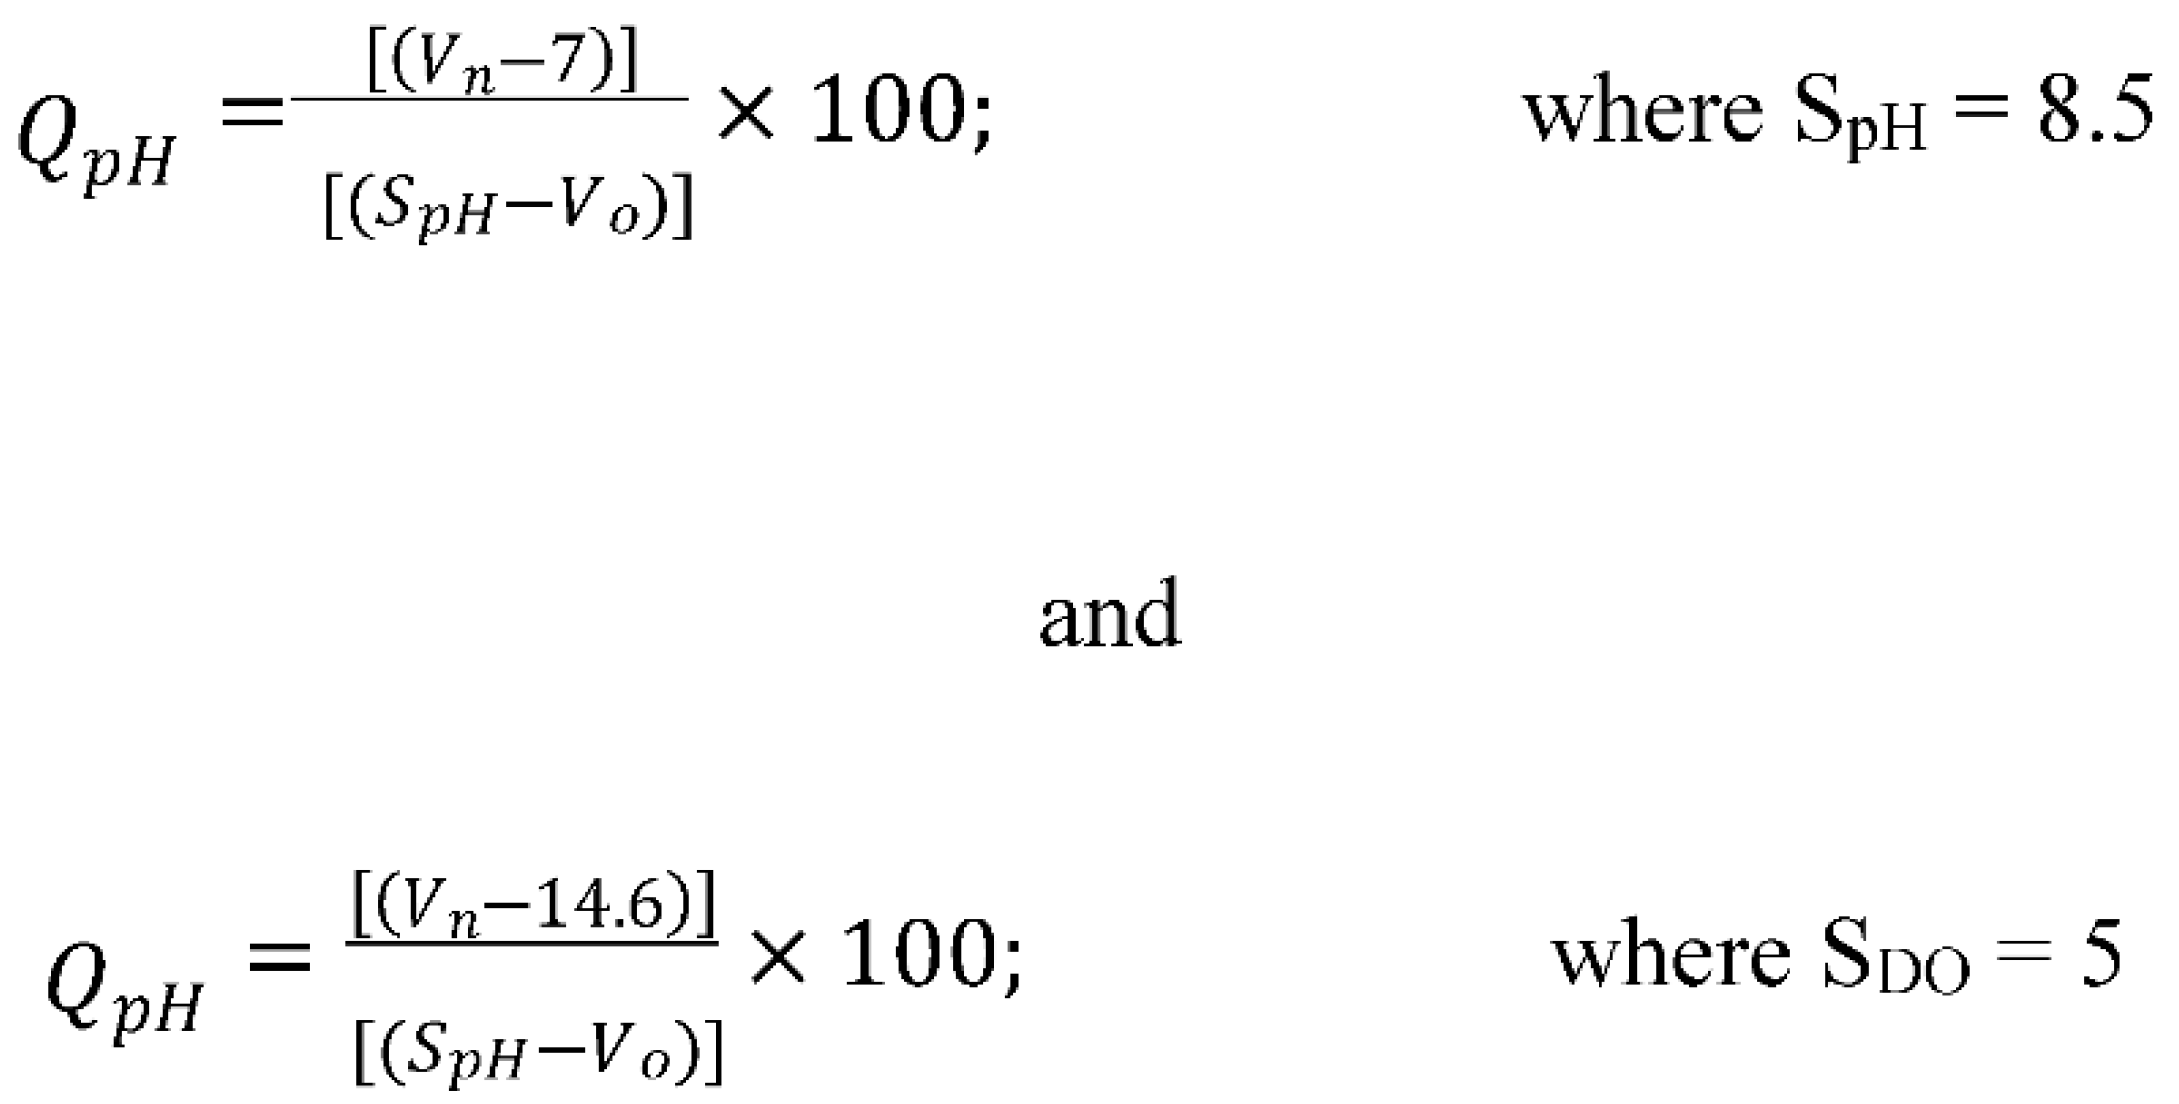
Generally, most of the parameters have actual values equivalent to zero (VO = 0), except for certain parameters such as pH (VO = 7) and DO (VO = 14.6). Therefore:
Preprints 81428 i004
After obtaining the sub-index (Qn) for each parameter, the unit weight per parameter (Wn) was multiplied by the Qn, where the total WnQn of all parameters was calculated before dividing it by the summation of unit weight (Wn) of all parameters
Preprints 81428 i005

3.4. Soil Quality Analysis

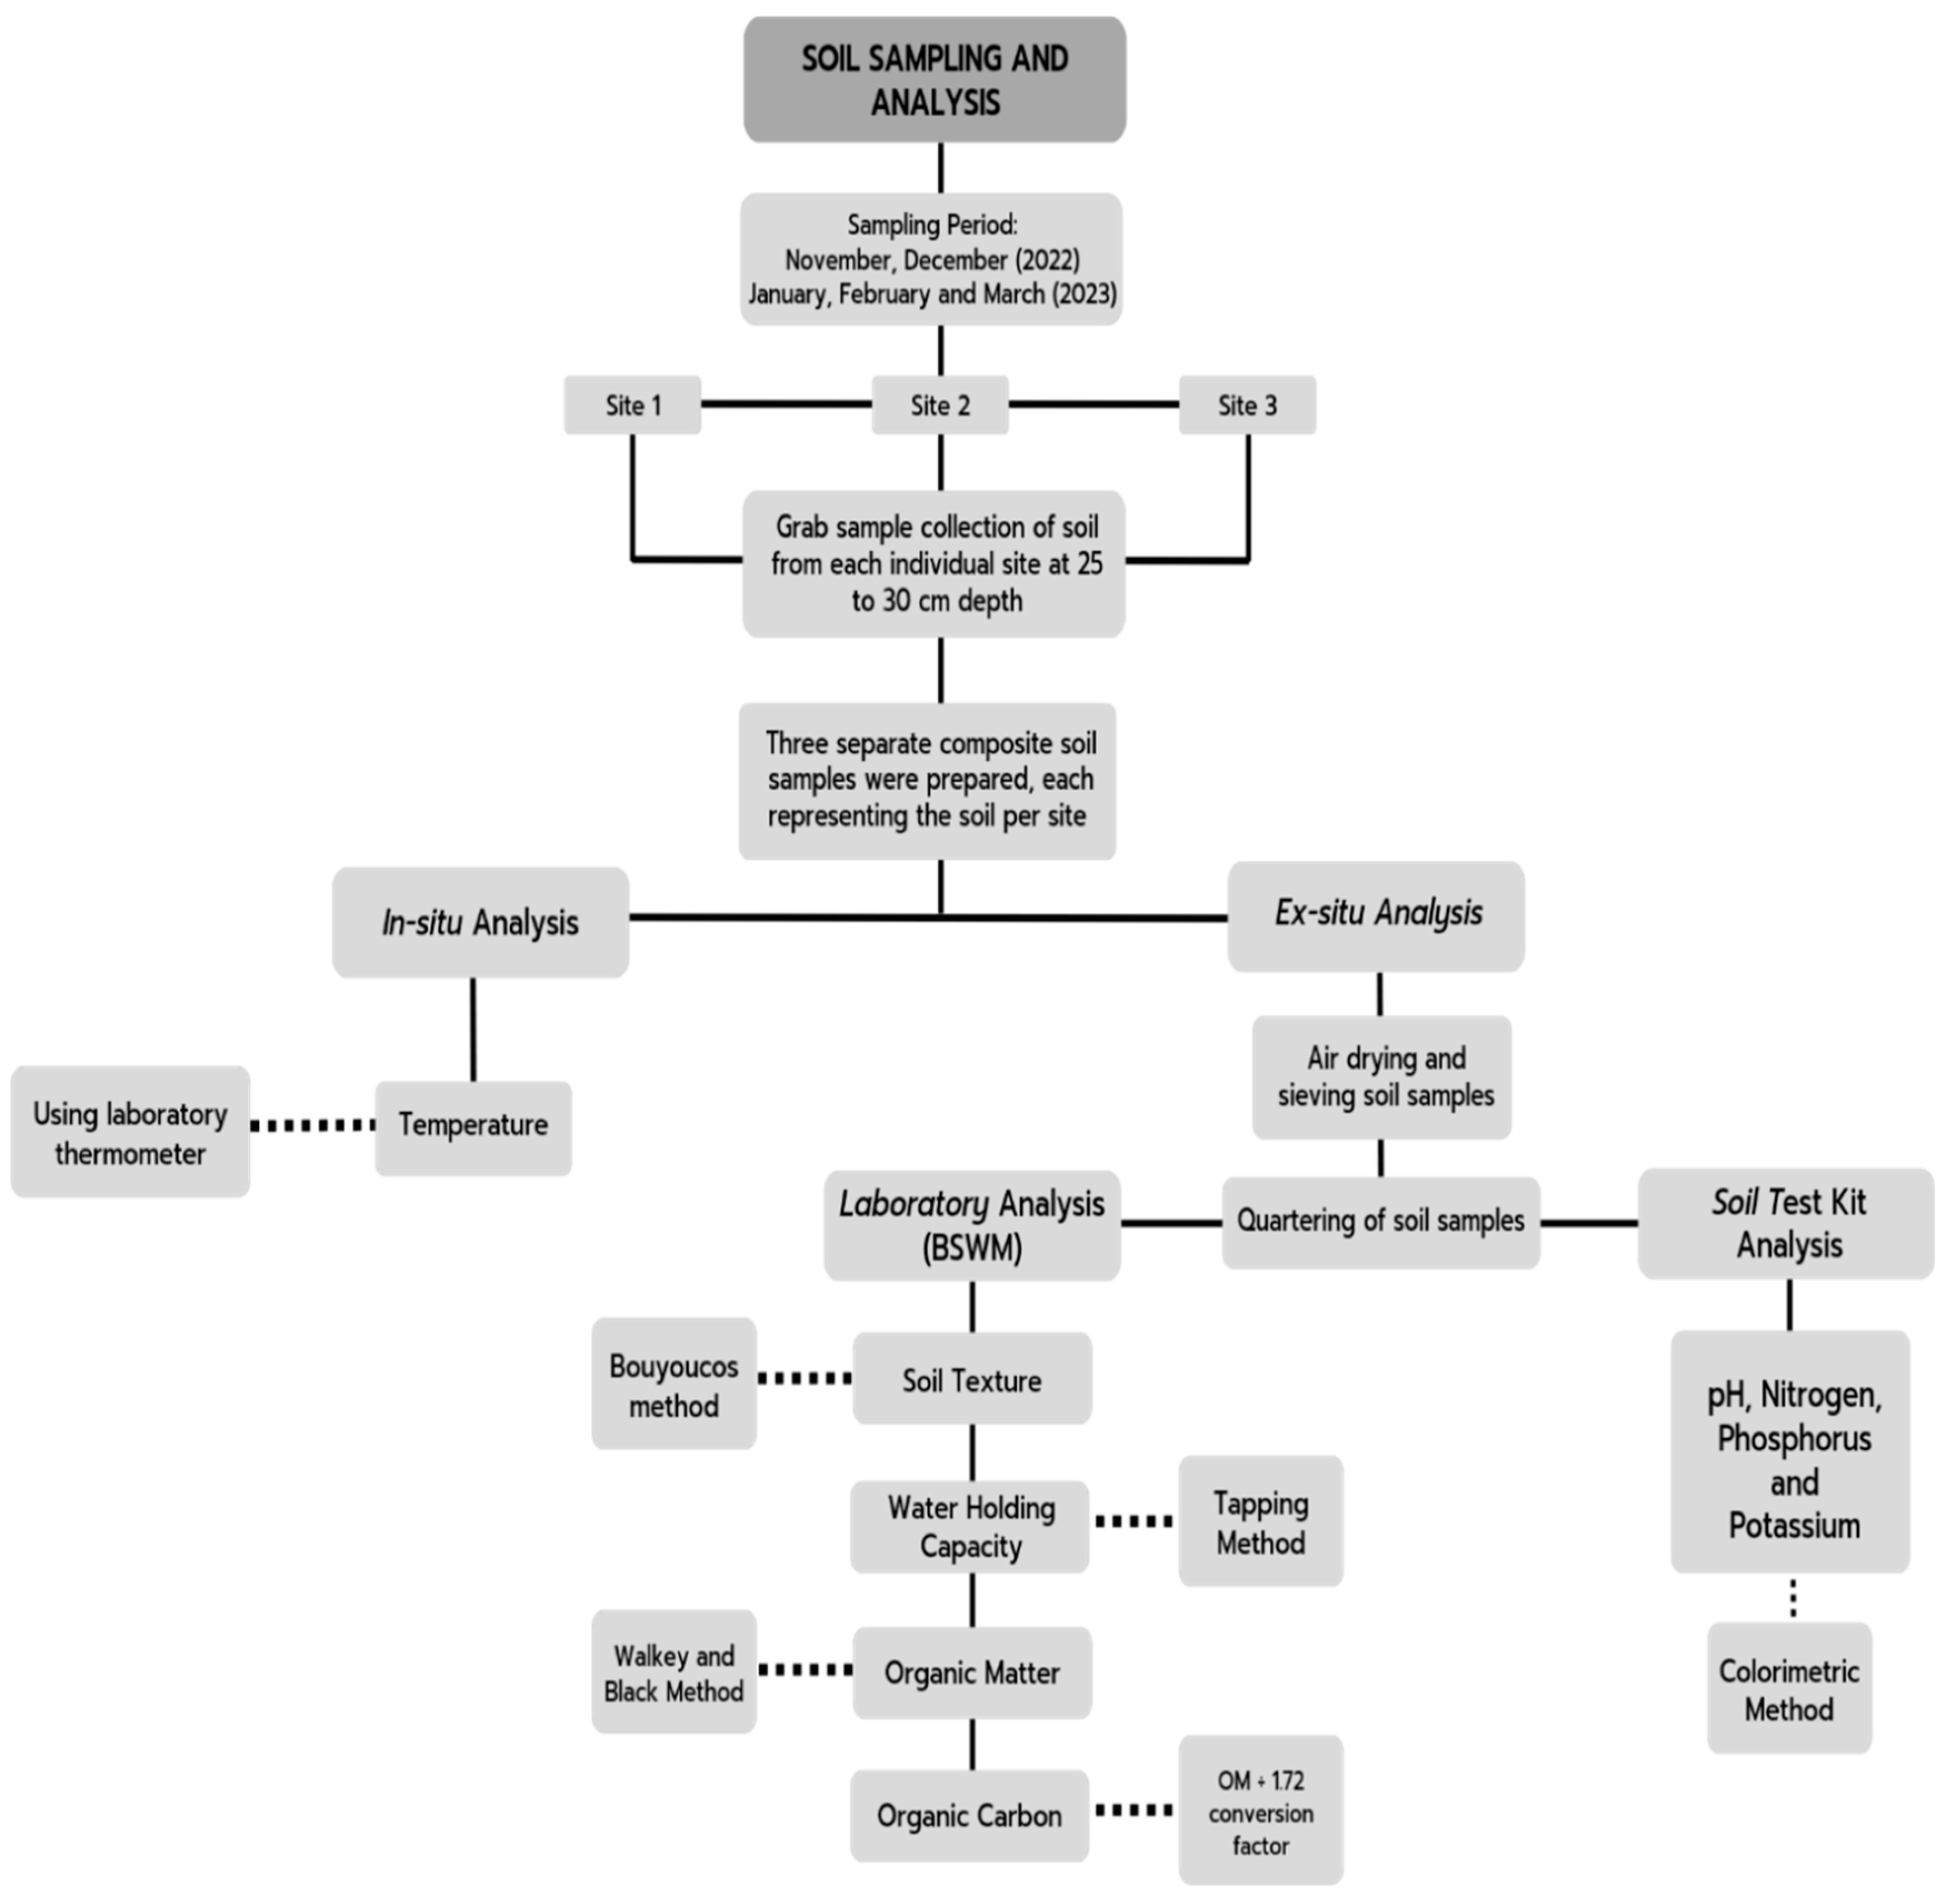
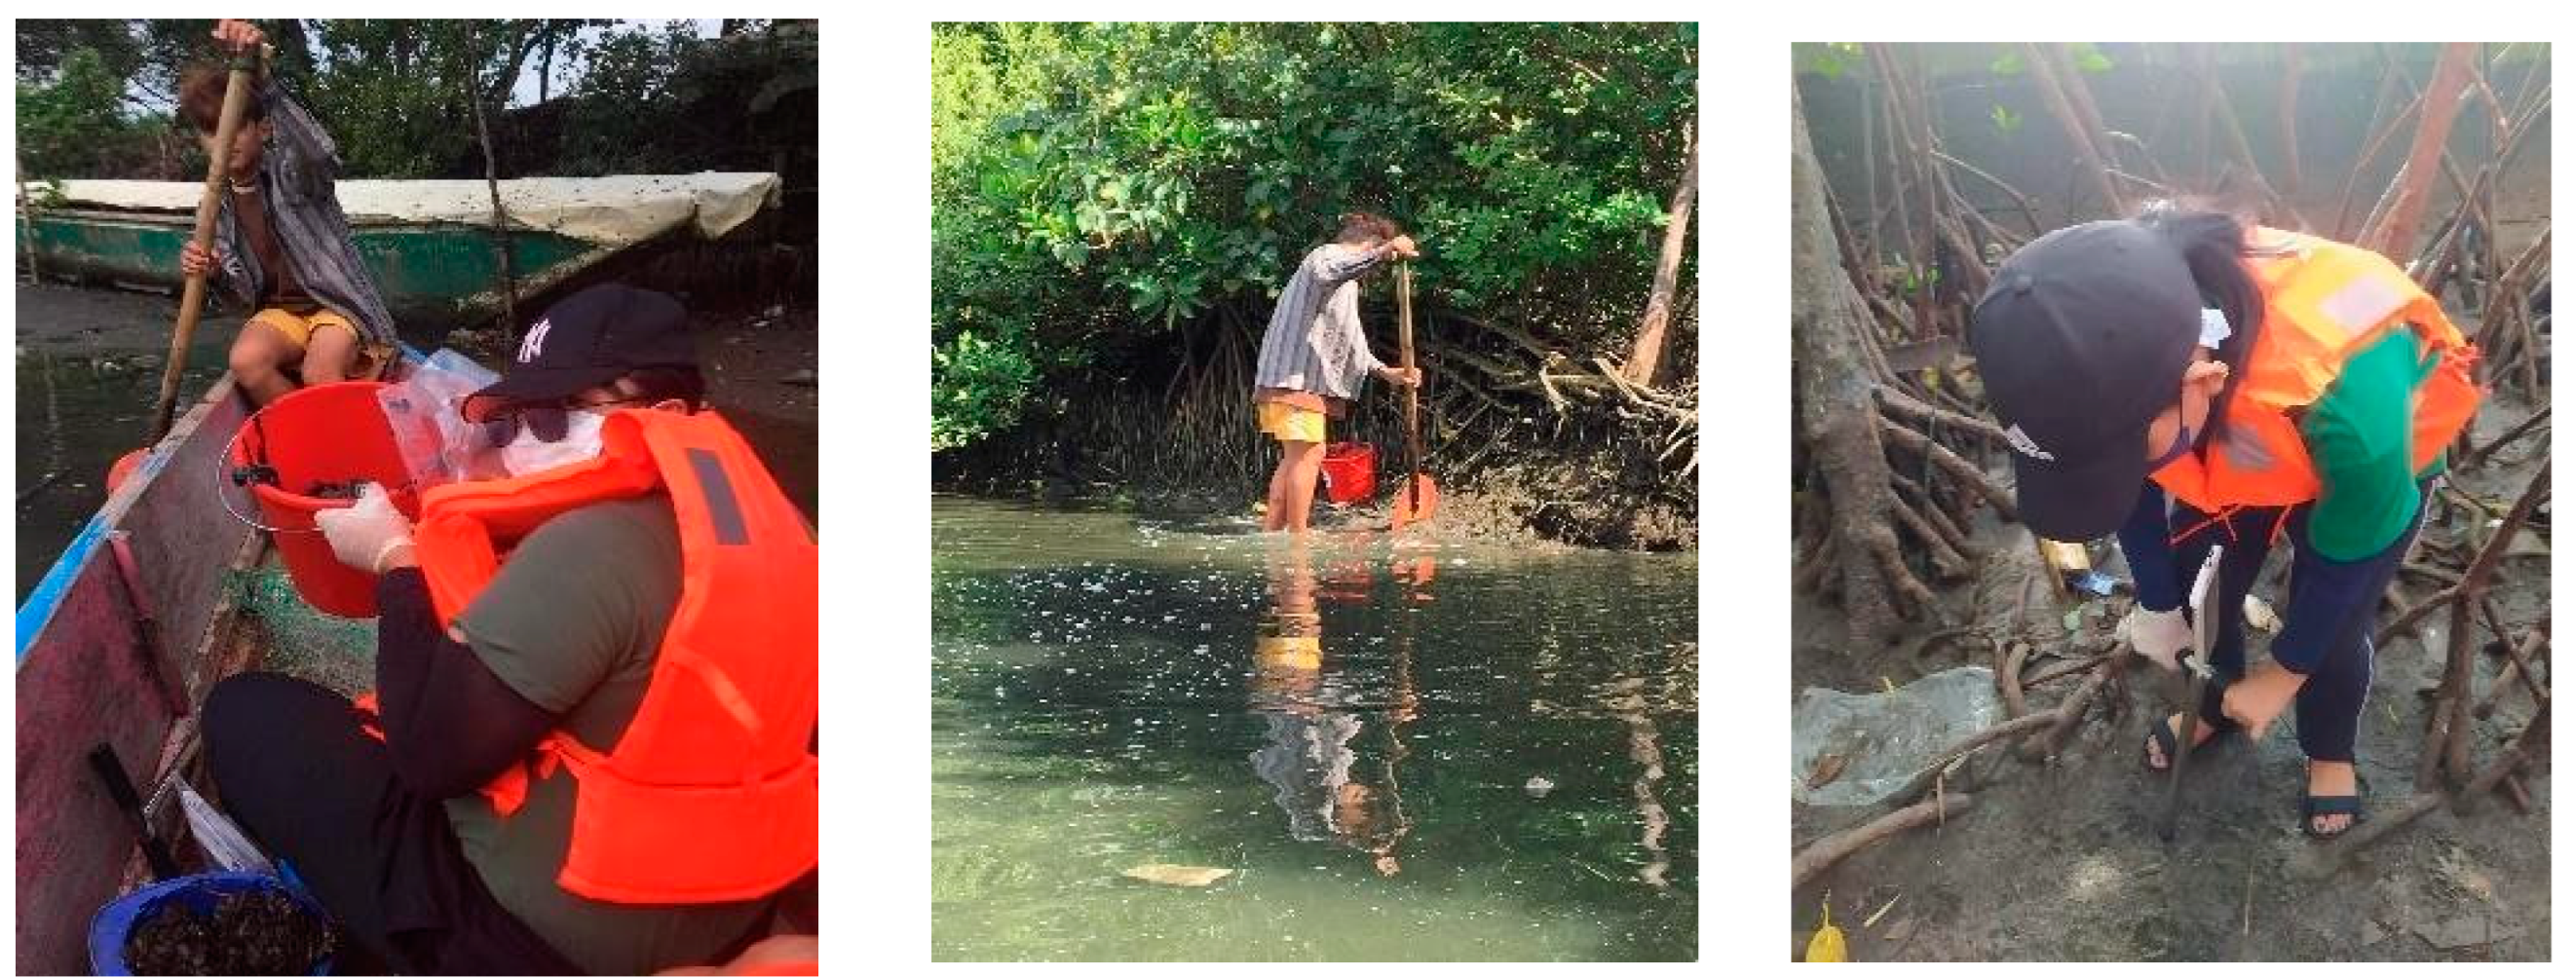
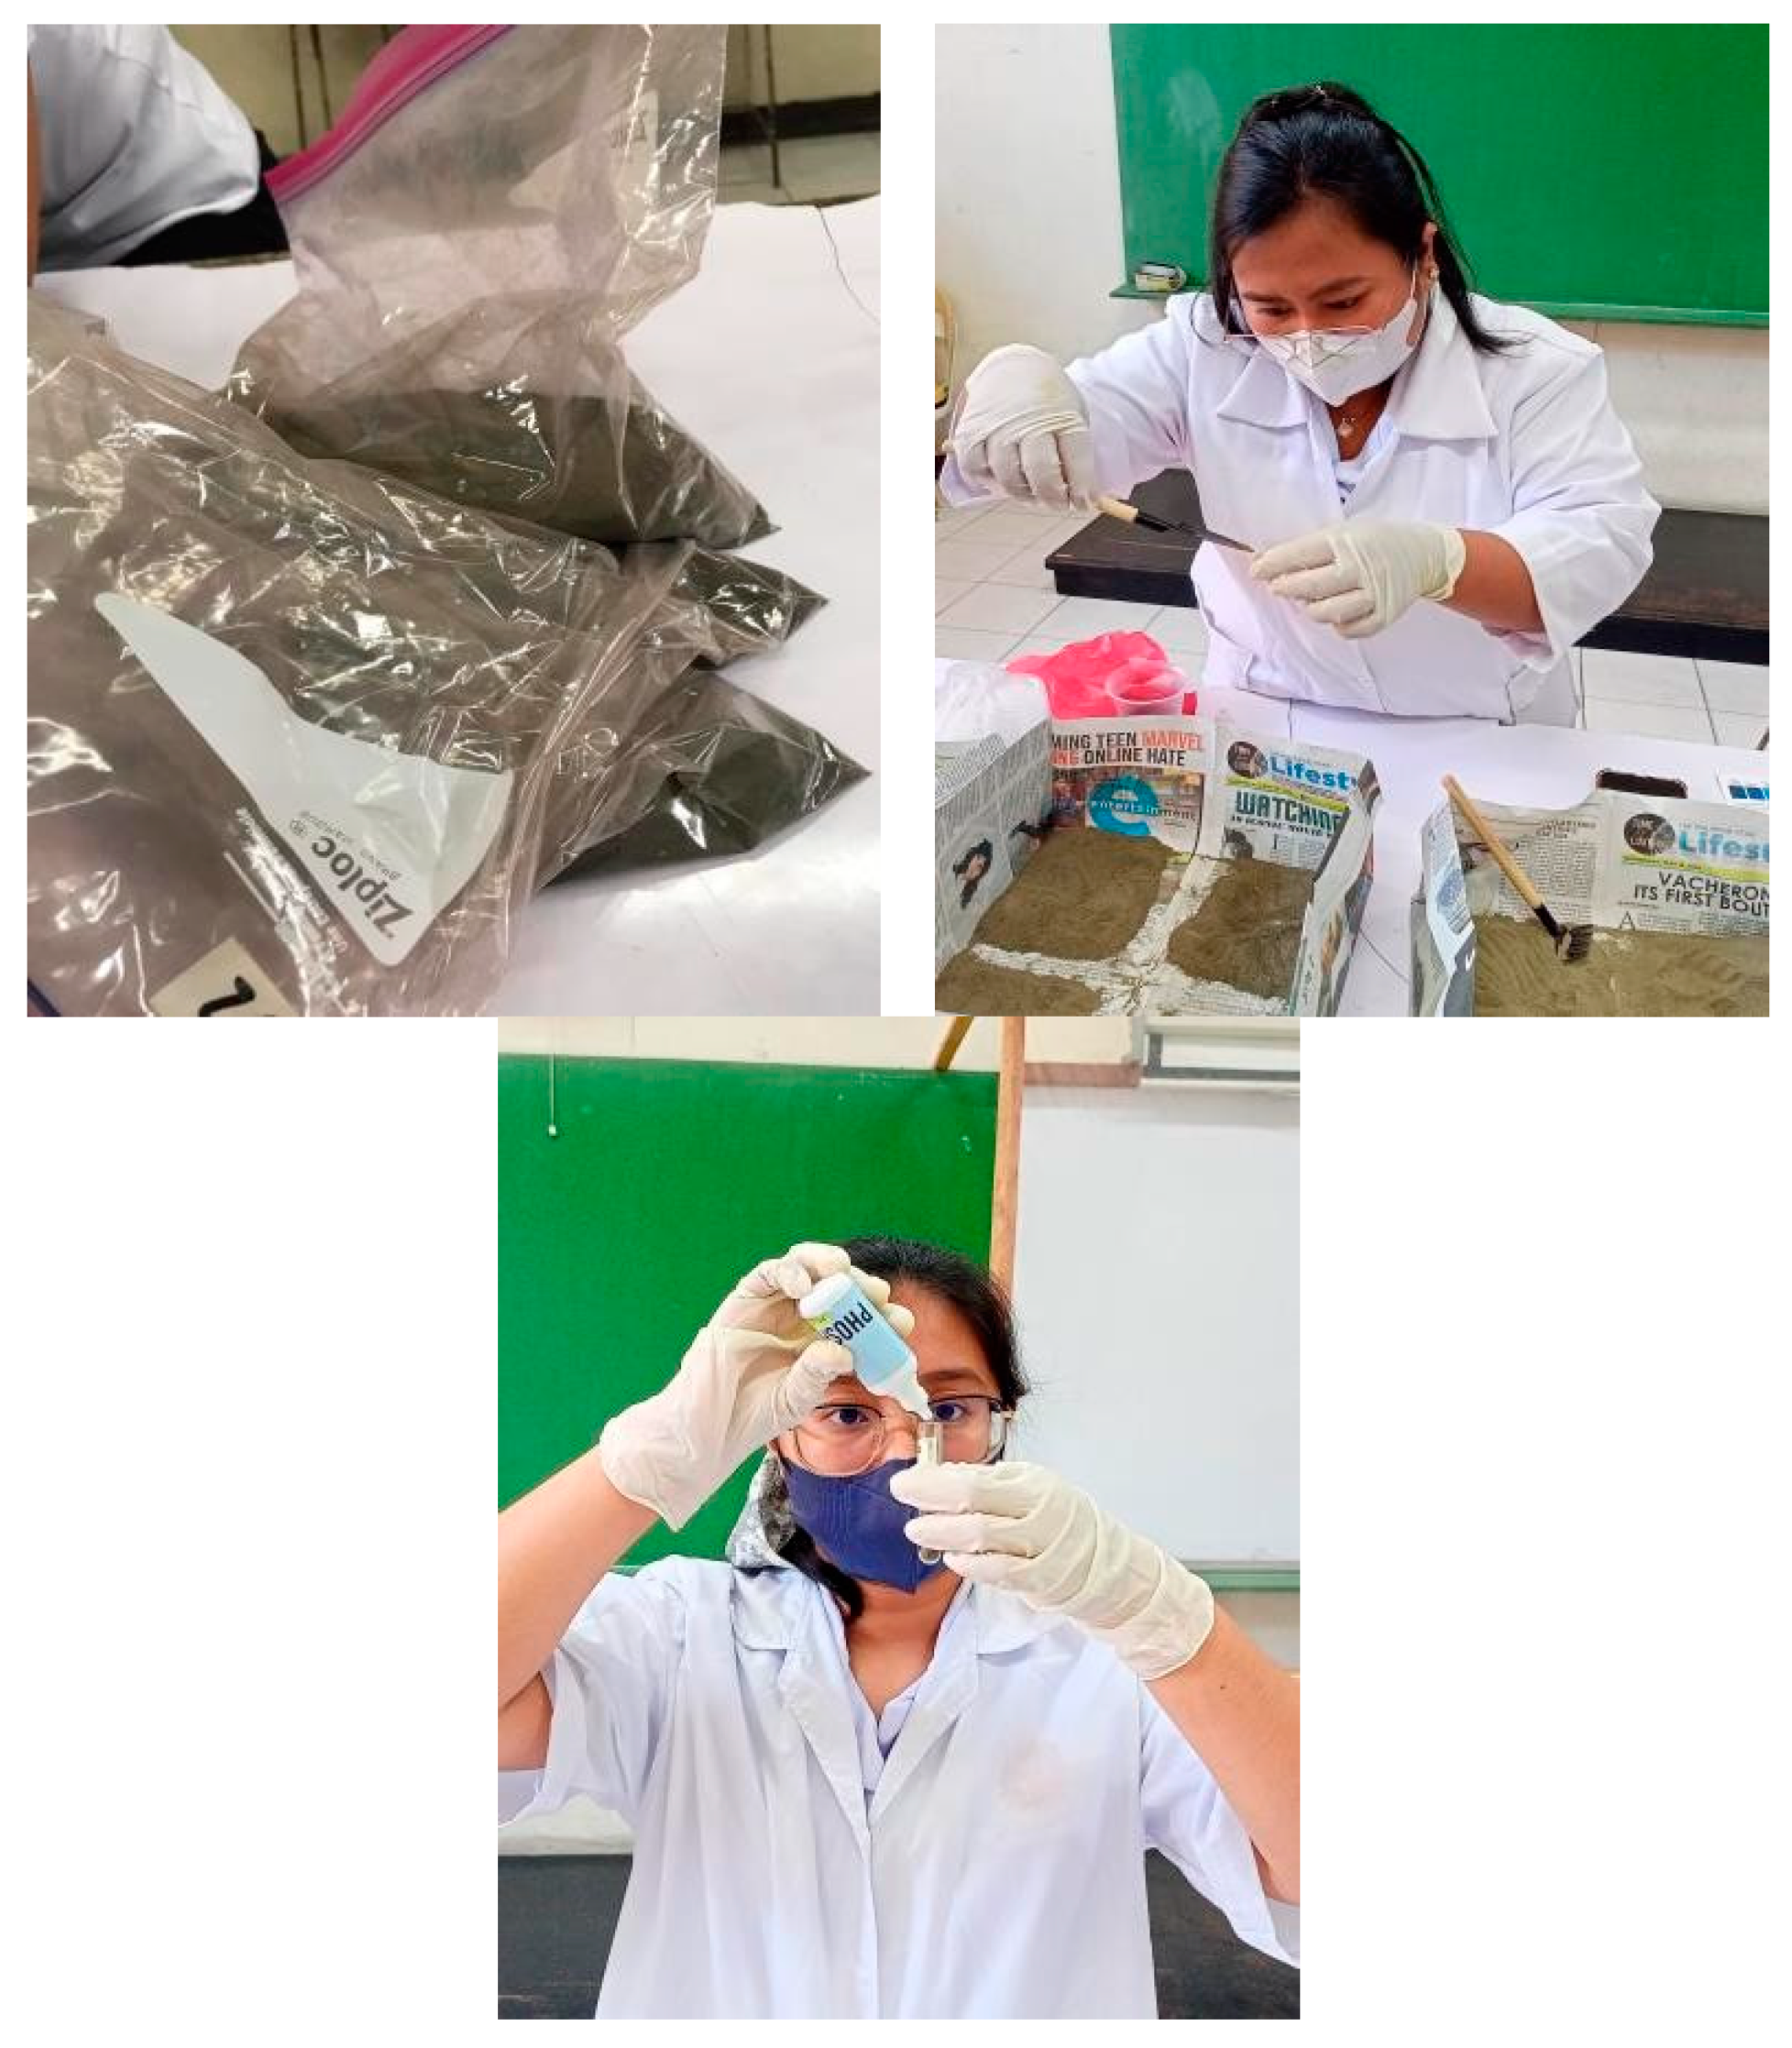
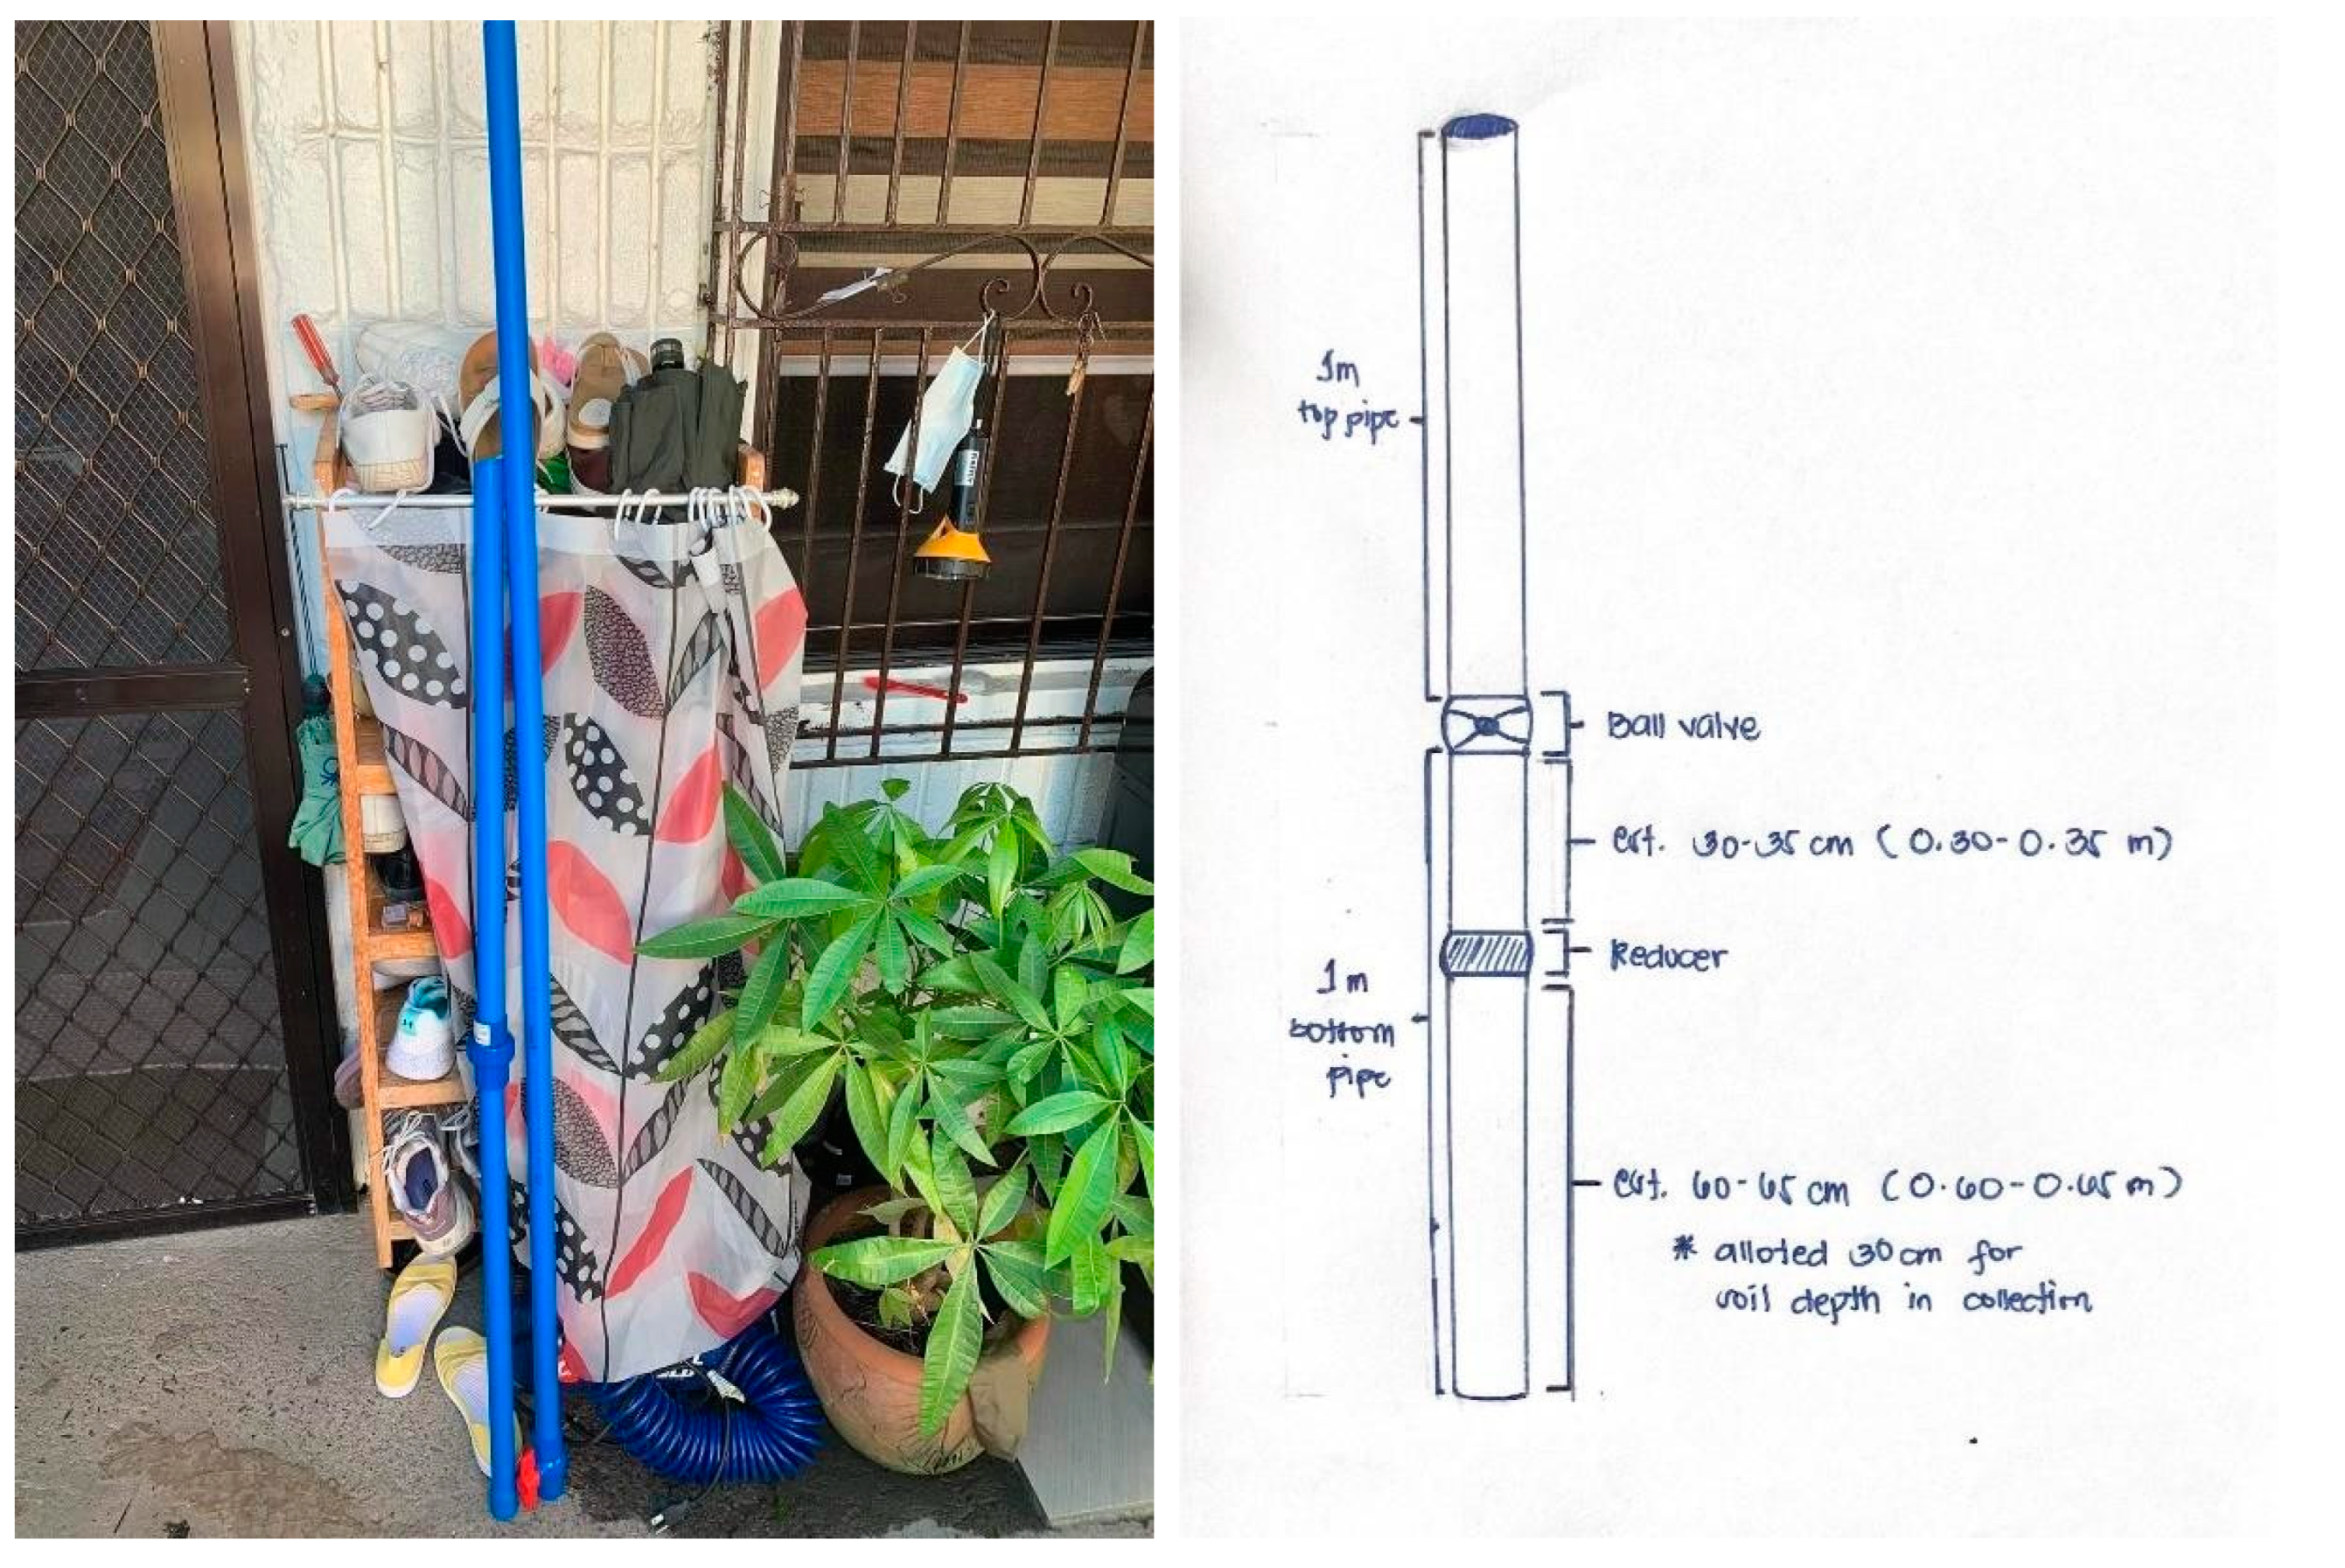
Following the Bureau of Soils and Water Management (2020) in soil sampling, a soil probe, a meter stick, a plastic, and a pail were prepared for the soil sample collection in the area. The soil samples' temperatures were analyzed in-situ. The ex-situ analysis used a test kit to analyze the sample's pH, nitrogen, phosphorus, and potassium. In addition, water holding capacity and soil texture were analyzed by the laboratory. The area was divided based on the sampling site, and three soil samples were taken on each site without any trials being conducted. These samples were taken at 10 points in a zigzag pattern and placed in a separate container. Afterward, organic matter and trash from the soil sample collected were removed. The soil sample was collected directly using a soil probe at a depth of 25 to 30 cm below the rim of the crown of the mangrove, wherein the sample was a composite soil sample. The soil sample was air-dried away from any contaminants. The sample used for the analysis was crushed and sorted away from the remaining organic matter in the soil sample and divided into four sides where two opposite sides were used, placed in the plastic bag upon obtaining one kilo of the sample and labeled before being sent to the Bureau of Soils and Water Management Laboratory for analysis. Testing methods for each soil quality parameter varied according to the current standard methods of BSWM. Soil pH and NPK were tested using a Soil Test Kit from the Bureau of Soils and Water Management.
In contrast, soil texture was examined using a Bouyoucos Hydrometer. The tapping method was used to determine the values of the samples' soil water holding capacity, while the organic matter used Walkey and Black Method. On the other hand, the test for soil organic carbon was obtained by multiplying the analysis result for soil organic matter by 1.72.

3.4.1. Test for Soil Texture

Soil texture was analyzed in the Bureau of Soils and Water Management using the Bouyoucos Hydrometer method of analysis.
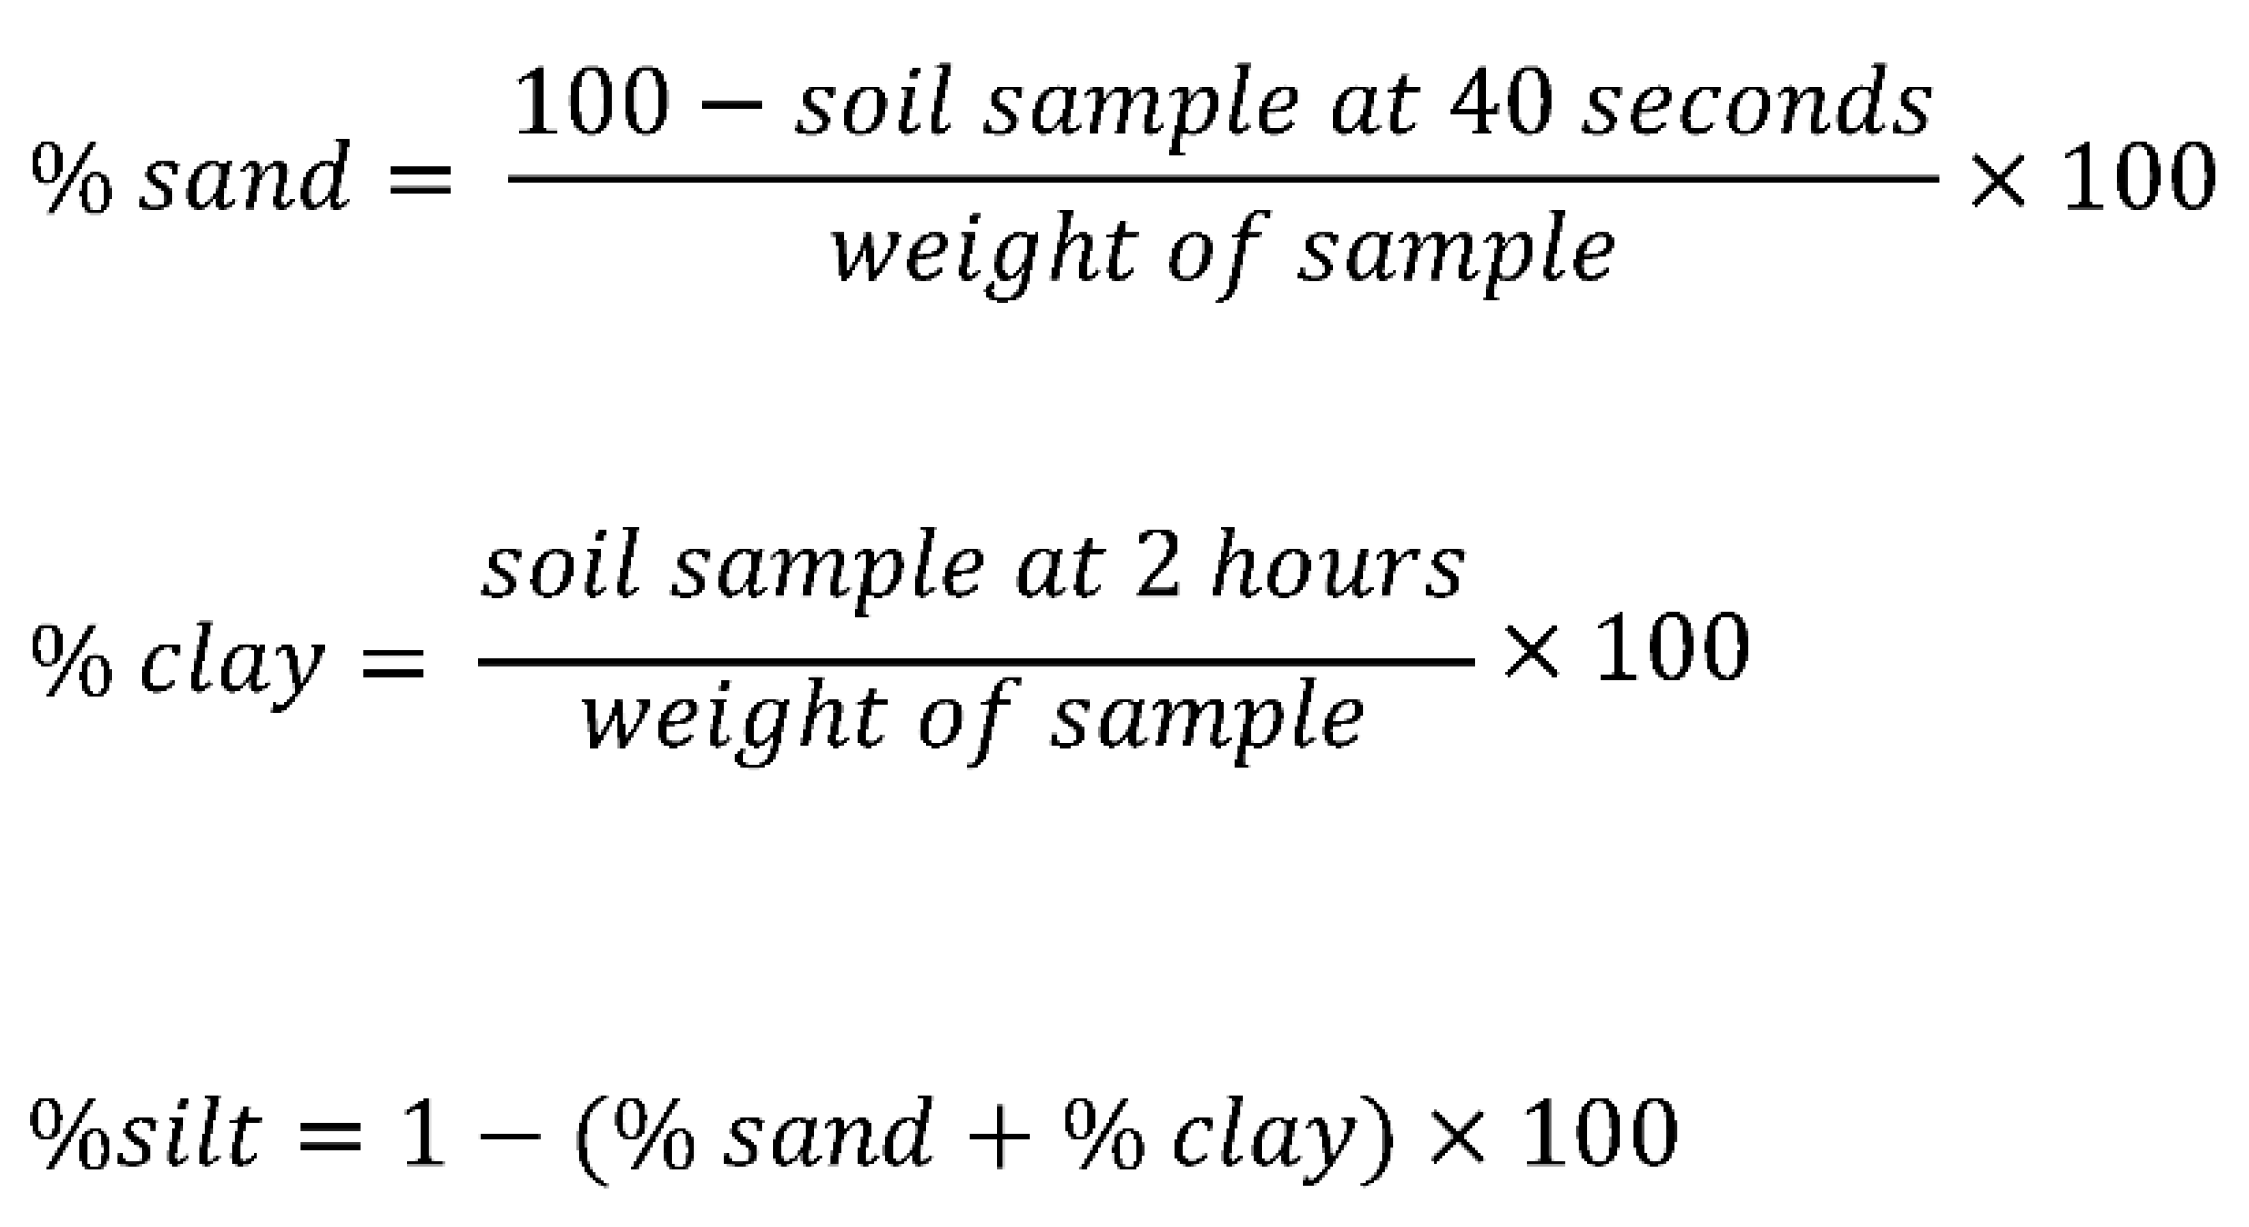
The soil sample was initially weighed at 25 grams before the same quantity of Calgon was added to dissolve it. The mixture was transferred into a 1L or 1000 mL sedimentation cylinder, filled up until the 1000 mL mark using distilled water, and immersed to mix. After the soil had settled, the soil particles were measured with a hydrometer at the 40-second time stamp and repeated after two hours. For each of the subsequent soil samples, three replicates of each test and analysis were conducted. Using the following formula shown below, the percentage of particulate size for soil, silt, and clay was calculated.
Preprints 81428 i006

3.4.2. Test for Water Holding Capacity

The soil samples were sent to the laboratory for testing the water-holding capacity of the soil sample using the tapping method.
A filter paper was used to line the bottom of the Keen Raczkowski box. The soil sample was packed by tapping the box on a wooden bench 20 times. A small amount of soil was added to the box and tapped as before. With that, the top of the box was leveled by striking off the excess soil with the use of a straight-edged spatula. The box was then placed in a petri dish filled with water and left overnight. The saturated box was removed from the petri dish, weighed, and dried in an oven at 105℃ and weighed again.
WHC (%) = fresh mass - dry mass fresh mass 100

3.4.3. Test for Soil Temperature

The soil temperature was obtained in-situ by thrusting the thermometer into the soil measuring at least 4 inches below. The thermometer was left to settle into the soil for 1 minute before the result was read and recorded.

3.4.4. Test for Soil pH

Soil pH was tested with the Soil Test Kit from the BSWM. The test tube was filled with the CPR indicator up to the second line mark and swirled gently about 20 times, then let it rest. The procedure was repeated after 2 minutes then let it rest for 5 minutes. The result was compared with the pH color chart included in the test kit’s manual. A soil pH that is greater than 5.8 requires another test by repeating the same steps mentioned using the BTB indicator. The soil pH equal to or less than 5.4 also requires another test by repeating the same steps using the BCG indicator. When the color did not match the color present in the BTG or the BCG color chart, the CPR color chart will be used as a reference. The same steps were repeated for other soil samples from other sites before washing and rinsing the test tube using distilled water.

3.4.5. Test for Soil Organic Matter

The soil samples were sent to the laboratory for testing of Organic Matter (OM). The method used was the Walkey and Black Method which according to the Department of Sustainable Natural Resources of Australia, the first method is to identify the moisture content of the soil sample, ground and sieved through a 0.42 mm sieve. Afterward, 0.5-1.0 g topsoil was weighed and mixed with 2.0-4.0 g subsoil into a dry-tared 250 mL conical flask. 10 mL of 1N Potassium dichromate (K2Cr2O7) was added to the sample before mixing gently. After that, a 20 mL measurement of concentrated Sulfuric acid (H2SO4) was added to direct the stream towards the suspension before the flask was until the sample and reagent were mixed. A 200°C thermometer was placed and heated while the flask was swirled on a hot plate. The thermometer was set aside upon reaching 135°C, letting the mixture cool down on an asbestos sheet inside the fume hood. Once cooled, the mixture was diluted in 200 mL of deionized water and titrated it using ferrous sulfate (F2SO4) with a ferroin indicator. After that, organic matter can be calculated using the following formula/computation:
Preprints 81428 i007
A 1 mL of 1 N Dichromate solution is equivalent to a measurement of 3 mg of carbon. Both quality and normality of the dichromate mixture used are as stated in the method, the percentage of carbon was determined from the formula:
O r g a n i c   C a r b o n   % = 0.03   g   N   × 10   m L   × 1 T S   ×   100 O D W = 3 ( 1 T S   ) W
where:
  • N=Normality of K2Cr2O7 solution
  • T=Volume of FeSO4 used in the sample titration (mL)
  • S=Volume of FeSO4 used in the blank titration (mL)
  • OSDW=Oven-dry sample weight (g)

3.4.6. Test for Soil Organic Carbon

The soil organic carbon (SOC) was obtained through the calculation of SOC from the Soil Organic Matter (SOM). According to Australia's Department of Food and Agriculture, there is a total of 58% of the carbon exists as the mass of organic matter. Hence, soil organic matter can be computed by multiplying the percent total organic carbon by the conversion factor of 1.72, which is derived from 100 (organic matter) divided by 58 (organic carbon). By reconstructing the formula, the amount of soil organic carbon was determined by dividing the soil organic matter by the
1.72 conversion factor.

3.4.7. Test for Nitrogen (N)

The test tube inclusive of the BSWM Soil Test Kit was filled with the soil sample up until the first line mark followed by the Nitrogen solution up until it reached the second line mark. The test tube was swirled gently about 30 times and let rest for 5 minutes. The process was repeated and let it rest for 30 minutes. The resulting solution on the soil sample was compared to the nitrogen color chart of the manual before washing and rinsing the test tube. The steps were then repeated for the other soil samples.

3.4.8. Test for Phosphorus (P)

The test tube of the Soil Test Kit was filled with the soil sample up until the first line mark followed by the Phosphorus solution up until the second line mark and 4 drops of P1 solution which contained a high concentration of strong acid. The solution was swirled gently for 1 minute and let rest for 3 minutes. It was swirled again for another minute and let it rest for about 5 minutes. The tin foil strip that is included in the test kit was wrapped firmly on one end of a plastic stick. The stick wrapped in tin foil was used to stir the solution in the test tube for 1 minute without causing any disturbance to the soil. After two minutes, it was stirred again for the same amount of time. The resulting blue color solution was compared against the manual’s color chart for phosphorus before washing and rinsing the test tube. The same steps were repeated for other soil samples using the same plastic stick and foil as it can be used up to 5 times.

3.4.9. Test for Potassium (K)

The Soil Test Kit test tube was filled with the soil sample up until the first line mark followed by adding the Potassium solution up to the second line mark and 8 drops of the K1 solution. The test tube was gently swirled for about 1 min. and let it rest for 3 min. The test tube was swirled again for another 1 min. and left to rest for 5 min. After that, the 12 drops of K2 solution were added dropwise in an inclined test tube without stirring or shaking the test tube. The appearance of a cloudy yellowish-yellow layer sitting above the orange solution was observed and compared to the picture provided in the manual after 5 min. of rest.
The sufficiency level was determined according to the level of thickness of the cloudy yellowish layer as presented in the picture. The test tube is washed and rinsed before repeating the same steps for the other soil samples.

3.5. Aboveground Biomass, Belowground Biomass, and Total Carbon Biomass of Mangrove Trees

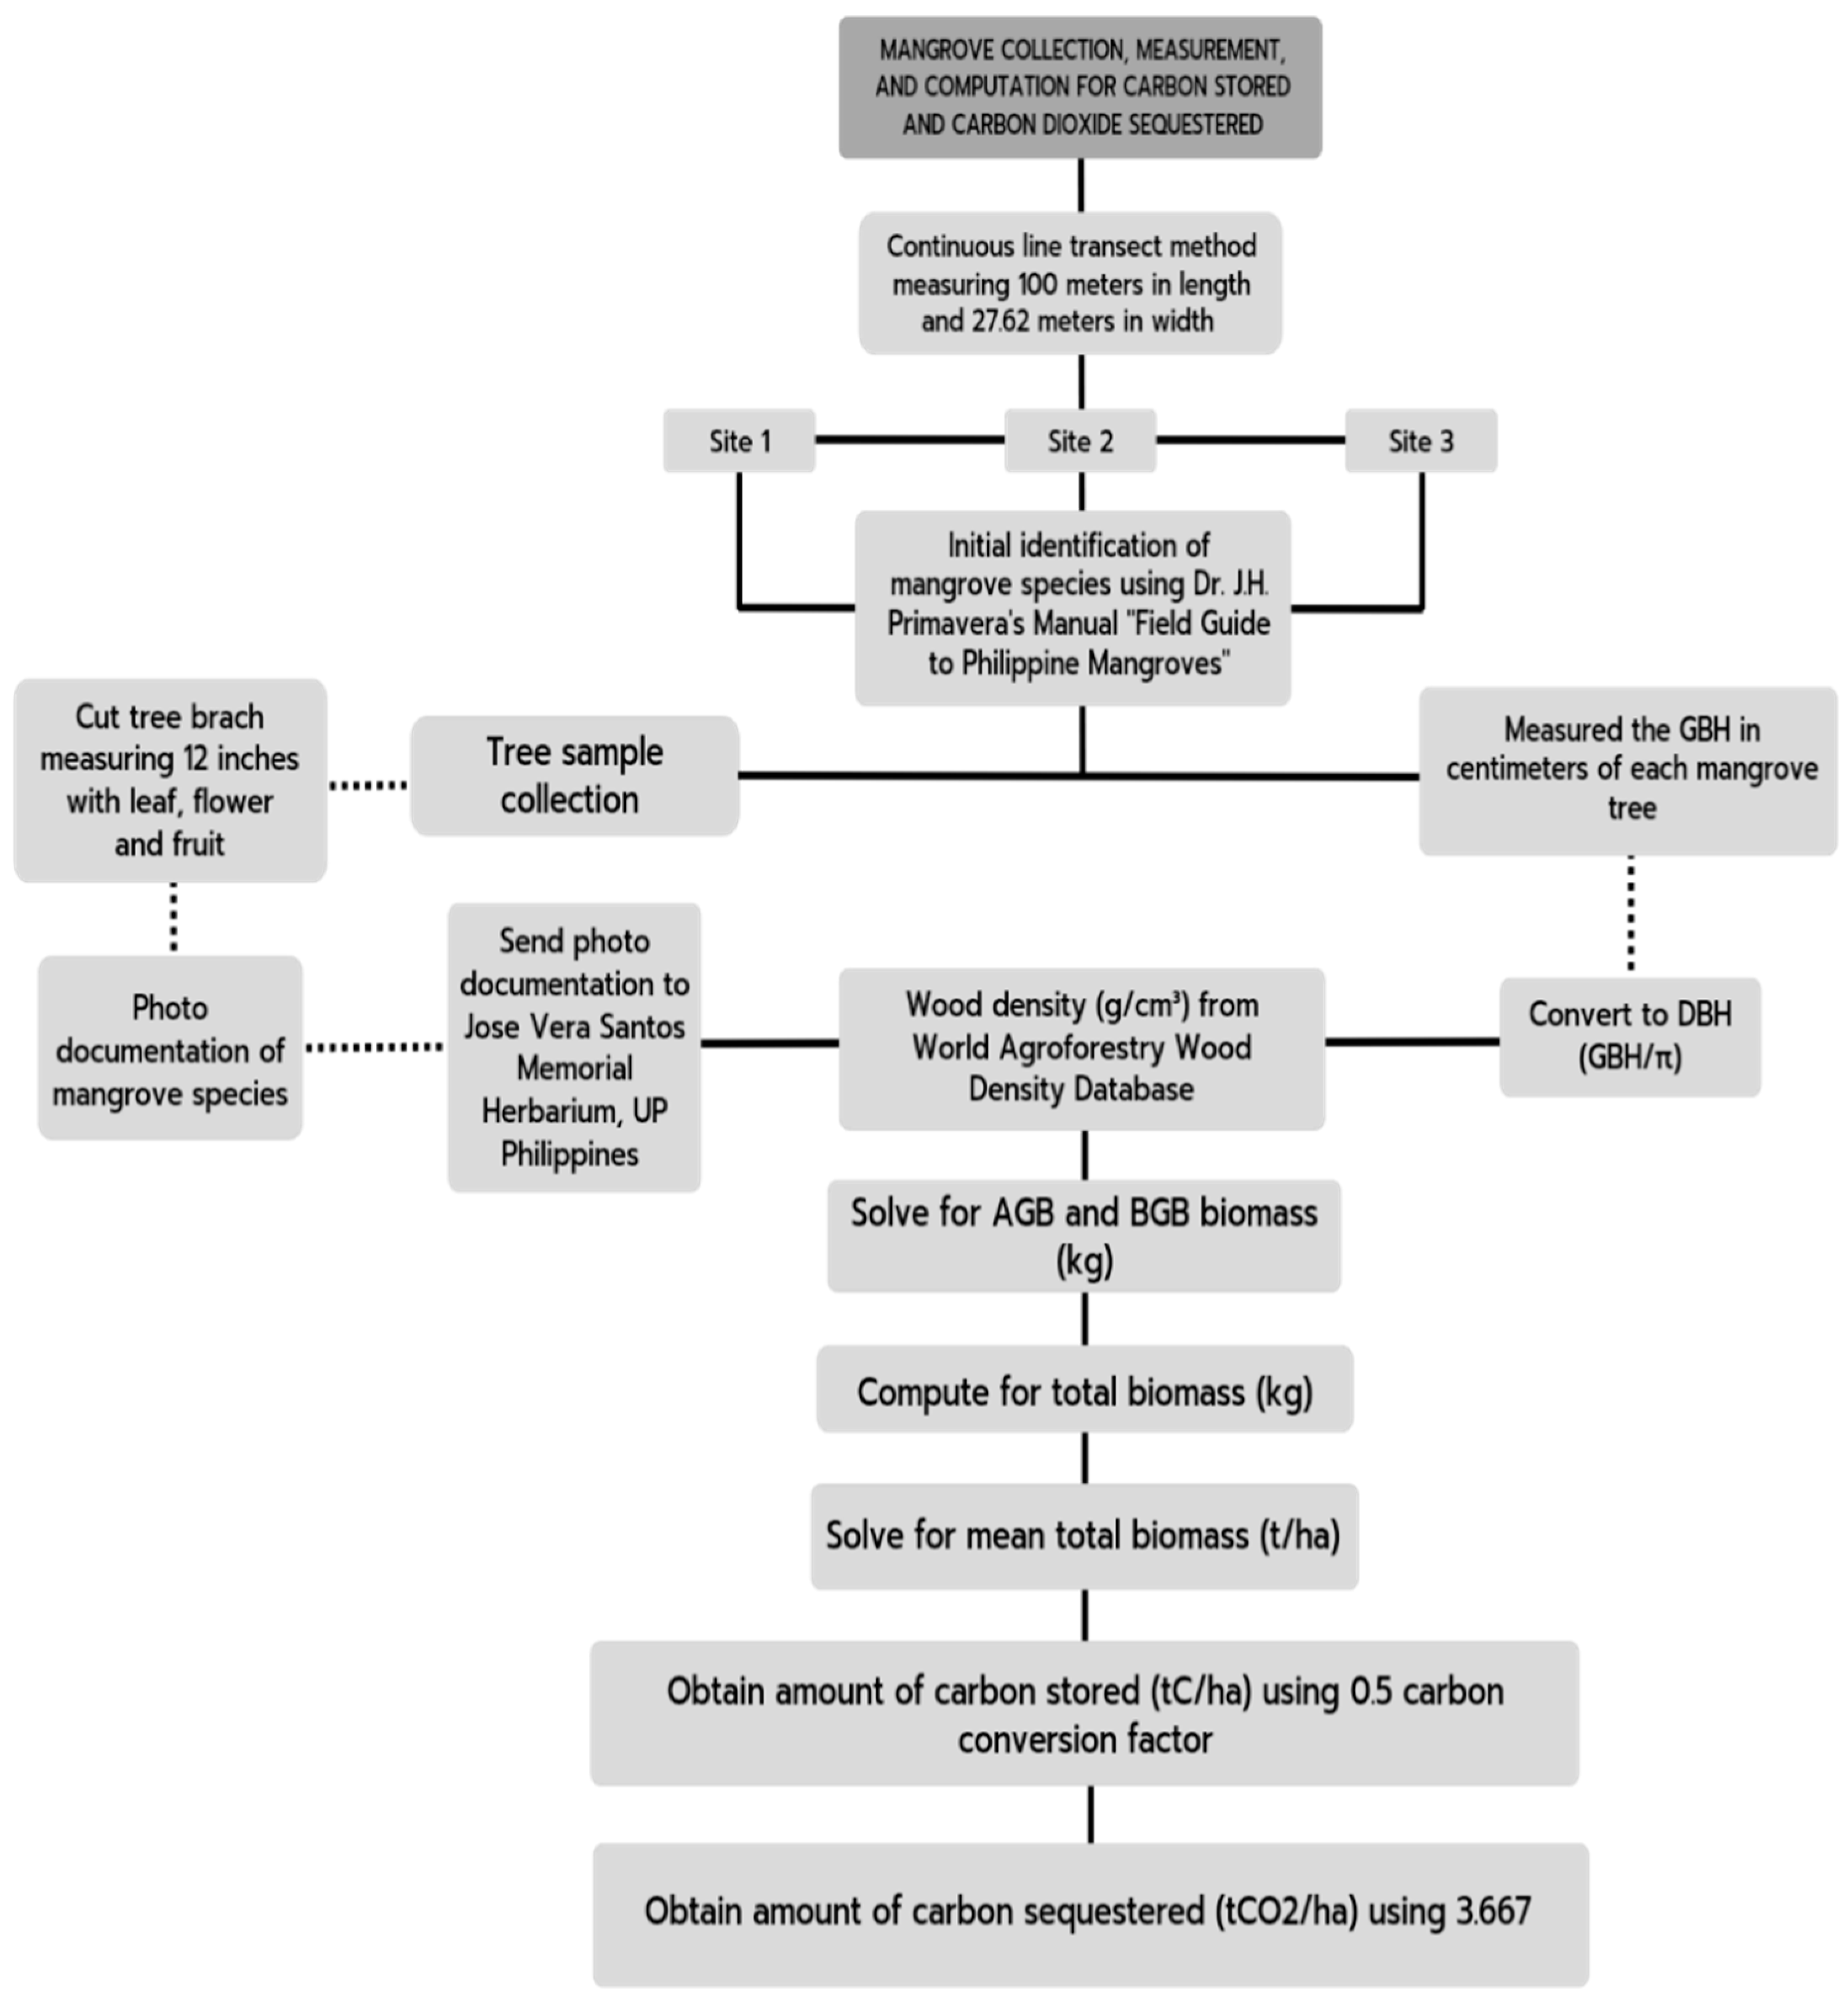
The Allometric equations used were established by Komiyama et al. (2005), as referenced by Abino et al. (2013), in the estimation of the aboveground and belowground biomass per mangrove tree. With the use of measuring tape, the girth of individual mangrove trees was obtained by measuring the circumference of mangrove trees not less than 10 cm, at the standard breast height of 1.37 m above the ground in centimeters.
The girth was divided by π at the value of 3.1416 to obtain the diameter (cm). The diameter of each tree was used in allometric equations along with the wood density for each mangrove species as follows:
Aboveground biomass
𝑤𝑎𝑔𝑏 = 0.251𝜌𝐷2.46 (kg)
Belowground biomass
𝑤𝑏𝑔𝑏 = 0.199𝜌0.899𝐷2.22 (kg)
where:
  • ρ = wood density in g/cm3 of each species of mangroves based on the database of World of Agroforestry for Wood Density (2017)
  • D = diameter of each tree in cm
After the biomass for the aboveground and belowground of an individual tree was obtained, the two are summed to obtain the total biomass.
𝑡𝑜𝑡𝑎𝑙 𝑏𝑖𝑜𝑚𝑎𝑠𝑠 = 𝑤𝑎𝑔𝑏 + 𝑤𝑏𝑔𝑏
The mean total biomass was obtained by taking the sum of the total biomass of each mangrove tree per site. Then it was divided by the site's total area before converting it to tons per hectare (t/ha).
Preprints 81428 i008
where:
  • N = number of trees per site
  • A = Area per site = 2,762 m2
Whereas the area was determined by multiplying the measured width of 27.62 m by the established length of 100 m using field measuring tape.

3.6. Carbon Stored and Carbon Sequestered by Mangrove Trees

In determining the amount of carbon stored, the computed mean total biomass was multiplied by the carbon conversion factor for mangroves at 0.50 value based on the Intergovernmental Panel on Climate Change's default carbon fraction value for woody and dry biomass matter. In contrast, the amount of carbon sequestered was obtained by converting the amount of carbon stored to carbon dioxide (CO2) emissions by multiplying it by 3.667, according to Nesperos et al. (2021) and US EPA.
Amount of Carbon Stored (tC/ha) Amount of Carbon dioxide Sequestered (tCO2/ha)
(Mean total carbon biomass) (0.50) (tC/ha) (3.667)

3.7. Mangrove Species Inventory

The Continuous Line Transect Method was used to measure the population of mangrove species in three sites within the area measuring 100 meters in length and 27.62 meters in width. The book Field Guide to Philippine Mangroves by J.H. Primavera (2009 & 2022) could serve as the standard reference for mangrove species identification. A sample of each mangrove species was collected for the herbarium, measuring a length of 12 inches which includes the bud, flower, leaves, and fruits. The sample was sent to the
University of the Philippines - Diliman Quezon City Institute of Biology and Dr. Jurgenne
H. Primavera, a marine scientist known for verification and authentication. The collected sample species of mangroves were photographed as part of the photo documentation method.

3.8. Species Diversity Indices

The evenness, richness, and diversity of species were used to compare a variety of biological populations.

3.8.1. Shannon-Wiener Index

The Shannon-Wiener Index was used to quantify the measurement wherein it considered the number of various species and the evenness of the species distribution in the population. The richness of species refers to the number of species present in a given habitat. Having a high richness of species infers that the habitat shows both complexity and, at the same time, stability.
Species richness is calculated using the formula:
𝐻 = ∑ 𝑝𝑖 ln 𝑝𝑖
where:
  • H = depicts the symbol for the Shannon Index of Diversity,
  • 𝑝i= pertains to the individual’s proportion based on the ith species; and
  • ln = refers to the natural logarithm
According to Kiernan (2021), evenness refers to the relative abundance of individual species that composes the area's abundance, and was calculated using the formula as follows:
Preprints 81428 i009
where:
  • E = depicts the symbol for species evenness; and
  • H = pertains to the calculated species richness
According to Moutsambote et al. (2016), the typical range for Shannon diversity ranges between 1.5 and 3.5 while a 4.5 index is rarely achieved.

3.8.2. Simpson’s Diversity Index

Another diversity index is Simpson’s Diversity Index, which measures diversity by considering the number of present species and the individual species’ relative abundance. The principle in Simpson’s diversity is a linear relationship between species richness and evenness and diversity. Hence, diversity increases when richness and evenness increase. In Simpson’s Diversity Index, species dominance is measured wherein a dominating species infers to a less diverse community compared to a community with similar measures of abundance.
The formula for dominance is as follows:
D s = n i ( n i 1 N N 1 )
where:
  • ni = refers to the number of individuals in species i; and
  • N
    = sum of individuals
    Once diversity is calculated, Ds can be substituted to obtain the species diversity in the formula as follows:
    𝑆𝑖𝑚𝑝𝑠𝑜𝑛′𝑠 𝐷𝑜𝑚𝑖𝑛𝑎𝑛𝑐𝑒 = 1 – 𝐷𝑠
    The value of a component closer to zero (0) indicates higher diversity while the value of a component that is distant from the zero (0) value indicates lower diversity. Hence, higher dominance is calculated to result in a lower calculated diversity.
    The Simpson's Reciprocal Index is used to compare communities and reveal their unique characteristics. It is common practice to use the Reciprocal Index to quantify the diversity of a given habitat in terms of the species present and the abundance of each species.
    Preprints 81428 i010

    3.8.3. Sorensen Index of Similarity

    The Sorensen Index of Similarity was used in comparing the diversity of the two species involved. The index of similarity is equal to two (2) multiplied by the quantity of the species found in both communities divided by the number of species that are present in the first community and the number of species present in the second community multiplied by 100. In formula form, the Sorensen Index of Similarity is:
    Preprints 81428 i011
    where:
    • C = species present in both communities
    • S1 = number of species found in the community I
    • S2 = number of species found in the community II
    Determining the similarity index evaluates the range of variation of species and their composition.

    3.9. Species Importance Value

    The Species Importance Value, often known as the SIV, is a metric utilized to acquire the general significance of individual species within the community. The total of the percentage values of relative frequency, relative density, and relative dominance is what is referred to as the SIV.
    𝑆𝐼𝑉 = 𝑅𝑒𝑙𝑎𝑡𝑖𝑣𝑒 𝐹𝑟𝑒𝑞𝑢𝑒𝑛𝑐𝑦 + 𝑅𝑒𝑙𝑎𝑡𝑖𝑣𝑒 𝐷𝑒𝑛𝑠𝑖𝑡𝑦 + 𝑅𝑒𝑙𝑎𝑡𝑖𝑣𝑒 𝐷𝑜𝑚𝑖𝑛𝑎𝑛𝑐𝑒

    3.9.1. Relative Frequency

    The term "Relative Frequency" (Rf) refers to the degree to which different species are dispersed across an area that is relative to the total count of occurrences of all present species.
    Preprints 81428 i012

    3.9.2. Relative Abundance

    The concept of relative abundance (RA) pertains to the numerical strength of individual species proportional to the sum of the quantity of all present species.

    3.9.3. Relative Dominance

    Relative Dominance (RDo) is the species coverage value corresponding to the total sum of the species' scope or coverage in an area.
    Preprints 81428 i013

    3.10. Statistical Treatment

    Statistical tests used in the study are Kruskal-Wallis, Friedman, and Pearson’s r Correlation Test. These were done using the IBM SPSS version 26 Software.

    Kruskal-Wallis

    Kruskal Wallis non-parametric analysis is the statistical analysis used to identify whether there is a significant difference in the water quality and soil quality during the five months of the sampling period per site.

    Friedman Test

    Friedman Test is a non-parametric test that is an alternative to the one-way Analysis of Variance (ANOVA) that is used to determine if there is a significant difference between the water quality and soil quality of the three sites in between each month during the five-month sampling period; and.

    Pearson's r Correlation

    Pearson's correlation, also known as Pearson's r, is a test statistic used to determine if there is a correlation between soil quality to mangroves, as well as the correlation between water quality to mangroves concerning the abundance of mangroves in three sampling sites.

    Chapter IV

    RESULTS AND DISCUSSION

    4.1. Anthropogenic Activities in Kaingen River

    Anthropogenic activities can directly affect the condition of thriving bodies of water; hence, assessing the respondent’s daily activities near the Kaingen River is important in determining how it can affect the water quality of the Kaingen River. There were 336 total survey questionnaires distributed to the residents of Barangay Kaingen, Kawit, Cavite.
    Based on Table 1, the anthropogenic activities near Kaingen River are fishing and bathing which occurred rarely. These activities were observed during the five months of sampling, wherein residents of Brgy. Kaingen, mostly kids were bathing or swimming in the river. The throwing of garbage in the river was also observed. Most soil samples per site have evidence of thrown plastic residues and pieces of clothing. However, the result of the survey showed this activity has never occurred in the river, this meant that the collected garbage residues were resident wastes thriving in the river for a long time. Fishing activities can be observed since most residents residing nearby the Kaingen River were local fishermen. Kaingen River has situated nearby Bacoor Bay and Manila Bay. It serves as an estuary, rich in diverse aquatic species such as fishes and mollusks. On the other hand, anthropogenic activities such as washing clothes, disposing of chemical wastes, excreting, and bathing animals were never done by the residents due to precautions implemented by the management of Brgy. Kaingen Kawit, Cavite.

    4.2. Protection and Conservation Measures of Kaingen River

    Protection and conservation measures are necessary for the controlling and monitoring of the river’s water quality to mitigate the deteriorating effects of harmful anthropogenic activities on the thriving aquatic species in Kaingen River. The perspicacity of Brgy. Kaingen’s residents in protection and conservation measures for the Kaingen River were asked and assessed through survey questionnaires. Table 2 showed the administered response of the residents for the protection and conservation of the Kaingen River.
    As presented in Table 2, the respondents strongly agreed with all of the conditions for the protection and conservation efforts of the Kaingen River such as preventing people from committing unlawful behavior in the river, taking part in environmental groups, creating groups and organizations, river conservation guidelines, promoting sustainable methods, preventing the depositing of wastes, river management, and supporting environmental programs. The result revealed that residents recognized the value of the river; its living thing components, beauty, and purpose as commercial rivers that most fishermen were relying on for their living. Residents are willing to exert extra effort to protect the river from the harmful effects of pollution by preventing unlawful behavior and depositing waste. Respondents were open to new knowledge and willing to join with environmental groups or create groups that will manage the river. A willingness to have river conservation guidelines, policies, and ordinances was observed in the interviews conducted during the distribution of survey questionnaires. The respondents wanted to promote sustainability and support environmental programs that seek to protect the Kaingen River and improve the Barangay's current approach to the protection and conservation of the river. Furthermore, respondents also agreed to have proper river management, which seeks to control the collection and extraction of fish and other aquatic resources in the river, as well as creating groups or organizations whose sole purpose is to oversee, manage, and monitor the condition of Kaingen River.

    4.3. Water Quality Parameters of the Three Sampling Sites in Kaingen River, Kawit, Cavite during the Sampling Period

    Water quality parameters were measured in-situ using different multi-tester for each designated parameter and conducting three trials per site. The data and results obtained from the tests were tabulated as presented in Table 3.

    4.3.1. Water Temperature

    Temperature is a crucial factor that affects different parameters specifically in water. The water temperature is important as it can determine the sudden change in the measurement of such parameters. Figure 5, it showed the fluctuation of measurement of the temperature in the three sampling sites during the five-month sampling period.
    Among the three sampling sites, it was observed that the highest and lowest temperature was measured in Site 3 during March that ranged from 34.83°C and 26.53°C, respectively. The temperature for Site 1 ranged from 30.07 to 32.8°C, 30 to 32.33°C for Site 2, and 26.53 to 34.83 for Site 3. The fluctuation that occurred during the sampling months may have been attributed to a variety of factors including air temperature, sediment thermal conductivity, wind speed, solar radiation, and artificial heat according to the study of Chen and Fang (2015). In addition to this, the country experienced warm and dry seasons from March to May which can be attributed to the high average recorded temperature, based on Figure 5, in March due to intense solar radiation. Consequently, it may have also been drastically increased due to the artificial heat brought by anthropogenic activities in the area, in which according to the same publication, artificial heat is one of the factors that causes higher temperature inputs in streams and river bodies. This is supported by Collins et al. (2013), claiming that anthropogenic activities have also contributed to the increase in greenhouse gas levels attributing to the rise in global temperature in which bodies of water store substantial amounts of the additional heat. Moreover, the average depth during March was the lowest among the months included in the sampling period. The shallow depth of the river increases the amount of solar radiation that is absorbed by the water. The upper surface of the water absorbs and reflects most of the incoming sunlight; thus, the increase in temperature is attributed to shallow depths of water showing an inverse relationship between the two parameters. Meanwhile, the month of December garnered the lowest average water temperature due to heavy rains that were experienced on the day of the sample collection, with the addition of significantly higher depth compared to March. Based on the water quality guideline set by DAO-2016-08 for temperature, the data obtained complied with the standard for class C water.
    According to the Kruskal-Wallis Test, the temperature has a significant difference among the three sites during November (p = 0.023) and January (p = 0.038). The distinction of measurements of temperature for November is observed between Site 2 and Site 3 (p = 0.006), while no significant difference is observed between Site 1 and Site 2 (p = 0.169), and Site 1 and Site 3 (p = 0.169). The disparity of measurement during January is observed between Site 1 and Site 3 (p = 0.011), while a marginal difference is observed between Site 1 and Site 2 (p = 0.134) and Site 2 and Site 3 (p = 0.295). On the other hand, the p-value of temperature during December (p = 0.066), February (p = 0.054), and March (p = 0.193) are observed to be insignificant.
    According to the Friedman Test, the temperature in Site 1-3 shows that there is no similarity between the five-sampling period as the results of the p-value (p = 0.31) of each month differ from one another. In comparison, temperature is directly proportional to the turbidity of water; as the turbidity increases, the water temperature increases as high turbidity increases the water temperature due to the particles absorbing sunlight. As studied by Mandal (2014), turbidity affects the water temperature as the suspended particles in the water column absorbed and scattered the sunlight.

    4.3.2. Turbidity

    Turbidity is the number of suspended solids present in water. It determines how clear the water is, which also affects other parameters. Figure 6 showed the measurement of the turbidity in the three sampling sites during the five-month sampling period.
    Based on the data collected during the sampling period, shown in table 3, it was observed that the result for turbidity during the five-month sampling period ranges from 8 to 24 NTU.
    The turbidity was highest during January with values ranging from 15.00 to 24.00 NTU from Site 1 to Site 3. An environmental phenomenon was observed during the sampling, wherein heavy precipitation occurred; thus, one possible factor that caused high turbidity was the run-off. The surface area, especially the soil with less vegetation, is more exposed to rainfall washing organic and inorganic materials off the surface increasing the load of sediment in the river (Liu et al., 2023). On the other hand, turbidity was lowest at 8.000 NTU in Site 2 in November, and Site 1 in December and February. The result can be inferred from the result of temperature where the low temperature was measured in Site 2 in November and Site 1 in December. According to the study of Shi et al. (2022), when water temperature becomes high, the turbidity increases, thus, a low-temperature results in low turbidity.
    According to the Kruskal-Wallis Test, there is a significant difference in turbidity among the three sites during the five-month sampling period – November to March (p = 0.018). A significant difference in turbidity for November is observed between Site 2 and Site 3 (p = 0.005), while an insignificant distinction is observed between Site 1 and Site 2 (p = 0.157) and Site 1 and Site 3 (p = 0.157). During December, a significant difference is ascertained between Site 1 and Site 2 (p = 0.014) and Site 1 and Site 3 (p = 0.014), while no significance is depicted between Site 2 and Site 3 (p = 1.000). The significant distinction of turbidity measurement in January is observed between Site 1 and Site 2 (p = 0.014) and Site 2 and Site 3 (p = 0.014), while the insignificant difference is observed between Site 1 and Site 3 (p = 1.000). During February, a significant difference in turbidity value is observed between Site 1 and Site 2 (p = 0.005), while no significant difference is observed between Site 1 and Site 3 (p = 0.157) and Site 2 and Site 3 (p = 0.157). Lastly, a significant distinction of measurement of turbidity during March sampling is observed between Site 1 and Site 3 (p = 0.014) and 2 and Site 3 (p = 0.014), while no significant difference is observed between Site 1 and Site 2 (p = 1.000).
    According to the Friedman Test, there is a significant difference in the measurement of turbidity in Sites 1 to 3 across the five sampling months (p = 0.017). Site 1 showed significant differences between December and January (p = 0.020), December and March (p = 0.020), February and January (p = 0.020), and February and March (p = 0.020). In Site 2, there are significant differences depicted in November and January (p = 0.007), and November and February (p = 0.007). On the other hand, no significant differences were observed between the five-sampling months for Site 2. Moreover, significant differences for Site 3 were observed between February and March (p = 0.002). Argenal and Gomez (2016) said that turbidity and dissolved oxygen are inversely related as the less dissolved oxygen was present in the water sample, the more turbid the water is. One factor that influences the relationship between dissolved oxygen and turbidity is anthropogenic activities as it plays an extensive role in keeping the turbidity level high in the water sample.

    4.3.3. Total Dissolved Solids (TDS)

    Total dissolved solids (TDS) are the measurement of both inorganic and organic substances present in water. In addition, the TDS measurement is commonly expressed in milligrams per liter (mg/L). Figure 7 showed the measurement of the TDS in the three sampling sites during the five-month sampling period.
    Based on the results obtained from total dissolved solids (TDS) analysis during the five-month sampling period, the concentration of TDS ranged from
    896.5 to 6029.9 mg/L. Among the five-month sampling period, TDS was observed to be highest in Site 3 in November, December, January, and March having concentrations of 911.8, 6029.9, 3437.7, and 3555.5 (in mg/L), respectively, while the TDS in February sampling was observed to be highest in Site 2 at 2695.4 mg/L. Whereas the highest concentration of TDS was observed in Site 2 (5507.6 mg/L) and Site 3 (6029.9 mg/L) in December. The high TDS concentration was caused by soil erosion, runoff, suspended particles from decayed plants or animals, and wastewater effluent by households or the agricultural sector near the Kaingen River that settled in on the bottom part of the river. In contrast, the TDS concentration in Site 3 was highest due to emissions from households/establishments near the bay that might have emitted inorganic salts such as potassium, calcium, bicarbonate, sulfates, and such (Chen et al., 2021). On the other hand, the lowest concentration of TDS was observed in Site 2 in November at 896.5 mg/L. It appeared to be lowest due to few human activities occurring on the site as well as it was far from other sources of pollution, specifically heavy metal pollution (Kadarsah et al., 2020).
    According to the Kruskal-Wallis Test, the measurement of total dissolved solids (TDS) has a significant difference among the three sites during December (p = 0.027), January (p = 0.027), February (p = 0.05), and March (p = 0.027). During December, significant distinction in TDS measurement is depicted between Site 1 and Site 3 (p = 0.007), while insignificant differences are observed between Site 1 and Site 2 (p = 0.178) and Site 2 and Site 3 (p = 0.178). During January, it was noticeable that a significant difference in measurement is found between Site 1 and Site 3 (p = 0.007), while no significant distinction is observed between Site 1 and Site 2 (p = 0.178) and Site 2 and Site 3 (p = 0.178). For February, a significant difference is observed between Site 1 and Site 2 (p = 0.017), while there is a negligible difference in TDS measurements between Site 1 and Site 3 (p = 0.100) and Site 2 and Site 3 (p = 0.454). Moreover, it was discernable that there is a significant difference in TDS value between Site 1 and Site 3 (p = 0.007), while a negligible difference is observed between Site 1 and Site 2 (p = 0.178) and Site 2 and Site 3 (p = 0.178) during March. On the other hand, no significant difference in TDS measurement among the three sites is observed during November (p = 0.414).
    According to the Friedman Test, the distribution of total dissolved solids (TDS) in sites 1-3 showed that there is no similarity between November 2022 to March 2023. The significant differences, based on pairwise comparison, were observed in the months of November-February (p = 0.020), November-March (p = 0.002), and January-March (p = 0.020) for Site 1, and the months of November- March (p = 0.020), November-December (p = 0.002), and February-December for sites 2 and 3. This may be attributed to several environmental factors such as phosphates, nitrates, and conductivity in which TDS is directly proportional. According to Rusydi (2018), TDS and conductivity have a direct relationship which is used to describe salinity level expressed with an equation: TDS = 0.65 × conductivity (in 25 °C). Moreover, TDS can also be affected by certain anthropogenic activities such as the dumping of organic wastes.

    4.3.4. Salinity

    Salinity is the measurement of dissolved salt in water which then affect the circulation of ocean current due to variation in density in different region. Moreover, salinity measurement is expressed in milligrams per liter (mg/L). Figure 8 showed the measurement of the salinity in the three sampling sites during the five-month sampling period.
    Based on the results of salinity during the five-month sampling period, the salinity of Site 1 to Site 3 ranged from 689.7 to 4638.4 mg/L. During the five-month sampling period, high salinity concentration was observed in Site 3 in November, December, January, and March at 701.4, 4638.4, 2644.4, and 2050.0 (mg/L), respectively, while the highest accounted salinity was observed in Site 2 and Site 3 in December with a concentration at 4236.7 mg/L and 4638.4 mg/L. The data also showed a low salinity concentration in Site 2 in November at 689.7 mg/L. The factors that affect the salinity level are conductivity and total dissolved solids (TDS) having a directly proportional relationship, as shown in table 3, that as the conductivity increases, the total dissolved solids and salinity increase resulting in salty water, thus a more concentrated salinity level. The low salinity level is caused by precipitation wherein it dilutes the salt concentration in water (Liu et al., 2020). As observed in the data, November has the lowest salinity among all the sampling months ranging from 689.7 to 701.4 mg/L, unlike December to March where salinity ranged from 805.7 to 4638.4 mg/L. According to the PAG-ASA weather forecast in November 2022, low pressure (LPA) will bring heavy rains and thunderstorms within CALABARZON. Hence, when the sampling was conducted in November, the water is affected by the precipitation, thus low salinity level. Aside from that, saltwater intrusion in the coastal area could also increase the salinity level (Halder, 2023) in the sampling area specifically on the riverbank during a certain period. Saltwater intrusion could happen through sea level rise, excessive pumping of ground water which can be observed in the area where a water pump is present, or when the groundwater recharge reduces (Bayabil et al., 2021).
    According to the Kruskal-Wallis Test, the measurement of salinity has a significant difference among the three sites during December (p = 0.027), January (p = 0.027), February (p = 0.050), and March (p = 0.027). During December, a significant distinction in salinity values is observed between Site 1 and Site 3 (p = 0.007), while a negligible difference is observed between Site 1 and Site 2 (p = 0.178) and Site 2 and Site 3 (p = 0.178). For January, it was observed that salinity has a significant difference between Site 1 and Site 3 (p = 0.007), while no significant distinction is observed between Site 1 and Site 2 (p = 0.178) and Site 2 and Site 3 (p = 0.178). A significant difference in salinity during February sampling is observed between Site 1 and Site 2 (p = 0.017), while a negligible difference was observed between Site 1 and Site 3 (p = 0.100) and Site 2 and Site 3 (p = 0.454). Lastly, the difference in salinity measurement during March is observed between Site 1 and Site 3 (p = 0.007), while a negligible distinction is observed between Site 1 and Site 2 (p = 0.178) and Site 2 and Site 3 (p = 0.178). Conversely, the salinity of the three sites during November showed no significant difference (p = 0.414).
    The Friedman Test for the distribution of salinity in sites 1-3 showed that there is a significant difference between November 2022 to March 2023. The pairwise comparison for the months of November-March (p = 0.020), November- December (p = 0.002), and February-December (p = 0.039) for sites 2 and 3, and the months of November-March (p = 0.020), November-February (p = 0.020), and January-March (p = 0.020) for Site 1 showed that there were differences in distributions of salinity. This can be attributed to several environmental factors such as saltwater intrusion, wherein nearby coastal areas affect the salinity of freshwater (Halder, 2023). In addition, the temperature has a direct relationship with salinity. The highest temperature for all sampling sites was recorded in March, which explained why the salinity level highly increased compared to previous months.

    4.3.5.Conductivity

    Conductivity measures the ability of water to conduct electric current. It determines the number of substances dissolved in water, chemicals, and mineral content. Measurement of conductivity is expressed by micro siemens per centimeter (µS/cm). Figure 9 showed the measurement of the conductivity in the three sampling sites during the five-month sampling period.
    Based on the results of conductivity during the five-month sampling period, the conductivity of Site 1 to Site 3 ranged from 1400.7 to 9276.7 µS/cm. During the five-month sampling period, high conductivity was measured in Site 3 in November, December, January, and March at 1402.7, 9276.7, 5288.7, 5470.0, respectively, while the highest measured conductivity was observed in Site 2 (8473.3 µS/cm) and Site 3 (9276.7 µS/cm) in December. Whereas, low conductivity was measured in Site 2 in November at 1379.3 µS/cm. As observed in table 3, conductivity, TDS, and salinity have a directly proportional relationship, as the conductivity increased, TDS and salinity increased. Conductivity can be used to determine the total dissolved solids (TDS) and both parameters can be used as indicators of salinity level in studying seawater intrusion. Thus, as both total dissolved solids and salinity increase, the conductivity also increases (Rusydi, 2019).
    According to the Kruskal-Wallis Test, the conductivity values measured have a significant difference among the three sites for December (p =0.027), January (p = 0.027), February (p = 0.050), and March (p = 0.027). For December, a significant difference in conductivity measurement is observed between Site 2 and Site 3 (p = 0.007), while an insignificant difference is observed between Site 1 and Site 2 (p = 0.178) and Site 1 and Site 3 (p = 0.178). A significant distinction of measurement is observed in January between Site 1 and Site 3 (p = 0.011), while a negligible difference is observed between Site 1 and Site 2 (p = 0.178) and Site 1 and Site 3 (p = 0.178). Further, it is observed during February that there is a significant difference in conductivity values between Site 1 and Site 2 (p = 0.017), while it is insignificant between Site 1 and Site 3 (p = 0.100) and Site 2 and Site 3 (p = 0.454). Subsequently, it is observed during March that there is a significant difference between Site 1 and Site 3 (p = 0.007), while no significant distinction is observed between Site 1 and Site 2 (p = 0.178) and Site 2 and Site 3 (p = 0.178). On the other hand, no significant difference in conductivity is observed during November sampling (p = 0.414).
    According to the Friedman Test, the distribution of conductivity in Sites 1 to 3 showed that there are significant differences between November 2022 to March 2023. The significant differences, based on pairwise comparison, were observed in the months of November-February (p = 0.020), November-March (p = 0.002), and January-March for Site 1, the months of November-March (p = 0.002), December- March (p = 0.020), and November-January (p = 0.039) for Site 2, and the months of November-March (p = 0.020), November-December (p = 0.002), and February- December (p = 0.020) for Site 3. Aside from water quality parameters where conductivity has a direct relationship with such as TDS and salinity, dissimilar distribution between months can be attributed to the presence of organic compounds such as oil and humic acid which came from decaying organic materials as discussed in the study of Klučáková (2018).

    4.3.6. Water pH

    The pH is a chemical parameter that determines the basicity or acidity of water. It is important as it can alter the compositions of different parameters in water. Figure 10 showed the measurement of the pH in the three sampling sites during the five-month sampling period.
    Based on the data collected, it was shown in table 3 that the pH was highest in March for sites 1 and 2 with similar pH recorded, that is, 8.150, while it was observed to be highest in Site 3 during November with a pH value of 7.800. The average pH of Sites 1 to 3 from November 2022 to March 2023 ranged from 7.540 to 8.020, with which the highest average pH was recorded in March 2023, while the lowest average pH was recorded in January 2023. However, all five sampling months displayed pH levels that are higher than the neutral pH of 7 which indicates that the water pH of the Kaingen River in Kawit, Cavite has basic pH properties. The occurrence of fluctuations in pH can be attributed to factors including natural and man-made influences. The month of March 2023 garnered the highest average pH of 8.020 despite the same month having the highest recorded average temperature. On the contrary, January 2023 had the lowest recorded average pH, but still basic, which is attributed to its slightly higher temperature - inversely proportional to pH - that reached 30.33°C despite being the second lowest average temperature that was recorded during the 5-month sampling period. Based on the water quality guideline set by DAO-2016-08 for pH in class C water, it was observable that the values obtained complied with the standard ranging from 6.5 to 9.0.
    According to the Kruskal-Wallis Test, it was observed that the pH has a significant difference among the three sites for November (p = 0.026), January (p = 0.026), and February (p = 0.027). During November, a significant difference in pH is observed between Site 1 and Site 2 (p = 0.007), while a negligible difference is depicted between Site 1 and Site 3 (p = 0.176) and Site 2 and Site 3 (p = 0.176).
    A significant difference in pH during January is observed between Site 1 and Site 2 (p = 0.007), while an insignificant difference is depicted between Site 1 and Site 2 (p = 0.176) and Site 2 and Site 3 (p = 0.176). Subsequently, a significant distinction in pH measurement among the three sites for February is observed between Site 1 and Site 3 (p = 0.007), while no significant discrepancy in measurement is shown between Site 1 and 2 (p = 0.178) and Site 2 and Site 3 (p = 0.178). In contrast, the pH in three sampling sites during December (p = 0.106) and March (p = 0.063) showed no significant difference.
    According to Friedman's test, there is a significant difference in pH measurement across the five-month sampling period (p = 0.022). The findings showed significant differences in pH in Site 1 observed between January and February (p = 0.020), January and March (p = 0.002), and November and March (p = 0.39). Further, there is a significant difference in the measurement of pH across the five sampling months at Site 2 (p = 0.017). The data collected revealed a significant difference in pH between January and March (p = 0.020), January and November (p = 0.002), and February and November (p = 0.020) for Site 3. According to Rugebregt and Nurhati (2020), the temperature can contribute to significant errors in the pH of water. The pH level of water is inversely proportional to the temperature of the water, an increase in temperature results in a lower pH level of the water sample.

    4.3.7. Dissolved Oxygen

    Dissolved oxygen is one of several indicators of water quality. It is the amount of oxygen present in water that was produced by aeration. Figure 11 showed the measurement of the DO in the three sampling sites during the five- month sampling period.
    The dissolved oxygen (DO) level ranged from 2.970 to 9.500 mg/L for Site 1, 4.000 to 7.800 mg/L for Site 2, and 3.900 to 9.500 mg/L for Site 3. The DO was observed to be highest in March sampling for Sites 1 to 3 measuring 9.500, 7.800, and 9.500 mg/L, from Sites 1 to 3, respectively. On the other hand, the lowest DO concentration for Site 1 was observed during November sampling at 2.970 mg/L, while during February sampling, both sites 2 and 3 were measured to have the lowest DO level having values of 4.000 and 3.900 mg/L, from Site 1 to 2, respectively. Based on figure 10, the month of March has the highest mean DO concentration at 8.933 mg/L, followed by December at 5.830 mg/L. While low DO was observed in February, November, and January with mean DO (in mg/L) of 4.167, 4.090, and 3.967, respectively. The variation in the DO measurement can be attributed to (1) temperature – having an inverse relationship, wherein the DO level decreases as the temperature increases; vice-versa, (2) industrial and household waste including waste water and high nutrients present which directly reduces the DO concentration in water, (3) and water turbulence increasing the amount DO as it gets higher adding aeration in water (US EPA, 2022). Based on the water quality guideline set in DAO-2016-08 for dissolved oxygen in class C water, it was found that during November, January, and February, the DO concentration did not comply with the minimum DO concentration of ≥ 5.0 mg/L, while during December and March, the concentrations of DO from the two sampling months were above and complied to the standard.
    According to the Kruskal-Wallis Test, the dissolved oxygen (DO) has a significant difference among the three sites for November (p = 0.026) and February (p = 0.048). A significant difference in DO for November is observable between Site 1 and Site 2 (p = 0.007), while there is no significant difference between Site 1 and Site 3 (p = 0.176) and Site 2 and Site 3 (p = 0.176). In February sampling, a significant distinction in DO concentration is observed between Site 1 and Site 3 (p = 0.016), while no significant difference is observed between Site 1 and Site 2 (p = 0.098) and Site 2 and Site 3 (p = 0.452). In contrast, there is no significant difference in DO level across the three sampling sites in December (p = 0.063), January (p = 0.053), and March (p = 0.063).
    According to the Friedman Test, the distribution of dissolved oxygen (DO) in Sites 1 to 3 showed that there is a significant difference between November 2022 to March 2023 (p = 0.18). Major differences in measurement, based on the pairwise comparison, were observed for the months of November-December (p = 0.028), November-March (p = 0.003), and January-March (p = 0.014) for Site 1; February- December (p = 0.020), February-March (p = 0.002), and January-March (p = 0.020) for Site 2; and February-December (p = 0.020), February-March (p = 0.002), and November-March (p = 0.039) for Site 3. This can be attributed to several environmental factors such as salinity, temperature, and anthropogenic activities as they have an indirect relationship to DO. The level of DO for November was significantly lower compared to December due to temperature where higher temperature was recorded in November. Although both January-March and November-March have lower DO records despite having lower temperatures and salinity, anthropogenic activity may contribute since in November and January, the water was more turbid which is due to the release of aquaculture waters.

    4.3.8. Phosphates and Nitrates

    Phosphates and Nitrates are essential for mangroves’ regenerative health and overall growth. Phosphates are a vital nutrient that helps the mangroves convert sunlight into usable energy essential for their cellular growth and reproduction, while nitrates help in synthesizing proteins. Phosphates play a major role in the formation of DNA and cell wall membranes for plants. High levels of phosphate in water can cause eutrophication or algal bloom which produce toxins lethal for both plants and animals. On the other hand, nitrates are essential to aquatic life but can cause significant problems in excessive amount. This could affect other water parameters such as DO, pH, and temperature. High levels of nitrates found in water can cause hypoxia which is a low level of DO in water and toxic to warm-blooded marine animals. Figure 12 showed the measurement of the Phosphate and Nitrate in the three sampling sites during the five-month sampling period.
    The tabulated result presented in Table 3, showed that the phosphate level gathered from November 2022 to February 2023 were 0.6140, 0.8150, 0.7270, and 0.7180 mg/L, respectively. Whereas the concentration of phosphates for March measures 0.4630 mg/L, the result was lower than obtained results of phosphates from November 2022 to February 2023. As set in DAO-2016-08, the standard concentration of phosphates in Class C water is ≤ 0.5 mg/L. Based on the results, only March complied with the standard concentration of phosphates at 0.4630 mg/L, or, below level to the standard set through DAO-2016-08. However, DAO- 2021-19 was issued amending the standard level for some parameters for WQG of DAO-2016-08, including phosphates. The result showed that the phosphates concentration of Kaingen River during the five-month sampling period exceeds the standard level of 0.025 mg/L for Water Quality Guidelines (WQG) of Class C water. The main cause for the high phosphate level in the river was active aquaculture in the area, wherein local fishermen use fertilizers that contain high levels of phosphates, and the discharge directly goes into the river’s bodies of water. Furthermore, the concentration of nitrates gathered from November 2022 to March 2023 was 0.1230, 0.2900, 0.1700, 0.1000, and 0.140 mg/L, respectively. During the five- month sampling period, the nitrates level of Kaingen River was lower than the standard level for nitrates of 7 mg/L as set in DAO-2016-08 for Class C water. According to Singh and Singh (2022), the main cause for low nitrates levels in the river was the natural process of denitrification wherein microorganisms convert nitrates into nitrogen gas. The presence of microorganisms is observable due to the slightest green coloration in water.
    According to Friedman’s Test, it was observed that there is no significant difference in the measurement of phosphates across the five sampling months (p = 0.406). The same result occurred in nitrates, wherein no significant difference was observed during the five- month sampling period. Therefore, pairwise comparisons were not shown.

    4.4. Water Quality Index

    Table 4 summarizes the water quality index of Kaingen River per site during the five-month sampling period using the Weighted Arithmetic Method.
    Based on the results depicted in Table 4, the water quality index in all sites during the sampling period from starting from November 2022 to March 2023 ranged from 108.45 to 159.44 which implied that the water quality in Kaingen River is unsuitable and deteriorated, which means that it is unfit or unsuitable for human consumption.
    The water quality index of the three sites throughout the sampling period all exceeded the 100 range which indicated that all sites were under the unsuitable category. The highest water quality index in November was recorded in Site 3 having a WQI value of 125.64 which was significantly affected due to the high values of turbidity, biological oxygen demand, and phosphates. The highest WQI for December, January, and February was recorded in Site 2, which was mainly caused by the high WnQn of the parameter’s turbidity and phosphates. Lastly, the month of March showed that the highest water quality index was recorded in Site 3 showing a significant difference from the WQI recorded in sites 1 and 2. The high WQI in March was attributed to its high total coliform and turbidity and showed that the phosphate levels in March have significantly dropped in value compared to the preceding months. In a comparison of all the months included in the sampling period, the highest average water quality index was recorded in December 2022, which is equivalent to 154.82, followed by January 2023 with 146.48, February 2023 with an average WQI of 139.96, then November 2022 with 119.96 and March 2023 with 114.58 which was slightly lower than November and all fall under the unsuitable category which indicated that the water in Kaingen River throughout the sampling period was unfit for human consumption. In addition, the average WQI per site including all five months revealed that Site 2 has the highest WQI equivalent to 138.91, followed by Site 3 equivalent to 137.00, while Site 3 garnered the least average WQI equivalent to 129.57. It can be observed that the water quality index was mainly affected by the WnQn values of the parameters including turbidity and phosphates which contributed a lot to the dark and murky appearance of the water in the Kaingen River. However, the most notable water parameter that contributed to the increase in the WQI was the phosphates which have exceedingly high values compared to the other parameters especially starting from December 2022 to February 2023. The increased phosphate levels resulted from anthropogenic activities present in the area (Indicators: Phosphorus | US EPA, 2022). Anthropogenic activities present in the Kaingen River such as fishing have caused the water quality index to appear high. In addition, precipitation runoff and other natural phenomena like tides, weathering, and erosion, as well as the decomposition of debris and leaves may have contributed to its increase. Specifically, phosphate levels tend to increase due to the presence of septic systems in which, according to the survey conducted, at least 65.88% of the total population in Barangay Kaingen have proper sewage systems in their households. In addition to this, frequent occurrence of precipitation runoff from urban areas may have been directed into the river which was also responsible for the river's increase in phosphate levels.

    4.5. Soil Texture and Water Holding Capacity of the Three Sampling Sites in Kaingen River, Kawit, Cavite during the Sampling Period.

    The determination of soil texture was done at the Bureau of Soils and Water Management. The texture of the representative soil samples in total sand, silt, and clay, were analyzed using the Bouyoucos Hydrometer whereas the water holding capacity of the soil samples was measured using the Tapping method of testing. The data and results obtained from the tests are tabulated in Table 5.

    4.5.1. Soil Texture

    Soil texture is the physical characteristic of soil that summarizes the sand, clay, and silt content of the soil. Based on the table depicted above, the textural class of soil in Site 1 for November was classified as clay which was dominated by 46.40% of total clay content. From December to March, the textural class of Site 1 was consistently classified as silty clay loam dominated by the total silt content that ranged from 33.50% to 53.00% over the five months. Site 2 on the other hand, was categorized as sandy loam during November in which the soil was dominated by 80.80% of total sand, followed by clay loam, clay, loam, and clay loam respectively from December to March which was dominated by total clay and loam interchangeably. While Site 3 was classified from clay to silty clay from December to March often dominated by the total clay content that ranged from 42.00% to 46.60%.
    The physical properties of the soil vary depending on the site from where the soil samples were taken and showed differences in results between months. The difference in structure of the soil between the three sites caused significant differences in water-holding capacity, and nutrients such as nitrogen, phosphorus, and potassium. On the other hand, other chemical properties of soil such as organic matter influence the overall soil structure. According to Easton and Bock (2016), the structure of the soil influences the rate of elements such as water and air that can pass through the soil, root penetration, and nutrient availability. Single-grained soils such as sand allow water to percolate at a higher rate compared to structure- less soils such as silt and clay. Thus, clay and silt that are less porous than sand indicate a higher ability to hold moisture in the soil.

    4.5.2. Water Holding Capacity

    Water holding capacity pertains to the moisture content of the soil that persists in the soil after the water is exuded. Figure 13 depicted the water-holding capacity of the three sampling sites during the five-month sampling period.
    The water-holding capacity of soil was dependent on the soil’s structure and texture in which less porous soils have higher water-holding capacities compared to porous soils. From November to March, the water holding capacity of all three sites ranged from 38.10% to 121.40%. During the sampling period, Site 1 has a water-holding capacity ranging from 38.10% to 95.90%, comparatively, the textural class of Site 1 during the sampling period was classified as either clay or silty clay loam which indicated the dominance of clay and silt content. On the other hand, Site 2 ranged from 75.50% to 98.50% from November to February in which the water holding capacity values are higher compared to Site 1. However, Site 2 showed a textural class of sandy loam despite having a higher water-holding capacity value in November. This is due to the higher organic matter in Site 2 in November equivalent to 3.85% which is higher compared to the 0.660% of organic matter in Site 1 in the same month.
    Based on the Kruskal Wallis Test, it shows that there is a significant difference (p = 0.027) in the distribution of the soil’s water-holding capacity across the sites of the five sampling months. This may be attributed to the increase in organic matter due to more presence of macropores that transport the dissolved nutrients, and micropores that oversee water capillary distribution, thus, contributing to the increase in soil water holding capacity as stated by Easton and Bock (2016). The pairwise comparison also showed that Site 1 and Site 2 (p = 1.000) have no significant difference, while Sites 1 and 3 (p = 0.020), as well as Sites 2 and 3 (p = 0.020), showed significant differences. This explains why Site 3 has a higher water holding capacity than sites 1 and 2 despite the contrast in textural classes. The highest water capacity values were recorded in Site 3 ranging from 97.70% to 121.40%. This indicates that the soil in the area has higher water retention due to the soil being less porous as indicated by the textural class of Site 3 ranging from Clay to Silty Clay which is dominated by high clay content in the soil. In addition, several factors such as natural occurrences and anthropogenic activities present in the area caused the increase in organic matter. Comparatively, Site 3 has the highest organic matter values compared to the other two sites which is directly proportional to the soil’s ability to hold water.
    The Friedman test also showed that there is no significant difference (p = 0.189) in the distribution of water holding capacity from November to March of the three sites. This may be attributed to the amount of clay and loam that consistently dominated the soil texture of the three sites from November to March.

    4.6. Soil Physicochemical Characteristics of the Three Sampling Sites in Kaingen River, Kawit, Cavite.

    The physicochemical properties of the soil along the Kaingen River were determined through a series of in-situ and ex-situ soil testing from November 2022 to March 2023. Table 6 shows the parameters for soil analysis include temperature, which was tested in-situ using a laboratory thermometer while soil pH, nitrogen, phosphorus, and potassium were tested using the colorimetric method from the Bureau of Soils and Water Management (BSWM) Soil Test Kit. Soil Organic Matter was tested in the laboratory using the Walkley and Black Method while Soil Organic Carbon was obtained by dividing the organic matter to 1.72. The data and results obtained from the tests are tabulated as presented in Table 6 and Table 7.

    4.6.1. Soil Temperature

    Soil temperature is a significant environmental factor that influences the physical and chemical processes occurring in soil. Figure 14 presents the soil temperature of the three sampling sites during the five-month sampling period.
    Based on the data gathered and presented in Figure 14, the soil temperature of all three sites from November 2022 to March 2023 ranged from 26.00°C to 31.00°C. The highest recorded temperature in sites 1 and 3 were recorded in November which are 31.00°C and 30.20°C respectively, while the highest soil temperature in Site 2 were recorded in November and March which both reached 29.50°C. On the other hand, the lowest soil temperature recorded for Sites 1 and 2 was in November and Site 3 was in January. The difference in the range of soil temperature from each site across varying months can be attributed to different factors such as the amount of solar radiation that is absorbed by the soil, and the vegetative cover (Onwuka & Mang, 2018). The amount of solar radiation absorbed is dependent on the moisture content of the soil as heat is directly proportional to the moisture content caused by the difference in soil texture of each site. Heat travels at a higher rate in soils with higher moisture content compared to soils with low moisture content because of the pockets of air present in drier soils. The textural class of the soil in Site 1 in November was classified as clay which has high water retention while Site 3 was unidentified, however, has a 98.40% water-holding capacity. Site 2 on the other hand, has a textural class of sandy loam but has a water holding capacity of 84.10% in November which is still high, thus the difference in the soil moisture content is associated with heat dissipation rate contributing to the contrast in temperature between sites.
    According to the Kruskal Wallis Test, there is no significant difference (p = 0.398) in the soil temperature across the sites of the five sampling months. Change in soil temperature in an area is also associated with the variation in weather conditions that occurred from November 2022 to March 2023. The Friedman Test showed that there is no significant difference (p = 0.137) in the distribution of temperature from November to March of the three sites. Heavy precipitation was evident during the sampling period which caused slight fluctuations in soil temperature. However, provided that all three sites are in the same area, each site may have received the same amount of rainfall and shade caused by the monsoons throughout the months. Moreover, each site from which the soil samples were taken is slightly covered by the sunlight provided by the population of present mangrove trees, thus, contributing to a marginal difference in the recorded temperature of the soil samples.

    4.6.2. Soil pH

    Soil pH measures how acidic or alkaline the soil is, which is essential to identify the availability of nutrients that can be dissolved in the soil. Figure 15 showed the soil pH of the three sampling sites during the five-month sampling period.
    The recorded soil pH of sites 1, 2, and 3 for November, December, January, February, and March are all the same at 5.800 which indicated that the soil samples for the four consecutive months were moderately acidic based on the standard classification in the Bureau of Soils and Water Management Manual that adopted the same classification in from the United States Department of Agriculture. The 5.800 pH levels recorded from November 2022 to March 2023 indicated that the soil is still tolerable for the survival of mangrove trees. This is supported by Alsumaiti and Shahid (2018), in which it was claimed that mangroves cannot withstand soils with extreme pH that are not within the 5.16 to 7.72 pH range. One cause of low soil pH is the amount of precipitation an area is experiencing; thus, greater precipitation indicates that there is a higher intensity of leaching and weathering of basic alkaline minerals in soil which leads to the acidification of the topsoil.
    According to the Kruskal Wallis Test, the soil pH shows no significant difference (p = 1.000) in the soil pH between sites 1, 2, and 3 over the five-month sampling period. This can be attributed due to the presence of anthropogenic activities that are evident in all three sites. Site 1 is the area closest to residential spaces and is more accessible to the public. Site 2 and 3 on the other hand, although slightly farther than Site 1, face the open Bacoor Bay wherein anthropogenic activities such as fishing are present. In addition to this, the Friedman Test showed that there is no significant difference (p = 1.000) in the distribution of pH from November to March of the three sites. Soil pH differs in varying locations because of an area's climate. Dry or arid climates have higher soil pH, thus, are basic whereas humid or wet climates have lower soil pH, making them acidic (Zhang et al., 2019). The Philippines, being a tropical country, experiences intense precipitation most especially during October to late March due to monsoons, thus explaining the consistent acidic nature of the soil of all three sites.

    4.6.3. Organic Matter

    Organic matter is the main source of carbon in the soil that supports the soil by improving its chemical, physical, and biological functions. Figure 16 depicted the soil organic matter of the three sampling sites during the five-month sampling period.
    Soil organic matter of all sites from November to December ranges from 0.6600% to 12.28%. The soil organic matter of Site 1 and 2 was highest during February which is equivalent to 6.380% and 6.300%. Site 3 on the other hand has the highest recorded organic matter among all the months which was recorded in December, equivalent to 12.28%. Climatic conditions such as soil temperature and precipitation affect the organic matter content of the soil. This was evident in the heavy precipitation that occurred during December which garnered the highest recorded organic matter of 12.28% compared to all sites and sampling months. The values of organic matter from November to March in Site 3 were significantly higher compared to the range of OM in the other two sites. The factors that change the amount of organic matter in soil are attributed to climatic conditions and increasing clay content. As seen in the table of results of the soil's physical test, Site 3 has a textural class ranging only from Silty clay to clay and has a clay content that ranges from 42.00% to 46.60%, which was significantly higher than the other sites, contributes as a factor as to why Site 3 has higher organic matter compared to the other two sites.
    According to the Kruskal-Wallis Test, there is a significant difference (p = 0.008) in the soil organic matter between the three sites across the five sampling months which can be attributed to the different soil texture between Sites 1 to 3. In addition, several anthropogenic factors such as the presence of decomposed leaves occur in the area because of the survey conducted with residents. The significant difference between sites also produced a pairwise comparison wherein sites 1 and 2 showed no significant difference (p = 0.525) in the amount of organic carbon due to both sites having a high percentage of loam other than clay content. Both soil particles are less porous and therefore, the presence of both textures increases the amount of organic matter in the soil. While sites 1 and 3 (p = 0.003) and sites 2 and 3 (p = 0.020) showed significant differences in soil organic matter between the three sites during the five-month sampling period due to their comparative differences in soil texture. The bonds that occur between the surfaces of clay particles delay the decomposition process of organic matter. This is supported by Wei et al. (2014) in which it was stated organic matter rates increase as the clay increases as well. Soil organic matter also increases the water- holding capacity of soil which contributes to the dark coloration of the soil and increases the soil’s ability to absorb temperature. Based on the results, Site 3 which holds the highest OM values and clay content during the five sampling months also displayed the highest values of water-holding capacity ranging from 97.70% to 121.40%, with January being the highest. In addition, based on the Friedman Test it showed that there is no significant difference (p = 0.308) in the distribution of organic matter between November to December of all three sites which may be attributed to the consistent textural class of each site from November to March that affects the organic matter content of the soil.

    4.6.4. Organic Carbon

    Organic carbon is the main component of organic matter. It is responsible for determining the quality and fertility of the soil by providing improvements to the soil’s physic-chemical properties. Figure 17 presented the soil organic carbon of the three sampling sites during the five-month sampling period.
    The soil organic carbon in all three sites across five sampling months ranged from 0.380% to 7.140%. Site 1 ranged from 0.3800% to 3.710% wherein the highest was recorded in February sampling. Organic carbon in Site 2 ranges from 1.020% to 3.660% wherein the highest organic carbon was recorded in February as well. Site 3 on the other hand, has the highest recorded organic carbon among all the months which was recorded in December, equivalent to 7.140%. Changes in soil organic matter carbon are attributed to several physical factors including the textural class of soil wherein a higher percentage of clay plays an important role in maintaining the amount of organic carbon in the soil while the temperature is responsible for affecting plant productivity which affects the organic carbon directly.
    According to the Kruskal-Wallis Test, there is a significant difference (p = 0.008) in the organic carbon content of soil across the three sites in all five sampling months. Factors that affect soil organic carbon content include the physical composition of the soil, wherein soils with higher organic carbon are associated with finer soil grain size and higher water content (Yang et al., 2021). This explained why Site 3 with the highest clay content and water-holding capacities has the highest organic carbon values, ranging from 96.50% to 121.4%, compared to the other two sites. However, the pairwise comparison showed that sites 1 and 2 (p = 0.525) do not have a significant difference in organic carbon content due to both sites having a closer range of values. On the other hand, a comparison between sites 1 and 3 (p = 0.020) and sites 2 and 3 (p = 0.003) showed a significant difference in the amount of organic carbon because of the higher range of values of organic matter recorded in Site 3. The change in soil organic carbon can be attributed to the amount of organic matter present in the soil. Organic carbon is dependent on the amount of organic matter since organic carbon is computed by simply dividing the organic matter value by the 1.72 conversion factor. In addition, based on the Friedman Test showed that there is no significant difference (p = 0.308) in the organic carbon content in soil between the sampling months of the three sites. This is due to the additional factors including precipitation and temperature wherein the organic matter is inversely proportional due to the increased evaporation rate and decreased plant productivity (Zhao, et. al). Temperature, which showed no significant difference between months of all sampling sites explains why there is also no observable difference in organic carbon.
    Table 7. Nitrogen (N), Phosphorus (P), and Potassium (K) of the Three Sampling Sites in Kaingen River, Kawit, Cavite during the Sampling Period.
    Table 7. Nitrogen (N), Phosphorus (P), and Potassium (K) of the Three Sampling Sites in Kaingen River, Kawit, Cavite during the Sampling Period.
    Parameters Sampling Period Sampling Sites
    1 2 3
    November Low High Very High
    December Low Low Very High
    Nitrogen (N) January Very High Low High
    February Very High Very High Very High
    March Very High Low Very High
    November High Very High Very High
    December Very High Very High Very High
    Phosphorus (P) January Very High Very High Very High
    February Very High Very High Very High
    March Very High Very High Very High
    November Sufficient ++ Sufficient Sufficient +
    December Sufficient + Sufficient Sufficient +
    Potassium (K) January Sufficient ++ Low Sufficient
    February Low Sufficient Sufficient
    March Sufficient Sufficient Low
    Nitrogen Range: Low: 0 – 2 High: 3.6 – 4.5 Very High: > 4.5 Phosphorus Range: High: 16 – 20 mg/L Very High: > 20 mg/L.

    4.6.5. Nitrogen (N)

    Based on the data shown in Table 7, the available Nitrogen of Sites 1 to 3 from November to March ranges from Low (0 to 2) to Very High (>4.5%). The highest available Nitrogen recorded in Site 1 was in January 2023, February 2023, and March 2023 in which all were classified as Very High (> 4.5%), Site 2 shows Very High available Nitrogen in February whereas Site 3 has Very High available Nitrogen for November, December, February, and March. However, the slight difference in available Nitrogen is dependent on several factors such as the soil pH, temperature and precipitation, organic carbon, and soil moisture.
    According to the Kruskal-Wallis Test, there is no significant difference (p = 0.135) in the distribution of Nitrogen availability across the three sites during the five months of sampling. The result can be attributed to the consistent value of soil pH (pH 5.8) which has an insignificant difference between the three sites from November to March. Low nitrogen availability in soil indicates that the soil has low organic carbon, which is the main component of organic matter. This explains why sites 1 and 2 have low nitrogen content in the soil as both sites have significantly lower organic matter and organic matter throughout the months that ranged from 0.6600% to 6.380% and 1.760% to 6.300% respectively. On the other hand, Site 3 is interchangeably categorized with high and very high nitrogen content due to the high values of organic matter ranging from 10.03% to 12.28% throughout the months. In addition, temperature has a directly proportional relationship with the available nutrients in soil such as nitrogen wherein the increase in temperature increases the rate of nutrient accumulation in the soil (Geng et al., 2017). This is proved by the result obtained wherein the amount of temperature of the three sites also showed no significant difference and therefore, explained the absence of a significant difference in the available nitrogen between the three sites from November to March. In addition, based on the Friedman Test it also showed that there is no significant difference (p = 0.406) in nitrogen availability in soil between the sampling months of the three sites. This can be attributed to the soil moisture content and amount of organic carbon present in soil which were also both found insignificant between the sampling months of the three sites. Soil organic carbon and available nitrogen are directly proportional according to Wibowo and Kasno (2021), however, organic carbon showed no significant difference between the sampling months and therefore, does not affect the amount of available nitrogen in the soil. The same case also applies to soil moisture which is directly proportional to the soil’s nitrogen availability. The amount of rainfall affects the balance of soil nitrogen, which also includes the processes of the nitrogen cycle, where the decrease in total nitrogen was caused by nitrogen leaching, hence, it explains the low availability of Nitrogen in those months (Zhang et al., 2020). However, the temperature accelerates the accumulation of nitrogen availability in soil, which the result was also found insignificant across the months of the three sampling sites. Therefore, it does not affect the amount of nitrogen in the soil.

    4.6.6. Phosphorus (P)

    The measured value of soil phosphorus is identical throughout November 2022 to March 2023 within the sampling period. All five months fall into the Very High (more than 20 mg/L) range except for Site 1 of November 2022 which was classified as High (16 to 20 mg/L). This indicated that the soil consistently contained 16 mg/L to more than 20 mg/L of phosphorus in the following months of the period. Factors that affect available phosphorus in the soil can be attributed to the soil’s pH levels and organic matter content between the sampling months and across each site. In terms of pH, acidic soils are proportional to the availability of soil phosphorus. On the other hand, organic matter indirectly increases the available phosphorus by increasing the acidity levels of soil. Phosphorus is one of the main soil nutrients that determine the growth of plants.
    According to the Kruskal-Wallis Test, there is no significant difference (p = 0.368) in the available Phosphorus of soil from November to March is the same across the three sites. One of the factors that affect phosphorus availability in soil is the soil pH. This may be due to the consistent value of soil pH (pH 5.8) that has an insignificant difference between the three sites from November to March. In this regard, the data presented show that the monthly pH of 5.8 in each site is one of the factors that may have affected the presence of phosphorus in the soil. The 5.8 pH is close to the maximum soil phosphorus availability ranging between 6 and 7 on the pH scale, as reported by Prasad and Chakraborty (2019). This explains why the Phosphorus in all sites for the entire five consecutive months falls under High to Very High. Consequently, Phosphate forms very strong bonds with aluminum and iron, both of which are abundant in acidic soils. The excretion of waterbirds is another factor that affects the availability of phosphorus in soil in the area. Mangrove soils and vegetation, where phosphorus availability was significantly higher than in typical soil, benefit greatly from the nutrient contributions of waterbirds, as stated by McFadden et. al. (2016). In addition, the Friedman Test showed that there is no significant difference (p = 0.406) in the availability of phosphorus in soil across the sampling months for the three sites. Organic matter content in soil has a directly proportional relationship to the phosphorus availability by providing acidic compounds. Thus, the insignificant difference in phosphorus availability between months of all sampling sites is attributed to the irrelevance in the organic matter content of the soil between months of all sampling sites as resulted of the statistical analysis.

    4.6.7. Potassium (K)

    Soil productivity increases in proportion to the amount of potassium present. The available Potassium of Sites 1 to 3 from November 2022 to March 2023 ranges from Low to Sufficient++. In Site 1, the highest available Potassium was recorded in November and January equivalent to Sufficient ++ in which several factors, including rainfall, moisture content, textural class, and temperature may be responsible for this. Precipitation was evident during January, however, despite the presence of rainfall, November and January have temperatures of 31.00°C and 27.50°C respectively which are still considerably high compared to the other recorded temperatures of other sites and months and textural class during those months' fall under Clay and Silty Clay Loam respectively with clay content values of 46.40% and 33.30%. The combination of different factors contributed to the Sufficient ++ potassium content in the soil.
    According to the Kruskal-Wallis Test, there is no significant difference (p = 0.323) in the distribution of soil potassium between the three sites of all sampling months. The concentration of potassium in the soil’s nutrient availability increases proportionally to the increasing temperature of the soil (Lal & Kumar, 2022). However, previous data suggested that the difference in soil temperature was negligible between sites in all months. Thus, the temperature being insignificant across the sites during the five-month sampling period is attributed to the minimal difference or shows no significant difference at all in the potassium availability across sites of all sampling months. Studies indicate that the difference in the total clay content in the soil at each site causes a difference in the nutrient availability of soil. Soil with higher clay content, due to its compact soil particles, holds onto plant nutrients better than the sand particles. However, according to the Friedman Test showed that there is no significant difference (p = 0.322) in the amount of phosphorus between months of all sampling sites. The availability of potassium in the soil rises as the amount of water in the soil rises wherein increasing soil moisture also boosts potassium's movement to the roots, which increases the nutrient's availability to the plant as stated by the University of Minnesota (2018). In this regard, the moisture content of soil with the presence of high loam and clay content percentage increases the ability of the soil to hold more moisture which increases the uptake of potassium availability. However, water holding capacity has no significant difference between months of all three sites and therefore, may be attributed to the marginal difference of phosphorus across months in all sites.

    4.7. Relationship of Water Quality to the Abundance of Mangrove Trees Found in Kaingen River, Kawit, Cavite

    Pearson’s r Correlation is a test statistic used to identify the relationship between the water quality and abundance of mangroves in Kaingen River. Table 8 showed the summarized results of the abundance of mangrove trees for each water parameter.
    Based on Pearson’s r Correlation Test, the temperature (r = -0.032; p = 0.911), turbidity (r = -0.298; p = 0.28), total dissolved solids (r = 0.16; p = 0.568), salinity (r = 0.16; p = 0.568), conductivity (r = 0.16; p = 0.568), pH (r = 0.288; p = 0.299) and dissolved oxygen (r = 0.054; p = 0.849) were observed to have negligible correlation and has no significant relationship with the abundance of mangroves as the p-values obtained were above the significance level of 0.05 (two-tailed).
    Temperature is an indicator of the absence and presence of mangroves, a sudden fluctuation can negatively affect the ability of mangroves to photosynthesize, hence, distorting their ability to flourish. Mangroves only survived at temperatures above 19° C and not exceeding 10 ° C (Noor et al., 2015). Although Table 3 showed that the temperature of water in Kaingen River is accepted for mangrove habitat, the result of Pearson’s r correlation resulted in a negligible correlation and was not significant in mangrove abundance (r = -0.032; p = 0.911).
    Turbidity measures the clarity and affects the amount of light passing through the water. When water is turbid, it appeared to be cloudy caused by inorganic and organic matter, silt, clay, algae, plankton, and other microbes (Water Science School, 2019). Based on the correlation between the mangrove abundance and turbidity, there is no significant relationship between the two variables (r = 0.16; p = 0.568).
    Dissolved oxygen is an indicator of healthy water bodies. According to the study of Chunkao et al., (2012), mangrove communities increase the amount of DO concentration in water. However, the correlation obtained depicted that the DO has a negligible correlation with the mangrove abundance (r = 0.054; p = 0.849).
    Salinity is a key environmental factor that controls the growth of mangroves. The study of Basyuni et al., (2019) showed that Avicennia alba can resist high salinity, while Rhizophora and Xylocarpus only grow within a specific range, due to their characteristic as non-salt secretors (ultrafiltration). Hence, the growth response of mangroves differs according to the response of mangrove species to a change in salinity concentration. On the other hand, total dissolved solids and conductivity are driving factors to salinity level (Rusydi, 2018), wherein table 3 accounted for a direct relationship within the three parameters. Although the result of Pearson's r correlation showed that salinity, TDS, and conductivity yielded the same r and p-value (r =0.16; p = 0.568), all three parameters have negligible correlation, and therefore, not significant in the abundance of mangroves in Kaingen River.
    The pH of water quantifies the limit of distribution of species in aquatic habitats, it indicates whether an aquatic species can thrive at a certain pH level. Mangroves in Kaingen River have been found to thrive within the pH level of 7.540 to 8.150. The result of Pearson’s r correlation for pH resulted in a negligible correlation and was not significant in mangrove abundance (r = -0.054; p = 0.849).
    Overall, the correlation results showed that the physicochemical parameters of the water measured were not related to the abundance of mangroves in the Kaingen River.

    4.8. Relationship of Soil Quality to the Abundance of Mangrove Trees Found in Kaingen River, Kawit, Cavite

    Pearson’s r Correlation is a test statistic used to identify the relationship between the soil quality and abundance of mangroves in Kaingen River. Table 9 showed the summarized results of the abundance of mangrove trees for each soil parameter.
    According to Pearson’s r Correlation Test, there is a low negative correlation and has no significant relationship between organic matter (r = -0.452; p = 0.090), organic carbon (r = -0.452; p = 0.090), available nitrogen (r = -0.414; p = 0.127), and available potassium (r = 0.226; p = 0.417) with the abundance of mangroves in all sites from November to March. Whereas a negligible correlation and no significant relationship occur between water holding capacity (r = -0.132; p = 0.639), soil temperature (r = -0.187; p = 0.504), and available phosphorous (r = 0.226; p = 0.417), with the mangrove abundance found in all sites during the 5-month sampling period. On the other hand, the soil pH showed that the correlation (r) coefficient cannot be computed because one or more variables of soil pH were constant and therefore, cannot describe its relationship with the abundance of mangrove trees.
    Organic matter indirectly affects the growth of mangroves by influencing the soil structure in which it binds and forms stable soil aggregates, thus, improving the soil structure to increase the water-holding capacity of soil which is beneficial for the growth and distribution of mangroves. A decrease in soil organic matter corresponds to a decrease in the soil’s porosity and turn decreases the soil’s capacity to hold water (Jiao et al., 2020) which is an essential factor that supports mangal abundance in an area. However, Pearson’s r Correlation indicated that there is a low negative correlation (r = -0.452) which infers that as organic matter increases, the abundance of mangroves slightly decreases. It also showed that the relationship between the two is not significant (p = 0.090); therefore, there is no significant relationship that exists between organic matter and the abundance of mangroves in Kaingen River, Kawit, Cavite.
    Soil organic carbon affects the physical property of soil in terms of the soil’s pore structure. The study conducted by Fukumasu et al. (2020), showed that there is a positive correlation between soil organic carbon and pore size distribution in soil which then contributes to the capacity of soil to hold and retain water that is essential for the growth of mangroves. Pearson’s correlation revealed a low negative correlation (r = -0.452) which presents that as organic carbon increases, a slight abundance of mangroves occurs. However, the statistical treatment also presented that the relationship between the two parameters is not significant (p = 0.090). Hence, this indicates that there is no relationship between organic carbon and the abundance of mangroves.
    Nitrogen availability in soil is considered one of the most important nutrients that affect plant growth. According to Pradipta et al. (2021), nutrients such as nitrogen affect the number of photosynthetic processes occurring in mangroves wherein the concentration of nitrogen found in leaves increases the electron transport in the photosynthesis process. However, most mangrove forests thrive even in nutrient-limiting soils, and that nitrogen availability only enhances the mangrove's growth but not its abundance in an area. Thus, the difference in the abundance of mangroves at each site despite the values of nitrogen availability shows that there is a low negative correlation (p = -0.414) which means that as nitrogen availability increase, the abundance of mangroves sightly decrease in Kaingen River, Kawit, Cavite but also shows that it is not significant (r = 0.127). Therefore, the result indicates the absence of a significant relationship between available nitrogen in soil with the abundance of mangroves.
    Potassium availability in the soil is an internal factor that influences the abundance of mangroves in an area. Potassium is utilized in fertilizers, boosting soil fertility, and serving as an indicator of healthy plant growth. A lack of potassium in the soil may result in unhealthy plant development (Sofawi et al., 2017). Several variables, including precipitation, moisture content, textural class, and temperature, may have contributed to the highest Potassium availability at each site. The statistical test revealed that there is also a low negative correlation (r = -0.384) which means that as potassium increases, a slight decrease in the abundance of mangroves occurs. However, it also showed that it is not significant (p = 0.158) which indicates that there is no significant relationship between soil potassium availability and mangrove abundance.
    The water-holding capacity of soil is the ability of soil to retain moisture. It pertains to the moisture content of the soil that persists in the soil after the water is exuded. A higher water holding capacity estimates the highest volume of water that is stored by the soil that will be utilized by plants for growth and survival (Zhang et. al, 2021). However, results showed a negligible correlation (r = -0.132) between the two variables which also showed that it is not significant (p = 0.639). In conclusion, there is no existing significant relationship between water-holding capacity and mangrove abundance.
    Soil temperature is one of the main factors that influences the spread of mangroves in the ecosystem. Higher density of mangrove populations tends to grow in sheltered tropical and subtropical temperatures which have higher temperatures which are commonly abundant along the Southern and Northern Hemispheres (Ward et al., 2016). The soil temperature varies according to the fluctuations in atmospheric and solar temperature, hence, an increase in solar and atmospheric temperature also increases the temperature of the soil. The increase in the temperature increases the rate of evaporation in soil, thus increasing the soil salinity. The increase in salinity affects mangroves by slowing their growth rates. Comparing the three sites, Site 2 with the slightly lower range of soil temperatures garnered the highest number of total mangroves found in the site whereas Site 1 having the highest range of temperatures from November to December shows the least number of total mangroves found within the site. However, the results indicate a negligible correlation (r = -0.187) between soil temperature and the abundance of mangroves which is also not significant. Therefore, there is no significant relationship between the temperature of the soil and the mangrove abundance in the Kaingen River.
    The amount of phosphorus present in the area is one factor that influences the growth and abundance of mangroves. Throughout the entirety of the sampling period, the value of the phosphorus that was measured was consistently between 16 and more than 20 milligrams per liter (mg/L). Insufficient levels of phosphorus and potassium in soil are classified as inadequate nutrients that cannot sustain plant growth. It has been suggested by Alhassan et al. (2021) that because of the decreased levels of nitrogen and phosphorus in the soil, it may cause dwarfism in mangrove trees. Additionally, the concentration of phosphorus in the soil may have been influenced by various factors, including the soil’s pH level and the presence of avian fauna in the area. This shows a negligible correlation (p = 0.226) between the abundance of mangroves and the availability of phosphorus in the soil, as evidenced by the consistent levels of phosphorus across various sites but also showed that it is not significant which concludes that the relationship occurred between available phosphorus and mangroves abundance is not significant.
    Moreover, soil pH is another external factor that affects the growth and abundance of mangroves in an area. According to Alsumaiti and Shahid (2018), it was claimed that mangroves cannot withstand soils with extreme pH that are not within the 5.160 to 7.720 pH range. Based on the results of the tests for soil pH, all three sites from November 2022 to March 2023 have a consistent soil pH of 5.800 which falls under moderately acidic pH for soil, thus, showing that the soils in all three sites are within the tolerable range of soil pH for the survival of mangroves. However, consistency in soil pH values indicates constant variables and therefore cannot identify both the relationship between soil pH and mangrove abundance, as well as their significance in their relationship.
    Overall, the correlation results showed that the physicochemical parameters of the soil measured are not related to the abundance of mangrove in Kaingen River, except for the soil pH where its relationship to mangrove abundance was not determined since the value of the variable was constant.

    4.9. Mangrove Trees Inventory in Kaingen River, Kawit, Cavite, Philippines

    The species of mangrove trees present along the river of Kaingen were initially identified using Dr. J.H. Primavera's manual Field Guide to Philippine Mangroves (2009) and (2022) and were then verified by Dr. Primavera as well as Jose Vera Santos Memorial Herbarium, Institute of Biology in the University of the Philippines – Diliman. The percentage occurrences quantify the population of mangrove trees found in each sampling site and determine the abundant mangrove species within the Kaingen Riverine ecosystem. The result for the percentage occurrences of mangrove trees was presented in Table 10.
    Based on the tabulated data presented in Table 10, Avicennia alba was observed to be dominant in Site 1, while Rhizophora mucronata of family Meliaceae became dominant in sites 2 and 3. Among all three identified mangrove species present in three sites, Rhizophora mucronata was the most abundant having 218 total trees and an occurrence of 85.16%, followed by Avicennia alba with an abundance of 24 and a total occurrence of 9.380%. On the other hand, the least abundant mangrove species was Xylocarpus granatum with only 14 total trees and a total occurrence of 5.470%.
    The biodiversity and conservation status of mangrove trees is necessary to monitor their biological status and whether the trees were categorized in the International Union for Conservation of Nature (IUCN) Red List or known as the list of threatened, endangered, and critically endangered flora and fauna across the world. Table 11 showed the biological and IUCN status of Mangrove trees found in the Kaingen River.
    Based on tabulated data presented in the table, the biodiversity and conservation status of mangrove species found in three sampling sites of Kaingen River showed that only Avicennia alba commonly known as Bungalon was introduced in the Philippines. All three species of mangroves were categorized as least concerned according to the International Union for Conservation of Nature (IUCN). Moreover, an accessory tree was found in Site 2 alongside mangrove trees of Kaingen River called Thespesia populneoides of the family Malvaceae or commonly known as Banago. It is a flowering plant native to terrestrial (coastal forest) and shorelines where mangroves are thriving. This accessory tree has introduced biological stats and is usually found in tropical regions of the world, including the Philippines.
    The Species Importance Value of the mangrove species was determined by calculating the relative frequency (Rf), relative abundance (RA), and relative dominance (RD), and were ranked from highest to lowest species importance value as summarized in Table 12.
    The table illustrated that Rhizophora mucronata exhibited the highest species importance value, as indicated by its 87.50 IV. Rhizophora mucronata, which held the highest Importance Value (IV) ranking, exhibited abundance within Site 2 of the mangrove forest. The study of Rastegar and Gozari (2017) has reported that Rhizophora mucronata, commonly referred to as Asiatic mangrove, is distributed in tropical and sub-tropical regions along coastal areas. Rhizophora mucronata is a crucial constituent of the mangrove ecosystem, as this species plays an essential part in safeguarding the adjacent terrestrial regions from the deleterious impacts of the marine environment. Specifically, Rhizophora mucronata contributes to shoreline stabilization and serves as a protective barrier against high-velocity winds and storms.
    Ranked as the species with the second highest importance was Avicennia alba showing an importance value of 11.72. This species was found in all three sites of the riverine system and the most abundant species of mangrove in Site 1. Avicennia alba is a woody type of mangrove species that is known to have a high salt tolerance and can adapt to extreme saline conditions. In addition, Avicennia alba is an important species of mangrove because of its salt exclusion abilities. The species of Avicennia ranked as first among the salt-secretor species of mangroves. Salt secretors allow the species to exclude excess amounts of salts through their leaves and root systems, thus, not only tolerating salt but also maintaining salt concentration in its system (Basyuni et al., 2019). Furthermore, Avicennia species are also known to have thinner leaves containing fewer chemicals such as lignin – species with a higher decomposing rate than other mangrove species, such as Rhizophora mucronata, which contributes more nutrients to the environment (Muliawan & Bengen, 2020).
    The mangrove species that ranked third and has the least species importance was the Xylocarpus granatum with an importance value of 7.813. Unlike the other two species, Xylocarpus granatum was found only in Site 2 which accounted for a total of 14 trees. The root system of Xylocarpus granatum is composed of stanniferous cells which it contains the chemical 'tannin', a derivative of phenolics that prevents infestation of bacteria and fungi as well as reduces the damages caused by excess ions, hydrogen sulfides, and salts (Chorchuhirun, 2020). According to Siddique et al. (2017), although Xylocarpus granatum was able to thrive better in non-saline conditions, the species can still adapt in areas with up to 25 PSU (Practical Salinity Unit). This characteristic of mangroves allowed them to perform carbon sequestration and provide other environmental benefits even in moderately saline conditions.

    4.10. Diversity Indices of Mangrove Trees Found in Kaingen River

    To determine the diversity of mangrove trees found in three sampling sites in Kaingen River, Kawit, Cavite, two diversity indices were used to quantify the mangrove trees such as Shannon-Wiener and Simpson’s Diversity Index. Table 13 showed the summarized results of Shannon-Weiner and Simpson’s Diversity Index of mangrove trees found in Sites 1, 2, and 3 of Kaingen River.
    The depicted data from above showed the result of computed value for Shannon- Weiner Diversity Indices of mangroves in the three sampling sites of Kaingen River. The Shannon-Weiner Diversity (H) results were 0.5983 (Site 1), 0.4311 (Site 2), and 0.1105 (Site 3).
    In Shannon-Weiner Diversity Index, H with a value of 1.99 and below represents very low diversity. Based on the result, all sampling sites were categorized as having very low diversity. However, among the three sampling sites, Site 1 has the higher computed value for Shannon-Weiner diversity (H = 0.5983) and evenness (E = 0.1994). The result for the Shannon-Weiner diversity index can be inferred from the outcome of Simpson's Diversity Index (Ds) such as 0.5714 (Site 1), 0.7899 (Site 2), and 0.9318 (Site 3). According to the principle of Simpson's index, the diversity value ranges from 0 to 1, the higher the value corresponds to the lower diversity. On the other hand, as the dominance (1-Ds) approaches 1, a high diversity of species is found in sampling sites. Hence, among the three sampling sites, mangrove species were diverse (Ds = 0.5714) and dominant (1-Ds = 0.4286) in Site 1. In addition, it also had high diversity in Simpson's index reciprocal (1/Ds = 1.750). The result suggested that Site 1 possessed a more favorable habitat for mangroves than Site 2 and Site 3.
    The difference in quantified mangrove species per sampling site was caused by the uneven distribution of mangrove species driven by the following factors such as human inhabitants near the sampling sites, anthropogenic activities, and soil quality. Site 1 is located near the Kaingen River's entrance and is more likely inhabited by households, and on its other side, a river's flash flood barrier was constructed. Site 2 was usually affected by human activities such as fishing and pathway for boats. Since there were few households on this site, residents are likely to throw waste within the open bodies of water due to insufficient land areas. Furthermore, only one side of Site 3 is inhabited by mangrove trees,
    while the other side is an open body of water separating Bacoor Bay from Manila Bay. Based on Table 10, only two mangrove species were found in Site 1 and Site 3, while three species were found in Site 2. The data showed that even though Site 1 was low in species richness, the site possessed much-distributed mangrove trees than other sampling sites. Both sites 2 and 3 have uneven mangrove distribution, hence, affecting the result of Shannon-Weiner and Simpon’s indices. As supported by Cañizares et al., (2016), the result of their study showed, although Brgy. Imelda of Dinagat Island has a relatively high species richness of mangroves, the uneven distribution of its species resulted in low diversity.
    Another factor that affected mangrove species distribution is the soil quality. During the five-month sampling period, different concentrations of nitrogen, phosphorus, and potassium (NPK) were observed. Nitrogen for Site 1 ranged from 0-2 to >4.5 mg/L which is likely to possess less range of nitrogen concentration than the other two sites with both ranging from 3.6 to >4.5 mg/L. On the other hand, phosphorus concentrations have been consistent for Site 1 which ranged from 16-20 to >20 mg/L, while sites 2 and 3 have been consistent at >20 mg/L. It showed that Site 1 can acquire less phosphorus concentration. Both nitrogen and phosphorus are limiting nutrients for the growth of mangroves, high concentrations can inflect thriving mangrove ecosystems, whereas moderate concentrations are best for mangrove trees. Subsequently, the concentration of potassium among the three sampling sites is as follows: Site 1 (low to sufficient ++), Site 2 (low to sufficient), and Site 3 (low to sufficient +). It can be inferred that during the five- month sampling period, Site 1 can potentially yield a substantial amount if potassium (sufficient++) suitable for mangrove trees. In the mangrove ecosystem, potassium is an essential nutrient that helps mangroves to regulate protein synthesis, osmotic pressure, and photosynthesis.
    To determine the similarity of the three sampling sites in terms of mangrove species composition, Sorensen’s Index of Similarity was used. Table 14 showed the summarized result of an index of similarity between Site 1 and Site 2, Site 2 and Site 3, and Site 1 and Site 3.
    The highest similarity index was found between sites 1 and 3, at 100.0%, while the lowest was found between sites 1 and 2 and between sites 2 and 3 at 80.00%. Possible explanations include the changes in water salinity leading to the introduction of new species on each site. In addition, a few numbers of Xylocarpus granatum species in the area may be due to its competition with Avicennia alba since they are both exclusively pollinated by animals, while Rhizophora mucronata is wind or self-pollinated.
    Moreover, the location of Site 1 and Site 3 could also be a factor that contributed to their similarity index. Both areas were affected by anthropogenic activities, creating large anthropogenic disturbances present in the area. Natural factors may have also contributed to the seed dispersal of the mangrove species since the mangrove forest is a sanctuary for waterbirds.

    4.11. Amount of Carbon Stored and Sequestered Per Mangrove Species

    The mangrove species were identified using Dr. Jurgenne H. Primavera’s Manual Field Guide and verified by the Jose Vera Santos Memorial Herbarium Institute. Table 15 presented the total biomass of each mangrove species and their corresponding amount of carbon stored and sequestered in tons per hectare.
    The calculated aboveground biomass (AGB) and belowground biomass (BGB) were summed to obtain the total biomass in tons per hectare (t/ha) and multiplied by the conversion factor of 0.50 to obtain the amount of carbon stored as referenced from the Intergovernmental Panel on Climate Change (Harishma et al., 2020). Among the three identified species present in the Kaingen River, Rhizophora mucronata has the highest total biomass calculated which yielded the highest carbon stored equivalent to 35.16 tC/ha, while the amount of carbon dioxide sequestered of the species, obtained by multiplying the carbon stored by 3.667, resulted to 128.92 tCO2/ha. This is followed by Avicennia alba which stored 34.92 tC/ha of carbon and sequestered 128.06 tCO2/ha carbon dioxide. Lastly, the least carbon stored, and carbon dioxide sequestered was yielded by Xylocarpus granatum which is equivalent to 1.683 tC/ha and 6.173 tCO2/ha.
    The amount of carbon stored and sequestered were both influenced by the population of each mangrove species. As indicated in Table 15, Rhizophora mucronata garnered the highest total biomass, carbon stored, and carbon dioxide sequestered due to its dominance in terms of abundance equivalent to 190 individual trees. Diana et.al (2021) stated that the carbon absorption rate is higher in a few species, such as Rhizophora mucronata, in which many of its trees are scattered throughout sites 2 and 3. However, Avicennia alba yielded results with only a marginal difference in the same categories despite only having 32 individual mangroves in all three sites. This may be attributed to the diameter size of each mangrove species, in which the same publication stated, that trees with greater diameter at breast height have greater carbon-storing and accumulation capabilities. This explained why Avicennia alba is not far behind Rhizophora mucronata in terms of storing and sequestering carbon due to its massive diameter size ranging from 7.640-54.97 cm despite its small abundance. Lastly, Xylocarpus granatum yielded the least amount of carbon stored and sequestered due to the combination of both its low abundance in the area and smaller diameter size only ranging from 4.270-14.96 cm.
    Based on these findings, the presence of Avicennia alba should be protected and conserved in the Kaingen River. Hence, plant more of this species since it can sequester more CO2 compared to other mangrove species.

    4.12. Calculated Carbon Stored and Sequestered of Mangrove Trees found in Kaingen River

    The Carbon Stored and Sequestered were calculated by determining first the Girth at Breast Height (GBH) and Diameter Breast Height (DBH) of individual species of mangroves present in 3 sampling sites of Kaingen River, Kawit, Cavite. After the verification of mangrove species, the Wood Density (WD) of each species was identified on the official website of the World Agroforestry Wood Density Database. The Aboveground Biomass (AGB) and Belowground Biomass (BGB) were calculated using the values from the Mean DBH per species of mangrove present per site. After that, the sum of AGB and BGB divided by the area of the sampling site was calculated to get the value of Mean Total Biomass (MTB) in Kilogram per square meter (kg/m2) which was then converted into Tons per hectare (tC/ha). Lastly, Carbon Stored was calculated by multiplying the value of MTB by 0.50, whereas Carbon Sequestered was calculated by multiplying the value of MTB by 3.667. Moreover, presented in Table 8 is the summary of the calculation of Carbon Stored and Sequestered.
    Based on the results shown in Table 16, showed that Site 3 has the highest aboveground biomass (AGB) with a value of 12277.50 kg, followed by Site 1 with an AGB value of 12145.35 kg, and Site 2 with an AGB value of 4276.35 kg. For belowground biomass (BGB), Site 3 has the highest BGB value of 4716.35 kg, followed by Site 1 with a BGB value of 4205.67 kg, and Site 2 with a BGB value of 2090.53. For mean total biomass, Site 3 has the highest value with 61.53 tC/ha, followed by Site 1 with 59.20 tC/ha, and Site 2 with 23.05 tC/ha. For carbon stored, Site 3 has the highest value with 30.76 tC/ha, followed by Site 1 with 29.60 tC/ha, and Site 2 with 11.53 tC/ha. Lastly, for carbon sequestered, Site 3 has the highest CO2 stored with a value of 112.81 tCO2/ha, followed by Site 1 with 108.54 tCO2/ha, and Site 2 with 42.27 tCO2/ha.
    The amount of carbon that can be stored by mangroves in their roots and leaves is proportional to the age of the mangroves. The high amount of carbon stored in sites 1 and 3 is due to the older age of mangrove trees in the two sites as referenced by greater diameter at breast height (DBH) measured, whereas the amount of carbon stored in Site 2 was relatively lower because of the smaller DBH. This is supported by Carnell et al. (2022), in which it was stated that the age of mangroves has a significant effect on the amount of carbon stocks, wherein mangroves with ages ranging from 17 to 35 years old double the carbon stored and sequestration rates. On the contrary, the amount of carbon sequestered by sites 1 and 3 is significantly lower than Site 2 despite having high carbon stocks because of the difference in mangrove abundance and spatial distribution. The mangrove trees in Site 2 are more condensed due to the smaller DBH which allows the mangroves to be relatively closer to each other and hence, give way to the growth of more mangrove trees which explains the site’s higher abundance and more carbon sequestered. Mangrove trees in sites 1 and 3, on the other hand, are older and have greater DBH which explained why mangroves in the two sites are scattered and less in number – contributing to the lower amount of carbon sequestered. Lastly, Sites 1 to 3 which represented the mangrove ecosystem of Kaingen River, Kawit, Cavite yielded a total carbon stored of 71.89 tC/ha and a total carbon sequestered of 263.62 tCO2/ha.
    The mangrove forest in Kaingen River has the potential to sequester CO2 in the environment since Site 3 alone can sequester 112.81 tCO2/ha. Accumulatively, sites 1-3 sum up approximately 35% of the entire Kaingen River. Therefore, 35% of the entire Kaingen River accumulated 71.89 tC/ha and sequestered 263.62 tCO2/ha. Even though Site 3 has a greater number of matured mangroves than Site 1, mangroves in Site 1 were able to store and sequester higher concentrations of carbon and carbon dioxide, respectively. Moreover, Site 2 has the highest number of mangroves that are currently in their 1-2 years of age. As concluded in the study of Wiarta et al. (2019) Rhizophora apiculata sequestered more carbon in their 5th year compared to the amount of carbon sequestered in their 1st and 3rd year. This meant that in another 3-4 years, all mangroves that are currently present in Kaingen River, especially in Site 2, will reach their maturity stage and will allow them to maximize their potential to sequester CO2.

    Chapter V

    SUMMARY, CONCLUSION, AND RECOMMENDATIONS

    5.1. Summary

    The study was conducted to determine the potential of mangrove trees present in Kaingen River, Kawit, Cavite, to store and sequester carbon from the environment, as well as identify both water and soil quality and its relationship with the abundance of mangroves throughout the five-month sampling period in three established sampling sites. The three sampling sites were located (1) near the aquaculture site and residential area of Barangay Kaingen, (2) between the aquaculture sites, and (3) the area located at the end of Kaingen River. Water quality was assessed by collecting and measuring physicochemical parameters such as water temperature, pH, turbidity, total dissolved solids, salinity, and dissolved oxygen through in-situ testing. Whereas phosphates and nitrates were sent to Mach Union Laboratories Inc. for testing. The soil quality on the other hand was tested by the researchers using the BSWM Soil Test Kit, while other parameters excluded from the test kit such as soil texture, water holding capacity, and organic matter were analyzed by the Bureau of Soils and Water Management (BSWM) laboratory. Mangrove species were identified using Dr. Jurgenne H. Primavera’s Manual Field Guide (2009) and (2022) and were verified by the Jose Vera Santos Memorial Herbarium, Institute of Biology in the University of the Philippines – Diliman. Diversity indices including the Shannon-Weiner Index, Simpson’s Diversity Index, as well as the Sorensen Index of Similarity, which was used to determine the abundance and diversity of mangroves found in Kaingen River. The amount of CO2 stored and sequestered by mangrove trees were obtained using a non-destructive method of collection by measuring the diameter at breast height (DBH) with the application of allometric equations introduced by Komiyama et al. (2006) for aboveground and belowground biomass. In addition, the use of 0.5 carbon conversion factor was used as referenced on Intergovernmental Panel on Climate Change (IPCC) which was indicated from the studies conducted by Harishma et al. (2020) and Indrayani et al. (2021).
    The results for water quality of Kaingen River yielded results that were based on the DENR Standard for Class C Waters. This includes water temperature ranging from 26.53°C – 34.83°C, turbidity (8.000 NTU – 24.00 NTU), conductivity (1379.3 µS/cm – 9276.7 µS/cm), TDS (896.5 mg/L – 6029.9 mg/L), salinity (689.7 mg/L – 4638.4 mg/L), pH (pH 7.54 – 8.15), DO (3.0 mg/L – 9.5 mg/L), and phosphates 0.463 mg/L – 0.815, which exhibited negligible correlation but not significant. Nitrates (0.1 mg/L – 0.29 mg/L), however, exhibited a low negative correlation but also not significant. On the other hand, soil quality standard was based on the United States Department of Agriculture which yielded soil organic matter (0.66% - 12.28%), organic carbon (0.38% - 7.14%), nitrogen (Low – Very high) and potassium (Low to Sufficient++) which have low negative correlation and has no significant relationship. Phosphorus (High – Very High), water holding capacity (38.1% - 121.4%), and temperature (26.0°C - 31.0°C) yielded negligible correlation and no significant relationship whereas pH (pH 5.8) cannot be computed and therefore, cannot describe its relationship with the abundance of mangrove trees.
    According to the Kruskal-Wallis Test, the water quality parameters that have a significant difference among the three sites with respective months are the following: temperature having a significant difference in November (p = 0.023) and January (p = 0.038); turbidity in November to March (p = 0.018); TDS, salinity, and conductivity on December (p = 0.027), January (p = 0.050), February (p = 0.027), and March (p = 0.027); pH on November to March (p = 0.018); and dissolved oxygen on November (p = 0.026) and February (p = 0.048). Whereas the Friedman test for water quality parameters shows no similarities among the three sites. Temperature on sites 1 (p = 0.031) and 3 (p = 0.017) while Site 2 showed a significant difference at (p = 0.189); TDS in sites 1 (p = 0.017), 2 (p = 0.022), and 3 (p = 0.017); salinity in sites 1 (p = 0.017), 2 (p = 0.022), and 3 (p = 0.017); conductivity in sites 1 (p = 0.017), 2 (p = 0.022), and 3 (p = 0.017); pH in sites 1 (p = 0.022), 2 (p = 0.017), and 3 (p = 0.017); and DO in sites 1 (p = 0.018), 2 (p = 0.017), and 3 (p = 0.022). However, the Friedman test shows having a significant difference in turbidity for sites 1-3 (p = 0.017), phosphates (p = 0.406), and nitrates (p = 0.406).
    According to the Kruskal-Wallis Test, the following soil parameters were observed to have no significant differences in the measurement across the three sampling sites during the five-sampling period: temperature (p = 0.398), soil pH (p = 1.000), nitrogen (p = 0.135), phosphorus (p = 0.368), and potassium (p = 0.323). On the other hand, the water-holding capacity (p = 0.027), organic matter (p = 0.008), and organic carbon (p = 0.008) were observed to have significant differences in the measurements. There were significant differences in the measurement of water holding capacity across the three sampling sites between sites 1 and 3 (p = 0.020) and sites 2 and 3 (p = 0.020), while no significant difference was observed between sites 1 and 2 (p = 1.000). For organic matter, significant differences were observed between sites 1 and 3 (p = 0.003) and sites 2 and 3 (p = 0.020), while no significant difference was observed between sites 1 and 2 (p = 0.525). On the other hand, the differences in the measurement of organic carbon across the three sampling sites were observed between sites 1 and 3 (p = 0.020) and sites 2 and 3 (p = 0.003), while no significant difference between sites 1 and 2 (p = 0.525). The Friedman test shows that there is no significant differences in the measurement of the following parameters for Sites 1 to 3 across the five-month sampling period: water holding capacity (p = 0.189), temperature (p = 0.137), pH (p = 1.000), organic matter (p = 0.308), organic carbon (p = 0.308), nitrogen (p = 0.406), phosphorus (p = 0.406) and potassium (p = 0.322).
    According to the inventory of mangroves, Rhizophora mucronata (Bakhaw babae) was the most abundant mangrove species among all identified mangrove species present in the three sites of the Kaingen River. This is followed by Avicennia alba (Bungalon), while the least abundant mangrove species is Xylocarpus granatum (Tabigi).
    Among the three identified species of mangroves present in the three established sites of Kaingen River, Rhizophora mucronata has the highest total biomass calculated which also yielded the highest carbon stored and amount of carbon dioxide sequestered. This is followed by Avicennia alba then, the least carbon stored and carbon dioxide sequestered was yielded by Xylocarpus granatum. Accumulatively, all three established sites sum up approximately 35% of the entire Kaingen River. Therefore, 35% of the entire Kaingen River was able to accumulate 71.89 tC/ha of carbon stored and sequester 263.62 tCO2/ha of carbon dioxide. The results of the study urge the residents and authorities of Barangay Kaingen to practice conservation and protection measures for the mangrove ecosystem and its benefits.

    5.2. Conclusion

    Based on the result of the study, the following conclusions were drawn:
    • Different anthropogenic activities in the area may affect the Kaingen Riverine system. Some of these activities include but are not limited to bathing, washing clothes, disposal of household and chemical waste, excretion, and bathing of animals.
    • There are varying trends in the result of water quality in terms of temperature, turbidity, pH, DO, phosphate, and nitrates based on the DENR Standard for Class C Waters and TDS, salinity, and conductivity.
    • There are varying trends in the result of soil quality in terms of soil texture, water holding capacity, soil temperature, soil pH, organic matter, organic carbon, and NPK.
    • Three species of mangroves were identified in the Kaingen River: Avicennia alba, Rhizophora mucronata, and Xylocarpus granatum.
    • A total of 71.89 tC/ha stored, and 263.62 tCO2/ha sequestered by the mangrove trees in Kaingen River were calculated using allometric equations.
    • There is no significant relationship between water and soil quality collected in three (3) sampling sites per sample month and five (5) sampling periods per site.
    • The results show no correlation between water quality and the abundance of mangroves, but there was a correlation between soil quality and the abundance in distribution of mangrove trees species in the Kaingen River.

    5.3. Recommendations

    Based on the results and discussion obtained, the following recommendations were made:
    • Use of mangrove plant parts such as leaves and seedlings to determine concentrations of pollutants.
    • Include a survey on threats to mangroves based on the activities in the Kaingen River.
    • Include carbon footprint and/or carbon emission in terms of carbon generated by vehicles, electricity consumption, and use of fuel of the entire barangay Kaingen, Kawit, Cavite, Philippines.
    • Conduct air quality monitoring in the Kaingen River.
    • Conduct a survey of Avifauna species in Kaingen River.
    • Analyze heavy metals of mangrove roots and water in Kaingen River.
    • Test for organophosphates and their relationship to mangroves.
    • Conduct economic valuation of the mangrove ecosystem in Kaingen River.

    Appendix A. Sampling Site/Station

    Figure A1. Location map of Kaingen River in Kawit, Cavite, Philippines with the three (3) sampling sites.
    Figure A1. Location map of Kaingen River in Kawit, Cavite, Philippines with the three (3) sampling sites.
    Preprints 81428 g0a1
    Figure A2. Sampling Site 1 is located near the aquaculture site of barangay Kaingen and the residential area.
    Figure A2. Sampling Site 1 is located near the aquaculture site of barangay Kaingen and the residential area.
    Preprints 81428 g0a2
    Figure A3. Sampling Site 2 is located in between the aquaculture sites along the Kaingen River.
    Figure A3. Sampling Site 2 is located in between the aquaculture sites along the Kaingen River.
    Preprints 81428 g0a3
    Figure A4. Sampling Site 3 is located next to Sampling Site 2 and end of the Kaingen River.
    Figure A4. Sampling Site 3 is located next to Sampling Site 2 and end of the Kaingen River.
    Preprints 81428 g0a4

    Appendix B. Schematic Diagram

    Figure B1. Diagram Showing the Process of Monitoring the Anthropogenic Activities Occurring in the Kaingen River.
    Figure B1. Diagram Showing the Process of Monitoring the Anthropogenic Activities Occurring in the Kaingen River.
    Preprints 81428 g0a5
    Figure B2. Diagram Showing the Process of Water Sampling and Analysis Done in Kaingen River.
    Figure B2. Diagram Showing the Process of Water Sampling and Analysis Done in Kaingen River.
    Preprints 81428 g0a6
    Figure B3. Diagram Showing the Process of Soil Sampling and Analysis Done in Kaingen River.
    Figure B3. Diagram Showing the Process of Soil Sampling and Analysis Done in Kaingen River.
    Preprints 81428 g0a7
    Figure B4. Diagram Showing the Process of Mangrove Collection, Measurement and Computation for Carbon Stored and Carbon Dioxide Sequestered Done in Kaingen River.
    Figure B4. Diagram Showing the Process of Mangrove Collection, Measurement and Computation for Carbon Stored and Carbon Dioxide Sequestered Done in Kaingen River.
    Preprints 81428 g0a8

    Appendix C. Survey Questionnaire

    Preprints 81428 g0a9aPreprints 81428 g0a9bPreprints 81428 g0a9cPreprints 81428 g0a9dPreprints 81428 g0a9e

    Appendix D. Survey Results

    Table D1. Demographic Profile.
    Table D1. Demographic Profile.
    Total No. of Respondents %
    Gender Male 164 48.81
    Female 172 51.19
    Age 18 – 30 172 51.19
    31 – 40 51 15.18
    41 – 50 39 11.61
    51 – above 74 22.02
    Civil Status Single 189 56.25
    Married 111 33.04
    Widowed 25 7.44
    Separated 11 3.27
    Educational Attainment Elementary 35 10.42
    High School 160 47.62
    College 133 39.58
    Vocational 8 2.38
    Members of the Family 0 – 1 1 0.30
    2 – 4 135 40.18
    5 – 7 167 49.70
    8 – 10 24 7.14
    11 – more 9 2.68
    Proper Sewage System Yes 221 65.77
    No 115 34.23
    Table D2. Anthropogenic Activities Near Kaingen River.
    Table D2. Anthropogenic Activities Near Kaingen River.
    1 2 3 4 Respondents X REMARKS
    Fishing 194 44 46 52 336 1.87 Seldom
    Bathing 202 45 38 51 336 1.82 Seldom
    Washing of clothes 258 29 21 27 335 1.45 Seldom
    Throwing garbage 220 46 27 42 335 1.67 Seldom
    Disposing of chemical waste 286 22 12 16 336 1.28 Seldom
    Excreting 263 29 23 21 336 1.41 Seldom
    Bathing of Animals 276 30 16 14 336 1.31 Seldom
    Range: Always 3.26-4.00 Often 2.51-3.25 Seldom 1.76-2.50 Never 1.00-1.75.
    Table D3. Protection and Conservation Measures of Kaingen River.
    Table D3. Protection and Conservation Measures of Kaingen River.
    1 2 3 4 Respondents X REMARKS
    Preventing people 17 10 71 238 336 1.87 Strongly Agree
    Environmental groups 16 14 91 215 336 1.82 Strongly Agree
    Creating groups 16 15 106 198 335 1.45 Strongly Agree
    River policies 17 8 88 223 336 1.67 Strongly Agree
    Sustainable methods 17 14 81 224 336 1.28 Strongly Agree
    River management 21 25 81 209 336 1.41 Strongly Agree
    Deposits 9 8 52 266 335 1.31 Strongly Agree
    Range: Strongly Agree 3.26-4.00 Agree 2.51-3.25 Disagree 1.76-2.50 Strongly Disagree 1.00-1.75.
    Table D4. Natural Occurrences in the Kaingen River.
    Table D4. Natural Occurrences in the Kaingen River.
    1 2 3 4 5 Respondents X REMARKS
    Precipitation Runoff 53 42 68 71 102 336 3.38 Often
    Fishing 73 36 59 60 108 336 3.28 Often
    Tides 44 57 82 74 79 336 3.26 Often
    Weathering and erosion 169 71 37 35 24 336 2.03 Seldom
    Debris and leaf decomposition 144 61 56 36 39 336 2.30 Seldom
    Precipitation Runoff 53 42 68 71 102 336 3.38 Often
    Fishing 73 36 59 60 108 336 3.28 Often
    Range: Always 4.30-5.00 Frequent 3.50-4.20 Often 2.70-3.40 Never 1.00-1.80.

    Appendix E. Physicochemical and Biological Properties of Water and Soil
    Figure E1. DENR Water Quality Guidelines and General Effluent Standards of 2016.
    Figure E1. DENR Water Quality Guidelines and General Effluent Standards of 2016.
    Preprints 81428 i098aPreprints 81428 i098bPreprints 81428 i098cPreprints 81428 i098dPreprints 81428 i098e
    Table E2. Updated Water Quality Guidelines and General Effluent Standards for Selected Parameters.
    Table E2. Updated Water Quality Guidelines and General Effluent Standards for Selected Parameters.
    Preprints 81428 i098aPreprints 81428 i098b
    Table E3. Water Quality Index Report of Kaingen River, Kawit, Cavite with the Inclusion of All Water Quality Parameters.
    Table E3. Water Quality Index Report of Kaingen River, Kawit, Cavite with the Inclusion of All Water Quality Parameters.
    Parameter Sites Sampling Period
    November December January February March
    1 16.5203 12.0147 22.5276 12.0147 22.5276
    Turbidity 2 12.0147 22.5276 36.0442 36.0442 22.5276
    3 22.5276 22.5276 22.5276 16.5203 36.0442
    1 0.0234 0.0640 0.0269 0.0668 0.0793
    Conductivity 2 0.0230 0.1414 0.0697 0.0692 0.0882
    3 0.0234 0.1548 0.0883 0.0684 0.0913
    Total Dissolved Solids 1 0.0360 0.0984 0.0414 0.1028 0.1219
    2 0.0354 0.2175 0.1073 0.1065 0.1357
    3 0.0360 0.2382 0.1358 0.1053 0.1404
    1 0.0263 0.0720 0.0303 0.0752 0.0892
    Salinity 2 0.0259 0.1591 0.0784 0.0778 0.0992
    3 0.0263 0.1741 0.0993 0.0770 0.1027
    1 3.9183 3.9287 3.8819 4.0690 4.2353
    pH 2 4.1002 4.0066 3.9495 4.0222 4.2353
    3 4.0534 3.9910 3.9183 3.9443 4.0274
    Dissolved Oxygen 1 4.5055 8.1099 5.2564 6.9085 14.2675
    2 7.6594 9.7620 6.3077 6.0074 11.7144
    3 6.3077 8.4103 6.3077 5.8572 14.2675
    1 0.0942 0.2222 0.1303 0.0766 0.1073
    Nitrates 2 0.0942 0.2222 0.1303 0.0766 0.1073
    3 0.0942 0.2222 0.1303 0.0766 0.1073
    1 92.2131 122.40 109.184 107.832 69.5353
    Phosphates 2 92.2131 122.40 109.184 107.832 69.5353
    3 92.2131 122.40 109.184 107.832 69.5353
    Total Coliform 1 0.3604 0.0020 0.0360 0.0036 0.0050
    2 0.3604 0.0020 0.0360 0.0036 0.0050
    3 0.3604 0.0020 0.0360 0.0036 0.0050
    Ave. WQI in Five Months 1 129.57 (UNSUITABLE)
    2 138.91 (UNSUITABLE)
    3 137.00 (UNSUITABLE)
    Ave. WQI per Month 119.96 (US) 154.82 (US) 146.48 (US) 139.96 (US) 114.58 (US)
    Range Quality: 0 – 25 = Excellent; 26 – 50 = Good; 51 – 75 = Poor; 76 – 100 = Very Poor; >100 = Unsuitable.
    Figure E4. Field Observation Record for Water.
    Figure E4. Field Observation Record for Water.
    Preprints 81428 g0a10
    Figure E5. Results of Phosphates and Nitrates For Water Quality.
    Figure E5. Results of Phosphates and Nitrates For Water Quality.
    Preprints 81428 g0a11aPreprints 81428 g0a11b
    Figure E6. Results of Ex-situ Soil analysis.
    Figure E6. Results of Ex-situ Soil analysis.
    Preprints 81428 g0a12
    Figure E7. Results of Soil Quality Soil Texture, WHC and Organic Matter November.
    Figure E7. Results of Soil Quality Soil Texture, WHC and Organic Matter November.
    Preprints 81428 g0a13aPreprints 81428 g0a13bPreprints 81428 g0a13cPreprints 81428 g0a13dPreprints 81428 g0a13e

    Appendix F. Abundance of Species

    Table F1. Amount of Carbon Stored and Carbon dioxide Sequestered of Mangrove Trees in Site 1.
    Table F1. Amount of Carbon Stored and Carbon dioxide Sequestered of Mangrove Trees in Site 1.
    Tree No. Scientific Name Local name GBH
    (cm)
    DBH (cm) Wood Density (g/cm3) AGB (kg) BGB (kg) Total Biomass (kg)
    1 Avicennia alba Bungalon 91.9 29.25261013 0.6987 709.1358437 259.2721792 968.4080229
    2 Avicennia alba Bungalon 162.6 51.75706646 0.6987 2886.222521 920.2018123 3806.424333
    3 Avicennia alba Bungalon 35.6 11.33180545 0.6987 68.79237045 31.58017106 100.3725415
    4 Avicennia alba Bungalon 61 19.41685765 0.6987 258.752571 104.3825053 363.1350764
    5 Avicennia alba Bungalon 80.8 25.71937866 0.6987 516.660461 194.8268028 711.4872638
    6 Avicennia alba Bungalon 172.7 54.9719888 0.6987 3347.437138 1051.924262 4399.3614
    7 Avicennia alba Bungalon 71.1 22.63177998 0.6987 377.2007064 146.6715887 523.8722952
    8 Avicennia alba Bungalon 128.3 40.8390629 0.6987 1611.42781 543.824363 2155.252173
    9 Avicennia alba Bungalon 62.7 19.95798319 0.6987 276.8544 110.9505408 387.8049408
    10 Avicennia alba Bungalon 56.4 17.9526356 0.6987 213.3633765 87.70716907 301.0705455
    11 Avicennia alba Bungalon 94.7 30.14387573 0.6987 763.4739581 277.1356756 1040.609634
    12 Avicennia alba Bungalon 68.6 21.83600713 0.6987 345.4065781 135.4674699 480.874048
    13 Avicennia alba Bungalon 38.1 12.1275783 0.6987 81.29217058 36.71545619 118.0076268
    14 Avicennia alba Bungalon 30.5 9.708428826 0.6987 47.02739088 22.40480281 69.4321937
    15 Avicennia alba Bungalon 26.7 8.498854087 0.6987 33.89931968 16.67441027 50.57372995
    16 Rhizophora mucronata Bakhaw babae 45.7 14.54672778 0.8483 154.3923777 65.45729277 219.8496705
    17 Rhizophora mucronata Bakhaw babae 48.3 15.37433155 0.8483 176.9057483 74.01277804 250.9185264
    18 Rhizophora mucronata Bakhaw babae 26.4 8.403361345 0.8483 40.02926939 19.35997504 59.38924442
    19 Rhizophora mucronata Bakhaw babae 33.02 10.51056786 0.8483 69.41024749 31.81479787 101.2250454
    20 Rhizophora mucronata Bakhaw babae 38.6 12.28673287 0.8483 101.9146865 44.99537666 146.9100632
    21 Rhizophora mucronata Bakhaw babae 32.3 10.28138528 0.8483 65.74613214 30.2951896 96.04132175
    Total Biomass of Site 1 (kg) Total Biomass (t/ha) C. Stored (tC/ha) CO2 Sequestered (tCO2/ha)
    5.919992648 59.19992648 29.59996324 108.5430652
    Table F2. Amount of Carbon Stored and Carbon dioxide Sequestered of Mangrove Trees in Site 2.
    Table F2. Amount of Carbon Stored and Carbon dioxide Sequestered of Mangrove Trees in Site 2.
    Tree No. Scientific Name Local name GBH
    (cm)
    DBH (cm) Wood Density (g/cm3) AGB (kg) BGB (kg) Total Biomass (kg)
    1 Avicennia alba Bungalon 48.0 15.27883881 0.6987 143.4916811 61.31278305 204.8044641
    2 Avicennia alba Bungalon 27.0 8.59434683 0.6987 34.84401078 17.09318681 51.93719759
    3 Avicennia alba Bungalon 24.0 7.639419404 0.6987 26.07912009 13.16025908 39.23937918
    4 Avicennia alba Bungalon 27.0 8.59434683 0.6987 34.84401078 17.09318681 51.93719759
    5 Avicennia alba Bungalon 33.5 10.66335625 0.6987 59.23569727 27.59274798 86.82844524
    6 Avicennia alba Bungalon 33.0 10.50420168 0.6987 57.08441723 26.68679559 83.77121282
    7 Avicennia alba Bungalon 40.0 12.73236567 0.6987 91.63066919 40.9042716 132.5349408
    8 Avicennia alba Bungalon 32.0 10.18589254 0.6987 52.92272845 24.92461361 77.84734206
    9 Xylocarpus granatum Tabigi 25.0 7.957728546 0.6721 27.73632089 13.91451251 41.6508334
    10 Xylocarpus granatum Tabigi 8.5 2.705627706 0.6721 1.952032252 1.268677365 3.220709617
    11 Xylocarpus granatum Tabigi 9.0 2.864782277 0.6721 2.246740971 1.440321844 3.687062815
    12 Rhizophora mucronata Bakhaw babae 16.0 5.092946269 0.8483 11.67796477 6.3692814 18.04724617
    13 Rhizophora mucronata Bakhaw babae 39.0 12.41405653 0.8483 104.5324036 46.03705171 150.5694553
    14 Rhizophora mucronata Bakhaw babae 40.0 12.73236567 0.8483 111.2498879 48.69868745 159.9485753
    15 Rhizophora mucronata Bakhaw babae 37.8 12.03208556 0.8483 96.79698516 42.95125627 139.7482414
    16 Rhizophora mucronata Bakhaw babae 11.0 3.50140056 0.8483 4.645773248 2.772271986 7.418045234
    17 Rhizophora mucronata Bakhaw babae 6.5 2.069009422 0.8483 1.27349974 0.862207363 2.135707103
    18 Rhizophora mucronata Bakhaw babae 12.0 3.819709702 0.8483 5.754636138 3.362996703 9.11763284
    19 Rhizophora mucronata Bakhaw babae 9.0 2.864782277 0.8483 2.835754152 1.775670772 4.611424924
    20 Rhizophora mucronata Bakhaw babae 5.0 1.591545709 0.8483 0.667879655 0.48156785 1.149447504
    21 Rhizophora mucronata Bakhaw babae 7.0 2.228163993 0.8483 1.528175321 1.016393138 2.544568458
    22 Rhizophora mucronata Bakhaw babae 7.0 2.228163993 0.8483 1.528175321 1.016393138 2.544568458
    23 Rhizophora mucronata Bakhaw babae 10.0 3.183091418 0.8483 3.674785579 2.243592995 5.918378573
    24 Rhizophora mucronata Bakhaw babae 9.0 2.864782277 0.8483 2.835754152 1.775670772 4.611424924
    25 Rhizophora mucronata Bakhaw babae 9.0 2.864782277 0.8483 2.835754152 1.775670772 4.611424924
    26 Rhizophora mucronata Bakhaw babae 10.0 3.183091418 0.8483 3.674785579 2.243592995 5.918378573
    27 Rhizophora mucronata Bakhaw babae 5.5 1.75070028 0.8483 0.844353328 0.595044227 1.439397555
    28 Rhizophora mucronata Bakhaw babae 10.0 3.183091418 0.8483 3.674785579 2.243592995 5.918378573
    29 Rhizophora mucronata Bakhaw babae 5.6 1.782531194 0.8483 0.882621596 0.619329113 1.501950709
    30 Rhizophora mucronata Bakhaw babae 8.0 2.546473135 0.8483 2.122429979 1.367111216 3.489541195
    31 Rhizophora mucronata Bakhaw babae 55.0 17.5070028 0.8483 243.5141598 98.75276082 342.2669206
    32 Rhizophora mucronata Bakhaw babae 7.0 2.228163993 0.8483 1.528175321 1.016393138 2.544568458
    33 Rhizophora mucronata Bakhaw babae 7.0 2.228163993 0.8483 1.528175321 1.016393138 2.544568458
    34 Rhizophora mucronata Bakhaw babae 21.0 6.684491979 0.8483 22.79772278 11.64852429 34.44624707
    35 Rhizophora mucronata Bakhaw babae 20.5 6.525337408 0.8483 21.48555129 11.04174331 32.5272946
    36 Rhizophora mucronata Bakhaw babae 10.5 3.342245989 0.8483 4.143407798 2.500255085 6.643662883
    37 Rhizophora mucronata Bakhaw babae 5.5 1.75070028 0.8483 0.844353328 0.595044227 1.439397555
    38 Rhizophora mucronata Bakhaw babae 21.5 6.84364655 0.8483 24.15631114 12.27318997 36.4295011
    39 Rhizophora mucronata Bakhaw babae 14.0 4.456327986 0.8483 8.408276237 4.735308897 13.14358513
    40 Rhizophora mucronata Bakhaw babae 15.5 4.933791698 0.8483 10.80060245 5.935816207 16.73641866
    41 Rhizophora mucronata Bakhaw babae 5.5 1.75070028 0.8483 0.844353328 0.595044227 1.439397555
    42 Rhizophora mucronata Bakhaw babae 6.0 1.909854851 0.8483 1.045885349 0.721838183 1.767723532
    43 Rhizophora mucronata Bakhaw babae 8.5 2.705627706 0.8483 2.463783603 1.564062453 4.027846056
    44 Rhizophora mucronata Bakhaw babae 10.0 3.183091418 0.8483 3.674785579 2.243592995 5.918378573
    45 Rhizophora mucronata Bakhaw babae 15.0 4.774637128 0.8483 9.963604971 5.51907976 15.48268473
    46 Rhizophora mucronata Bakhaw babae 16.9 5.379424497 0.8483 13.36082565 7.192047707 20.55287336
    47 Rhizophora mucronata Bakhaw babae 12.2 3.88337153 0.8483 5.993454143 3.488694169 9.482148312
    48 Rhizophora mucronata Bakhaw babae 14.0 4.456327986 0.8483 8.408276237 4.735308897 13.14358513
    49 Rhizophora mucronata Bakhaw babae 6.0 1.909854851 0.8483 1.045885349 0.721838183 1.767723532
    50 Rhizophora mucronata Bakhaw babae 8.0 2.546473135 0.8483 2.122429979 1.367111216 3.489541195
    51 Rhizophora mucronata Bakhaw babae 10.0 3.183091418 0.8483 3.674785579 2.243592995 5.918378573
    52 Rhizophora mucronata Bakhaw babae 9.0 2.864782277 0.8483 2.835754152 1.775670772 4.611424924
    53 Rhizophora mucronata Bakhaw babae 6.7 2.13267125 0.8483 1.372069208 0.922210659 2.294279867
    54 Rhizophora mucronata Bakhaw babae 10.2 3.246753247 0.8483 3.858232774 2.344425609 6.202658383
    55 Rhizophora mucronata Bakhaw babae 8.0 2.546473135 0.8483 2.122429979 1.367111216 3.489541195
    56 Rhizophora mucronata Bakhaw babae 16.6 5.283931755 0.8483 12.78491662 6.911686493 19.69660311
    57 Rhizophora mucronata Bakhaw babae 15.8 5.029284441 0.8483 11.32213782 6.193880303 17.51601813
    58 Rhizophora mucronata Bakhaw babae 15.5 4.933791698 0.8483 10.80060245 5.935816207 16.73641866
    59 Rhizophora mucronata Bakhaw babae 16.0 5.092946269 0.8483 11.67796477 6.3692814 18.04724617
    60 Rhizophora mucronata Bakhaw babae 17.4 5.538579068 0.8483 14.35433753 7.672968345 22.02730588
    61 Rhizophora mucronata Bakhaw babae 18.0 5.729564553 0.8483 15.60279369 8.272733549 23.87552723
    62 Rhizophora mucronata Bakhaw babae 19.7 6.270690094 0.8483 19.4813442 10.10785719 29.5892014
    63 Rhizophora mucronata Bakhaw babae 19.1 6.079704609 0.8483 18.05402697 9.437091167 27.49111813
    64 Rhizophora mucronata Bakhaw babae 16.2 5.156608098 0.8483 12.04034522 6.547377891 18.58772311
    65 Rhizophora mucronata Bakhaw babae 20.3 6.461675579 0.8483 20.97356501 10.80401751 31.77758253
    66 Rhizophora mucronata Bakhaw babae 14.9 4.742806213 0.8483 9.800996264 5.437729392 15.23872566
    67 Rhizophora mucronata Bakhaw babae 15.0 4.774637128 0.8483 9.963604971 5.51907976 15.48268473
    68 Rhizophora mucronata Bakhaw babae 16.9 5.379424497 0.8483 13.36082565 7.192047707 20.55287336
    69 Rhizophora mucronata Bakhaw babae 19.4 6.175197352 0.8483 18.75962959 9.76931056 28.52894015
    70 Rhizophora mucronata Bakhaw babae 17.0 5.411255411 0.8483 13.55614951 7.28686428 20.84301379
    71 Rhizophora mucronata Bakhaw babae 17.8 5.665902725 0.8483 15.17977062 8.070054737 23.24982536
    72 Rhizophora mucronata Bakhaw babae 15.0 4.774637128 0.8483 9.963604971 5.51907976 15.48268473
    73 Rhizophora mucronata Bakhaw babae 18.3 5.825057296 0.8483 16.25031127 8.581940408 24.83225167
    74 Rhizophora mucronata Bakhaw babae 19.0 6.047873695 0.8483 17.82238667 9.327753688 27.15014035
    75 Rhizophora mucronata Bakhaw babae 20.6 6.557168322 0.8483 21.74429671 11.16167325 32.90596995
    76 Rhizophora mucronata Bakhaw babae 3.2 1.018589254 0.8483 0.222792697 0.178803916 0.401596613
    77 Rhizophora mucronata Bakhaw babae 5.3 1.687038452 0.8483 0.770815861 0.5480706 1.318886461
    78 Rhizophora mucronata Bakhaw babae 2.0 0.636618284 0.8483 0.070107712 0.062984062 0.133091774
    79 Rhizophora mucronata Bakhaw babae 5.0 1.591545709 0.8483 0.667879655 0.48156785 1.149447504
    80 Rhizophora mucronata Bakhaw babae 4.9 1.559714795 0.8483 0.635498252 0.460446709 1.095944961
    81 Rhizophora mucronata Bakhaw babae 3.7 1.177743825 0.8483 0.318425797 0.246803834 0.565229631
    82 Rhizophora mucronata Bakhaw babae 3.4 1.082251082 0.8483 0.258624783 0.204563088 0.463187871
    83 Rhizophora mucronata Bakhaw babae 4.5 1.432391138 0.8483 0.515388575 0.381132388 0.896520963
    84 Rhizophora mucronata Bakhaw babae 17.8 5.665902725 0.8483 15.17977062 8.070054737 23.24982536
    85 Rhizophora mucronata Bakhaw babae 15.0 4.774637128 0.8483 9.963604971 5.51907976 15.48268473
    86 Rhizophora mucronata Bakhaw babae 17.2 5.47491724 0.8483 13.95185592 7.478547001 21.43040292
    87 Rhizophora mucronata Bakhaw babae 16.0 5.092946269 0.8483 11.67796477 6.3692814 18.04724617
    88 Rhizophora mucronata Bakhaw babae 19.2 6.111535523 0.8483 18.2874447 9.54712927 27.83457397
    89 Rhizophora mucronata Bakhaw babae 20.3 6.461675579 0.8483 20.97356501 10.80401751 31.77758253
    90 Rhizophora mucronata Bakhaw babae 16.7 5.315762669 0.8483 12.97521379 7.004459705 19.9796735
    91 Rhizophora mucronata Bakhaw babae 15.4 4.901960784 0.8483 10.62999295 5.851134422 16.48112737
    92 Rhizophora mucronata Bakhaw babae 19.0 6.047873695 0.8483 17.82238667 9.327753688 27.15014035
    93 Rhizophora mucronata Bakhaw babae 15.3 4.87012987 0.8483 10.46099328 5.767120844 16.22811413
    94 Rhizophora mucronata Bakhaw babae 16.8 5.347593583 0.8483 13.16718194 7.097913145 20.26509508
    95 Rhizophora mucronata Bakhaw babae 16.4 5.220269926 0.8483 12.40931673 6.728177154 19.13749389
    96 Rhizophora mucronata Bakhaw babae 15.5 4.933791698 0.8483 10.80060245 5.935816207 16.73641866
    97 Rhizophora mucronata Bakhaw babae 18.9 6.016042781 0.8483 17.59251952 9.219116022 26.81163554
    98 Rhizophora mucronata Bakhaw babae 20.1 6.398013751 0.8483 20.46889059 10.56913202 31.03802261
    99 Rhizophora mucronata Bakhaw babae 17.4 5.538579068 0.8483 14.35433753 7.672968345 22.02730588
    100 Rhizophora mucronata Bakhaw babae 15.9 5.061115355 0.8483 11.49923447 6.281244391 17.78047886
    101 Rhizophora mucronata Bakhaw babae 16.7 5.315762669 0.8483 12.97521379 7.004459705 19.9796735
    102 Rhizophora mucronata Bakhaw babae 20.0 6.366182837 0.8483 20.21928494 10.45275246 30.67203741
    103 Rhizophora mucronata Bakhaw babae 17.0 5.411255411 0.8483 13.55614951 7.28686428 20.84301379
    104 Rhizophora mucronata Bakhaw babae 14.9 4.742806213 0.8483 9.800996264 5.437729392 15.23872566
    105 Rhizophora mucronata Bakhaw babae 19.6 6.23885918 0.8483 19.23897538 9.994303962 29.23327934
    106 Rhizophora mucronata Bakhaw babae 21.8 6.939139292 0.8483 24.99395466 12.65661271 37.65056737
    107 Rhizophora mucronata Bakhaw babae 20.7 6.588999236 0.8483 22.00488246 11.28231555 33.28719802
    108 Rhizophora mucronata Bakhaw babae 24.2 7.703081232 0.8483 32.3160152 15.95931283 48.27532803
    109 Rhizophora mucronata Bakhaw babae 23.0 7.321110262 0.8483 28.51559776 14.25541521 42.77101297
    110 Rhizophora mucronata Bakhaw babae 25.1 7.98955946 0.8483 35.35325113 17.30691804 52.66016917
    111 Rhizophora mucronata Bakhaw babae 24.8 7.894066718 0.8483 34.32283387 16.85104377 51.17387764
    112 Rhizophora mucronata Bakhaw babae 22.7 7.22561752 0.8483 27.60931375 13.84590917 41.45522292
    113 Rhizophora mucronata Bakhaw babae 22.2 7.066462949 0.8483 26.1372758 13.17794463 39.31522043
    114 Rhizophora mucronata Bakhaw babae 21.7 6.907308378 0.8483 24.71285657 12.5280848 37.24094137
    115 Rhizophora mucronata Bakhaw babae 20.8 6.62083015 0.8483 22.26731267 11.40367099 33.67098366
    116 Rhizophora mucronata Bakhaw babae 25.0 7.957728546 0.8483 35.0077682 17.1542168 52.161985
    117 Rhizophora mucronata Bakhaw babae 24.3 7.734912147 0.8483 32.6455084 16.10608559 48.75159399
    118 Rhizophora mucronata Bakhaw babae 24.9 7.925897632 0.8483 34.66429701 17.00225893 51.66655595
    119 Rhizophora mucronata Bakhaw babae 20.9 6.652661064 0.8483 22.53159141 11.52574032 34.05733173
    120 Rhizophora mucronata Bakhaw babae 16.8 5.347593583 0.8483 13.16718194 7.097913145 20.26509508
    121 Rhizophora mucronata Bakhaw babae 16.4 5.220269926 0.8483 12.40931673 6.728177154 19.13749389
    122 Rhizophora mucronata Bakhaw babae 19.8 6.302521008 0.8483 19.72551594 10.22211583 29.94763177
    123 Rhizophora mucronata Bakhaw babae 20.0 6.366182837 0.8483 20.21928494 10.45275246 30.67203741
    124 Rhizophora mucronata Bakhaw babae 17.4 5.538579068 0.8483 14.35433753 7.672968345 22.02730588
    125 Rhizophora mucronata Bakhaw babae 15.2 4.838298956 0.8483 10.29359862 5.683774517 15.97737314
    126 Rhizophora mucronata Bakhaw babae 18.3 5.825057296 0.8483 16.25031127 8.581940408 24.83225167
    127 Rhizophora mucronata Bakhaw babae 19.7 6.270690094 0.8483 19.4813442 10.10785719 29.5892014
    128 Rhizophora mucronata Bakhaw babae 16.5 5.25210084 0.8483 12.59628581 6.81959261 19.41587842
    129 Rhizophora mucronata Bakhaw babae 19.1 6.079704609 0.8483 18.05402697 9.437091167 27.49111813
    130 Rhizophora mucronata Bakhaw babae 18.7 5.952380952 0.8483 17.13808748 9.00393688 26.14202436
    131 Rhizophora mucronata Bakhaw babae 17.4 5.538579068 0.8483 14.35433753 7.672968345 22.02730588
    132 Rhizophora mucronata Bakhaw babae 15.6 4.965622613 0.8483 10.97282658 6.021167151 16.99399373
    133 Rhizophora mucronata Bakhaw babae 17.7 5.634071811 0.8483 14.9708424 7.969750518 22.94059292
    134 Rhizophora mucronata Bakhaw babae 19.9 6.334351923 0.8483 19.97149479 10.33708066 30.30857544
    135 Rhizophora mucronata Bakhaw babae 23.6 7.512095747 0.8483 30.38054292 15.0941521 45.47469501
    136 Rhizophora mucronata Bakhaw babae 22.0 7.00280112 0.8483 25.56182152 12.91583317 38.47765469
    137 Rhizophora mucronata Bakhaw babae 24.8 7.894066718 0.8483 34.32283387 16.85104377 51.17387764
    138 Rhizophora mucronata Bakhaw babae 18.6 5.920550038 0.8483 16.91351396 8.89739377 25.81090773
    139 Rhizophora mucronata Bakhaw babae 22.6 7.193786606 0.8483 27.31107304 13.7108636 41.02193663
    140 Rhizophora mucronata Bakhaw babae 15.3 4.87012987 0.8483 10.46099328 5.767120844 16.22811413
    141 Rhizophora mucronata Bakhaw babae 16.5 5.25210084 0.8483 12.59628581 6.81959261 19.41587842
    142 Rhizophora mucronata Bakhaw babae 23.7 7.543926662 0.8483 30.69820165 15.23650658 45.93470823
    143 Rhizophora mucronata Bakhaw babae 25.2 8.021390374 0.8483 35.70074949 17.4603633 53.16111279
    144 Rhizophora mucronata Bakhaw babae 18.0 5.729564553 0.8483 15.60279369 8.272733549 23.87552723
    145 Rhizophora mucronata Bakhaw babae 23.0 7.321110262 0.8483 28.51559776 14.25541521 42.77101297
    146 Rhizophora mucronata Bakhaw babae 24.7 7.862235803 0.8483 33.98337504 16.70057067 50.68394571
    147 Rhizophora mucronata Bakhaw babae 20.1 6.398013751 0.8483 20.46889059 10.56913202 31.03802261
    148 Rhizophora mucronata Bakhaw babae 23.0 7.321110262 0.8483 28.51559776 14.25541521 42.77101297
    149 Rhizophora mucronata Bakhaw babae 19.4 6.175197352 0.8483 18.75962959 9.76931056 28.52894015
    150 Rhizophora mucronata Bakhaw babae 18.3 5.825057296 0.8483 16.25031127 8.581940408 24.83225167
    151 Rhizophora mucronata Bakhaw babae 22.7 7.22561752 0.8483 27.60931375 13.84590917 41.45522292
    152 Rhizophora mucronata Bakhaw babae 24.6 7.830404889 0.8483 33.64591681 16.55083896 50.19675578
    153 Rhizophora mucronata Bakhaw babae 20.1 6.398013751 0.8483 20.46889059 10.56913202 31.03802261
    154 Rhizophora mucronata Bakhaw babae 16.8 5.347593583 0.8483 13.16718194 7.097913145 20.26509508
    155 Rhizophora mucronata Bakhaw babae 19.7 6.270690094 0.8483 19.4813442 10.10785719 29.5892014
    156 Rhizophora mucronata Bakhaw babae 24.9 7.925897632 0.8483 34.66429701 17.00225893 51.66655595
    157 Rhizophora mucronata Bakhaw babae 25.0 7.957728546 0.8483 35.0077682 17.1542168 52.161985
    158 Rhizophora mucronata Bakhaw babae 15.2 4.838298956 0.8483 10.29359862 5.683774517 15.97737314
    159 Rhizophora mucronata Bakhaw babae 17.8 5.665902725 0.8483 15.17977062 8.070054737 23.24982536
    160 Rhizophora mucronata Bakhaw babae 21.6 6.875477464 0.8483 24.4336434 12.40027746 36.83392086
    161 Rhizophora mucronata Bakhaw babae 24.6 7.830404889 0.8483 33.64591681 16.55083896 50.19675578
    162 Rhizophora mucronata Bakhaw babae 23.8 7.575757576 0.8483 31.01782331 15.37959574 46.39741905
    163 Rhizophora mucronata Bakhaw babae 19.8 6.302521008 0.8483 19.72551594 10.22211583 29.94763177
    164 Rhizophora mucronata Bakhaw babae 22.3 7.098293863 0.8483 26.42785811 13.3100863 39.73794441
    165 Rhizophora mucronata Bakhaw babae 16.9 5.379424497 0.8483 13.36082565 7.192047707 20.55287336
    166 Rhizophora mucronata Bakhaw babae 26 8.276037688 0.8483 38.55373335 18.71478783 57.26852118
    167 Rhizophora mucronata Bakhaw babae 22.4 7.130124777 0.8483 26.72034914 13.44295287 40.16330201
    168 Rhizophora mucronata Bakhaw babae 24.8 7.894066718 0.8483 34.32283387 16.85104377 51.17387764
    169 Rhizophora mucronata Bakhaw babae 17.0 5.411255411 0.8483 13.55614951 7.28686428 20.84301379
    170 Rhizophora mucronata Bakhaw babae 15.2 4.838298956 0.8483 10.29359862 5.683774517 15.97737314
    171 Rhizophora mucronata Bakhaw babae 23.7 7.543926662 0.8483 30.69820165 15.23650658 45.93470823
    172 Rhizophora mucronata Bakhaw babae 26.7 8.498854087 0.8483 41.15756818 19.85176272 61.0093309
    173 Rhizophora mucronata Bakhaw babae 18.8 5.984211867 0.8483 17.36442123 9.111177358 26.47559859
    174 Rhizophora mucronata Bakhaw babae 15.9 5.061115355 0.8483 11.49923447 6.281244391 17.78047886
    175 Rhizophora mucronata Bakhaw babae 23.3 7.416603005 0.8483 29.43930609 14.67148993 44.11079602
    176 Rhizophora mucronata Bakhaw babae 18.1 5.761395467 0.8483 15.8168974 8.375109839 24.19200724
    177 Rhizophora mucronata Bakhaw babae 16 5.092946269 0.8483 11.67796477 6.3692814 18.04724617
    178 Rhizophora mucronata Bakhaw babae 18 5.729564553 0.8483 15.60279369 8.272733549 23.87552723
    179 Rhizophora mucronata Bakhaw babae 19.8 6.302521008 0.8483 19.72551594 10.22211583 29.94763177
    180 Rhizophora mucronata Bakhaw babae 20.5 6.525337408 0.8483 21.48555129 11.04174331 32.5272946
    181 Rhizophora mucronata Bakhaw babae 23.6 7.512095747 0.8483 30.38054292 15.0941521 45.47469501
    182 Xylocarpus granatum Tabigi 25.0 7.957728546 0.6721 27.73632089 13.91451251 41.6508334
    183 Xylocarpus granatum Tabigi 15.5 4.933791698 0.6721 8.55721432 4.814792179 13.3720065
    184 Xylocarpus granatum Tabigi 47.0 14.96052967 0.6721 131.062112 56.50650169 187.5686137
    185 Xylocarpus granatum Tabigi 13.4 4.265342501 0.6721 5.981281409 3.485088643 9.466370052
    186 Xylocarpus granatum Tabigi 21.0 6.684491979 0.6721 18.06241835 9.448611899 27.51103024
    187 Xylocarpus granatum Tabigi 6.0 1.909854851 0.6721 0.828644988 0.585513553 1.414158541
    188 Xylocarpus granatum Tabigi 39.5 12.5732111 0.6721 85.45653647 38.41375204 123.8702885
    189 Xylocarpus granatum Tabigi 25.0 7.957728546 0.6721 27.73632089 13.91451251 41.6508334
    190 Xylocarpus granatum Tabigi 40.0 12.73236567 0.6721 88.14222522 39.50157001 127.6437952
    191 Xylocarpus granatum Tabigi 55.0 17.5070028 0.6721 192.9339465 80.10255099 273.0364975
    192 Xylocarpus granatum Tabigi 25.2 8.021390374 0.6721 28.28536336 14.16284092 42.44820427
    Total Biomass of Site 2 (kg) Total Biomass (t/ha) C. Stored (tC/ha) CO2 Sequestered (tCO2/ha)
    2.305169919 23.05169919 11.52584959 42.26529046
    Table F3. Amount of Carbon Stored and Carbon dioxide Sequestered of Mangrove Trees in Site 3.
    Table F3. Amount of Carbon Stored and Carbon dioxide Sequestered of Mangrove Trees in Site 3.
    Tree No. Scientific Name Local Name GBH (cm) DBH (cm) Wood Density (g/cm3) AGB (kg) BGB (kg) Total Biomass (kg)
    1 Avicennia alba Tabigi 149 47.42806213 0.6987 2328.152905 757.9996385 3086.152544
    2 Rhizophora mucronata Bakhaw babae 35 11.14081996 0.8483 80.10126827 36.20554871 116.306817
    3 Rhizophora mucronata Bakhaw babae 37.6 11.96842373 0.8483 95.54195021 42.44837712 137.9903273
    4 Rhizophora mucronata Bakhaw babae 11 3.50140056 0.8483 4.645773248 2.772271986 7.418045234
    5 Rhizophora mucronata Bakhaw babae 73 23.23656735 0.8483 488.6593796 185.1487672 673.8081468
    6 Rhizophora mucronata Bakhaw babae 74 23.5548765 0.8483 505.291548 190.8264157 696.1179638
    7 Rhizophora mucronata Bakhaw babae 32.5 10.34504711 0.8483 66.75212126 30.71320487 97.46532613
    8 Rhizophora mucronata Bakhaw babae 62 19.73516679 0.8483 326.9757612 128.8408633 455.8166245
    9 Rhizophora mucronata Bakhaw babae 55 17.5070028 0.8483 243.5141598 98.75276082 342.2669206
    10 Rhizophora mucronata Bakhaw babae 62.5 19.89432136 0.8483 333.5007739 131.1588843 464.6596582
    11 Rhizophora mucronata Bakhaw babae 37.2 11.84110008 0.8483 93.06098296 41.45237342 134.5133564
    12 Rhizophora mucronata Bakhaw babae 10 3.183091418 0.8483 3.674785579 2.243592995 5.918378573
    13 Rhizophora mucronata Bakhaw babae 57 18.14362108 0.8483 265.8790683 106.9021045 372.7811728
    14 Rhizophora mucronata Bakhaw babae 46.6 + 49.2 15.24700789 0.8483 173.3234665 72.65891613 245.9823826
    15 Rhizophora mucronata Bakhaw babae 25 7.957728546 0.8483 35.0077682 17.1542168 52.161985
    16 Rhizophora mucronata Bakhaw babae 59.4 18.90756303 0.8483 294.2704531 117.1520744 411.4225276
    17 Rhizophora mucronata Bakhaw babae 11 3.50140056 0.8483 4.645773248 2.772271986 7.418045234
    18 Rhizophora mucronata Bakhaw babae 53.5 17.02953909 0.8483 227.5004747 92.87299935 320.373474
    19 Rhizophora mucronata Bakhaw babae 70.7 22.50445633 0.8483 451.6518165 172.4468135 624.0986301
    20 Rhizophora mucronata Bakhaw babae 40.4 12.85968933 0.8483 114.006644 49.78639791 163.7930419
    21 Rhizophora mucronata Bakhaw babae 42 13.36898396 0.8483 125.4368842 54.26970989 179.7065941
    22 Rhizophora mucronata Bakhaw babae 51.2 16.29742806 0.8483 204.1907702 84.24097577 288.431746
    23 Rhizophora mucronata Bakhaw babae 22.4 7.130124777 0.8483 26.72034914 13.44295287 40.16330201
    24 Rhizophora mucronata Bakhaw babae 33.7 10.72701808 0.8483 72.97961358 33.28759779 106.2672114
    25 Rhizophora mucronata Bakhaw babae 47 14.96052967 0.8483 165.4217968 69.66286313 235.08466
    26 Rhizophora mucronata Bakhaw babae 55.9 17.79348103 0.8483 253.4341007 102.3760311 355.8101318
    27 Rhizophora mucronata Bakhaw babae 42 13.36898396 0.8483 125.4368842 54.26970989 179.7065941
    28 Rhizophora mucronata Bakhaw babae 41.4 13.17799847 0.8483 121.0745441 52.56356743 173.6381116
    29 Rhizophora mucronata Bakhaw babae 60 19.09854851 0.8483 301.6366295 119.7953198 421.4319493
    30 Rhizophora mucronata Bakhaw babae 57.1 18.175452 0.8483 267.0280164 107.3189057 374.3469221
    31 Rhizophora mucronata Bakhaw babae 58 18.46193023 0.8483 277.5012013 111.1102746 388.6114759
    32 Rhizophora mucronata Bakhaw babae 64.7 20.59460148 0.8483 363.1253211 141.628801 504.7541221
    33 Rhizophora mucronata Bakhaw babae 49.2 15.66080978 0.8483 185.1254623 77.1092721 262.2347344
    34 Rhizophora mucronata Bakhaw babae 75.6 24.06417112 0.8483 532.5932038 200.107083 732.7002868
    35 Rhizophora mucronata Bakhaw babae 58 18.46193023 0.8483 277.5012013 111.1102746 388.6114759
    36 Rhizophora mucronata Bakhaw babae 65.2 + 70.7 21.62910619 0.8483 409.654828 157.9081985 567.5630265
    37 Rhizophora mucronata Bakhaw babae 98.5 21.62910619 0.8483 409.654828 157.9081985 567.5630265
    38 Rhizophora mucronata Bakhaw babae 61 19.41685765 0.8483 314.1545814 124.2728645 438.4274459
    39 Rhizophora mucronata Bakhaw babae 28 21.62910619 0.8483 409.654828 157.9081985 567.5630265
    40 Rhizophora mucronata Bakhaw babae 68 21.64502165 0.8483 410.3967649 158.1662659 568.5630307
    41 Rhizophora mucronata Bakhaw babae 19 21.62910619 0.8483 409.654828 157.9081985 567.5630265
    42 Rhizophora mucronata Bakhaw babae 33 10.50420168 0.8483 69.30687152 31.77203423 101.0789058
    43 Rhizophora mucronata Bakhaw babae 40 21.62910619 0.8483 409.654828 157.9081985 567.5630265
    Total Biomass of Site 3(kg) Total Biomass (t/ha) C. Stored (tC/ha) CO2 Sequestered (tCO2/ha)
    6.152733237 61.52733237 30.76366618 112.8103639
    Table F4. Amount of Carbon Stored and Carbon dioxide Sequestered of Avicennia alba.
    Table F4. Amount of Carbon Stored and Carbon dioxide Sequestered of Avicennia alba.
    Tree No. Scientific Name Local name GBH
    (cm)
    DBH (cm) Wood Density (g/cm3) AGB (kg) BGB (kg) Total Biomass (kg)
    1 Avicennia alba Bungalon 91.9 29.25261013 0.6987 709.1358437 259.2721792 968.4080229
    2 Avicennia alba Bungalon 162.6 51.75706646 0.6987 2886.222521 920.2018123 3806.424333
    3 Avicennia alba Bungalon 35.6 11.33180545 0.6987 68.79237045 31.58017106 100.3725415
    4 Avicennia alba Bungalon 61 19.41685765 0.6987 258.752571 104.3825053 363.1350764
    5 Avicennia alba Bungalon 80.8 25.71937866 0.6987 516.660461 194.8268028 711.4872638
    6 Avicennia alba Bungalon 172.7 54.9719888 0.6987 3347.437138 1051.924262 4399.3614
    7 Avicennia alba Bungalon 71.1 22.63177998 0.6987 377.2007064 146.6715887 523.8722952
    8 Avicennia alba Bungalon 128.3 40.8390629 0.6987 1611.42781 543.824363 2155.252173
    9 Avicennia alba Bungalon 62.7 19.95798319 0.6987 276.8544 110.9505408 387.8049408
    10 Avicennia alba Bungalon 56.4 17.9526356 0.6987 213.3633765 87.70716907 301.0705455
    11 Avicennia alba Bungalon 94.7 30.14387573 0.6987 763.4739581 277.1356756 1040.609634
    12 Avicennia alba Bungalon 68.6 21.83600713 0.6987 345.4065781 135.4674699 480.874048
    13 Avicennia alba Bungalon 38.1 12.1275783 0.6987 81.29217058 36.71545619 118.0076268
    14 Avicennia alba Bungalon 30.5 9.708428826 0.6987 47.02739088 22.40480281 69.4321937
    15 Avicennia alba Bungalon 26.7 8.498854087 0.6987 33.89931968 16.67441027 50.57372995
    16 Avicennia alba Bungalon 48.0 15.27883881 0.6987 143.4916811 61.31278305 204.8044641
    17 Avicennia alba Bungalon 27.0 8.59434683 0.6987 34.84401078 17.09318681 51.93719759
    18 Avicennia alba Bungalon 24.0 7.639419404 0.6987 26.07912009 13.16025908 39.23937918
    19 Avicennia alba Bungalon 27.0 8.59434683 0.6987 34.84401078 17.09318681 51.93719759
    20 Avicennia alba Bungalon 33.5 10.66335625 0.6987 59.23569727 27.59274798 86.82844524
    21 Avicennia alba Bungalon 33.0 10.50420168 0.6987 57.08441723 26.68679559 83.77121282
    22 Avicennia alba Bungalon 40.0 12.73236567 0.6987 91.63066919 40.9042716 132.5349408
    23 Avicennia alba Bungalon 32.0 10.18589254 0.6987 52.92272845 24.92461361 77.84734206
    24 Avicennia alba Bungalon 149 47.42806213 0.6987 2328.152905 757.9996385 3086.152544
    25 Avicennia alba Bungalon 48.0 15.27883881 0.6987 143.4916811 61.31278305 0.074150784
    26 Avicennia alba Bungalon 27.0 8.59434683 0.6987 34.84401078 17.09318681 0.018804199
    27 Avicennia alba Bungalon 24.0 7.639419404 0.6987 26.07912009 13.16025908 0.014206872
    28 Avicennia alba Bungalon 27.0 8.59434683 0.6987 34.84401078 17.09318681 0.018804199
    29 Avicennia alba Bungalon 33.5 10.66335625 0.6987 59.23569727 27.59274798 0.031436801
    30 Avicennia alba Bungalon 33.0 10.50420168 0.6987 57.08441723 26.68679559 0.030329911
    31 Avicennia alba Bungalon 40.0 12.73236567 0.6987 91.63066919 40.9042716 0.047985134
    32 Avicennia alba Bungalon 32.0 10.18589254 0.6987 52.92272845 24.92461361 0.028185135
    Total Biomass of Avicennia alba (kg) Total Biomass (t/ha) C. Stored (tC/ha) CO2 Sequestered (tCO2/ha)
    6.984794515 69.84794515 34.92397257 128.0662074
    Table F5. Amount of Carbon Stored and Carbon dioxide Sequestered of Xylocarpus granatum.
    Table F5. Amount of Carbon Stored and Carbon dioxide Sequestered of Xylocarpus granatum.
    Tree No. Scientific Name Local Name GBH
    (cm)
    DBH (cm) Wood Density (g/cm3) AGB (kg) BGB (kg) Total Biomass (kg)
    1 Xylocarpus granatum Tabigi 25.0 7.957728546 0.6721 27.73632089 13.91451251 41.6508334
    2 Xylocarpus granatum Tabigi 15.5 4.933791698 0.6721 8.55721432 4.814792179 13.3720065
    3 Xylocarpus granatum Tabigi 47.0 14.96052967 0.6721 131.062112 56.50650169 187.5686137
    4 Xylocarpus granatum Tabigi 13.4 4.265342501 0.6721 5.981281409 3.485088643 9.466370052
    5 Xylocarpus granatum Tabigi 21.0 6.684491979 0.6721 18.06241835 9.448611899 27.51103024
    6 Xylocarpus granatum Tabigi 39.5 12.5732111 0.6721 85.45653647 38.41375204 123.8702885
    7 Xylocarpus granatum Tabigi 25.0 7.957728546 0.6721 27.73632089 13.91451251 41.6508334
    8 Xylocarpus granatum Tabigi 40.0 12.73236567 0.6721 88.14222522 39.50157001 127.6437952
    9 Xylocarpus granatum Tabigi 55.0 17.5070028 0.6721 192.9339465 80.10255099 273.0364975
    10 Xylocarpus granatum Tabigi 25.2 8.021390374 0.6721 28.28536336 14.16284092 42.44820427
    11 Xylocarpus granatum Tabigi 25.0 7.957728546 0.6721 27.73632089 13.91451251 41.6508334
    Total Biomass of Xylocarpus granatum (kg) Total Biomass (t/ha) C. Stored (tC/ha) CO2 Sequestered (tCO2/ha)
    0.336665209 3.366652086 1.683326043 6.1727566
    Table F6. Amount of Carbon Stored and Carbon dioxide Sequestered of Rhizophora mucronata.
    Table F6. Amount of Carbon Stored and Carbon dioxide Sequestered of Rhizophora mucronata.
    Tree No. Scientific Name Local name GBH (cm) DBH (cm) Wood Density (g/cm3) AGB (kg) BGB (kg) Total Biomass (kg)
    1 Rhizophora mucronata Bakhaw babae 45.7 14.54672778 0.8483 154.3923777 65.45729277 219.8496705
    2 Rhizophora mucronata Bakhaw babae 48.3 15.37433155 0.8483 176.9057483 74.01277804 250.9185264
    3 Rhizophora mucronata Bakhaw babae 26.4 8.403361345 0.8483 40.02926939 19.35997504 59.38924442
    4 Rhizophora mucronata Bakhaw babae 33.02 10.51056786 0.8483 69.41024749 31.81479787 101.2250454
    5 Rhizophora mucronata Bakhaw babae 38.6 12.28673287 0.8483 101.9146865 44.99537666 146.9100632
    6 Rhizophora mucronata Bakhaw babae 32.3 10.28138528 0.8483 65.74613214 30.2951896 96.04132175
    7 Rhizophora mucronata Bakhaw babae 16 5.092946269 0.8483 11.67796477 6.3692814 18.04724617
    8 Rhizophora mucronata Bakhaw babae 39 12.41405653 0.8483 104.5324036 46.03705171 150.5694553
    9 Rhizophora mucronata Bakhaw babae 40 12.73236567 0.8483 111.2498879 48.69868745 159.9485753
    10 Rhizophora mucronata Bakhaw babae 37.8 12.03208556 0.8483 96.79698516 42.95125627 139.7482414
    11 Rhizophora mucronata Bakhaw babae 11 3.50140056 0.8483 4.645773248 2.772271986 7.418045234
    12 Rhizophora mucronata Bakhaw babae 6.5 2.069009422 0.8483 1.27349974 0.862207363 2.135707103
    13 Rhizophora mucronata Bakhaw babae 12 3.819709702 0.8483 5.754636138 3.362996703 9.11763284
    14 Rhizophora mucronata Bakhaw babae 10 3.183091418 0.8483 3.674785579 2.243592995 5.918378573
    15 Rhizophora mucronata Bakhaw babae 10 3.183091418 0.8483 3.674785579 2.243592995 5.918378573
    16 Rhizophora mucronata Bakhaw babae 10 3.183091418 0.8483 3.674785579 2.243592995 5.918378573
    17 Rhizophora mucronata Bakhaw babae 55 17.5070028 0.8483 243.5141598 98.75276082 342.2669206
    18 Rhizophora mucronata Bakhaw babae 21 6.684491979 0.8483 22.79772278 11.64852429 34.44624707
    19 Rhizophora mucronata Bakhaw babae 20.5 6.525337408 0.8483 21.48555129 11.04174331 32.5272946
    20 Rhizophora mucronata Bakhaw babae 10.5 3.342245989 0.8483 4.143407798 2.500255085 6.643662883
    21 Rhizophora mucronata Bakhaw babae 21.5 6.84364655 0.8483 24.15631114 12.27318997 36.4295011
    22 Rhizophora mucronata Bakhaw babae 14 4.456327986 0.8483 8.408276237 4.735308897 13.14358513
    23 Rhizophora mucronata Bakhaw babae 15.5 4.933791698 0.8483 10.80060245 5.935816207 16.73641866
    24 Rhizophora mucronata Bakhaw babae 10 3.183091418 0.8483 3.674785579 2.243592995 5.918378573
    25 Rhizophora mucronata Bakhaw babae 15 4.774637128 0.8483 9.963604971 5.51907976 15.48268473
    26 Rhizophora mucronata Bakhaw babae 16.9 5.379424497 0.8483 13.36082565 7.192047707 20.55287336
    27 Rhizophora mucronata Bakhaw babae 12.2 3.88337153 0.8483 5.993454143 3.488694169 9.482148312
    28 Rhizophora mucronata Bakhaw babae 14 4.456327986 0.8483 8.408276237 4.735308897 13.14358513
    29 Rhizophora mucronata Bakhaw babae 10 3.183091418 0.8483 3.674785579 2.243592995 5.918378573
    30 Rhizophora mucronata Bakhaw babae 10.2 3.246753247 0.8483 3.858232774 2.344425609 6.202658383
    31 Rhizophora mucronata Bakhaw babae 16.6 5.283931755 0.8483 12.78491662 6.911686493 19.69660311
    32 Rhizophora mucronata Bakhaw babae 15.8 5.029284441 0.8483 11.32213782 6.193880303 17.51601813
    33 Rhizophora mucronata Bakhaw babae 15.5 4.933791698 0.8483 10.80060245 5.935816207 16.73641866
    34 Rhizophora mucronata Bakhaw babae 16 5.092946269 0.8483 11.67796477 6.3692814 18.04724617
    35 Rhizophora mucronata Bakhaw babae 17.4 5.538579068 0.8483 14.35433753 7.672968345 22.02730588
    36 Rhizophora mucronata Bakhaw babae 18 5.729564553 0.8483 15.60279369 8.272733549 23.87552723
    37 Rhizophora mucronata Bakhaw babae 19.7 6.270690094 0.8483 19.4813442 10.10785719 29.5892014
    38 Rhizophora mucronata Bakhaw babae 19.1 6.079704609 0.8483 18.05402697 9.437091167 27.49111813
    39 Rhizophora mucronata Bakhaw babae 16.2 5.156608098 0.8483 12.04034522 6.547377891 18.58772311
    40 Rhizophora mucronata Bakhaw babae 20.3 6.461675579 0.8483 20.97356501 10.80401751 31.77758253
    41 Rhizophora mucronata Bakhaw babae 14.9 4.742806213 0.8483 9.800996264 5.437729392 15.23872566
    42 Rhizophora mucronata Bakhaw babae 15 4.774637128 0.8483 9.963604971 5.51907976 15.48268473
    43 Rhizophora mucronata Bakhaw babae 16.9 5.379424497 0.8483 13.36082565 7.192047707 20.55287336
    44 Rhizophora mucronata Bakhaw babae 19.4 6.175197352 0.8483 18.75962959 9.76931056 28.52894015
    45 Rhizophora mucronata Bakhaw babae 17 5.411255411 0.8483 13.55614951 7.28686428 20.84301379
    46 Rhizophora mucronata Bakhaw babae 17.8 5.665902725 0.8483 15.17977062 8.070054737 23.24982536
    47 Rhizophora mucronata Bakhaw babae 15 4.774637128 0.8483 9.963604971 5.51907976 15.48268473
    48 Rhizophora mucronata Bakhaw babae 18.3 5.825057296 0.8483 16.25031127 8.581940408 24.83225167
    49 Rhizophora mucronata Bakhaw babae 19 6.047873695 0.8483 17.82238667 9.327753688 27.15014035
    50 Rhizophora mucronata Bakhaw babae 20.6 6.557168322 0.8483 21.74429671 11.16167325 32.90596995
    51 Rhizophora mucronata Bakhaw babae 17.8 5.665902725 0.8483 15.17977062 8.070054737 23.24982536
    52 Rhizophora mucronata Bakhaw babae 15 4.774637128 0.8483 9.963604971 5.51907976 15.48268473
    53 Rhizophora mucronata Bakhaw babae 17.2 5.47491724 0.8483 13.95185592 7.478547001 21.43040292
    54 Rhizophora mucronata Bakhaw babae 16 5.092946269 0.8483 11.67796477 6.3692814 18.04724617
    55 Rhizophora mucronata Bakhaw babae 19.2 6.111535523 0.8483 18.2874447 9.54712927 27.83457397
    56 Rhizophora mucronata Bakhaw babae 20.3 6.461675579 0.8483 20.97356501 10.80401751 31.77758253
    57 Rhizophora mucronata Bakhaw babae 16.7 5.315762669 0.8483 12.97521379 7.004459705 19.9796735
    58 Rhizophora mucronata Bakhaw babae 15.4 4.901960784 0.8483 10.62999295 5.851134422 16.48112737
    59 Rhizophora mucronata Bakhaw babae 19 6.047873695 0.8483 17.82238667 9.327753688 27.15014035
    60 Rhizophora mucronata Bakhaw babae 15.3 4.87012987 0.8483 10.46099328 5.767120844 16.22811413
    61 Rhizophora mucronata Bakhaw babae 16.8 5.347593583 0.8483 13.16718194 7.097913145 20.26509508
    62 Rhizophora mucronata Bakhaw babae 16.4 5.220269926 0.8483 12.40931673 6.728177154 19.13749389
    63 Rhizophora mucronata Bakhaw babae 15.5 4.933791698 0.8483 10.80060245 5.935816207 16.73641866
    64 Rhizophora mucronata Bakhaw babae 18.9 6.016042781 0.8483 17.59251952 9.219116022 26.81163554
    65 Rhizophora mucronata Bakhaw babae 20.1 6.398013751 0.8483 20.46889059 10.56913202 31.03802261
    66 Rhizophora mucronata Bakhaw babae 17.4 5.538579068 0.8483 14.35433753 7.672968345 22.02730588
    67 Rhizophora mucronata Bakhaw babae 15.9 5.061115355 0.8483 11.49923447 6.281244391 17.78047886
    68 Rhizophora mucronata Bakhaw babae 16.7 5.315762669 0.8483 12.97521379 7.004459705 19.9796735
    69 Rhizophora mucronata Bakhaw babae 20 6.366182837 0.8483 20.21928494 10.45275246 30.67203741
    70 Rhizophora mucronata Bakhaw babae 17 5.411255411 0.8483 13.55614951 7.28686428 20.84301379
    71 Rhizophora mucronata Bakhaw babae 14.9 4.742806213 0.8483 9.800996264 5.437729392 15.23872566
    72 Rhizophora mucronata Bakhaw babae 19.6 6.23885918 0.8483 19.23897538 9.994303962 29.23327934
    73 Rhizophora mucronata Bakhaw babae 21.8 6.939139292 0.8483 24.99395466 12.65661271 37.65056737
    74 Rhizophora mucronata Bakhaw babae 20.7 6.588999236 0.8483 22.00488246 11.28231555 33.28719802
    75 Rhizophora mucronata Bakhaw babae 24.2 7.703081232 0.8483 32.3160152 15.95931283 48.27532803
    76 Rhizophora mucronata Bakhaw babae 23 7.321110262 0.8483 28.51559776 14.25541521 42.77101297
    77 Rhizophora mucronata Bakhaw babae 25.1 7.98955946 0.8483 35.35325113 17.30691804 52.66016917
    78 Rhizophora mucronata Bakhaw babae 24.8 7.894066718 0.8483 34.32283387 16.85104377 51.17387764
    79 Rhizophora mucronata Bakhaw babae 22.7 7.22561752 0.8483 27.60931375 13.84590917 41.45522292
    80 Rhizophora mucronata Bakhaw babae 22.2 7.066462949 0.8483 26.1372758 13.17794463 39.31522043
    81 Rhizophora mucronata Bakhaw babae 21.7 6.907308378 0.8483 24.71285657 12.5280848 37.24094137
    82 Rhizophora mucronata Bakhaw babae 20.8 6.62083015 0.8483 22.26731267 11.40367099 33.67098366
    83 Rhizophora mucronata Bakhaw babae 25 7.957728546 0.8483 35.0077682 17.1542168 52.161985
    84 Rhizophora mucronata Bakhaw babae 24.3 7.734912147 0.8483 32.6455084 16.10608559 48.75159399
    85 Rhizophora mucronata Bakhaw babae 24.9 7.925897632 0.8483 34.66429701 17.00225893 51.66655595
    86 Rhizophora mucronata Bakhaw babae 20.9 6.652661064 0.8483 22.53159141 11.52574032 34.05733173
    87 Rhizophora mucronata Bakhaw babae 16.8 5.347593583 0.8483 13.16718194 7.097913145 20.26509508
    88 Rhizophora mucronata Bakhaw babae 16.4 5.220269926 0.8483 12.40931673 6.728177154 19.13749389
    89 Rhizophora mucronata Bakhaw babae 19.8 6.302521008 0.8483 19.72551594 10.22211583 29.94763177
    90 Rhizophora mucronata Bakhaw babae 20 6.366182837 0.8483 20.21928494 10.45275246 30.67203741
    91 Rhizophora mucronata Bakhaw babae 17.4 5.538579068 0.8483 14.35433753 7.672968345 22.02730588
    92 Rhizophora mucronata Bakhaw babae 15.2 4.838298956 0.8483 10.29359862 5.683774517 15.97737314
    93 Rhizophora mucronata Bakhaw babae 18.3 5.825057296 0.8483 16.25031127 8.581940408 24.83225167
    94 Rhizophora mucronata Bakhaw babae 19.7 6.270690094 0.8483 19.4813442 10.10785719 29.5892014
    95 Rhizophora mucronata Bakhaw babae 16.5 5.25210084 0.8483 12.59628581 6.81959261 19.41587842
    96 Rhizophora mucronata Bakhaw babae 19.1 6.079704609 0.8483 18.05402697 9.437091167 27.49111813
    97 Rhizophora mucronata Bakhaw babae 18.7 5.952380952 0.8483 17.13808748 9.00393688 26.14202436
    98 Rhizophora mucronata Bakhaw babae 17.4 5.538579068 0.8483 14.35433753 7.672968345 22.02730588
    99 Rhizophora mucronata Bakhaw babae 15.6 4.965622613 0.8483 10.97282658 6.021167151 16.99399373
    100 Rhizophora mucronata Bakhaw babae 17.7 5.634071811 0.8483 14.9708424 7.969750518 22.94059292
    101 Rhizophora mucronata Bakhaw babae 19.9 6.334351923 0.8483 19.97149479 10.33708066 30.30857544
    102 Rhizophora mucronata Bakhaw babae 23.6 7.512095747 0.8483 30.38054292 15.0941521 45.47469501
    103 Rhizophora mucronata Bakhaw babae 22 7.00280112 0.8483 25.56182152 12.91583317 38.47765469
    104 Rhizophora mucronata Bakhaw babae 24.8 7.894066718 0.8483 34.32283387 16.85104377 51.17387764
    105 Rhizophora mucronata Bakhaw babae 18.6 5.920550038 0.8483 16.91351396 8.89739377 25.81090773
    106 Rhizophora mucronata Bakhaw babae 22.6 7.193786606 0.8483 27.31107304 13.7108636 41.02193663
    107 Rhizophora mucronata Bakhaw babae 15.3 4.87012987 0.8483 10.46099328 5.767120844 16.22811413
    108 Rhizophora mucronata Bakhaw babae 16.5 5.25210084 0.8483 12.59628581 6.81959261 19.41587842
    109 Rhizophora mucronata Bakhaw babae 23.7 7.543926662 0.8483 30.69820165 15.23650658 45.93470823
    110 Rhizophora mucronata Bakhaw babae 25.2 8.021390374 0.8483 35.70074949 17.4603633 53.16111279
    111 Rhizophora mucronata Bakhaw babae 18 5.729564553 0.8483 15.60279369 8.272733549 23.87552723
    112 Rhizophora mucronata Bakhaw babae 23 7.321110262 0.8483 28.51559776 14.25541521 42.77101297
    113 Rhizophora mucronata Bakhaw babae 24.7 7.862235803 0.8483 33.98337504 16.70057067 50.68394571
    114 Rhizophora mucronata Bakhaw babae 20.1 6.398013751 0.8483 20.46889059 10.56913202 31.03802261
    115 Rhizophora mucronata Bakhaw babae 23 7.321110262 0.8483 28.51559776 14.25541521 42.77101297
    116 Rhizophora mucronata Bakhaw babae 19.4 6.175197352 0.8483 18.75962959 9.76931056 28.52894015
    117 Rhizophora mucronata Bakhaw babae 18.3 5.825057296 0.8483 16.25031127 8.581940408 24.83225167
    118 Rhizophora mucronata Bakhaw babae 22.7 7.22561752 0.8483 27.60931375 13.84590917 41.45522292
    119 Rhizophora mucronata Bakhaw babae 24.6 7.830404889 0.8483 33.64591681 16.55083896 50.19675578
    120 Rhizophora mucronata Bakhaw babae 20.1 6.398013751 0.8483 20.46889059 10.56913202 31.03802261
    121 Rhizophora mucronata Bakhaw babae 16.8 5.347593583 0.8483 13.16718194 7.097913145 20.26509508
    122 Rhizophora mucronata Bakhaw babae 19.7 6.270690094 0.8483 19.4813442 10.10785719 29.5892014
    123 Rhizophora mucronata Bakhaw babae 24.9 7.925897632 0.8483 34.66429701 17.00225893 51.66655595
    124 Rhizophora mucronata Bakhaw babae 25 7.957728546 0.8483 35.0077682 17.1542168 52.161985
    125 Rhizophora mucronata Bakhaw babae 15.2 4.838298956 0.8483 10.29359862 5.683774517 15.97737314
    126 Rhizophora mucronata Bakhaw babae 17.8 5.665902725 0.8483 15.17977062 8.070054737 23.24982536
    127 Rhizophora mucronata Bakhaw babae 21.6 6.875477464 0.8483 24.4336434 12.40027746 36.83392086
    128 Rhizophora mucronata Bakhaw babae 24.6 7.830404889 0.8483 33.64591681 16.55083896 50.19675578
    129 Rhizophora mucronata Bakhaw babae 23.8 7.575757576 0.8483 31.01782331 15.37959574 46.39741905
    130 Rhizophora mucronata Bakhaw babae 19.8 6.302521008 0.8483 19.72551594 10.22211583 29.94763177
    131 Rhizophora mucronata Bakhaw babae 22.3 7.098293863 0.8483 26.42785811 13.3100863 39.73794441
    132 Rhizophora mucronata Bakhaw babae 16.9 5.379424497 0.8483 13.36082565 7.192047707 20.55287336
    133 Rhizophora mucronata Bakhaw babae 26 8.276037688 0.8483 38.55373335 18.71478783 57.26852118
    134 Rhizophora mucronata Bakhaw babae 22.4 7.130124777 0.8483 26.72034914 13.44295287 40.16330201
    135 Rhizophora mucronata Bakhaw babae 24.8 7.894066718 0.8483 34.32283387 16.85104377 51.17387764
    136 Rhizophora mucronata Bakhaw babae 17 5.411255411 0.8483 13.55614951 7.28686428 20.84301379
    137 Rhizophora mucronata Bakhaw babae 15.2 4.838298956 0.8483 10.29359862 5.683774517 15.97737314
    138 Rhizophora mucronata Bakhaw babae 23.7 7.543926662 0.8483 30.69820165 15.23650658 45.93470823
    139 Rhizophora mucronata Bakhaw babae 26.7 8.498854087 0.8483 41.15756818 19.85176272 61.0093309
    140 Rhizophora mucronata Bakhaw babae 18.8 5.984211867 0.8483 17.36442123 9.111177358 26.47559859
    141 Rhizophora mucronata Bakhaw babae 15.9 5.061115355 0.8483 11.49923447 6.281244391 17.78047886
    142 Rhizophora mucronata Bakhaw babae 23.3 7.416603005 0.8483 29.43930609 14.67148993 44.11079602
    143 Rhizophora mucronata Bakhaw babae 18.1 5.761395467 0.8483 15.8168974 8.375109839 24.19200724
    144 Rhizophora mucronata Bakhaw babae 16 5.092946269 0.8483 11.67796477 6.3692814 18.04724617
    145 Rhizophora mucronata Bakhaw babae 18 5.729564553 0.8483 15.60279369 8.272733549 23.87552723
    146 Rhizophora mucronata Bakhaw babae 19.8 6.302521008 0.8483 19.72551594 10.22211583 29.94763177
    147 Rhizophora mucronata Bakhaw babae 20.5 6.525337408 0.8483 21.48555129 11.04174331 32.5272946
    148 Rhizophora mucronata Bakhaw babae 23.6 7.512095747 0.8483 30.38054292 15.0941521 45.47469501
    149 Rhizophora mucronata Bakhaw babae 35 11.14081996 0.8483 80.10126827 36.20554871 116.306817
    150 Rhizophora mucronata Bakhaw babae 37.6 11.96842373 0.8483 95.54195021 42.44837712 137.9903273
    151 Rhizophora mucronata Bakhaw babae 11 3.50140056 0.8483 4.645773248 2.772271986 7.418045234
    152 Rhizophora mucronata Bakhaw babae 73 23.23656735 0.8483 488.6593796 185.1487672 673.8081468
    153 Rhizophora mucronata Bakhaw babae 74 23.5548765 0.8483 505.291548 190.8264157 696.1179638
    154 Rhizophora mucronata Bakhaw babae 32.5 10.34504711 0.8483 66.75212126 30.71320487 97.46532613
    155 Rhizophora mucronata Bakhaw babae 62 19.73516679 0.8483 326.9757612 128.8408633 455.8166245
    156 Rhizophora mucronata Bakhaw babae 55.0 17.5070028 0.8483 243.5141598 98.75276082 342.2669206
    157 Rhizophora mucronata Bakhaw babae 62.5 19.89432136 0.8483 333.5007739 131.1588843 464.6596582
    158 Rhizophora mucronata Bakhaw babae 37.2 11.84110008 0.8483 93.06098296 41.45237342 134.5133564
    159 Rhizophora mucronata Bakhaw babae 10.0 3.183091418 0.8483 3.674785579 2.243592995 5.918378573
    160 Rhizophora mucronata Bakhaw babae 57.0 18.14362108 0.8483 265.8790683 106.9021045 372.7811728
    161 Rhizophora mucronata Bakhaw babae 46.6 + 49.2 15.24700789 0.8483 173.3234665 72.65891613 245.9823826
    162 Rhizophora mucronata Bakhaw babae 25.0 7.957728546 0.8483 35.0077682 17.1542168 52.161985
    163 Rhizophora mucronata Bakhaw babae 59.4 18.90756303 0.8483 294.2704531 117.1520744 411.4225276
    164 Rhizophora mucronata Bakhaw babae 11.0 3.50140056 0.8483 4.645773248 2.772271986 7.418045234
    165 Rhizophora mucronata Bakhaw babae 53.5 17.02953909 0.8483 227.5004747 92.87299935 320.373474
    166 Rhizophora mucronata Bakhaw babae 70.7 22.50445633 0.8483 451.6518165 172.4468135 624.0986301
    167 Rhizophora mucronata Bakhaw babae 40.4 12.85968933 0.8483 114.006644 49.78639791 163.7930419
    168 Rhizophora mucronata Bakhaw babae 42.0 13.36898396 0.8483 125.4368842 54.26970989 179.7065941
    169 Rhizophora mucronata Bakhaw babae 51.2 16.29742806 0.8483 204.1907702 84.24097577 288.431746
    170 Rhizophora mucronata Bakhaw babae 22.4 7.130124777 0.8483 26.72034914 13.44295287 40.16330201
    171 Rhizophora mucronata Bakhaw babae 33.7 10.72701808 0.8483 72.97961358 33.28759779 106.2672114
    172 Rhizophora mucronata Bakhaw babae 47.0 14.96052967 0.8483 165.4217968 69.66286313 235.08466
    173 Rhizophora mucronata Bakhaw babae 55.9 17.79348103 0.8483 253.4341007 102.3760311 355.8101318
    174 Rhizophora mucronata Bakhaw babae 42.0 13.36898396 0.8483 125.4368842 54.26970989 179.7065941
    175 Rhizophora mucronata Bakhaw babae 41.4 13.17799847 0.8483 121.0745441 52.56356743 173.6381116
    176 Rhizophora mucronata Bakhaw babae 60.0 19.09854851 0.8483 301.6366295 119.7953198 421.4319493
    177 Rhizophora mucronata Bakhaw babae 57.1 18.175452 0.8483 267.0280164 107.3189057 374.3469221
    178 Rhizophora mucronata Bakhaw babae 58.0 18.46193023 0.8483 277.5012013 111.1102746 388.6114759
    179 Rhizophora mucronata Bakhaw babae 64.7 20.59460148 0.8483 363.1253211 141.628801 504.7541221
    180 Rhizophora mucronata Bakhaw babae 49.2 15.66080978 0.8483 185.1254623 77.1092721 262.2347344
    181 Rhizophora mucronata Bakhaw babae 75.6 24.06417112 0.8483 532.5932038 200.107083 732.7002868
    182 Rhizophora mucronata Bakhaw babae 58.0 18.46193023 0.8483 277.5012013 111.1102746 388.6114759
    183 Rhizophora mucronata Bakhaw babae 65.2 + 70.7 21.62910619 0.8483 409.654828 157.9081985 567.5630265
    184 Rhizophora mucronata Bakhaw babae 98.5 21.62910619 0.8483 409.654828 157.9081985 567.5630265
    185 Rhizophora mucronata Bakhaw babae 61.0 19.41685765 0.8483 314.1545814 124.2728645 438.4274459
    186 Rhizophora mucronata Bakhaw babae 28.0 21.62910619 0.8483 409.654828 157.9081985 567.5630265
    187 Rhizophora mucronata Bakhaw babae 68.0 21.64502165 0.8483 410.3967649 158.1662659 568.5630307
    188 Rhizophora mucronata Bakhaw babae 19.0 21.62910619 0.8483 409.654828 157.9081985 567.5630265
    189 Rhizophora mucronata Bakhaw babae 33.0 10.50420168 0.8483 69.30687152 31.77203423 101.0789058
    190 Rhizophora mucronata Bakhaw babae 40.0 21.62910619 0.8483 409.654828 157.9081985 567.5630265
    Total Biomass of Rhizophora mucronata (kg) Total Biomass (t/ha) C. Stored (tC/ha) CO2 Sequestered (tCO2/ha)
    7.031091513 70.31091513 35.15545757 128.9150629
    Table F7. Total Occurrence of Identified Mangrove spp. in Kaingen River, Kawit, Cavite.
    Table F7. Total Occurrence of Identified Mangrove spp. in Kaingen River, Kawit, Cavite.
    Mangrove Species Site 1 Site 2 Site 3 Total No. of Species Total Occurrences (%)
    Acanthaceae
    Avicennia alba 15 8 1 24 9.38
    Meliaceae
    Xylocarpus granatum - 14 - 14 5.47
    Rhizophoraceae
    Rhizophora mucronata 6 170 42 218 85.16

    Appendix G. Statistical Treatment

    Table G1. Kruskal Wallis Comparing the Water Quality of Three Sampling Sites Per Sampling Month.
    Table G1. Kruskal Wallis Comparing the Water Quality of Three Sampling Sites Per Sampling Month.
    Parameters November December January
    p-value Remarks p-value Remarks p-value Remarks
    Temperature 0.023 S 0.066 NS 0.038 S
    Turbidity 0.018 S 0.018 S 0.018 S
    TDS 0.414 NS 0.027 S 0.027 S
    Salinity 0.414 NS 0.027 S 0.027 S
    Conductivity 0.414 NS 0.027 S 0.027 S
    pH 0.026 S 0.106 NS 0.026 S
    DO 0.026 S 0.063 NS 0.053 NS
    Parameters February March
    p-value Remarks p-value Remarks
    Temperature 0.054 NS 0.193 NS
    Turbidity 0.018 S 0.018 S
    TDS 0.05 S 0.027 S
    Salinity 0.05 S 0.027 S
    Conductivity 0.05 S 0.027 S
    pH 0.027 S 0.063 NS
    DO 0.048 S 0.063 NS
    Table G2. Friedman Test One-Way ANOVA Comparison of Soil Quality across Sampling Sites during the Five-Month Period.
    Table G2. Friedman Test One-Way ANOVA Comparison of Soil Quality across Sampling Sites during the Five-Month Period.
    Parameters SITE 1 SITE 2 SITE 3
    p - value Remarks p - value Remarks p - value Remarks
    Temperature 0.031 S 0.189 NS 0.017 S
    Turbidity 0.017 S 0.017 S 0.017 S
    TDS 0.017 S 0.022 S 0.017 S
    Salinity 0.017 S 0.022 S 0.017 S
    Conductivity 0.017 S 0.022 S 0.017 S
    pH 0.022 S 0.017 S 0.017 S
    DO 0.018 S 0.017 S 0.022 S
    Nitrate 0.406 NS 0.406 NS 0.406 NS
    Phosphate 0.406 NS 0.406 NS 0.406 NS
    Table G3. Kruskal Wallis Comparing the Soil Quality of Three Sampling Sites Per Sampling Month.
    Table G3. Kruskal Wallis Comparing the Soil Quality of Three Sampling Sites Per Sampling Month.
    Parameters p - value Remarks
    Soil Temperature 0.398 Not Significant
    Soil pH 1.000 Not Significant
    Organic Matter 0.008 Significant
    Organic Carbon 0.008 Significant
    Water Holding Capacity 0.027 Significant
    Nitrogen 0.135 Not Significant
    Phosphorus 0.368 Not Significant
    Potassium 0.323 Not Significant
    Table G4. Friedman Test One-Way ANOVA Comparison of Soil Quality across Sampling Sites during the Five-Month Period.
    Table G4. Friedman Test One-Way ANOVA Comparison of Soil Quality across Sampling Sites during the Five-Month Period.
    Parameters p - value Remarks
    Soil Temperature 0.137 Not Significant
    Soil pH 1.000 Not Significant
    Organic Matter 0.308 Not Significant
    Organic Carbon 0.308 Not Significant
    Water Holding Capacity 0.339 Not Significant
    Nitrogen 0.406 Not Significant
    Phosphorus 0.406 Not Significant
    Potassium 0.322 Not Significant

    Appendix H. Species Diversity Computation

    Table H1. Shannon-Weiner Diversity Index for Mangrove sp. found in Site 1,2, and 3 of Kaingen River, Kawit Cavite.
    Table H1. Shannon-Weiner Diversity Index for Mangrove sp. found in Site 1,2, and 3 of Kaingen River, Kawit Cavite.
    Species n pi In(pi) PiInPi
    Site 1
    Avicennia alba 15 0.71429 -0.33647 -0.24034
    Xylocarpus granatum 0 0 0 0
    Rhizophora mucronata 6 0.28571 -1.25276 -0.35793
    Total 21
    Shannon-Weiner (H) 0.5983
    Shannon-Weiner Evenness (E) 0.1994
    Species Richness(S) 2
    Site 2
    Avicennia alba 8 0.04167 -3.17805 -0.13242
    Xylocarpus granatum 14 0.07292 -2.61844 -0.19093
    Rhizophora mucronata 170 0.88542 -0.12170 -0.10775
    Total 192
    Shannon-Weiner (H) 0.4311
    Shannon-Weiner Evenness (E) 0.1437
    Species Richness (S) 3
    Site 3
    Avicennia alba 1 0.02326 -3.76120 -0.08747
    Xylocarpus granatum 0 0 0 0
    Rhizophora mucronata 42 0.97674 -0.02353 -0.02298
    Total 43
    Shannon-Weiner (H) 0.1105
    Shannon-Weiner Evenness (E) 0.0368
    Species Richness (S) 2
    Table H2. Simpson Diversity Index of Mangrove sp. found in Site 1, 2, and 3 in Kaingen River, Kawit Cavite.
    Table H2. Simpson Diversity Index of Mangrove sp. found in Site 1, 2, and 3 in Kaingen River, Kawit Cavite.
    Site 1 Species n n-1 n(n-1) Dominance (C) Diversity
    (1-D)
    Reciprocal (1/D)
    Avicennia alba 15 14 210
    Xylocarpus granatum 0 5 30 0.5714 0.4286 1.750
    Rhizophora mucronata 6 0 40
    Site 2 Species n n-1 n(n-1) Dominance (C) Diversity
    (1-D)
    Reciprocal (1/D)
    Avicennia alba 8 7 56
    Xylocarpus granatum 14 169 28730 0.7899 0.2101 1.266
    Rhizophora mucronata 170 13 182
    Site 3 Species n n-1 n(n-1) Dominance (C) Diversity
    (1-D)
    Reciprocal (1/D)
    Avicennia alba 1 0 0
    Xylocarpus granatum 0 41 1722 0.9318 0.06818 1.073
    Rhizophora mucronata 42 0 1722

    Appendix I. Photo-documentations

    Table I1. Identified and Collected Tree Species in Kaingen River during the Five-Month Sampling Period.
    Table I1. Identified and Collected Tree Species in Kaingen River during the Five-Month Sampling Period.
    Local Name Family Name Scientific Name No. of Trees per Species
    Bakhaw Babae Rhizophoreceae Rhizophora mucronata Poir 24
    Bungalon Acanthaceae Avicennia alba Blume 14
    Tabigi Meliaceae Xylocarpus granatum J.Koenig 218
    Banago Malvaceae Thespesia populneoides (Roxb.) Kostel. 1
    Note: Thespesia populneoides (Roxb.) Kostel is an associate species.
    Local Name: Bakhaw Babae
    Scientific Name: Rhizophora mucronata Poir
    Description: It is an evergreen tree that grows on riverbanks. It produces seeds with elongated roots that reach a meter or more and still attached to the branch until it becomes well-developed.
    Preprints 81428 i050
    Local Name: Bungalon, Api-api, Miapi
    Scientific Name: Avicennia alba Blume
    Description: Low, bushy and has a shallow aerial root known as pneumatophores. It is characterized by its silvery grey underside color and rough texture underneath its leaves.
    Preprints 81428 i051
    Local Name: Tabigi
    Scientific Name: Xylocarpus granatum J Koenig
    Description: A native Philippine mangroves that can be found in estuaries. It has plank or ribbon roots. Some unique characteristics are smooth and brown colored bark, pinnate leaves, has 2-3 leaflets, with rounded tips.
    Preprints 81428 i052
    Local Name: Banago
    Scientific Name: Thespesia populneoides (Roxb.) Kostel
    Description: It has cordate leaf blades, strong yellow twigs accompany with yellow flower that anthesis to color pink and red. It grows commonly in beach forests, tidal streams, and riverbanks.
    Figure I2. Description of Identified and Collected Tree Species in the Kaingen River, Kawit, Cavite.
    Figure I2. Description of Identified and Collected Tree Species in the Kaingen River, Kawit, Cavite.
    Preprints 81428 g0a14
    Figure I3. Instrument Calibration.
    Figure I3. Instrument Calibration.
    Preprints 81428 g0a15
    Figure I4. Water Samples Collection and Preparation.
    Figure I4. Water Samples Collection and Preparation.
    Preprints 81428 g0a16
    Figure I5. In-situ Water Sample Analysis.
    Figure I5. In-situ Water Sample Analysis.
    Preprints 81428 g0a17
    Figure I6. Soil Collection.
    Figure I6. Soil Collection.
    Preprints 81428 g0a18
    Figure I7. Preparation of Soil Samples.
    Figure I7. Preparation of Soil Samples.
    Preprints 81428 g0a19
    Figure I8. Ex-situ Soil Analysis.
    Figure I8. Ex-situ Soil Analysis.
    Preprints 81428 g0a20
    Figure I9. Measuring of Girth at Breast Height (GBH) of Mangroves.
    Figure I9. Measuring of Girth at Breast Height (GBH) of Mangroves.
    Preprints 81428 g0a21
    Figure I10. Distribution of Survey Questionnaires.
    Figure I10. Distribution of Survey Questionnaires.
    Preprints 81428 g0a22
    Figure I11. Soil collection instrumentation (used during high tide).
    Figure I11. Soil collection instrumentation (used during high tide).
    Preprints 81428 g0a23

    Appendix J. Letters and Certifications

    Figure J1. Thesis Proposal Endorsement.
    Figure J1. Thesis Proposal Endorsement.
    Preprints 81428 g0a24
    Figure J2. Application for Gratuitous Permit.
    Figure J2. Application for Gratuitous Permit.
    Preprints 81428 g0a25
    Figure J3. Letter of Request for Barangay Kaingen.
    Figure J3. Letter of Request for Barangay Kaingen.
    Preprints 81428 g0a26
    Figure J4. Barangay Permit from Barangay Kaingen.
    Figure J4. Barangay Permit from Barangay Kaingen.
    Preprints 81428 g0a27
    Figure J5. Gratuitous Permit.
    Figure J5. Gratuitous Permit.
    Preprints 81428 g0a28aPreprints 81428 g0a28b
    Figure J6. Letter of Request for Mangrove Species Identification.
    Figure J6. Letter of Request for Mangrove Species Identification.
    Preprints 81428 g0a29
    Figure J7. Billing Statement.
    Figure J7. Billing Statement.
    Preprints 81428 g0a30
    Figure J8. Certificate of Plant Identification.
    Figure J8. Certificate of Plant Identification.
    Preprints 81428 g0a31
    Figure J10. Certificate of Proofreading.
    Figure J10. Certificate of Proofreading.
    Preprints 81428 g0a32
    Figure J11. Certificate of Similarity Index Using Turnitin.
    Figure J11. Certificate of Similarity Index Using Turnitin.
    Preprints 81428 g0a33aPreprints 81428 g0a33b
    Figure J12. ITSO Documents.
    Figure J12. ITSO Documents.
    Preprints 81428 g0a34aPreprints 81428 g0a34bPreprints 81428 g0a34c
    Figure J13. Letter of Request to Conduct Anthropogenic Survey.
    Figure J13. Letter of Request to Conduct Anthropogenic Survey.
    Preprints 81428 g0a35
    Figure J14. Discount Letter for Laboratory Soil Analysis in BSWM.
    Figure J14. Discount Letter for Laboratory Soil Analysis in BSWM.
    Preprints 81428 g0a36aPreprints 81428 g0a36bPreprints 81428 g0a36cPreprints 81428 g0a36d

    Appendix K. Line of Budget

    LINE-ITEM BUDGET
    Title of Proposal: ENVIRONMENTAL PARAMETERS AND CARBON SEQUESTRATION POTENTIAL OF MANGROVE FOREST IN KAINGEN RIVERINE ECOSYSTEM, KAWIT, CAVITE, PHILIPPINES
    Proponents: Barrios, Roniel B., Buenafe, Jhade V., Madla, Jhianna Lou J., Tupas, Kristia Mariae G., and Verano, Gian Carlo G.
    Unit (PHP) Quantity Total (PHP)
    I. Material/s
    Life Vest 200 5 pcs 1000
    Nylon Rope 200 2 pcs 400
    Sola Bottle 21 2 pcs 42
    Electrical Tape 110 1 pc 110
    Black Cartolina 25 2 pcs 50
    Waterproof Phone Case 150 5 pcs 750
    Field Tape Measure 250 2 pcs 500
    Meter Stick 42 1 pc 42
    Zip Lock Bags 88 1 pack 88
    Masking Tape 30 3 pcs 90
    Clear Packaging Tape 100 1 pc 100
    Raincoat 100 5 pcs 500
    Pail 26 1 pc 26
    Clearbook 53 2 pcs 106
    Metal Soil Probe 877 1 pc 877
    DIY Soil Probe (PVC) 676 1 pc 676
    Field Guide Book 700 5 pcs 3500
    Binder Clip 228/box 2 boxes 456
    Folder 7 7 pcs 49
    Puncher 190 1 pc 190
    Expanding Folder 252 1 set 252
    Fastener 59 7 pcs 49
    SUBTOTAL 9853
    II. Acquired In-Situ Device and Other Equipment
    DO Analyzer 3365 1 3365
    Salinity Refractor 537 1 537
    Portable pH Meter with TDS 774 1 774
    5-in-1 pH Meter Water Quality Tester 1560 1 1560
    BSWM Soil Test Kit 1500 1 1500
    SUBTOTAL 7736
    III. Laboratory Expenses
    Mangrove Species ID 200 7 1400
    1st Soil Parameter Testing BSWM 2250 1 2250
    2nd Soil Parameter Testing BSWM 2250 1 2250
    3rd Soil Parameter Testing BSWM 2250 1 2250
    4th Soil Parameter Testing BSWM 2250 1 2250
    5th Soil Parameter Testing BSWM 2250 1 2250
    Laboratory Expenses for Nitrates (Mach Union Laboratories Inc.) 2500 1 2500
    Laboratory Expenses for Phosphates (Mach Union Laboratories Inc.) 2500 1 2500
    SUBTOTAL 17650
    IV. Transportation
    1st Ocular Inspection 350 2 700
    2nd Ocular Inspection 300 3 900
    3rd Ocular Inspection 300 5 1500
    November Sampling 300 5 1500
    December Sampling 300 5 1500
    January Sampling 300 5 1500
    February Sampling 300 5 1500
    March Sampling 300 5 1500
    Total Travel Expense for Gratuitous Permit (4 days) 300/day 3 3600
    January Thesis Survey 300 5 1500
    February Thesis Survey 300 5 1500
    Boat Rent (November Sampling) 2000 1 2000
    Boat Rent (December Sampling) 2000 1 2000
    Boat Rent (January Sampling) 2000 1 2000
    Boat Rent (February Sampling) 2000 1 2000
    Boat Rent (March Sampling) 2000 1 2000
    Travel expense to BSWM Laboratory (November) 250 1 250
    Travel expense to BSWM Laboratory (December) 250 1 250
    Travel expense to BSWM Laboratory (January) 250 1 250
    Travel expense to BSWM Laboratory (February) 250 2 500
    Travel expense to BSWM Laboratory (March) 250 1 250
    Travel expense to BSWM Laboratory (April) 250 1 250
    Travel expense to BSWM Laboratory (May) 250 2 500
    June Travel Expenses 4800 4 19200
    July Travel Expenses 4800 4 19200
    SUBTOTAL 67850
    V. Other Expenses Unit (PHP) Quantity Total (PHP)
    TURNITIN Account 300 1 300
    Gratuitous Permit 200 1 200
    November Printing Expenses 470 1 470
    December Printing Expenses 585 1 585
    January Printing Expenses 380 1 380
    February Printing Expenses 440 1 440
    March Printing Expenses 270 1 270
    April Printing Expenses 300 1 300
    May Printing Expenses 2574 1 2574
    Food for Panel 143 5 715
    June Printing Expense 2500 1 2500
    July Printing Expense (For book bind) 800 10 8000
    Grammarian 1500 1 1500
    Notary 50 4 200
    Book bind 250 10 2500
    Tarpaulin Printing 300 1 300
    CD Burn 80 5 400
    SUBTOTAL 21634
    TOTAL PHP 124,723.00

    References

    1. Abino, A. C., Castillo, J. A. A., & Lee, Y. J. (2013). Assessment of species diversity, biomass and carbon sequestration potential of a natural mangrove stand in Samar, the Philippines. Forest Science and Technology, 10(1), 2–8. [CrossRef]
    2. Ahmed, S., Sarker, S. K., Friess, D. A., Kamruzzaman, N. M., Jacobs, M. A., Islam, A., Alam, A., Suvo, M. S. H., Sani, N. H., Dey, T. K., Naabeh, C. S. S., & Pretzsch, H. (2022). Salinity reduces site quality and mangrove forest functions. From monitoring to understanding. Science of the Total Environment, 853, 158662. [CrossRef]
    3. Alhassan, A. B., & Aljahdali, M. O. (2021). Nutrient and physicochemical properties as potential causes of stress in mangroves of the central Red Sea. PLOS ONE, 16(12), e0261620. [CrossRef]
    4. Alongi, D. M. (2014). Carbon Cycling and Storage in Mangrove Forests. Annual Review of Marine Science, 6(1), 195–219. [CrossRef]
    5. Alsumaiti, T. S., & Shahid, S. A. (2018). Comprehensive analysis of mangrove soil in Eastern Lagoon National Park of Abu Dhabi Emirate. International Journal of Business and Applied Social Science, 4(5), 39-56. https://nbnresolving.org/urn:nbn:de:0168-ssoar-57449-3.
    6. Arnaud, M., Baird, A. J., Morris, P. J., Dang, T. H., & Nguyen, T. T. (2020). Sensitivity of mangrove soil organic matter decay to warming and sea level change. Global Change Biology, 26(3), 1899–1907. [CrossRef]
    7. Baird, R. B., Eaton, A. D., & Rice, E. W. (Eds.). (2017, June 15). Standard methods for the examination of water and wastewater. Standard Methods for the Examination of Water and Wastewater. https://www.standardmethods.org/doi/abs/10.2105/SMWW.2882.
    8. Basyuni, M., Putri, L. a. P., Nainggolan, B., & Sihaloho, P. K. (2014). Growth and biomass in response to salinity and subsequent fresh water in mangrove seedlings Avicennia marina and Rhizophora stylosa. Jurnal Manajemen Hutan Tropika, 20(1), 17–25. [CrossRef]
    9. Basyuni, M., Ramayani, Hayullah, A., Prayunita, Hamka, M., Putri, L. A. P., & Baba, S. (2019). Growth of salt-secretor and non-salt secretor mangrove seedlings with varying salinity and their relations to habitat zonation. IOP Conference Series. [CrossRef]
    10. Bayabil, H. K., Li, Y., Tong, Z., & Gao, B. (2021). Potential management practices of saltwater intrusion impacts on soil health and water quality: a review. Journal of Water and Climate Change, 12(5), 1327–1343. [CrossRef]
    11. Bonner, M. T., Herbohn, J., Gregorio, N., Pasa, A., Avela, M. S., Solano, C., Moreno, M.O. M., Almendras-Ferraren, A., Wills, J., Shoo, L. P., & Schmidt, S. (2019). Soil organic carbon recovery in tropical tree plantations may depend on restoration of soil microbial composition and function. Geoderma, 353, 70– 80. [CrossRef]
    12. Cañizares, L.P. & Seronay, R.A. (2016). Diversity and species composition of mangroves in Barangay Imelda, Dinagat Island, Philippines. Volume 9, Issue 3. AACL Bioflux. 9(3):518-526. Retrieved on June 1, 2022, from http://www.bioflux.com.ro/docs/2016.518-527.pdf.
    13. Carnell, P. E., Palacios, M. M., Waryszak, P., Trevathan-Tackett, S. M., Masqué, P., & Macreadie, P. I. (2022). Blue carbon drawdown by restored mangrove forests improves with age. Research Online. https://ro.ecu.edu.au/ecuworks2022-2026/136/.
    14. Chen, G., & Fang, X. (2015). Accuracy of Hourly Water Temperatures in Rivers Calculated from Air Temperatures. Water, 7(12), 1068–1087. [CrossRef]
    15. Chen, S., Xie, J., & Wen, Z. (2021). Microalgae-based wastewater treatment and utilization of microalgae biomass. Elsevier EBooks, 165–198. [CrossRef]
    16. Chen, H., Hsu, L., Huang, S., & Liao, X. (2020). Assessment of the Components and Sources of Acid Deposition in Northeast Asia: A Case Study of the Coastal and Metropolitan Cities in Northern Taiwan. Atmosphere, 11(9), 983. [CrossRef]
    17. Chen, Z., Lum, S., & Srikanth, S. (2015). Mangrove root: Adaptations and ecological importance. Trees, 30(2), 451–465. [CrossRef]
    18. Chorchuhirun, B. (2020). Comparative Anatomy of Two Mangrove Species, Xylocarpus granatum and Xylocarpus moluccensis (Meliaceae). Li01.tci-thaijo.org. [CrossRef]
    19. Chunkao, K., Jitthaisong, O., Dhanmanonda, P., & Teejuntuk, S. (2012). Water quality from mangrove forest: The King’s Royally Initiated Laem Phak Bia Environmental Research and Development Project, Phetchaburi Province, Thailand. Modern Applied Science, 6(8). [CrossRef]
    20. Christina Curell, Michigan State University Extension. (2022, January 21). Why is soil water holding capacity important? MSU Extension. Retrieved October 10, 2022, from https://www.canr.msu.edu/news/why_is_soil_water_holding_capacity_impo rtant.
    21. Collins, M., Knutti, R., Arblaster, J., Dufresne, J.-L., Fichefet, T., Friedlingstein, P., et al. (2013). Long-term climate change, projections, commitments and irreversibility in Climate Change 2013, The Physical Science Basis. Contribution of Working Group I to the Fifth Assessment Report of the Intergovernmental Panel on Climate Change, eds T. F. Stocker, D. Qin, G.-K. Plattner, M. Tignor, S. K. Allen, J. Boschung, A. Nauels, Y. Xia, V. Bex, and P. M. Midgley. New York, NY: Cambridge University Press, 1029–1136.
    22. Dissolved Oxygen. (2023, May 18). US EPA. https://www.epa.gov/caddis-vol2/dissolved- oxygen#checklist.
    23. Dolorosa, R. G., Dangan-Galon, F., Mendoza, N. I., & Sespeñe, J. S. (2016). Diversity and structural complexity of mangrove forest along Puerto Princesa Bay, Palawan Island, Philippines. Journal of Marine and Island Cultures, 5(2), 118–125. [CrossRef]
    24. Dror, I., Yaron, B., & Berkowitz, B. (2021). The Human Impact on All Soil-Forming Factors during the Anthropocene. ACS Environmental Au. [CrossRef]
    25. Easton, Z., & Bock, E. (2016). Soil and soil water relationships. VCE publication. https://ext.vt.edu/content/dam/ext_vt_edu/topics/agriculture/water/document s/Soil-and-Soil-Water-Relationships.pdf.
    26. Feller, C. (2018). Mangroves. Smithsonian Ocean. https://ocean.si.edu/ocean-life/plants- algae/mangroves.
    27. Fukumasu, J., Jarvis, N., Koestel, J., Kätterer, T., & Larsbo, M. (2022). Relations between soil organic carbon content and the pore size distribution for an arable topsoil with large variations in soil properties. European Journal of Soil Science, 73(1). [CrossRef]
    28. Gangopadhyay, S., Bhattacharyya, T., Mishra, T. K., & Banerjee, S. (2021). Organic carbon stock in the forest soils of Himalayas and other areas in India. Forest Resources Resilience and Conflicts, 93–116. [CrossRef]
    29. Garcia, K., Malabrigo, P. L., & Gevaña, D. T. (2014). Philippines’ Mangrove Ecosystem: Status, Threats and Conservation. In Springer eBooks (pp. 81–94). [CrossRef]
    30. Geng, Y., Baumann, F., Song, C., Zhang, M., Shi, Y., Kuhn, P., Scholten, T., & He, J. (2017). Increasing temperature reduces the coupling between available nitrogen and phosphorus in soils of Chinese grasslands. Scientific Reports, 7(1). [CrossRef]
    31. Ghosh, A., Mukherjee, S., & Sarkar, N. S. (2018). Influence of soil texture on nature of mangrove vegetation in Sundarbans Tiger Reserve forest of India. International Journal of Environment, Agriculture and Biotechnology, 3(2), 656–626. [CrossRef]
    32. Greenhouse Gases Equivalencies Calculator - Calculations and References. (2022, June 23). US EPA. Retrieved October 9, 2022, from https://www.epa.gov/energy/greenhouse-gases-equivalencies-calculator- calculations-and-references.
    33. Halder, B. (2023). Mapping and monitoring land dynamics using geospatial techniques on Pathar Pratima Block, South 24 Parganas, India. Elsevier EBooks, 299–324. [CrossRef]
    34. Hancock, G., Turner, L., & Webb, A. (2022). Organic carbon export in steep forested catchments – An assessment of scale and disturbance. Journal of Hydrology, 612, 128011. [CrossRef]
    35. Harishma, K. M., Sandeep, S., & Sreekumar, V. B. (2020). Biomass and carbon stocks in mangrove ecosystems of Kerala, southwest coast of India. Ecological Processes, 9(31). [CrossRef]
    36. Irvine, K. (2017). Teacher Handbook of Water Quality for the Singapore Geography Curriculum. National Institute of Education. 10.13140/RG.2.2.25193.80486.
    37. Jimenez, L. C. Z., Queiroz, H. M., Cherubin, M. R., & Ferreira, T. O. (2022, March 7). Applying the Soil Management Assessment Framework (SMAF) to assess mangrove soil quality. Sustainability, 14(5), 3085. [CrossRef]
    38. Jimenez, L. C. Z., Queiroz, H. M., Otero, X. L., Nóbrega, G. N., & Ferreira, T. O. (2021, August 26). Soil organic matter responses to mangrove restoration: A replanting experience in Northeast Brazil. International Journal of Environmental Research and Public Health, 18(17), 8981. [CrossRef]
    39. Jiao, S., Liu, S., Li, Y., Xu, Z., Kong, B., Li, Y., & Shen, Y. (2020). Variation of soil organic carbon and physical properties in relation to land uses in the Yellow River Delta, China. Scientific Reports, 10(1). [CrossRef]
    40. Joshi, P., & Beck, K. A. (2015). Biological oxygen demand and economic growth: An empirical investigation. Water Economics and Policy, 01(02), 1550001. [CrossRef]
    41. Kadarsah, A., Salim, D., & Husain, D. S. (2020). Study of Water and Sediment Quality and Heavy Metal Pollution (Pb) at South Kalimantan Mangrove Ecosystem. IOP Conference Series. [CrossRef]
    42. Kumar, M., Krishi, J., Jabalpur, J., & Pradesh, M. (2021). Pharmacy journal Pharmaceutical journal. The Pharma Innovation Journal. https://www.thepharmajournal.com/archives/2022/vol11issue2S/PartD/S-11-1-275-433.pdf.
    43. Kiernan, D. (2021, May 1). 10.1: Introduction, Simpson’s index and Shannon-Weiner index. Statistics LibreTexts. Retrieved June 21, 2022, from https://stats.libretexts.org/Bookshelves/Applied_Statistics/Book%3A_Natur al_Resources_Biometrics_(Kiernan)/10%3A_Quantitative_Measures_of_Di versity_Site_Similarity_and_Habitat_Suitability/10.01%3A_IntroductionSimpsons_Index_and_Shannon-Weiner_Index.
    44. Kiselev, M. V., Voropay, N. N., & Cherkashina, A. A. (2019). Influence of anthropogenic activities on the temperature regime of soils of the South-Western Baikal region. IOP Conference Series, 381(1), 012043. [CrossRef]
    45. Lal, G., & Kumar, M. (2022). Effect of soil temperature gradient on potassium movement in controlled Paddy Field. The Pharma Innovation Journal. https://www.thepharmajournal.com/special- issue?year=2022&vol=11&issue=2S&ArticleId=10542.
    46. Liu, F., Zhang, H., Ming, J., Zheng, J., Tian, D., & Chen, D. (2020b). Importance of precipitation on the upper ocean salinity response to Typhoon Kalmaegi (2014). Water, 12(2), 614. [CrossRef]
    47. Liu, S., Wang, D., Miao, W., Wang, Z., Zhang, P., & Li, D. (2023). Characteristics of runoff and Sediment Load during Flood Events in the Upper Yangtze River, China. Journal of Hydrology, 129433. [CrossRef]
    48. McFadden, T. N., Kauffman, J. B., & Bhomia, R. K. (2016). Effects of nesting waterbirds on nutrient levels in mangroves, Gulf of Fonseca, Honduras. Wetlands Ecology and Management, 24(2), 217–229. [CrossRef]
    49. Muliawan, R., Prartono, T., & Bengen, D. G. (2020). Productivity and decomposition rate of Rhizophora mucronata and Avicennia alba litter based on environment characteristics in Muara Gembong. IOP Conference Series. [CrossRef]
    50. Nesperos, V. C., Villanueva, C. M., Garcia, J. E., & Gevaña, D. T. (2021). Assessment of blue carbon stock of mangrove vegetation in Infanta, Quezon, Philippines. Ecosystems and Development Journal, 11(1 & 2), 48–60. https://ovcre.uplb.edu.ph/journalsuplb/index.php/EDJ/article/download/618/ 595/.
    51. Noor, Tahira & Batool, Nazima & Mazhar, Roomina & Ilyas, Noshin. (2015). Effects of Siltation, Temperature and Salinity on Mangrove Plants.
    52. Onwuka, B. M., & Mang, B. (2018). Effects of Soil Temperature on Some Soil Properties and Plant Growth. Advances in Plants and Agriculture Research, 8(1). [CrossRef]
    53. Pawar, P. R. (2013). Monitoring the impact of anthropogenic inputs on water quality of the mangrove ecosystem of Uran, Navi Mumbai, west coast of India. Marine Pollution Bulletin, 75(1–2), 291–300. [CrossRef]
    54. Pototan, B., Capin, N., Delima, A. G., & Novero, A. (2020). Assessment of mangrove species diversity in Banaybanay, Davao Oriental, Philippines, 22(1). [CrossRef]
    55. Pradipta, N., Alamsjah, M. A., & Masithah, E. D. (2021, February 1). Study of nitrogen (N) and phosphorus (P) in the land of mangrove sediments in ecotourism area Wonorejo Surabaya and coastal area of Jenu Tuban. IOP Conference Series: Earth and Environmental Science, 679(1), 012048. [CrossRef]
    56. Primavera, J. H., & Dianala, R. D. B. (2009). Field guide to Philippine mangroves. Philippine Tropical Forest Conservation Inc.
    57. Primavera, J., Friess, D., Lavieren, H.V., Lee, S. et al. (2018). The mangrove ecosystem. 10.1016/B978-0-12-805052-1.00001-2.
    58. Rastegar, S., Gozari, M. (2017). Effect of mangrove plant extract on growth of four fungal pathogens. J. Paramed. Sci. 8 (1), 1-6.
    59. Reef, R., & Lovelock, C. E. (2015). Regulation of water balance in mangroves. Annals of Botany, 115(3), 385–395. https://www.jstor.org/stable/26525623.
    60. Rugebregt, M. J., & Nurhati, I. S. (2020). Preliminary Study of Ocean Acidification: Relationship of pH, Temperature, and Salinity in Ohoililir, Southeast Maluku. IOP Conference Series, 618(1), 012004. [CrossRef]
    61. Rusydi, A. F. (2018). Correlation between conductivity and total dissolved solid in various types of water: A review. IOP Conference Series, 118, 012019. [CrossRef]
    62. Sahu, S. K., & Kathiresan, K. (2019). The age and species composition of mangrove forest directly influence the net primary productivity and carbon sequestration potential. Biocatalysis and Agricultural Biotechnology, 20, 101235. [CrossRef]
    63. Salcedo, A. J. M., Estévez, E., Salvadó, H., Barquín, J., & Cañedo-Argüelles, M. (2022). Human activities disrupt the temporal dynamics of salinity in Spanish rivers. Hydrobiologia. [CrossRef]
    64. Santos-Andrade, M., Hatje, V., Arias-Ortiz, A., Patire, V. F., & Da Silva, L. A. (2021). Human disturbance drives loss of soil organic matter and changes its stability and sources in mangroves. Environmental Research, 202, 111663. [CrossRef]
    65. Sari, K., & Soeprobowati, T. R. (2021). Impact of Water Quality Detorioration in Mangrove Forest in Semarang Coastal Area. Indonesian Journal of Limnology, 2(2), 37–48. [CrossRef]
    66. Shi, M., Ma, J., & Zhang, K. (2022). The Impact of Water Temperature on In-Line Turbidity Detection. Water, 14(22), 3720. [CrossRef]
    67. Siddique, M. R. H., Saha, S., Salekin, S., & Mahmood, H. (2017). Salinity strongly drives the survival, growth, leaf demography, and  nutrient partitioning in seedlings of Xylocarpus granatum J. König. iForest Research Article Biogeosciences and Forestry. https://iforest.sisef.org/pdf/?id=ifor2382-010.
    68. Sofawi, A. B., Nazri, M. N., & Rozainah, M.Z. (2017). Nutrient variability in mangrove soil: anthropogenic, seasonal and depth variation factors. Applied Ecology and Environmental Research, 15(4), 1983–1998. [CrossRef]
    69. Supriyantini, E., Santoso, A., & Soenardjo, N. (2018). Nitrate and Phosphate Contents on Sediments Related to The Density Levels of MangroveRhizophoraSp. in Mangrove Park Waters of Pekalongan, Central Java. IOP Conference Series, 116, 012013. [CrossRef]
    70. Tomotsune, M., Yoshitake, S., Iimura, Y., Kida, M., Fujitake, N., Koizumi, H., & Ohtsuka, T. (2018, July). Effects of soil temperature and tidal condition on variation in carbon dioxide flux from soil sediment in a subtropical mangrove forest. Journal of Tropical Ecology, 34(4), 268–275. [CrossRef]
    71. Wang, Q., Wen, Y., Zhao, B., Hong, H., Liao, R., Li, J., Liu, J., Lu, H., & Yan, C. (2021). Coastal soil texture controls soil organic carbon distribution and storage of mangroves in China. CATENA, 207, 105709. [CrossRef]
    72. Ward, R. D., Friess, D. A., Day, R. H., & Mackenzie, R. A. (2016, April). Impacts of climate change on mangrove ecosystems: a region-by-region overview. Ecosystem Health and Sustainability, 2(4), e01211. [CrossRef]
    73. Wdowczyk, A., & Szymańska-Pulikowska, A. (2021). Analysis of the possibility of conducting a comprehensive assessment of landfill leachate contamination using physicochemical indicators and toxicity test. Ecotoxicology and Environmental Safety, 221, 112434. [CrossRef]
    74. Water quality guidelines and general effluent standards of 2016. (2018, May 4). Department of Environment and Natural Resources. https://emb.gov.ph/wp- content/uploads/2019/04/DAO-2016-08_WATER-QUALITY- GUIDELINES-AND-GENERAL-EFFLUENT-STANDARDS.pdf.
    75. Water Science School. (2019, October 22). Turbidity and water U.S. Geological Survey. U.S. Geological Survey. https://www.usgs.gov/special-topics/water- science-school/science/turbidity-and-water.
    76. Wei, H., Guenet, B., Vicca, S., Nunan, N., Asard, H., AbdElgawad, H., Shen, W., & Janssens, I. A. (2014). High clay content accelerates the decomposition of fresh organic matter in artificial soils. Soil Biology & Biochemistry, 77, 100– 108. [CrossRef]
    77. Wiarta, R. (2019). Carbon sequestration by young Rhizophora apiculata plants in Kubu Raya District, West Kalimantan, Indonesia. https://www.semanticscholar.org/paper/Carbon-sequestration-by-young- Rhizophora-apiculata-Wiarta- Indrayani/fbba8e640f6042fd1537c35b0b348715e64a57e5.
    78. Wibowo, H., & Kasno, A. (2021). Soil organic carbon and total nitrogen dynamics in paddy soils on the Java Island, Indonesia. IOP Conference Series, 648(1), 012192. [CrossRef]
    79. Wood Density Database. (2017). World of Agroforestry. Retrieved October 1, 2022, from http://db.worldagroforestry.org//wd.
    80. Yang, P., Hu, Z., & Shu, Q. (2021). Factors Affecting Soil Organic Carbon Content between Natural and Reclaimed Sites in Rudong Coast, Jiangsu Province, China. Journal of Marine Science and Engineering, 9(12), 1453. [CrossRef]
    81. Zhang, X., Li, Q., Gao, J., Hu, Y., Song, M., & Yue, Y. (2020). Effects of rainfall amount and frequency on soil nitrogen mineralization in Zoigê alpine wetland. European Journal of Soil Biology, 97, 103170. [CrossRef]
    82. Zhang, Y., Wu, W., & Liu, H. (2019). Factors affecting variations of soil pH in different horizons in hilly regions. PLOS ONE, 14(6), e0218563. [CrossRef]
    83. Zhang, Y., Wang, K., Wang, J., Liu, C., & Shangguan, Z. (2021). Changes in soil water holding capacity and water availability following vegetation restoration on the Chinese Loess Plateau. Scientific Reports, 11(1). [CrossRef]
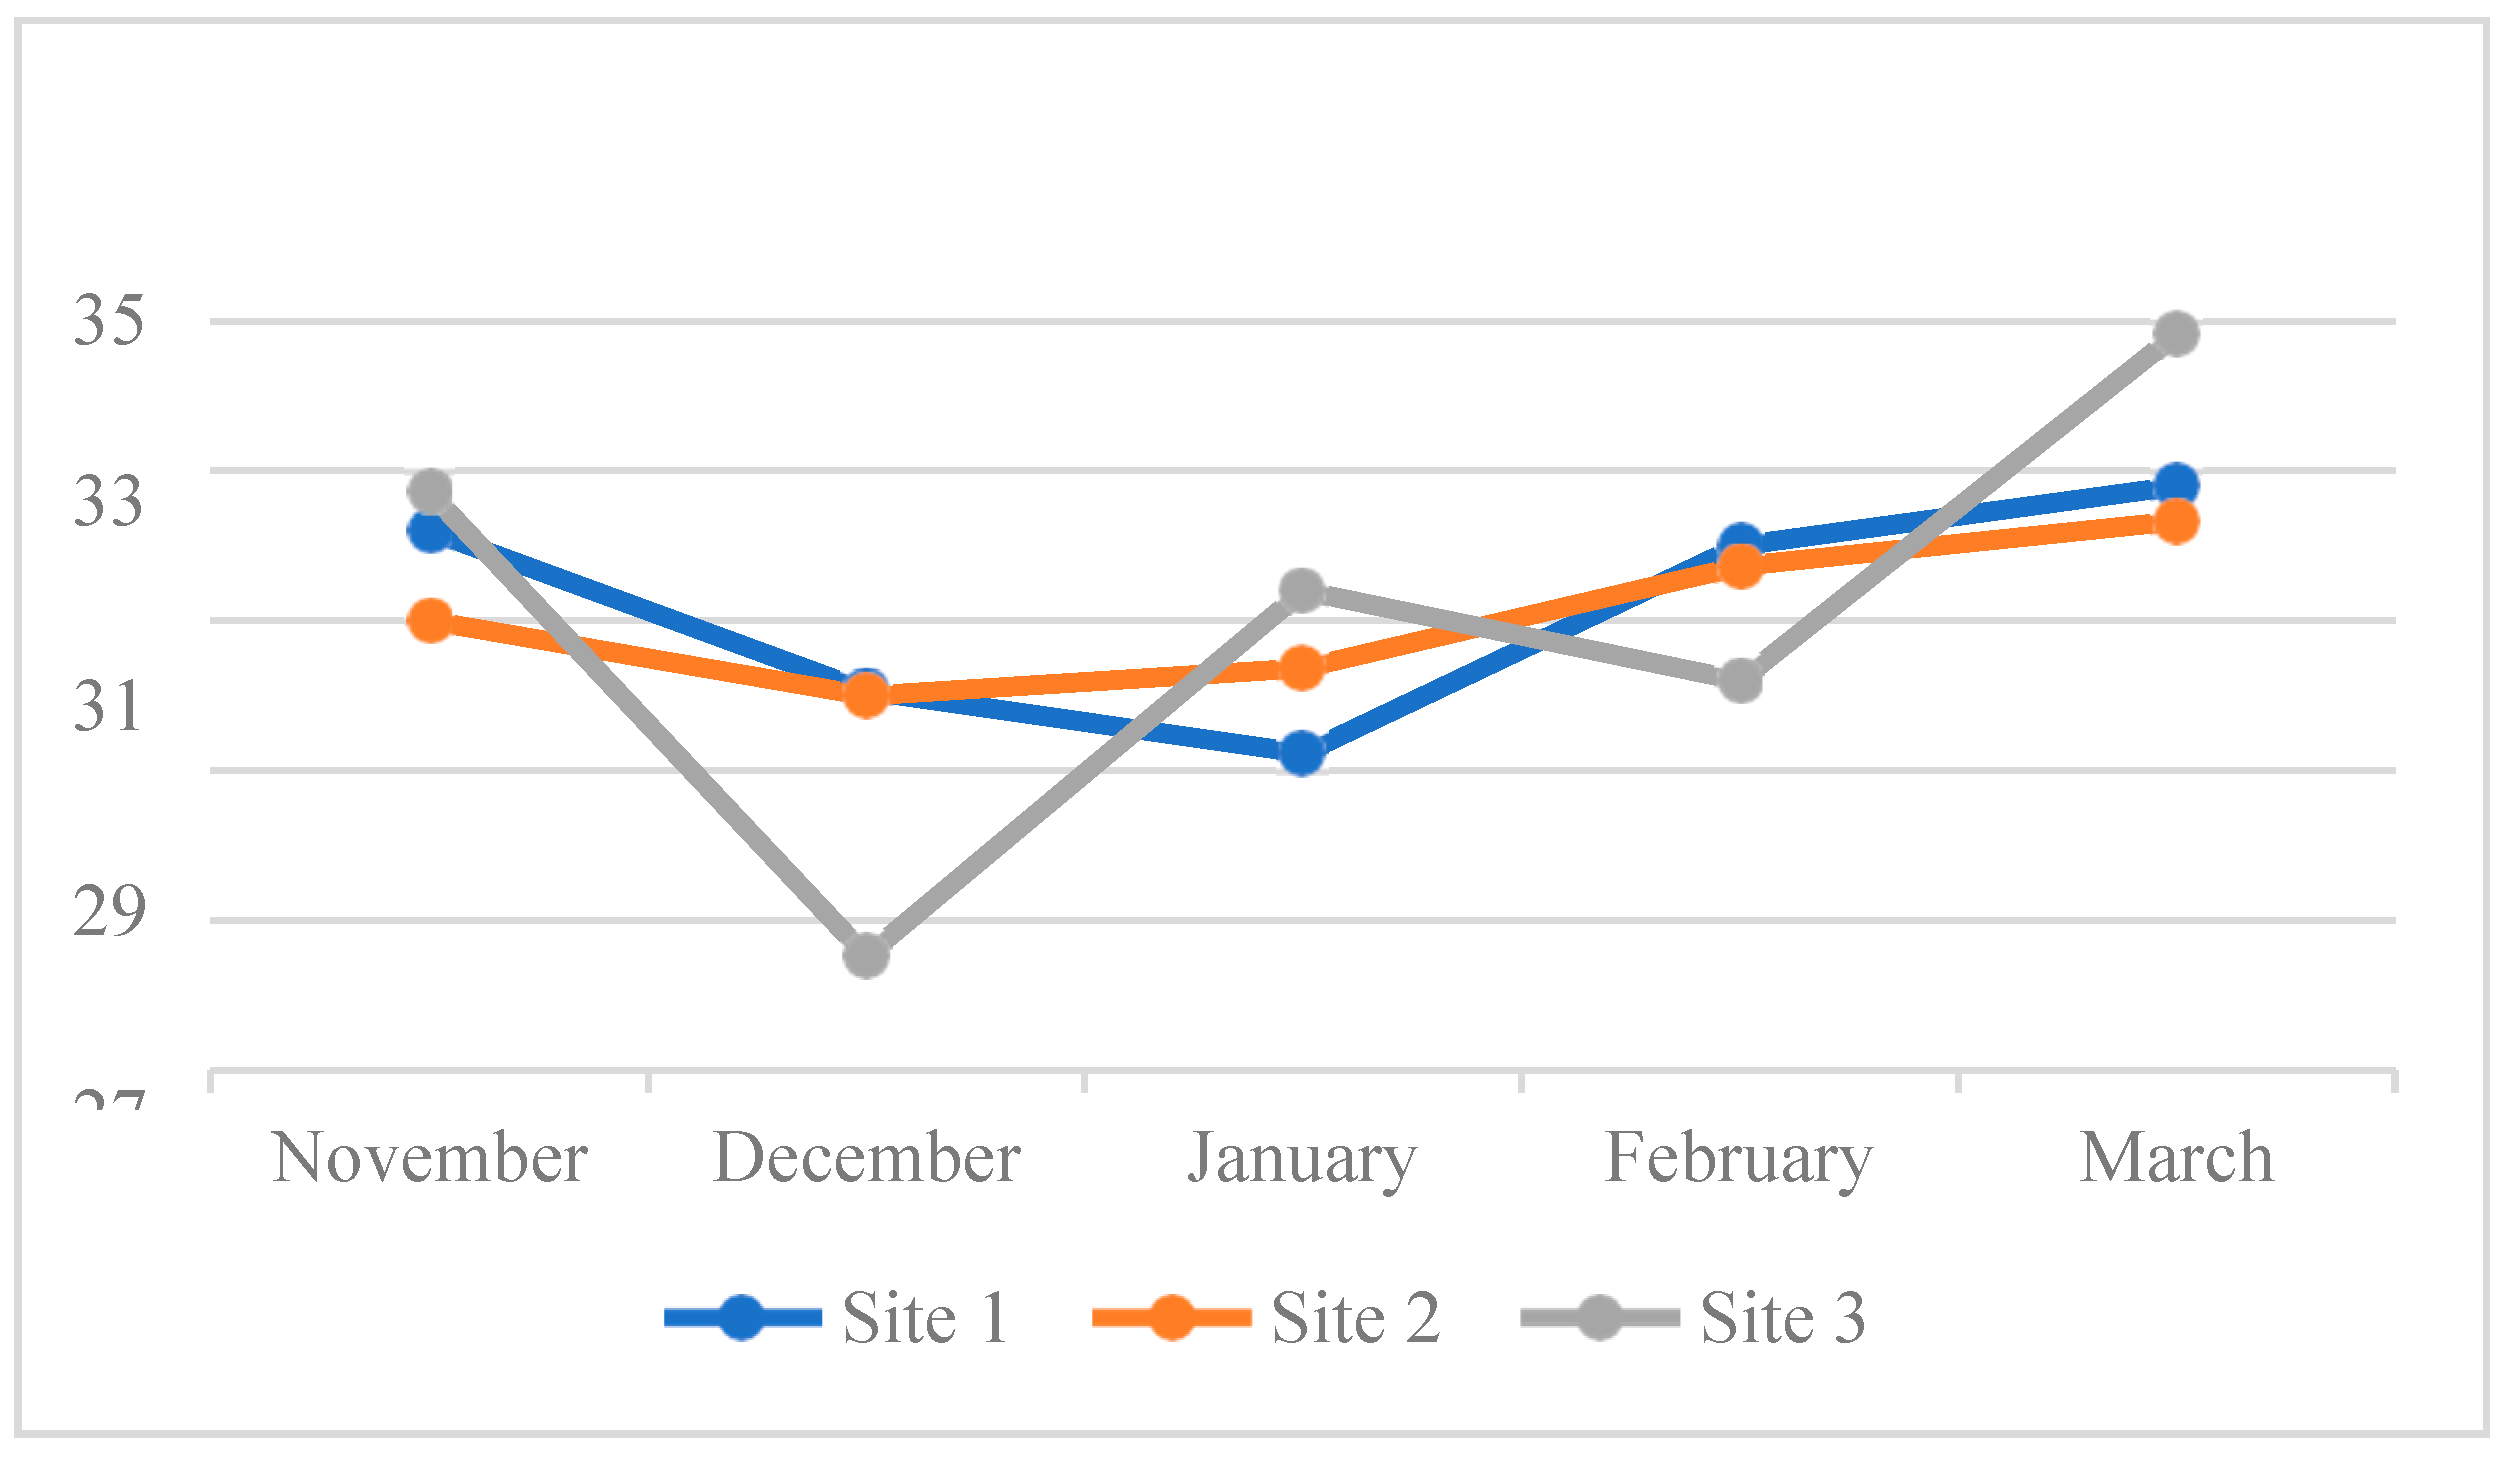
    Figure 5. The temperature of water of the three Sites in the Kaingen River.
    Figure 5. The temperature of water of the three Sites in the Kaingen River.
    Preprints 81428 g005
    Figure 6. The Turbidity of water of the three sites in the Kaingen River.
    Figure 6. The Turbidity of water of the three sites in the Kaingen River.
    Preprints 81428 g006
    Figure 7. The total dissolved solids of water of the three Sites in the Kaingen River.
    Figure 7. The total dissolved solids of water of the three Sites in the Kaingen River.
    Preprints 81428 g007
    Figure 8. The salinity of water of the three Sites in the Kaingen River.
    Figure 8. The salinity of water of the three Sites in the Kaingen River.
    Preprints 81428 g008
    Figure 9. The conductivity of water of the three Sites in the Kaingen River.
    Figure 9. The conductivity of water of the three Sites in the Kaingen River.
    Preprints 81428 g009
    Figure 10. The pH of water of the three Sites in the Kaingen River.
    Figure 10. The pH of water of the three Sites in the Kaingen River.
    Preprints 81428 g010
    Figure 11. The dissolved oxygen of water of the three Sites in the Kaingen River.
    Figure 11. The dissolved oxygen of water of the three Sites in the Kaingen River.
    Preprints 81428 g011
    Figure 12. The phosphates and nitrates of water of the three Sites in the Kaingen River.
    Figure 12. The phosphates and nitrates of water of the three Sites in the Kaingen River.
    Preprints 81428 g012
    Figure 13. The soil water holding capacity of the three Sites in the Kaingen River.
    Figure 13. The soil water holding capacity of the three Sites in the Kaingen River.
    Preprints 81428 g013
    Figure 14. The soil temperature of the three Sites in the Kaingen River.
    Figure 14. The soil temperature of the three Sites in the Kaingen River.
    Preprints 81428 g014
    Figure 15. The soil pH of the three Sites in the Kaingen River.
    Figure 15. The soil pH of the three Sites in the Kaingen River.
    Preprints 81428 g015
    Figure 16. The soil organic matter of the three Sites in the Kaingen River.
    Figure 16. The soil organic matter of the three Sites in the Kaingen River.
    Preprints 81428 g016
    Figure 17. The soil organic carbon of the three Sites in the Kaingen River.
    Figure 17. The soil organic carbon of the three Sites in the Kaingen River.
    Preprints 81428 g017
    Table 1. Anthropogenic activities in the Kaingen River.
    Table 1. Anthropogenic activities in the Kaingen River.
    Anthropogenic Activities Mean Remarks
    Fishing 1.87 Seldom
    Bathing 1.82 Seldom
    Washing of clothes 1.45 Never
    Throwing garbage 1.67 Never
    Disposing of chemical waste 1.28 Never
    Excreting 1.41 Never
    Bathing of Animals 1.31 Never
    Range: Always 3.26-4.00 Often 2.51-3.25 Seldom 1.76-2.50 Never 1.00-1.75.
    Table 2. Protection and conservation measures of Kaingen River.
    Table 2. Protection and conservation measures of Kaingen River.
    Protection and Conservation Measures Mean Remarks
    Preventing people from committing unlawful behavior in the river 3.58 Strongly Agree
    Taking part in environmental groups 3.50 Strongly Agree
    Creating groups and organizations 3.45 Strongly Agree
    River conservation guidelines 3.54 Strongly Agree
    Promoting sustainable methods 3.52 Strongly Agree
    River management 3.42 Strongly Agree
    Preventing depositing wastes 3.72 Strongly Agree
    Supporting environmental programs 3.67 Strongly Agree
    Range: Strongly Agree 3.26-4.00 Agree 2.51-3.25 Disagree 1.76-2.50 Strongly Disagree 1.00-1.75.
    Table 3. Water quality of Kaingen River, Kawit, Cavite during the five-month sampling period.
    Table 3. Water quality of Kaingen River, Kawit, Cavite during the five-month sampling period.
    Parameters Site November December January February March DENR
    Standard for Class C Water
    Temperature (°C) 1
    2
    3
    32.20
    31.00
    32.73
    30.07
    30.00
    26.53
    29.23
    30.37
    31.40
    32.00
    31.73
    30.2
    32.80
    32.33
    34.83
    25-31
    Turbidity (NTU) 1
    2
    3
    11.00
    8.000
    15.00
    8.000
    15.00
    15.00
    15.00
    24.00
    15.00
    8.000
    24.00
    11.00
    15.00
    15.00
    24.00
    -
    Total Dissolved Solid (mg/L) 1
    2
    3
    910.5
    896.5
    911.8
    2491.6
    5507.6
    6029.9
    1047.3
    2715.7
    3437.7
    2602.1
    2695.4
    2665.0
    3087.5
    3436.4
    3555.5
    -
    Salinity (mg/L) 1
    2
    3
    700.3
    689.7
    701.4
    1916.7
    4236.7
    4638.4
    805.7
    2089.0
    2644.4
    2001.7
    2073.4
    2050.0
    2375.0
    2643.4
    2735.0
    -
    Conductivity (µS/cm) 1
    2
    3
    1400.7
    1379.3
    1402.7
    3833.3
    8473.3
    9276.7
    1611.3
    4178.0
    5288.7
    4003.3
    4146.7
    4100.0
    4750.0
    5286.7
    5470.0
    -
    pH 1
    2
    3
    7.540
    7.890
    7.800
    7.560
    7.710
    7.680
    7.470
    7.600
    7.540
    7.830
    7.740
    7.590
    8.150
    8.150
    7.750
    6.5-9.0
    Dissolved Oxygen (mg/L) 1
    2
    3
    2.970
    5.130
    4.170
    5.400
    6.530
    5.570
    3.500
    4.200
    4.200
    4.600
    4.000
    3.900
    9.500
    7.800
    9.500
    ≥ 5
    Phosphates (mg/L) 0.6140 0.8150 0.7270 0.7180 0.4630 ≤ 0.025
    Nitrates (mg/L) 0.1230 0.2900 0.1700 0.1000 0.1400 ≤ 7
    Table 4. Water Quality Index Report of Kaingen River, Kawit, Cavite.
    Table 4. Water Quality Index Report of Kaingen River, Kawit, Cavite.
    Sampling Sites
    Sampling Periods 1 2 3 Average WQI Remarks
    WQI WQI WQI
    November 117.7 116.53 125.64 119.96 Unsuitable
    December 146.91 159.44 158.12 154.82 Unsuitable
    January 141.11 155.91 142.43 146.48 Unsuitable
    February 131.15 154.24 134.48 139.96 Unsuitable
    March 110.97 108.45 124.32 114.58 Unsuitable
    Average WQI 129.57 138.91 137.00 - Unsuitable
    Range Quality: 0 – 25 = Excellent; 26 – 50 = Good; 51 – 75 = Poor; 76 – 100 = Very Poor;. >100 = Unsuitable
    Table 5. Soil Texture and Water Holding Capacity of the Three Sampling Sites in Kaingen River, Kawit, Cavite during the Sampling Period.
    Table 5. Soil Texture and Water Holding Capacity of the Three Sampling Sites in Kaingen River, Kawit, Cavite during the Sampling Period.
    Soil Parameters Site Sampling Period
    November December January February March
    1 20.10 18.10 8.800 17.70 12.80
    Total Sand 2 80.80 33.90 30.90 29.00 31.50
    3 - 24.00 16.10 16.10 11.70
    1 33.50 49.70 58.00 51.10 53.00
    Total Silt 2 8.200 30.30 27.60 25.50 25.70
    3 - 24.00 37.30 41.90 44.10
    1 46.40 33.80 33.30 31.20 34.20
    Total Clay 2 11.00 35.80 41.50 45.50 42.80
    3 - 42.20 46.60 42.00 44.20
    1 Clay Silty Clay Loam Silty Clay Loam Silty Clay Loam Silty Clay Loam
    Texture Class 2 Sandy
    Loam
    Clay Loam Clay Loam Clay
    3 - Clay Clay Silty Clay Silty Clay
    Water Holding Capacity
    (WHC)
    1 38.10 87.20 85.70 95.90 94.60
    2 84.10 75.50 88.30 98.50 77.60
    3 98.40 97.70 121.4 107.2 96.50
    Pore Size Distribution: Sand: 0.006 mm – 2.0 mm; Silt: 0.05 mm – 0.002 mm; Clay: < 0.002 mm.
    Table 6. Soil pH, Temperature, and Soil Nutrients of the Three Sampling Sites in Kaingen River, Kawit, Cavite during the Sampling Period.
    Table 6. Soil pH, Temperature, and Soil Nutrients of the Three Sampling Sites in Kaingen River, Kawit, Cavite during the Sampling Period.
    Parameters Sampling Period Sampling Sites
    1 2 3
    November 31.00 29.50 30.20
    December 27.00 26.00 28.00
    Temperature (°C) January 27.50 26.50 26.80
    February 29.50 27.00 26.00
    March 29.00 29.50 27.00
    November 5.800 5.800 5.800
    December 5.800 5.800 5.800
    pH January
    February
    5.800
    5.800
    5.800
    5.800
    5.800
    5.800
    March 5.800 5.800 5.800
    November 0.6600 3.850 10.50
    December 3.990 2.020 12.28
    Organic Matter (%) January
    February
    5.320
    6.380
    2.840
    6.300
    9.400
    11.05
    March 5.300 1.760 10.03
    November 0.3800 2.240 6.100
    December 2.320 1.170 7.140
    Organic Carbon (%) January 3.090 1.650 5.470
    February 3.710 3.660 6.420
    March 3.080 1.020 5.830
    Table 8. Relationship of Mangrove trees to the Physicochemical parameters of water in Kaingen River, Kawit, Cavite.
    Table 8. Relationship of Mangrove trees to the Physicochemical parameters of water in Kaingen River, Kawit, Cavite.
    Parameters r-value p-value Remarks
    Temperature -0.032 0.911 Negligible Correlation/ Not Significant
    Turbidity -0.298 0.28 Negligible Correlation/Not Significant
    Total Dissolved Solids 0.16 0.568 Negligible Correlation/ Not Significant
    Salinity 0.16 0.568 Negligible Correlation/ Not Significant
    Conductivity 0.16 0.568 Negligible Correlation/ Not Significant
    pH 0.054 0.849 Negligible Correlation/Not Significant
    Dissolved Oxygen 0.021 0.987 Negligible Correlation/Not Significant
    Table 9. Relationship of Mangrove trees to the Physicochemical Parameters of Soil in Kaingen River, Kawit, Cavite.
    Table 9. Relationship of Mangrove trees to the Physicochemical Parameters of Soil in Kaingen River, Kawit, Cavite.
    Parameters r-value p-value Remarks
    Water Holding Capacity -0.132 0.639 Negligible correlation/Not significant
    Soil Temperature -0.187 0.504 Negligible correlation/Not significant
    pH a a Cannot be computed (variable is constant)
    Organic Matter -0.452 0.090 Low negative correlation/Not Significant
    Organic Carbon -0.452 0.090 Low negative correlation/Not Significant
    N -0.414 0.127 Low negative correlation/Not Significant
    P 0.226 0.417 Negligible correlation/ Not Significant
    K -0.384 0.158 Low negative correlation/Not Significant
    Table 10. Percentage (%) Occurrence of Identified Mangrove Trees in Kaingen River, Kawit, Cavite.
    Table 10. Percentage (%) Occurrence of Identified Mangrove Trees in Kaingen River, Kawit, Cavite.
    Mangrove Species Site 1 Site 2 Site 3 Total No. of Species %
    Occurrences
    Acanthaceae
    Avicennia alba 15 8 1 24 9.38
    Meliaceae
    Xylocarpus granatum - 14 - 14 5.47
    Rhizophoraceae
    Rhizophora mucronata 6 170 42 218 85.16
    Table 11. Biodiversity and Conservation Status of Mangrove trees found in Kaingen River, Kawit, Cavite.
    Table 11. Biodiversity and Conservation Status of Mangrove trees found in Kaingen River, Kawit, Cavite.
    Family Name Scientific Name Common Name Biological Status IUCN Status
    Acanthaceae Avicennia alba Bungalon Introduced Least Concern
    Meliaceae Xylocarpus granatum Tabigi Native Least Concern
    Rhizophoraceae Rhizophora mucronata Bakhaw babae Native Least Concern
    Malvaceae Thespesia populneoides Banago Introduced Least Concern
    Note: Thespesia populneiodes is an accessory tree found alongside mangrove trees in the Kaingen River.
    Table 12. Mangrove Species Importance Value Index found in Site 1, 2, and 3 in Kaingen River, Kawit, Cavite.
    Table 12. Mangrove Species Importance Value Index found in Site 1, 2, and 3 in Kaingen River, Kawit, Cavite.
    Site
    Species 1 2 3 f Rf RA RD IV Rank
    Rhizophora mucronata 6 170 42 218 85.16 1.172 1.172 87.50 1
    Avicennia alba 15 8 1 24 9.375 1.172 1.172 11.72 2
    Xylocarpus granatum 0 14 0 14 5.469 1.172 1.172 7.813 3
    Table 13. Shannon-Weiner and Simpson’s Diversity Index for Mangrove Trees found in Sites 1,2, and 3 of Kaingen River, Kawit Cavite.
    Table 13. Shannon-Weiner and Simpson’s Diversity Index for Mangrove Trees found in Sites 1,2, and 3 of Kaingen River, Kawit Cavite.
    Diversity Indices Site 1 Site 2 Site 3
    Shannon-Weiner Index
    Diversity (H) 0.5983 0.4311 0.1105
    Evenness (E) 0.1994 0.1437 0.0368
    Simpson’s Index
    Diversity (Ds) 0.5714 0.7899 0.9318
    Dominance (1-Ds) 0.4286 0.2101 0.0682
    Reciprocal (1/Ds) 1.750 1.266 1.073
    Simpson’s Diversity Index: Ds = 0 (High Diversity); 1= (Low diversity). 1-Ds = 0 (Low diversity); 1 (High diversity) 1/Ds = >1 (High diversity). Shannon-Weiner Diversity Index: 1.99 and below (Very Low); 2.0-2.49 (Low); 2.50-2.99 (Moderate); 3.00-3.49 (High); 3.50 and above (Very High)
    Table 14. Sorensen’s Index of Similarity of each study site in Kaingen River, Kawit, Cavite.
    Table 14. Sorensen’s Index of Similarity of each study site in Kaingen River, Kawit, Cavite.
    Sites Index of Similarity (%)
    Sites 1 and Site 2 80.00
    Site 2 and Site 3 80.00
    Site 1 and Site 3 100.0
    Table 15. Carbon Stored and Carbon Dioxide (CO2) Sequestered of each Mangrove Species in all sampling sites in Kaingen River, Kawit, Cavite.
    Table 15. Carbon Stored and Carbon Dioxide (CO2) Sequestered of each Mangrove Species in all sampling sites in Kaingen River, Kawit, Cavite.
    Mangrove Species Abundanc e per Species GBH Range (cm) DBH
    Range (cm)
    Mean Total Biomass (t/ha) Carbon Stored (tC/ha) CO2
    Sequestered (tCO2/ha)
    Avicennia alba 32 24.00 – 172.7 7.640-54.97 69.85 34.92 128.06
    Xylocarpus granatum 11 10.00 – 47.00 4.270-14.96 3.367 1.683 6.173
    Rhizophora mucronata 190 10.00 – 67.95 3.180-24.06 70.31 35.16 128.92
    Table 16. Carbon Stored and Sequestered of Mangrove Species of sites 1, 2, and 3 in Kaingen River, Kawit, Cavite.
    Table 16. Carbon Stored and Sequestered of Mangrove Species of sites 1, 2, and 3 in Kaingen River, Kawit, Cavite.
    Site Aboveground Biomass (kg) Belowground Biomass (kg) Mean Total Biomass (tC/ha) Carbon Stored (tC/ha) CO2
    Sequestered (tCO2/ha)
    1 12145.35 4205.67 59.20 29.60 108.54
    2 4276.35 2090.53 23.05 11.53 42.27
    3 12277.50 4716.35 61.53 30.76 112.81
    TOTAL 71.89 263.62
    Disclaimer/Publisher’s Note: The statements, opinions and data contained in all publications are solely those of the individual author(s) and contributor(s) and not of MDPI and/or the editor(s). MDPI and/or the editor(s) disclaim responsibility for any injury to people or property resulting from any ideas, methods, instructions or products referred to in the content.
    Copyright: This open access article is published under a Creative Commons CC BY 4.0 license, which permit the free download, distribution, and reuse, provided that the author and preprint are cited in any reuse.
    Prerpints.org logo

    Preprints.org is a free preprint server supported by MDPI in Basel, Switzerland.

    Subscribe

    © 2024 MDPI (Basel, Switzerland) unless otherwise stated