1. Introduction
Conventional energy, particularly the fossil fuel-based is a major source of electricity production across the globe. In 2020, fossil fuel (coal and gas) based energy generation accounted for about 59% of global generation, while nuclear and renewable energy contributed the remaining share [
1]. In Nigeria, fossil fuels dominate the country’s energy mix, accounted for about 80% of the total installed capacity. Likewise, about 90% of the country’s economy depends on crude oil. Nigeria is endowed with so many renewable energy sources (RES) such as wind, solar, biomass and hydropower, most of which are yet to be fully harnessed [
2]. Due to poor maintenance of the grid infrastructure, Nigeria is only able to supply about 30% of the electricity generated for the 12,522 MW installed capacity [
2,
3,
4]. Power loss in the country’s grid is between 30-35%, which is significantly high. Overall, the rate of access to electricity in Nigeria is about 55% in urban areas and 36% in rural areas [
2,
3,
4].
Nigeria’s electricity generation is mainly from the fossil fuels based installed plants. The country‘s percentage mix of electricity generation is 39.8% natural gas, 35.6% hydro, 24.8% oil and 0.4% coal [
5]. The gap between electricity demand and supply continues to increase as the maximum generation capacity which is less than 4,000 MW fails to match the electricity demand of the country. This challenge is caused by several factors such as the unpremeditated shut down of power plants for preservation, inadequate gas supply to thermal stations, and power equipment vandalisation [
5].
The limited access to reliable and affordable electricity by the citizens is considered as one of the key causes of poverty in Nigeria and other Sub-Saharan Africa (SSA) countries. In SSA, about 585 million people do not have access to electricity [
6,
7]. According to the World Economic Forum, energy poverty is defined as the lack of access to sustainable energy services and products [
8]. In Nigeria, the total populace that lacks access to electricity in rural areas is more than 80 million people [
4,
9]. Though some rural areas are connected to the grid, power outages still pose a problem in these regions as a result of constraints related to electricity generation, transmission and distribution [
4,
9]. In 2018, Nigeria had the highest average frequency of interruptions of about 304 interruptions per customer and the longest average duration of interruptions of 742 hours of interruption per customer [
6]. Due to limited access and unreliability of the grid in the country, household electricity demand in rural areas is very low, though the desire to use electricity is very high [
10]. Some households use kerosene and candles due to the absence of electricity, which can be harmful, causing respiratory infections as a result of soot emission. Lack of access to electricity also affects income and business productivity in rural areas [
11].
Several reasons for these electricity challenges in rural areas have been identified. The primary reason is the location of rural settlements which are largely dispersed and very far from urban areas; hence, the grid extension to such areas is very expensive and almost impossible. Microgrid systems as an alternative to national grid system are crucial due to the disparity between low electricity demand and grid extension costs. However, though off-grid systems are beneficial, they cannot provide enough energy due to the intermittent nature of RES such a solar and wind [
12].
This study aims to size an economically feasible hybrid microgrid system (HMS) for addressing the rural electrification challenges in Nigeria. This research focuses on energy storage which is an integral part of a microgrid system. The study considers improving the reliability of an off-grid system using battery storage and also the possibility of connecting to the grid. To achieve this, the study analyses two renewable energy sources in Nigeria, namely, solar energy and hydropower. To size the HMS, HOMER was used. This software is widely used and is considered the best and easiest tool for renewable energy sources’ evaluation [
13].
2. Addressing Electrification Challenges in Nigeria
A major drawback of RES like solar is their intermittent nature, due to their dependence on weather conditions. Hybrid systems using several RES that include energy storage systems such as batteries and diesel generators can help improve the reliability of RES [
14]. Solar energy systems have a promising future since they can be used in various locations and are highly efficient. They are beneficial for many reasons especially in Sub-Saharan African countries that have a high solar resource potential [
15]. Located north of the equator at coordinates 9.0830oN and 8.6753oE, Nigeria is one of the tropical countries that have a high solar potential and an even distribution of sunlight throughout the year. The average total daily solar irradiation is estimated to be around 3.5 kWh/m2/day in the South and 7.0 kWh/m2/day in the North [
16]. Considering such an abundant energy resource across the country, the use of solar energy could be effective in providing electricity to rural settlements that are off the national grid in Nigeria.
In Nigeria, large-scale hydropower systems contribute about 30% of the total installed generation capacity and form one of the major electricity sources due to the presence of large rivers in different parts of the country [
16]. The proper execution of project plans and the maintenance of hydropower already commissioned can play a major part in alleviating the electricity crisis in Nigeria as it can provide twice the amount of the present generation capacity. Small-scale hydropower systems, on the other hand, use streams, small rivers and waterfalls to generate electricity. These systems generate approximately 10 MW of electricity. Nigeria shows a very high resource potential for hydropower, which can be used for both off-grid and on-grid connections [
16].
Small-scale hydropower is an appropriate scheme for rural electrification. Hydropower utilization would promote the conservation of petroleum resources, encourage economic diversification and cause a significant reduction in dangerous gas emissions [
17]. Rivers such as Benue and Niger, including some smaller rivers, have a high potential for hydropower exploitation in Nigeria. Also, the mountains and high terrains in some regions are good sites for reservoirs and flow diversion for generating electricity [
18,
19].
Even though solar photovoltaic (PV) and hydropower systems are environmentally friendly, they both have some drawbacks; solar PV has an intermittent nature, and hydropower relies on the inflow of water. Consequently, solar PV cannot provide electricity reliably, except if equipped with energy storage systems [
20]. Distributed energy systems like microgrids have autonomous characteristics that enable the development of an electrical generating infrastructure using renewable energy technologies. Microgrids are interconnected networks that can be standalone or grid-connected. The decentralised nature of microgrids makes them more beneficial than centralised systems. Some benefits include a sustainable environment, economic improvement, and regional equity relating to rural electrification and technical performance [
21]. The microgrid is also advantageous due to its proximity to the load centre. Unlike the traditional standalone system, microgrids provide the flexibility of being integrated to the grid when there is an increase in electricity demand or grid expansion sometime in the future [
21].
Several research works have been conducted regarding the reliability of microgrids and hybrid systems. When taking into consideration the Nigeria’s energy sector and renewable energy features, the application of renewable energy technologies in a remote economic sector is more beneficial than conventional energy [
2]. Study [
22] emphasised that renewable energy supported microgrids could make a significant impact by providing a cost-effective solution to the rural electrification challenge in SSA countries compared to grid extension investments. The study presented a detailed review of the ongoing renewable energy supported technology for the SSA region’s rural electrification. It also discussed energy poverty, challenges facing the development of renewable energy technology, and how it is directly related to these countries’ lagging economy.
HOMER software has widely beeb used such as in studies [
23,
24,
25,
26,
27] size hybrid energy systems as well as for techno-economic analysis. HOMER software is used for the design and analysis of the energy system. HOMER is preferred for hybrid system optimisation among other software tools because it allows multiple possible combinations of renewable energy systems [
28]. It can easily perform sensitivity and optimisation analysis of many possible system configurations [
28,
29]. Many studies performed technical and economic feasibility of hybrid energy system worldwide using HOMER software [
30,
31,
32]. Further description of HOMER software are covered in [
33].
For instance, using HOMER, the feasibility of a grid-tied solar PV system considering a case study of Jos, Nigeria was investigated in [
23]. The techno-economic performance of combining 80 kW solar PV and grid power of 100 kW was studied. At the cost of
$2,400/kW for solar PV and at an average global solar radiation of 6.0 kWh/m2/day, the total annual electricity generated was 331,536 kWh, and the LCOE was found to be
$0.103/kWh. The solar PV contributed about 40.4% of the total generated energy by the hybrid system [
23]. Also, HOMER was used in [
24] to investigate the possibility of generating electricity in rural and semi-urban areas by using a hybrid energy system in Jos, a northern part of Nigeria. The obtained results showed that considering diesel price of
$1.1/L, the PV/generator/battery hybrid was the most suitable option for electricity generation in the study location. The obtained optimal simulation result showed that the LCOE varies between
$0.348/kWh and
$0.378/kWh. The LCOE value obtained was lower than the cost of using only diesel generator (without battery), ranging between
$0.417 and
$0.423/kWh.
Techno-economic study of PV/wind/diesel energy/battery sources that considered case study villages across the six geo-political zones in Nigeria was carried out in [
25] using HOMER. The PV/diesel/battery system configuration results had the least net present cost (NPC) among other considered configurations investigated for the six case studies. Similarly, the study [
27] analysed the technical and economic feasibility of employing hybrid energy system to supply electricity to a rural healthcare facility in six geo-political zones in Nigeria. The obtained results showed that PV/battery/diesel as the optimum configuration for Port Harcourt, while PV/battery/wind/diesel as the optimal configuration for Jos, Enugu and Maiduguri. The feasibility of energizing a remote mobile transceiver station in Nigeria was studied in [
26]. PV/wind/ diesel/battery system and PV/diesel/battery system configurations were the two best system configurations obtained. However, when the two optimal hybrid systems were compared with the conventional standalone diesel generator, the PV/diesel/battery system was the most economically viable system with the least cost of electricity of
$0.409/kWh and NPC of
$69,811.
The research work in [
12] conducted in Rwanda articulated the importance of microgrids for rural areas in SSA. The study highlighted the fact that extending the grid to rural areas where electricity demand is low can be a costly venture; therefore, harnessing the untapped renewable energy potentials of these rural communities can improve rural electrification. Various challenges of electrification in SSA, including lack of financial means, dispersed rural settlements, lack of energy policies, and lack of appropriate knowledge, were presented in the study. The improvement in renewable energy technologies and microgrid systems provided a viable rural electrification solution, which was modelled using HOMER. A microgrid system was designed for electrification in rural Rwanda which consisted of solar PV, batteries and micro-hydro. The installation of a microgrid based on solar PV, batteries and micro-hydro was more cost-effective than a grid extension [
12].
Focusing on Nigeria, study [
29] highlighted the fact that even with its diverse renewable energy sources, lack of experts in the field has prevented the country from harnessing these resources for electricity production. Most rural areas in Nigeria lack access to the grid but have close proximity to renewable energy sources like hydro and solar. The study analysed a hydro-based hybrid system as a solution to energy poverty in remote areas. The hybrid system consisted of solar PV and a pico-hydro scheme. The results showed that harnessing clean energy in Nigeria is important for economic development and is a solution to energy poverty [
29].
5. Results and Discussion
According to the optimisation results of the HMS design model, the analysis comprises two scenarios, namely off-grid and grid-connected microgrid configurations.
5.1. Off-grid Hybrid Microgrid Configuration
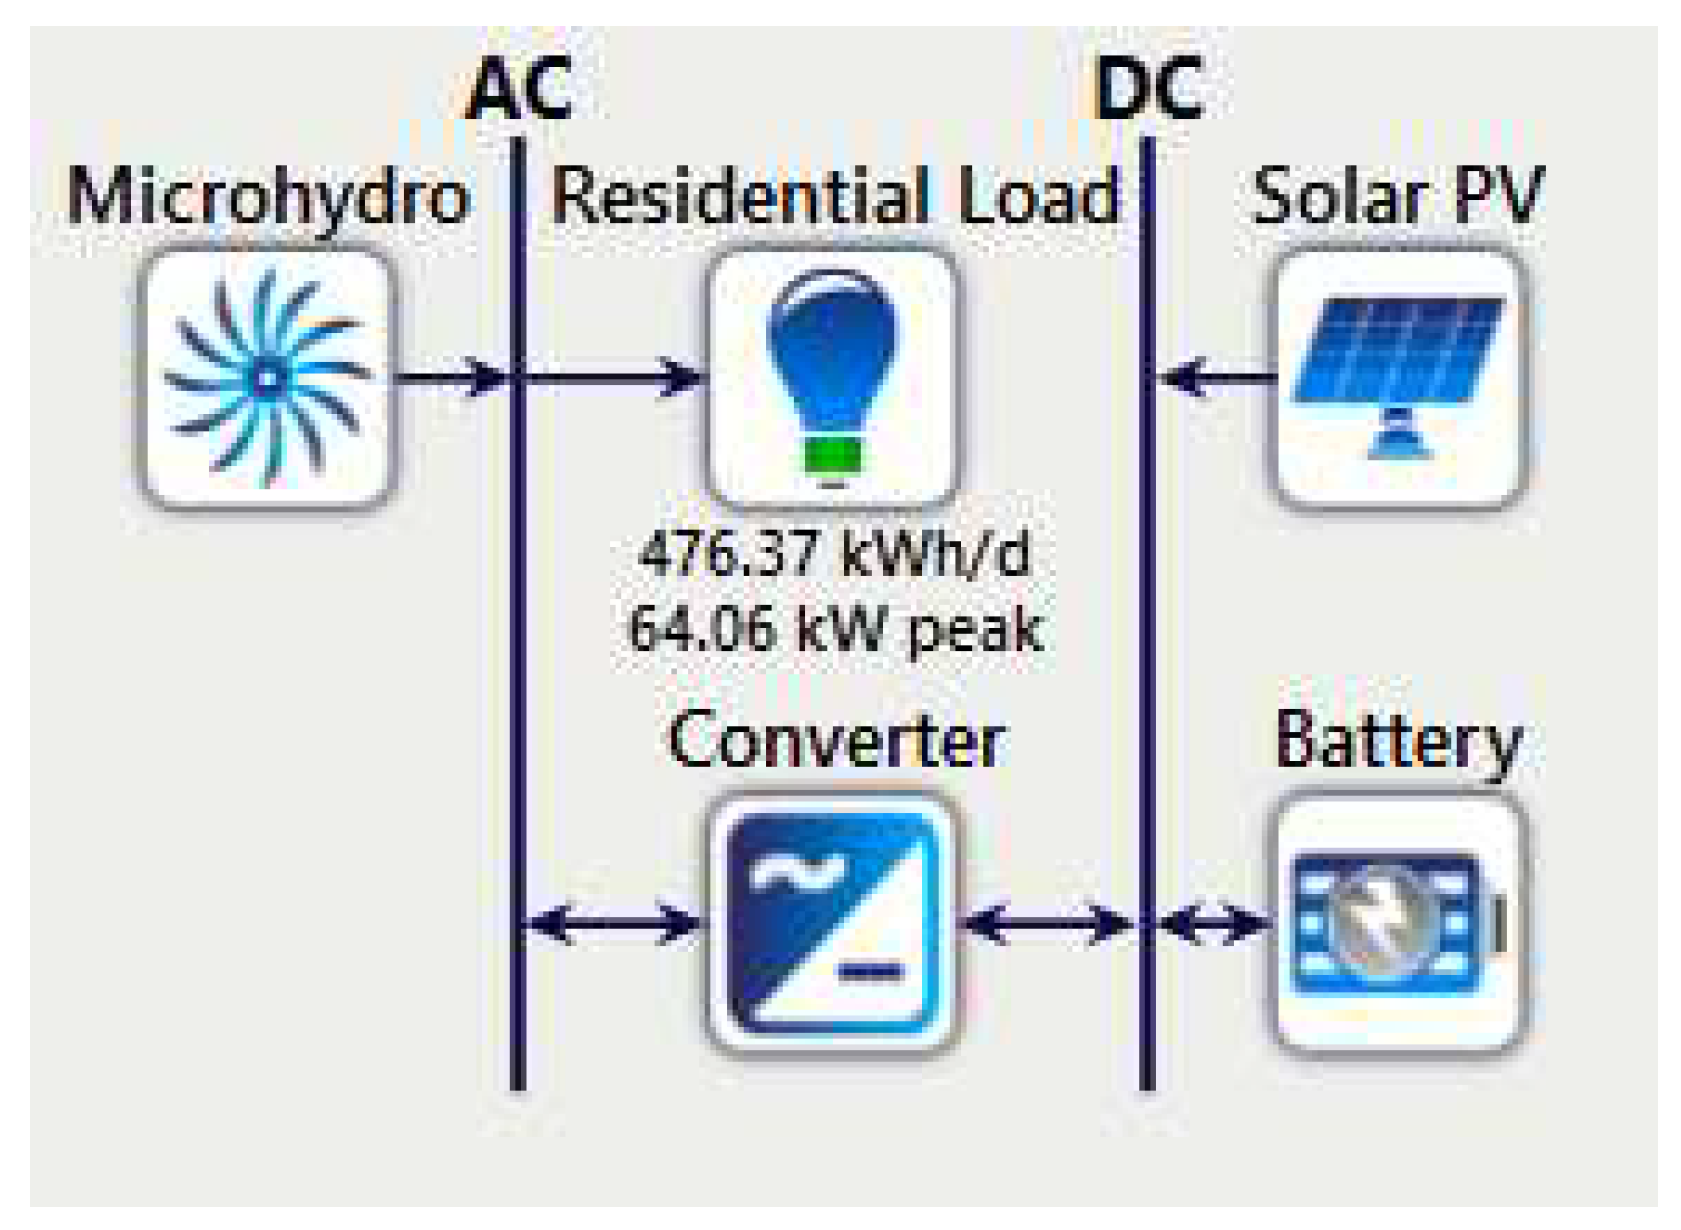
The system architecture of the off-grid microgrid configuration includes solar PV, micro-hydro, batteries and converter. From the optimisation results, a base case system architecture was automatically selected by HOMER as the most feasible configuration with the lowest capital cost. The base case system architecture comprises a solar PV module, a micro-hydro turbine, and a converter with the capacities of 78.6 kW, 20 kW and 45.8 kW, respectively, and a total of 45 batteries. The annual electricity generated by solar PV is 107,408 kWh and by micro-hydro is 178,782 kWh, making an annual total generated electricity of 286,190 kWh.
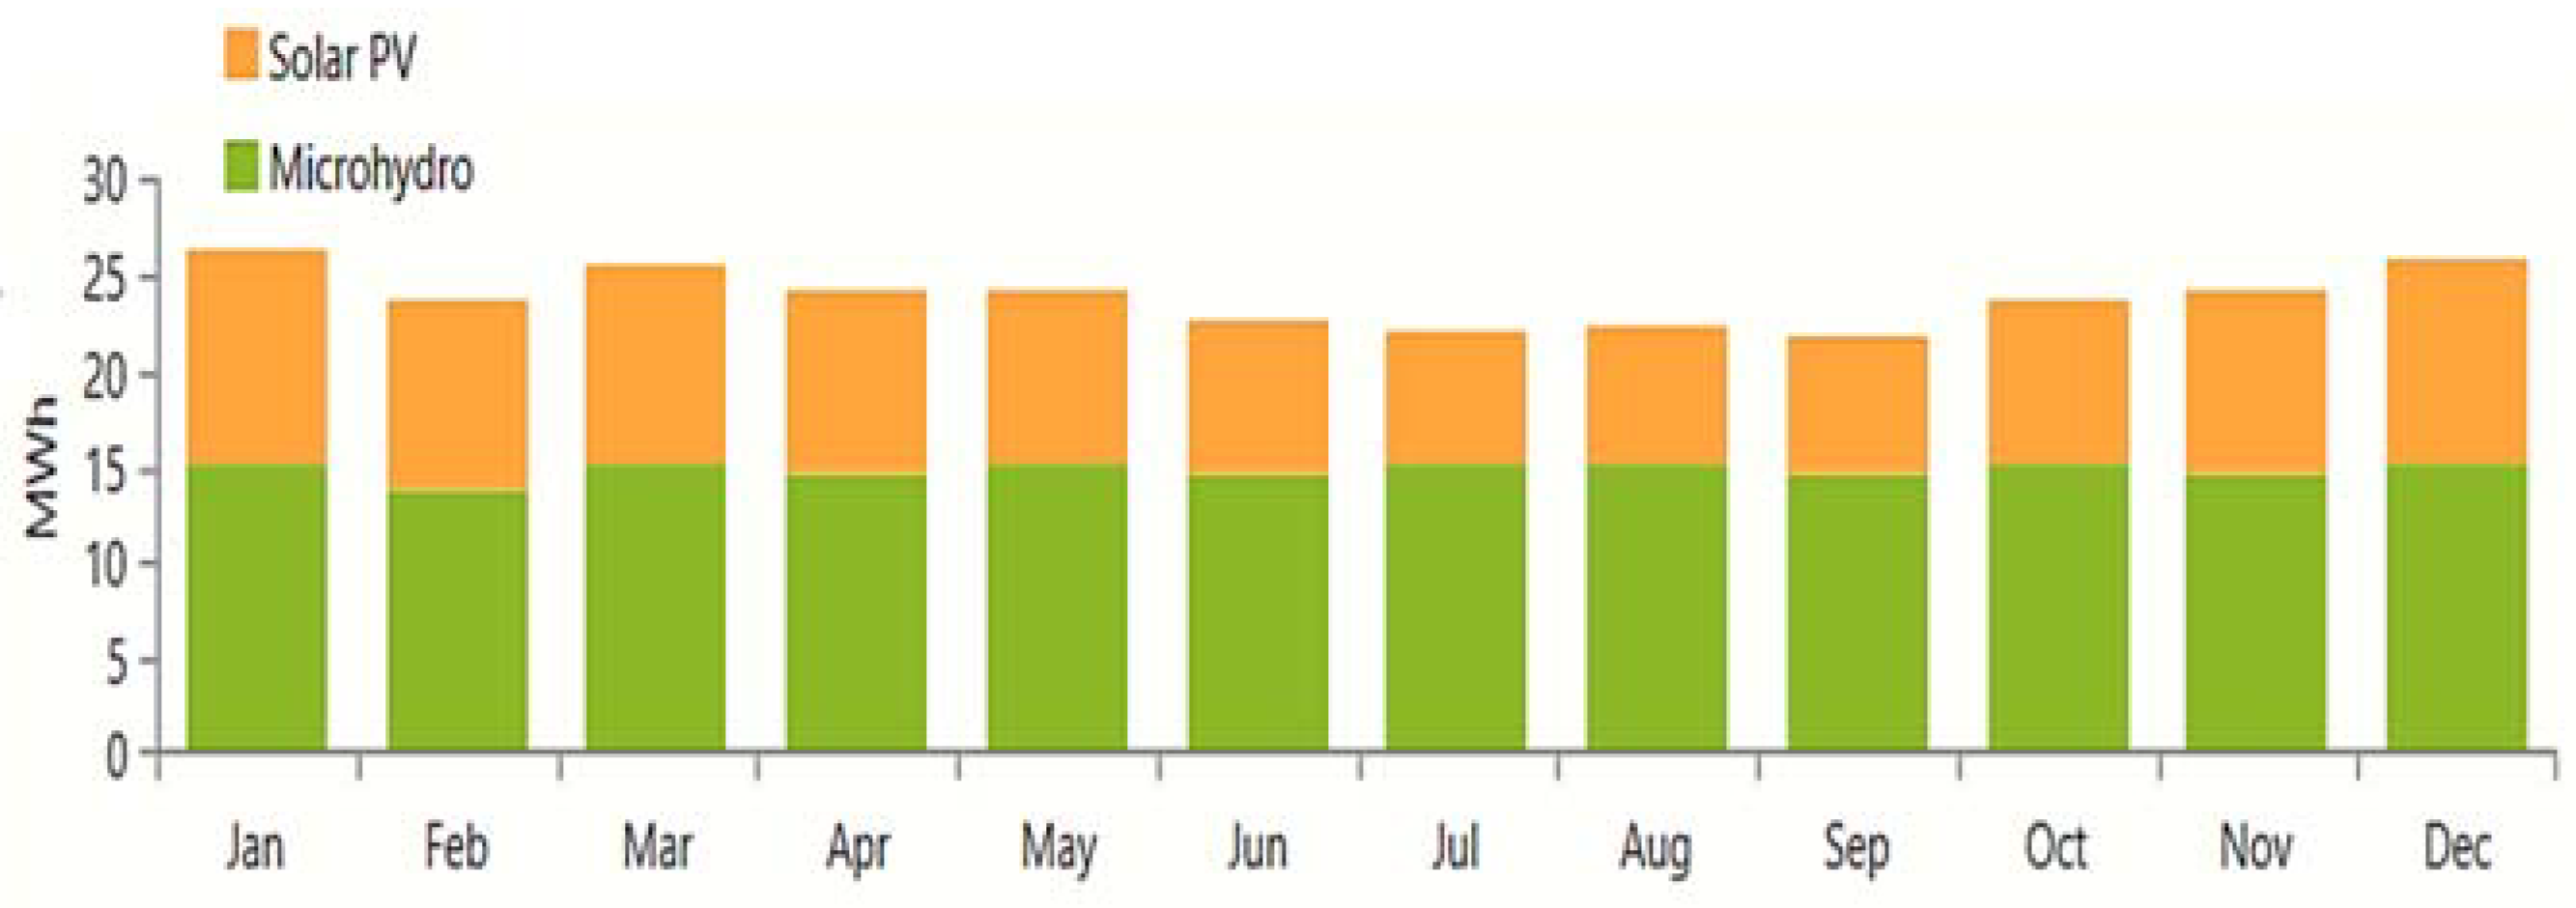
In
Figure 12, the percentages of electricity generated by solar PV and micro-hydro are 37.5% and 62.5%, respectively. The electricity produced by solar PV is less than that of micro-hydro, given that the daily solar irradiance varies throughout the year. Micro-hydro can produce that much electricity as a result of the predominant flow rate because it is constant all year round, with 8,760 hours of operation.
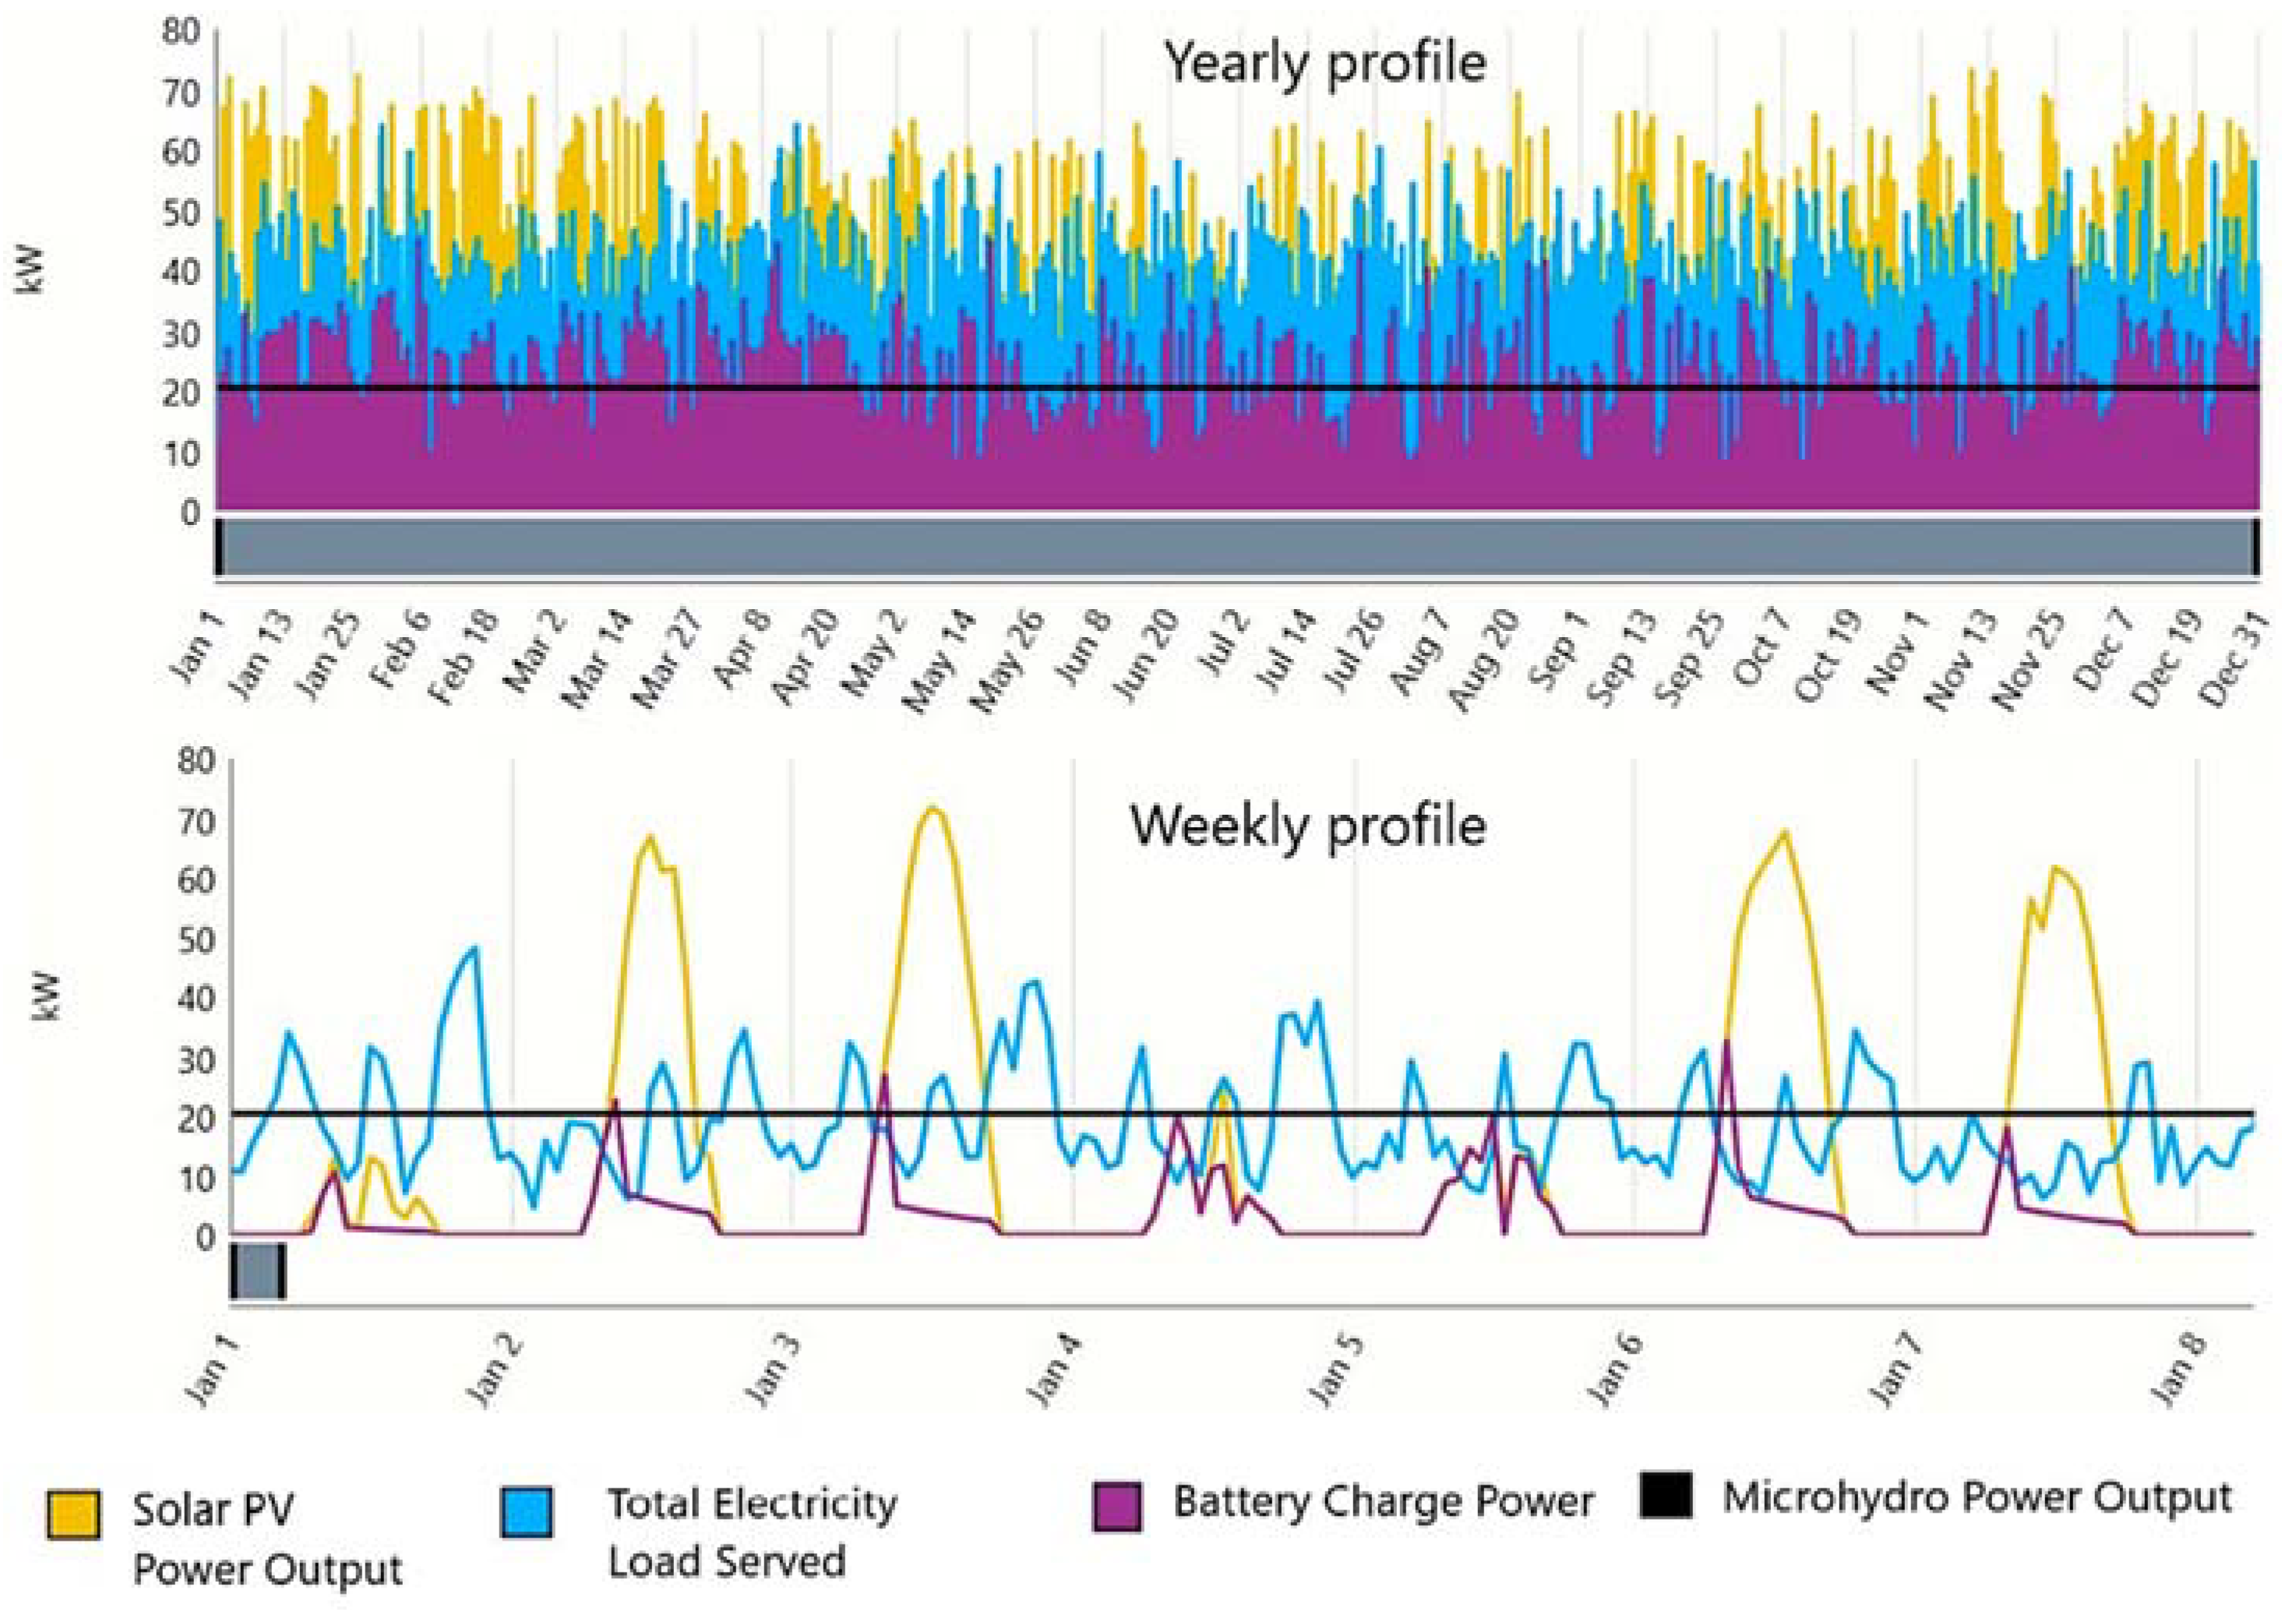
The solar PV power output, battery system charge power, micro-hydro power output and total electrical load served by a combination of solar PV, micro-hydro and battery is presented in
Figure 13. The top and bottom graphs show the yearly and weekly performance, respectively.
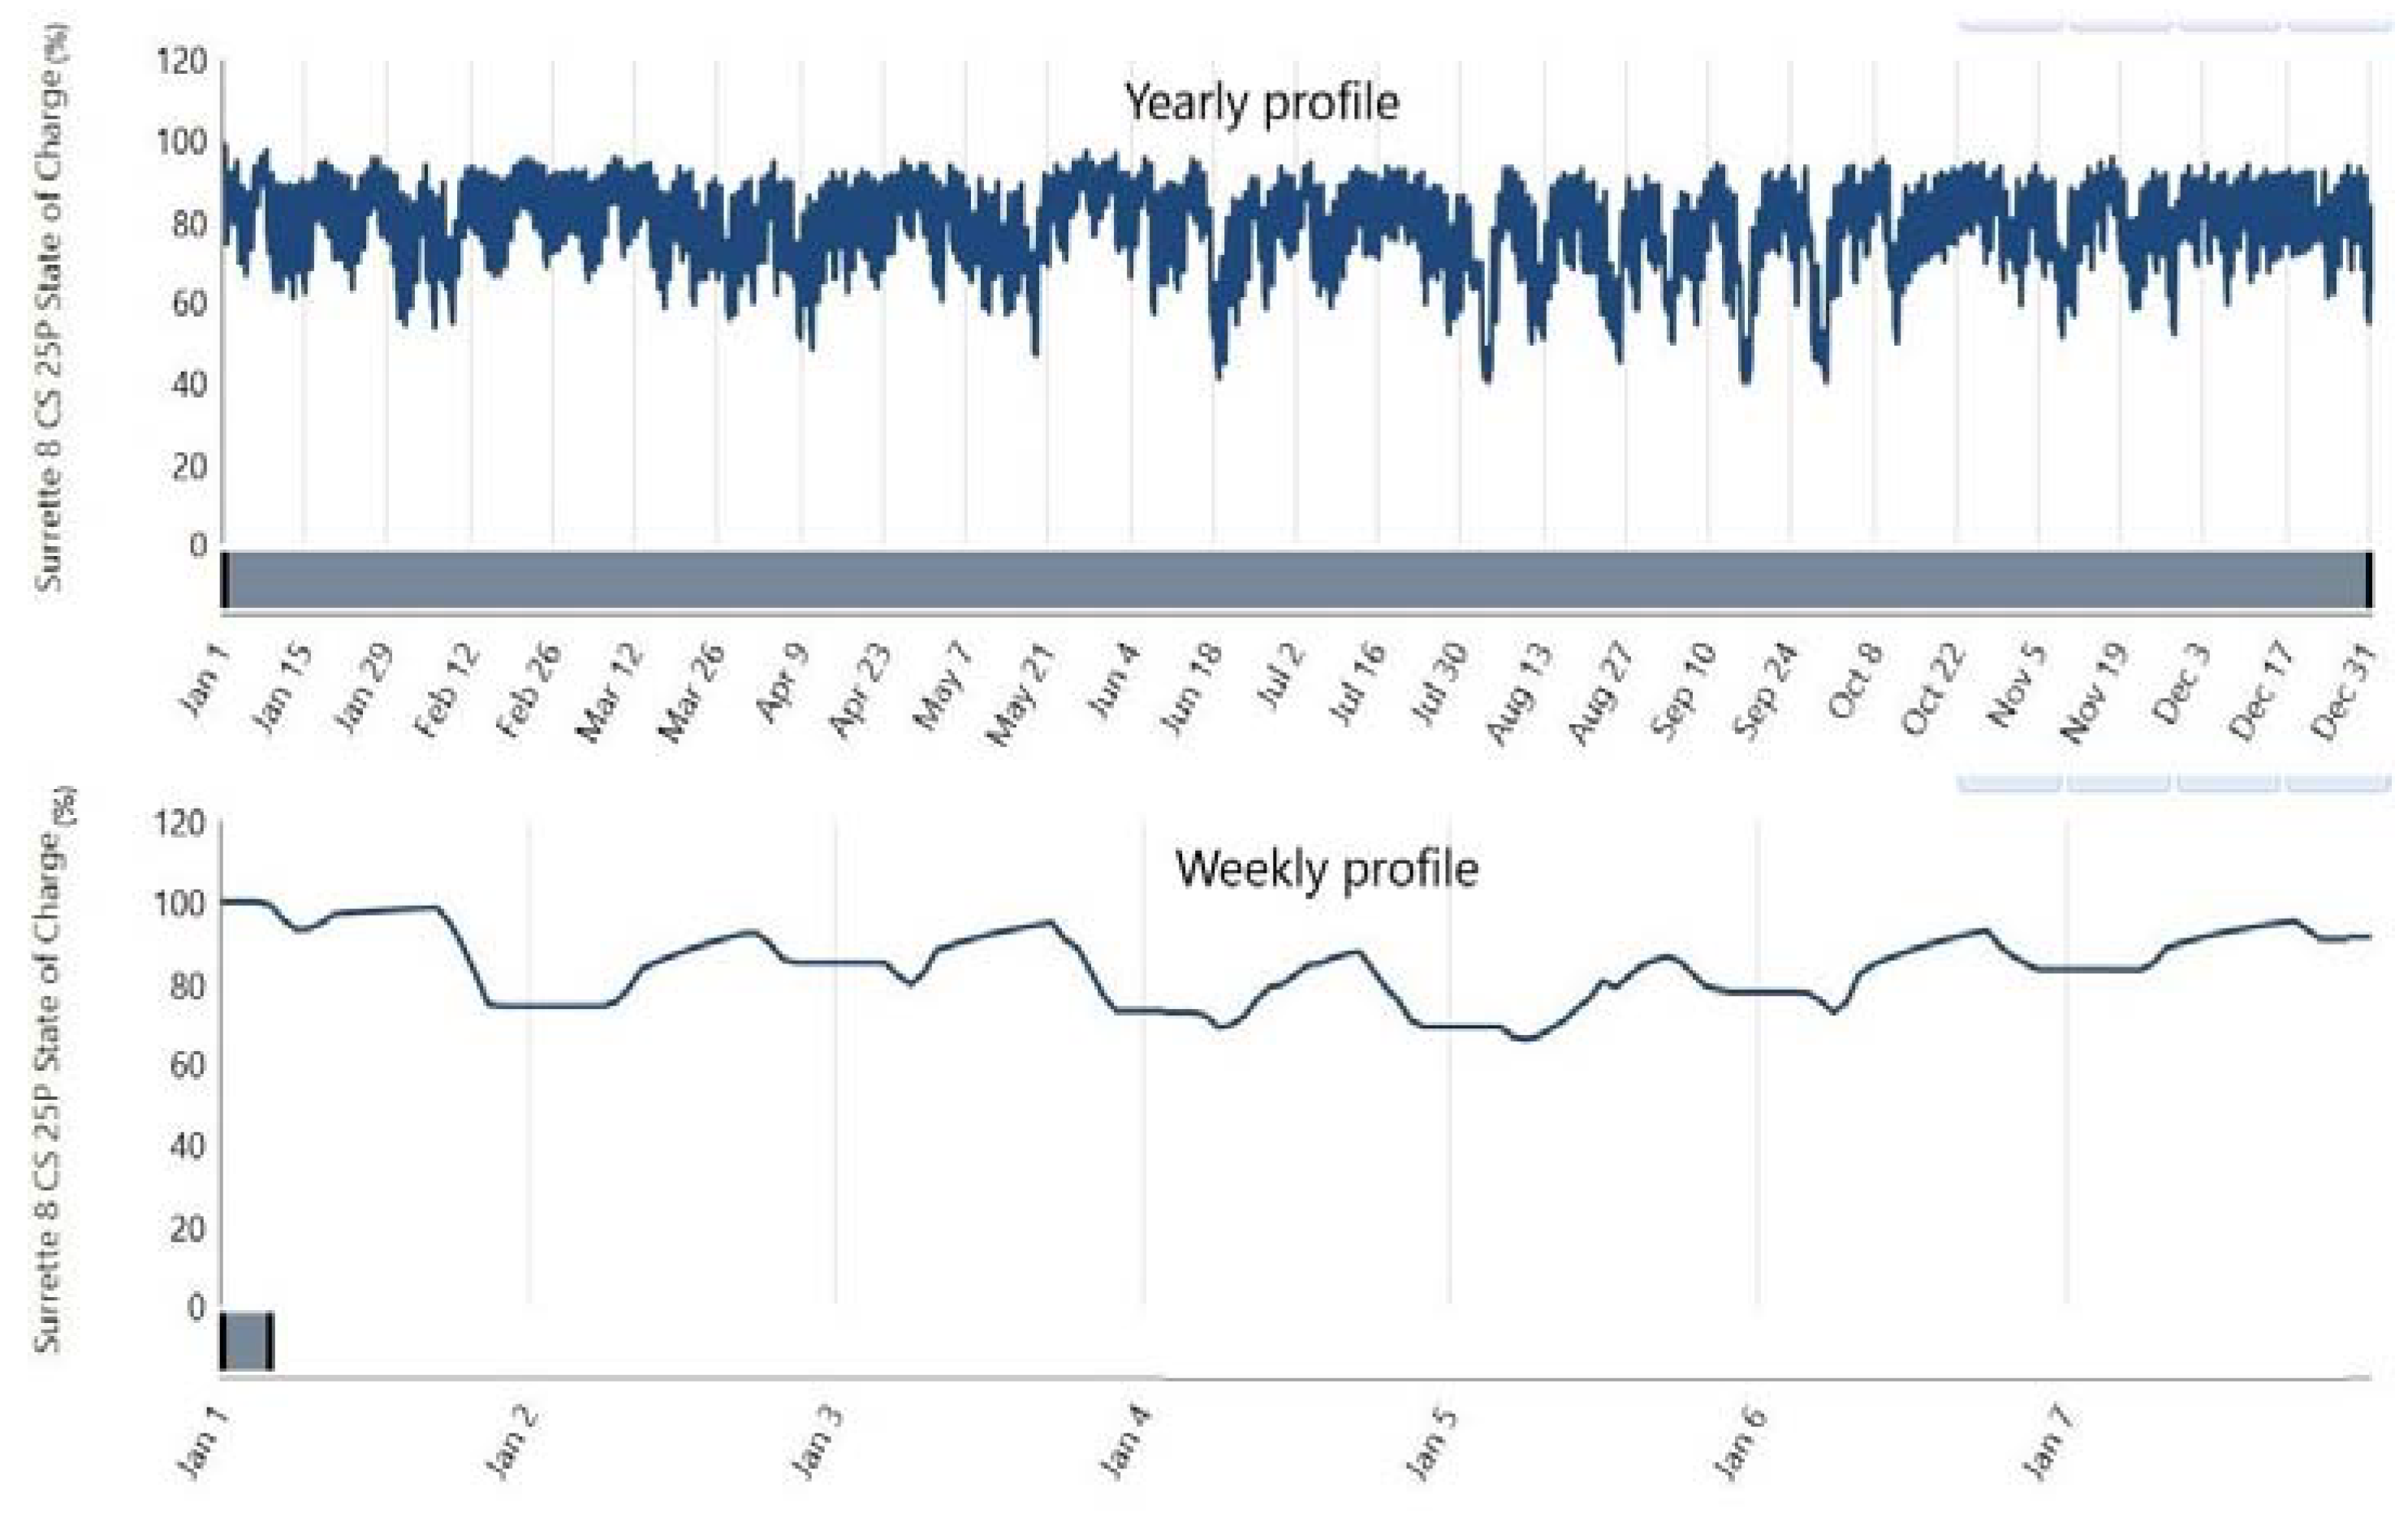
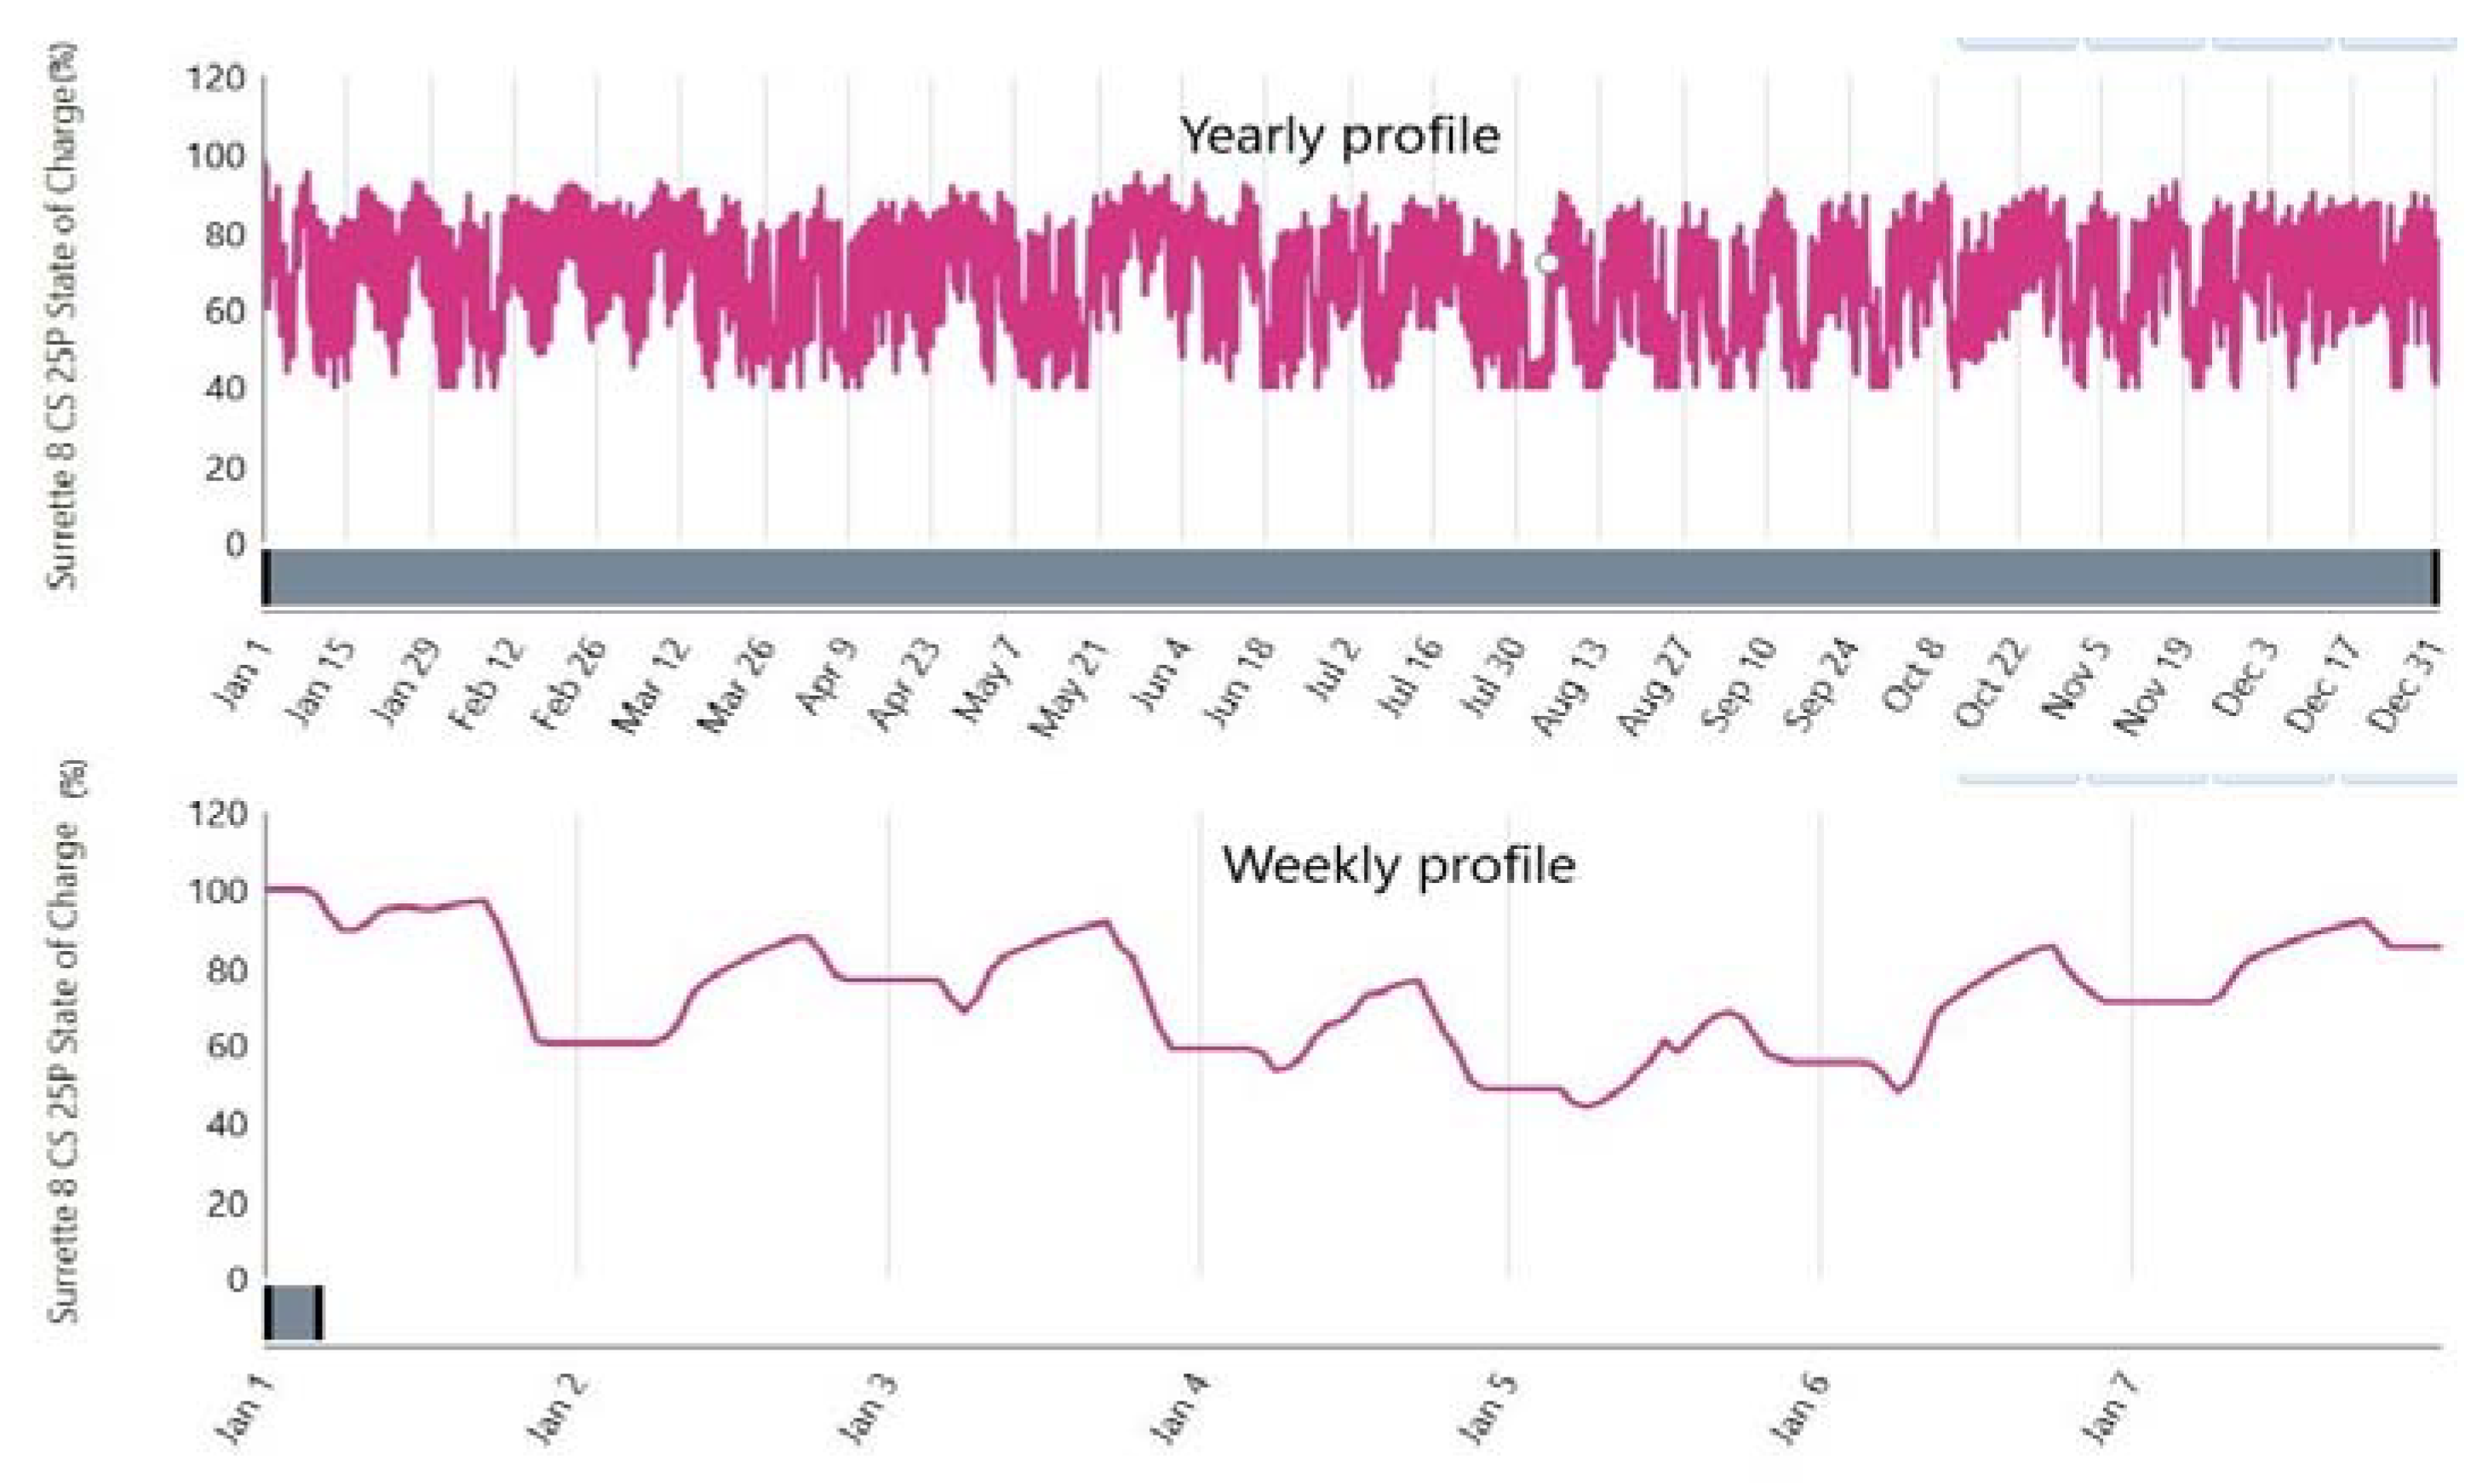
The PV system has a capacity factor of 15.6% and a total annual operation time of 4,422 hours, generating power between the hours of 08:00 and 18:00 daily. The solar PV module generates electricity during daytime and micro-hydro generates a constant 20 kW power, 24 hours a day. Both renewable sources cannot meet the demand at night-time; the battery stores energy during the day to use at night. The configuration of the storage is a lead-acid battery bank with a nominal ampere-hour and energy capacity values of 1,156 Ah and 427 kWh, respectively. The battery’s state of charge is in the range of 40% and 100% in the yearly profile and between 60% and 100% in the first week, as shown in
Figure 14. The battery autonomy is approximately 13 hours.
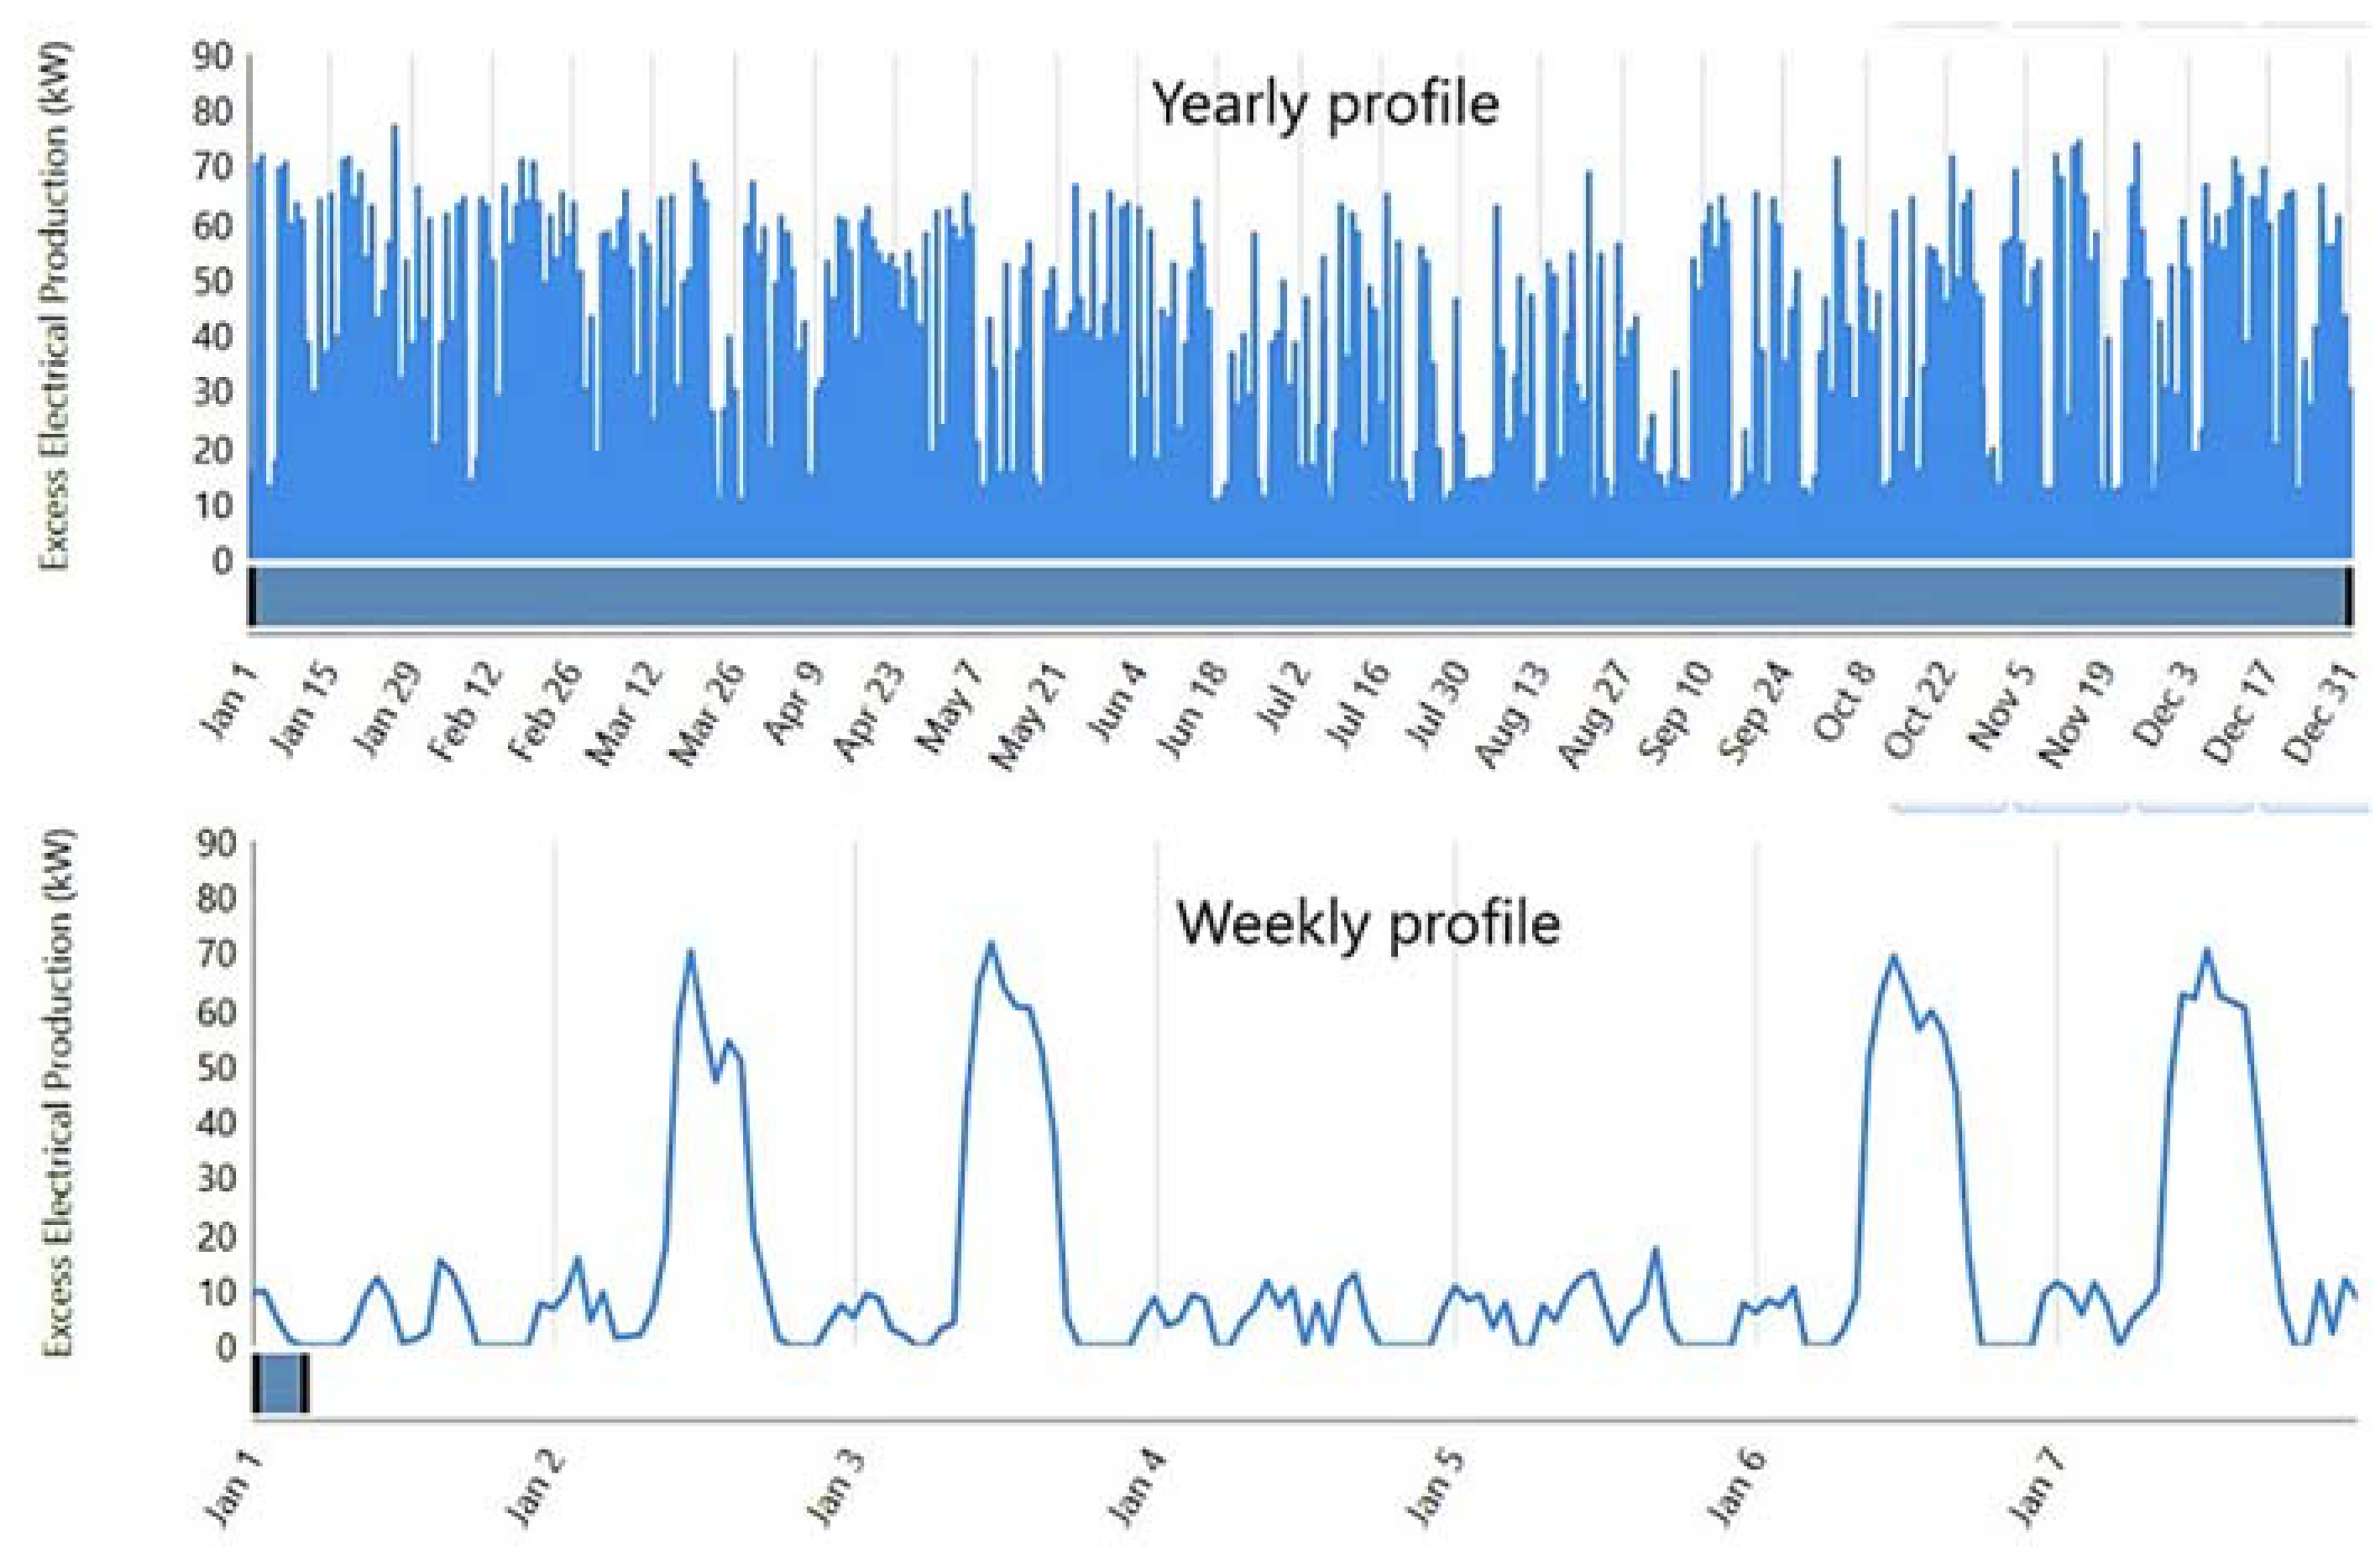
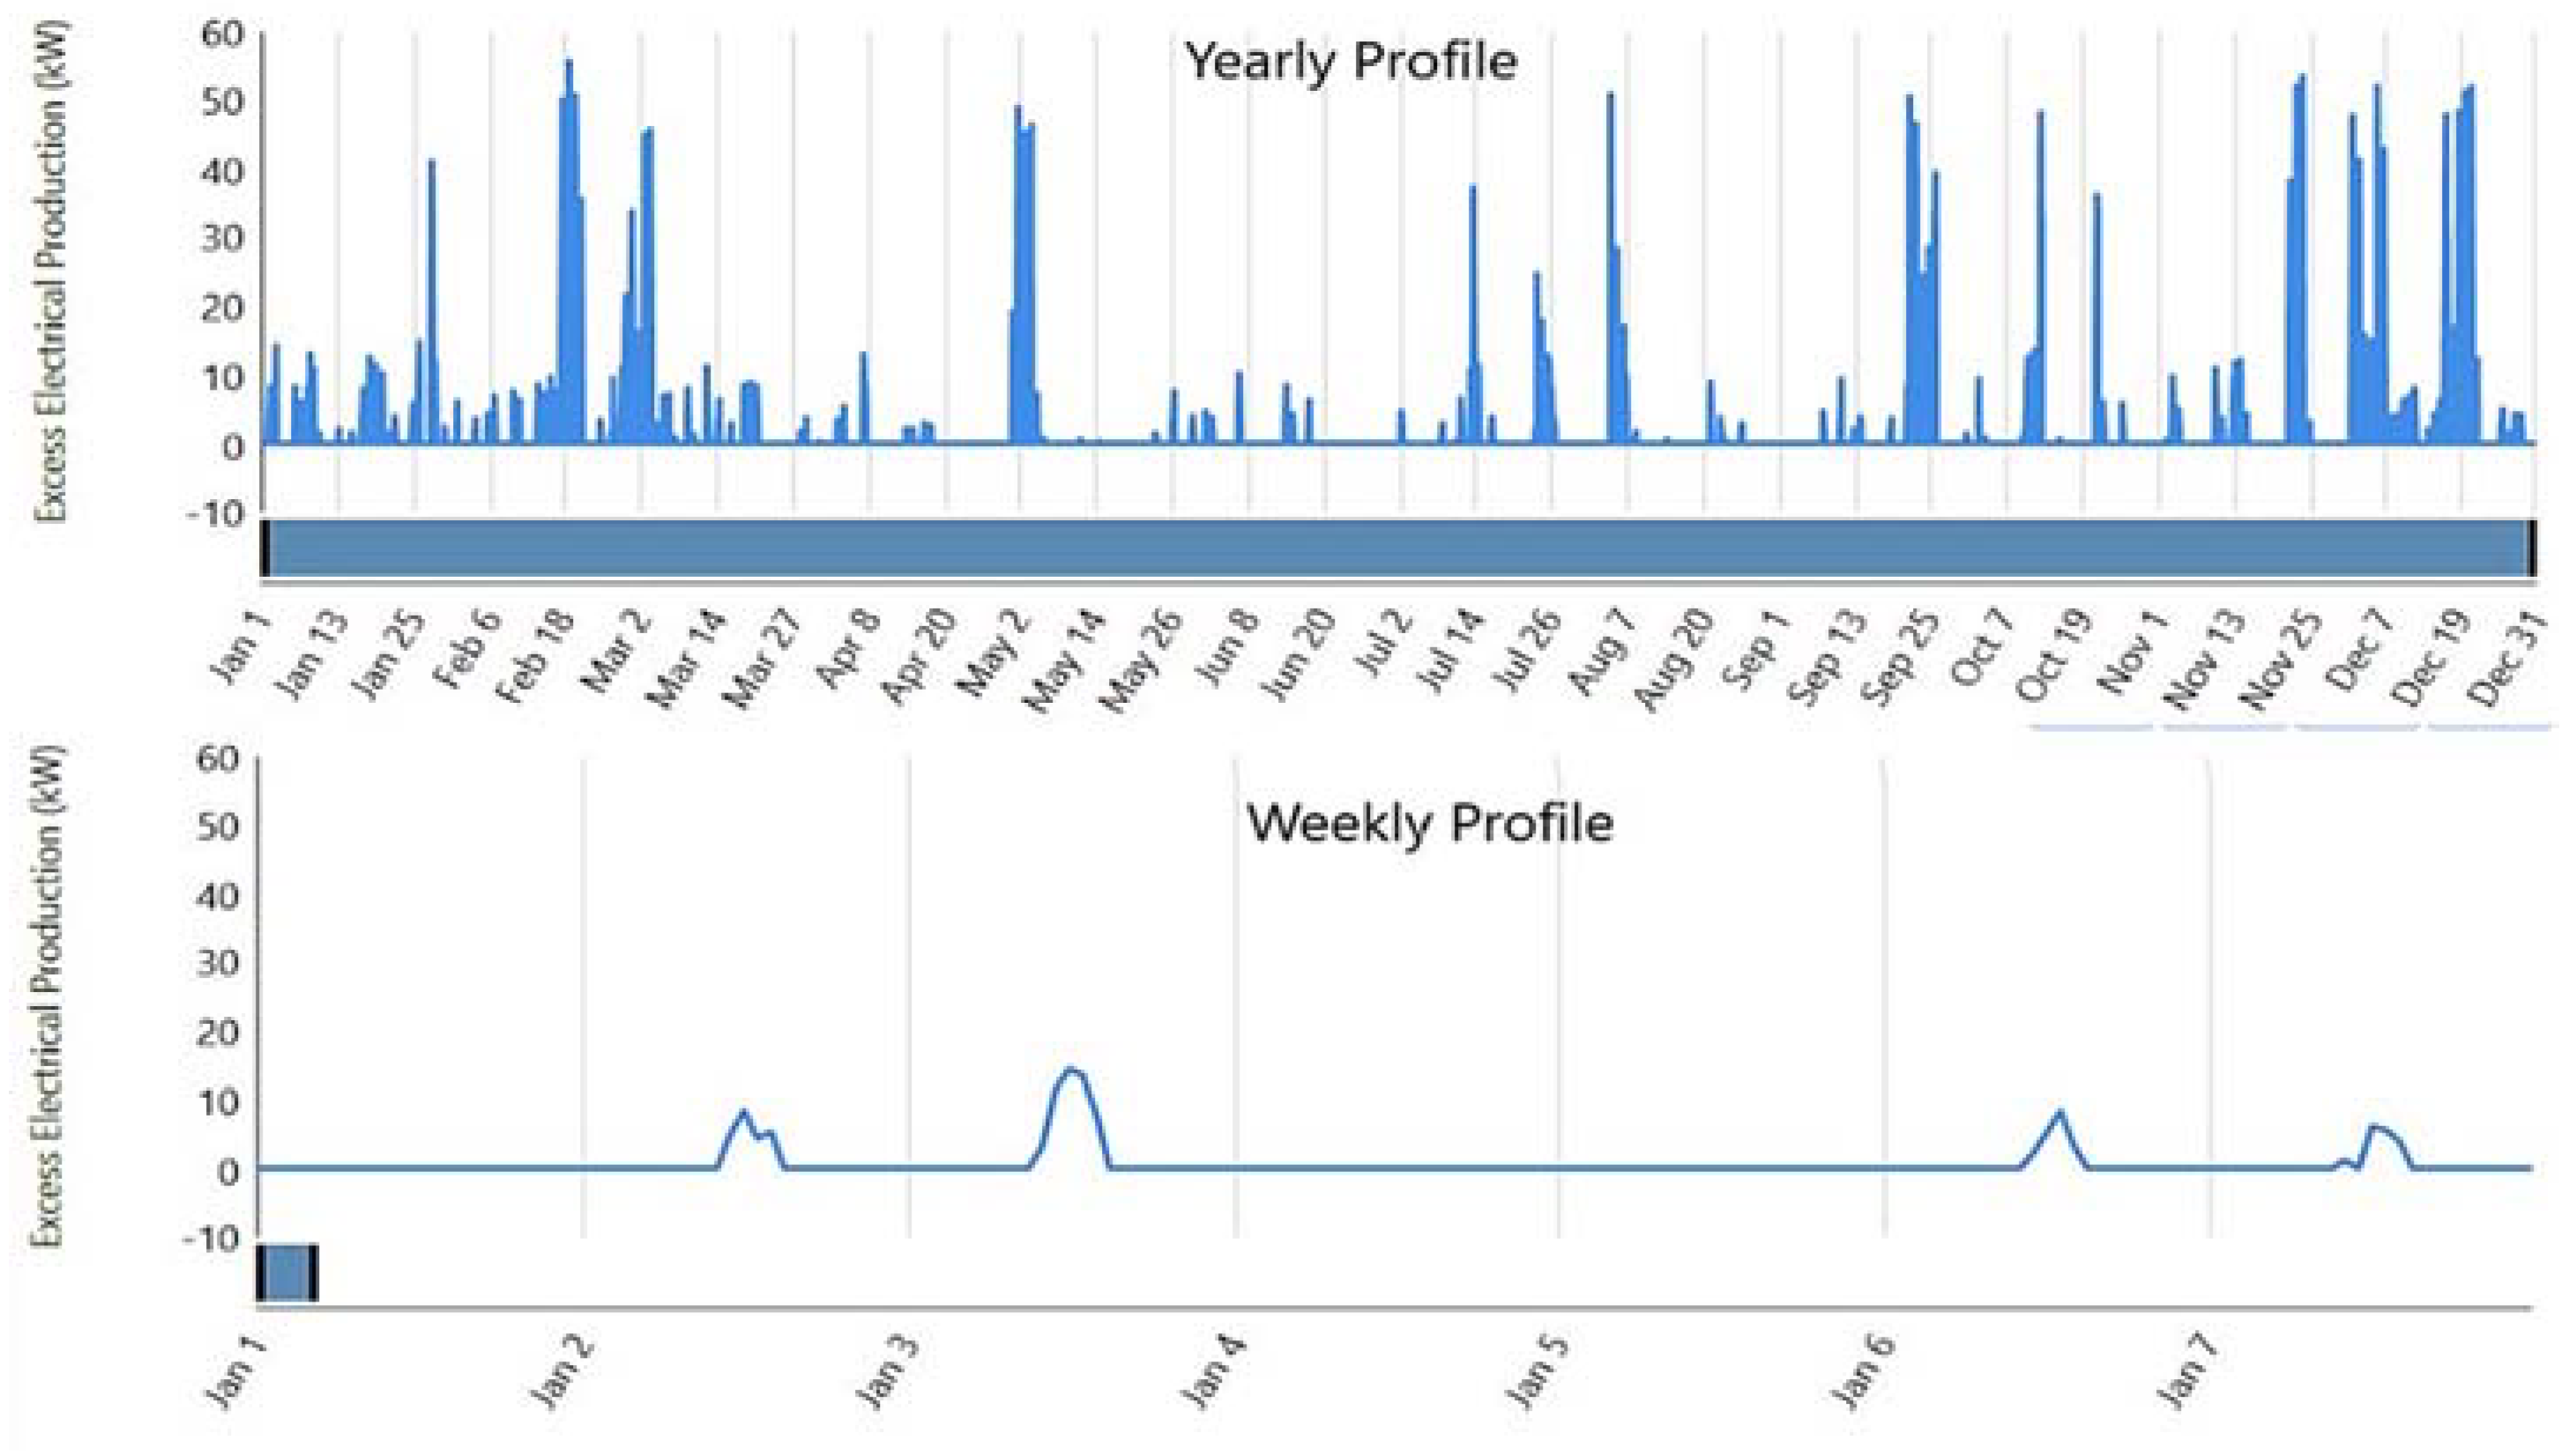
The configuration produces an annual excess of electricity of 104,420 kWh, 36.5% of the total electricity produced which is presented in
Figure 15. This system was designed with about 20% oversizing to allow for the accomodation of any increment of energy demand in the future. Also, contrary to the assumed invariant household consumption used in the analysis, ideally some households may consume more energy than others. The excess energy generated could be used to accomodate for these disparities.
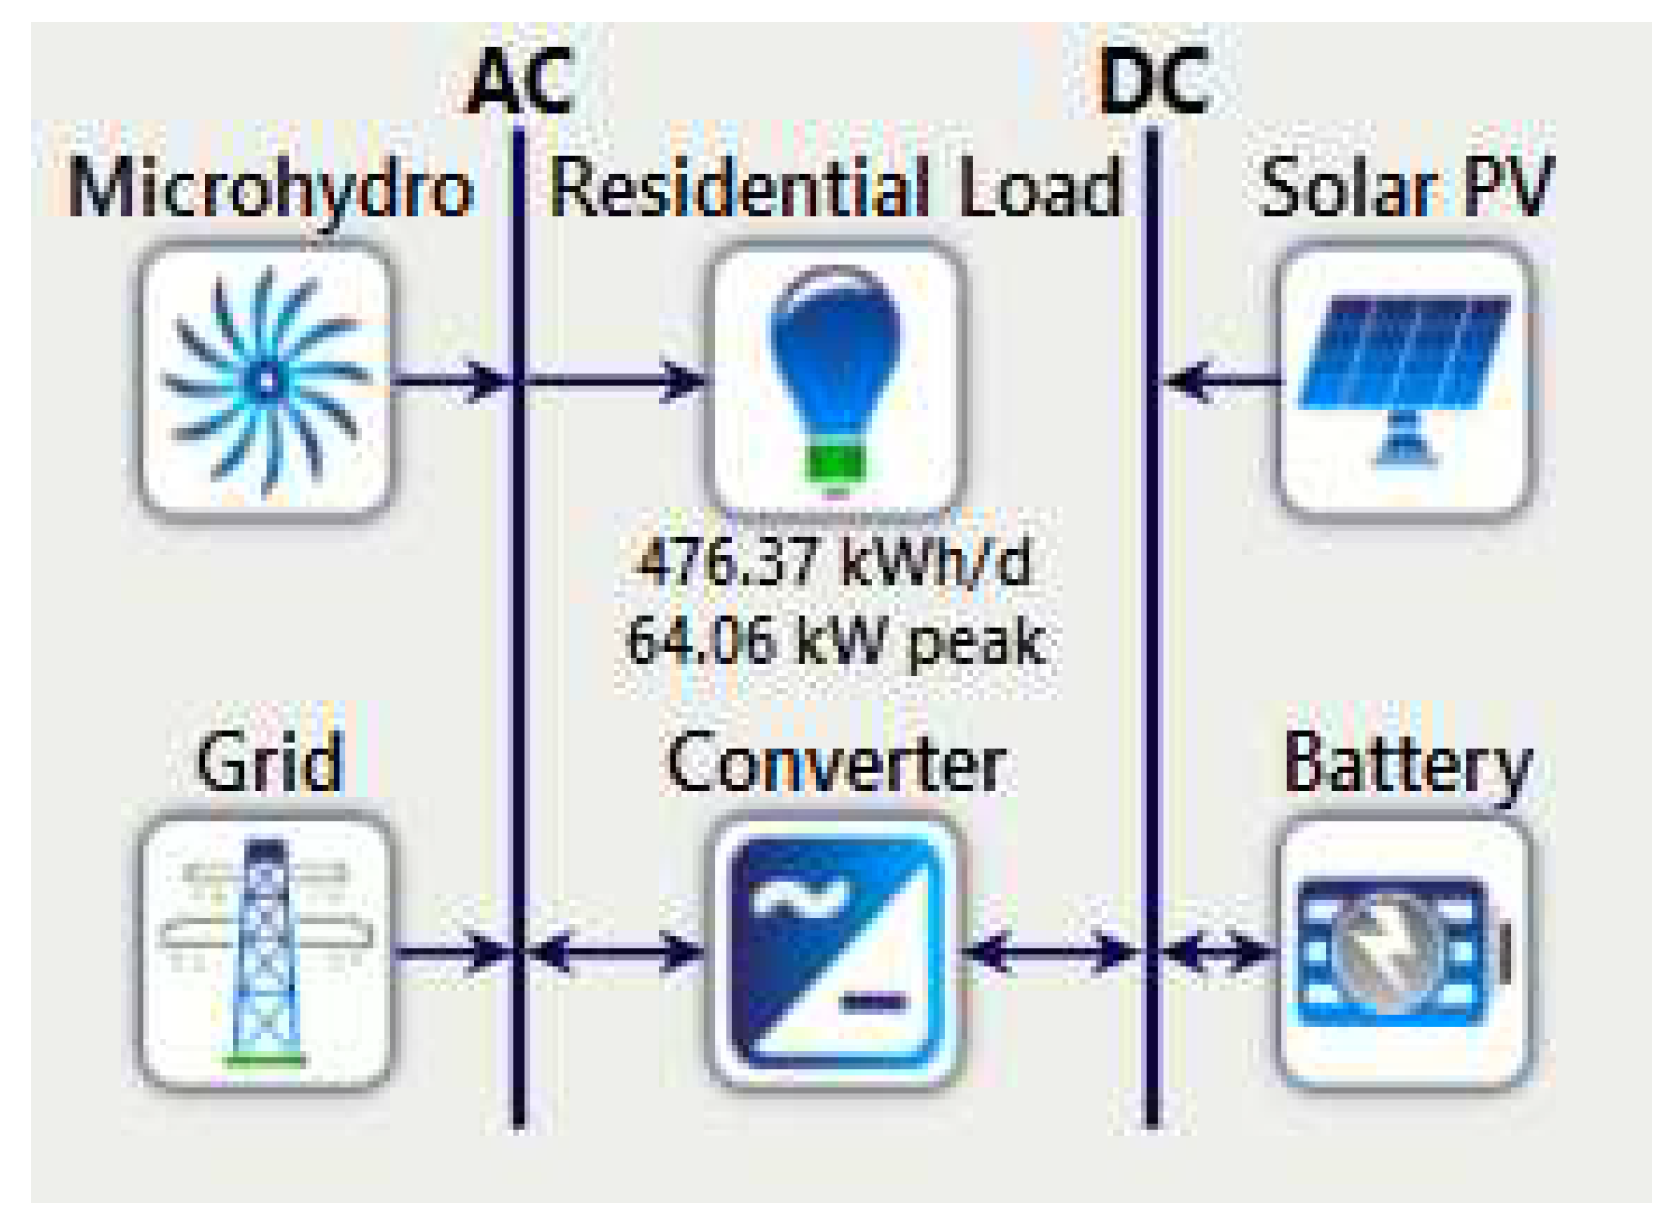
A grid-connected scenario is analysed in the next subsection. The selected site in this study is connected to the utility grid and the existence of the grid in the area was investigated for the possibility of integrating the proposed HMS to it.
5.2. Grid-connected Microgrid Configuration
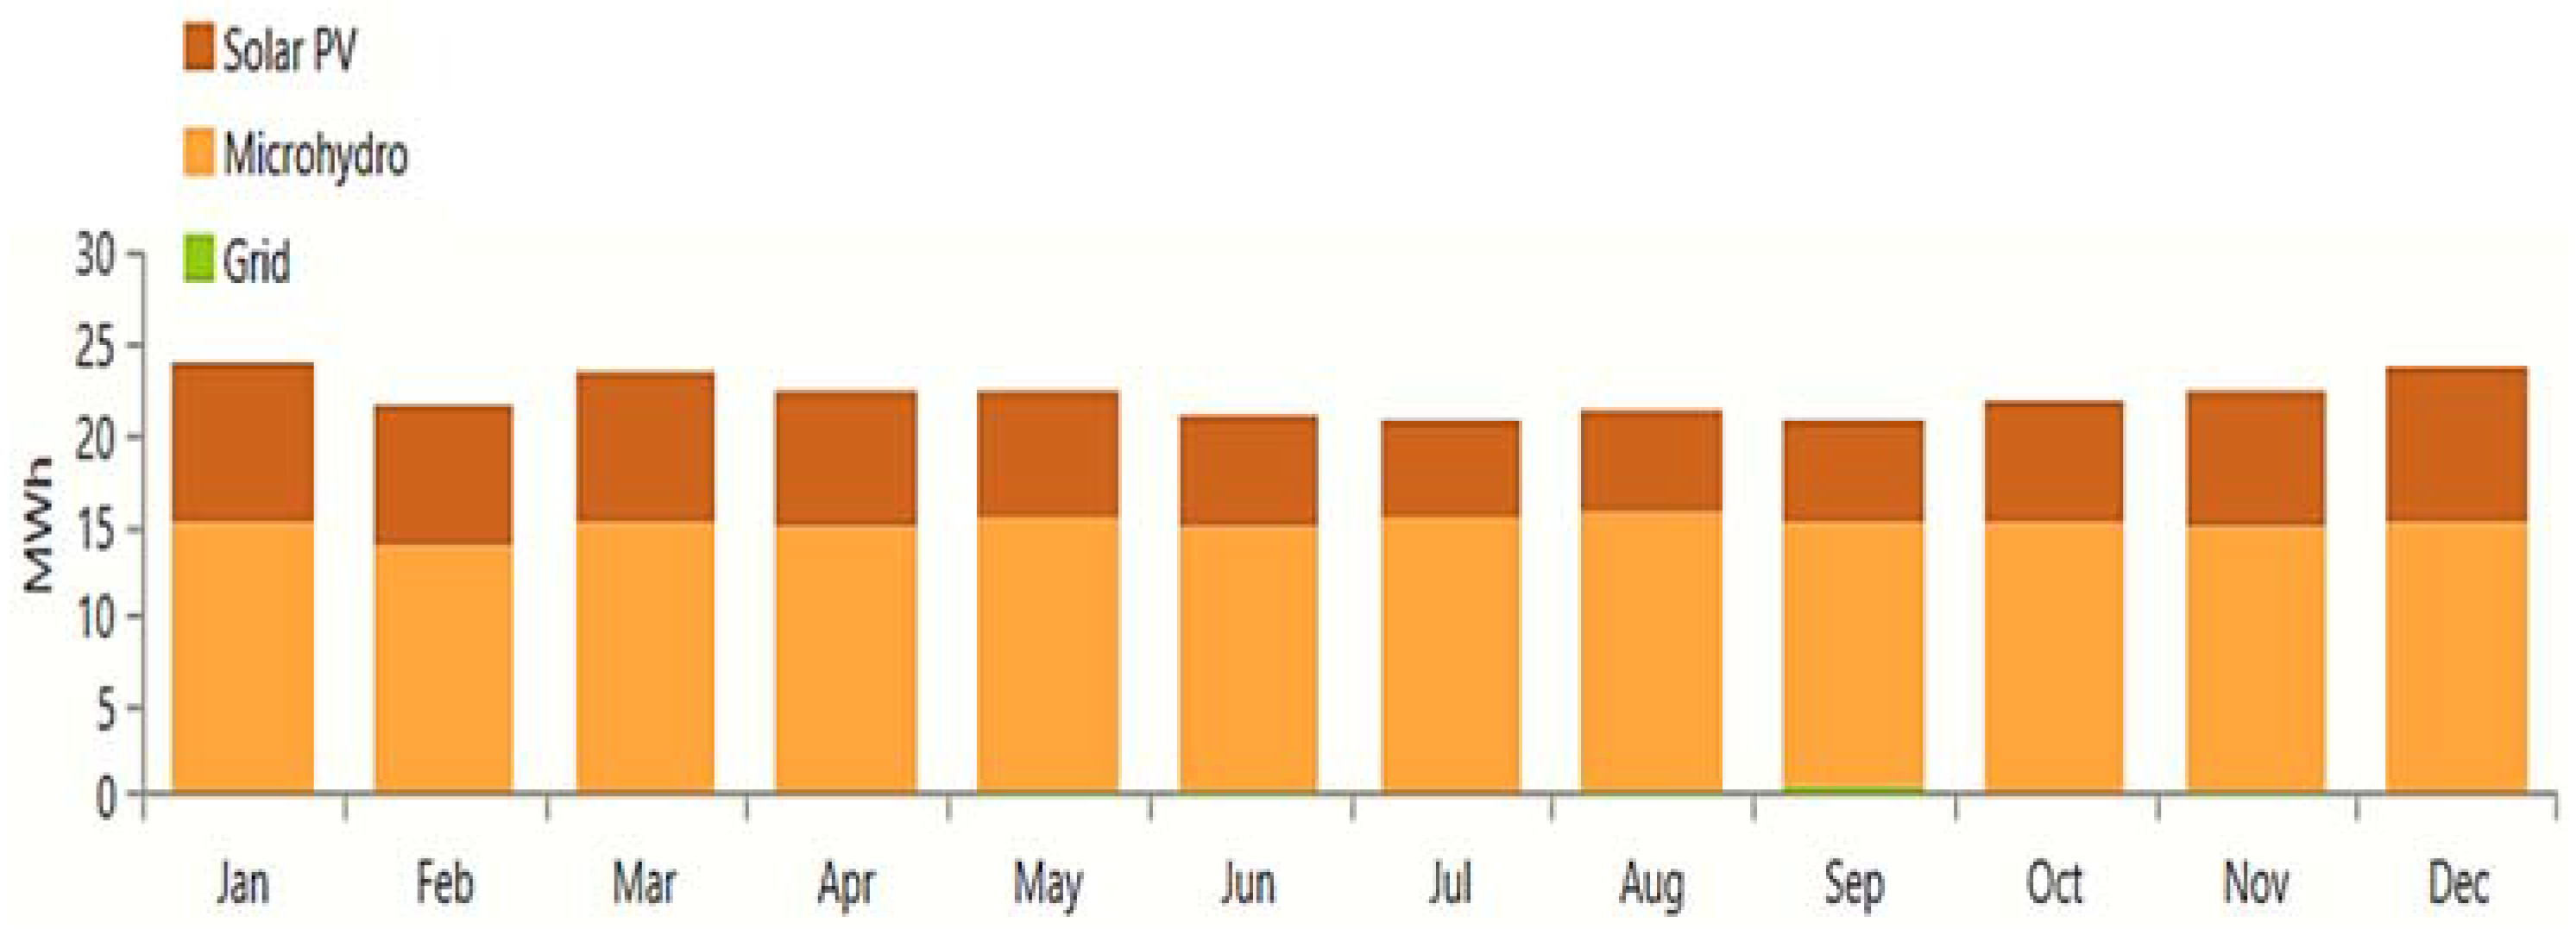
This microgrid configuration is connected to the utility grid. It consists of the grid, a solar PV, micro-hydro, battery, converter and the load. The nominal capacities of the solar PV, micro-hydro and converter components are 61.2 kW, 20 kW and 36.4 kW, respectively, and there is a total of 30 batteries. The grid supplies an annual average peak load of 32 kW. The total annual electricity production from all three sources is 264,196 kWh, with a production percentage of 67.7%, 31.7% and 0.672% for micro-hydro, solar PV and the grid, respectively. Electricity is consumed from the grid only when there is a shortfall in the microgrid system. Therefore, the grid electricity production is termed as grid purchases. The average annual monthly amounts of the electricity purchased from the grid, as well as the electricity production from solar PV and micro-hydro, are shown in
Figure 16.
The total annual load consumption is 173,791 kWh, which is approximately 66% of the total electricity produced, and the surplus energy of 70,466 kWh is sold to the grid. Because part of the surplus energy is sold to the grid, the annual excess electricity reduces to 11,260 kWh, which is 4.26% of the total electricity produced as shown in
Figure 17.
The micro-hydro generates a total of 178,782 kWh annually, operating 8,760 hours throughout the year. It generates a constant power of 20 kW. The solar PV generates annually a total of 83,638 kWh, a capacity factor of 15.6%, and its annual hours of operation is 4,422 hours. The demand for electricity during the daytime is lower than night-time. The PV generates electricity during the daytime, as the battery stores electricity from the PV.
The battery system nominal capacity is 285 kWh and annual consumption is 26,974 kWh. The average yearly/weekly state of charge is shown in
Figure 18. The state of charge is within the range of 40% to 100%.
5.3. Excess Electricity sold to the Grid
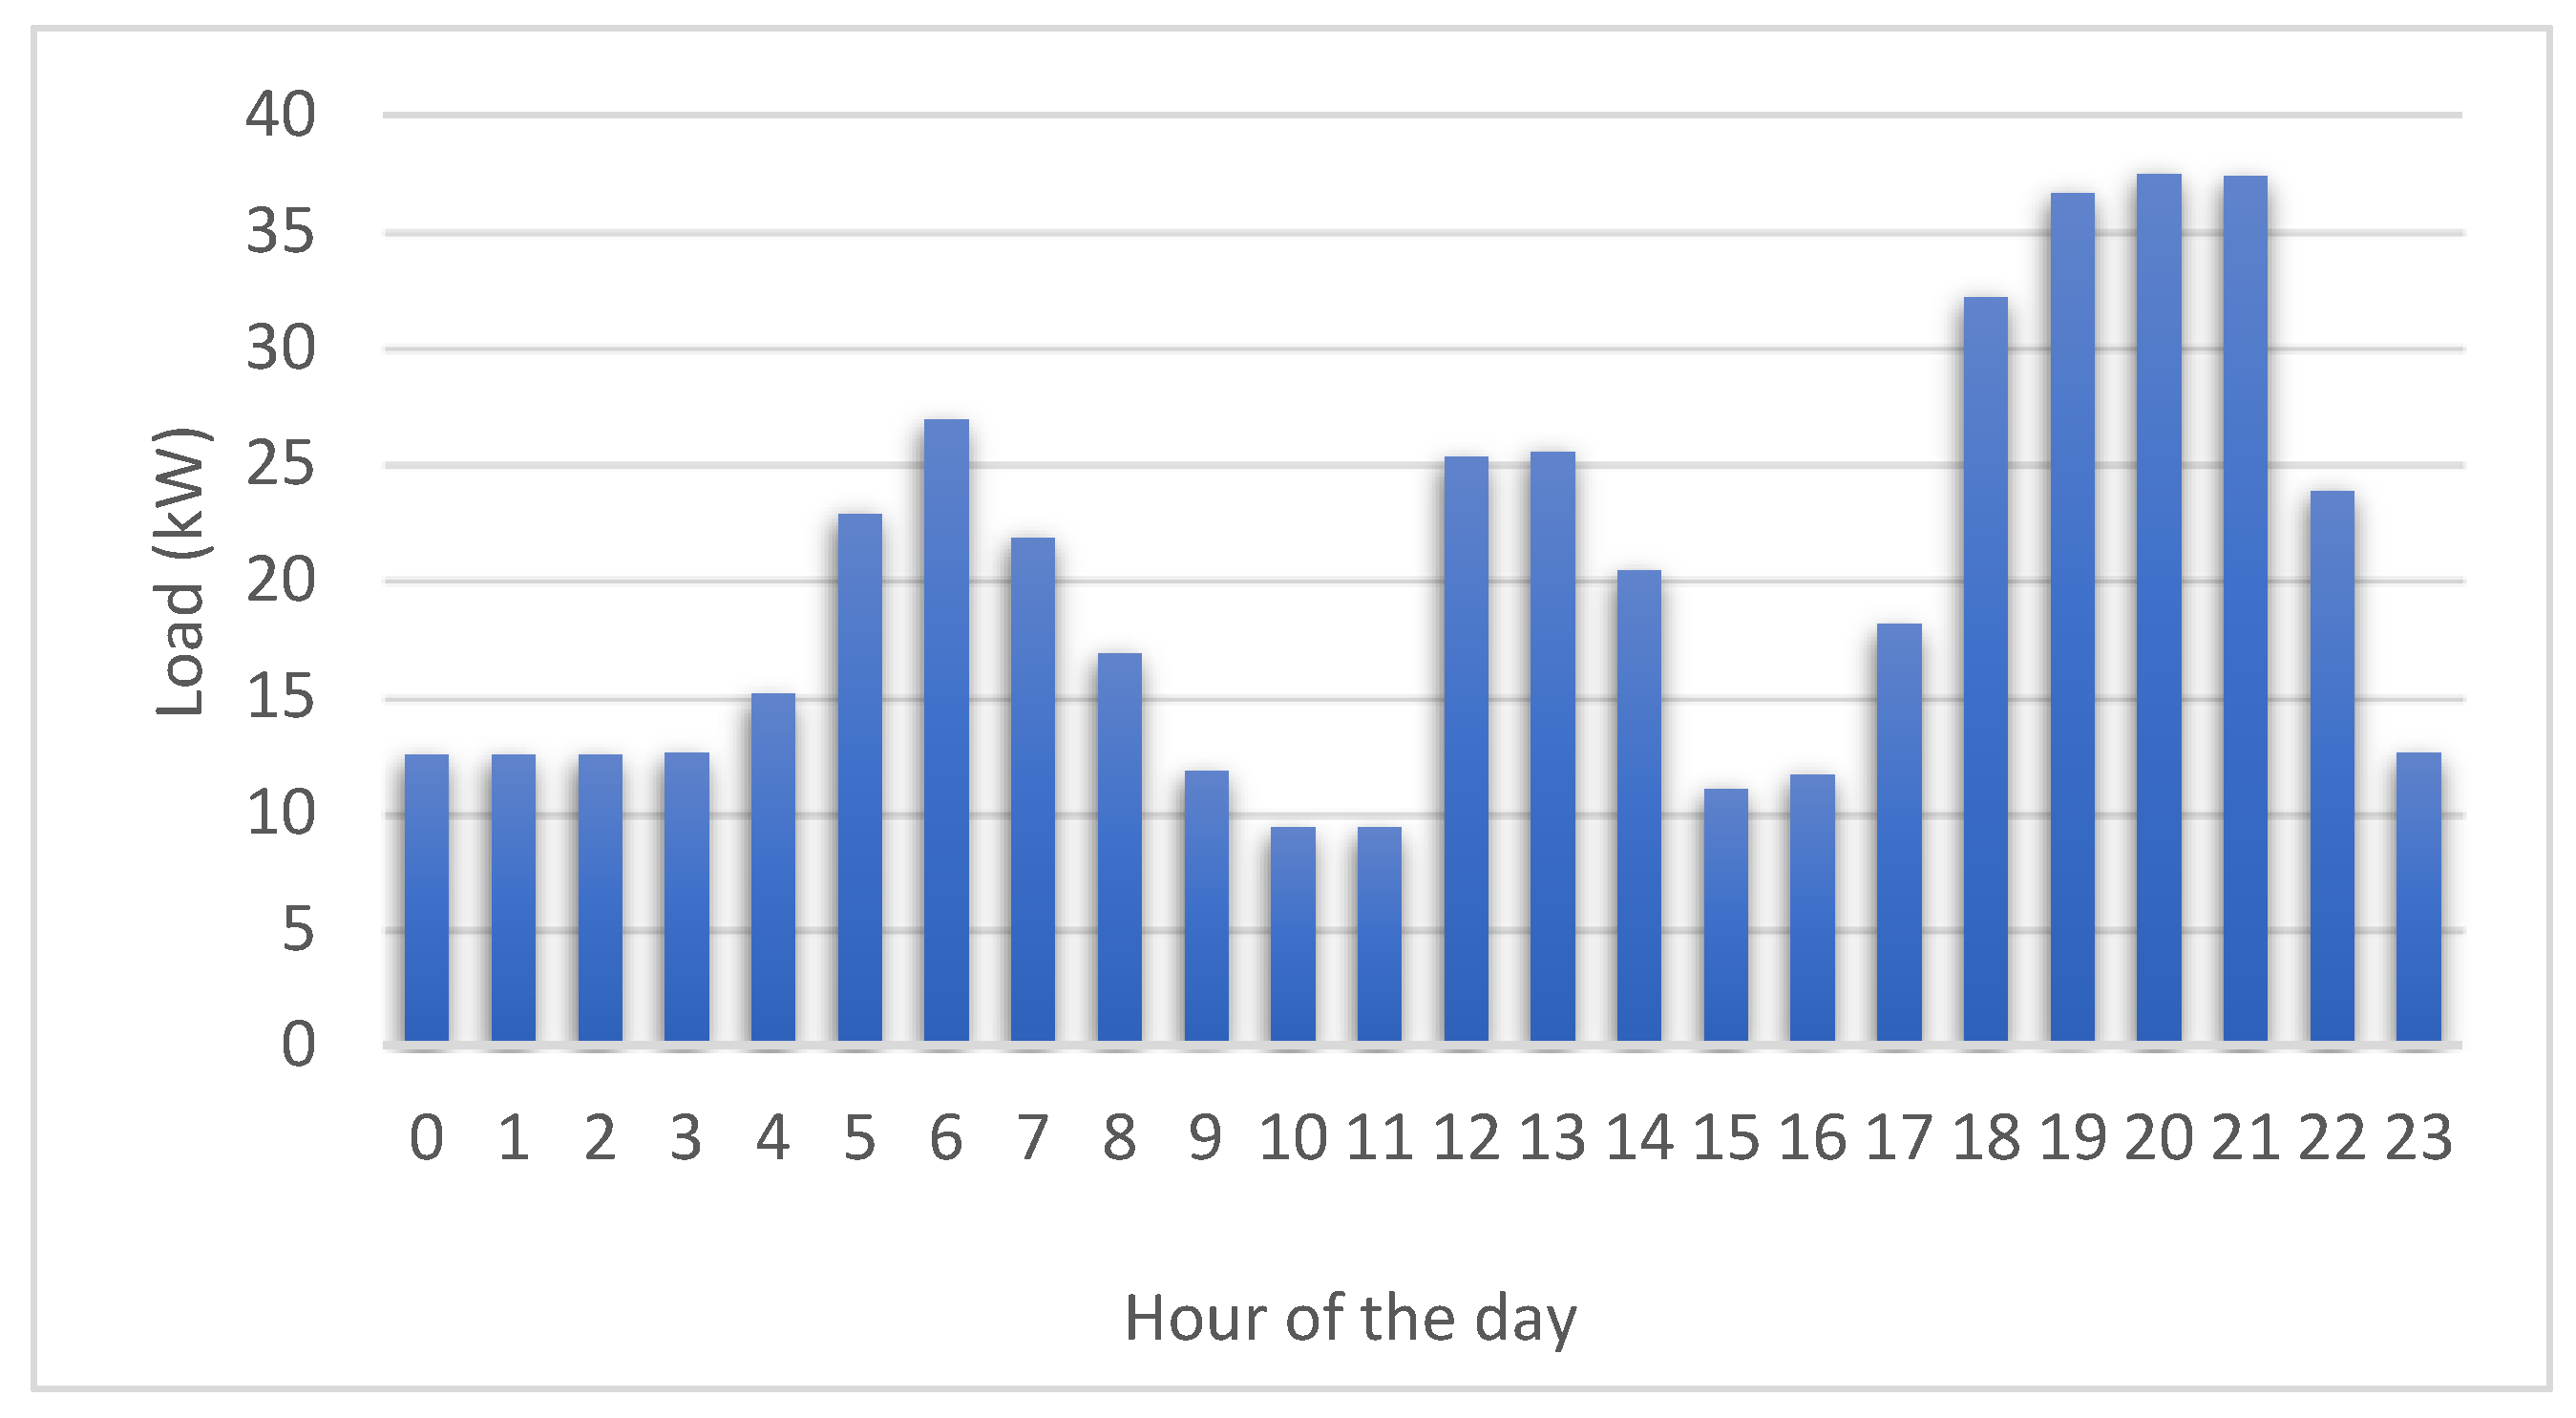
The configurations presented above are optimised to find the most cost effective and reliable electricity with the available resources, solar and hydro, for Ase village in Nigeria. The study aims to improve microgrid reliability using an energy storage system; therefore, a battery bank was included in the system’s configuration. The number of households in the village is estimated to be 101; average daily load demand is 476.37 kWh/day, and a peak load of 64 kW occurs in the evening between the hours of 18:00 and 22:00.
The selected site is connected to the utility grid and, as such, two configurations were analysed. The off-grid microgrid configuration had an annual excess electricity of 104,420 kWh, 36.5% of the total annual electricity produced. In the grid-connected microgrid configuration, the annual excess electricity reduced to 11,260 kWh, 4.26% of the total annual electricity produced, because the bulk of the excess electricity could be sold to the grid. To encourage investments in renewable energy generation in Nigeria, the Nigerian Electricity Regulatory Commission (NERC) targeted electricity generation of about 2,000 MW from renewables by 2020. To achieve this, the commission’s aim was to promote grid-connected renewable energy projects by approving schemes that were yet to be commissioned. These schemes such as net-metering and feed-in tariff, which aid the selling of surplus electricity back to the grid are considered [
39].
According to the results, the LCOE of the off-grid and grid-connected configurations are
$0.101/kWh and
$0.046/kWh, respectively. As a comparison, Benin Electricity Distribution Company (BEDC) approved tariff rate for residential customers as ₦31.36/kWh (
$0.081/kWh) [
40]. Due to the unreliability of the grid, rural dwellers use diesel generators for electricity supply [
41]. However, the fuel price required to operate these generators ranges from ₦121.50 (
$0.314) to ₦123.50 (
$0.320) per litre, which is expensive [
42]. The LCOE of both system configurations, when compared to the electricity tariff rate of BEDC and fuel price, is relatively lower and affordable; the LCOE of the microgrid, when connected to the utility grid, is almost half the electricity tariff rate.
The configuration is a function of the load profile and the renewable energy resource potentials of the selected site. The results of the HMS configurations are shown in
Table 3.
The system generates enough electricity to serve the load. When there is a shortfall in the system, the battery bank is used as a backup. The excess electricity that is not used up by the load is sold back to the grid; the sell-back price is
$0.05/kWh. Because the energy generated by solar PV, micro-hydro and battery storage is almost sufficient, the energy purchased from the grid is minimal as shown in
Table 4. It is notable from
Table 4 that the monthly energy sold to the grid is extremely higher than the energy purchased from the grid. The grid-connected configuration can earn up to
$3,434.50/year by selling electricity to the grid.
5.4. Economic Viability
The economics of both scenarios, the off-grid microgrid configuration (scenario 1) and grid-connected microgrid configuration (scenario 2), are analysed in this section. The net present cost (NPC), capital cost, O&M cost, and LCOE are important parameters for determining the configuration of a microgrid system. The grid sell-back price and purchase price generally affect the system costs, total NPC and LCOE. The important parameters are compared between both scenarios as shown in
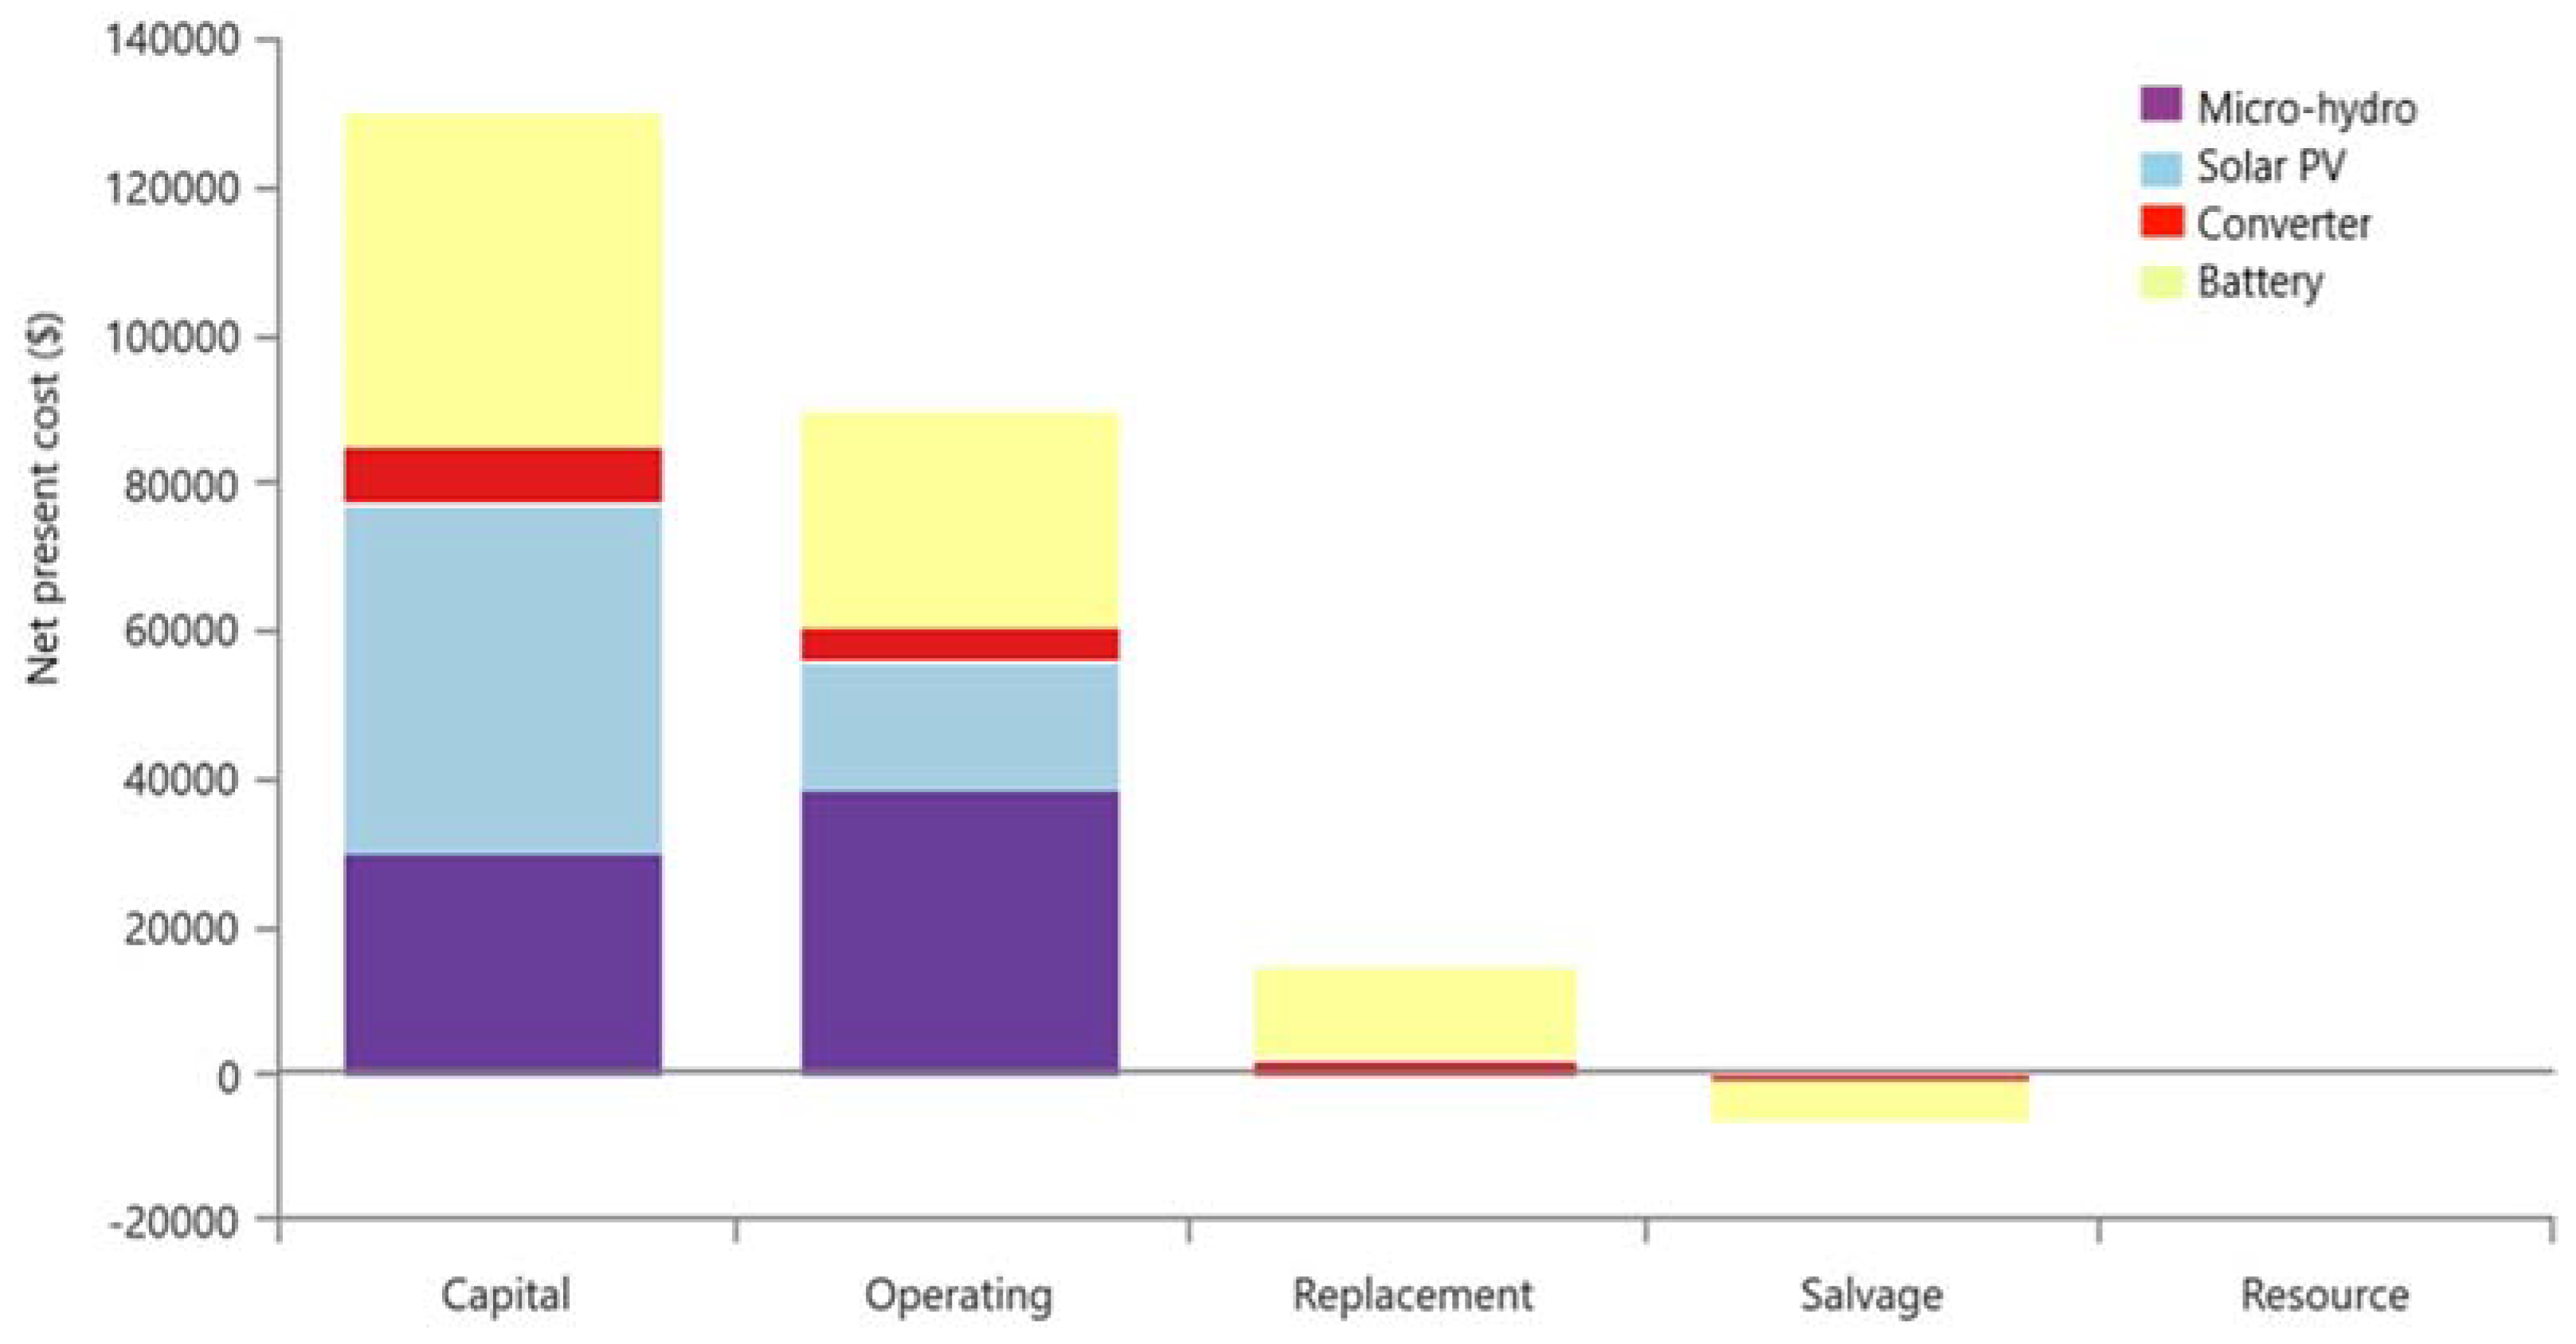
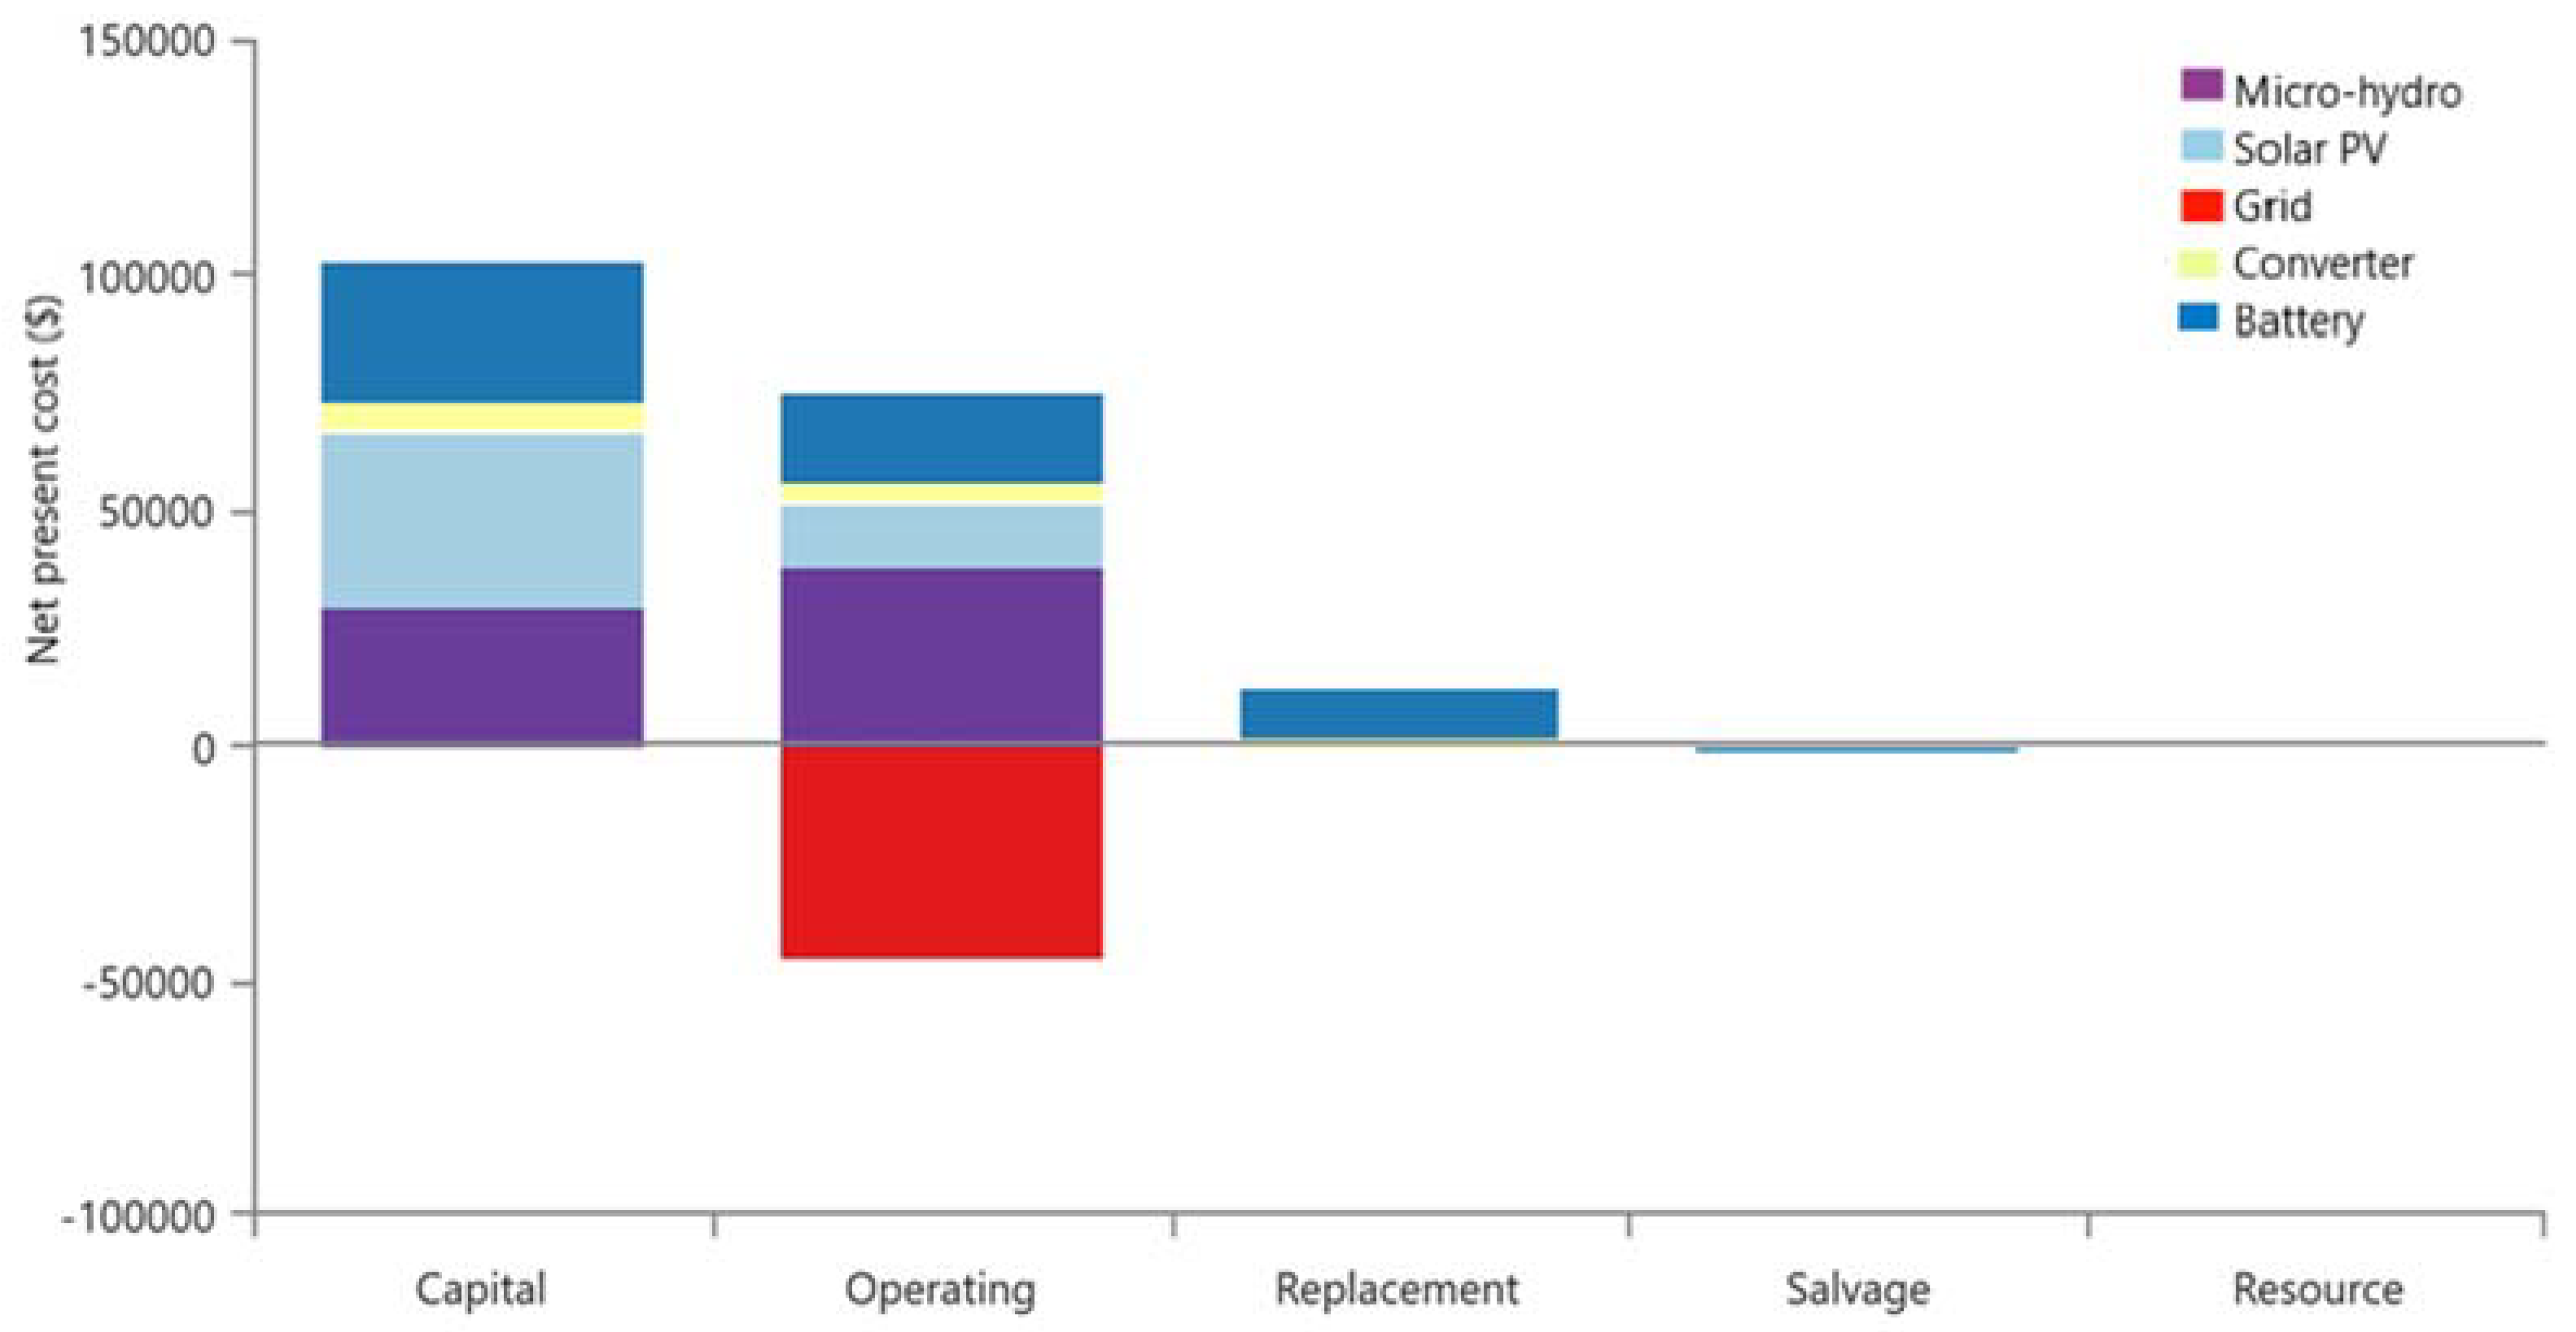
Table 5. The NPC values of both off-grid and grid-connected configurations are illustrated in
Figure 19 and
Figure 20, respectively. The capital and O&M costs of the grid-connected system is relatively cheaper compared to the off-grid system because of the reduced components’ capacities for the grid-connected system.
The cost analysis of the off-grid configuration as a function of each component is as follows:
The capital cost of the PV is 36.37% of the initial capital cost of the system, with the battery constituting about 34.72%. The micro-hydro and converter contributed about 23.14% and 0.06% of the system capital cost, respectively. The total capital cost of the system is $129,605, with the solar PV as the most costly component in this scenario.
The solar PV and micro-hydro have no replacement costs since the lifetime of both components, which is 25 years, is the same as the project lifetime. However, the replacement cost is made up of the costs of the battery and converter, which contribute 85.3% and 14.7%, respectively. The expected lifetime of the battery is 18.7 years.
The total operating cost and salvage value during the project lifetime are $89,286.50 and $6,032.74, respectively.
The cost analysis of the grid-connected configuration as a function of each component is as follows:
The capital costs of solar PV, micro-hydro, battery and converter are 35.76%, 29.23%, 29.23% and 5.78% of the total initial capital cost of the system, respectively. The grid is an existing one and therefore incurred no capital cost.
Like scenario 1, the solar PV and micro-hydro have no replacement costs; the grid does not have a replacement cost either. The replacement costs of both battery and converter are 87% and 13% of the total replacement cost of the system, respectively. The expected lifetime of the battery is 13.2 years.
The total operating cost and salvage value during the project lifetime are $30,520.31 and $839.16, respectively.
5.5. Comparative Analysis of Studies’ Findings
Table 6 shows a comparative techno-economic analysis results obtained in this study and that of similar studies in [
23,
24,
25,
26]. The proposed systems had better techno-economic feasibilities as compared to other studies with standalone PV, as well as hybrid systems. The LCOE of the grid-connected system in this study is relatively lower than that of study [
23]. Also, the LCOE of this study’s off-grid system is relatively lower than studies [
24,
25,
26]. This could be as a result of the recent global reduction in the cost of components like solar PV panels and inverters, as well as the improved efficiency of these components.
6. Conclusion and Future Works
The main objective of this paper was to design an economically feasible HMS that could solve the problem of rural electrification in Nigeria. The load profile of a village in Nigeria was estimated and the renewable energy sources were assessed by analysing the solar radiation and the stream discharge, as well as the reliability of the grid. Moreover, a battery bank was included in the system to ensure the continuous supply of electricity to the community, which will improve the power supply reliability.
The configuration of the off-grid HMS comprised of solar PV, micro-hydro and battery bank. The annual excess electricity generated was 104,420 kWh. A way to fully maximise the utilization of the excess electricity was analysed by modelling a grid-connected HMS. The grid-connected HMS configuration comprised of the grid, solar PV, micro-hydro and battery bank. The annual excess electricity reduced considerably to 11,260 kWh because most of the excess electricity was sold to the grid. In addition, this configuration could generate up to $3,434.50/year from the surplus energy sold to the grid.
The LCOE of the off-grid and grid-connected HMS configurations was $0.101/kWh and $0.046/kWh, respectively, which is relatively lower as compared to the grid tariff rate and generator fuel price. Furthermore, both configurations do not pose a threat to the environment because the renewable fraction is 100% and 99.3% for the off-grid HMS and grid-connected HMS, respectively.
Notably, the interest and adoption of grid-connected solar PV systems in Nigeria have recently increased. Thus, as future work, the impact of the penetration levels of intermittent renewable energy sources to the grid on the grid stability should be investigated. As a result, the regulatory authority will be able to safeguard the grid’s stability as well as to establish appropriate policy frameworks to support renewable energy systems in the country.
Figure 1.
Load profile of Ase village.
Figure 1.
Load profile of Ase village.
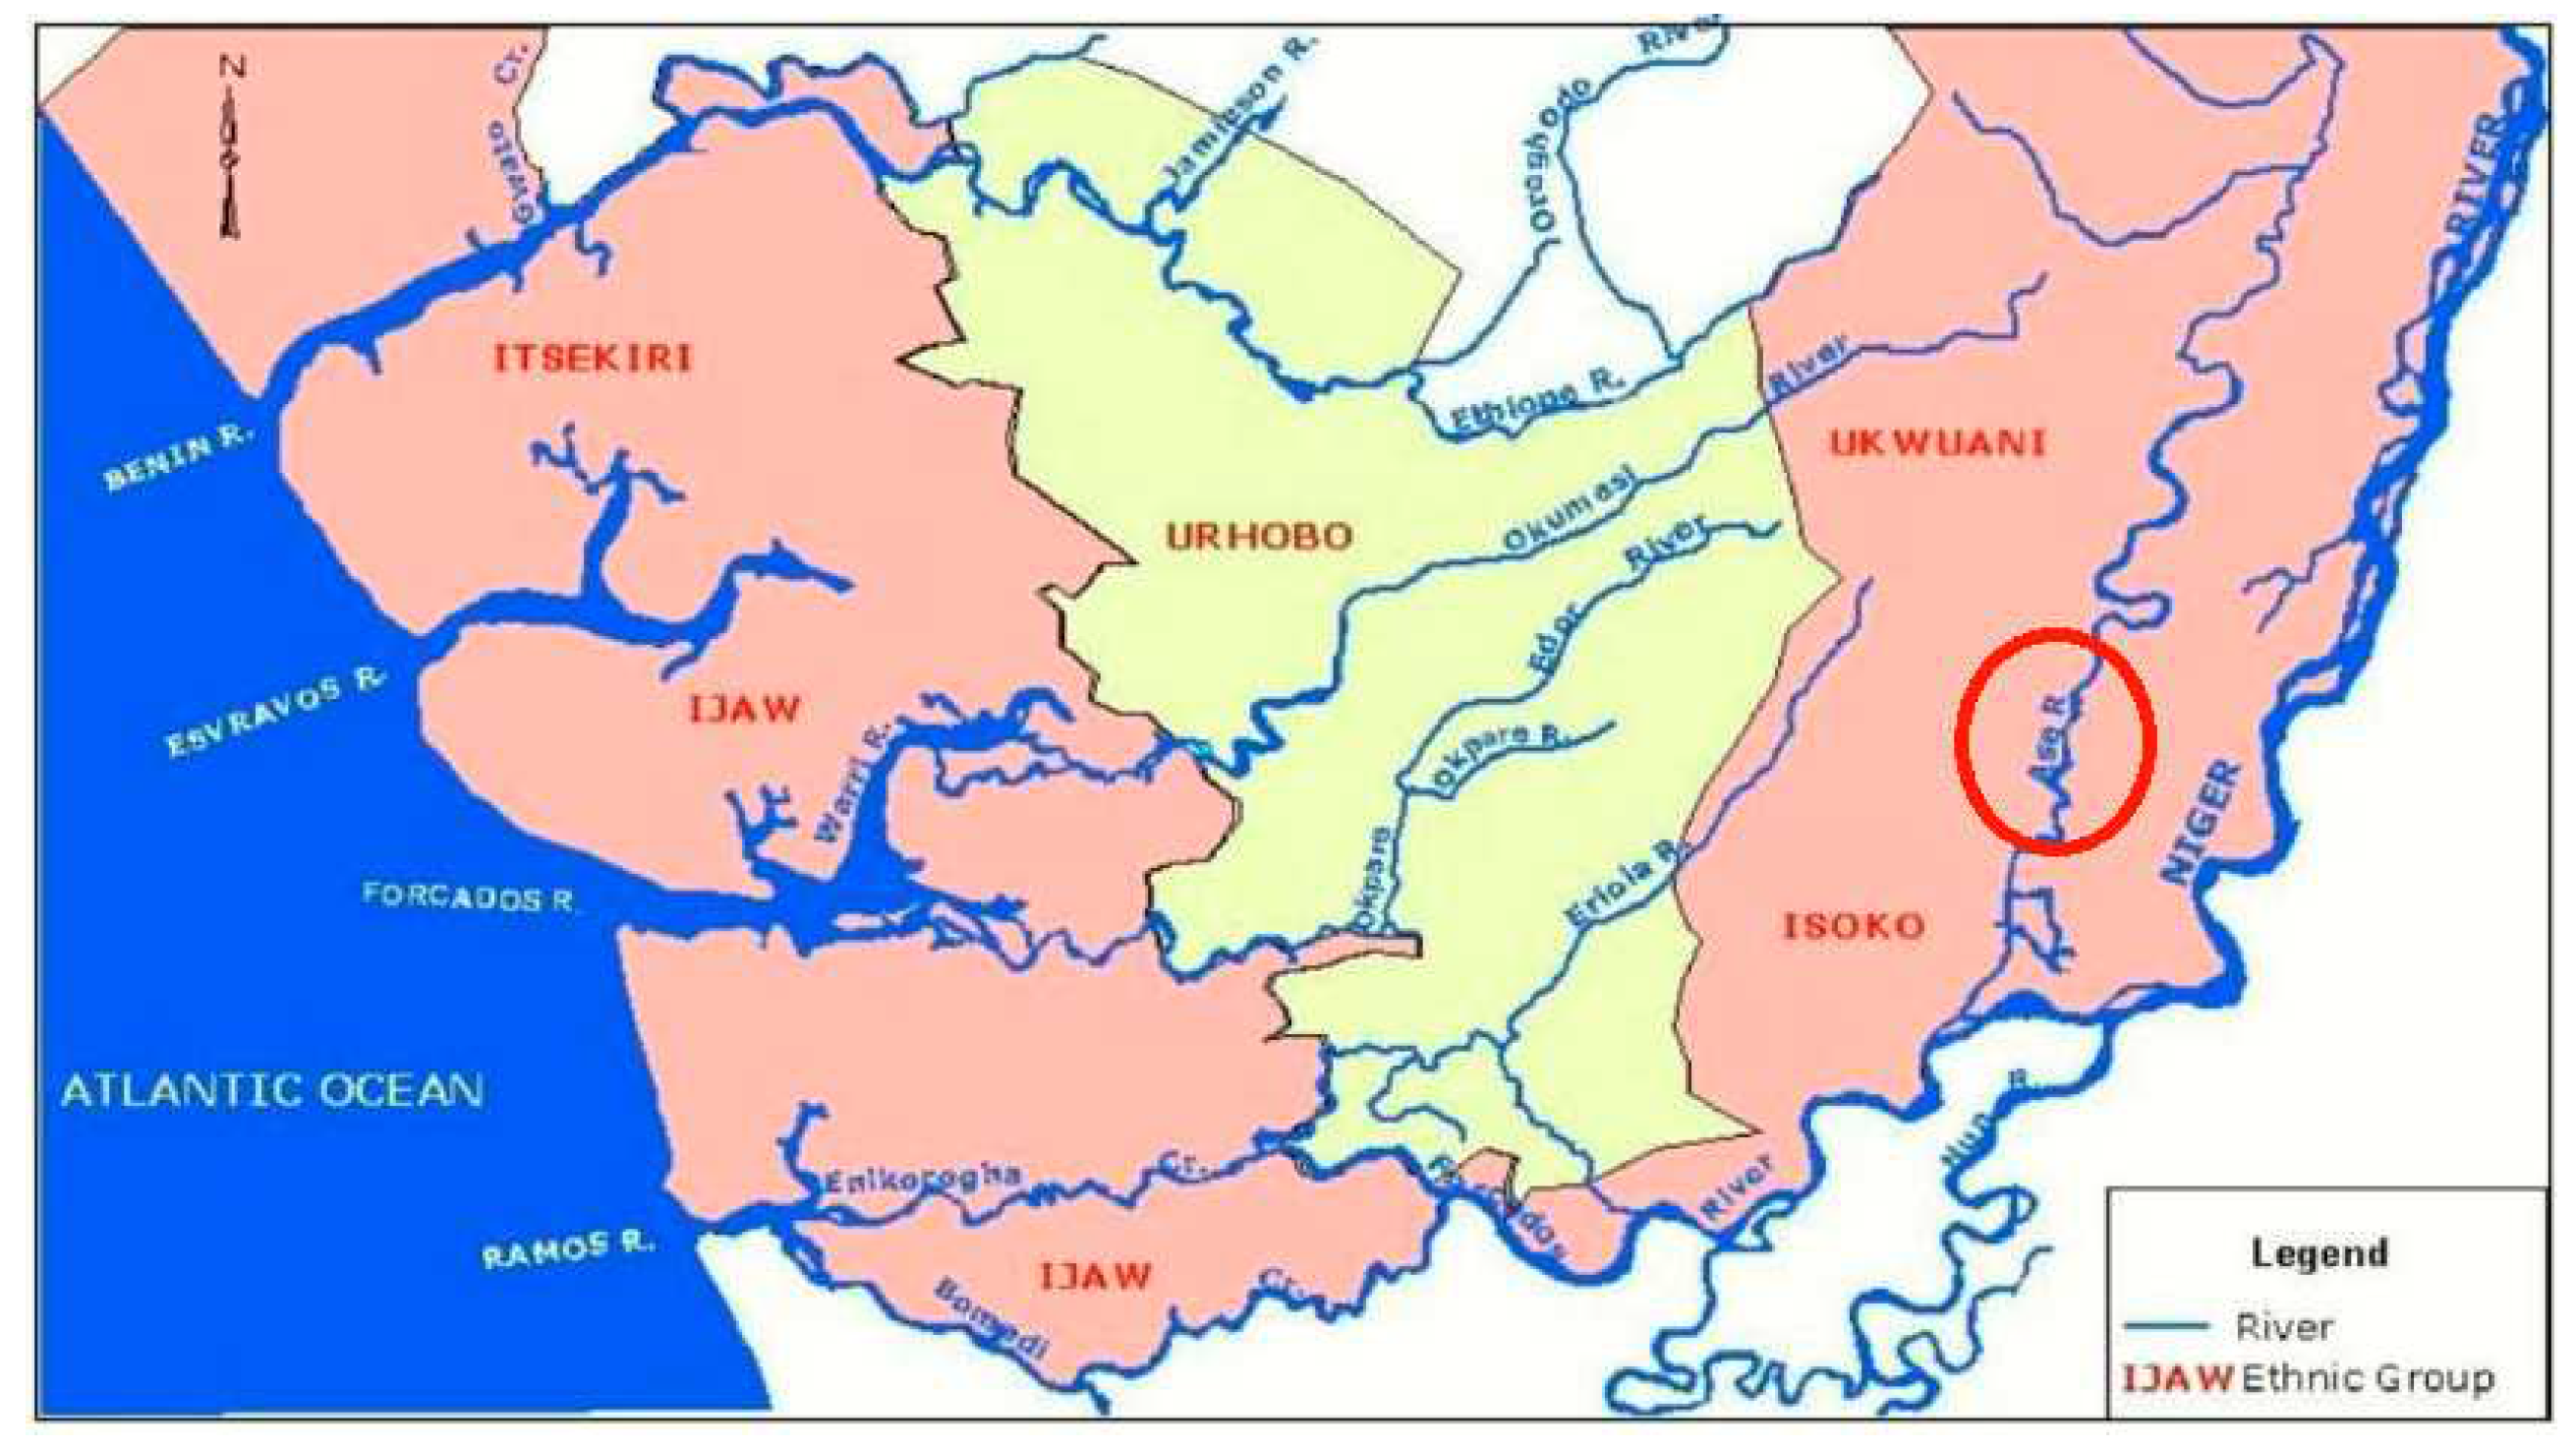
Figure 2.
Location of Asse river in Delta State [
35].
Figure 2.
Location of Asse river in Delta State [
35].
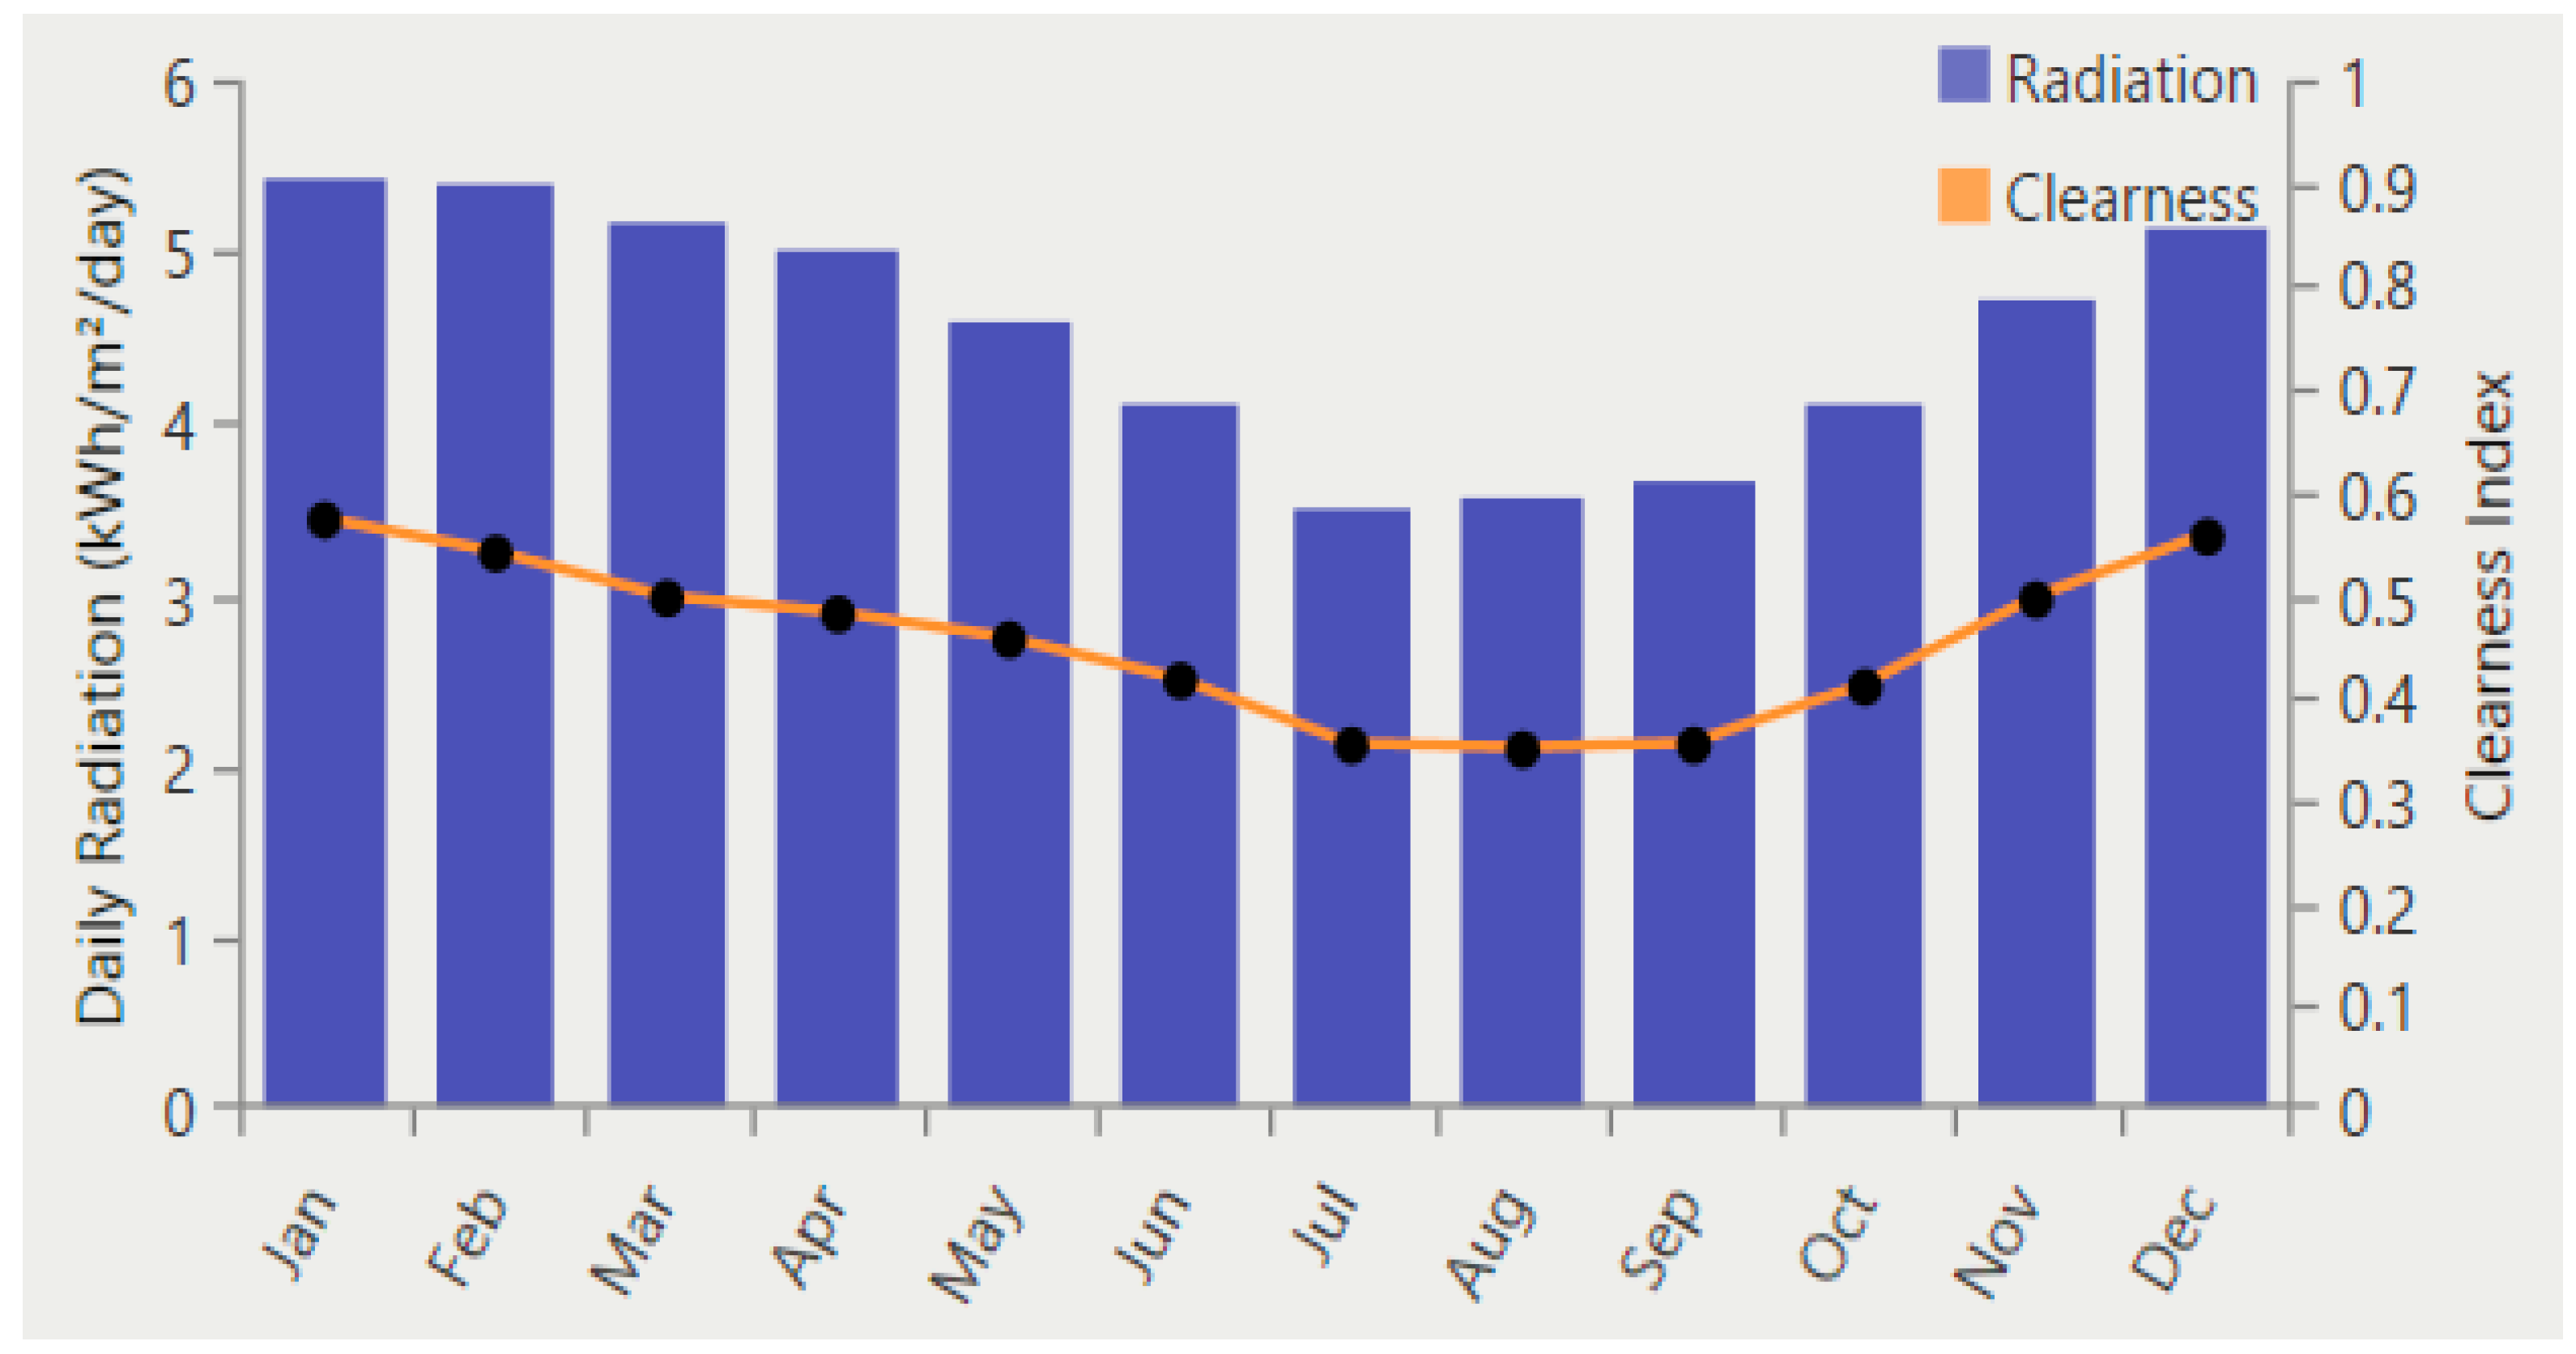
Figure 3.
Monthly average daily radiation of Ase village.
Figure 3.
Monthly average daily radiation of Ase village.
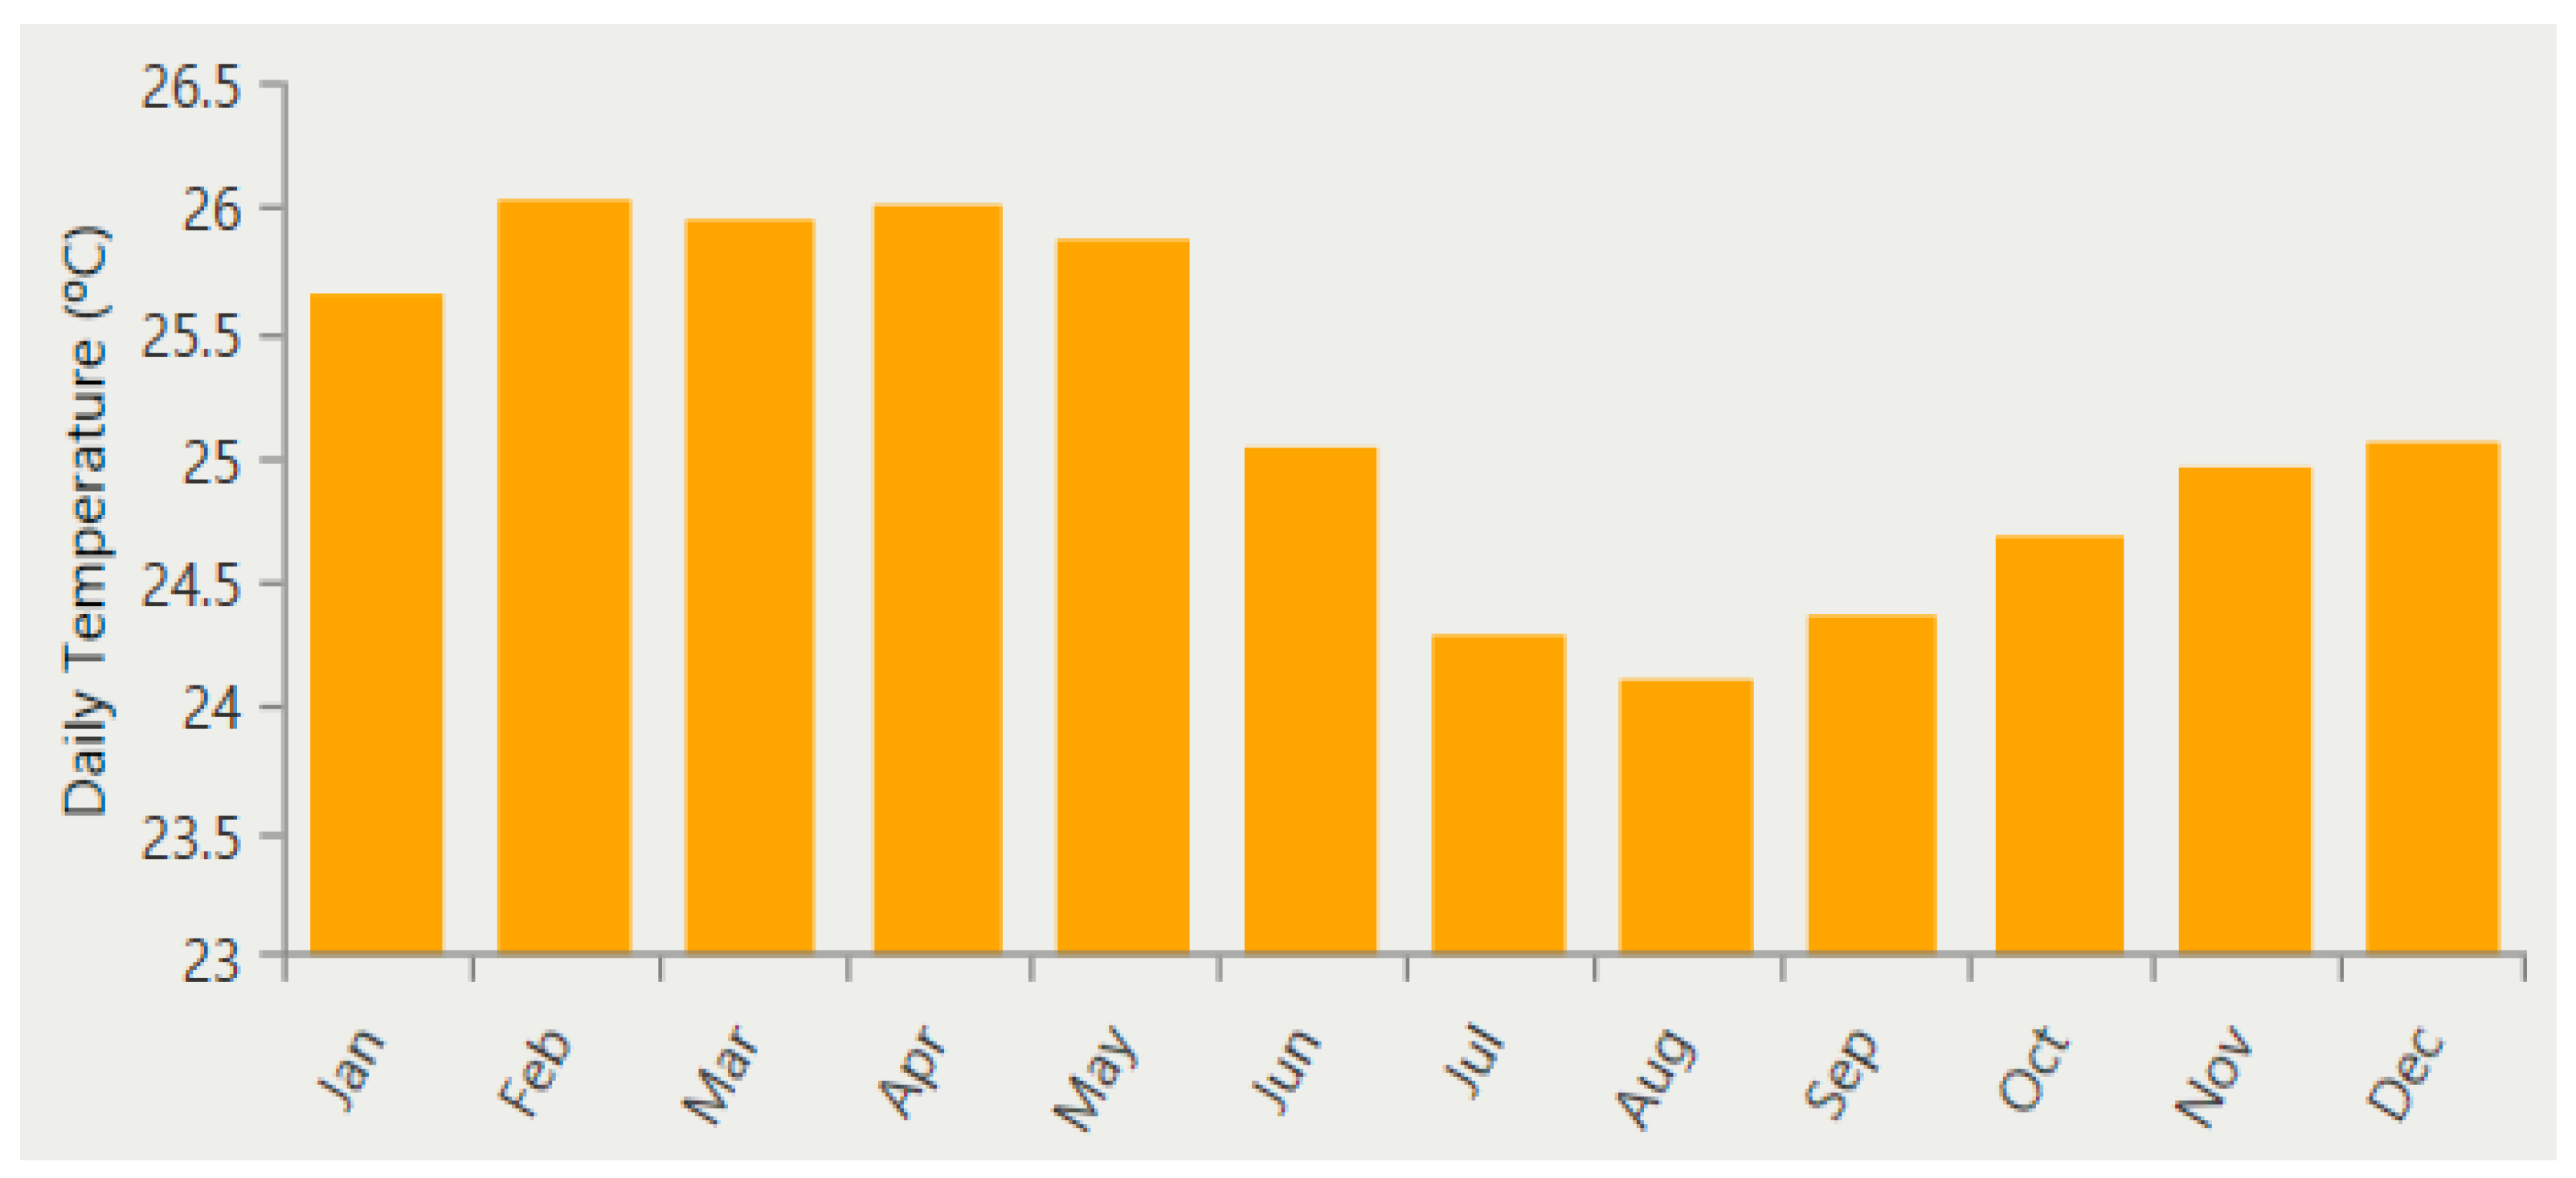
Figure 4.
Monthly average daily temperature of Ase village.
Figure 4.
Monthly average daily temperature of Ase village.
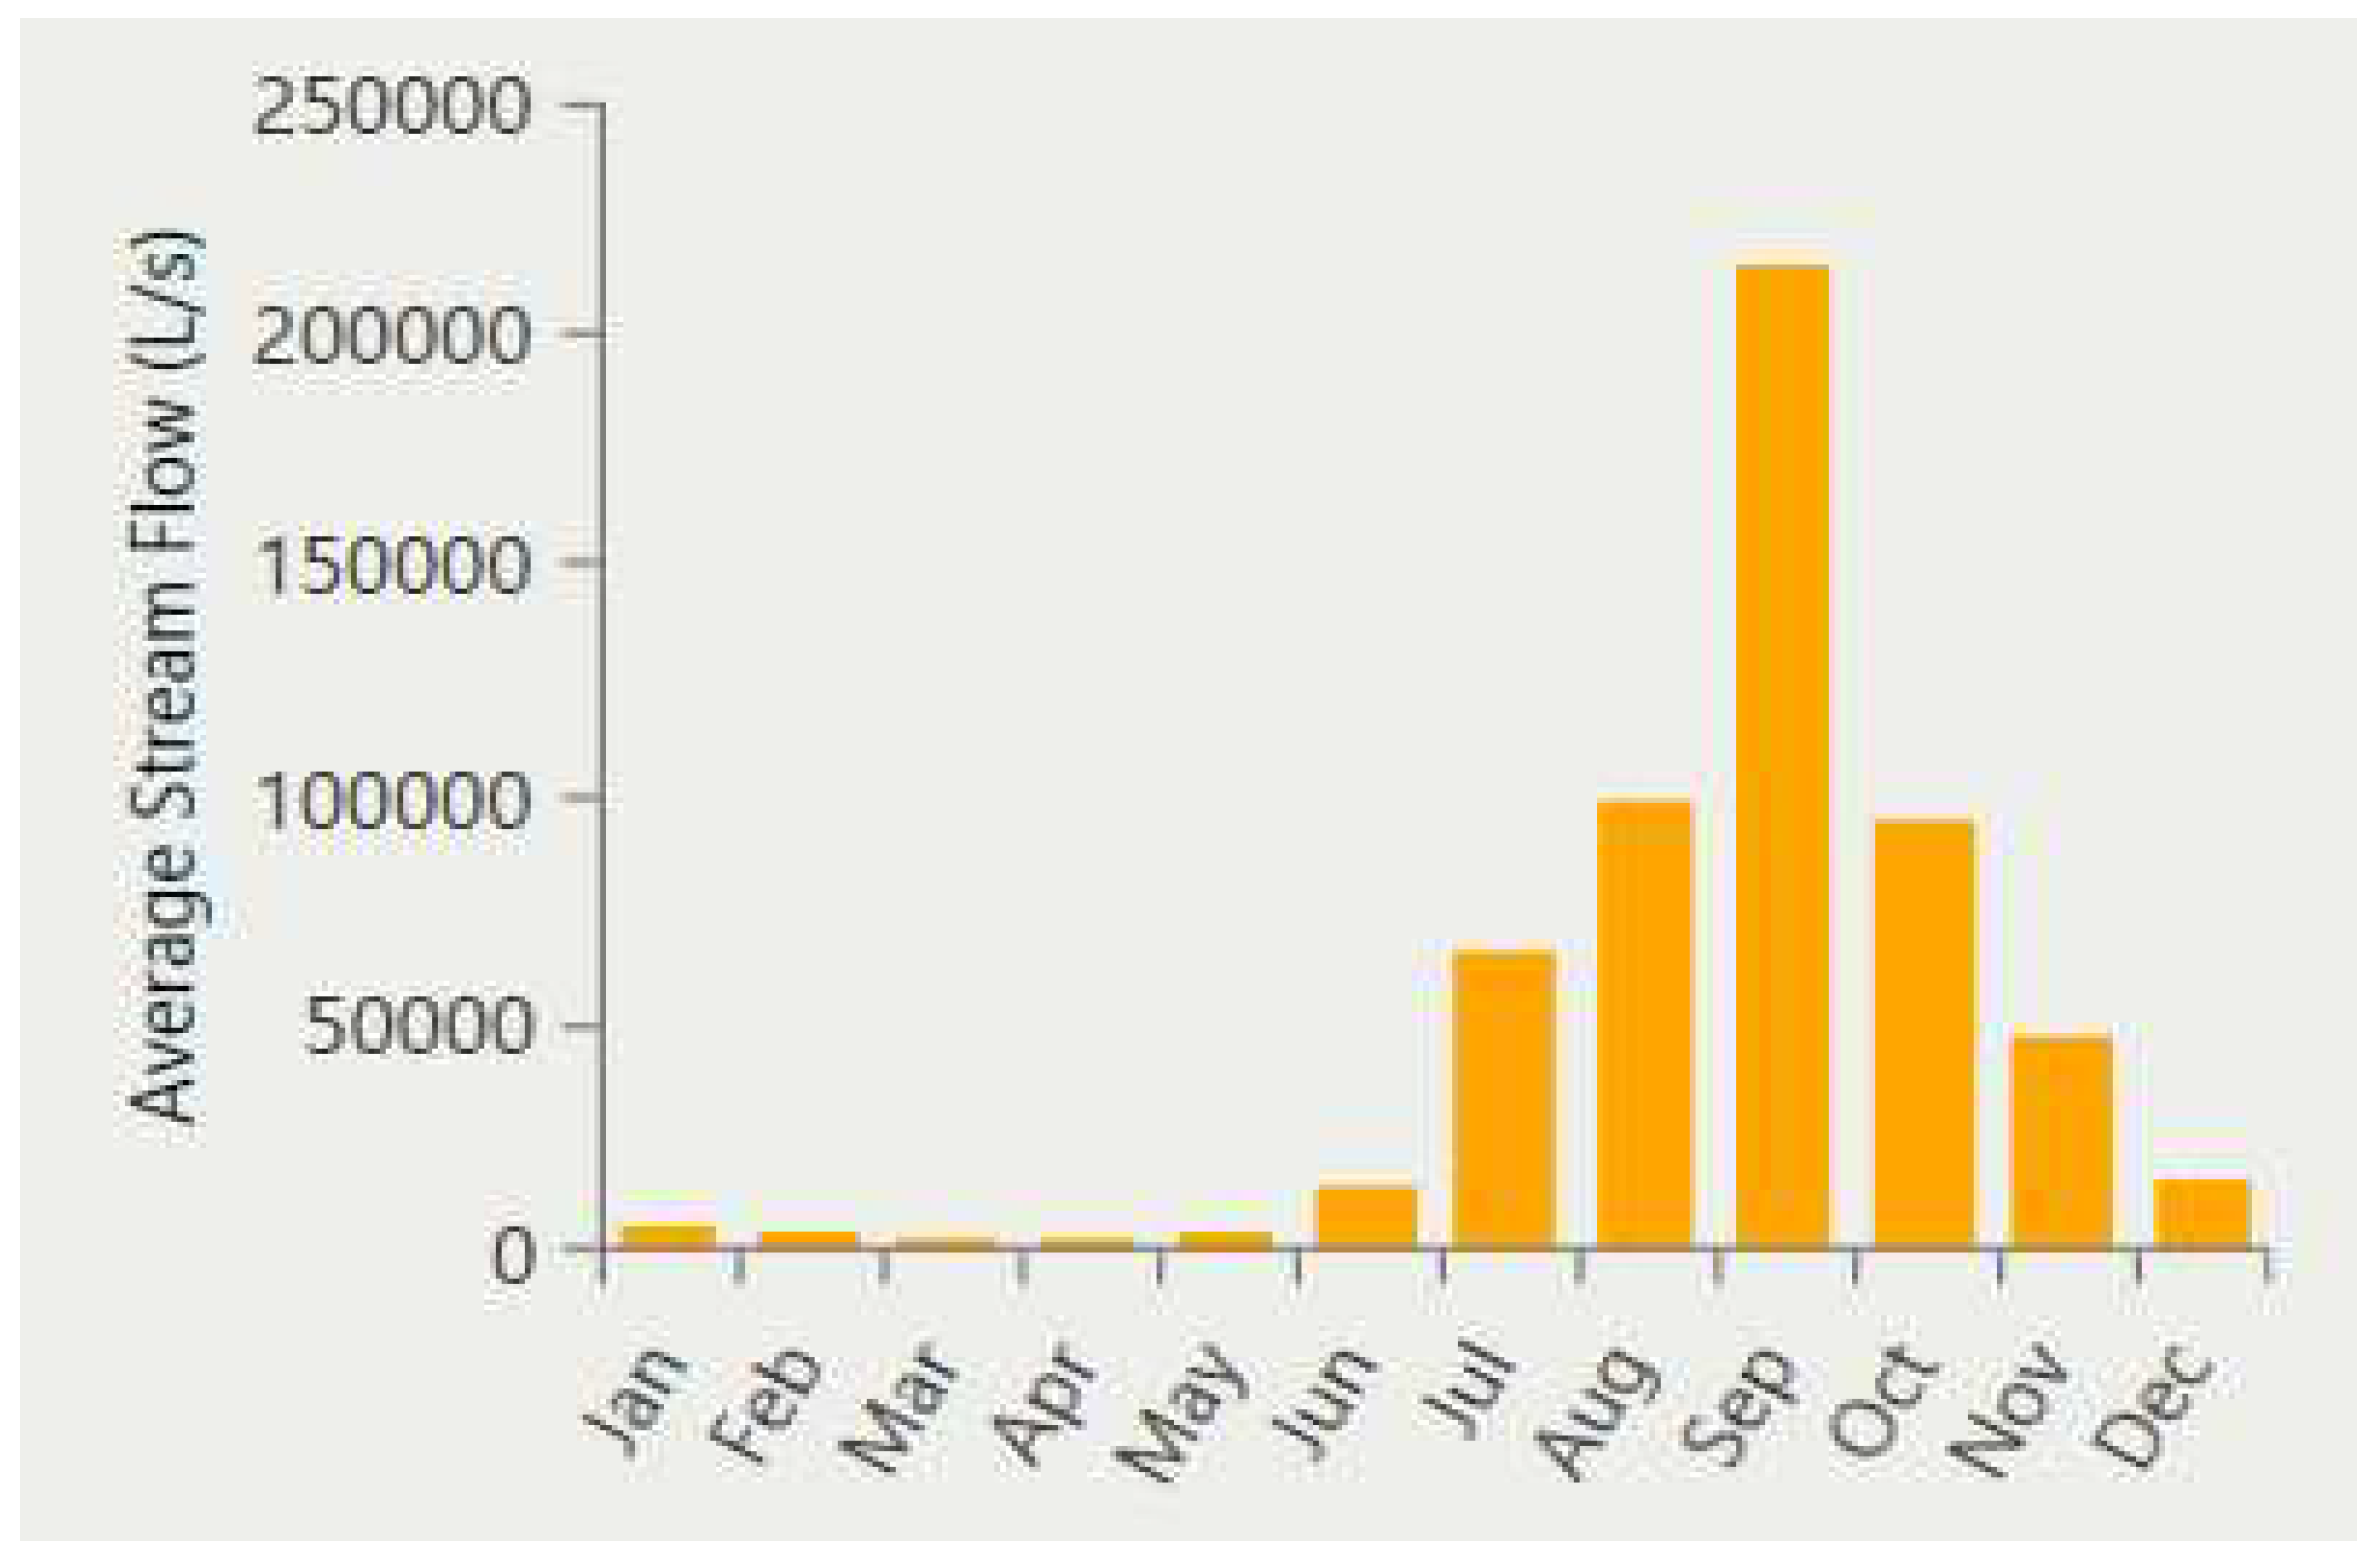
Figure 5.
Monthly average stream discharge.
Figure 5.
Monthly average stream discharge.
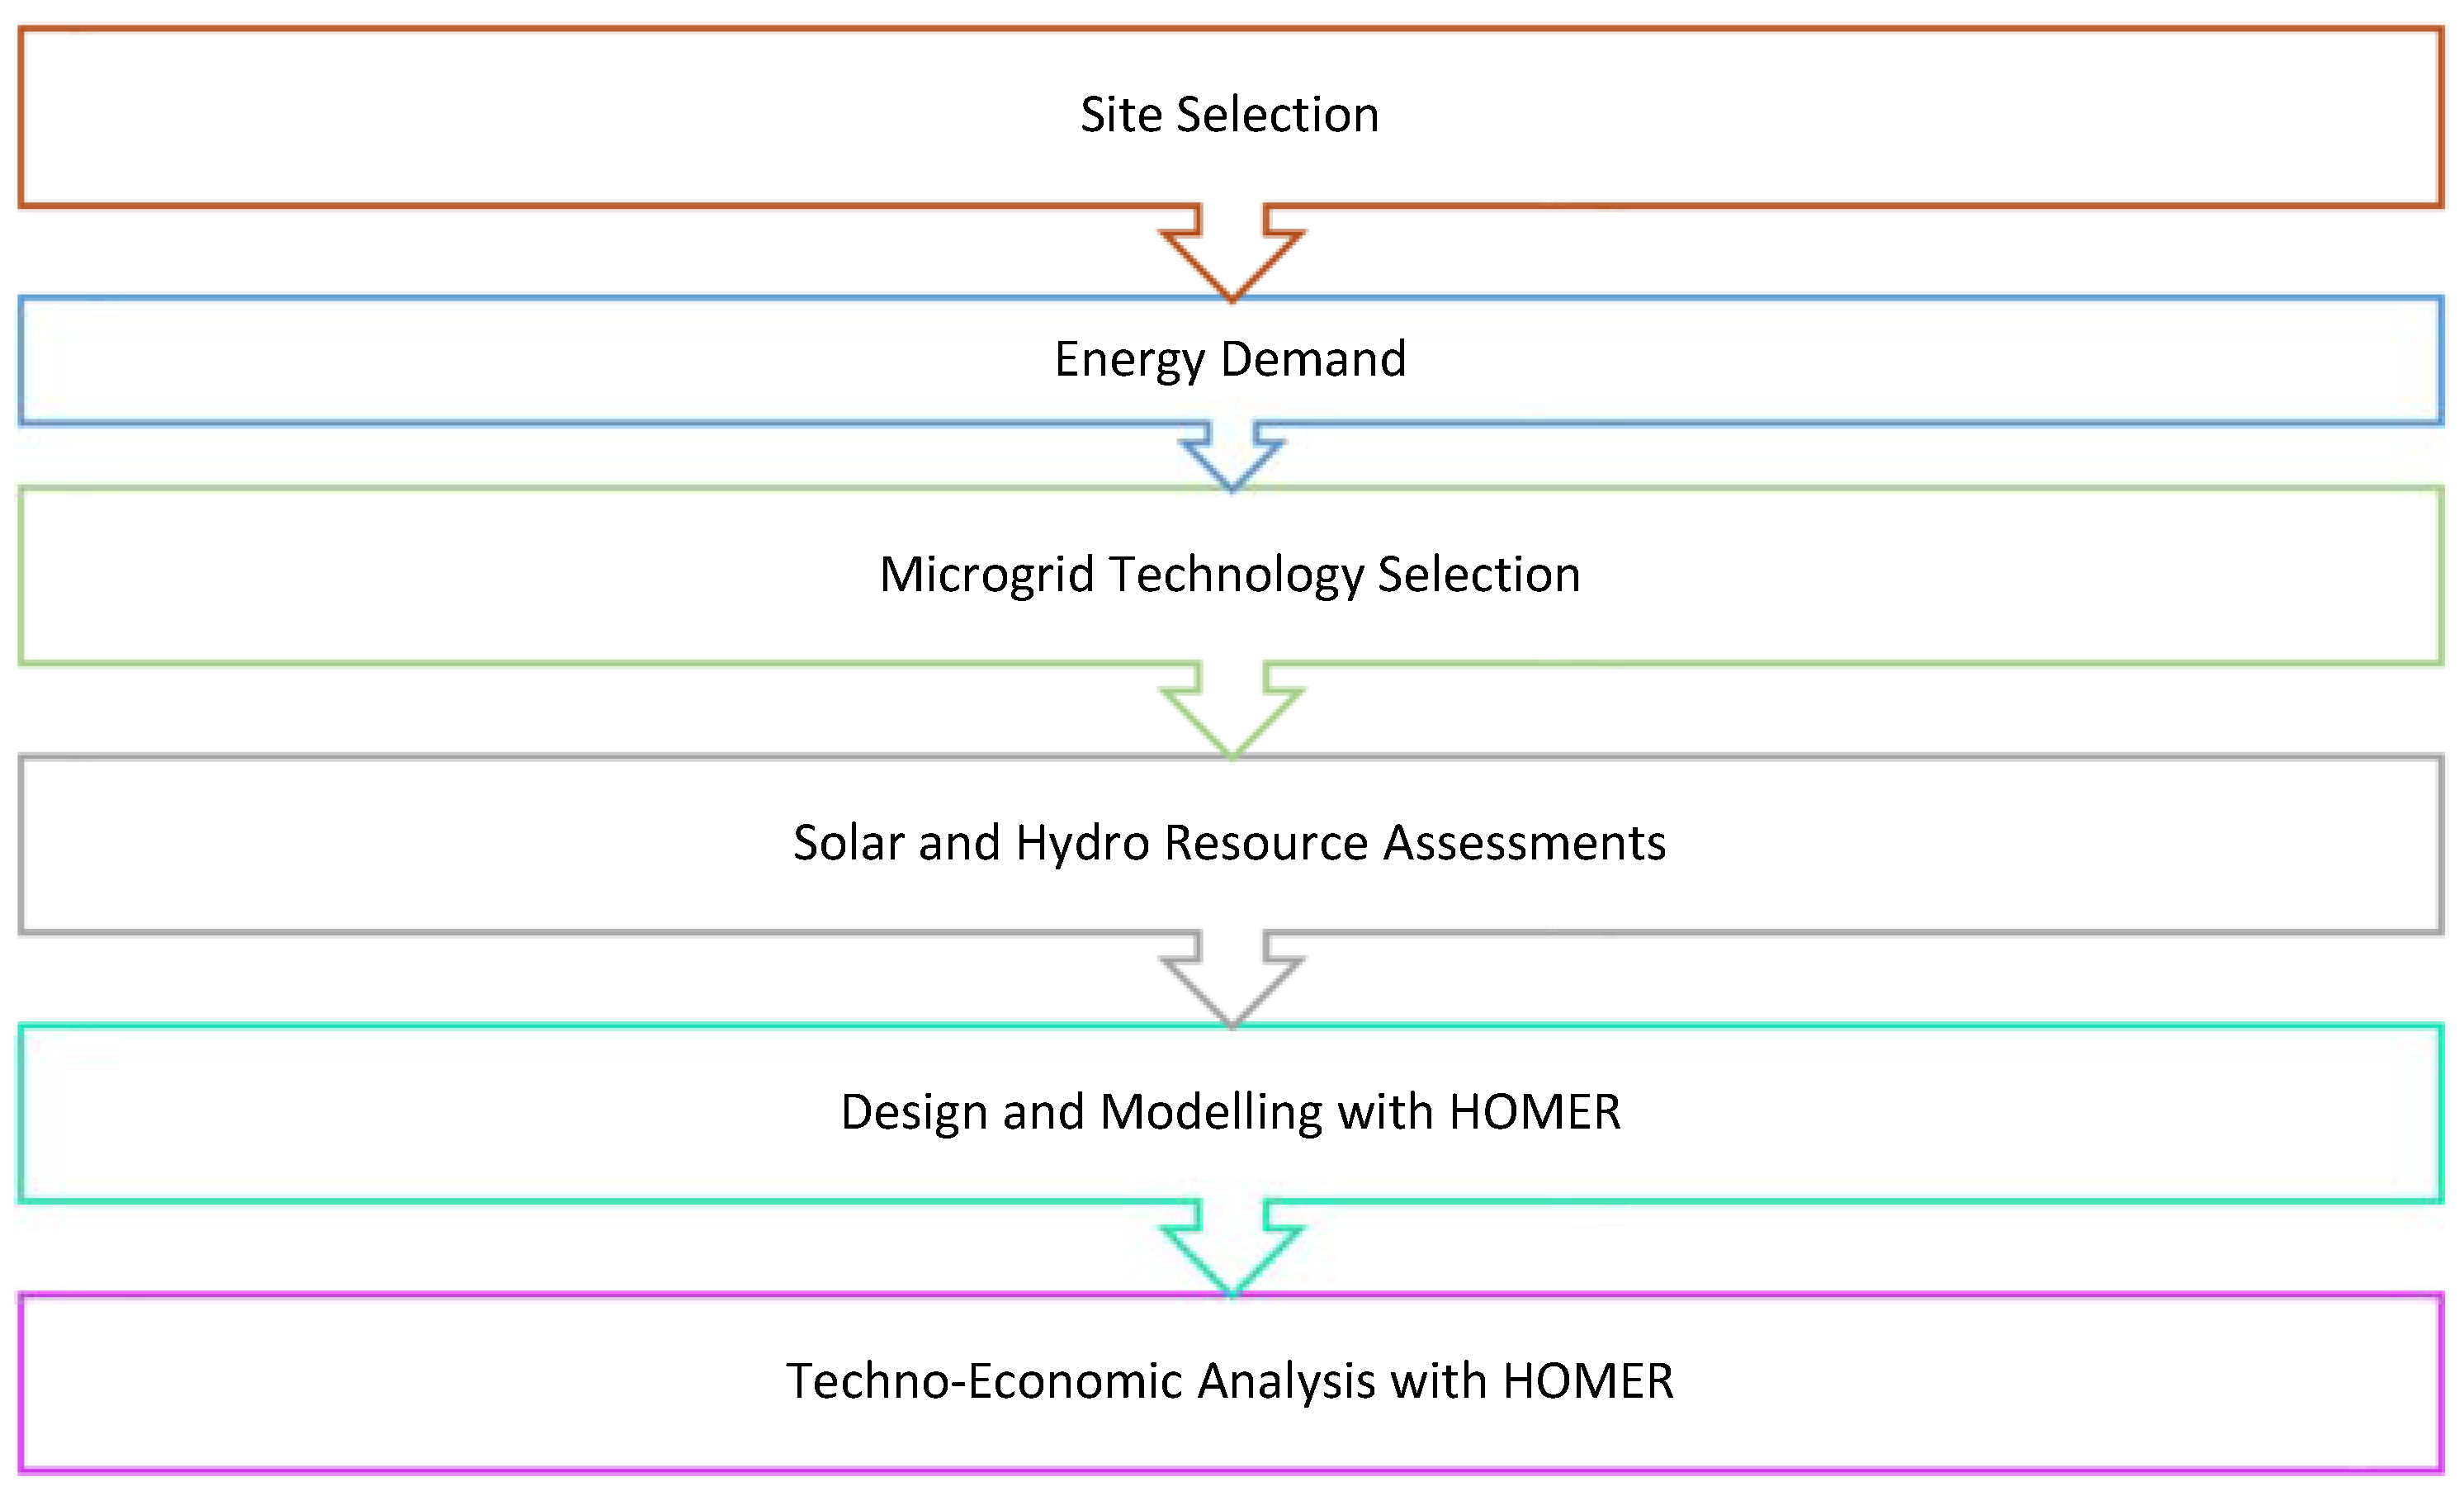
Figure 6.
Methodology of the HMS design.
Figure 6.
Methodology of the HMS design.
Figure 7.
Schematic of the off-grid microgrid.
Figure 7.
Schematic of the off-grid microgrid.
Figure 8.
Schematic of the grid-connected microgrid.
Figure 8.
Schematic of the grid-connected microgrid.
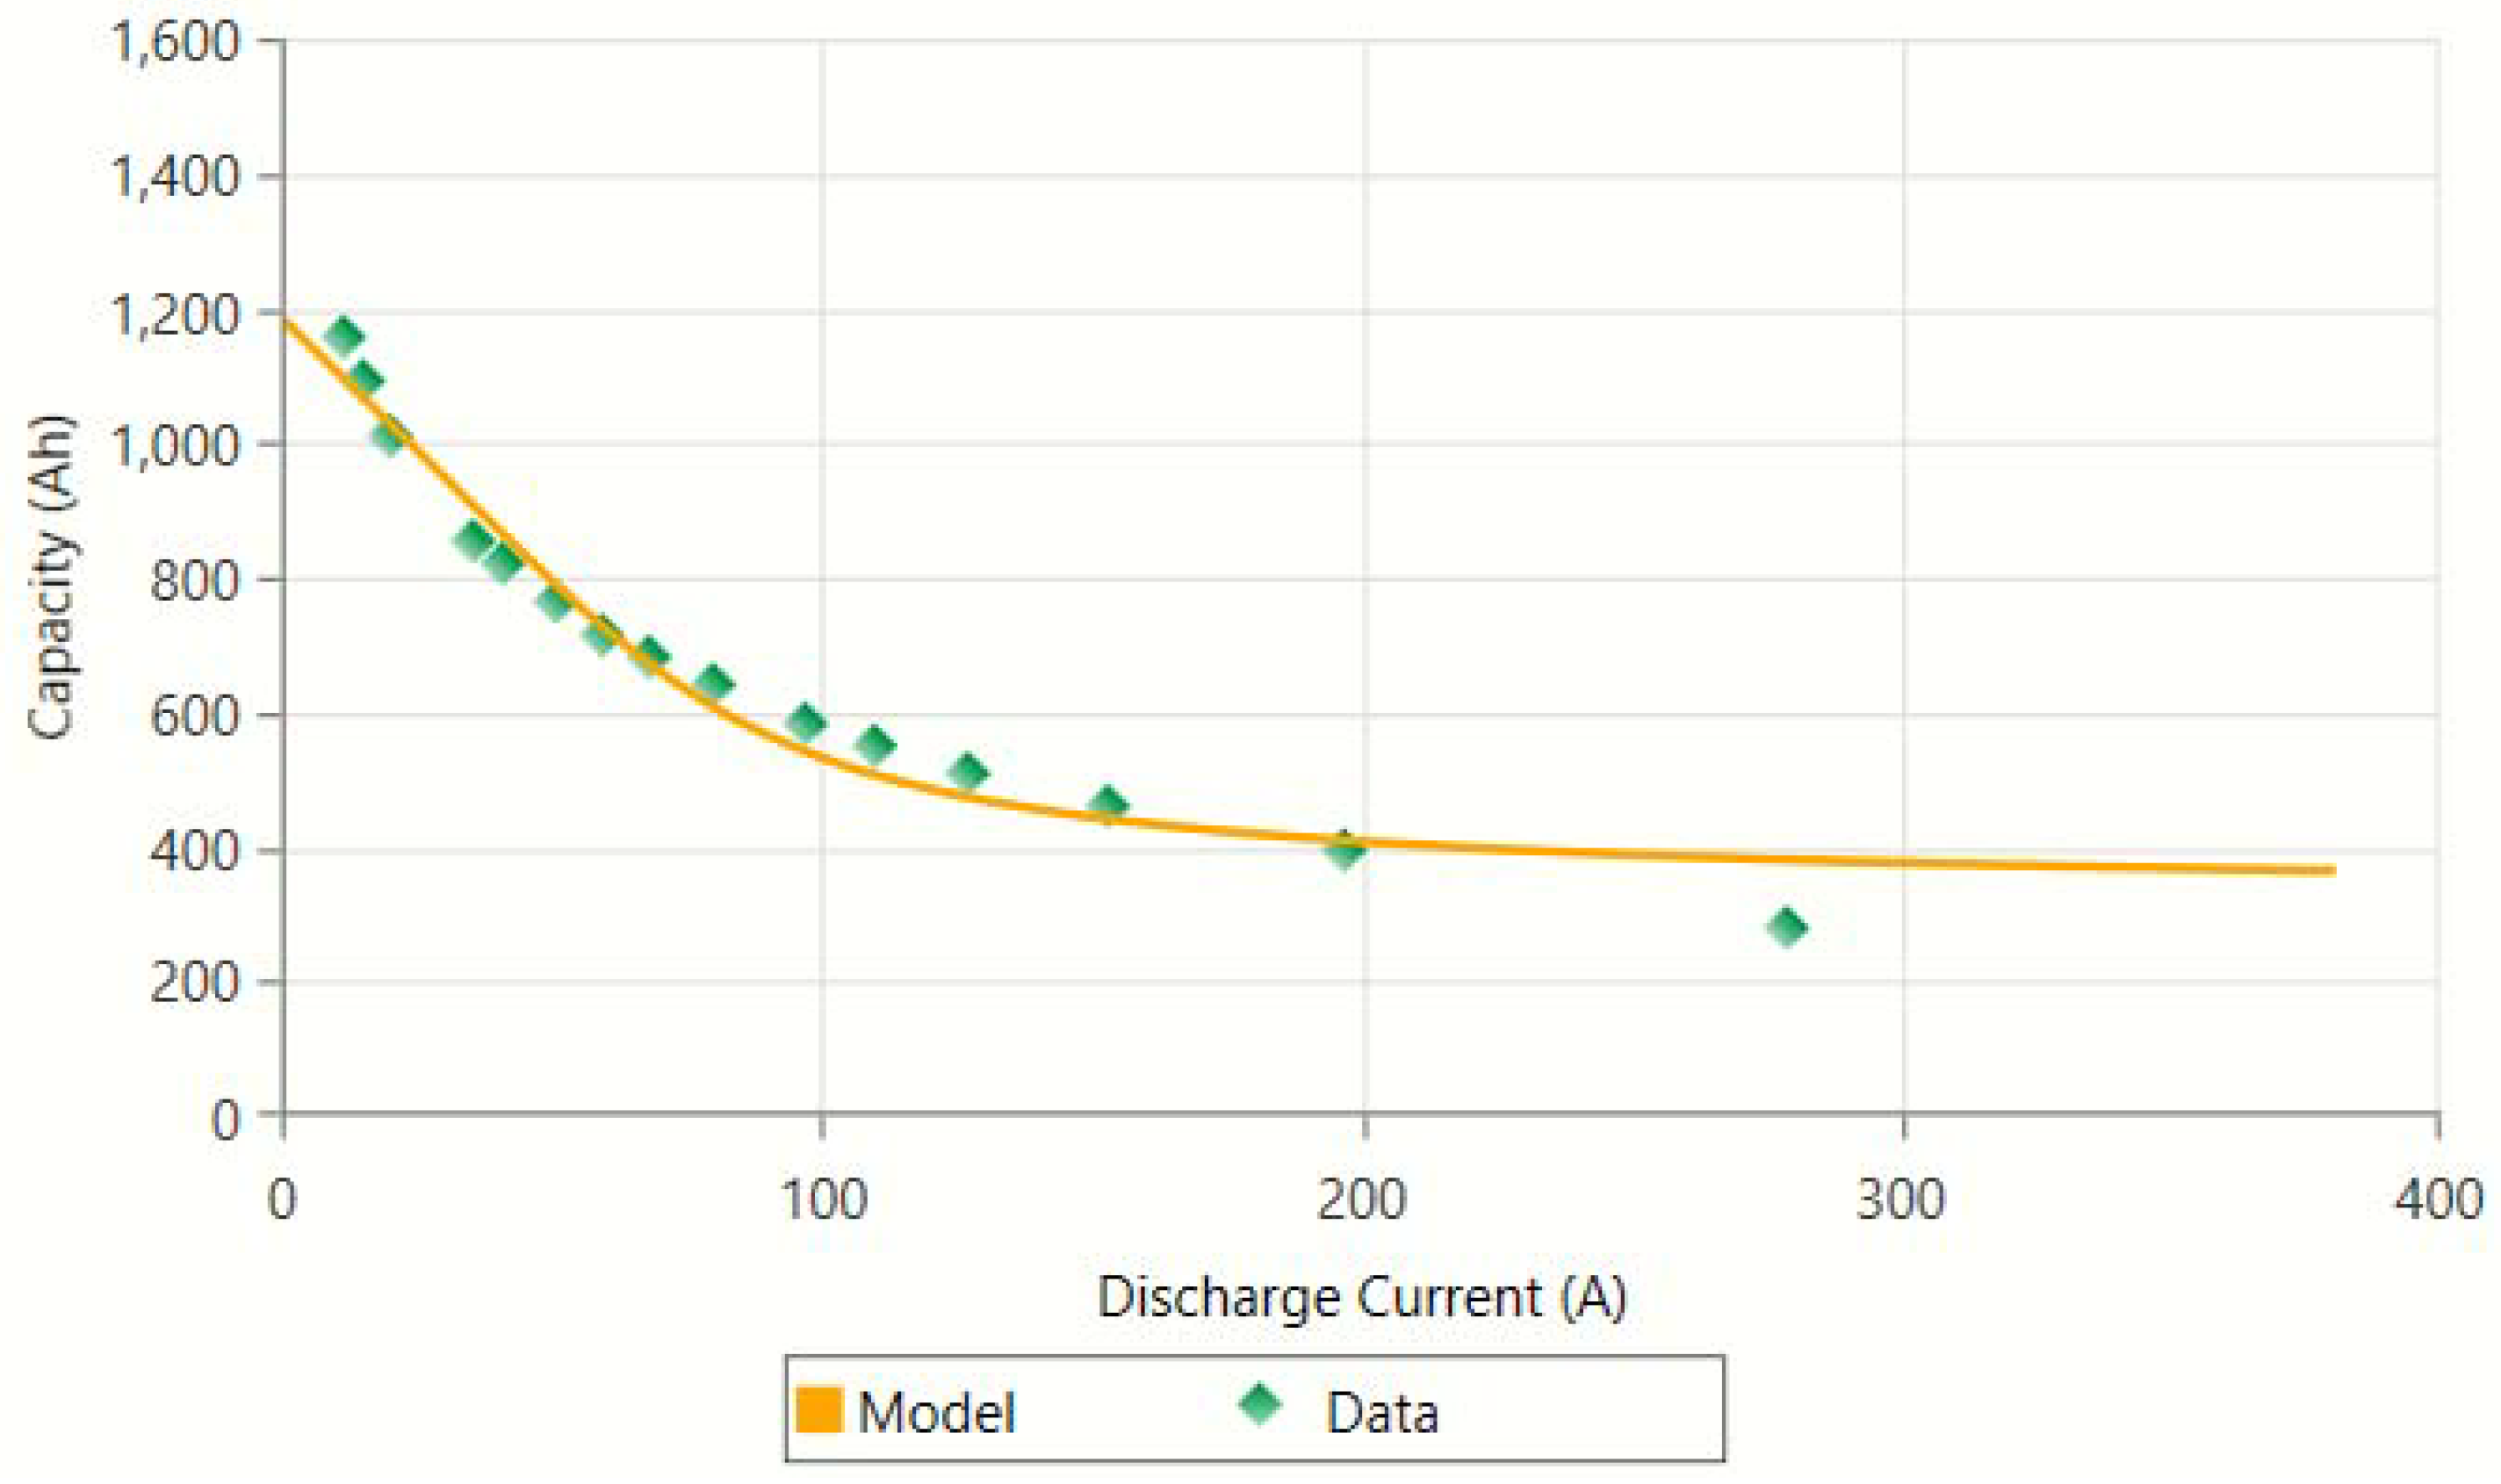
Figure 9.
Capacity curve of Surette 8CS25P battery.
Figure 9.
Capacity curve of Surette 8CS25P battery.
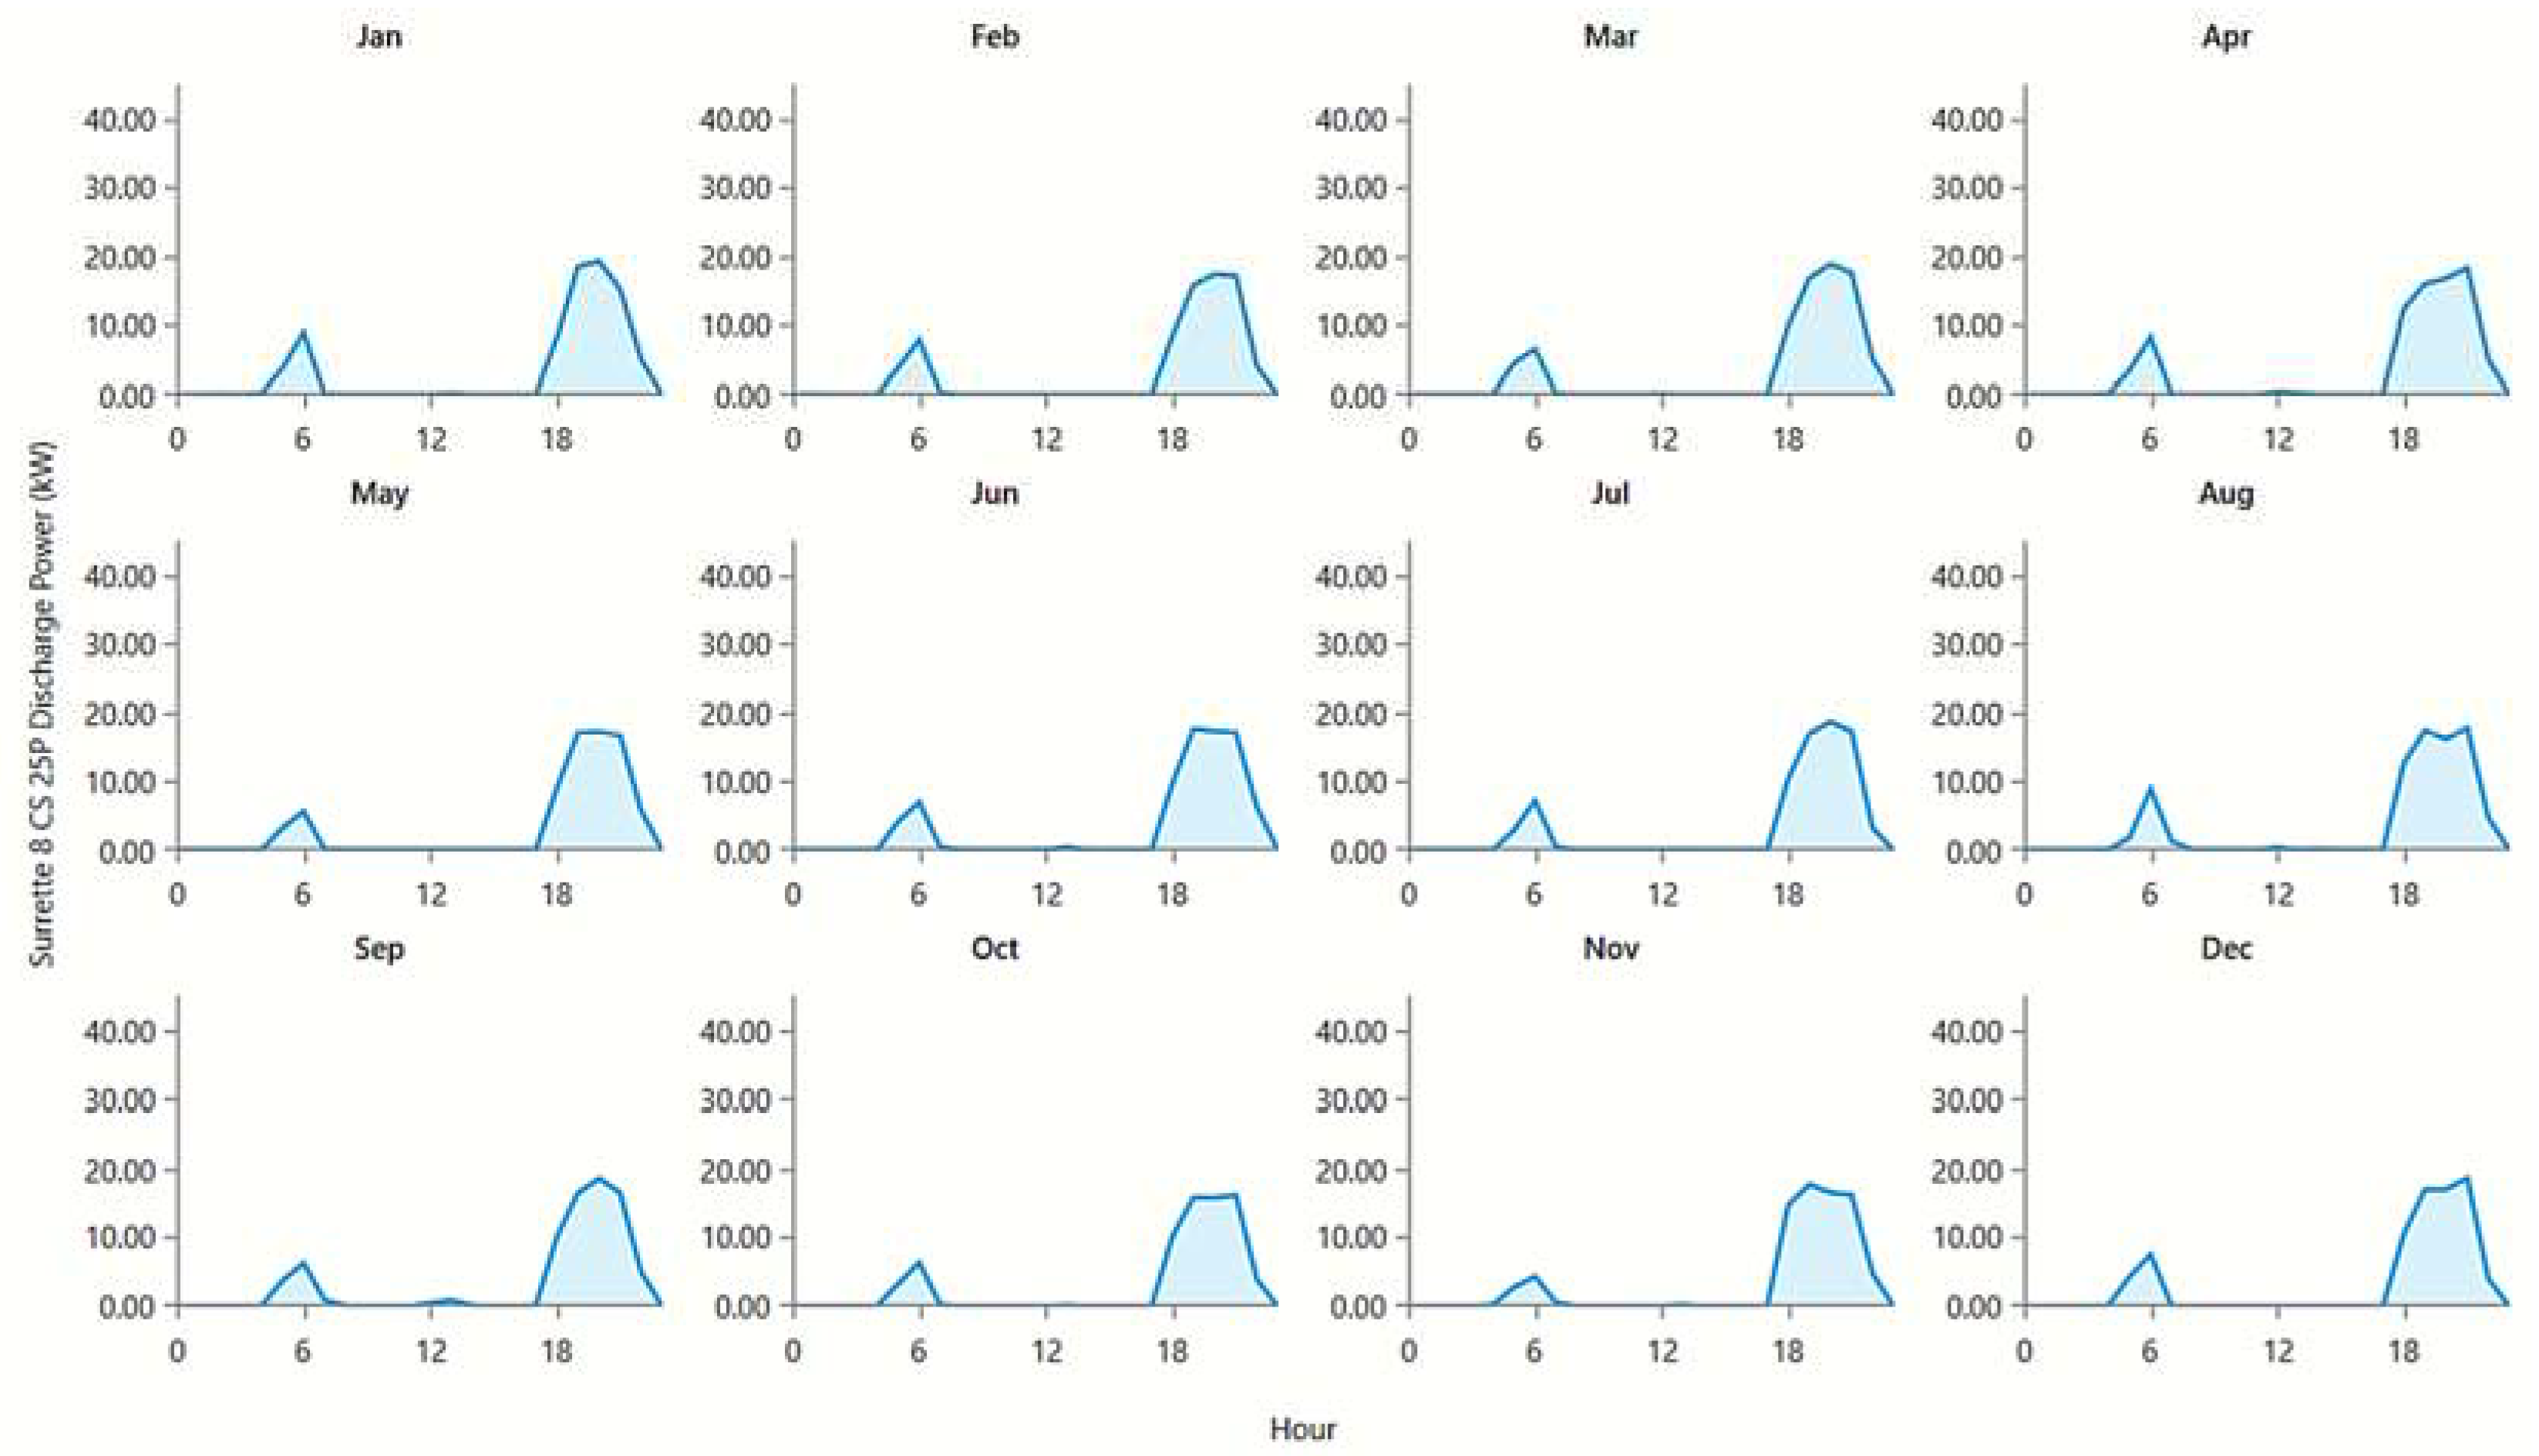
Figure 10.
Average annual monthly discharge power of the battery.
Figure 10.
Average annual monthly discharge power of the battery.
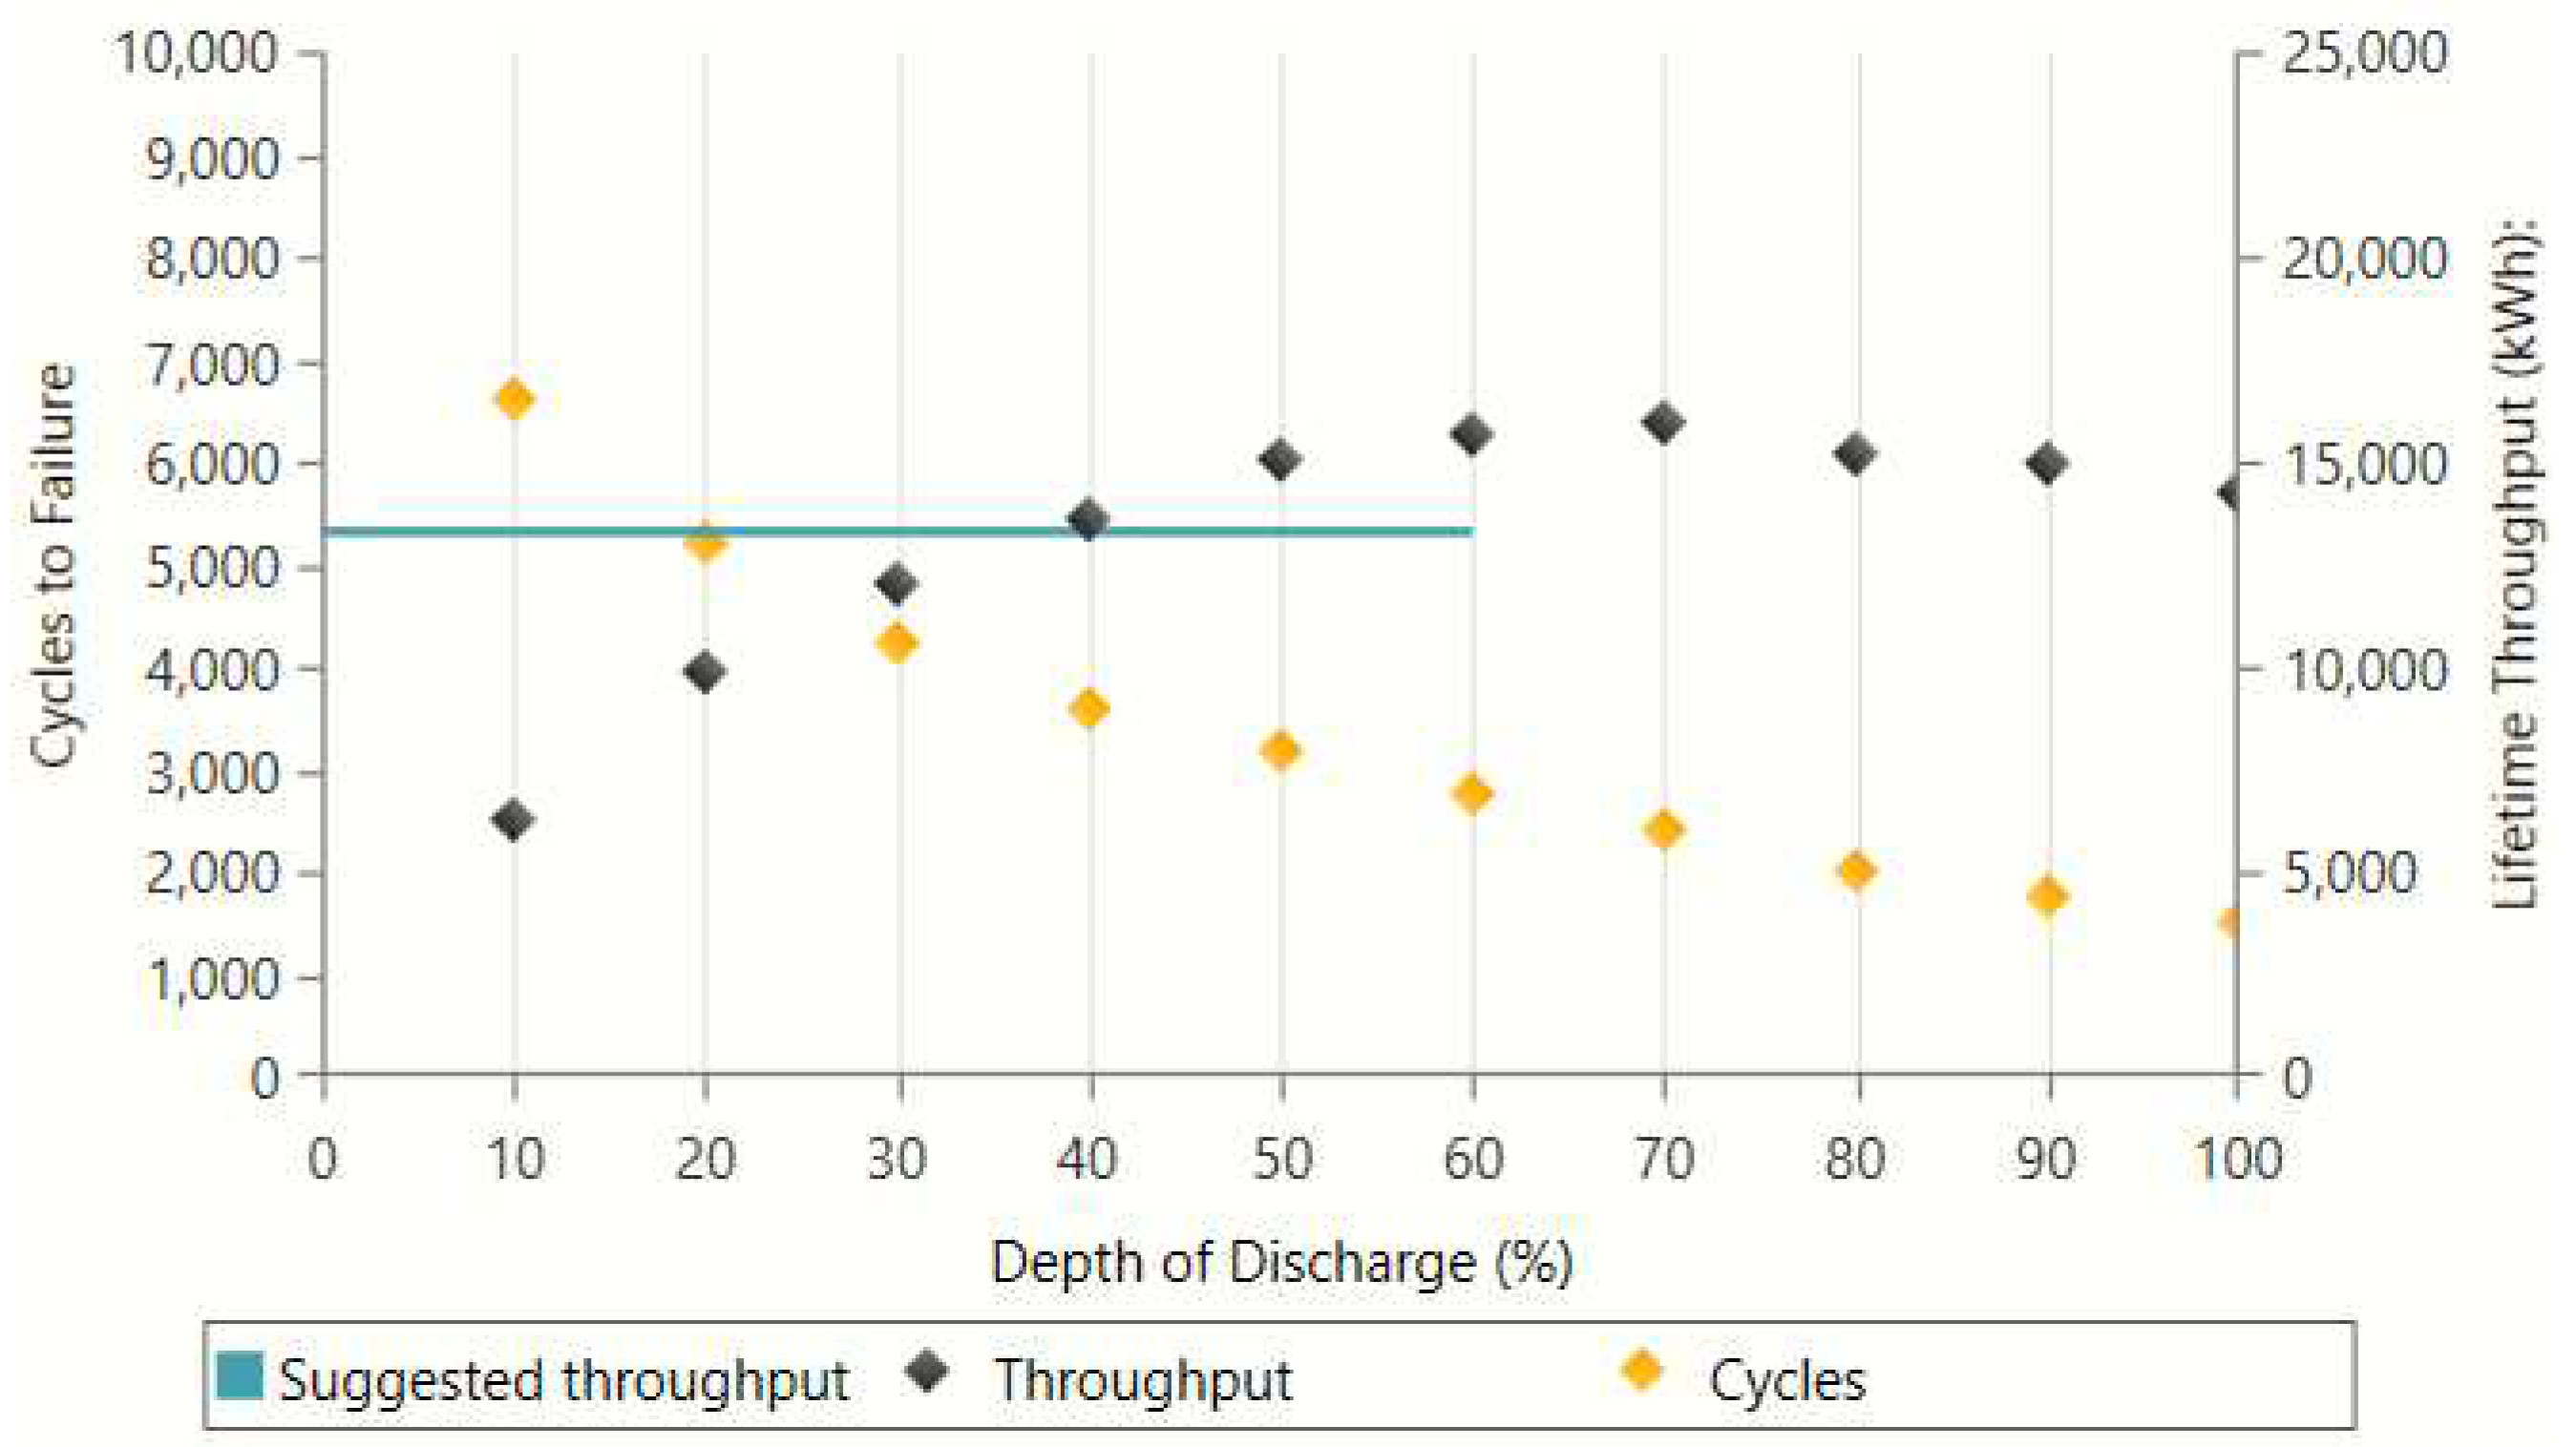
Figure 11.
Lifetime curve of Surette 8CS25P battery.
Figure 11.
Lifetime curve of Surette 8CS25P battery.
Figure 12.
Average monthly electricity production of renewable energy sources.
Figure 12.
Average monthly electricity production of renewable energy sources.
Figure 13.
Electricity generation power output to load.
Figure 13.
Electricity generation power output to load.
Figure 14.
Battery state of charge.
Figure 14.
Battery state of charge.
Figure 15.
Excess electricity and the unmet load of the off-grid microgrid.
Figure 15.
Excess electricity and the unmet load of the off-grid microgrid.
Figure 16.
Average monthly electricity production.
Figure 16.
Average monthly electricity production.
Figure 17.
Excess electricity of grid-connected microgrid.
Figure 17.
Excess electricity of grid-connected microgrid.
Figure 18.
Battery state of charge.
Figure 18.
Battery state of charge.
Figure 19.
Off-grid net present cost summary by cost type.
Figure 19.
Off-grid net present cost summary by cost type.
Figure 20.
Grid-connected net present cost summary by cost type.
Figure 20.
Grid-connected net present cost summary by cost type.
Table 1.
Component specifications.
Table 1.
Component specifications.
| Components |
Parameters |
Specifications |
| PV panel |
Model |
CS6X-325P |
| Nominal maximum power (Pmax) |
325 W |
| Module efficiency |
16.94% |
| Microhydro Turbine/Generator |
Model |
XJ30-20SCTF4/6-Z / SF10-4 |
| Power output |
20 kW |
| Turbine efficiency |
70% |
| Battery |
Model |
8CS25P |
| Nominal voltage |
8 V |
| Nominal capacity |
1156 Ah |
| Converter |
Model |
SUNSYS-PCS2 IM 66TR |
| Rated power |
66 kW |
| Efficiency |
97% |
Table 2.
Cost summary of components.
Table 2.
Cost summary of components.
| Component |
Capacity/Quantity |
Capital cost ($) |
Replacement cost ($) |
O&M cost ($/year) |
| Solar PV |
30 kW |
18000 |
15000 |
500 |
| Micro-hydro |
16 kW |
30000 |
20000 |
3000 |
| Battery |
1 |
1000 |
800 |
50 |
| Converter |
66 kW |
10750 |
3450 |
500 |
Table 3.
Off-grid and Grid-connected HMS configuration.
Table 3.
Off-grid and Grid-connected HMS configuration.
| Scenario 1 |
Scenario 2 |
| Component |
Description |
Component |
Description |
| Micro-hydro system |
20 kW |
Micro-hydro system |
20 kW |
| Solar PV module |
78.6 kW |
Solar PV module |
61.2 kW |
| Battery bank |
427 kWh (45 batteries) |
Battery bank |
285 kWh (30 batteries) |
| Inverter |
45.8 kW |
Inverter |
36.4 kW |
Table 4.
Excess electricity sold to the grid.
Table 4.
Excess electricity sold to the grid.
| Month |
Energy purchased [kWh] |
Energy sold [kWh] |
Peak load [kW] |
Energy charge [$] |
| January |
39 |
8,006 |
10 |
398.39 |
| February |
89 |
6,171 |
17 |
304.13 |
| March |
68 |
6,375 |
22 |
315.33 |
| April |
112 |
6,886 |
24 |
338.70 |
| May |
152 |
6,166 |
24 |
300.66 |
| June |
199 |
5,823 |
21 |
281.18 |
| July |
122 |
4,763 |
22 |
232.03 |
| August |
375 |
4,437 |
32 |
203.08 |
| September |
423 |
4,314 |
27 |
194.54 |
| October |
6 |
5,845 |
4 |
291.94 |
| November |
164 |
6,492 |
20 |
316.38 |
| December |
26 |
5,189 |
21 |
258.14 |
| Annual |
1,776 |
70,466 |
32 |
3,434.50 |
Table 5.
Cost summary and comparison.
Table 5.
Cost summary and comparison.
| Scenarios |
LCOE [$/kWh] |
NPC [$] |
Initial capital cost [$] |
O&M [$/year] |
Replacement cost [$] |
| 1 |
0.101 |
227,307 |
129,605 |
7,558 |
14,448.70 |
| 2 |
0.046 |
145,282 |
102,635 |
3,299 |
12,965.99 |
Table 6.
Comparing the results obtained from this study and previous relevant works.
Table 6.
Comparing the results obtained from this study and previous relevant works.
| Study |
Location |
System Components |
LCOE [$/kWh] |
Specific Energy yield [kWh/kW] |
NPC [$] |
Grid connected |
| This study |
Delta, Nigeria |
PV-microhydro-battery |
0.101 |
1,367 |
$227,307 |
No |
| This study |
Delta, Nigeria |
PV-microhydro-battery |
0.046 |
1,367 |
$145,282 |
Yes |
| Adaramola [23] |
Jos, Nigeria |
PV |
0.103 |
1,674 |
$19,200 |
Yes |
| Adaramola et al [24] |
Jos, Nigeria |
PV-diesel generator-battery |
0.364 |
1,491 |
$3,441,282 |
No |
| Olatomiwa et al [25] |
Nigeria |
PV-wind-diesel |
0.540 |
---- |
$350,000 |
No |
| Olatomiwa et al [26] |
A base transceiver station (BTS) in Kaduna state Nigeria |
PV-wind-diesel-battery |
0.445 |
1,616 |
$69,811 |
No |
