Preprint
Article

Oxidative Stress and Lipid Profile during Acute Phase of COVID-19 Infection and after Recovery: Evidence of a Sequel in LDL

Altmetrics

Downloads

180

Views

93

Comments

0

Submitted:

03 August 2023

Posted:

04 August 2023

You are already at the latest version

Alerts
Abstract
This study aimed to investigate the atherogenicity (quality) of LDL particles in patients with acute and recovered from COVID-19 infection. The participants were adults, aged 18 years or older of both sexes. Those with positive RT-PCR results at baseline were included in the Acute COVID-19 group (n=33), and those with negative RT-PCR six months after acute infection, were included in the Recovered COVID-19 group (n=30). The LDL quality was evaluated using three validated methods: Z-scan, UV-visible spectroscopy, and Lipoprint. The Recovered COVID-19 group showed significantly higher numbers of large LDL particles (less atherogenic) than the Acute COVID-19 group (P<0.05). We also found that COVID-19 infection was associated with the oxidative modification of LDL particles. D-dimer and CRP levels were correlated with Z-scan results and antioxidant-amount estimate. Moreover, we noticed that the infection left a sequel in LDL quality, even after six months of recovery. These findings highlight the importance of monitoring lipids during and after recovery from COVID-19 infection, and their potential deleterious effect on the LDL profile might correlate with the progression of atherosclerosis and poor clinical outcomes.
Keywords: 
Subject: Physical Sciences  -   Other

1. Introduction

COVID-19 and cardiovascular diseases (CVD) share many similar metabolic pathways. Common events observed in CVD, such as thrombosis, dyslipidaemia, inflammation, and oxidation, potentially exert negative impacts on the clinical prognosis of infected COVID-19 patients [1].
Lipids play a key role in viral infection by fusing the viral membrane to the host cell, replicating the virus, and enabling viral endocytosis and exocytosis [1]. Furthermore, viruses like SARS-COV-2 are enveloped by lipid bilayers. Regarding that dyslipidaemia is a common cardiovascular risk factor present in about 39% of patients with CVD [2]. For instance, dyslipidaemia according to The Brazilian Longitudinal Study of Adult Health (ELSA-Brasil) was about 58% [3], and it is plausible that individuals with unbalanced lipid metabolism have an additional risk for a worse COVID-19 prognosis. In fact, numerous studies have shown that patients with COVID-19 infection have lower levels of total cholesterol, low-density lipoprotein cholesterol (LDL-C), high-density lipoprotein cholesterol (HDL-C), and apolipoprotein B (Apo B) and AI (Apo AI) [4,5,6,7,8,9,10]. One study reported that LDL-C levels were significantly lower at the time of admission compared to LDL-C levels before infection and that they returned to pre-infection levels at the time of discharge [5]. Additionally, the lipid profile values of patients who did not survive the COVID-19 infection gradually decreased until death [5]. Researchers found improvements in serum cholesterol levels in recovered COVID-19 patients after 3-6-months of the follow-up time [8]. Despite that, patients under lipid-lowering therapy did not show better clinical outcomes than normal or hypercholesterolemic patients [11,12,13].
Lipoproteins are complex structures containing different lipids, proteins, density, molecular weight, and minor components (antioxidant – tocopherols and polyphenols), that define their functionality [14,15]. Therefore, characteristics of lipoproteins other than lipid content may be involved in COVID-19 infection and prognosis.
It was shown that small and dense LDL (SDLDL) particles are more atherogenic than large and dense LDL (LDLDL) subfractions [16]. SDLDL migrates more easily to the subendothelial layer, where it associates with proteoglycans undergoing additional oxidative modifications and is uptaken by macrophages [17]. Moreover, modified (mainly oxidized) LDL represents about 60% of SDLDL, contributing for the formation of plaques in the arteries [17]. Therefore, qualitative aspects of lipoproteins can be important for COVID-19 infection; however, this needs to be confirmed.
In previous in vitro [18] and in vivo [19,20,21,22] studies, we have shown that the Z-scan experimental technique [23] gives complementary information about atherogenic profile of the LDL. It was shown that there is a positive correlation between the amplitude of the thermal lens (represented by the parameter θ) formed in a LDL solution illuminated by a laser beam, and the antioxidant content in this lipoprotein. Opposite profile was obtained to lipid peroxidation evaluated by Thiobarbituric acid reactive substances (TBARS) assay [21].
To the best of our knowledge, the quality (defined hereafter as: the better the quality of the LDL, the less atherogenic it is) of LDL in COVID-19 patients remains an interesting issue, mainly when different stages of the disease are considered.
Based on this, our aim was to investigate the total lipid profile and the quality of LDL particles, using three validated methods (Z-scan, UV-visible spectroscopy, and the Lipoprint system), which can improve the traditional lipid profile investigation in patients infected by SARS-CoV2. We monitored acute and recovered COVID-19 adult patients who attended a public community hospital located in a low-middle-income area in the city of São Paulo, Brazil.

2. Materials and Methods

2.1. Study population and design

The study population derived from a community-prospective Cohort of COVID-19 patients (n=445) with flu-like symptoms, including more severe cases of pneumonia. These patients were attended in the emergency department care (between February 2020 and March 2021) from a community public secondary hospital, Hospital Universitario (HU) from the University of São Paulo, located in the Butantan region, a low-middle income area in the western region of São Paulo city.
All subjects of both sexes and aged 18 years or older with positive COVID-19 confirmed by RT-PCR (n=445) at hospital admission were potentially considered for inclusion in the present study. From the 445 patients with acute infection due to COVID-19, 90 had plasma available for additional analysis; however, 57 were excluded due to insufficient material to analyze LDL quality. Thus, 33 individuals had their LDL quality evaluated during acute phase (Acute COVID-19 group). Additionally, 30 aleatory individuals had their lipid quality evaluated six months after acute infection (Recovered COVID-19 group). The clinical characteristics of the patients from both groups, at baseline were similar.
The study was approved by the local Research Ethics Committees (Hospital Universitário, Universidade de São Paulo-HU/USP; CAAE: 59599722.9.0000.0076). All procedures followed the ethical principles for medical research involving human subjects as stated in the Declaration of Helsinki and were performed only after the participants signed the informed consent agreement.

2.2. Clinical characteristics

At baseline, clinical information was obtained by direct interview performed by a physician, and 6 months after discharge, the patients’ clinical characteristics were obtained via telephone and direct interviews performed by a trained interviewer. We collected data on sociodemographic and clinical characteristics (sex, age, race, smoking status, alcohol intake, and previous clinical comorbidities such as diabetes mellitus, cardiovascular diseases, severe acute respiratory syndrome, stroke, subarachnoid haemorrhage, and chronic kidney disease).

2.3. Blood samples and LDL purification

Blood samples were collected after 12h of fasting in EDTA-2Na tubes, and plasma was obtained after centrifugation (3000 rpm, 4°C and 15 minutes). Protease inhibitors (10 µg/mL aprotinin, 10 µM benzamidine and 5 µM phenylmethylsulphonyl fluoride - PMSF) and antioxidant (100 µM butylated hydroxytoluene – BHT) were added to the plasma and samples were maintained at -80°C until analysis. LDL was obtained from plasma by preparative sequential ultracentrifugation (55,000 rpm, 4°C and 12h) equipped with a fixed-angle rotor (Hitachi Himac CP 70MX, Tokyo, Japan). The total protein level in LDL was determined using a bicinchoninic acid (BCA) protein commercial assay kit (Pierce, Rockford, IL, USA), with bovine serum albumin as the standard. More details about the LDL separation can be found in our previous works [20,21,24]. All experiments were performed by validated methods and instructions of manufacturers for standard and commercial kits.

2.4. Biochemistry analysis

The concentration of total cholesterol (TC), HDL-C and triglycerides (TG) were determined using a colorimetric assay using the following kits: Cholesterol Liquiform®, Cholesterol HDL® and Triglycerides Liquiform®, respectively (Labtest, Minas Gerais, Brazil). The content of cholesterol in LDL-C was calculated using the formula proposed by Friedewald [25] (1972): LDL-C = (TC – HDL-C) – (TG/5). Additionally, C-reactive protein (CRP) level was measured by nephelometric technology (BN IITM System, Siemens Healthineers, Germany) and D-dimer level by a fully automated coagulation analyzer (Siemens Sysmex® CS-2500), following the manufacturer’s instructions.

2.5. Lipids analyses

2.5.1. Z-scan technique

In order to measure the nonlinear optical properties of LDL samples (1.0 mg/dL), Z-scan technique was used. A focused Gaussian laser beam with a wavelength of 532 nm was used to illuminate the LDL samples. During the process of converting light energy into heat, the sample forms a thermal lens. Several factors determine the strength of a thermal lens, including the thermo-optic coefficient, absorption coefficient, and thermal conductivity. A temperature of 37°C was used for all the Z-scan experiments. The phase shift (i.e., the amplitude of the thermal lens) θ is a dimensionless parameter that measures the strength of the thermal lens is within LDL samples and is related to the peak-to-valley amplitude measured from the normalized transmittance as a function of the z-position of the sample characteristic curve [23]. During the Z-scan setup, a mechanical chopper modulated the light intensity with a square pulse (30 ms pulse width). The samples were scanned around the focal point in the z-direction. The intensity of the transmitted light was measured as a function of the z-position of the sample. The thermal lens strength and LDL particle modifications are proportional to the peak-to-valley amplitude of the characteristic curves.

2.5.2. UV-visible spectroscopy

In UV-visible spectroscopy, a sample can be quantitatively and qualitatively analysed, based on the usual Lambert-Beer expression. Linear absorbance spectra of LDL samples were obtained using quartz cuvettes, with 1 cm optical path, placed in the UV-visible spectrophotometer. The absorption of the sample was calculated by removing the Rayleigh scattering from the extinction spectra, measured with the spectrophotometer. LDL particles are composed of different molecules, which absorbs light in particular wavelengths. ApoB-100, cholesterol, α-tocopherol, and phospholipids, absorbance, mainly, in the range from 200 nm to 300 nm. As the wavelength used in the Z-scan experiment is 532 nm, those molecules do not contribute to the formation of the thermal lens. The wavelength of 484 nm corresponds to one of the broad peaks of the absorbance of carotenoids (antioxidant-amount estimate), which extends to higher wavelengths, reaching 532 nm, used in our experiments. Under these experimental conditions, we are able to evaluate the amount of carotenoids in the LDL particles. All the UV-visible spectroscopy measurements were performed at 37°C.

2.5.3. Lipoprotein subfractions analysis

The LDL subfractions were determined using the Lipoprint® System (Quantimetrix Corporation). First, 25 µL of plasma and 200 µL of a gel containing lipophilic dye were pipetted for LDL analysis. After homogenization (7x), the sample applied to the polyacrylamide gel underwent photopolymerization (30 min), followed by electrophoresis in an electrophoresis buffer. The bands show the relative amount of lipoprotein particles per sample in decreasing order of particle size. From the LDL subfraction kit, one VLDL band, IDL A, B, and C, and seven LDL subfractions were obtained. LDL-1 and 2 were classified as larger and less dense particles (LDLDL). Small dense particles (SDLDL) were identified from the sum of the LDL-3 to 7 subfractions. After the application of the cut-off point based on total LDL size, it was identified the phenotype A (≥ 26.51 nm - less atherogenic), and phenotype B (< 26.5 nm - atherogenic). All results are expressed as a percentage of the area under the curve, adjusted by the total cholesterol content.

2.5.4. Statistical analysis

The median and interquartile ranges (IQR), or mean and standard deviation (±SD), were used to express continuous variables according to their distribution. The normality of the data distribution was examined using the Shapiro-Wilk test. Depending on the distribution of a variable, the Mann-Whitney U test, or T-test was used. The Chi-square test and Fisher’s exact test were used to compare categorical variables. For the analysis of correlations between continuous variables, Spearman’s rank test was used. Statistical analyses were performed using OriginPro 2021 software. Statistical significance was defined as P-value<0.05 for all analyses.

3. Results

3.1. Clinical and Biochemistry parameters

Table 1 shows the results of the clinical parameters of all patients studied at baseline (i.e., when admitted to the hospital). Individuals in both the Acute and Recovered COVID-19 groups had similar profiles, except for D-dimer (1,362 (579-2,201) versus 656 (451-1,529) ng/mL; P=0.0248). Total cholesterol in Acute COVID-19 group was significantly lower than Recovered COVID-19 group (200.7(185.9-213.1) versus 215.4(208.0-220.2) mg/dL; P=0.0017), and similar characteristics were observed for LDL-C (101.6±24.4 versus 115.6±18.1 mg/dL; P=0.021). Tryglycerides (138.5(93.5-173.1) versus 109.3(73.9-171.4) mg/dL; P=0.121) and HDL-C (70.4±21.6 versus 72.3±11.3 mg/dL; P=0.693) showed similar profile between the Acute and Recovered COVID-19 groups.
Results are shown in median (IQR) or n (%) or mean±SD. DM – Diabetes Mellitus; SARS – severe acute respiratory syndrome; SAH – subarachnoid haemorrhage; CVD – cardiovascular diseases; CRP – C-reactive protein. Categorial variables were compared using the Chi-square test or Fisher’s Exact test, and continuous variables using Mann-whitney test or T-test according to the normality distribution. *significant level adopted (P<0.05).

3.2. Z-scan and UV-visible results

Figure 1 shows the typical UV-visible spectroscopy and Z-scan results of a patient from the Acute and Recovered COVID-19 groups. The Acute COVID-19 group shows smaller light absorbance peaks at the visible wavelengths (Figure. 1a) and smaller peak-to-valley amplitude (Figure. 1b) than the one from the Recovered COVID-19 group. This indicates the presence of fewer carotenoids and more modified LDL particles in the individuals from the Acute COVID-19 group, in comparison with the results from the Recovered COVID-19 group.
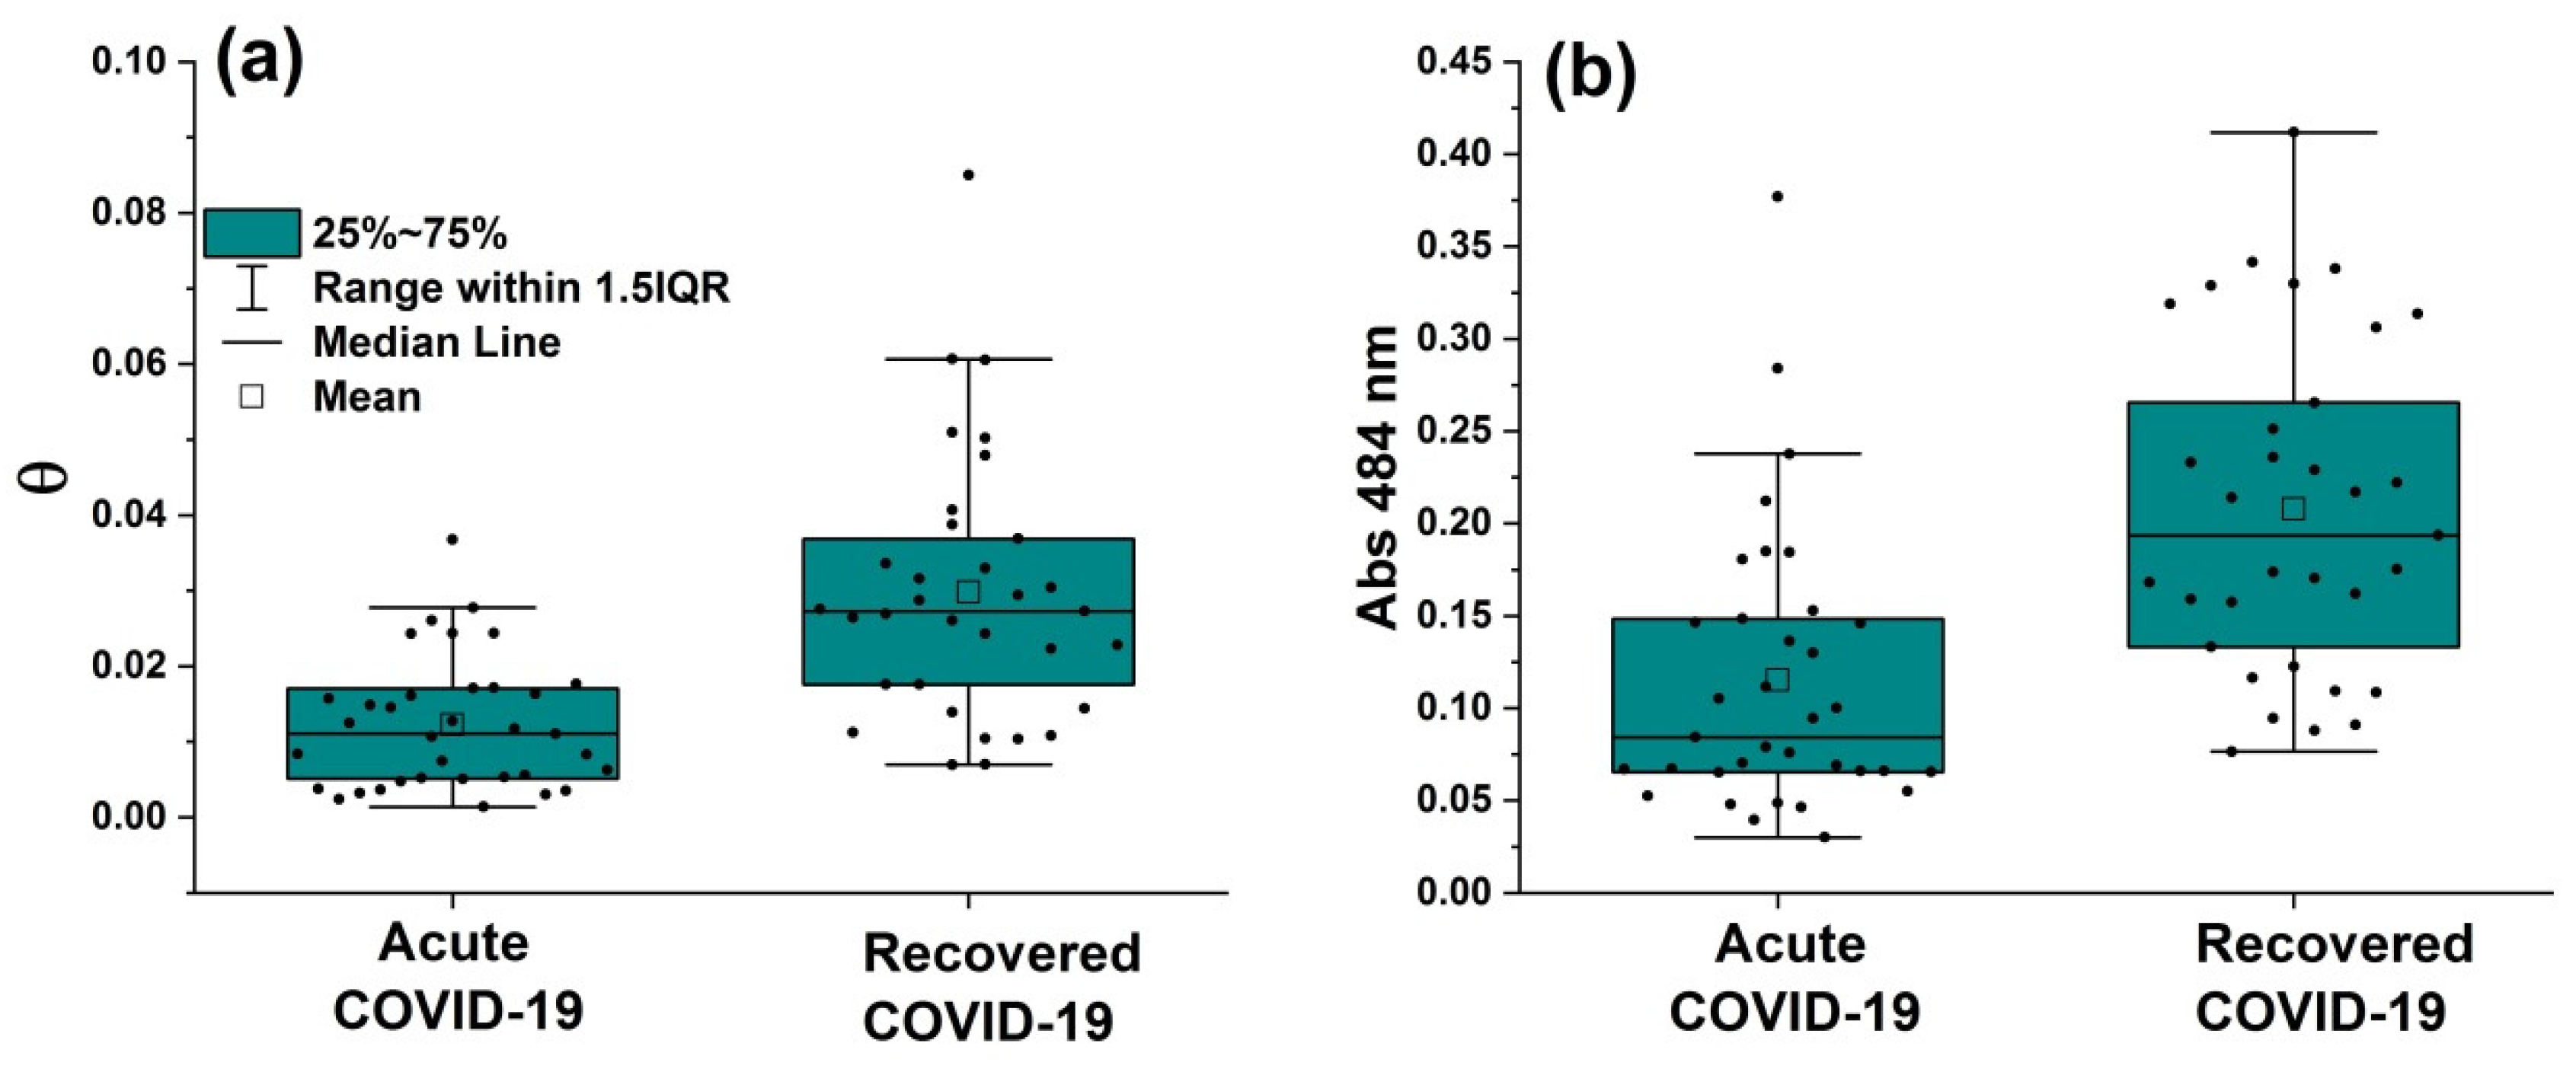
In Figure 2a, the box-plot presents the measurements of the phase shift θ from the Acute and Recovered COVID-19 groups. As discussed elsewhere [18], the smaller the value of θ, the more atherogenic the LDL is. We observed a significant difference in the median value of θ (0.011(0.004-0.017) versus 0.027(0.014-0.039); P<0.001), between the two groups. Figure 2b shows the box-plot of the optical absorbance at wavelength 484 nm of both groups. Median values of this parameter are also significantly lower in the Acute group (0.076(0.054-0.147) versus 0.195(0.121-0.315); P<0.001). The higher the absorbance at 484 nm, the larger the number of carotenoids (antioxidants) in LDL particles.
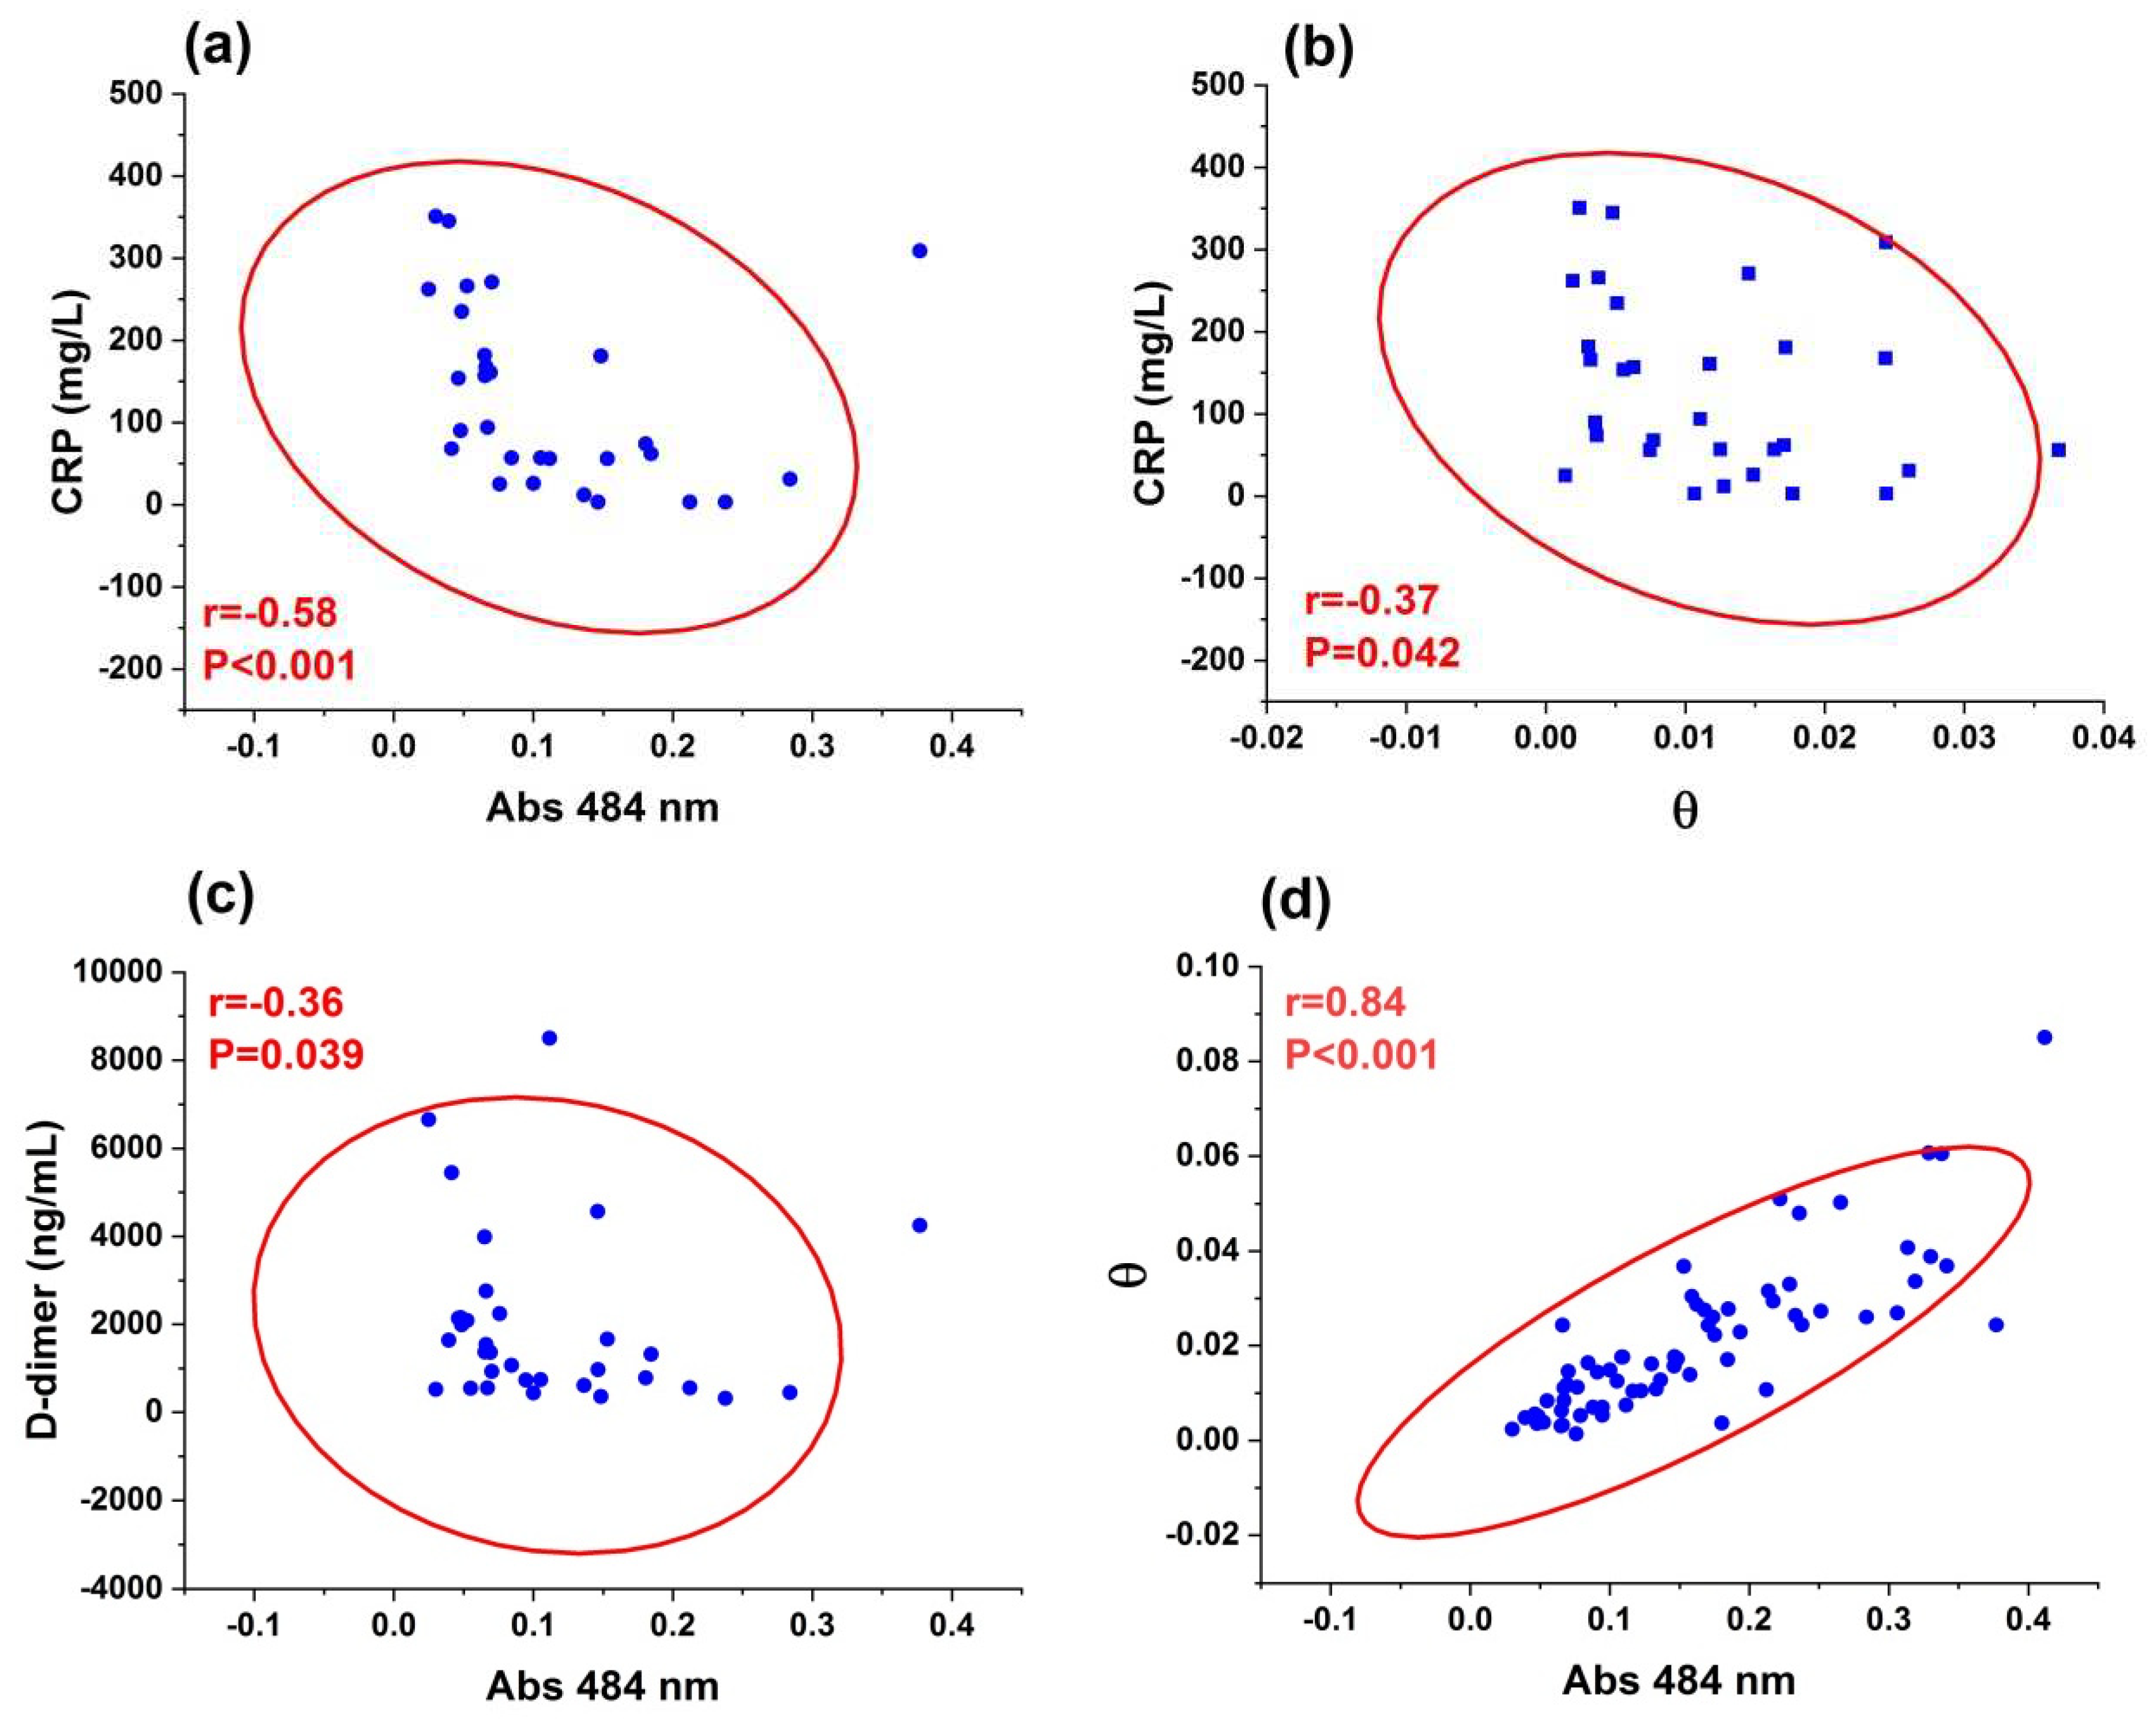
For the Acute COVID-19 group, we found significant positive correlation between the age and CRP level (r=0.42; P=0.02), and significant negative correlation between age and phase shift θ (r=-0.59; P=0.0003). Figure (3a-b) shows significant negative correlation between CRP level and physical parameters, antioxidant-amount (carotenoids) estimate (absorbance at wavelength 484 nm) (r = -0.58; P<0.001) and phase shift θ (r = -0.37; P=0.042) for the Acute COVID-19 group. Figure 3c shows significant negative correlation between D-dimer and antioxidant-amount estimate in the Acute COVID-19 group (r=-0.36; P=0.039). For the Acute and Recovered COVID-19 groups (Figure 3d), a significant positive correlation between the phase shift (θ) and antioxidant-amount estimate (Abs 484 nm) (r=0.84; P<0.001) was observed. The Lipid profile was not correlated with θ and the estimate of the antioxidant amount in the LDL particles.

3.3. Lipoprotein subfractions analysis

The results of LDL subfraction analysis are shown in Table 2. The Recovered COVID-19 group showed significant higher values for LDLDL (% and mg/dL), (P=0.025 and P=0.040; respectively), corresponding to LDL-1 (P=0.009) and LDL-2 (P=0.008), when compared to the Acute COVID-19 group. The mean LDL size did not differ between the Acute and Recovered COVID-19 groups (P=0.336), impacting similar phenotype A (43% versus 41%; P=0.996). Although SDLDL was similar between groups, individuals in the Recovered COVID-19 group had higher LDL-5 (% and mg/dL), (P=0.046 and P=0.039, respectively) and LDL-7 (mg/dL) (P=0.029) than the Acute COVID-19 group.
Lipoprotein subfractions and size were not correlated with θ and the antioxidant-amount estimate; however, a positive correlation between D-dimer and LDL-2 was found (r=0.35; P=0.04) in the Acute COVID-19 group. Moreover, this LDL subfraction was positively correlated with CRP level (r=0.37; P=0.04).

4. Discussion

COVID-19 and lipid metabolism have an interesting relationship which can modify the acute phase and prognosis of the disease. Here, we expand the state-of-the-art addition to traditional lipid profile, data on LDL subfractions and oxidative information of LDL using validated and innovative methods.
Our results showed that the TC and LDL-C concentrations in the Recovered COVID-19 group were higher than those observed in the Acute COVID-19 group, confirming previous studies on the hypocholesterolaemia response associated with COVID-19 infection [1,4,5,6,7]. During the acute phase of infection, the intense viral replication requires cholesterol for the synthesis of new cell membranes [1]. Cholesterol is the main energy source for many viruses, including COVID-19 [1,26]. Uptake of triglycerides by viruses could be another relevant source to supply energy, however, our results were not able to confirm this hypothesis. Both groups, showed TG similar profiles (Acute COVID-19 group = 138.5(93.5-171.1) versus Recovered COVID-19 group =109.3(73.9-171.4); P=0.121). The study by Fan et al. [5] (2020), based on a similar design but including lipid profile prior to the COVID-19 infection, described lower TC and LDL-C levels during the acute phase. Interestingly, in the same study, patients with poor outcomes had lower lipid levels than those observed in the previous stages of infection. Regarding the close relationship between COVID-19 and lipid levels, the potential impact of lipid-lowering drugs has been hypothesized. According to Gil and Ambrose [27] (2021), the intensity of COVID-19 infection can be reduced in individuals with lower TC levels.
Changes in lipid levels are part of an inflammatory storm typical of COVID-19 and a very common event in other viral infections related to SARS [4]. Although we did not perform a wide cytokine panel, the CRP and D-dimer levels used to monitor acute inflammation response and thrombotic risk, respectively, confirmed the proinflammatory status of the Acute COVID-19 group. We observed that these markers were not correlated with TC and LDL-C levels in both groups. The Inflammatory process is a positive stimulus for oxidative stress in different molecules, including LDL particles [28,29,30]. For the last twenty years, we [21,31,32,33] and other groups [34,35] have investigated the relationship between modified LDL level and diseases using different methods. For the first time in the literature, we demonstrated that, in addition to the changes in classical lipid markers, COVID-19 infection is associated with oxidative modification of LDL using the Z-scan technique and antioxidant-amount estimate. In fact, when compared to the Recovered COVID-19 group, individuals during acute COVID-19 phase had lower θ values and antioxidant-amount estimate (from the measurement of Abs 484 nm). This complementary profile was confirmed by positive correlation between them. Inflammatory processes, as well as oxidative stress, may play a relevant role in the severity of COVID-19 [36]. Coronavirus-infected host cells produce more free radicals during infection, which results in severe inflammation [37,38]. The lipid molecules present in LDL are modified (oxidized) by these toxic free radicals [10,39].
Previously, we demonstrated in a transversal study that patients with acute periodontitis had improved LDL quality after treatment, as evaluated by increased peak-to-valley amplitude in the Z-scan characteristic result (θ is proportional to the peak-to-valley amplitude in the Z-scan curve – see, e.g., Figure. 1b) [22,24]. More recently, we observed that diabetes patients, under nutritional supplementation based on green banana biomass (rich in fibers and antioxidants) showed a significant improvement in antioxidant-amount estimate [20]. Low levels of lutein/zeaxanthin, α- and β-carotene, and total carotenoids are strongly related to higher levels of oxidative stress as well as inflammation [40,41]. Despite the potential mechanisms related to and promisors’ results [42,43], there is a gap in controlled and randomized clinical trials testing the supplementation of antioxidant nutrients for the prevention and treatment of COVID-19.
In order to broaden our understanding of the relationship between lipids and COVID-19, we monitored individuals according to LDL subfractions in addition to the oxidative aspects of LDL. The Recovered COVID-19 patients had higher LDLDL than those with acute COVID-19 did. Large, dense LDLs are less atherogenic than smaller LDLs because they transport fewer oxidized lipids and migrate less to the subendothelial space [44,45]. Additionally, large LDLs have high α-tocopherol content and TBARS, as previously demonstrated, suggesting a non-atherogenic profile compared to smaller particles [46]. LDL subfractions were not significantly correlated with θ and antioxidant-amount estimate; however, both subfractions and oxidized LDL, were independently correlated with inflammation (CRP) and prothrombotic event risk (D-dimer). Based on this, we propose that the Z-scan technique and the Lipoprint test can be used as adjuvant methods to better understand the risk of COVID-19 in patients with unbalanced lipid metabolism. Small dense LDL was investigated in the Multi-Ethnic of Atherosclerosis (MESA) and The Atherosclerosis Risk in Communities (ARIC) Study associated with increased cardiovascular risk [47,48]. Small LDL was also found to be involved in the inflammatory pathway in other outcomes, such as elevated thyroid stimulating hormone (TSH) levels, which can correlate to cardiovascular outcomes [49]. In the context of COVID-19, it is important to remember that some patients evolve to thrombotic events; however, the specific risk factors for that are not clear. Previously, a case-control study including acute ischemic stroke (AIS) matched by health individuals verified that an adverse lipoprotein subfraction profile (SDLDL and SDHDL) was a predictor of stroke and mortality [50], and based on that, we speculate that LDL subfractions can improve the traditional estimate of stroke risk in COVID-19 patients. Small LDL (% and mg/dL) were similar in both the Acute and Recovered COVID-19 groups; however, when we evaluated smaller LDLs, the LDL-5 and LDL-7 in Recovered COVID-19 group were higher than those in the Acute COVID-19 group, suggesting a lower thrombotic risk.
A striking finding of our study is that the quality of LDL particles is higher in patients after recovery. In the Recovered COVID-19 group, there is a significant increase in the value of the parameter θ, with respect to the value from the Acute COVID-19 group. This result reveals that the LDL particles from patients in the Recovered COVID-19 group are less modified and better protected against oxidation. This last conclusion comes from the higher number of carotenoids in LDL particles evaluated in patients in the Recovered COVID-19 group.
At this point, an interesting question could be proposed: Is there a sequel, due to COVID-19 infection concerning the quality of the LDL particles in patients diagnosed with severe COVID-19? To shed some light in this direction, one possibility is to compare our present values of θ with those obtained from a group of “healthy” individuals (no diabetes mellitus, no history of cardiovascular diseases, no hypertension, and no smoking), which were investigated in a previous study [22]. As this study was conducted in 2009, the selected individuals were not infected with SARS-CoV-2. The amplitude of the parameter θ (median) from healthy individuals, normalized to the same experimental conditions of the present study, is θH=0.047 (0.028-0.078). The same parameters for the Acute COVID-19 and Recovered COVID-19 groups are θA=0.011 (0.004-0.017) and θR=0.027 (0.014-0.039), respectively. The difference between these three groups is also significant (P<0.001, Kruskal-Wallis ANOVA test, post hoc Dunn’s test (θA versus θH; P<0.001 and θR versus θH; P=0.024)). These numbers bring interesting information about the quality of the LDL particles among these three groups: θARH. Since the quality of the LDL particles in patients recovered from severe COVID-19 infection, after 6 months from the PCR-RT negative result, did not reach the typical value of that characteristic of healthy individuals, a sequel of the infection seems to be present. The follow-up of these patients with time may inform about the recovery of them with respect to this aspect.

5. Conclusions

In conclusion, the quality of LDL particles in COVID-19 patients improved after recovery. The significant increase in physical parameters (θ and absorbance at 484 nm) after recovery of COVID-19 patients, as well as increasing large LDL subfraction observed by Lipoprint experiment, supports this finding. Moreover, comparing our present results with those from previous experiments, we noticed that the infection left a sequel in the quality of LDL, even after 6 months of recovery. These findings highlight the importance of monitoring lipids during and after recovery from intense inflammatory states, such as COVID-19 infection, due to potential deleterious effects in the LDL profile that might corroborate the progression of atherosclerosis, resulting in poor clinical cardiovascular outcomes.

Author Contributions

ZL: Made the absorption, Z-scan measurements and the data analysis. Participate in the discussion of the results and writing the manuscript. Performed the statistical analysis. LSN: Participate in the absorption and Z-scan measurements, collection of blood, separation of the LDL and discussion of the results. AFM: Participate in the design of the experiment and collection of blood separation of the LDL. MCPF: Performed the Lipoprint measurements, participate in the blood collection. ACV: Collected data and built the dataset, approved the final version. PAL: Developed the design and concept of study, dataset supervision and approved the final version of manuscript. ACG: Participate in the design of the experiment, responsible for the clinical data and cohort. Participate in the data analysis and writing of the manuscript. NRTD: Participate in the design of the experiment, responsible for the Lipoprint experiments. Participate in the data analysis and writing of the manuscript. JBA: participate in the collection of blood samples, design of the experiments and cohort. RAF: Participate in the collection of blood samples, design of the experiments and cohort. AMFN: Responsible for the absorption and Z-scan experiments, participate in the design of the experiment, discussion of the results and writing of the manuscript.

Funding

This research was funded from INCT/CNPq (Conselho Nacional de Desenvolvimento Científico e Tecnológico; Grant numbers: 465259/2014-6 and 303001/2019-4), INCT/FAPESP (Fundação de Amparo à Pesquisa do Estado de São Paulo; Grant Number: 14/50983-3), INCT/CAPES (Coordenação de Aperfeiçoamento de Pessoal de Nível Superior; Grant number: 88887.136373/2017-00), FAPESP (Thematic Project; Grant 2016/24531-3), and INCT-FCx (Instituto Nacional de Ciência e Tecnologia de Fluidos Complexos).

Institutional Review Board Statement

The study was approved by the local Research Ethics Committees (Hospital Universitário, Universidade de São Paulo-HU/USP; CAAE: 59599722.9.0000.0076). All procedures followed the ethical principles for medical research involving human subjects as stated in the Declaration of Helsinki and were performed only after the participants signed the informed consent agreement.

Data Availability Statement

The data can be made available from authors upon request.

Conflicts of Interest

The authors declare no conflict of interest.

References

  1. Abu-Farha, M.; Thanaraj, T.A.; Qaddoumi, M.G.; Hashem, A.; Abubaker, J.; Al-Mulla, F. The role of lipid metabolism in COVID-19 virus infection and as a drug target. Int. J. Mol. Sci. 2020, 21, 3544. [Google Scholar] [CrossRef] [PubMed]
  2. Pirillo, A.; Casula, M.; Olmastroni, E.; Norata, G.D.; Catapano, A.L. Global epidemiology of dyslipidaemias. Nat. Rev. Cardiol. 2021, 18, 689–700. [Google Scholar] [CrossRef] [PubMed]
  3. Santos, R.D.; Bensenor, I.M.; Pereira, A.C.; Lotufo, P.A. Dyslipidemia according to gender and race: the Brazilian Longitudinal Study of Adult Health (ELSA-Brasil). J. Clin. Lipidol. 2016, 10, 1362–1368. [Google Scholar] [CrossRef] [PubMed]
  4. Wei, X.; Zeng, W.; Su, J.; Wan, H.; Yu, X.; Cao, X.; Tan, W.; Wang, H. Hypolipidemia is associated with the severity of COVID-19. J. Clin. Lipidol. 2020, 14, 297–304. [Google Scholar] [CrossRef]
  5. Fan, J.; Wang, H.; Ye, G.; Cao, X.; Xu, X.; Tan, W.; Zhang, Y. Low-density lipoprotein is a potential predictor of poor prognosis in patients with coronavirus disease 2019. Metab. 2020, 107, 154243. [Google Scholar] [CrossRef]
  6. Feingold, K.R. Lipid and lipoprotein levels in patients with COVID-19 infections. 2020, MDText.com, Inc., South Dartmouth (MA). https://www.ncbi.nlm.nih.gov/sites/books/NBK564657/.
  7. Jin, X.; Yang, S.; Lu, J.; Wu, M. Small, dense low-density lipoprotein-cholesterol and atherosclerosis: relationship and therapeutic strategies. Front. Cardiovasc. Med. 2022, 8, 1–14. [Google Scholar] [CrossRef]
  8. Li, G.; Du, L.; Cao, X.; Wei, X.; Jiang, Y.; Lin, Y.; Nguyen, V.; Tan, W.; Wang, H. Follow-up study on serum cholesterol profiles and potential sequelae in recovered COVID-19 patients. BMC Infect. Dis. 2021, 21, 1–10. [Google Scholar] [CrossRef]
  9. Changaripour, S.; Sarvazad, H.; Barghi, M.; Sajadi, E.; Sadeghian, M.H.; Roozbahani, N.E. Lipid profile changes in patients with COVID-19 referred to medical centers in Kermanshah, Iran; a case–control study. J. Int. Med. Res. 2022, 85, 1543–1553. [Google Scholar] [CrossRef]
  10. Ganesan, A.; Gopalakrishnan, S.; Purandhar, S. A study of relationship between lipid profile and severity of SARS-CoV-2. Rom J Diabetes Nutr Metab Dis 2022, 29, 289–292. [Google Scholar]
  11. Novack, V.; Eisinger, M.; Frenkel, A.; Terblanche, M.; Adhikari, N.K.; Douvdevani, A.; Amichay, D.; Almog, Y. The effects of statin therapy on inflammatory cytokines in patients with bacterial infections: a randomized double-blind placebo controlled clinical trial. Intensive Care Med INTENS 2009, 35, 1255–1260. [Google Scholar] [CrossRef]
  12. Papazian, L.; Roch, A.; Charles, P.E.; Penot-Ragon, C.; Perrin, G.; Roulier, P.; Goutorbe, P.; Lefrant, J.Y.; Wiramus, S.; Jung, B.; Perbet, S. Effect of statin therapy on mortality in patients with ventilator-associated pneumonia: a randomized clinical trial. Jama 2013, 310, 1692–1700. [Google Scholar] [CrossRef]
  13. Pertzov, B.; Eliakim-Raz, N.; Atamna, H.; Trestioreanu, A.Z.; Yahav, D.; Leibovici, L. Hydroxymethylglutaryl-CoA reductase inhibitors (statins) for the treatment of sepsis in adults–a systematic review and meta-analysis. Clin. Microbiol. Infect. 2019, 25, 280–289. [Google Scholar] [CrossRef] [PubMed]
  14. Otvos, J.D.; Mora, S.; Shalaurova, I.; Greenland, P.; Mackey, R.H.; Goff Jr, D.C. Clinical implications of discordance between low-density lipoprotein cholesterol and particle number. J. Clin. Lipidol. 2011, 5, 105–113. [Google Scholar] [CrossRef] [PubMed]
  15. Packard, C.; Caslake, M.; Shepherd, J. The role of small, dense low density lipoprotein (LDL): a new look. Int. J. Cardiol. 2000, 74, S17–S22. [Google Scholar] [CrossRef] [PubMed]
  16. Ivanova, E.A.; Myasoedova, V.A.; Melnichenko, A.A.; Grechko, A.V.; Orekhov, A.N. Small dense low-density lipoprotein as biomarker for atherosclerotic diseases. Oxidative Med. Cell. Longev. 2017, 2017, 1–10. [Google Scholar] [CrossRef] [PubMed]
  17. Mello, A.P.Q.; da Silva, I.T.; Abdalla, D.S.P.; Damasceno, N.R.T. Electronegative low-density lipoprotein: origin and impact on health and disease. Atherosclerosis 2011, 215, 257–265. [Google Scholar] [CrossRef]
  18. de Queiroz Mello, A.P.; Albattarni, G.; Espinosa, D.H.; Reis, D.; Figueiredo Neto, A.M. Structural and Nonlinear Optical Characteristics of In Vitro Glycation of Human Low-Density Lipoprotein, as a Function of Time. Braz. J. Phys. 2018, 48, 560–570. [Google Scholar] [CrossRef]
  19. Monteiro, A.M.; Jardini, M.A.; Giampaoli, V.; Alves, S.; Figueiredo Neto, A.M.; Gidlund, M. Measurement of the nonlinear optical response of low-density lipoprotein solutions from patients with periodontitis before and after periodontal treatment: evaluation of cardiovascular risk markers. J. Biomed. Opt. 2012, 17, 115004. [Google Scholar] [CrossRef]
  20. Lotfollahi, Z.; Mello, A.P.D.Q.; Costa, E.S.; Oliveira, C.L.; Damasceno, N.R.; Izar, M.C.; Neto, A.M.F. Green-banana biomass consumption by diabetic patients improves plasma low-density lipoprotein particle functionality. Sci. Rep. 2020, 10, 1–11. [Google Scholar] [CrossRef]
  21. Lotfollahi, Z.; Mello, A.P.; Fonseca, F.A.; Machado, L.O.; Mathias, A.F.; Izar, M.C.; Damasceno, N.R.; Oliveira, C.L.; Neto, A.M.F. Changes in lipoproteins associated with lipid-lowering and antiplatelet strategies in patients with acute myocardial infarction. PloS one 2022, 17, e0273292. [Google Scholar] [CrossRef]
  22. Monteiro, A.M.; Jardini, M.A.; Alves, S.; Giampaoli, V.; Aubin, E.C.; Figueiredo Neto, A.M.; Gidlund, M. Cardiovascular disease parameters in periodontitis. J. Periodontol. 2009, 80, 378–388. [Google Scholar] [CrossRef] [PubMed]
  23. Alves, S.; Figueiredo Neto, A.M. Advances in the non-linear optical investigation of lyotropic-like low-density human lipoproteins in the native and oxidised states. Liq. Cryst. 2014, 41, 465–470. [Google Scholar] [CrossRef]
  24. Pedroso, J.D.F.; Lotfollahi, Z.; Albattarni, G.; Arrruda Schulz, M.; Monteiro, A.; Sehnem, A.L.; Gidlund, M.A.; Figueiredo Neto, A.M.; Jardini, M.A.N. Influence of Periodontal Disease on cardiovascular markers in Diabetes Mellitus patients. Sci. Rep. 2019, 9, 1–9. [Google Scholar] [CrossRef]
  25. Friedewald, W.T.; Levy, R.I.; Fredrickson, D.S. Estimation of the concentration of low-density lipoprotein cholesterol in plasma, without use of the preparative ultracentrifuge. Clin. Chem. 1972, 18, 499–502. [Google Scholar] [CrossRef]
  26. Sanders, D.W.; Jumper, C.C.; Ackerman, P.J.; Bracha, D.; Donlic, A.; Kim, H.; Kenney, D.; Castello-Serrano, I.; Suzuki, S.; Tamura, T.; Tavares, A.H. SARS-CoV-2 requires cholesterol for viral entry and pathological syncytia formation. Elife 2021, 10, e65962. [Google Scholar] [CrossRef] [PubMed]
  27. Gill, M.R.S.; Ambrose, J.A. COVID-19 Infection and Myocardial Infarction Pathophysiology and Therapy. CARDIOLOGY 2021, 99. [Google Scholar]
  28. Rhoads, J.P.; Major, A.S. How oxidized low-density lipoprotein activates inflammatory responses. CRC crit. rev. immunol. 2018, 38, 333–342. [Google Scholar] [CrossRef]
  29. Tekin, I.O.; Orem, A.; Shiri-Sverdlov, R. Oxidized LDL in inflammation: from bench to bedside. Mediators Inflamm. 2013, 2013, 762759. [Google Scholar] [CrossRef]
  30. Memon, R.A.; Staprans, I.; Noor, M.; Holleran, W.M.; Uchida, Y.; Moser, A.H.; Feingold, K.R.; Grunfeld, C. Infection and inflammation induce LDL oxidation in vivo. Arterioscler. Thromb. Vasc. Biol. 2000, 20, 1536–1542. [Google Scholar] [CrossRef]
  31. Silva, I.T.; Mello, A.P.; Damasceno, N.R. Antioxidant and inflammatory aspects of lipoprotein-associated phospholipase A2 (Lp-PLA2): a review. Lipids Health Dis. 2011, 10, 1–10. [Google Scholar] [CrossRef]
  32. de Freitas, M.C.P.; Neto, A.M.F.; Damasceno, N.R. Nonlinear optical responses of oxidized low-density lipoprotein: Cutoff point for z-scan peak-valley distance. Photodiagnosis Photodyn Ther. 2020, 30, 101689. [Google Scholar] [CrossRef] [PubMed]
  33. da Silva, I.T.; de Queiroz Mello, A.P.; Sanches, L.B.; Abdalla, D.S.P.; Damasceno, N.R.T. Is plasma alpha-tocopherol associated with electronegative LDL in obese adolescents? J. Nutr. Sci. Vitaminol. 2013, 59, 100–107. [Google Scholar] [CrossRef] [PubMed]
  34. Kim, H.K.; Hong, J.; Ahn, S.; Lee, W.; Chun, S.; Min, W.K. Association between measured or calculated small dense low-density lipoprotein cholesterol and oxidized low-density lipoprotein in subjects with or without type 2 diabetes mellitus. J. Clin. Lab. Anal. 2022, 37, e24807. [Google Scholar] [CrossRef]
  35. Pfützner, A.; Efstrathios, K.; Löbig, M.; Armbruster, F.P.; Hanefeld, M.; Forst, T. Differences in the results and interpretation of oxidized LDL cholesterol by two ELISA assays--an evaluation with samples from the PIOstat study. Clin. Lab. 2009, 55, 275–281. [Google Scholar] [PubMed]
  36. Erol, A. Role of oxidized LDL-induced “trained macrophages” in the pathogenesis of COVID-19 and benefits of pioglitazone: A hypothesis. Diabetes Metab. Syndr. 2020, 14, 713–714. [Google Scholar] [CrossRef] [PubMed]
  37. Stringer, D.; Braude, P.; Myint, P.K.; Evans, L.; Collins, J.T.; Verduri, A.; Quinn, T.J.; Vilches-Moraga, A.; Stechman, M.J.; Pearce, L.; Moug, S. The role of C-reactive protein as a prognostic marker in COVID-19. Int. J. Epidemiol. 2021, 50, 420–429. [Google Scholar] [CrossRef]
  38. Wu, J. Tackle the free radicals damage in COVID-19. Nitric Oxide. 2020, 102, 39–41. [Google Scholar] [CrossRef]
  39. Chernyak, B.V.; Popova, E.N.; Prikhodko, A.S.; Grebenchikov, O.A.; Zinovkina, L.A.; Zinovkin, R.A. COVID-19 and oxidative stress. Biochem. (Mosc.) 2020, 85, 1543–1553. [Google Scholar] [CrossRef]
  40. Walston, J.; Xue, Q.; Semba, R.D.; Ferrucci, L.; Cappola, A.R.; Ricks, M.; Guralnik, J.; Fried, L.P. Serum antioxidants, inflammation, and total mortality in older women. Am. J. Epidemiol. 2006, 163, 18–26. [Google Scholar] [CrossRef]
  41. Johra, F.T.; Bepari, A.K.; Bristy, A.T.; Reza, H.M. A mechanistic review of β-carotene, lutein, and zeaxanthin in eye health and disease. Antioxidants 2020, 9, 1046. [Google Scholar] [CrossRef]
  42. Bae, M.; Kim, H. The role of vitamin C, vitamin D, and selenium in immune system against COVID-19. Molecules 2020, 25, 5346. [Google Scholar] [CrossRef] [PubMed]
  43. Iddir, M.; Brito, A.; Dingeo, G.; Fernandez Del Campo, S.S.; Samouda, H.; La Frano, M.R.; Bohn, T. Strengthening the immune system and reducing inflammation and oxidative stress through diet and nutrition: considerations during the COVID-19 crisis. Nutrients 2020, 12, 1562. [Google Scholar] [CrossRef] [PubMed]
  44. Griffin, B.A. Lipoprotein atherogenicity: an overview of current mechanisms. Proc. Nutr. Soc. 1999, 58, 163–169. [Google Scholar] [CrossRef] [PubMed]
  45. Taskinen, M.-R. LDL-cholesterol, HDL-cholesterol or triglycerides—which is the culprit? Diabetes Res. Clin. Pract. 2003, 61, S19–S26. [Google Scholar] [CrossRef]
  46. Perugini, C.; Seccia, M.; Bagnati, M.; Cau, C.; Albano, E.; Bellomo, G. Different mechanisms are progressively recruited to promote Cu (II) reduction by isolated human low-density lipoprotein undergoing oxidation. Free Radic. Biol. Med. 1998, 25, 519–528. [Google Scholar] [CrossRef] [PubMed]
  47. Tsai, M.Y.; Steffen, B.T.; Guan, W.; McClelland, R.L.; Warnick, R.; McConnell, J.; Hoefner, D.M.; Remaley, A.T. New automated assay of small dense low-density lipoprotein cholesterol identifies risk of coronary heart disease: the Multi-ethnic Study of Atherosclerosis. Arterioscler. Thromb. Vasc. Bio. 2014, 34, 196–201. [Google Scholar] [CrossRef]
  48. Hoogeveen, R.C.; Gaubatz, J.W.; Sun, W.; Dodge, R.C.; Crosby, J.R.; Jiang, J.; Couper, D.; Virani, S.S.; Kathiresan, S.; Boerwinkle, E.; Ballantyne, C.M. Small dense low-density lipoprotein-cholesterol concentrations predict risk for coronary heart disease: the Atherosclerosis Risk in Communities (ARIC) study. Arterioscler. Thromb. Vasc. Bio. 2014, 2014. 34, 1069–1077. [Google Scholar] [CrossRef]
  49. Janovsky, C.C.P.S.; Goulart, A.C.; Generoso, G.; Santos, R.D.; Blaha, M.J.; Jones, S.; Toth, P.P.; Lotufo, P.A.; Bittencourt, M.S.; Benseñor, I.M. Substantially elevated TSH, not traditional clinical subclinical thyroid disorder groupings, are associated with smaller LDL-P mean size: ELSA-Brasil. J. Clin. Lipidol. 2022, 16, 335–344. [Google Scholar] [CrossRef]
  50. Zeljkovic, A.; Vekic, J.; Spasojevic-Kalimanovska, V. Jelic-Ivanovic, Z.; Bogavac-Stanojevic, N.; Gulan, B.; Spasic, S. LDL and HDL subclasses in acute ischemic stroke: prediction of risk and short-term mortality. Atherosclerosis 2010, 210, 548–554. [Google Scholar] [CrossRef]
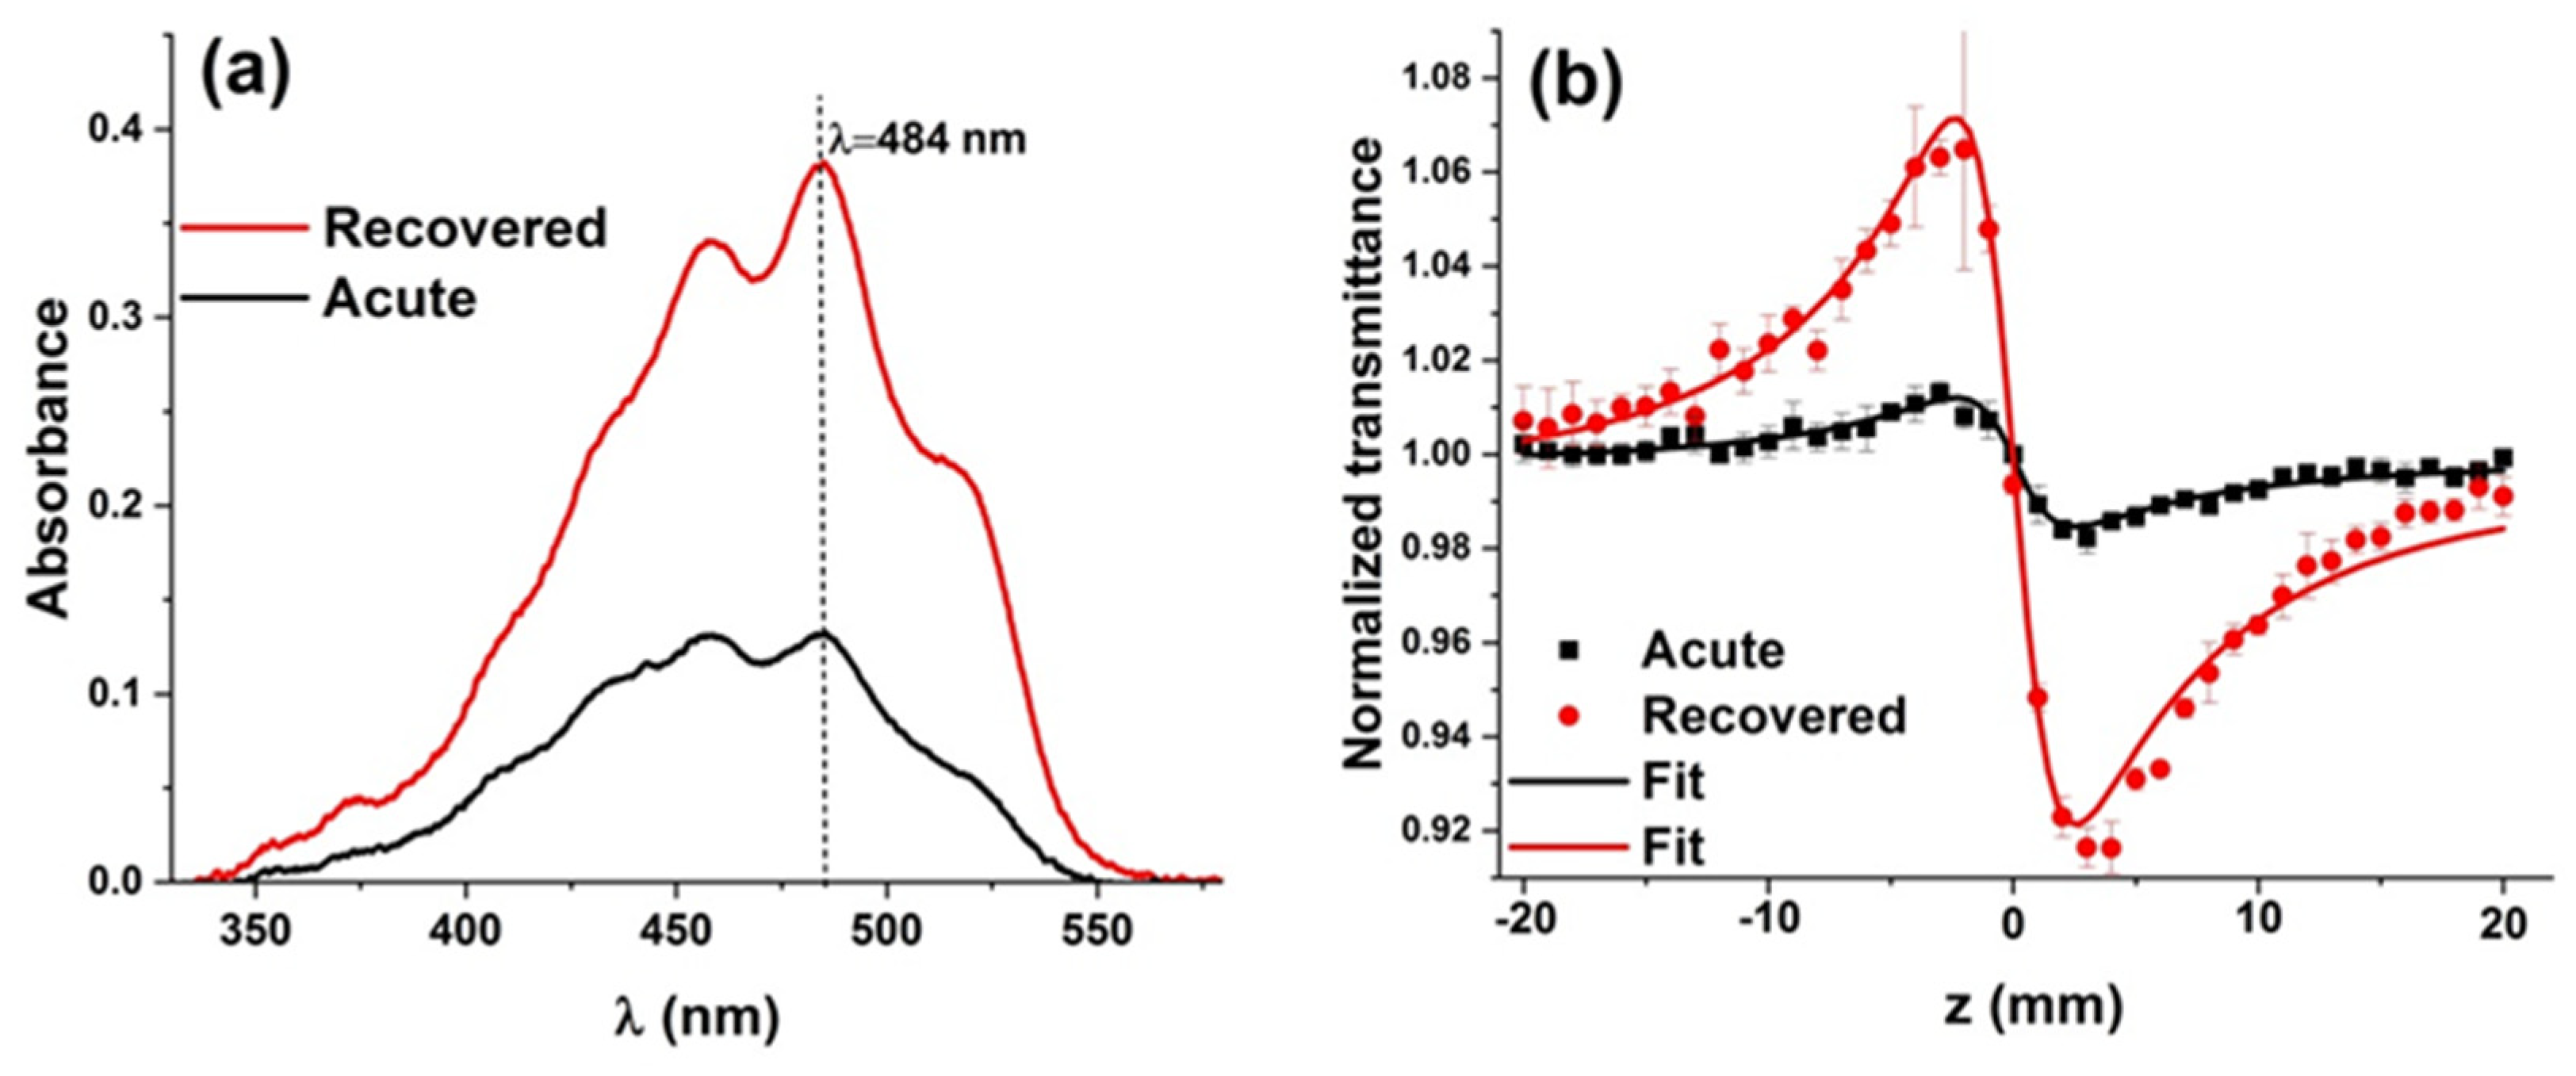
Figure 1. (a) UV-visible results, with the absorbance as a function of wavelength; and (b) Z-scan results, with the normalized transmittance as a function of the sample z-position from a patient of the Acute and Recovered COVID-19 groups.
Preprints 81508 g001
Figure 2. Box-plot showing the significant differences between the Acute and Recovered COVID-19 groups for (a) phase shift θ and (b) absorbance at wavelength 484 nm.
Preprints 81508 g002
Figure 3. Correlation between (a) CRP level and antioxidant-amount estimate (absorbance at wavelength 484 nm), (b) CRP level and phase shift θ, (c) D-dimer level and antioxidant-amount estimate, and (d) phase shift θ and antioxidant-amount estimate.
Preprints 81508 g003
Table 1. Baseline characteristics of individuals, according to the Acute and Recovered COVID-19 groups.
Acute
COVID-19
(n=33)
Recovered
COVID-19
(n=30)
P-value
Age, years 60±19 53±15 0.101
Sex, male 21(63) 13 (43) 0.45
Race, white 25 (75) 20 (66) 0.89
Smoking 2 (6) 3 (10) 0.66
Alcoholism 1 (3) 0 (0) 1.00
Comorbidities 20 (61) 18 (60) 0.99
DM 9 (27) 6 (20) 0.93
Stroke 1 (3) 0 (0) 1.00
SARS 28 (84) 20 (66) 0.41
Dyslipidaemia 1 (3) 0 (0) 1.00
SAH 12 (36) 13 (43) 0.95
CVD 1 (3) 0 (0) 1.00
CRP (mg/L) 92 (49-195) 87 (56-175) 0.84
D-dimer (ng/mL) 1,362 (579-2,201) 656 (451-1,529) 0.0248*
Table 2. Low-density lipoprotein subfractions, according to the Acute and Recovered COVID-19.
Variables Acute
COVID-19 (n=33)
Recovered
COVID-19 (n=30)
P-value
LDL-1 (%) 14.1 (2.6-26.5) 17.0 (2.0-31.7) 0.266
LDL-2 (%) 8.9 (0.0-23.0) 12.9 (0.0-24.7) 0.008*
LDL-3 (%) 1.8 (0.0-9.4) 3.1 (0.0-12.5) 0.060
LDL-4 (%) 0.0 (0.0-4.7) 0.0 (0.0-8.4) 0.261
LDL-5 (%) 0.0 (0.0-1.2) 0.0 (0.0-5.0) 0.046*
LDL-6 (%) 0.0 (0.0-2.2) 0.0 (0.0-2.2) 0.502
LDL-7 (%) 0.0 (0.0-30.6) 0.0 (0.0-11.0) 0.657
Large LDL (%) 23.1 (2.6-39.0) 29.9 (2.0-50.2) 0.025*
Small LDL (%) 3.2 (0.0-32.8) 4.8 (0.0-25.1) 0.153
LDL-1 (mg/dL) 23.9 (2.5-58.2) 35 (4.5-70.1) 0.009*
LDL-2 (mg/dL) 24.6 (0.0-47.6) 27.1 (0.0-53.2) 0.489
LDL-3 (mg/dL) 8.1 (0.0-39.8) 6.3 (0.0-28.1) 0.548
LDL-4 (mg/dL) 0.0 (0.0-13.9) 0.0 (0.0-17.8) 0.753
LDL-5 (mg/dL) 0.0 (0.0-3.4) 0.0 (0.0-10.7) 0.039*
LDL-6 (mg/dL) 0.0 (0.0-0.0) 0.0 (4.3) 0.195
LDL-7 (mg/dL) 0.0 (0.0-8.5) 0.0 (0.0-25.2) 0.029*
Large LDL (mg/dL) 49.4 (2.5-94.6) 60.9 (4.5-108.3) 0.040*
Small LDL (mg/dL) 8.3 (0.0-53.7) 10.1 (0.0-53.6) 0.595
LDL size (nm) 267 (205-276) 266 (201-275) 0.336
Phenotype A (%) 24(43) 11(41) 0.996
Variables are expressed as median (min-max) and n (%). Variables compared between groups using two samples T-test or Mann–Whitney tests. Bold numbers*: significant difference (P<0.05).
Disclaimer/Publisher’s Note: The statements, opinions and data contained in all publications are solely those of the individual author(s) and contributor(s) and not of MDPI and/or the editor(s). MDPI and/or the editor(s) disclaim responsibility for any injury to people or property resulting from any ideas, methods, instructions or products referred to in the content.
Copyright: This open access article is published under a Creative Commons CC BY 4.0 license, which permit the free download, distribution, and reuse, provided that the author and preprint are cited in any reuse.
Prerpints.org logo

Preprints.org is a free preprint server supported by MDPI in Basel, Switzerland.

Subscribe

© 2024 MDPI (Basel, Switzerland) unless otherwise stated