Submitted:
05 August 2023
Posted:
07 August 2023
You are already at the latest version
Abstract
Keywords:
1. Introduction
2. Materials and methods
3. Results and discussion
4. Conclusions
Author Contributions
Funding
Data Availability Statement
Acknowledgments
Conflicts of Interest
References
- Kemnitz, E.; Menz, D.H. Prog. Solid State Chem. 1998, 26, 97–153. [CrossRef]
- Murthy, J.K.; Gross, U.; Rudiger, S.; Unveren, E.; Kemnitz, E.J. Fluorine Chem. 2004, 125, 937–949. [CrossRef]
- Tang, S.; et al. Dissolution reaction of TiO2 in molten 6.58 NaF-AlF3: A Raman spectroscopy and computational simulation study. Journal of Molecular Liquids 2022, 367, 120431. [Google Scholar] [CrossRef]
- Zhou, H.; et al. Enhanced effect of AlF3 and its Co-regulatory effect with micron-scaled α-Al2O3 nuclei on alumina crystal growth in high-temperature calcination process. Ceramics International 2023, 49, 6563–6572. [Google Scholar] [CrossRef]
- Zhou, H.; et al. Enhanced effect of AlF3 and its Co-regulatory effect with micron-scaled α-Al2O3 nuclei on alumina crystal growth in high-temperature calcination process. Ceramics International 2023, 49, 6563–6572. [Google Scholar] [CrossRef]
- Becker, C.; Braun, T.; Paulus, B. Theoretical Study on the Lewis Acidity of the Pristine AlF3 and Cl-Doped α-AlF3 Surfaces. Catalysts 2021, 11, 565. [Google Scholar] [CrossRef]
- Kumar, M.; Sekhon, S.S. J. Phys. D: Appl. Phys. 2001, 34, 2995–3002. [CrossRef]
- Fujihara, S.; Tokumo, K. J. Fluorine Chem. 2009, 130, 1106–1110. [CrossRef]
- Fujihara, S.; Kato, T.; Kimura, T. J. Mater. Sci. Lett. 2001, 20, 687–689. [CrossRef]
- Du, Y.P.; Zhang, Y.W.; Yan, Z.G.; Sun, L.D.; Yan, C.H. J. Am. Chem. Soc. 2009, 131, 16364–16365. [CrossRef] [PubMed]
- Feng, W.; Sun, L.D.; Zhang, Y.W.; Yan, C.H. Coord. Chem. Rev. 2010, 254, 1038–1053. [CrossRef]
- Mechanism of oxide film removal by KF-AlF3 and CsF-AlF3 mixed fluxes on Cu and Al base metals and their effect on wettability.
- Al-Assadi, Z.I.; Sultan, M.F. Comparative Study for Designing Two Optical Multilayers Stacks ThF4/AlF3 and ThF4/LiF. Al-Mustansiriyah Journal of Science 2022, 33, 98–102. [Google Scholar] [CrossRef]
- Gutiérrez-Luna, N.; et al. Temperature dependence of AlF3 protection on far-UV Al mirrors. Coatings 2019, 9, 428. [Google Scholar] [CrossRef]
- Praseodymium mid-infrared emission in AlF3-based glass sensitized by ytterbium.
- Li, X.; et al. Atomic layer deposition of insulating alf3/polyimide nanolaminate films. Coatings 2021, 11, 355. [Google Scholar] [CrossRef]
- Physical, chemical, and biological properties of white MTA with additions of AlF3.
- Luo, Z.; et al. AlF3 coating as sulfur immobilizers in cathode material for high performance lithium-sulfur batteries. Journal of Alloys and Compounds 2020, 812, 152132. [Google Scholar] [CrossRef]
- Lei, C.; et al. Reduction of porous carbon/Al contact resistance for an electric double-layer capacitor (EDLC). Electrochimica acta 2013, 92, 183–187. [Google Scholar] [CrossRef]
- Zhang, J.; et al. AlF3 coating improves cycle and voltage decay of Li-rich manganese oxides. Journal of Materials Science 2023, 58, 4525–4540. [Google Scholar] [CrossRef]
- Rodríguez, S.J.; et al. A theoretical study on the intercalation and diffusion of AlF 3 in graphite: Its application in rechargeable batteries. Physical Chemistry Chemical Physics 2021, 23, 19579–19589. [Google Scholar] [CrossRef] [PubMed]
- Adhitama, E.; et al. Revealing the Role, Mechanism, and Impact of AlF3 Coatings on the Interphase of Silicon Thin Film Anodes. Advanced Energy Materials 2022, 12, 2201859. [Google Scholar] [CrossRef]
- Padamata, S.K.; Yasinskiy, A.; Polyakov, P. Electrode processes in the KF–AlF3–Al2O3 melt. New Journal of Chemistry 2020, 44, 5152–5164. [Google Scholar] [CrossRef]
- Abdullayev, A.; et al. AlF3-assisted flux growth of mullite whiskers and their application in fabrication of porous mullite-alumina monoliths. Open Ceramics 2021, 7, 100145. [Google Scholar] [CrossRef]
- Estruga, M.; et al. Large-scale solution synthesis of α-AlF3·3H2O nanorods under low supersaturation conditions and their conversion to porous β-AlF3 nanorods. Journal of Materials Chemistry 2012, 22, 20991–20997. [Google Scholar] [CrossRef]
- Han, W.; et al. PVDF mediated fabrication of freestanding AlF3 sub-microspheres: Facile and controllable synthesis of α, β and θ-AlF3. Materials Chemistry and Physics 2020, 240, 122287. [Google Scholar] [CrossRef]
- Jia, W.Z.; et al. A novel method for the synthesis of well-crystallized β-AlF3 with high surface area derived from γ-Al2O3. Journal of Materials Chemistry 2011, 21, 8987–8990. [Google Scholar] [CrossRef]
- Liu, W.; et al. 3D spiny AlF3/Mullite heterostructure nanofiber as solid-state polymer electrolyte fillers with enhanced ionic conductivity and improved interfacial compatibility. Journal of Energy Chemistry 2023, 76, 503–515. [Google Scholar] [CrossRef]
- Mao, W.; et al. The ethylene glycol-mediated sol–gel synthesis of nano AlF 3: Structural and acidic properties after different post treatments. Dalton Transactions 2022, 51, 935–945. [Google Scholar] [CrossRef]
- Deng, X.; et al. Fabrication and characterization of mullite-whisker-reinforced lightweight porous materials with AlF3·3H2O. Ceramics International 2022, 48, 14891–14898. [Google Scholar] [CrossRef]
- Kemnitz, E. Nanoscale metal fluorides: A new class of heterogeneous catalysts. Catalysis Science & Technology 2015, 5, 789–806. [Google Scholar]
- Kemnitz, E.; et al. Amorphous metal fluorides with extraordinary high surface areas. Angewandte Chemie International Edition 2003, 42, 4251–4254. [Google Scholar] [CrossRef] [PubMed]
- Krysztafkiewicz, A.; Rager, B.; Maik, M. Silica recovery from waste obtained in hydrofluoric acid and aluminum fluoride production from fluosilicic acid. Journal of hazardous materials 1996, 48, 31–49. [Google Scholar] [CrossRef]
- Le Bail, A.; et al. Crystal structure of the metastable form of aluminum trifluoride β-AlF3 and the gallium and indium homologs. Journal of Solid State Chemistry 1988, 77, 96–101. [Google Scholar] [CrossRef]
- König, D.; Ebest, G. Antipolar Counterpart to the Positively Charged SiOxNy Layer for Improvement of Field Effect Solar Cells.
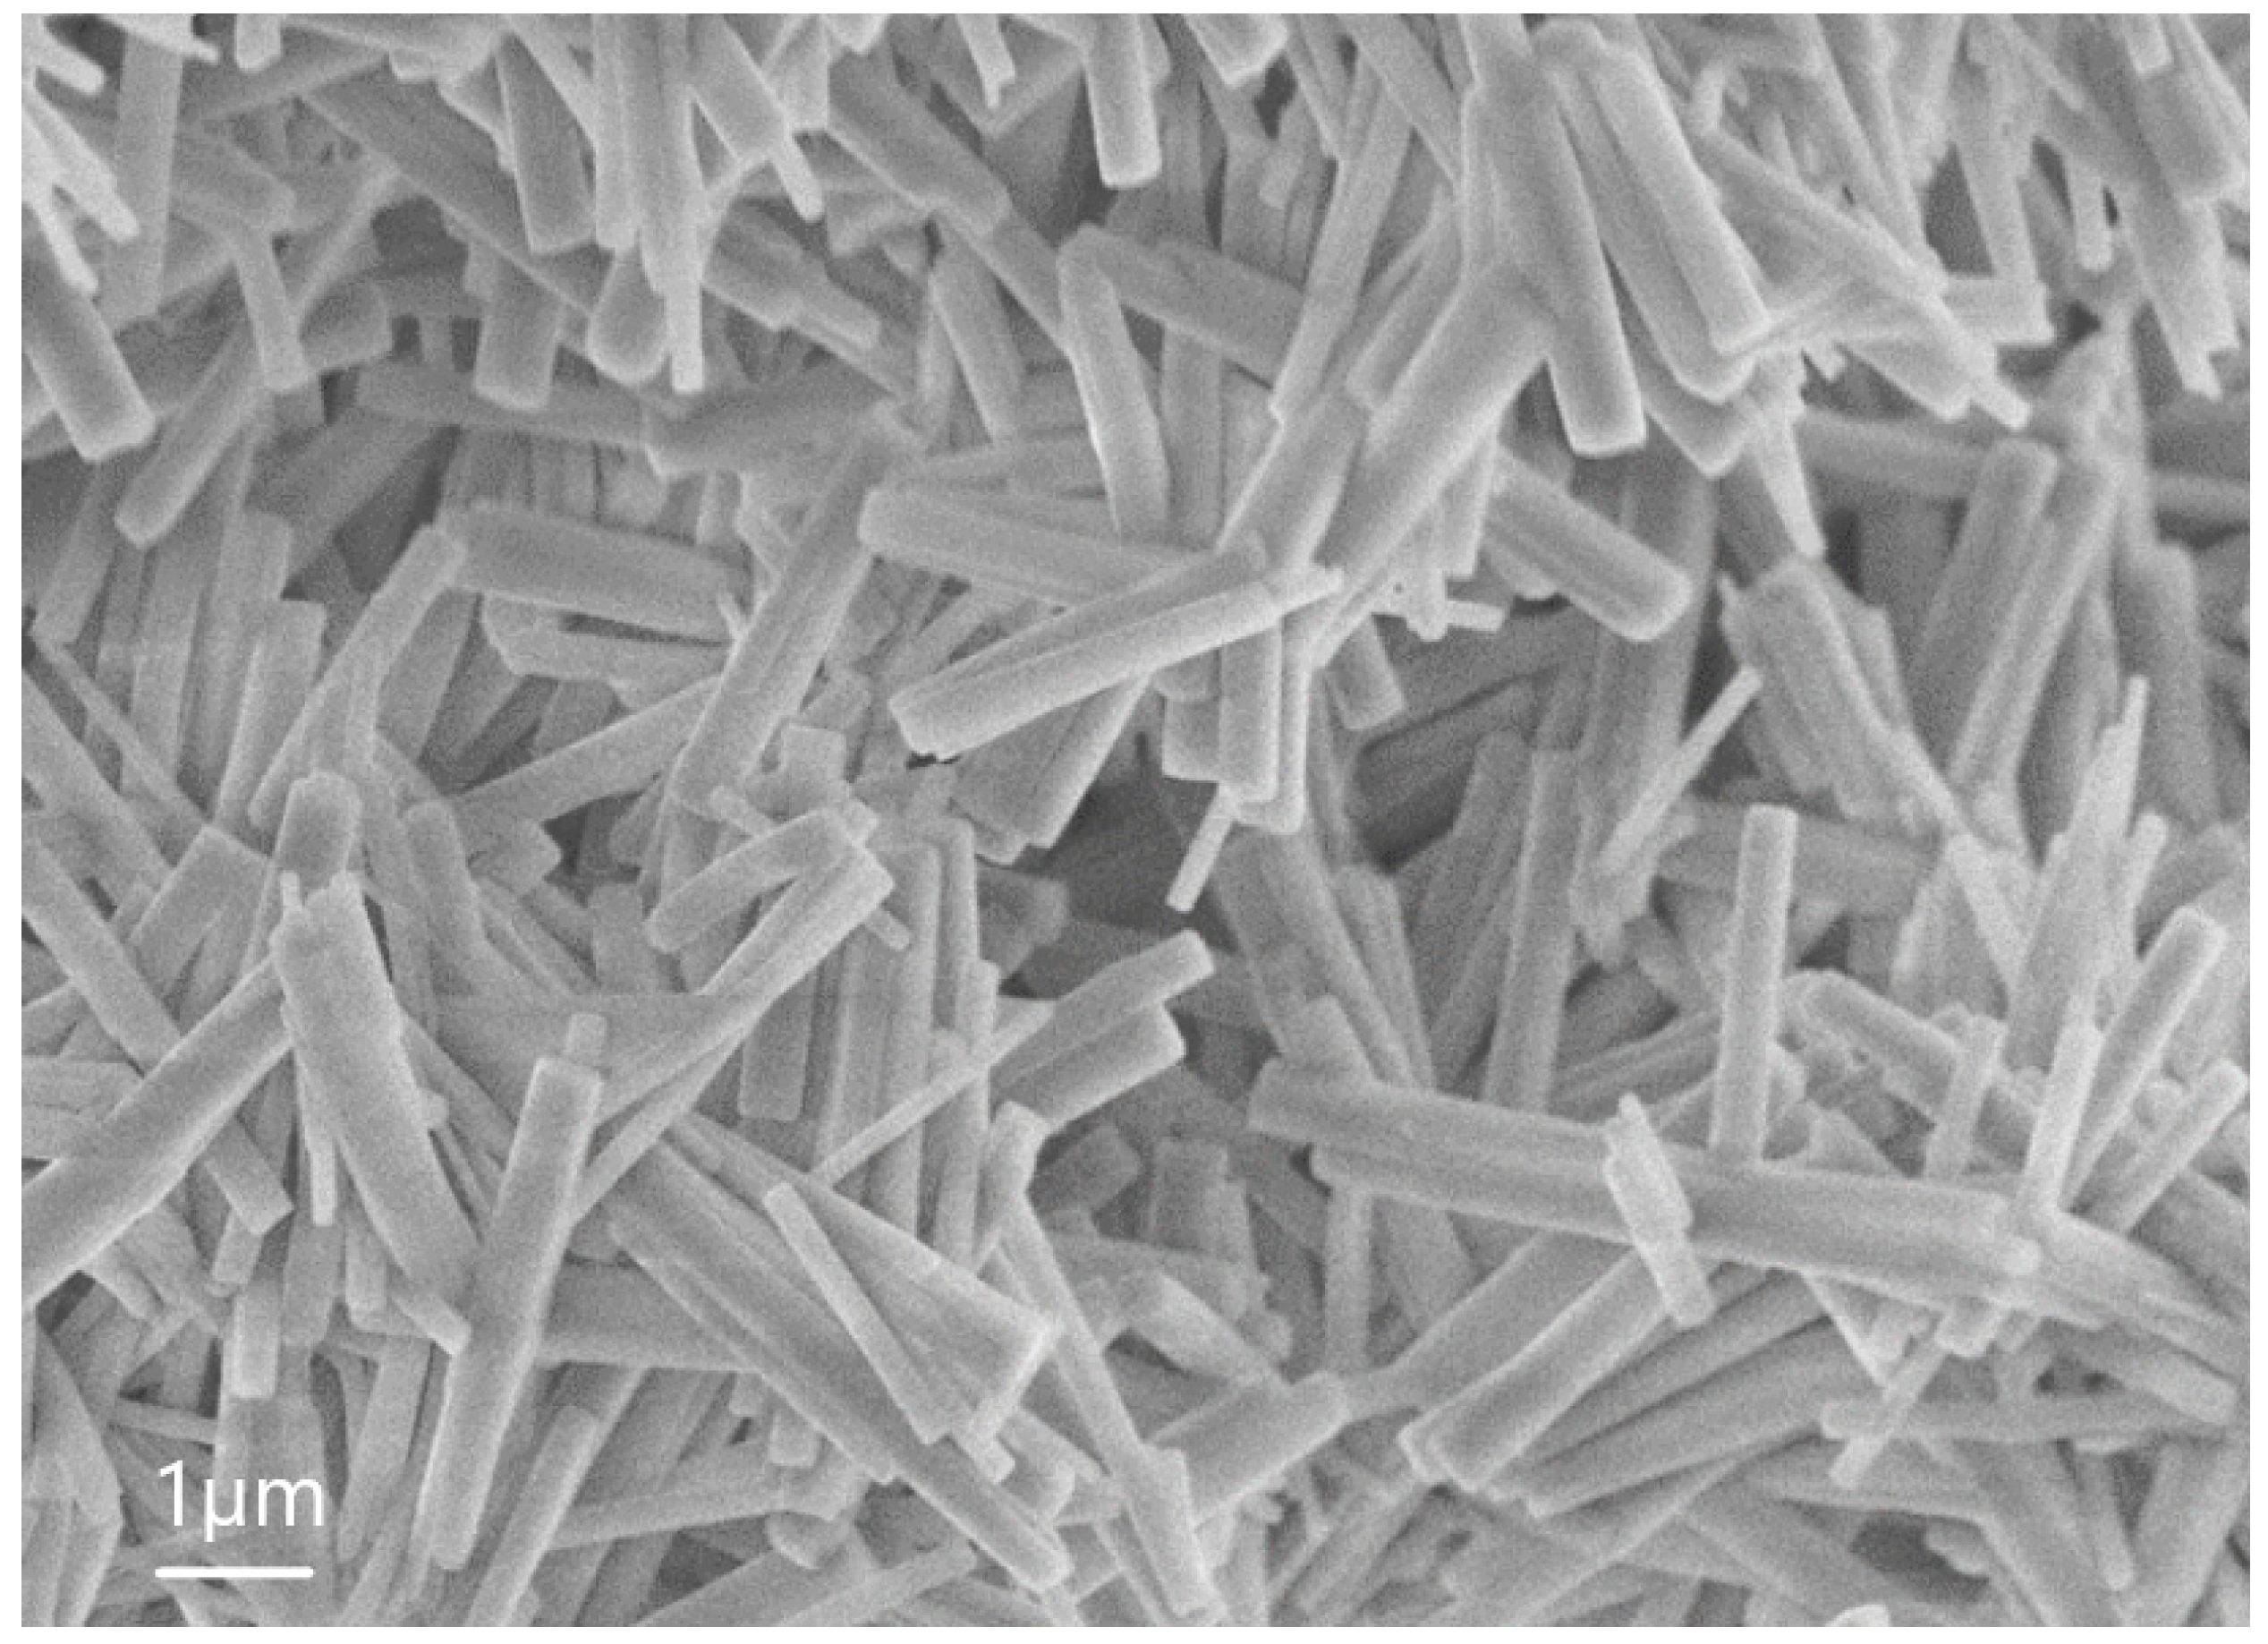
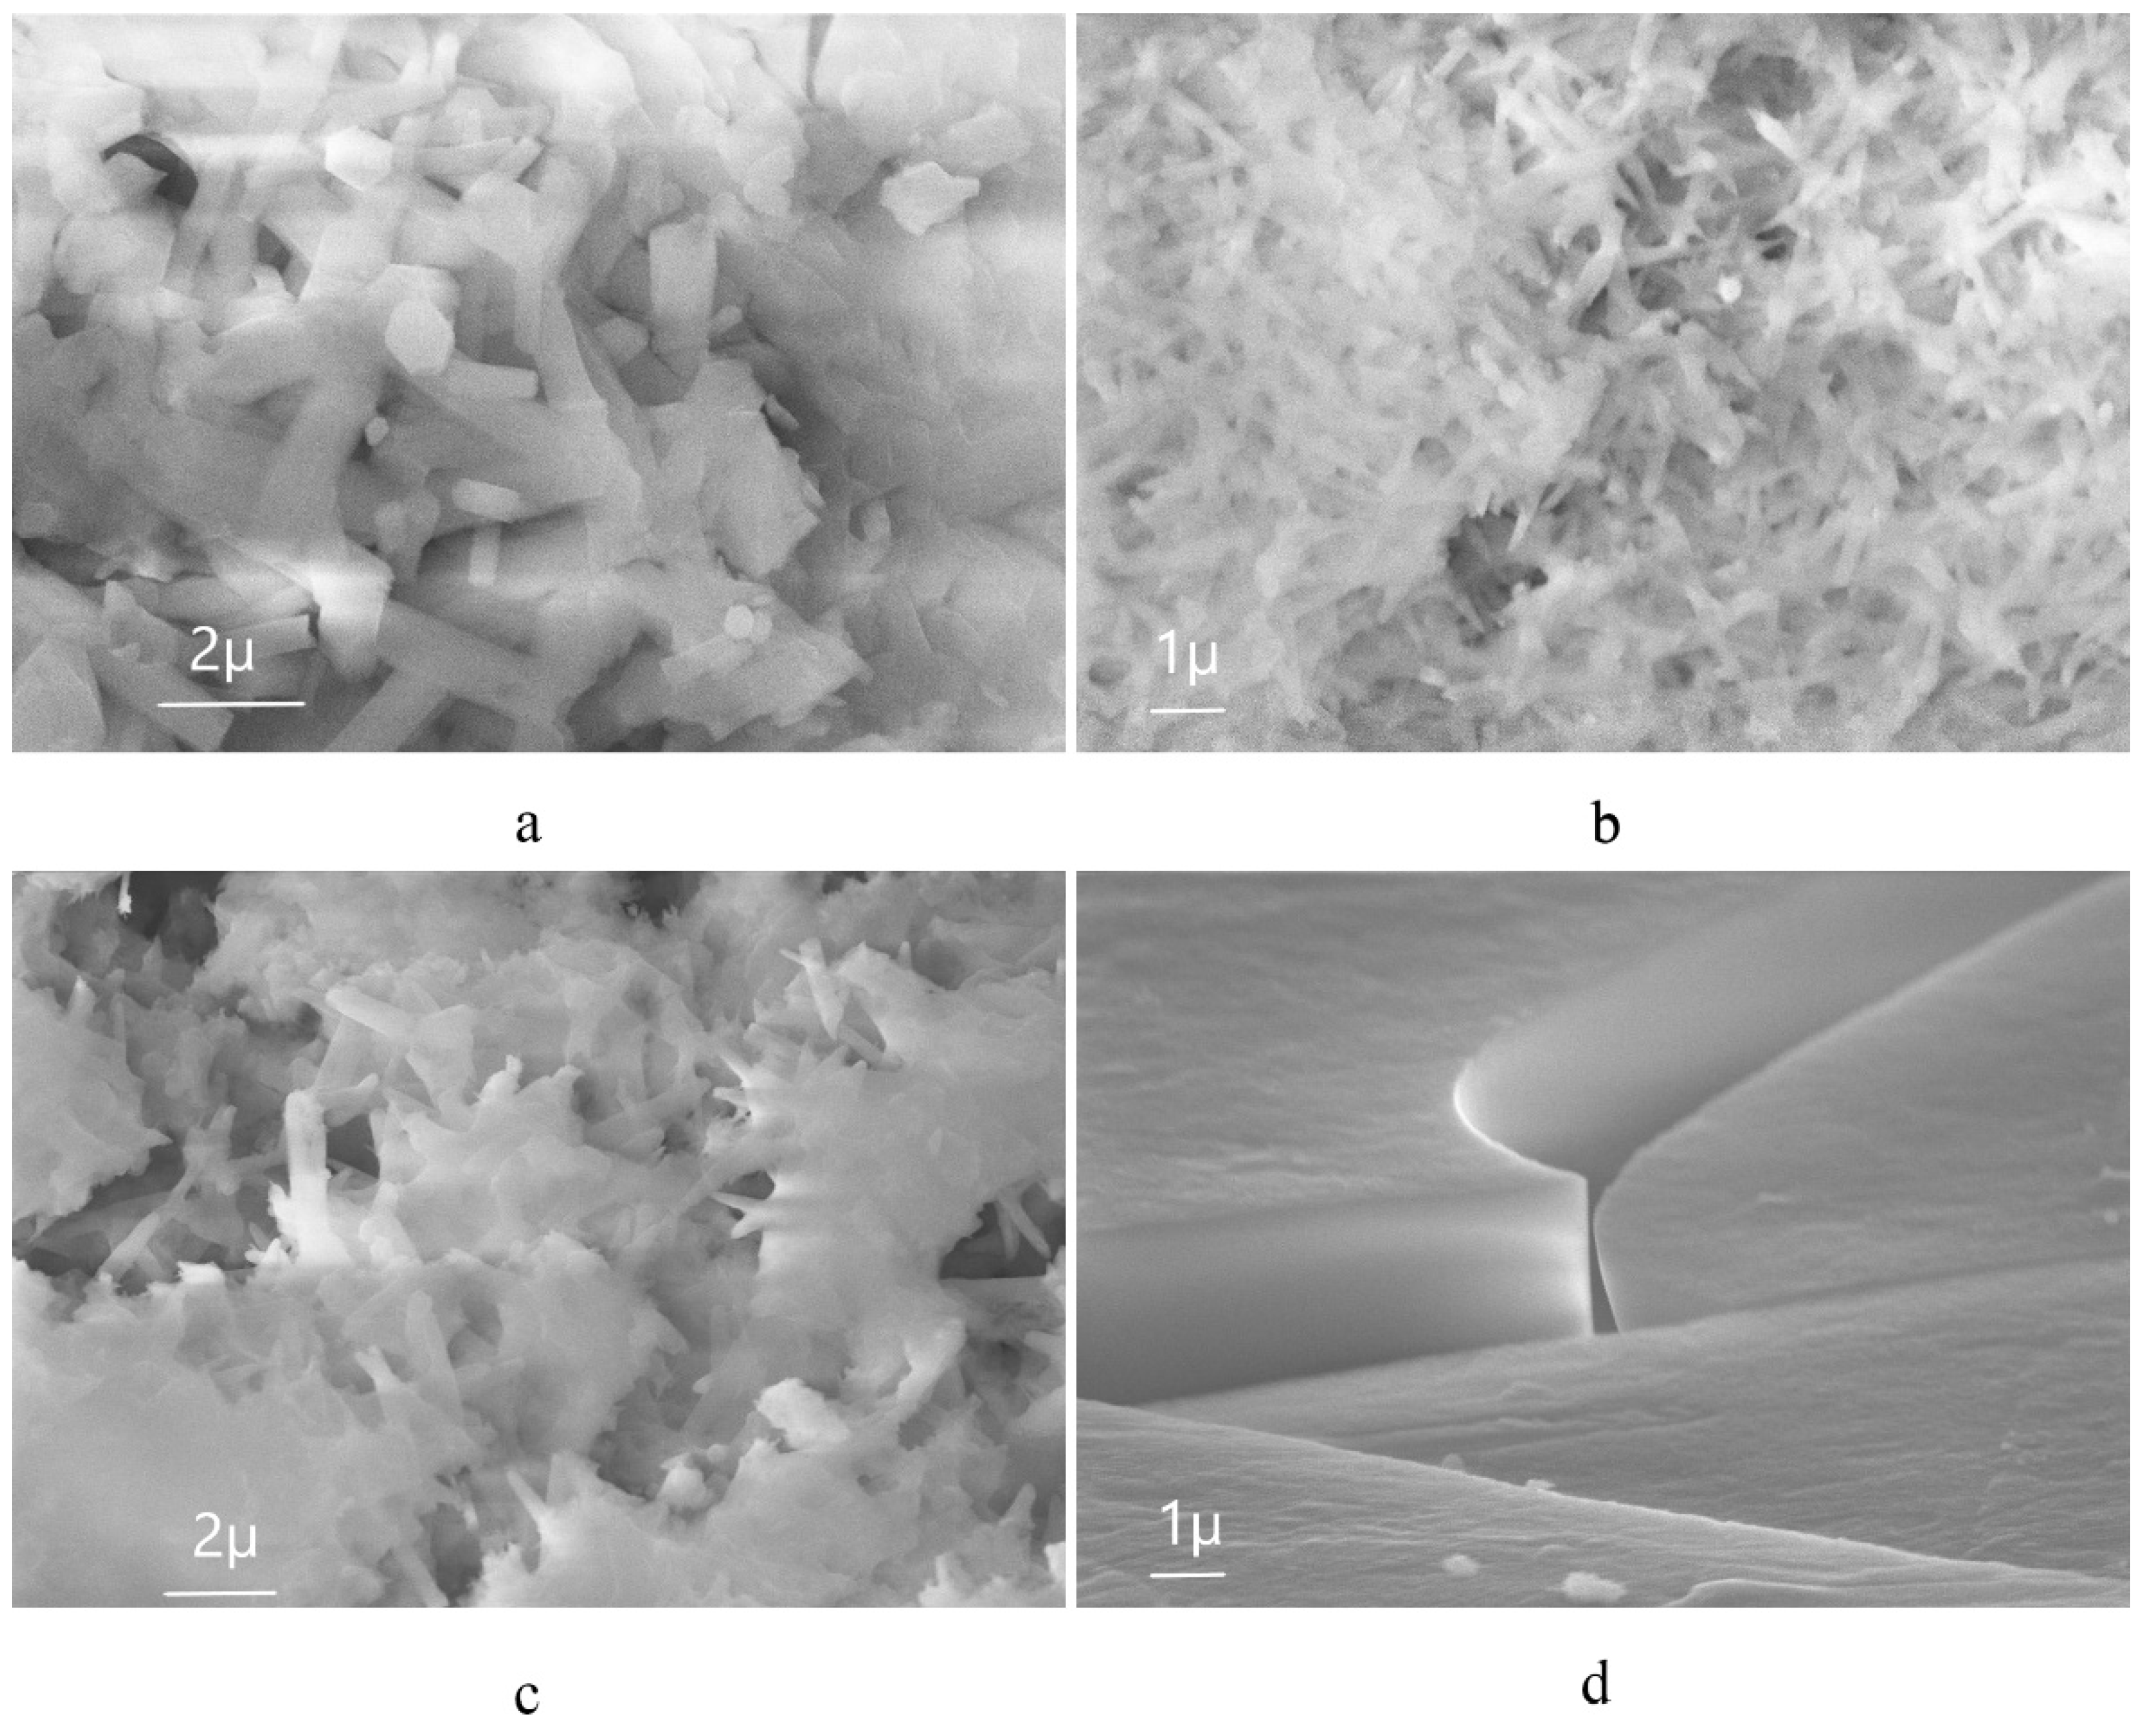
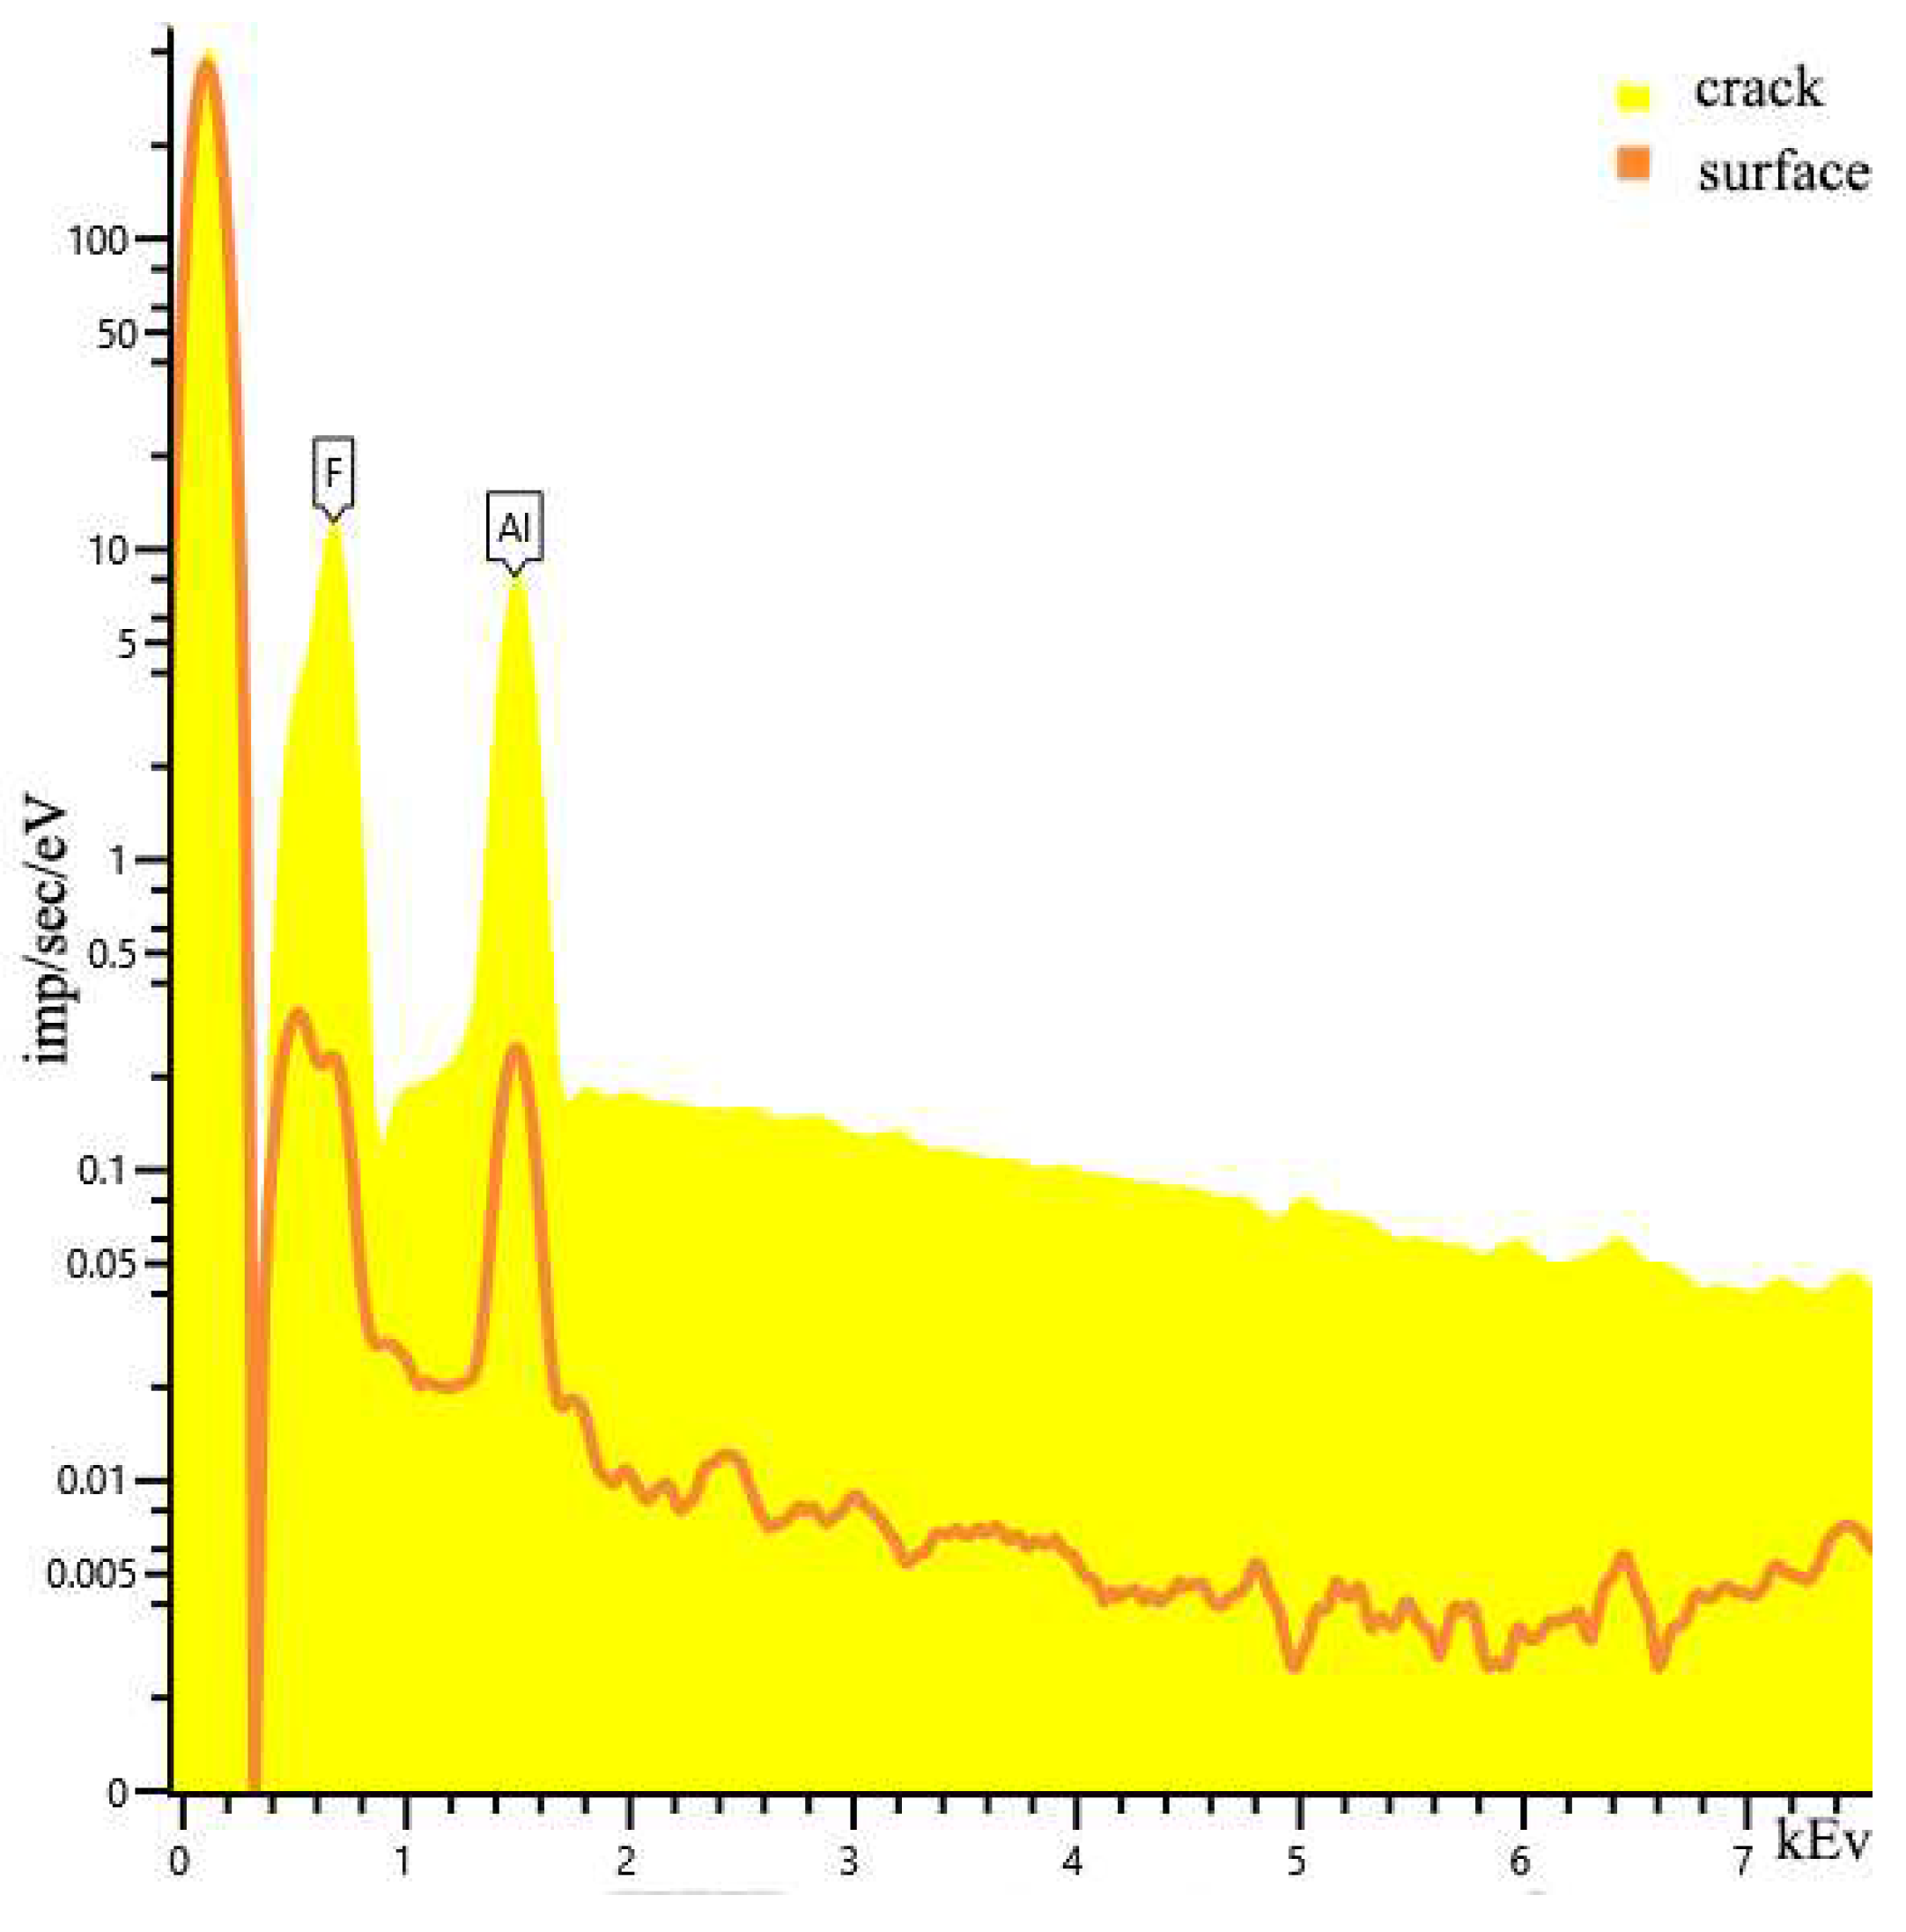
| Sample | percentage of solution concentration, % | |
|---|---|---|
| 1.1 | 40 | 12.49 |
| 2.1 | 32.6 | 10.67 |
| 3.1 | 29.4 | 9.77 |
| 4.1 | 24.5 | 11.34 |
| 5.1 | 16.3 | 10.12 |
| 6.1 | 8 | 14.32 |
| Sample | percentage of solution concentration, % | |
|---|---|---|
| 1.2 | 40 | 120.65 |
| 2.2 | 32.6 | 93.31 |
| 3.2 | 29.4 | 81.04 |
| 4.2 | 24.5 | 53.81 |
| 5.2 | 16.3 | 115.37 |
Disclaimer/Publisher’s Note: The statements, opinions and data contained in all publications are solely those of the individual author(s) and contributor(s) and not of MDPI and/or the editor(s). MDPI and/or the editor(s) disclaim responsibility for any injury to people or property resulting from any ideas, methods, instructions or products referred to in the content. |
© 2023 by the authors. Licensee MDPI, Basel, Switzerland. This article is an open access article distributed under the terms and conditions of the Creative Commons Attribution (CC BY) license (http://creativecommons.org/licenses/by/4.0/).


