1. Introduction
Tourism is one of the fastest growing industries in the global economy. It is an important source of foreign currency inflows and employment, closely linked to the social, economic and environmental well-being of a country.
According to the World Tourism Organization, sustainable tourism is understood as “tourism that fully takes into account its current and future economic, social, and environmental consequences when satisfying the needs of tourists, tourism industry, environment, and host communities.”
The United Nations World Tourism Organization (UNWTO) declares [
1] that sustainable tourism must meet the following requirements: optimally utilize environmental resources, respect the socio-cultural uniqueness of host communities, provide viable and long-term economic activities, and offer socio-economic benefits to all interested parties. Sustainable tourism development requires informed participation of all relevant stakeholders, as well as strong political leadership to ensure broad participation and consensus. Achieving sustainable tourism is an ongoing process that implies continuous monitoring of impacts and the implementation of necessary preventive and/or remedial measures when necessary.
Within the framework of UNWTO, an international network of sustainable tourism observatories has been created to monitor the economic, environmental, and social impacts of tourism at the destination level.
Since its establishment in 2004, a total of 36 observatories in China, Greece, Brazil, Indonesia, Croatia, USA, Guatemala, Italy, Argentina, Australia, Portugal, Spain, Canada, Colombia, and Mexico have joined this network [
2].
Among the main monitoring indicators are tourism seasonality, employment data, energy and water consumption management, waste management, climate impact, etc.
There exist regional monitoring systems (observatories), such as shapetourism, that provide an interpretation tool of tourism dynamics based on four dimensions: reputation, attractiveness, competitiveness, and sustainability. It covers 52 countries in the Mediterranean region [
3].
Another type of system is a system for monitoring individual attractions or territories, for example, in Australia [
4], Portugal [
5], China [
6], France [
7], Russia [
8].
Moreover, the data can be presented not only as interactive maps but also as individual files with graphs and tables for a specific month and indicator. This method of obtaining information is considered inefficient for users.
Thus, the worldwide goal of sustainable tourism development has been established. Its implementation is only possible through continuous monitoring of this area based on comprehensive data, which, in turn, can be done only if modern information technologies are employed.
It is also important to mention a significant increase in the volume of data related to tourism. Data is created by tourist agencies, tourist facilities (hotels, restaurants, events, etc.), and consumers of tourism services on the Internet. The available data is characterized by massiveness, heterogeneity, sometimes weak structuring, incompleteness, and inconsistency. The explosive increase in the amount of data available on the Internet creates the need for development of methods and software tools for integrating autonomous and diverse data sources, searching for relevant data, extracting and interpreting them [
7,
9].
The aim of this work is to describe the concept of the tourism monitoring service in Irkutsk Oblast as part of the Lake Baikal area, define methods and means of implementing this service, and present individual results of its prototyping.
To achieve this goal, the following tasks need to be solved:
1. Describe the concept of the tourism monitoring service.
2. Formulate and study the structure of content sources of open data in the tourism industry.
3. Based on the identified structure of data sources, build an ontology of tourism objects.
4. Determine the data collection method and develop an algorithm for collecting structured data sets.
5. Process the collected data, perform unification, identification of objects from different sources, and aggregation of their measures and dimensions.
6. Develop visualizations of the descriptive statistics of the obtained data sets.
2. Tourism in Irkutsk Oblast
Irkutsk Oblast is one of the largest regions in Russia. The region is located in Eastern Siberia and occupies the southeastern part of the Central Siberian Plateau, with plateaus and ridges reaching heights of 500 to 1000 meters. The southernmost point of the region is located at 51° north latitude, with the northern tip almost reaching the 65th parallel. The region stretches from north to south for almost 1450 km, and from west to east for 1318 km. The southeastern border of Irkutsk Oblast runs along Lake Baikal [
10], which was included in the UNESCO World Heritage List in 1996 [
11].
Undoubtedly, Lake Baikal is a major attraction for tourists.
In the 2021 National Tourism Ranking, Irkutsk Oblast ranked 15th and entered the top twenty most attractive to domestic and foreign tourists regions of Russia [
12].
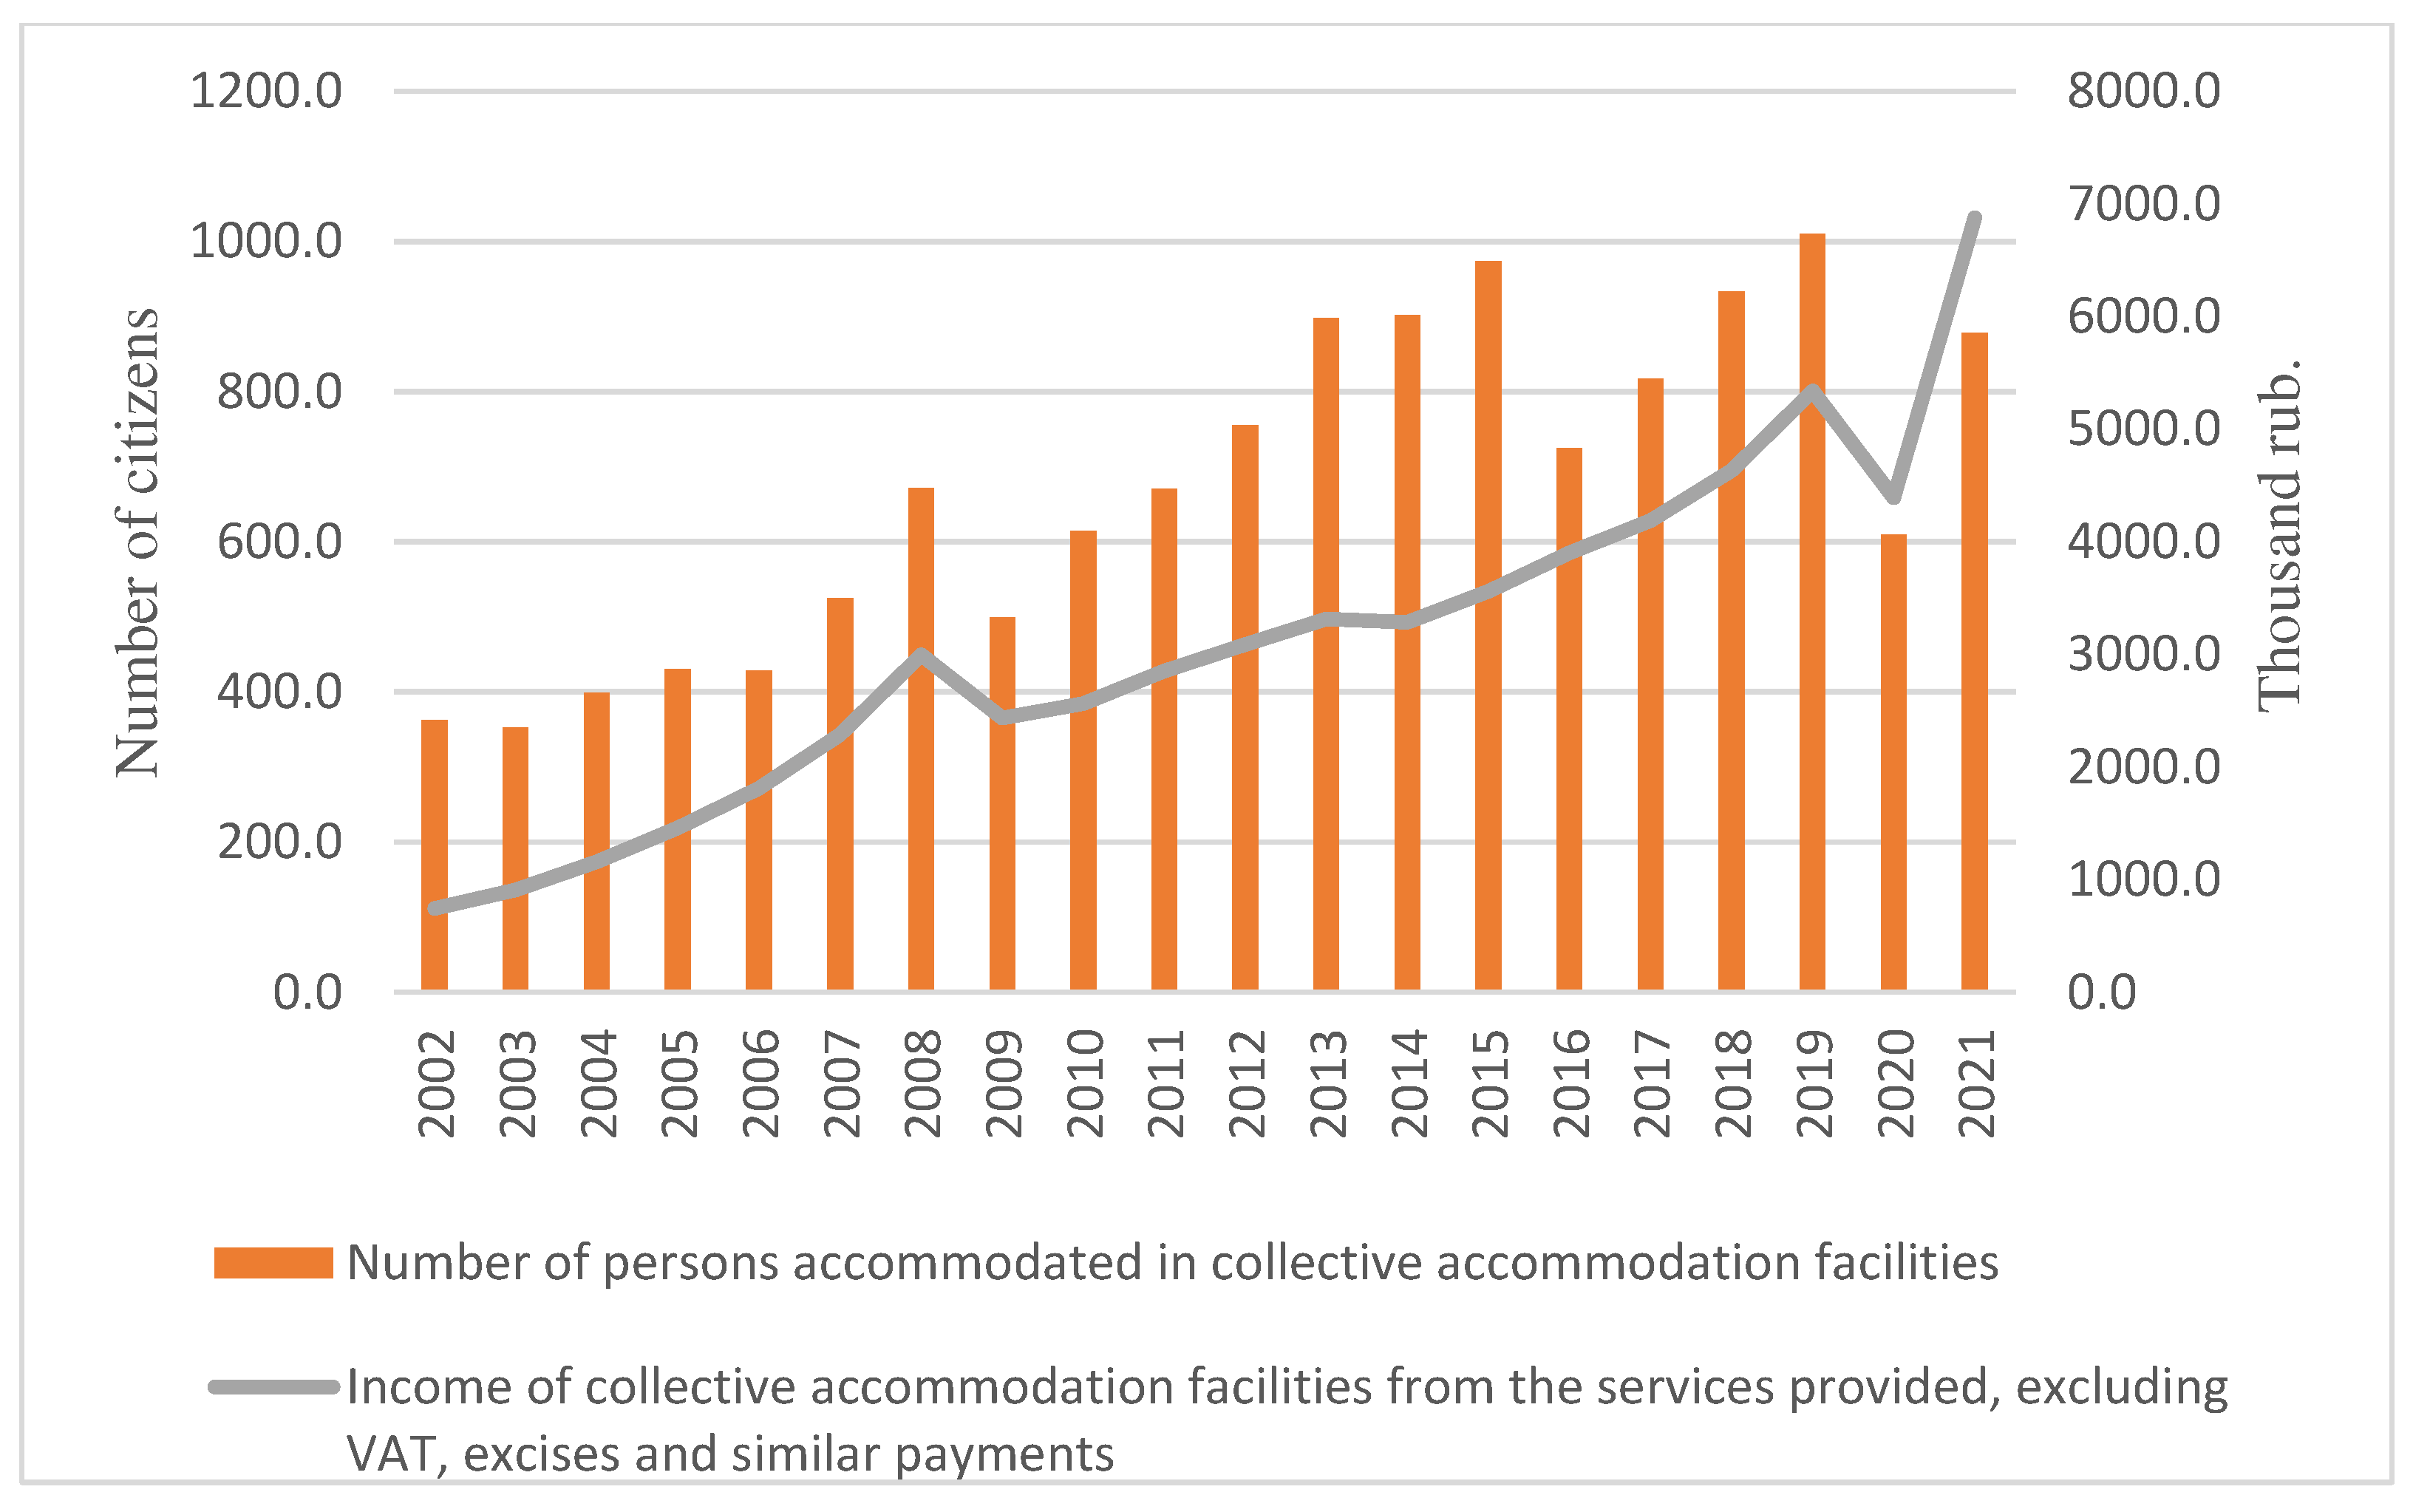
Over the past 20 years, the number of people that use public accommodation facilities has been steadily increasing and in 2019 exceeded 1 million people, while their profit in 2021 amounted to 6,877,621.3 thousand rubles (
Figure 1) [
13]. This fact indicates, on the one hand, the active development of the tourism industry in Irkutsk Oblast, and on the other hand, the increase in various environmental risks at the territory of a unique object of nature. Monitoring and managing these risks is an urgent task.
3. The concept of tourism monitoring service
To address the issue of monitoring tourism in a given area based on open data, we propose to develop a service that provides the following functions:
-
Real-time information on socio-ecological-economic indicators of regional tourism (a wider set of indicators than official statistics can be collected in real time, unlike data collection through administrative management):
-
Development of the tourism profile of the territory (region, district, locality):
types of tourism (recreational, event, ecological, ethnographic, active, business, rural, children’s, water and cruise, social tourism, amateur, health and wellness, extreme, pilgrimage, cultural-cognitive, gastronomic, etc.),
brands of the territory, attractions (museums, religious sites, objects of natural and wildlife reserves, hunting and fishing sites, rural, industrial, business, military-patriotic tourism objects, ski resorts),
sites for nature observation,
tourist events,
tourist routes,
ecological tourist paths,
excursions,
tourist information centers,
accommodation,
transport services, transport accessibility,
dining facilities,
climate,
-
operational monitoring (including informal tourism)
types of tourist services (products),
tourist flows, their direction and density,
tourist routes,
reviews to identify their sentiment and issues in the tourism industry (environmental, transportation, quality of services, safety),
recreational (anthropogenic) load on the territory, determining the environmental risk,
population involved in tourism (number of jobs, education),
region’s (district’s, locality’s) rating,
impact of extreme events (pandemics, forest fires - presence of smoke, debris),
-
monitoring:
identification of informal recreational areas based on satellite imagery (tent placement),
identification of tourist accommodation locations not registered in the official registry based on satellite imagery,
analysis of the popularity of landmarks,
-
zoning:
specialization of tourism types,
density of tourist flows,
recreational load.
-
Decision support for small and medium-sized businesses:
determination of business territories,
selection, justification, and development of tourism products for business.
-
Decision support for tourists:
There are currently various ways to implement the service and provide general access to it, ranging from services that offer various rental or hosting services for their own equipment in data centers, to cloud platforms that offer access to computing resources or services through the “Infrastructure as a Service” (IaaS) or “Platform as a Service” (PaaS) models. When creating a software system by a small group of developers (researchers), the most preferable approach is based on using cloud platform services. This choice is motivated by the following factors: no need for installation, configuration, and maintenance of the tools and libraries used for the operation of the target software system; no need for purchasing equipment and creating own infrastructure; reducing project risk, as research is highly prone to significant changes in the requirements and functionality of the target software system; the option of automatic scaling when there is an increase in load while using the software system.
The most popular cloud platforms currently are Amazon Web Services [
14] and Google Cloud Platform [
15]. However, in terms of convenience, especially when it comes to the Russian language support and compliance with the requirements of the Personal Data Protection Law of the Russian Federation, it is most expedient to use cloud platforms that take into account the specific needs of the Russian Federation, such as VK Cloud [
16] or Yandex.Cloud [
17]. The latter platform is preferable due to its functionality. During the development of the service, we propose to organize problem-oriented functions as independent computational blocks, i.e., elements of the so-called serverless infrastructure, the integration of which will be implemented using existing cloud platform tools. The same tools will be used to set up data storage and display the results of their processing. This approach aligns well with the popular concept of microservices architecture, where each function of the software system is implemented as an individual small service.
Currently, within the framework of the proposed service concept, the function of “forming a tourist profile of the territory” is implemented using the example of Lake Baikal area.
4. Information sources
Currently, official statistical data on the regional tourism in Lake Baikal area do not reflect the complete information on accommodation facilities, catering establishments, provided services and their quality, etc. [
18,
19]. Among the emerging statistical indicators, we should highlight the number of accommodated persons, the number of overnight stays, the profit of public accommodation facilities, etc. [
13]. One of the main shortcomings of this data is the lack of their precise territorial reference that should ensure assessment of recreational load of the area under consideration.
The website of the tourism agency of Irkutsk Oblast (
https://irkobl.ru/sites/tour/index.php?type=special) offers the following information: tourist passports of municipal entities (8 out of 32) and urban districts (7 out of 10), tourist routes of Irkutsk Oblast, up-to-date information for organizations in the tourism industry, etc. This information is presented as loosely structured and scattered texts in various formats. It should be noted that there is a lack of data available for further automated processing.
A lot of information about the Lake Baikal area is available on various web resources:
- Accommodation facilities (can be found at Ostrovok.ru, 101 Hotel, Mir Turbaza)
- Public catering establishments (website of the Tourism Agency of Irkutsk Oblast)
- Tourist routes (website of the Tourism Agency of Irkutsk Oblast)
In this work, we propose to analyze specific data sources, identify the data information model, collect, integrate, and visualize the data based on different criteria.
5. Ontology
The analysis of information sources allowed us to create an ontology for the tourism industry in order to unify the concepts used in the developed information models. To create this ontology, we used ontologies from the tourism area presented in various works. For example, the TITERIA ontology, which describes tourism in Teruel, includes the following main concepts: Party, Heritage, History, Cultural Center, Nature, Gastronomy [
20]. The ontology for studying tourism in Thailand includes such concepts as Cultural and Traditional Event, Event Content, Cultural Activity, Attraction, Way of Life, Location, Data Time. The OntoTouTra ontology, which uses formal specifications to represent knowledge of tourist traceability systems, utilizes such concepts as Accommodation, City, Provider, Tourist, Experience, Cultural, Adventure, Nature, Attraction etc. [
21]. The ontology for generating recommendations for tourists uses concept of Tourist Attraction [
22].
UNESCO developed a dictionary of terms [
23] and its ontology has the following main classes: accommodation, transportation, attractions, activities, services, restaurants, and cultural heritage. The listed ontologies were generalized and complemented with relationships and properties of concepts by the authors.
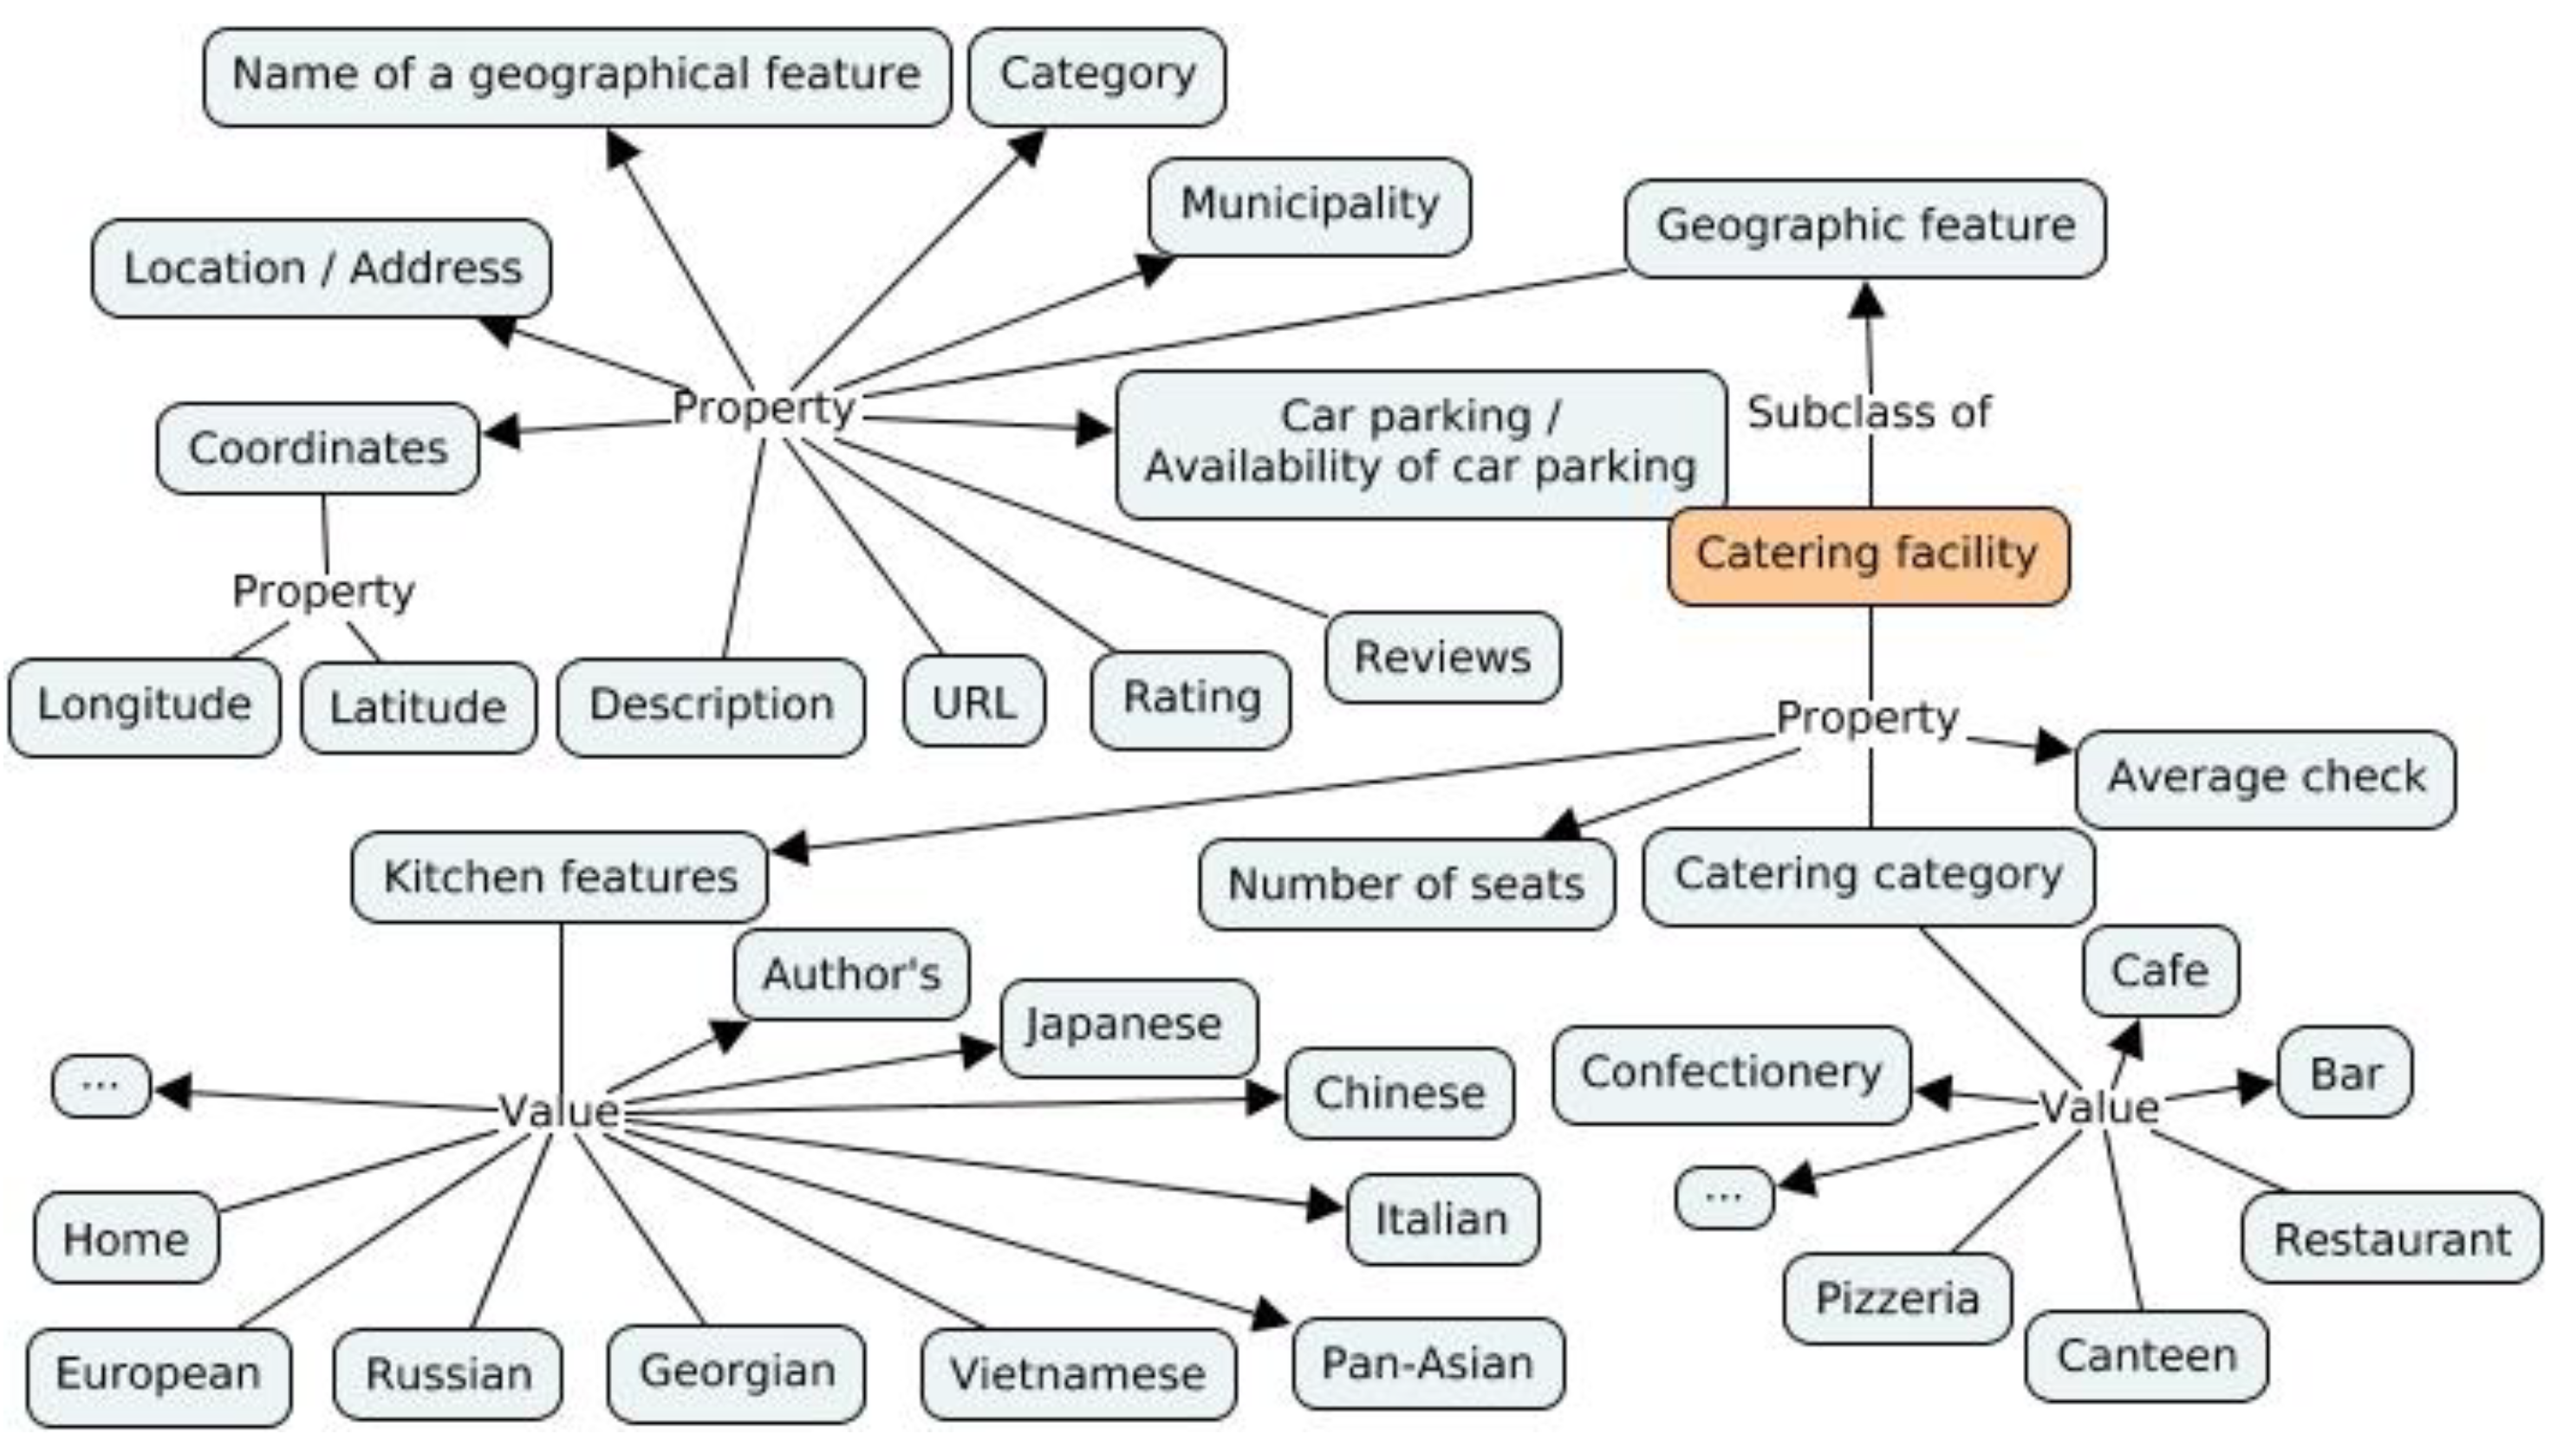
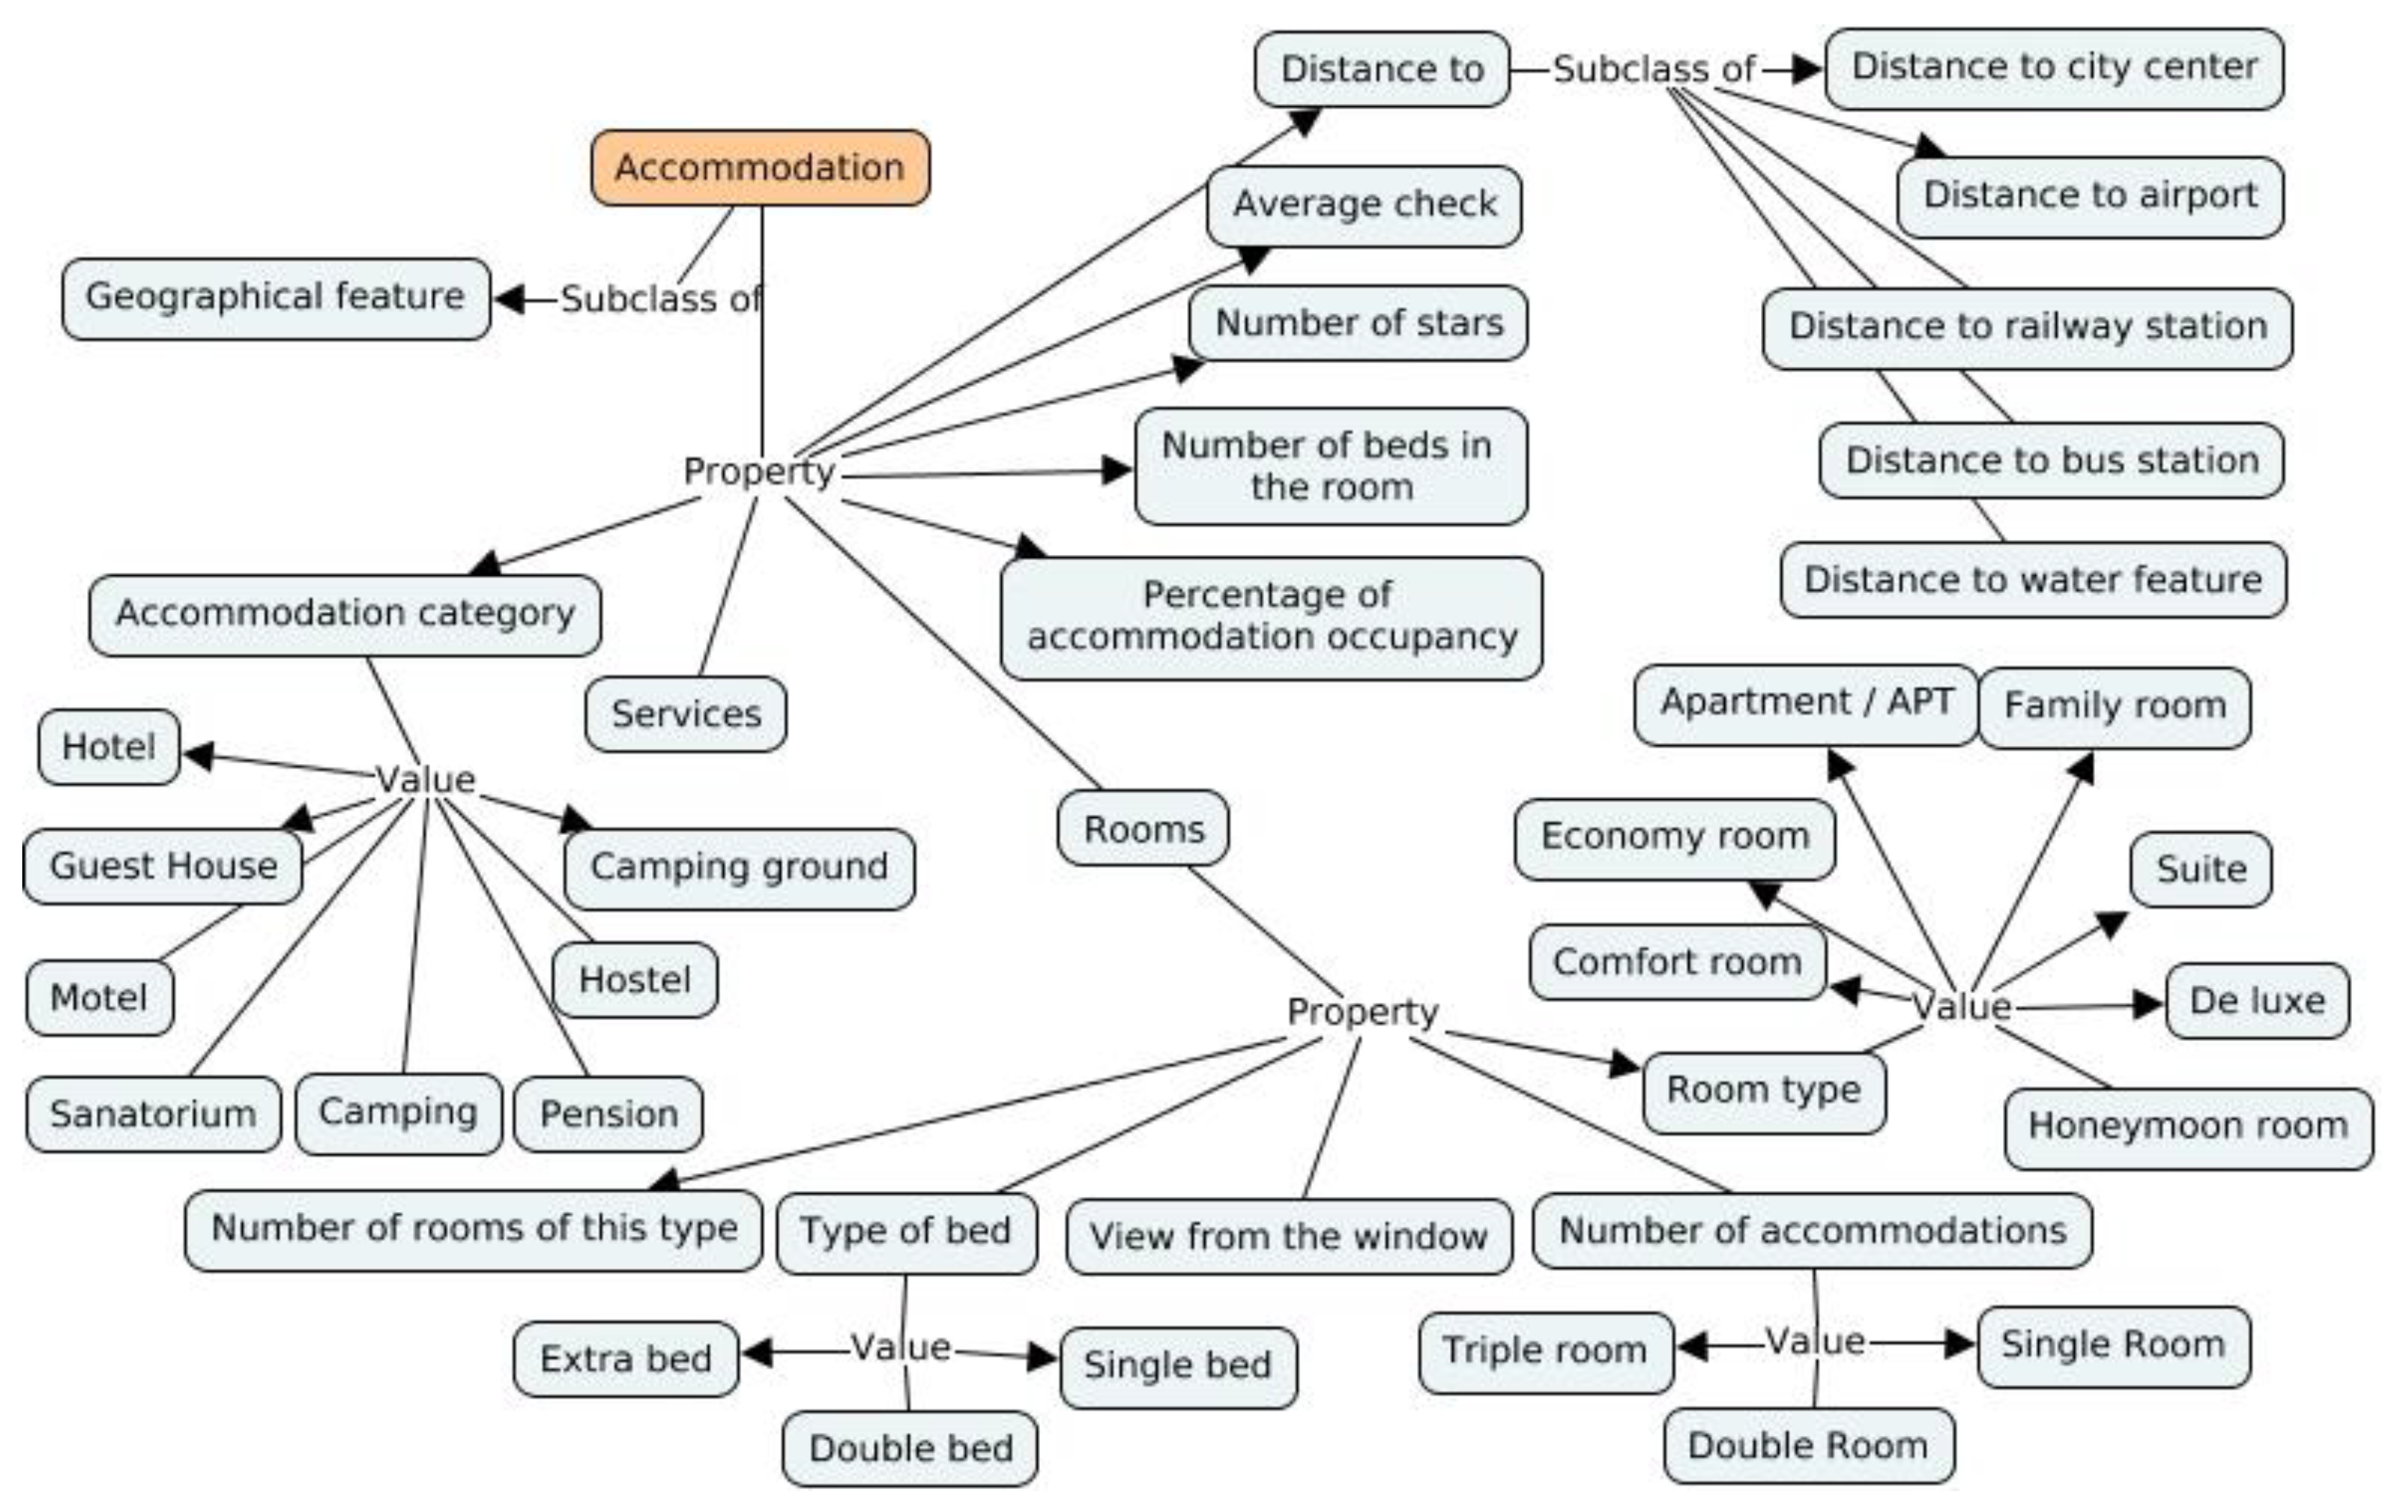
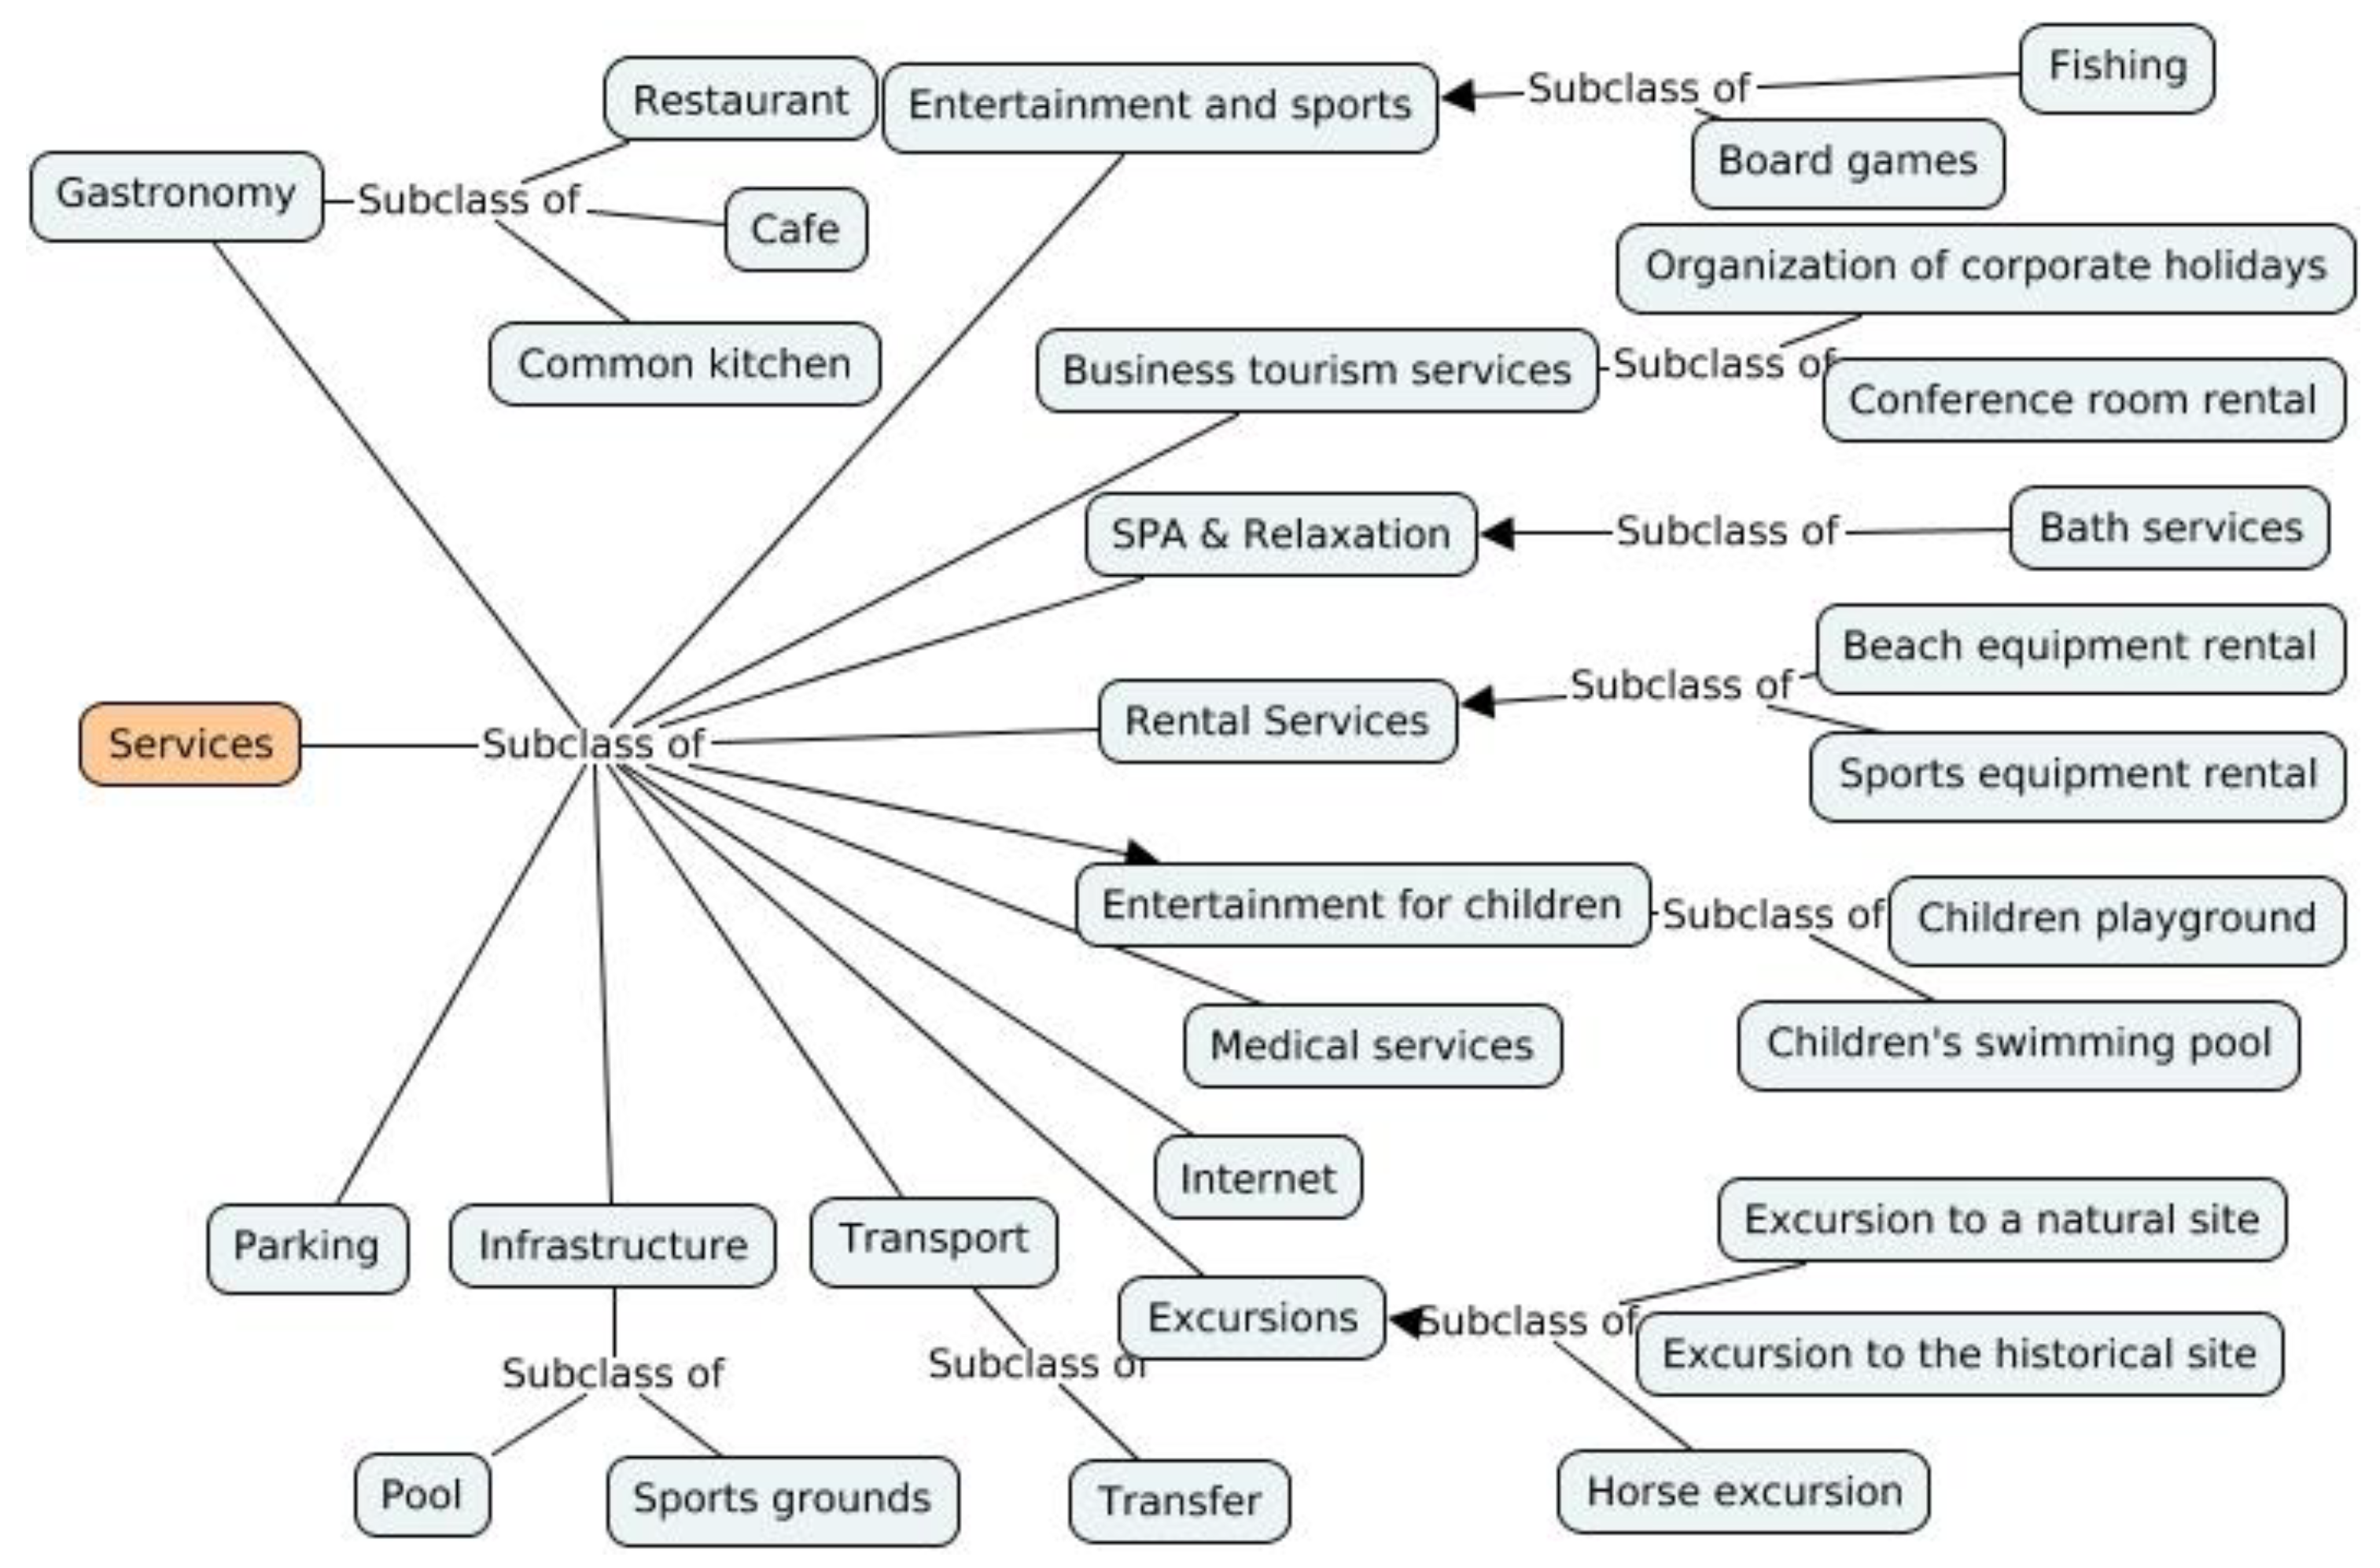
Within the scope of this work, we propose ontologies of catering establishments (
Figure 2), public accommodation facilities (
Figure 3), services provided by them (
Figure 4), and routes (excursions) (
Figure 5).
6. Methods for data collection and processing
Data analysis comprises the following main stages (Cross-Industry Process for Data Mining): problem definition, data extraction (collection, description, examination, quality verification), data preparation (cleaning, transformation, integration, formatting), data exploration and visualization, prediction model creation (algorithm selection, model training, quality evaluation), model validation and testing, interpretation of results.
To implement the function of a territory tourist profile formation service, it is necessary to solve the tasks of data collection, their statistical processing, and visualization.
6.1. Data collection methods
Obtaining data from web resources is mainly done using the following methods:
Obtaining data using online surveys is time-consuming and may not provide complete information. The availability of ready-made databases allows obtaining structured data, but finding suitable databases freely available is quite difficult, if not impossible. The API method is easy to implement, but services rarely provide free and unrestricted data through APIs. Additionally, this method does not allow for analysis of reviews and their ratings. The web scraping method is designed to extract data from the structure of markup of dynamic web sources and is based on the automatic navigation of pages of the web source with the subsequent extraction of the necessary information from the DOM structure, simulating user behavior. For solving the given tasks, this method is the most promising.
The web scraping consists of the following main stages [
24,
25]:
Extracting the markup of the web source page. This is done via HTTP requests to the resource and saving the retrieved data in a variable or HTML code files of the webpage;
Extracting information from the HTML code structure. This is based on searching for specified paths to the markup elements: tag names, attributes, and their values;
Saving the data in a structured format and further processing;
Optionally: repeating the actions;
Within the scope of the present research, the data collection implementation can be described as gathering links to the necessary objects and then traversing them to extract detailed information and record it in a table about the objects. Implementation of the method’s algorithm has some special features, such as its uniqueness for each data source and the necessity of making changes over time, since the website markup may be changed by its developers.
6.2. Methods for data cleaning and integration
Based on the proposed ontologies, the collected data from various sources undergo processing, including optional geocoding (if the coordinates of an object are unknown) and transformations to obtain a list of unique objects (
Figure 6).
Manual verification of the dataset is necessary because different sources may store records of the same object with errors. For example, there may be inconsistencies in the object name, house number, coordinates, different towns may have the same name, etc. The identified values are used to determine the maximum distance between the coordinates of the records, which is defined as a threshold value. Then, the closest record is searched for (closeness is determined based on the threshold values) using the average value of normalized distance indicators: the Levenshtein distance is used when searching for object names, town names, addresses, and the Haversine formula is used for the distance between coordinates.
Object identification is followed by calculations of average values of cost, user ratings, and summing the number of reviews, as well as by determining service categories and their popularity.
6.3. Methods for Text Analysis (Reviews)
The data obtained in the form of short texts (reviews) from social networks undergo the following processing stages:
Data preparation for analysis includes excluding foreign texts or translating them, for example using the Translator module [
26];
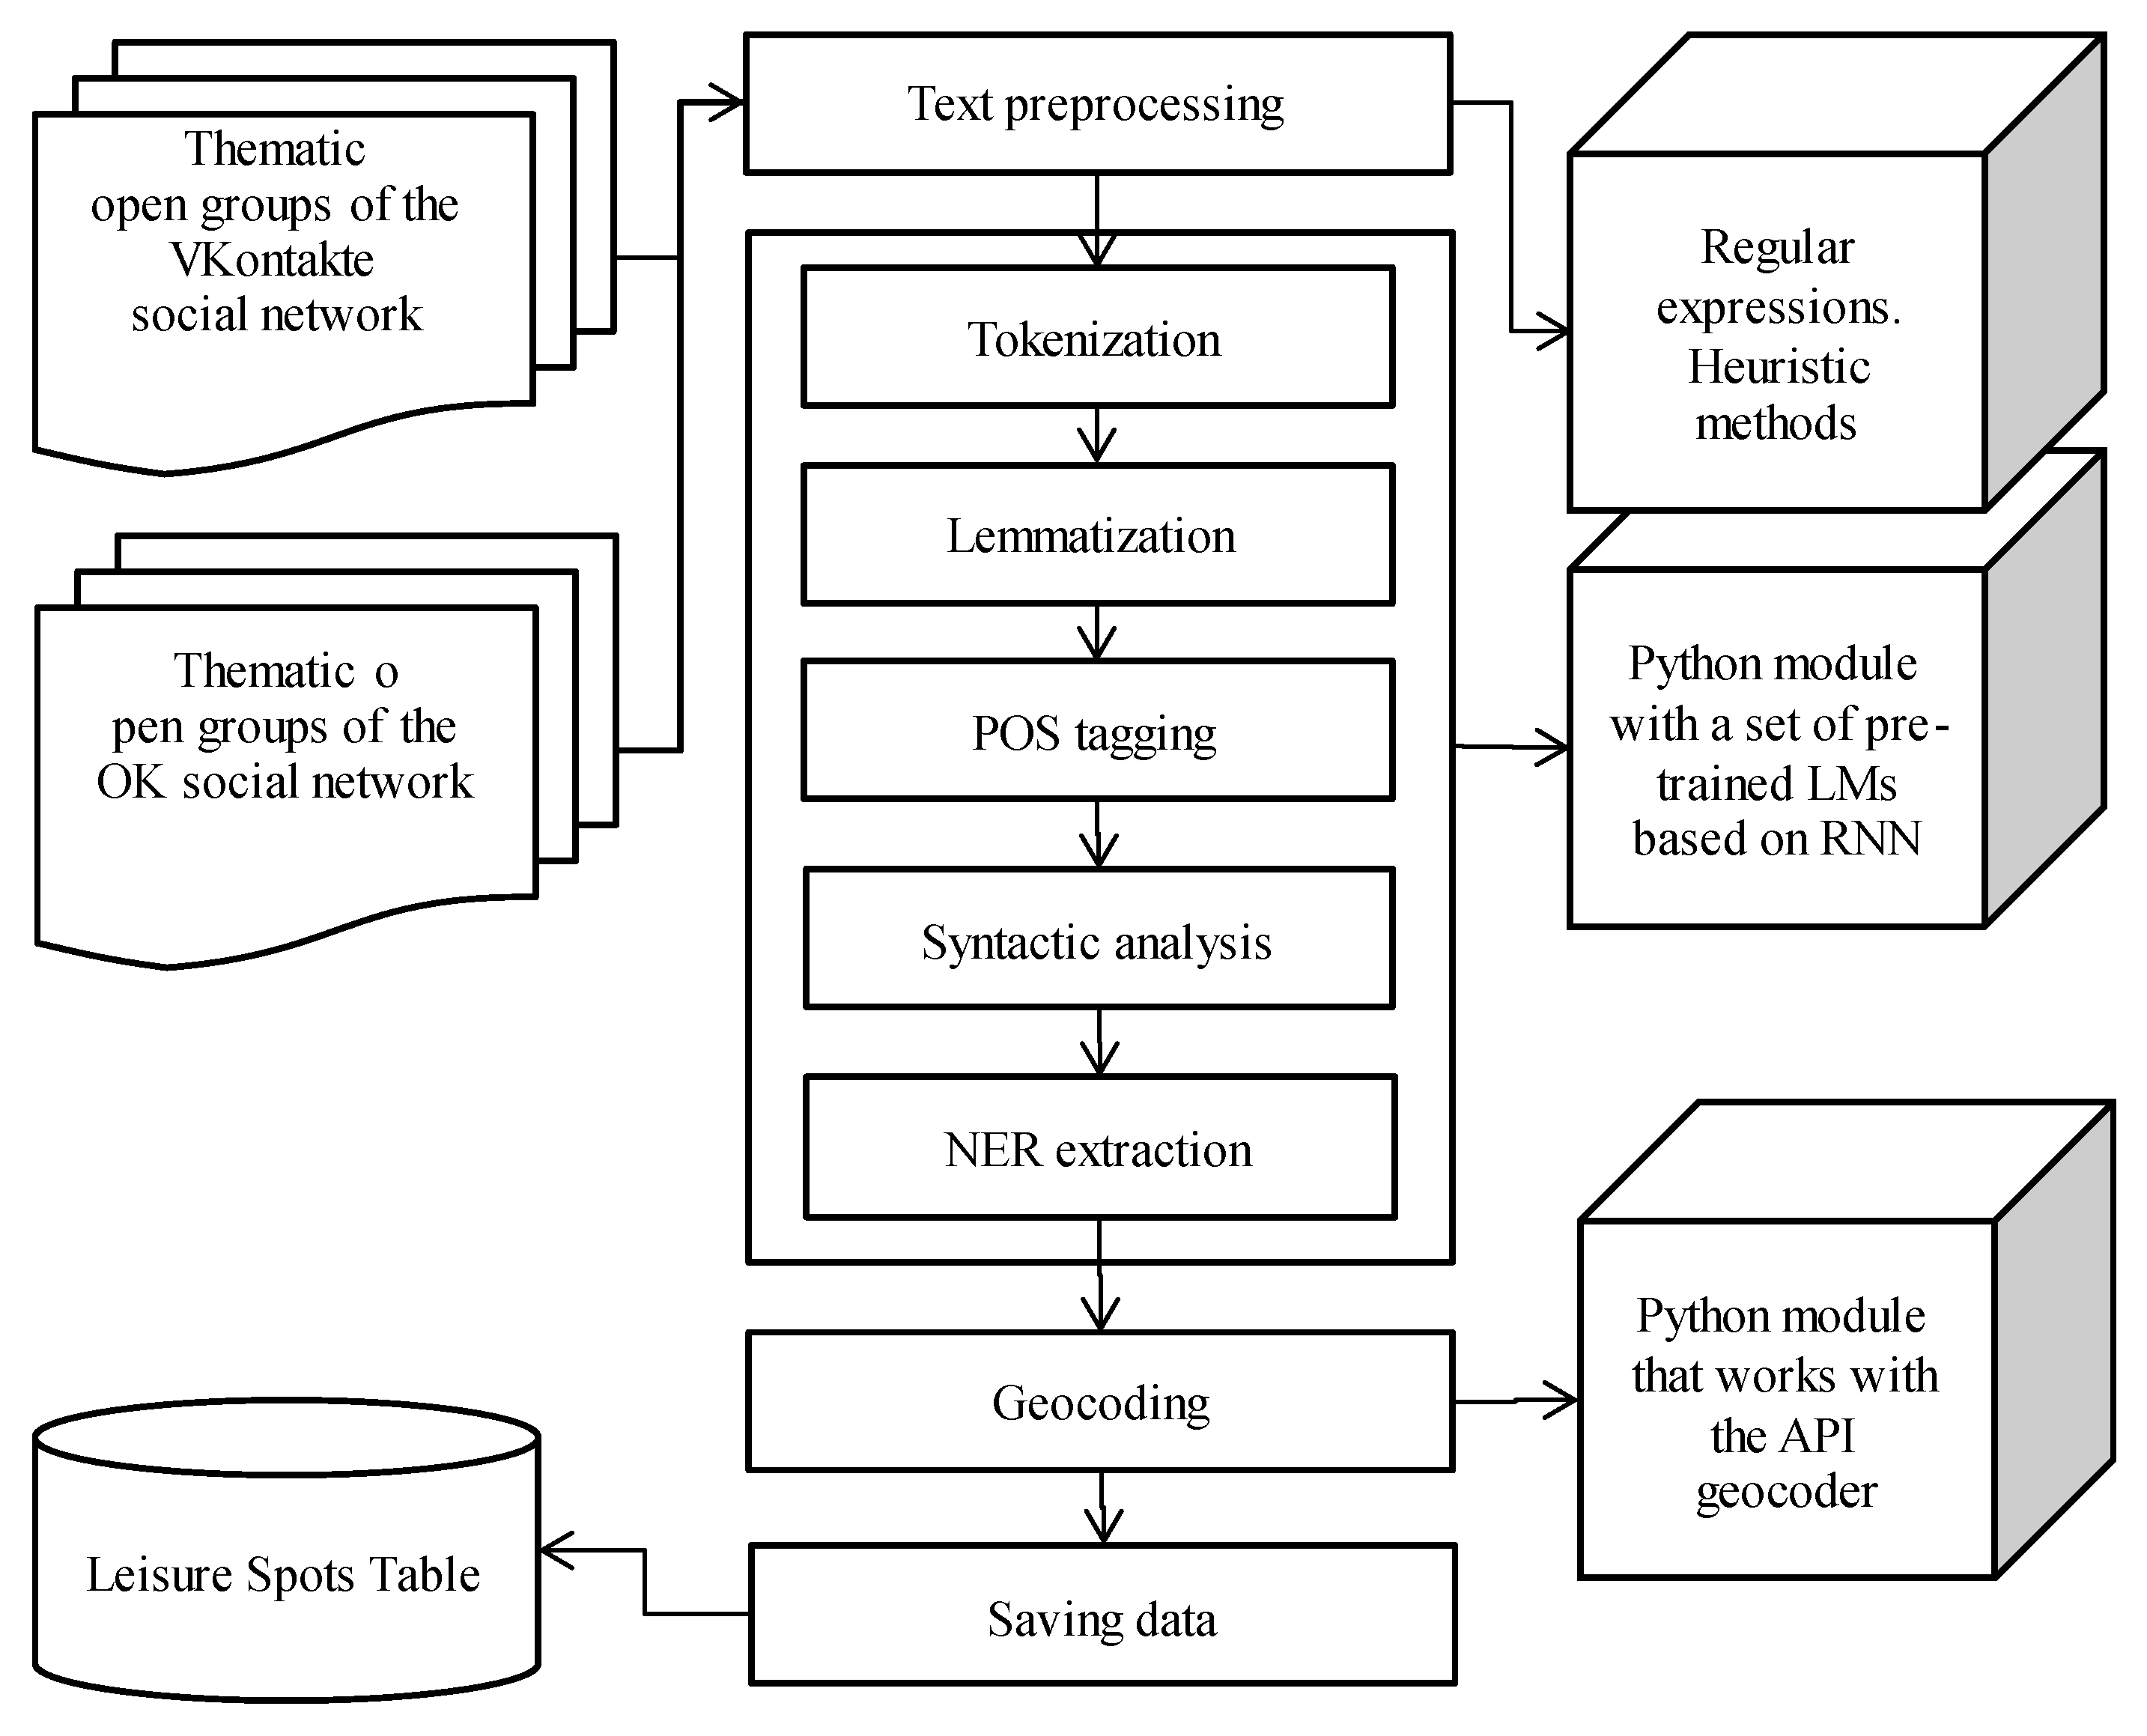
Text tokenization: splitting the text into individual words, excluding all other elements (punctuation marks, emojis, and other symbols). It is performed using regular expressions and specialized methods;
Named Entity Recognition (NER). In the context of the task at hand, this means identifying locations of popular recreational places using the Stanza library [
27,
28];
Text lemmatization: bringing words to their base form or stemming, i.e., extracting the word stem. Lemmatization is carried out using the Pymorphy2 library, which also allows for morphological analysis (part-of-speech tagging), i.e., it determines parts of speech. As a result, prepositions are excluded from further analysis;
Removing stop words (commonly used words that do not carry significant information);
Creating a dictionary specific to the task at hand, which allows for semantic analysis of the text to identify entities, actions, descriptions, and their connections to locations. All this forms knowledge base about flora and fauna, infrastructure objects, and other territorial characteristics;
Sentiment analysis of the text: determining the sentiment based on classifying characteristics into negative and positive classes, allowing for additional identification of issues and preferences related to locations. This is done using a method that converts tokens into numerical vectors (embedding), followed by a classification through a neural network.
Each stage of the text analysis (tokenization, lemmatization, syntactic analysis, named entity recognition) employs neural networks (
Figure 7).
6.4. Data visualization methods
The main task of visualization is to support users in the process of perceiving, understanding, and comprehending information, as well as forming new knowledge, while minimizing the effort required to perform cognitive tasks compared to textual data representation. Cloud computing technologies, such as Business Intelligent Systems (BI systems/platforms), are becoming increasingly relevant for data visualization and processing. These systems provide the ability to analyze and display various data and information related to the task at hand. Among the existing platforms, Tableau, Power BI, Yandex DataLens, and others can be distinguished. These platforms have the following main functionalities: data visualization, automatic discovery of dependencies and hidden correlations, creation of interactive reports, deep analytics, integration with other tools (Excel, Google Sheets), and machine learning.
These systems allow for efficient data visualization using information panels (commonly known as dashboards) consisting of multiple charts and diagrams, with the ability for interactive user interaction.
In the case of developing a service on a multifunctional platform like Yandex.Cloud, it is advisable to use the Yandex DataLens visualization tool provided by this platform.
7. Implementation of monitoring service
The proposed technology for collecting, processing, and presenting socio-ecological-economic data on the current state of regional tourism is planned to be implemented using the Yandex.Cloud platform based on a microservices architecture approach. Cloud functions [
29] are proposed as a means of implementing computational blocks, message queues [
30] – for organizing data exchange channels, API Gateway [
31] – for overall service integration, and PostgreSQL – for data storage.
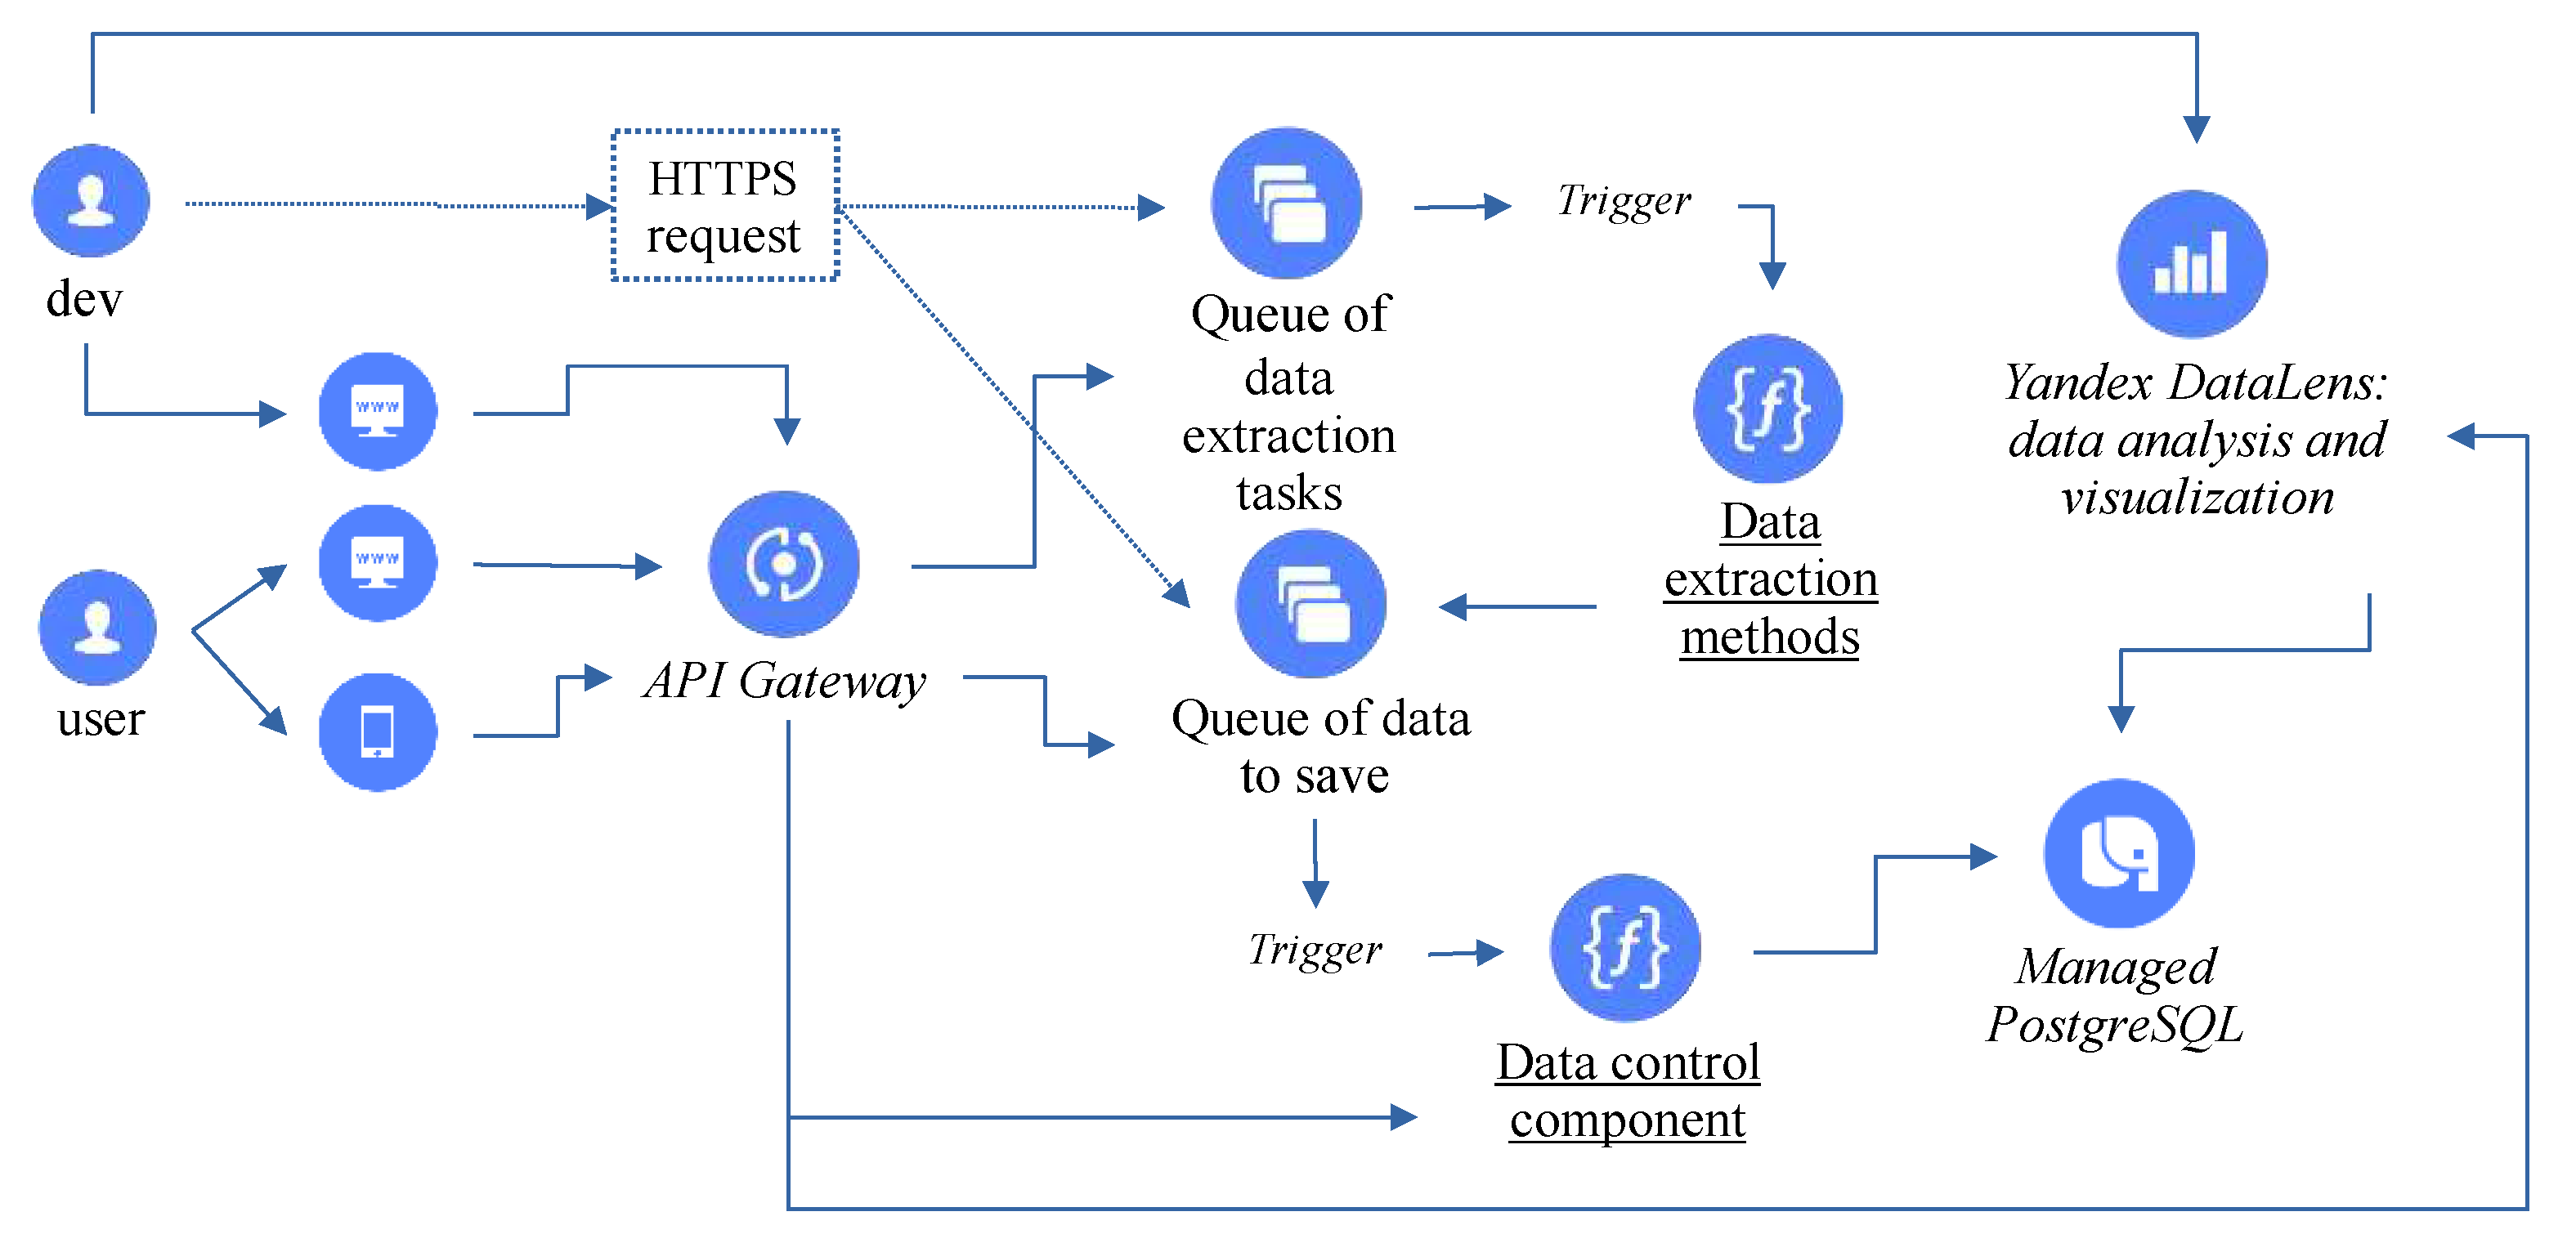
The current view of the software system architecture implementing the proposed technology is shown in
Figure 8.
Users of the software system are divided into two main groups. The first group are developers who, after authentication, have full access to functionality. The second group are regular users who do not require authentication and have access only to informational resources containing the results of the analysis of collected data. This classification is not exhaustive but is sufficient for the current stage of the development process.
The information collection is based on two message queues. The first queue contains information about the sources that need to be processed. It operates by one message-one source system, for example, a request to the API of the VKontakte social network and its parameters (
Figure 8, Information Extraction Tasks). The second queue contains the processing results to be recorded in PostgreSQL as one message-one row in the target table. (
Figure 8, Queue for Data Input into the Database). The built-in trigger mechanism is used to process messages in the queue, which transfers messages to a cloud function-handler in the form of an array with a fixed maximum length. The following functions are used to extract information from external sources: get_vk() and get_ok(), to retrieve data about community posts and comments from the VK and OK social networks, respectively. The database records the data using the data-controller component from the AI PaaS platform, which utilizes a snapshot of the database structure to minimize required access rights (no access to metadata is needed) and improve performance. In a regular operation mode, the management of adding messages to the Queue of Information Extraction Tasks is implemented within the API Gateway specification. However, for testing and debugging purposes, developers have the ability to access the queues in write-only mode (highlighted with dashed lines in the diagram) through the built-in HTTPS queue interface.
To visualize the results of the analysis of collected data, including when employing GIS capacities, we propose to use a specialized Yandex DataLens tool from Yandex.Cloud platform. This service allows for the creation of various graphs, charts, and layers for displaying geoinformation within a specialized user interface, which supports analytics throughout creating the desired visualization panel, from forming a query to the database to selecting a method for visualizing the results. The ability to parameterize the created display tools allows them to be used as a means of implementing data analysis functions in the developed software system.
Integration of individual blocks into a software system is performed using the API Gateway service by creating a specification in the OpenAPI 3.0 format, which declaratively represents the functions of the target software system as a set of URL addresses and specifies how incoming requests to these addresses will be processed. The following options are used in this work: integration with Object Storage, which is used to represent the static content of the software system (HTML code, JavaScript and CSS files); calls to cloud functions that facilitate interaction with the database and work with data collection and processing methods (data preparation, geocoding); integration with message queues, which allows us to manage gathering of information from external sources. In addition, the API Gateway specification provides a solution for the necessary and tedious task of organizing access control to the software system. In this work, we use the authorization mechanism based on Yandex OAuth [
32].
8. The results of data collection and analysis
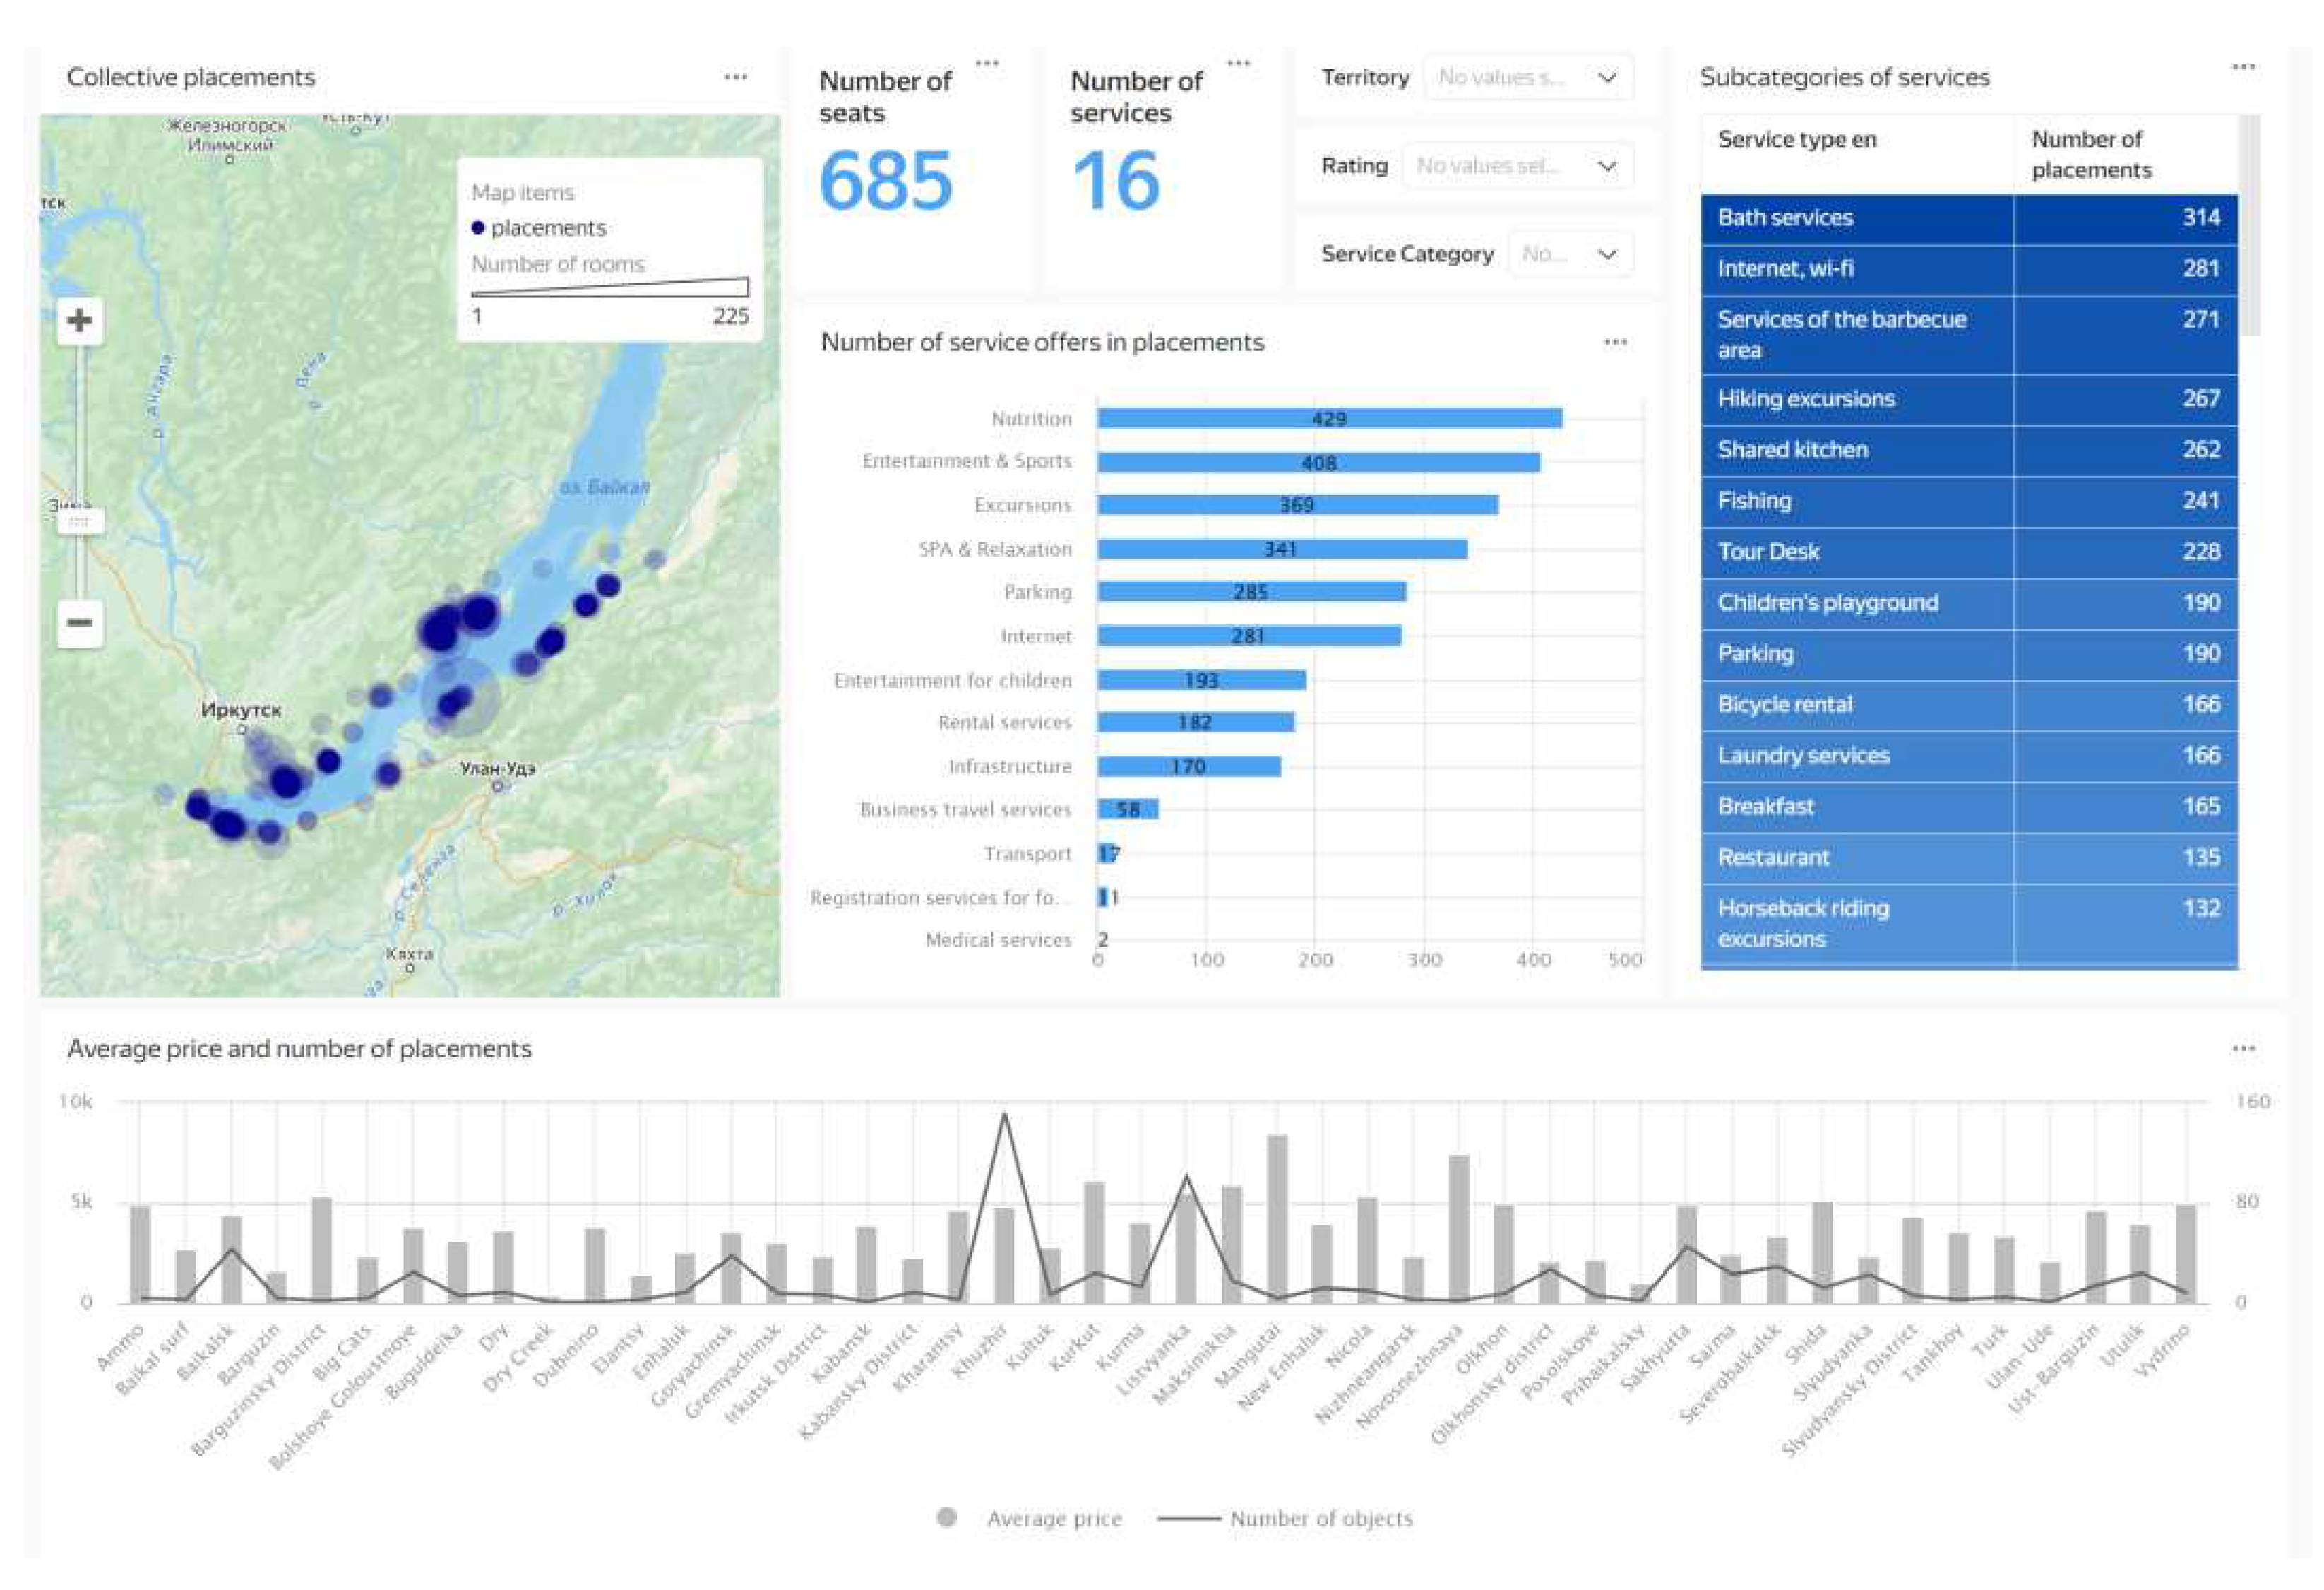
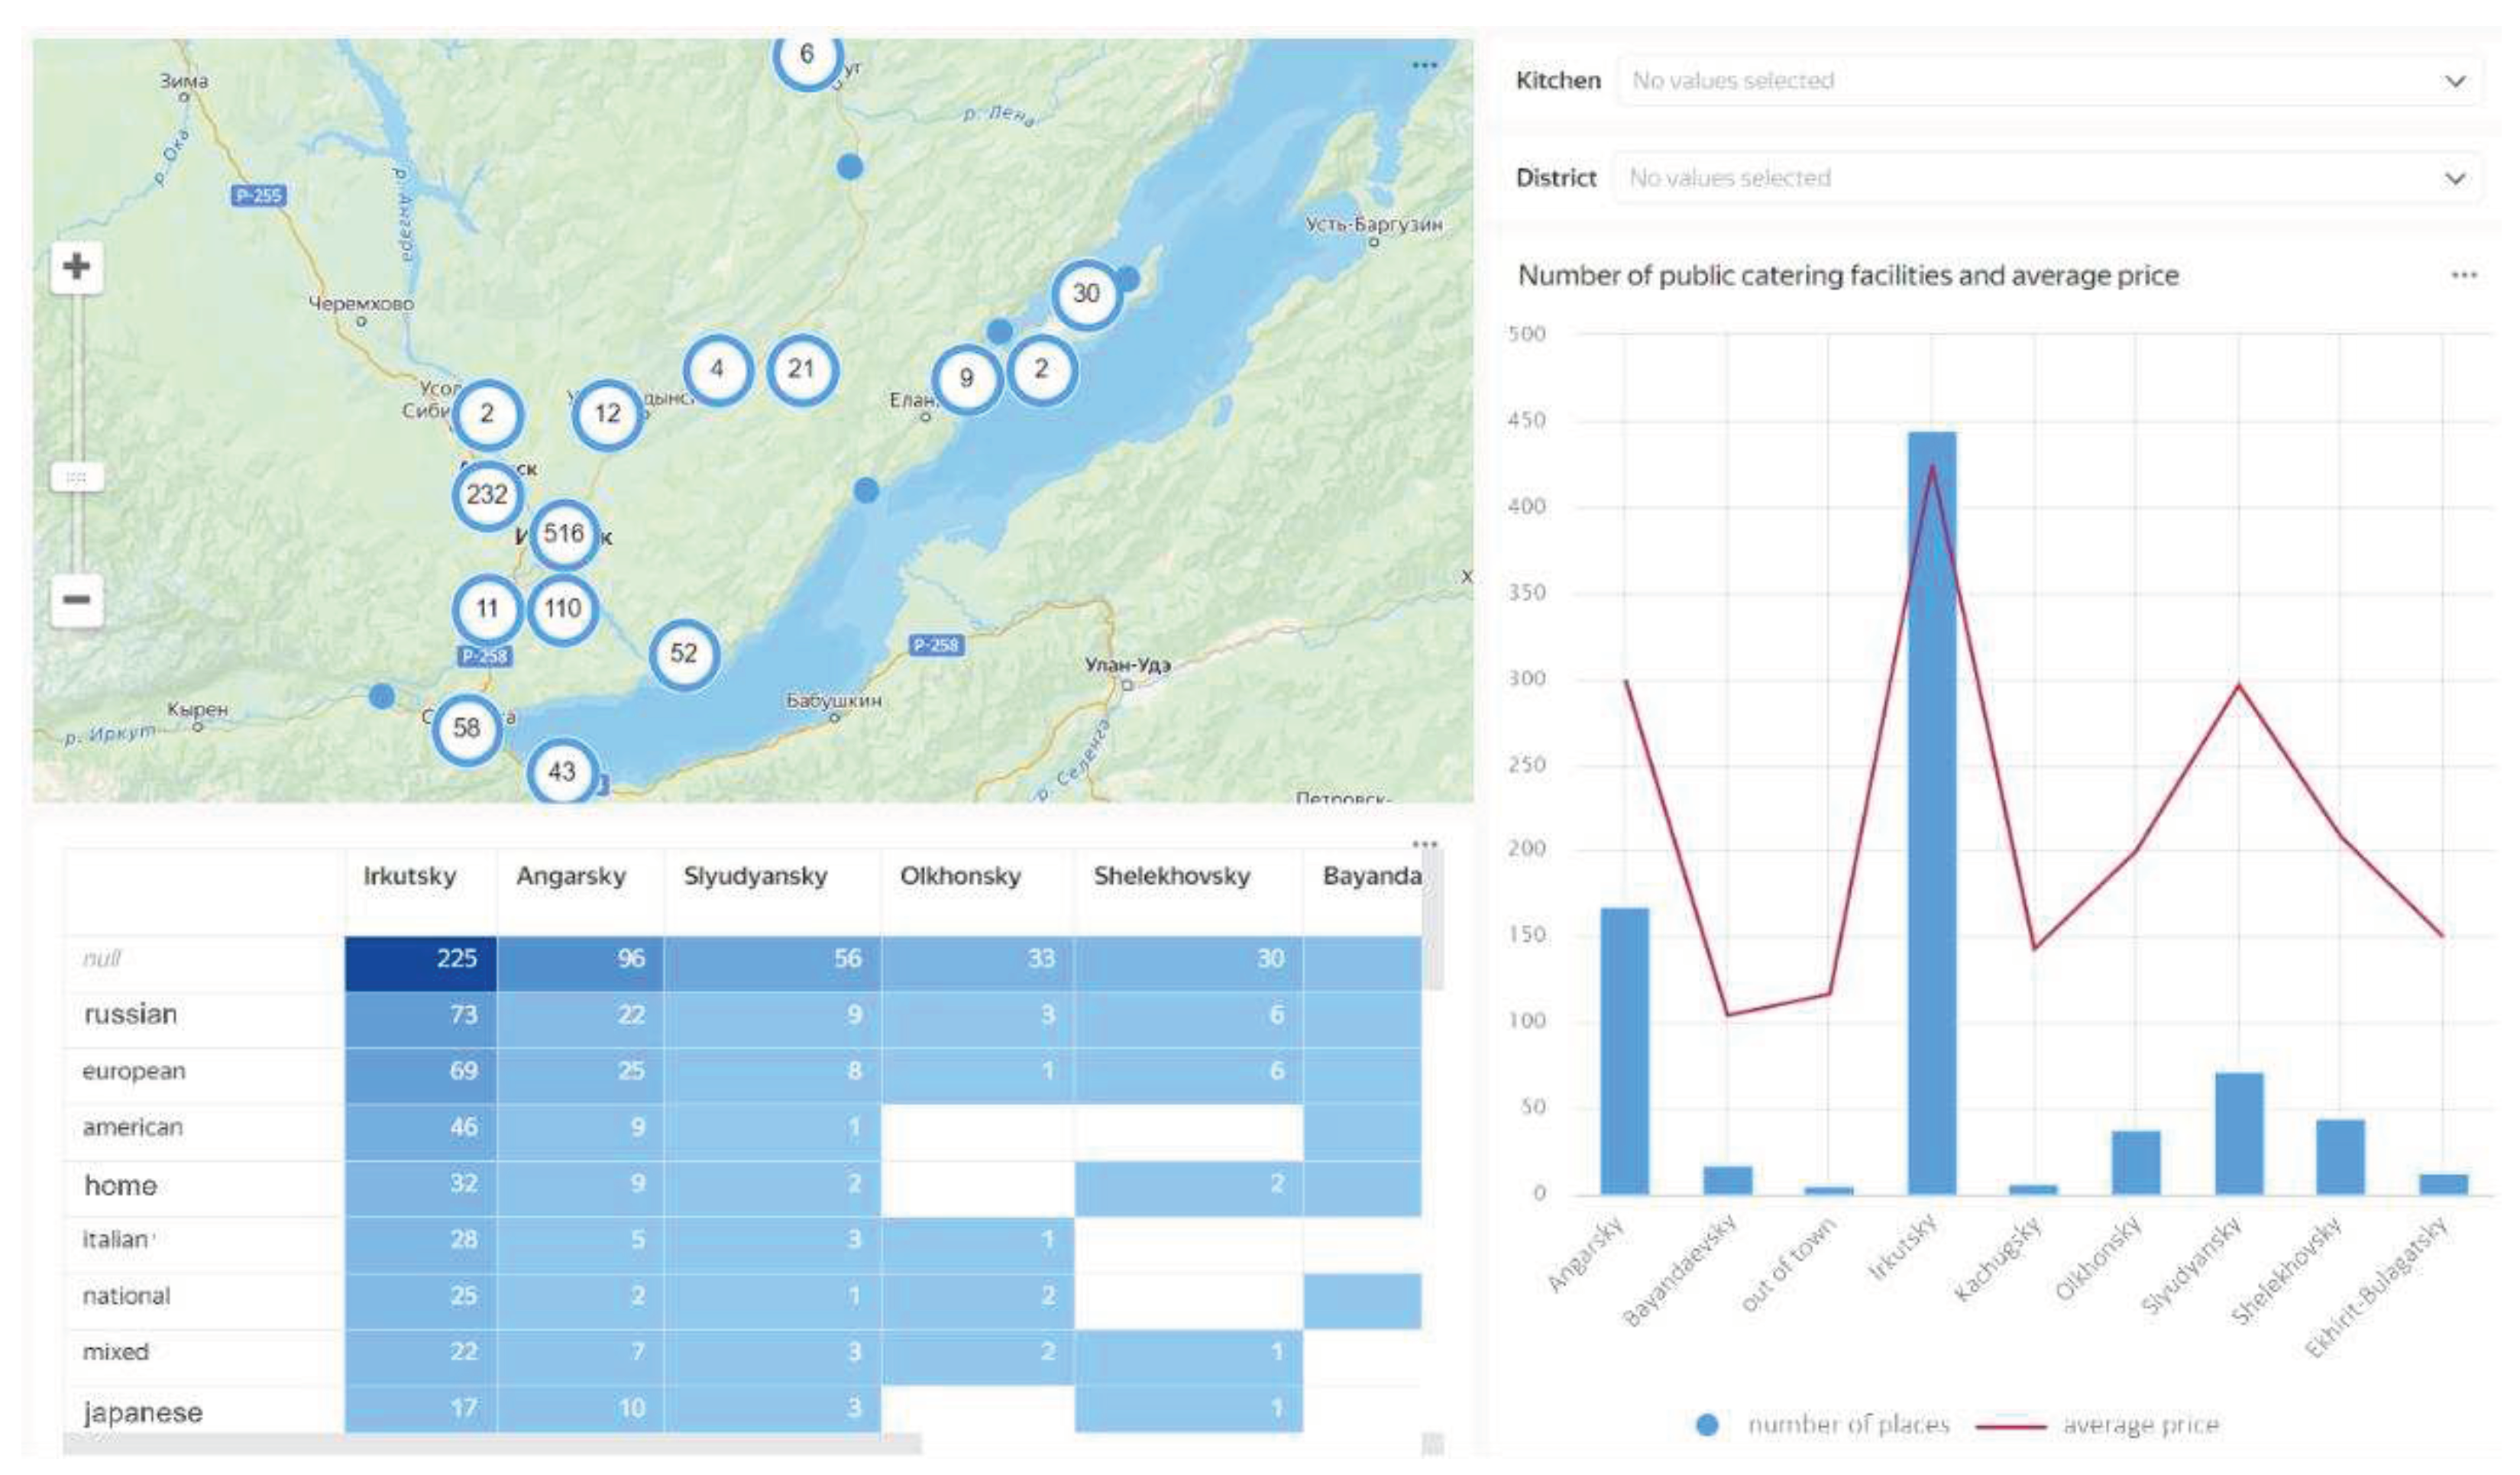
Currently, information has been collected and processed for the following tourist attractions: 1163 (685) accommodation facilities (the first figure is the number of objects for which information has been collected, including geolocation, the figure in brackets shows number of identified objects), 61 (16) services, 809 catering establishments, 395 (352) attractions, 94 tourist routes and excursions.
We implemented the following information dashboards:
Among the 339 places rated as “Excellent”, services in the Entertainment and Sports category are more common. Detailed categorizations reveals that accommodation facilities often offer walking tours. Businesses may employ this way of creating service lists, as it is characterized by high user ratings.
The largest number of accommodations is found in the Olkhon District, in the village of Khuzhir. The highest average bill is charged by accommodations in the settlements of Mangutae and Novosnezhnaya, located in the southern part of Lake Baikal. These areas also have a low number of facilities, which can be explained by low competition and low recreational load.
9. Discussion and conclusions
Existing software services solve the problems of monitoring territorial tourism on the basis of official statistical information received by government authorities, or data received from tourists as a result of special agreements. It should be noted that there is a situation where the territorial authorities do not have complete and up-to-date information about tourism. Data from open sources, mainly data from social networks, is used as part of individual studies of tourist cities or attractions.
In this study, work has begun on the creation of information technology that allows, based on data from open sources, information web resources and social networks, to form a tourist profile of the territory, which will later become the basis for research for the creation of methods and decision support software for tourists, business and territorial authorities.
In this paper described the concept of service, justified methods of data analysis and visualization, built an ontological model, defined the content of dashboards, implemented a prototype of a service, and demonstrated the results of data collection, processing and presentation obtained from the research.
Currently, within the proposed concept of service, a prototype of the function for tourist profile formation of the territory using the Lake Baikal area as an example.
It should be noted an important feature that the developed methods, implemented within the framework of the cloud platform, will allow collecting and processing data on the territory with a given frequency, forming various trends that characterize the dynamics of the tourism sector.
In the future, the efforts of the authors will be directed to the analysis of social network data to obtain detailed information about tourist routes: popularity, quality of services, social and environmental problems and their workload. This aspect will allow assessing the recreational load of the territory and making decisions for the further development of tourism.
Author Contributions
Conceptualization, Olga Nikolaychuk and Yulia Pestova; methodology, Olga Nikolaychuk, Yulia Pestova and Alexander Pavlov; software, Yulia Pestova, Evgeniy Kosogorov and Alexander Pavlov; validation, Olga Nikolaychuk and Yulia Pestova; writing—original draft preparation, review and editing, Olga Nikolaychuk; visualization, Yulia Pestova and Evgeniy Kosogorov; project administration, Olga Nikolaychuk. All authors have read and agreed to the published version of the manuscript.
Funding
This work was supported by Russian Science Foundation, Project No. 23-28-00844 (the project “Monitoring of regional tourism based on analysis of data from open sources”).
Institutional Review Board Statement
Not applicable.
Informed Consent Statement
Not applicable.
Data Availability Statement
Not applicable.
Acknowledgments
We would like to thank Ivan Poddubny, master student of the Institute of Mathematics and Information Technologies of the Irkutsk State University, for technical support during data processing and writing section 6.3 of the article “Methods for Text Analysis (Reviews)”.
Conflicts of Interest
The authors declare no conflict of interest.
References
- A United Nations Specialized Agency of World Tourism Organization. Available online: https://www.unwto.org/sustainable-development (accessed on 22 March 2023).
- International Network of Sustainable Tourism Observatories of World Tourism Organization. Available online: https://www.unwto.org/insto/observatories/ (accessed on 22 March 2023).
- SHAPETOURISM OBSERVATORY. Available online: https://www.quantitas.it/data/shapetourism/build/index.php (accessed on 12 January 2023).
- Destination NSW. Available online: https://www.destinationnsw.com.au/about-us (accessed on 15 January 2023).
- Lobao, F.; Aparicio, M.; Neto, M. SMART TOURISM -CITY TOURISM RADAR: A Tourism Monitoring Tool at the City of Lisbon. In Proceedings of the 19.the Conference of the Portuguese Association of Information Systems, CAPSI ’2019, Lisbon, Portugal, 2019; pp. 1–21. [Google Scholar]
- Li, H. , Hu, M., Li, G. Forecasting tourism demand with multisource big data. Ann. Tour. Res. 2020, 83, 102912. [Google Scholar] [CrossRef]
- Soualah-Alila, F.; Coustaty, M.; Rempulski, N.; Doucet, A. DataTourism: Designing an Architecture to Process Tourism Data. In Information and Communication Technologies in Tourism; Inversini, A., Schegg, R., Eds.; Springer: Cham, Switzerland, 2016. [Google Scholar] [CrossRef]
- Rubtsova, N.V. Formation of the System for Monitoring the Efficiency of Regional Tourist-Recreational Services. World Econ. Manag. 2019, 19, 101–110. [Google Scholar] [CrossRef]
- Li, J.; Xu, L.; Tang, L.; Wang, S.; Li, L. Big data in tourism research: A literature review. Tour. Manag. 2018, 68, 301–323. [Google Scholar] [CrossRef]
- Wikipedia. Irkutsk Oblast. Available online: https://en.wikipedia.org/wiki/Irkutsk_Oblast (accessed on 22 March 2023).
- Wikipedia. Lake Baikal. Available online: https://en.wikipedia.org/wiki/Lake_Baikal (accessed on 22 March 2023).
- The Irkutsk region took 15th place in the National Tourist Rating. Available online: http://www.irk.ru/news/20220113/rating/ (accessed on 15 May 2023).
- Tourism. Federal State Statistics Service. Available online: https://rosstat.gov.ru/statistics/turizm (accessed on 10 May 2023).
- AWS. Available online: https://aws.amazon.com (accessed on 10 December 2022).
- Google Cloud. Available online: https://cloud.google.com (accessed on 10 December 2022).
- Enterprise Cloud from, VK. Available online:. Available online: https://mcs.mail.ru/cloud-platform (accessed on 10 December 2022).
- Yandex Cloud. Available online: https://cloud.yandex.ru (accessed on 10 December 2022).
- Kotelnikov, D. A. Formation of a system of indicators for monitoring the sustainable development of tourist areas. In Competition of scientific innovations: prospects for the development of science in the modern world: Collection of articles based on the materials of the All-Russian research competition; Limited Liability Company “Scientific Publishing Center “Herald of Science”: Ufa, Russia, 2020; pp. 41–50. [Google Scholar]
- Lebedeva, Y.A. Organization of monitoring of the quality of tourist services at the municipal level: monograph. – 2020; Publishing House “Sreda”: Cheboksary, Russia, 2020. [Google Scholar] [CrossRef]
- Garrido, P. , Barrachina, J., Martinez, F. J., Seron, F. J. Smart Tourist Information Points by Combining Agents, Semantics and AI Techniques. Comput. Sci. Inf. Syst. 2017, 14, 1–23. [Google Scholar] [CrossRef]
- Mendoza-Moreno, J.F. , Santamaria-Granados, L., Fraga, V.A., Ramirez-Gonzalez, G. OntoTouTra: Tourist Traceability Ontology Based on Big Data Analytics. Appl. Sci. 2021, 11, 11061. [Google Scholar] [CrossRef]
- Pai, M.-Y. , Wang, D.-C., Hsu, T.-H., Lin, G.-Y., Chen, C.-C. On Ontology-Based Tourist Knowledge Representation and Recommendation. Appl. Sci. 2019, 9, 5097. [Google Scholar] [CrossRef]
- UNESCO Thesaurus. Available online: https://vocabularies.unesco.org/browser/thesaurus/ru/ (accessed on 20 May 2023).
- Mitchell, R. Web Scraping with Python: Collecting Data from the Modern. Web, 2nd ed.; O’Reilly Media, 2018. [Google Scholar]
- Moskalenko, A.A. , Laponina, O. R., Sukhomlin V.A. System for managing access to web application resources based on user behavior analysis. Int. J. Open Inf. Technol. 2020, 8, 30–35. [Google Scholar]
- Github.com. Available online: https://github.com/UlionTse/translators (accessed on 01 September 2022).
- Stanza. Available online: https://stanfordnlp.github.io/stanza/ (accessed on 01 September 2022).
- Qi, P.; , Zhang, Y., Zhang, Y.J., Bolton, C.D. Manning Stanza: A Python Natural Language Processing Toolit for Many Human Languages. Available online: https://arxiv.org/pdf/2003.07082.pdf (accessed on 11 July 2023).
- Yandex Cloud. Cloud Functions comparison with other Yandex Cloud services. Available online: https://cloud.yandex.com/en/docs/functions/service-comparison (accessed on 11 July 2023).
- Yandex Cloud. Message queues. Available online: https://cloud.yandex.com/en/docs/message-queue/concepts/queue (accessed on 11 July 2023).
- Yandex Cloud. Resource relationships in API Gateway. Available online: https://cloud.yandex.com/en/docs/api-gateway/concepts/ (accessed on 11 July 2023).
- Pavlov, A.I.; Stolbov, A.B.; Lempert, A.A. Towards extensibility features of knowledge-based systems development platform. In 4th Scientific-Practical Workshop Information Technologies: Algorithms, Models, Systems; Bychkov, I.V., Karastoyanov, D., Eds.; CEUR Workshop Proceedings, 2021; Volume 2984, pp. 87–94.
|
Disclaimer/Publisher’s Note: The statements, opinions and data contained in all publications are solely those of the individual author(s) and contributor(s) and not of MDPI and/or the editor(s). MDPI and/or the editor(s) disclaim responsibility for any injury to people or property resulting from any ideas, methods, instructions or products referred to in the content. |
© 2023 by the authors. Licensee MDPI, Basel, Switzerland. This article is an open access article distributed under the terms and conditions of the Creative Commons Attribution (CC BY) license (http://creativecommons.org/licenses/by/4.0/).
