Submitted:
03 August 2023
Posted:
07 August 2023
You are already at the latest version
Abstract
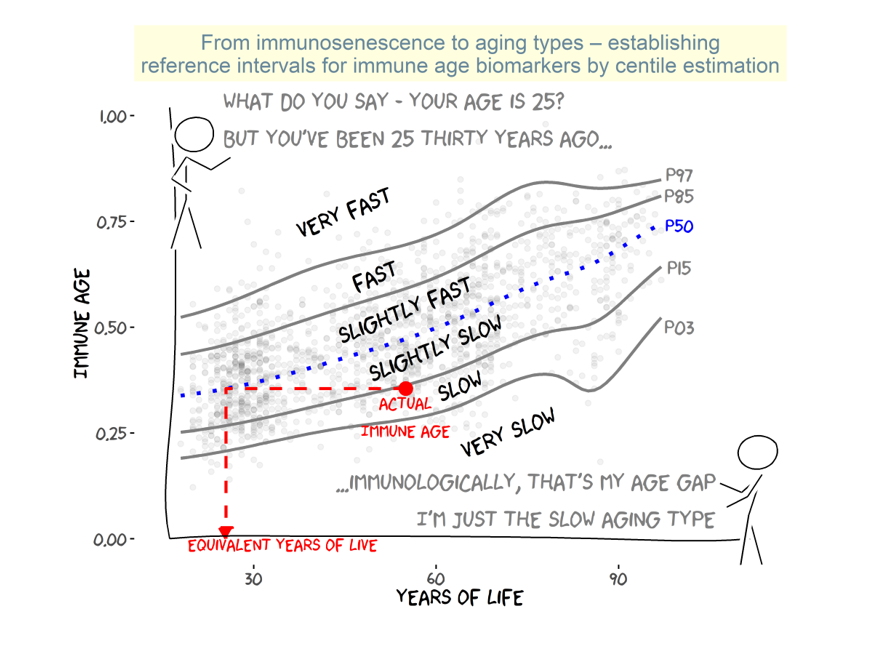
Keywords:
1. Introduction
2. Results
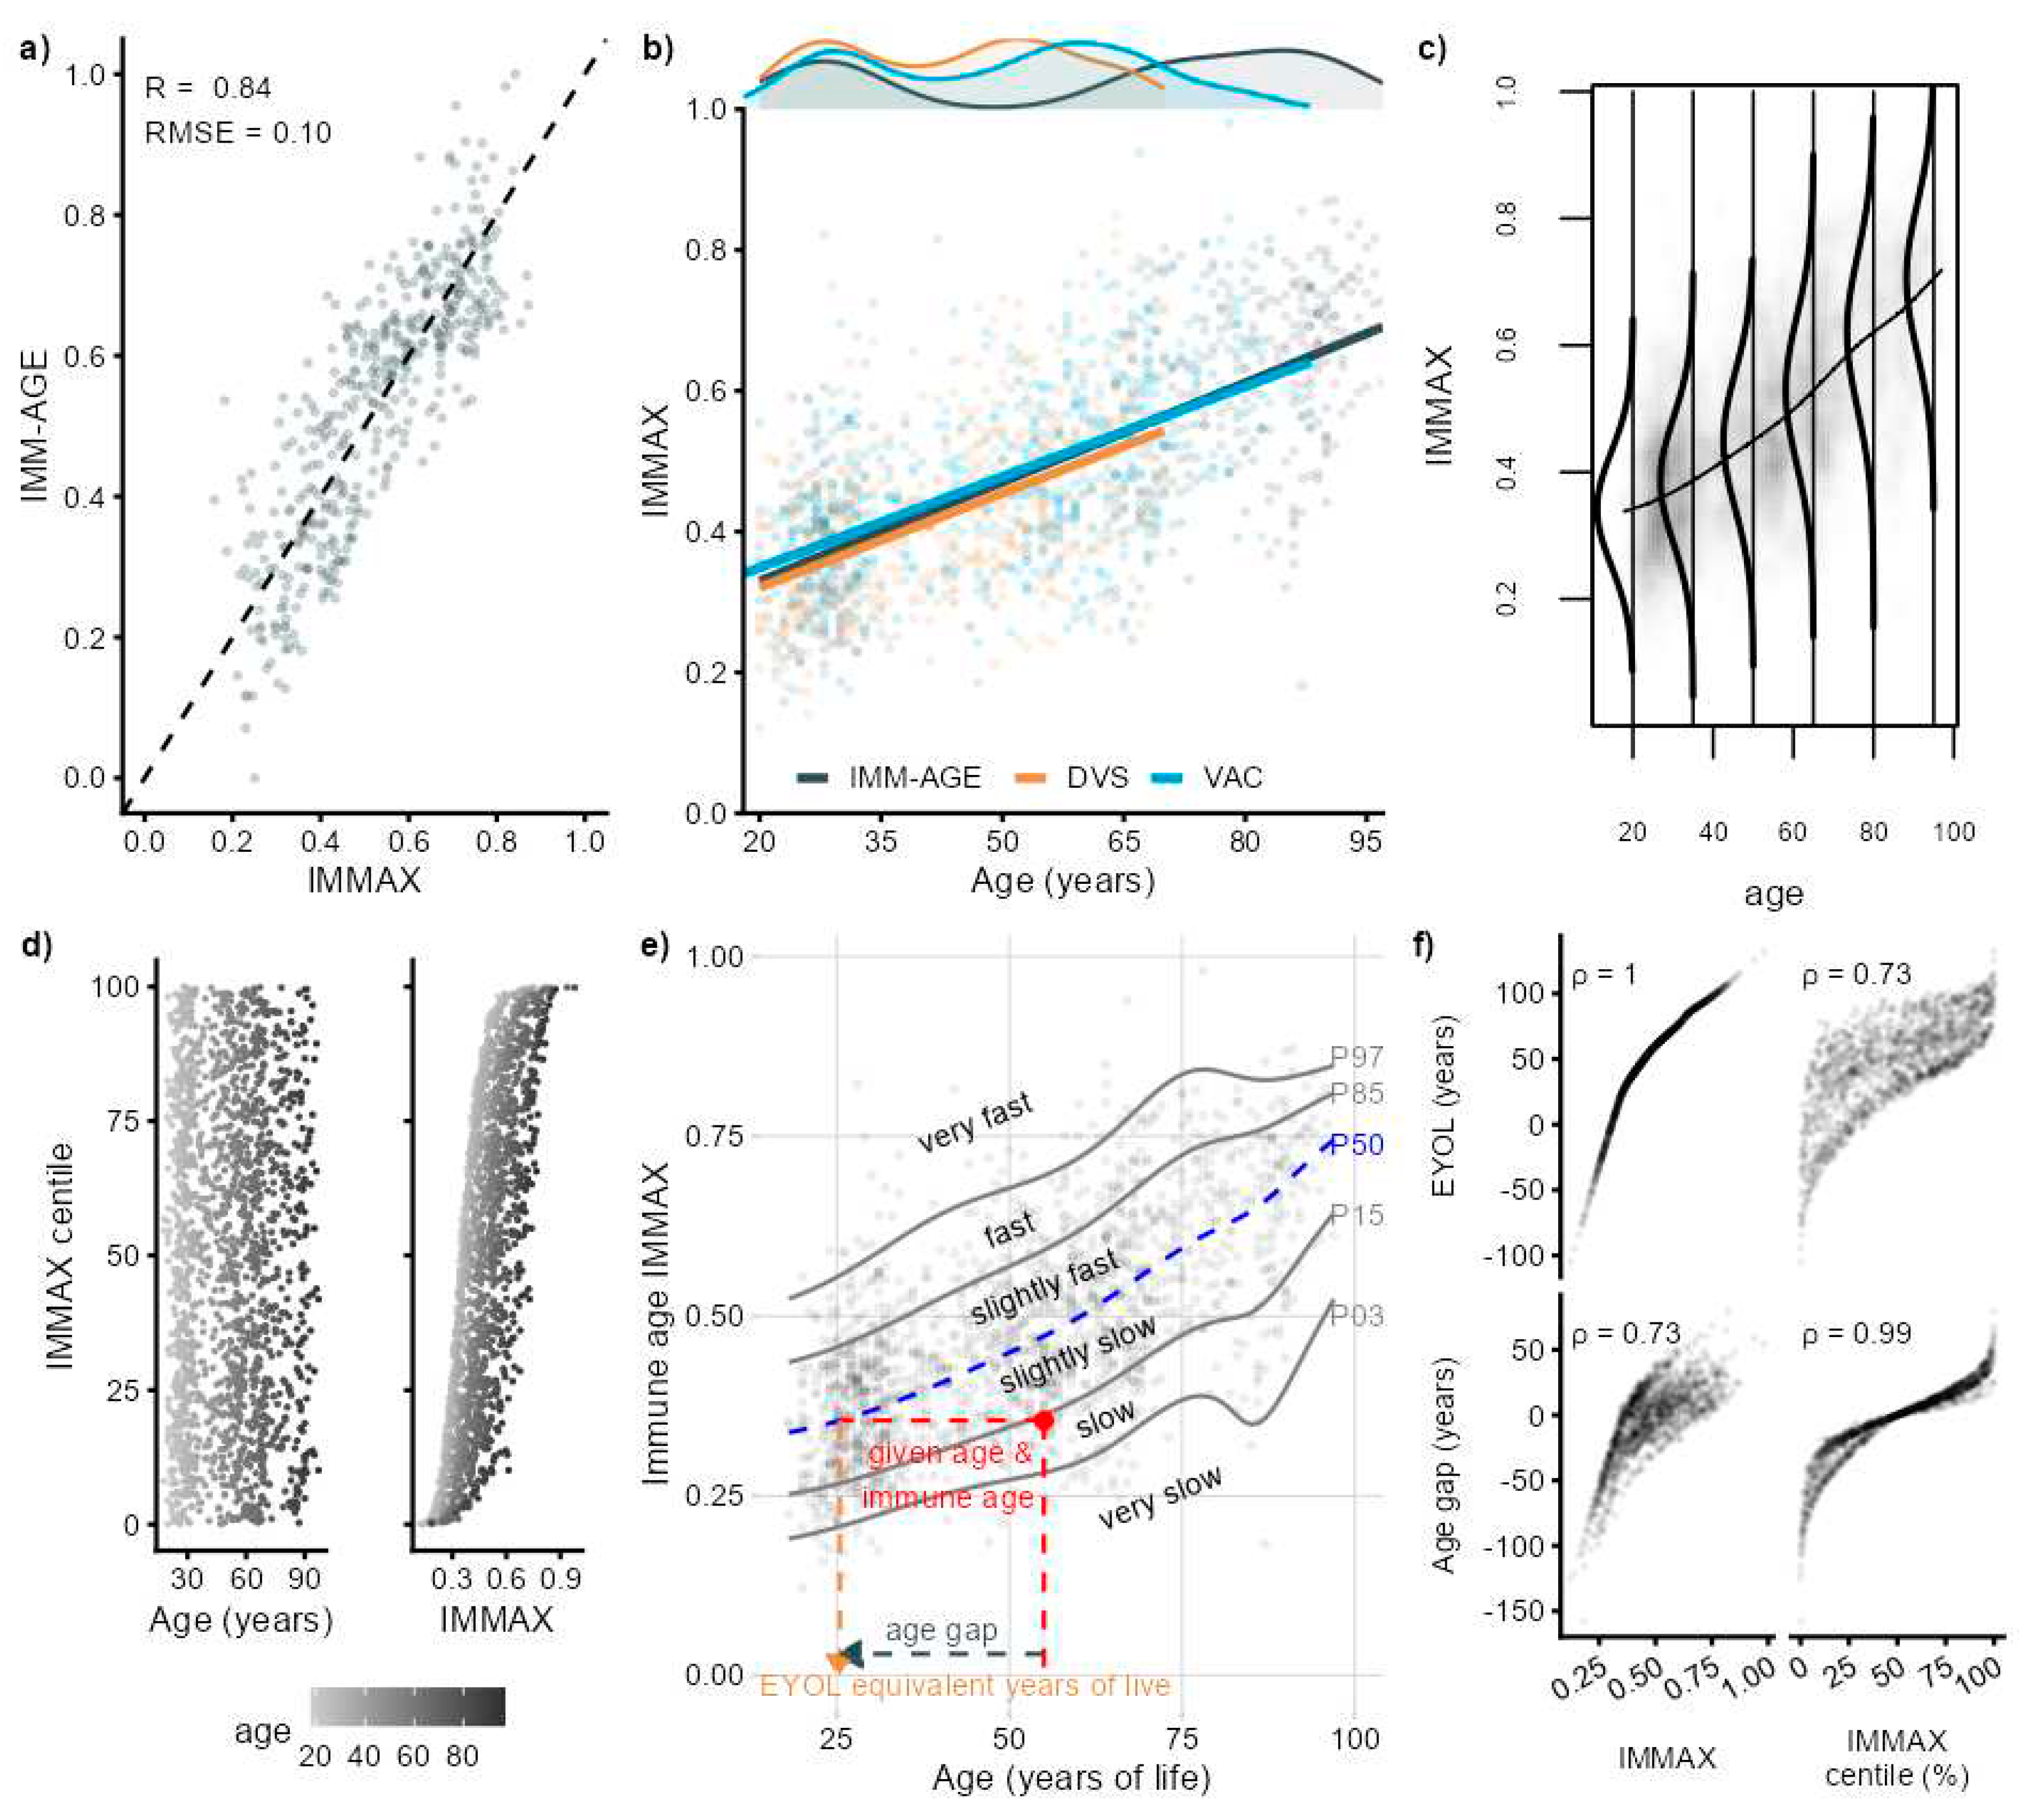
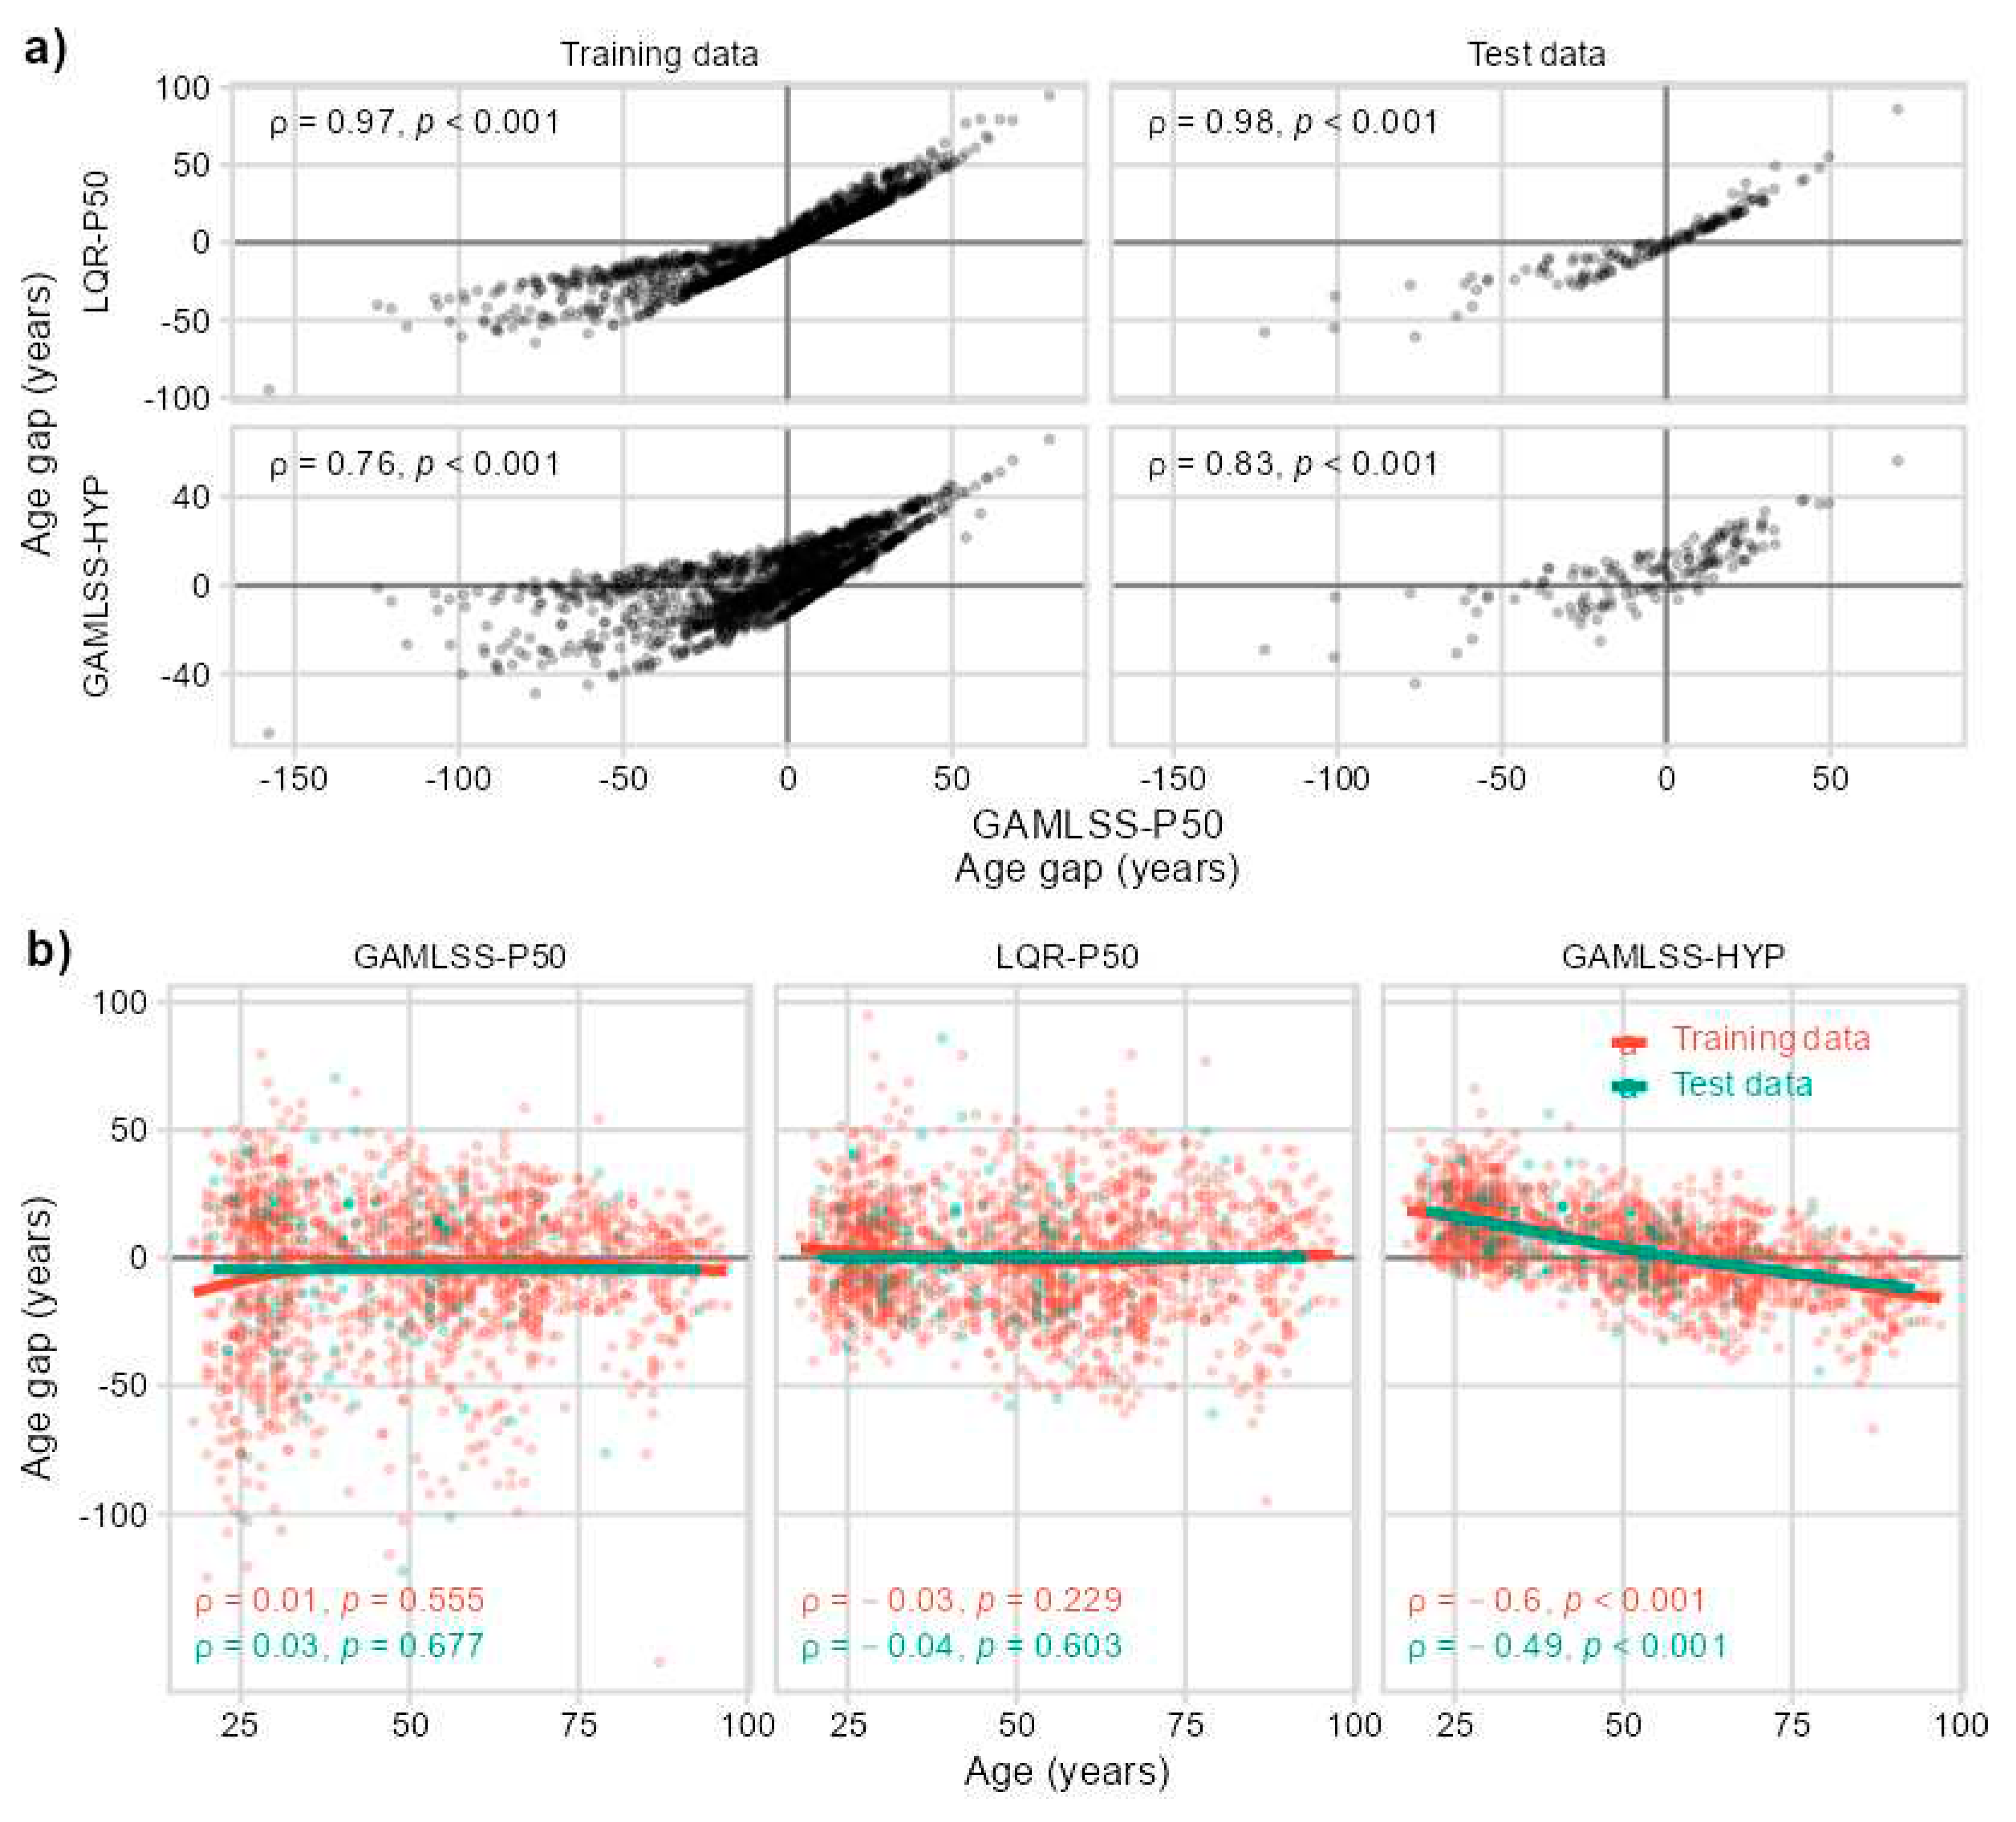
2.1. IMMAX Centile Estimation, Immunological Aging Types and Age Gap
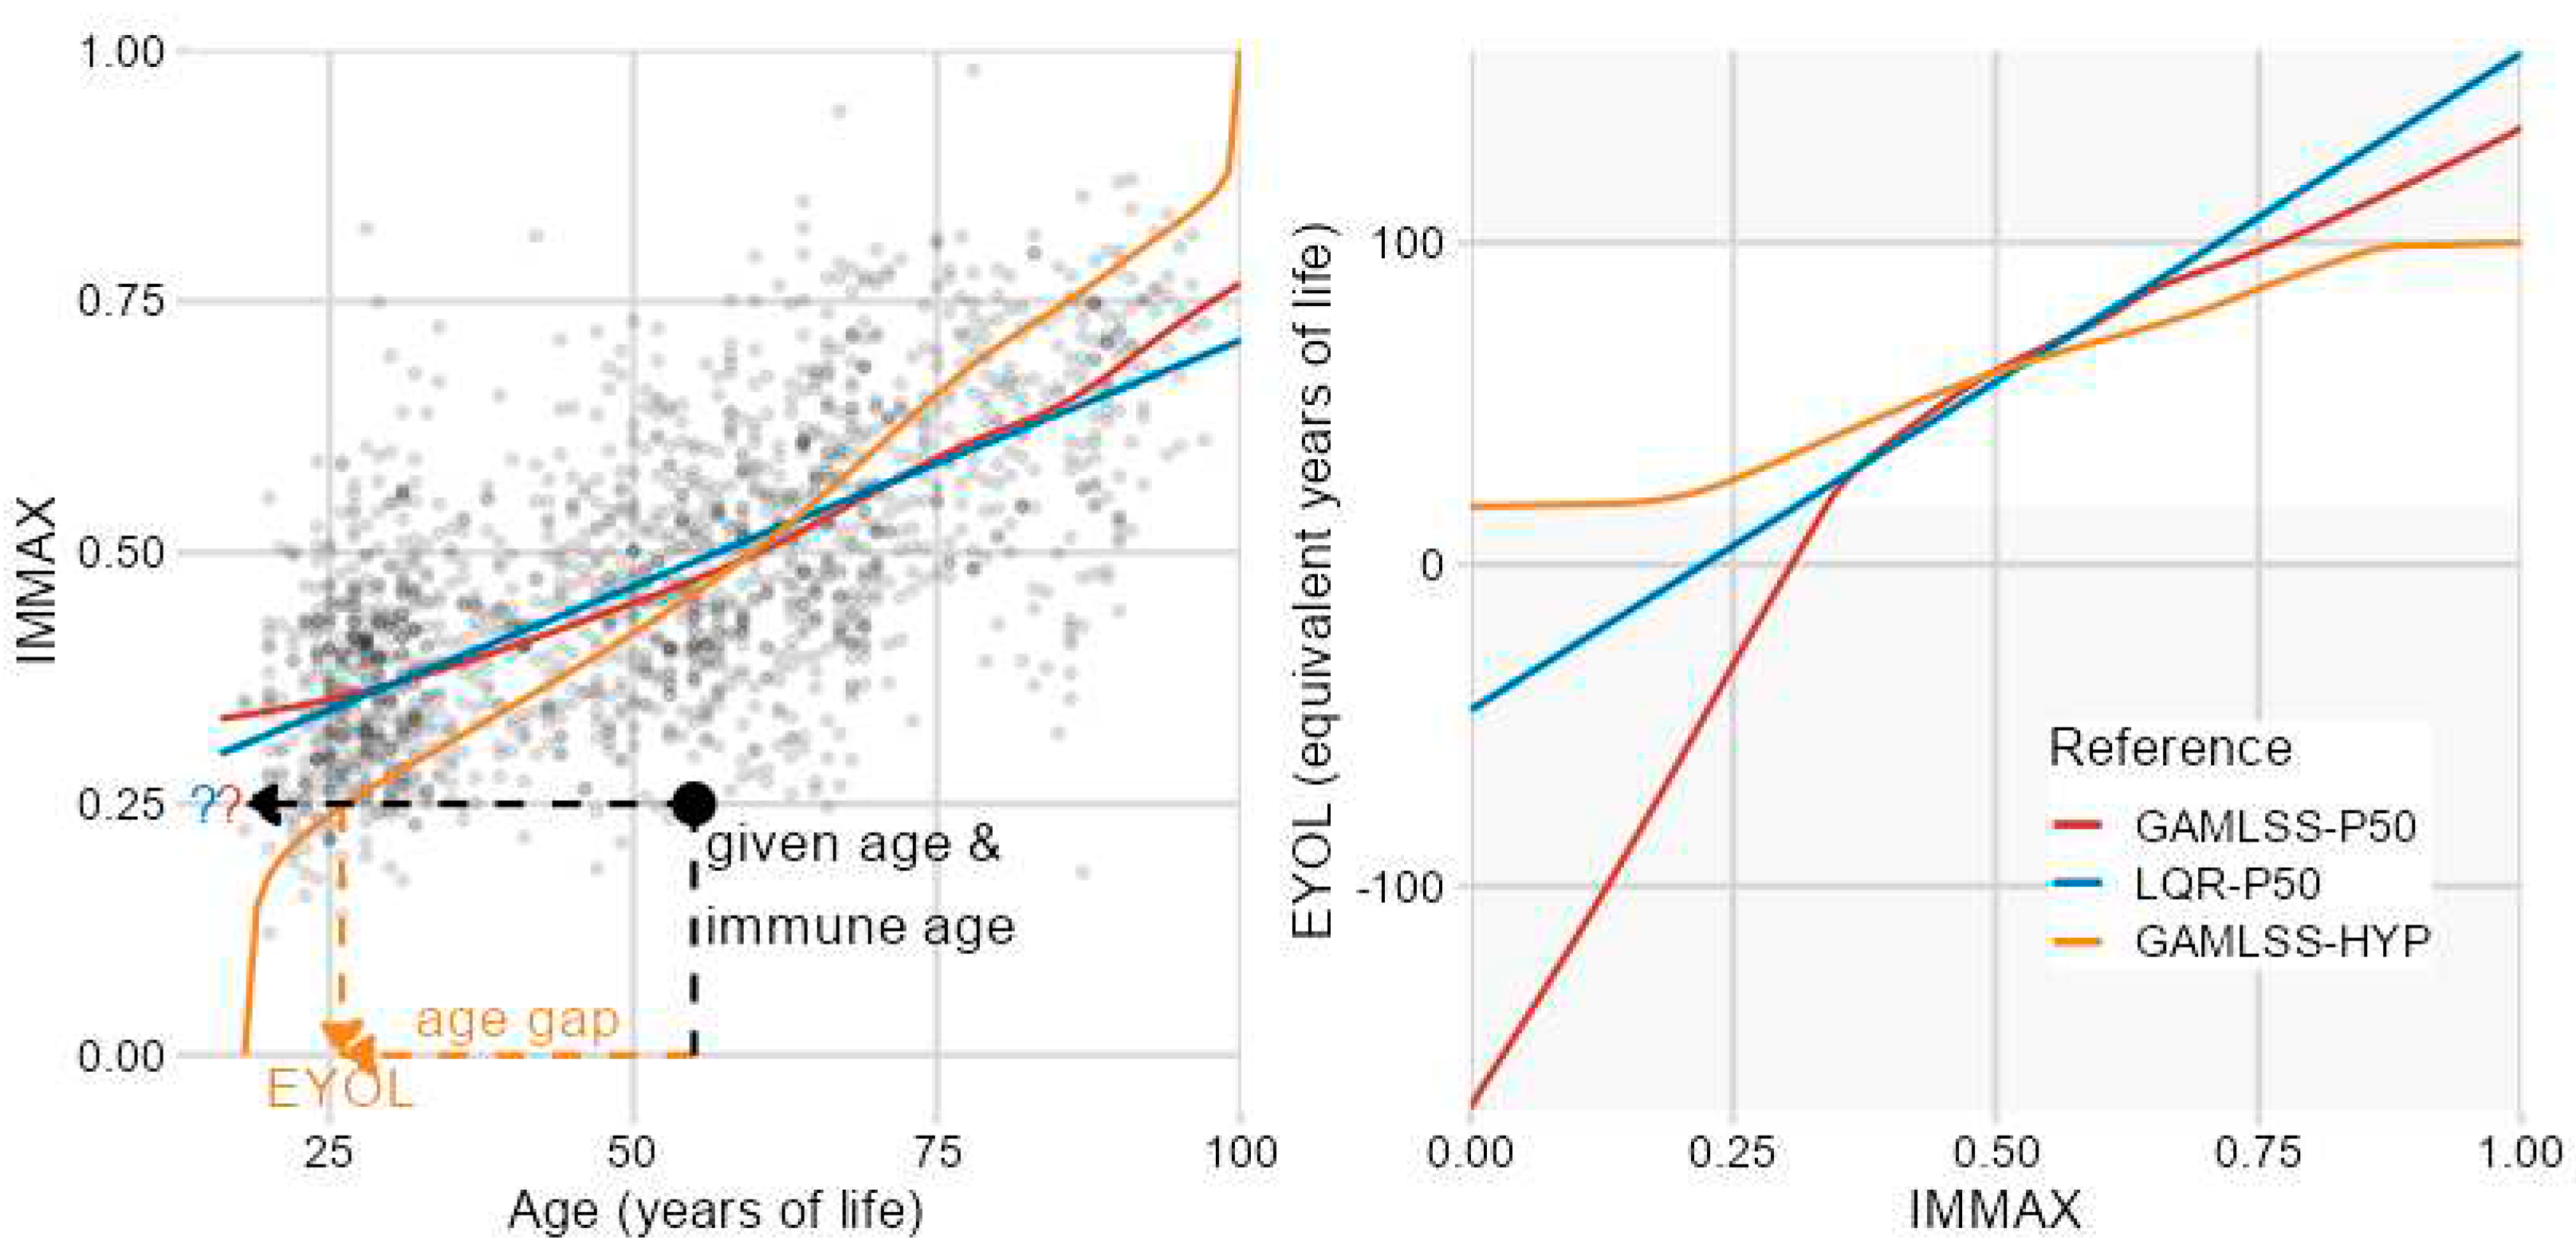
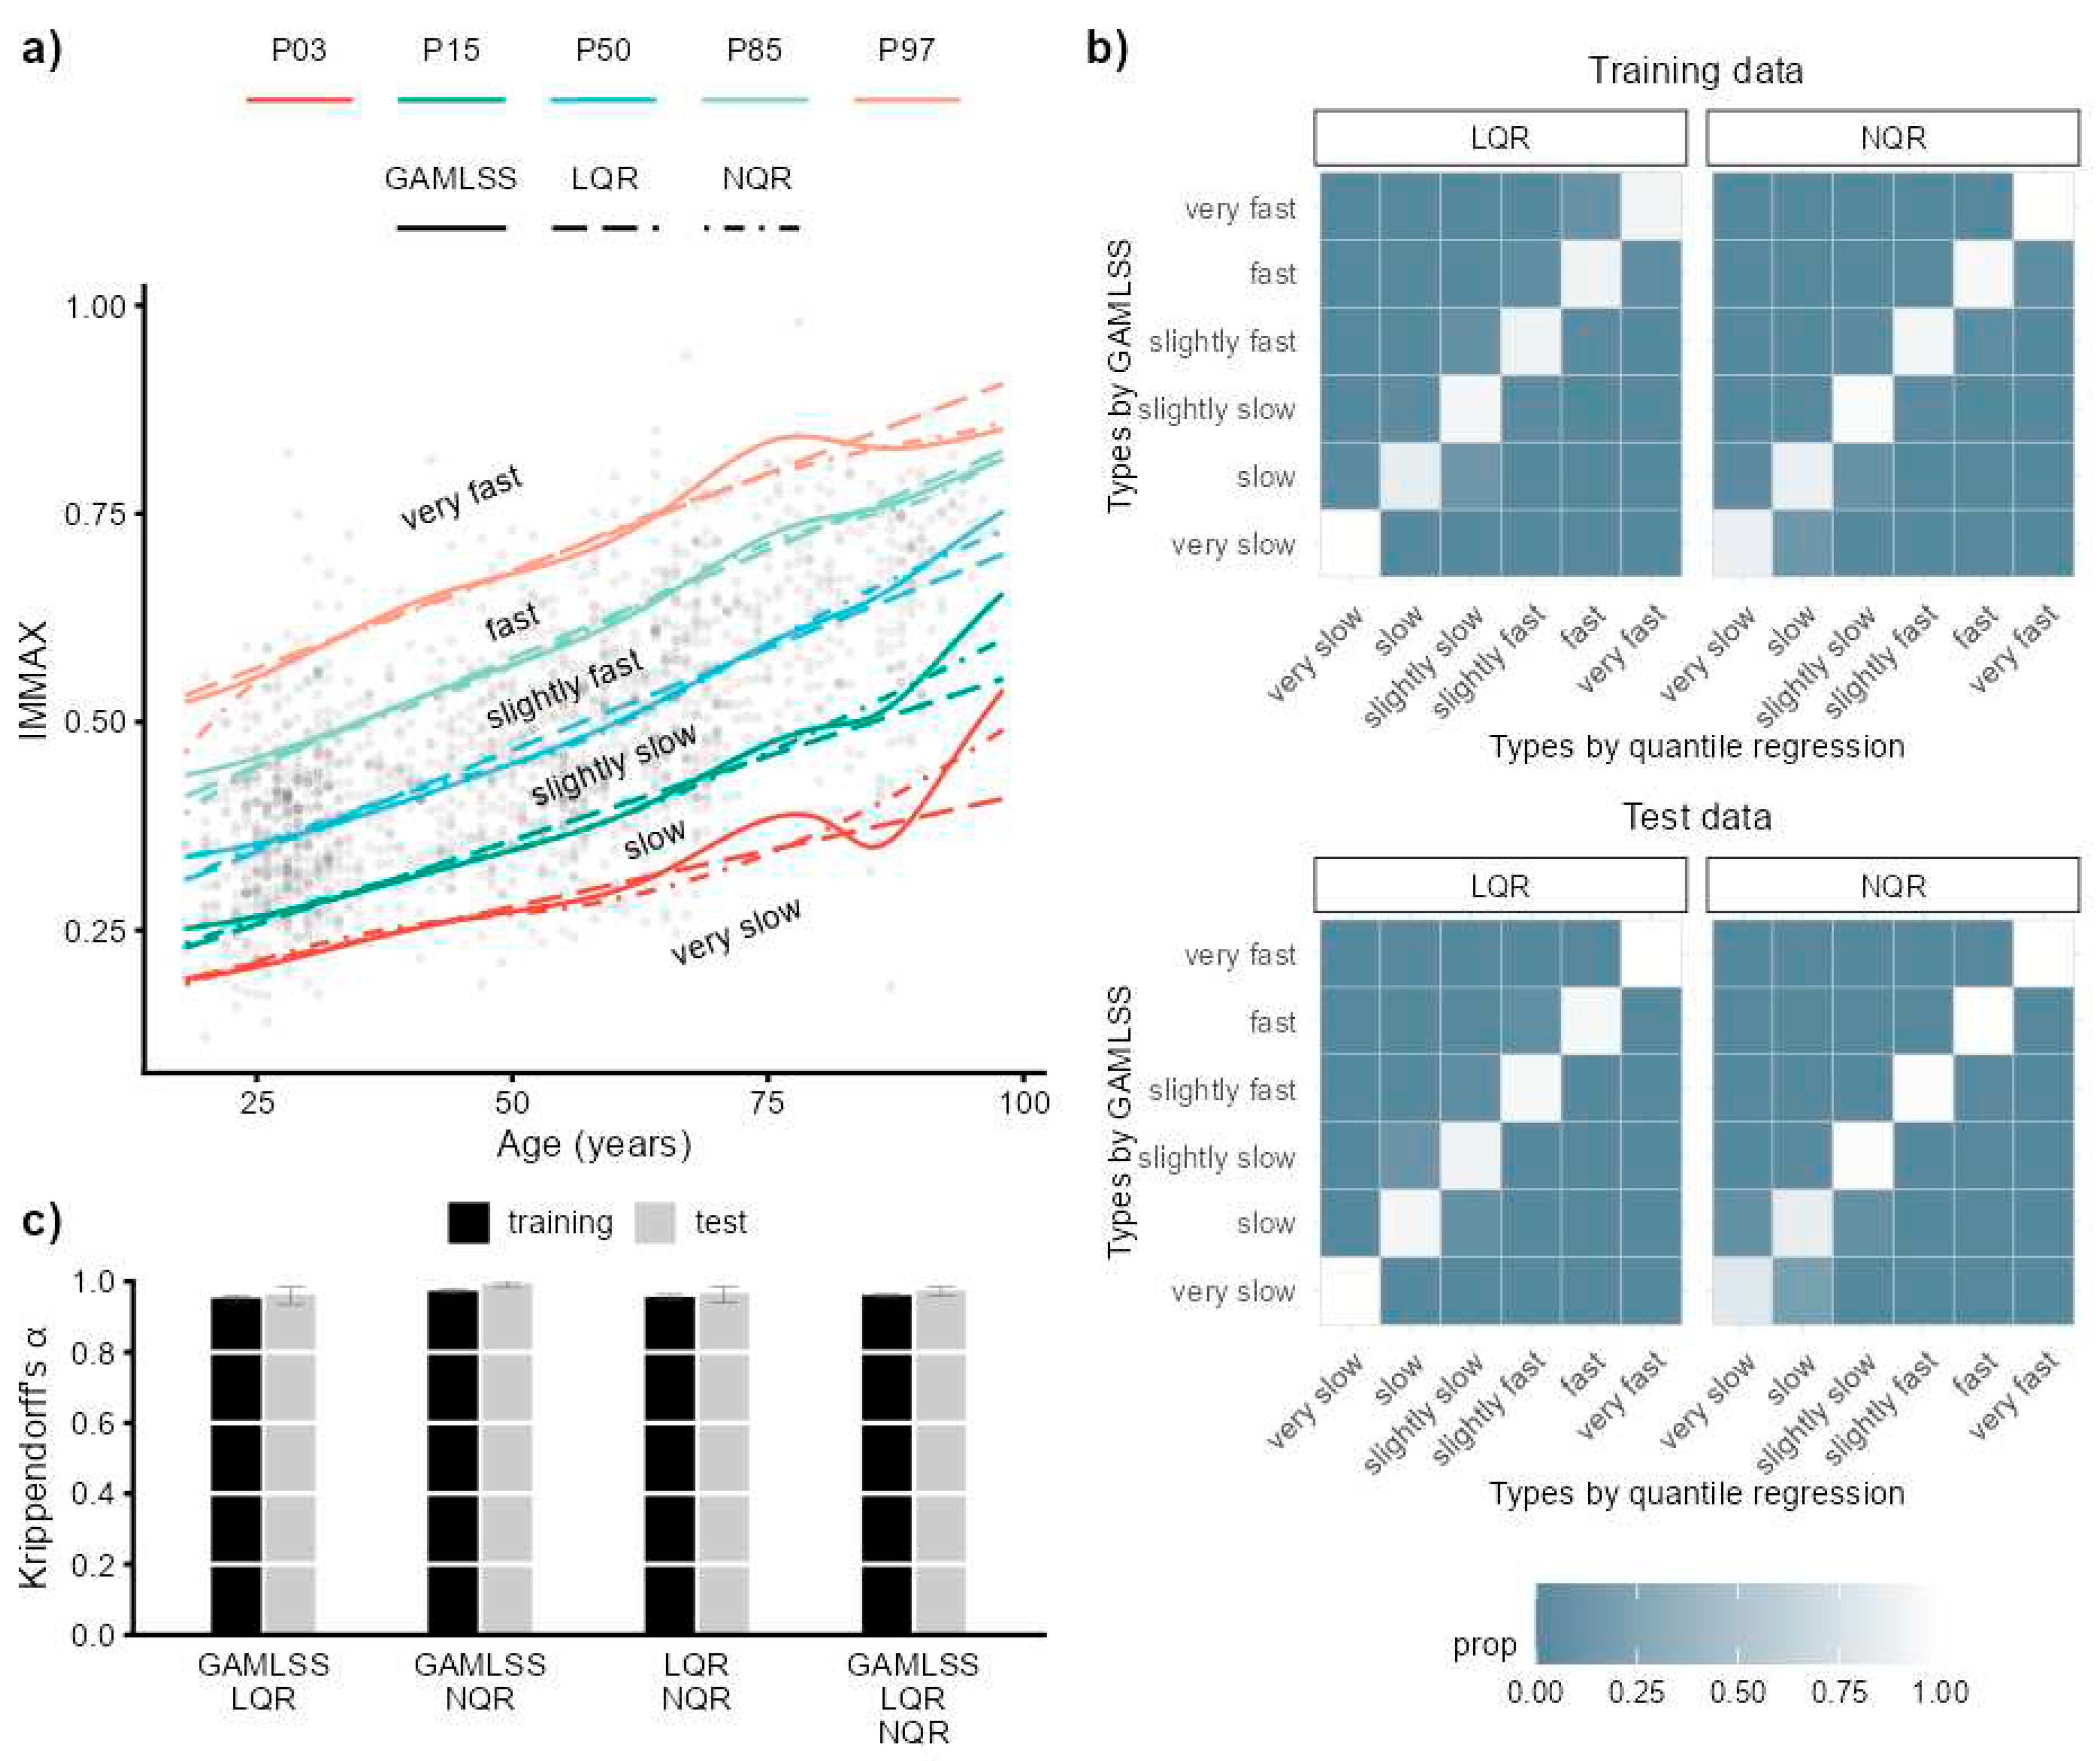
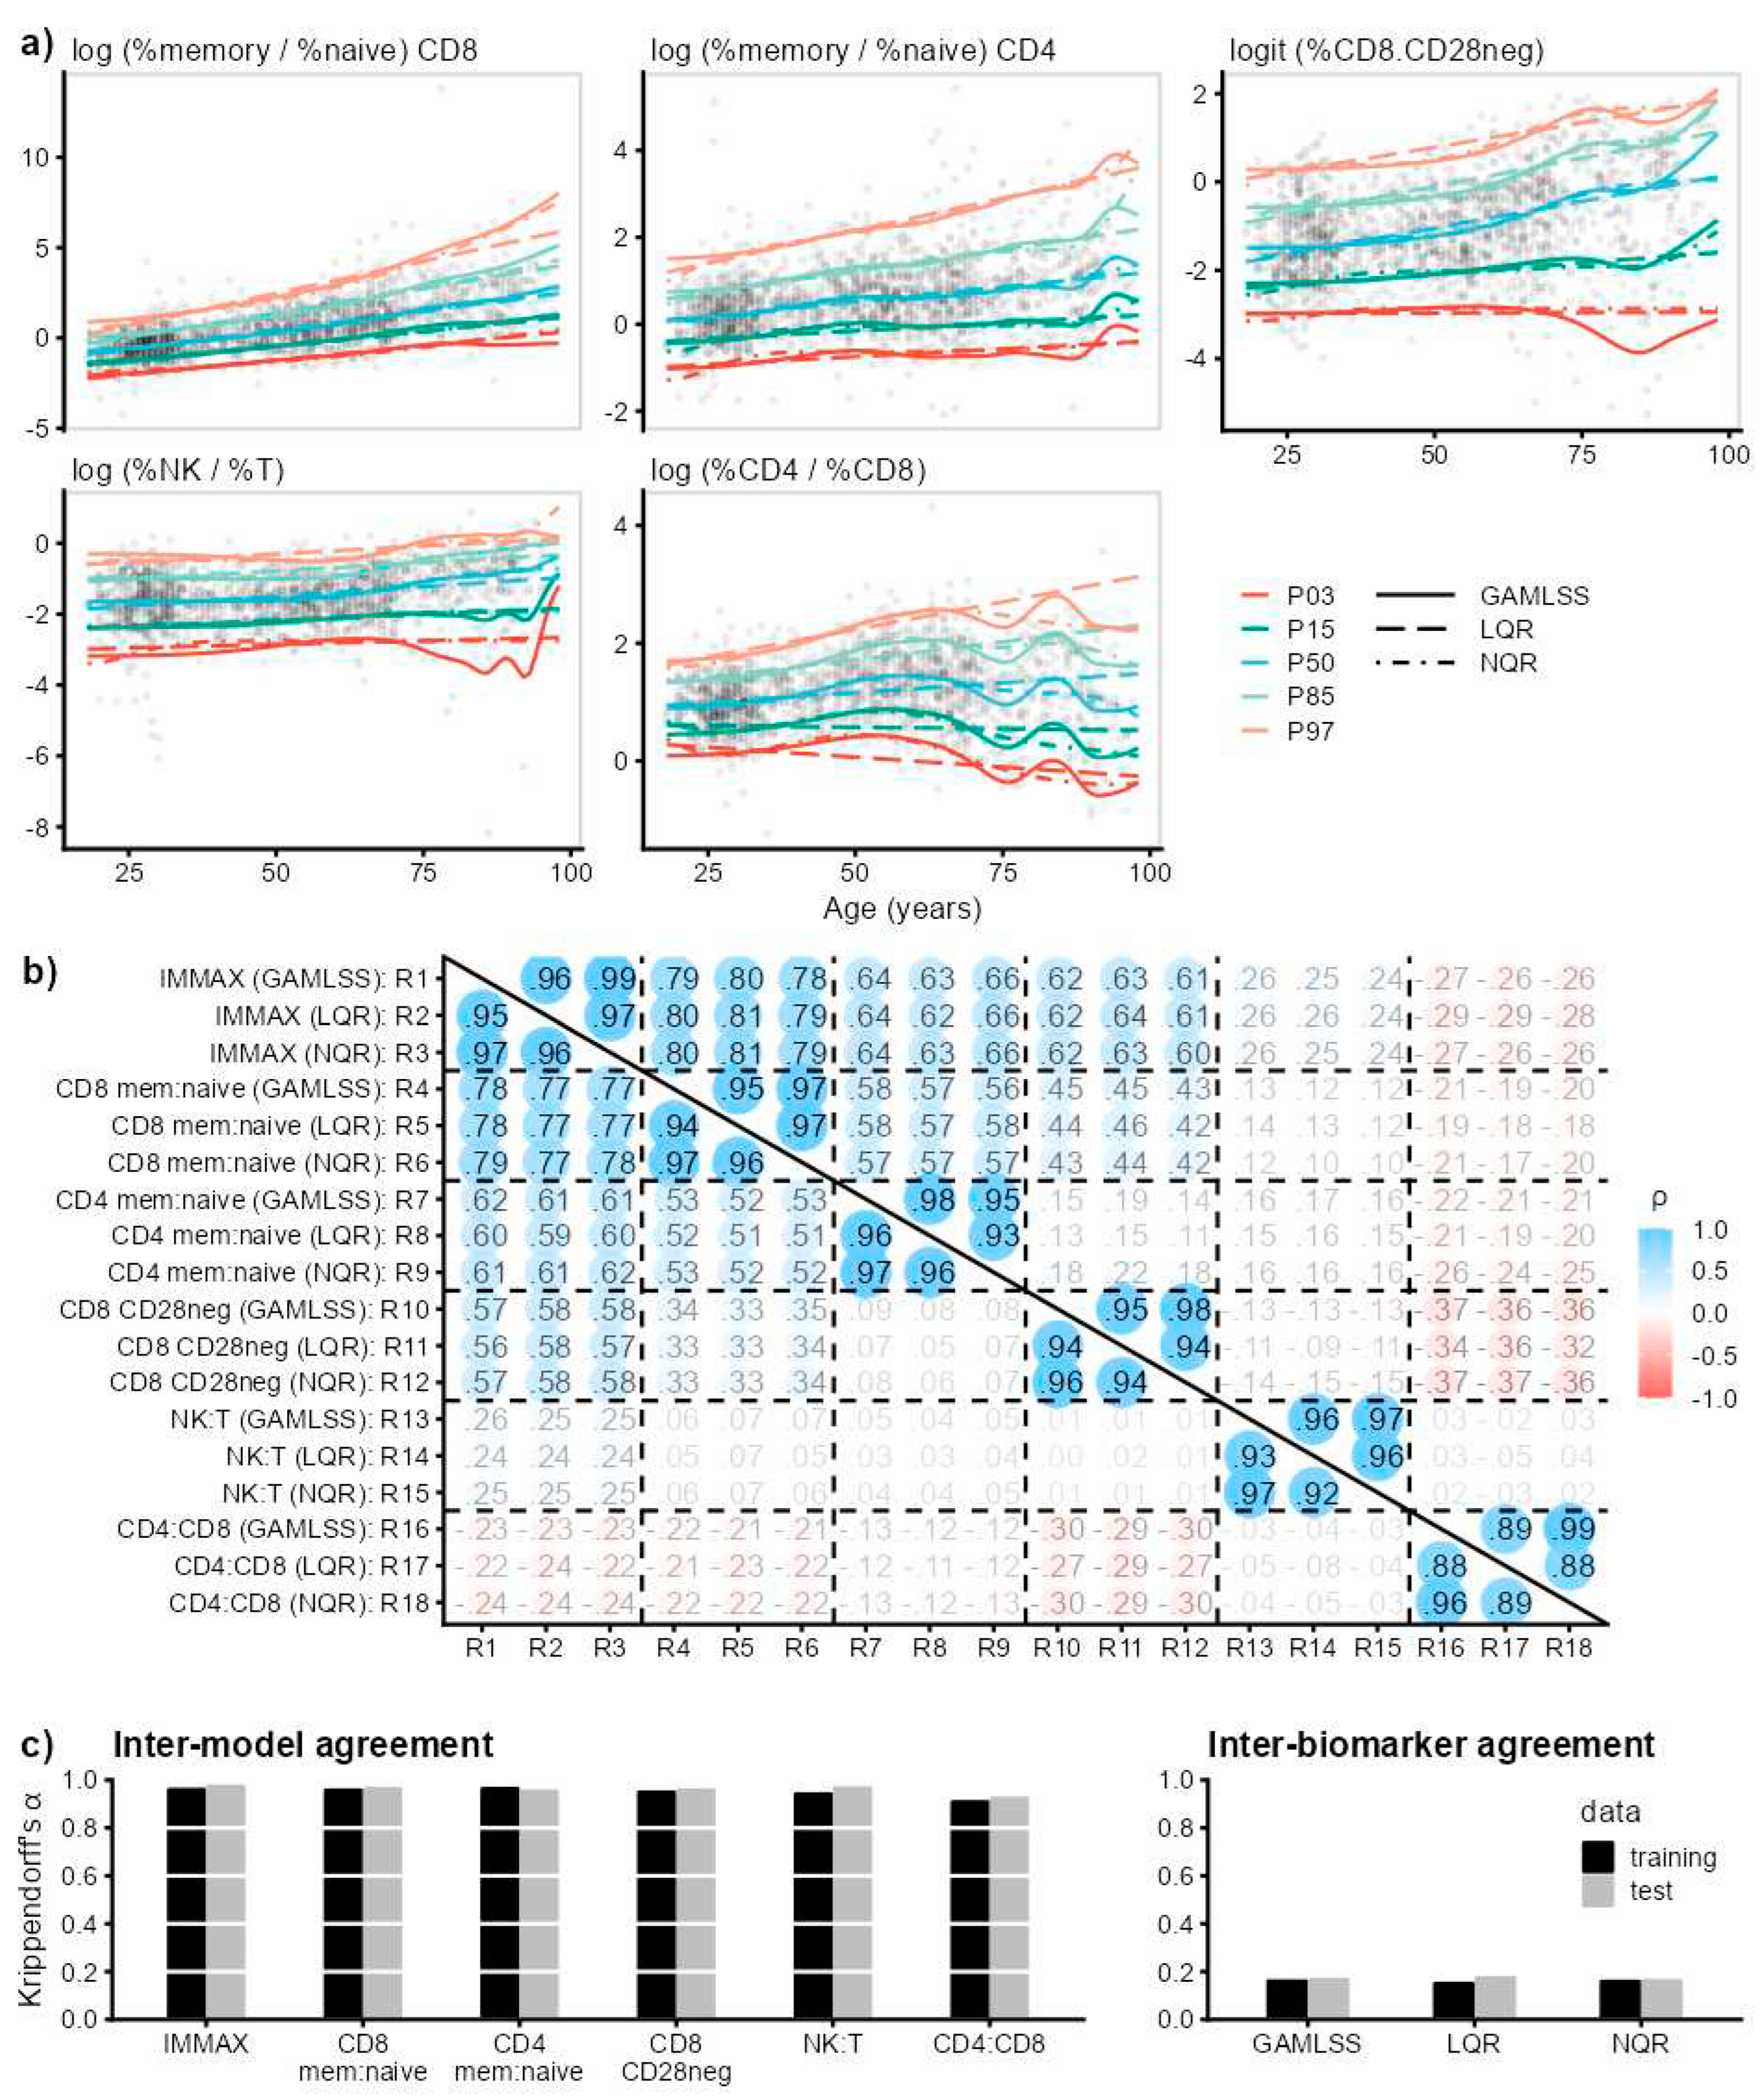
2.2. Sensitivity to Centile Estimation Modelling Strategy
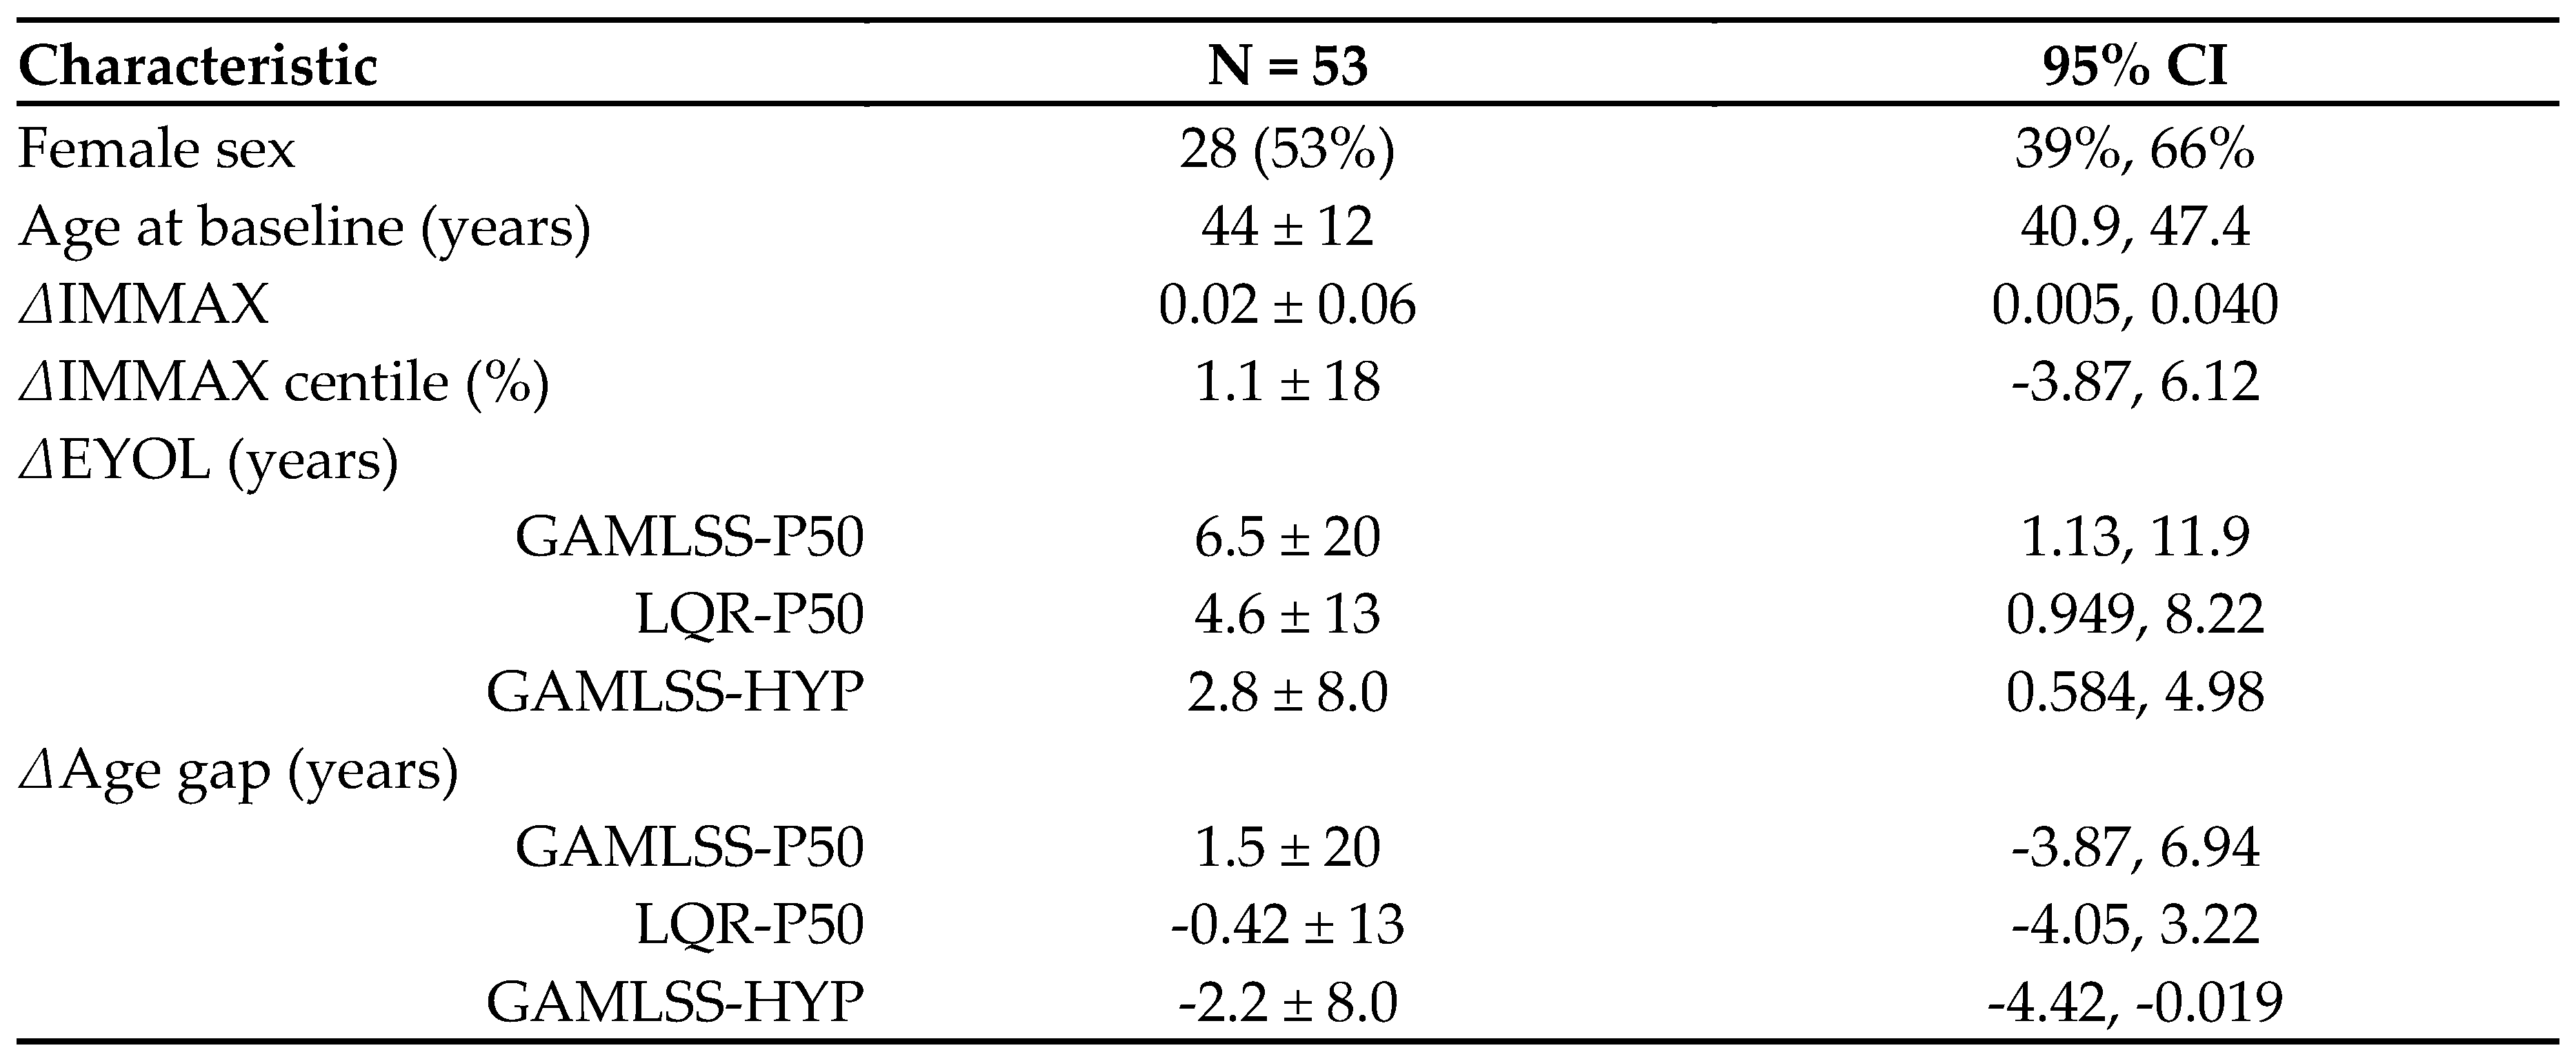
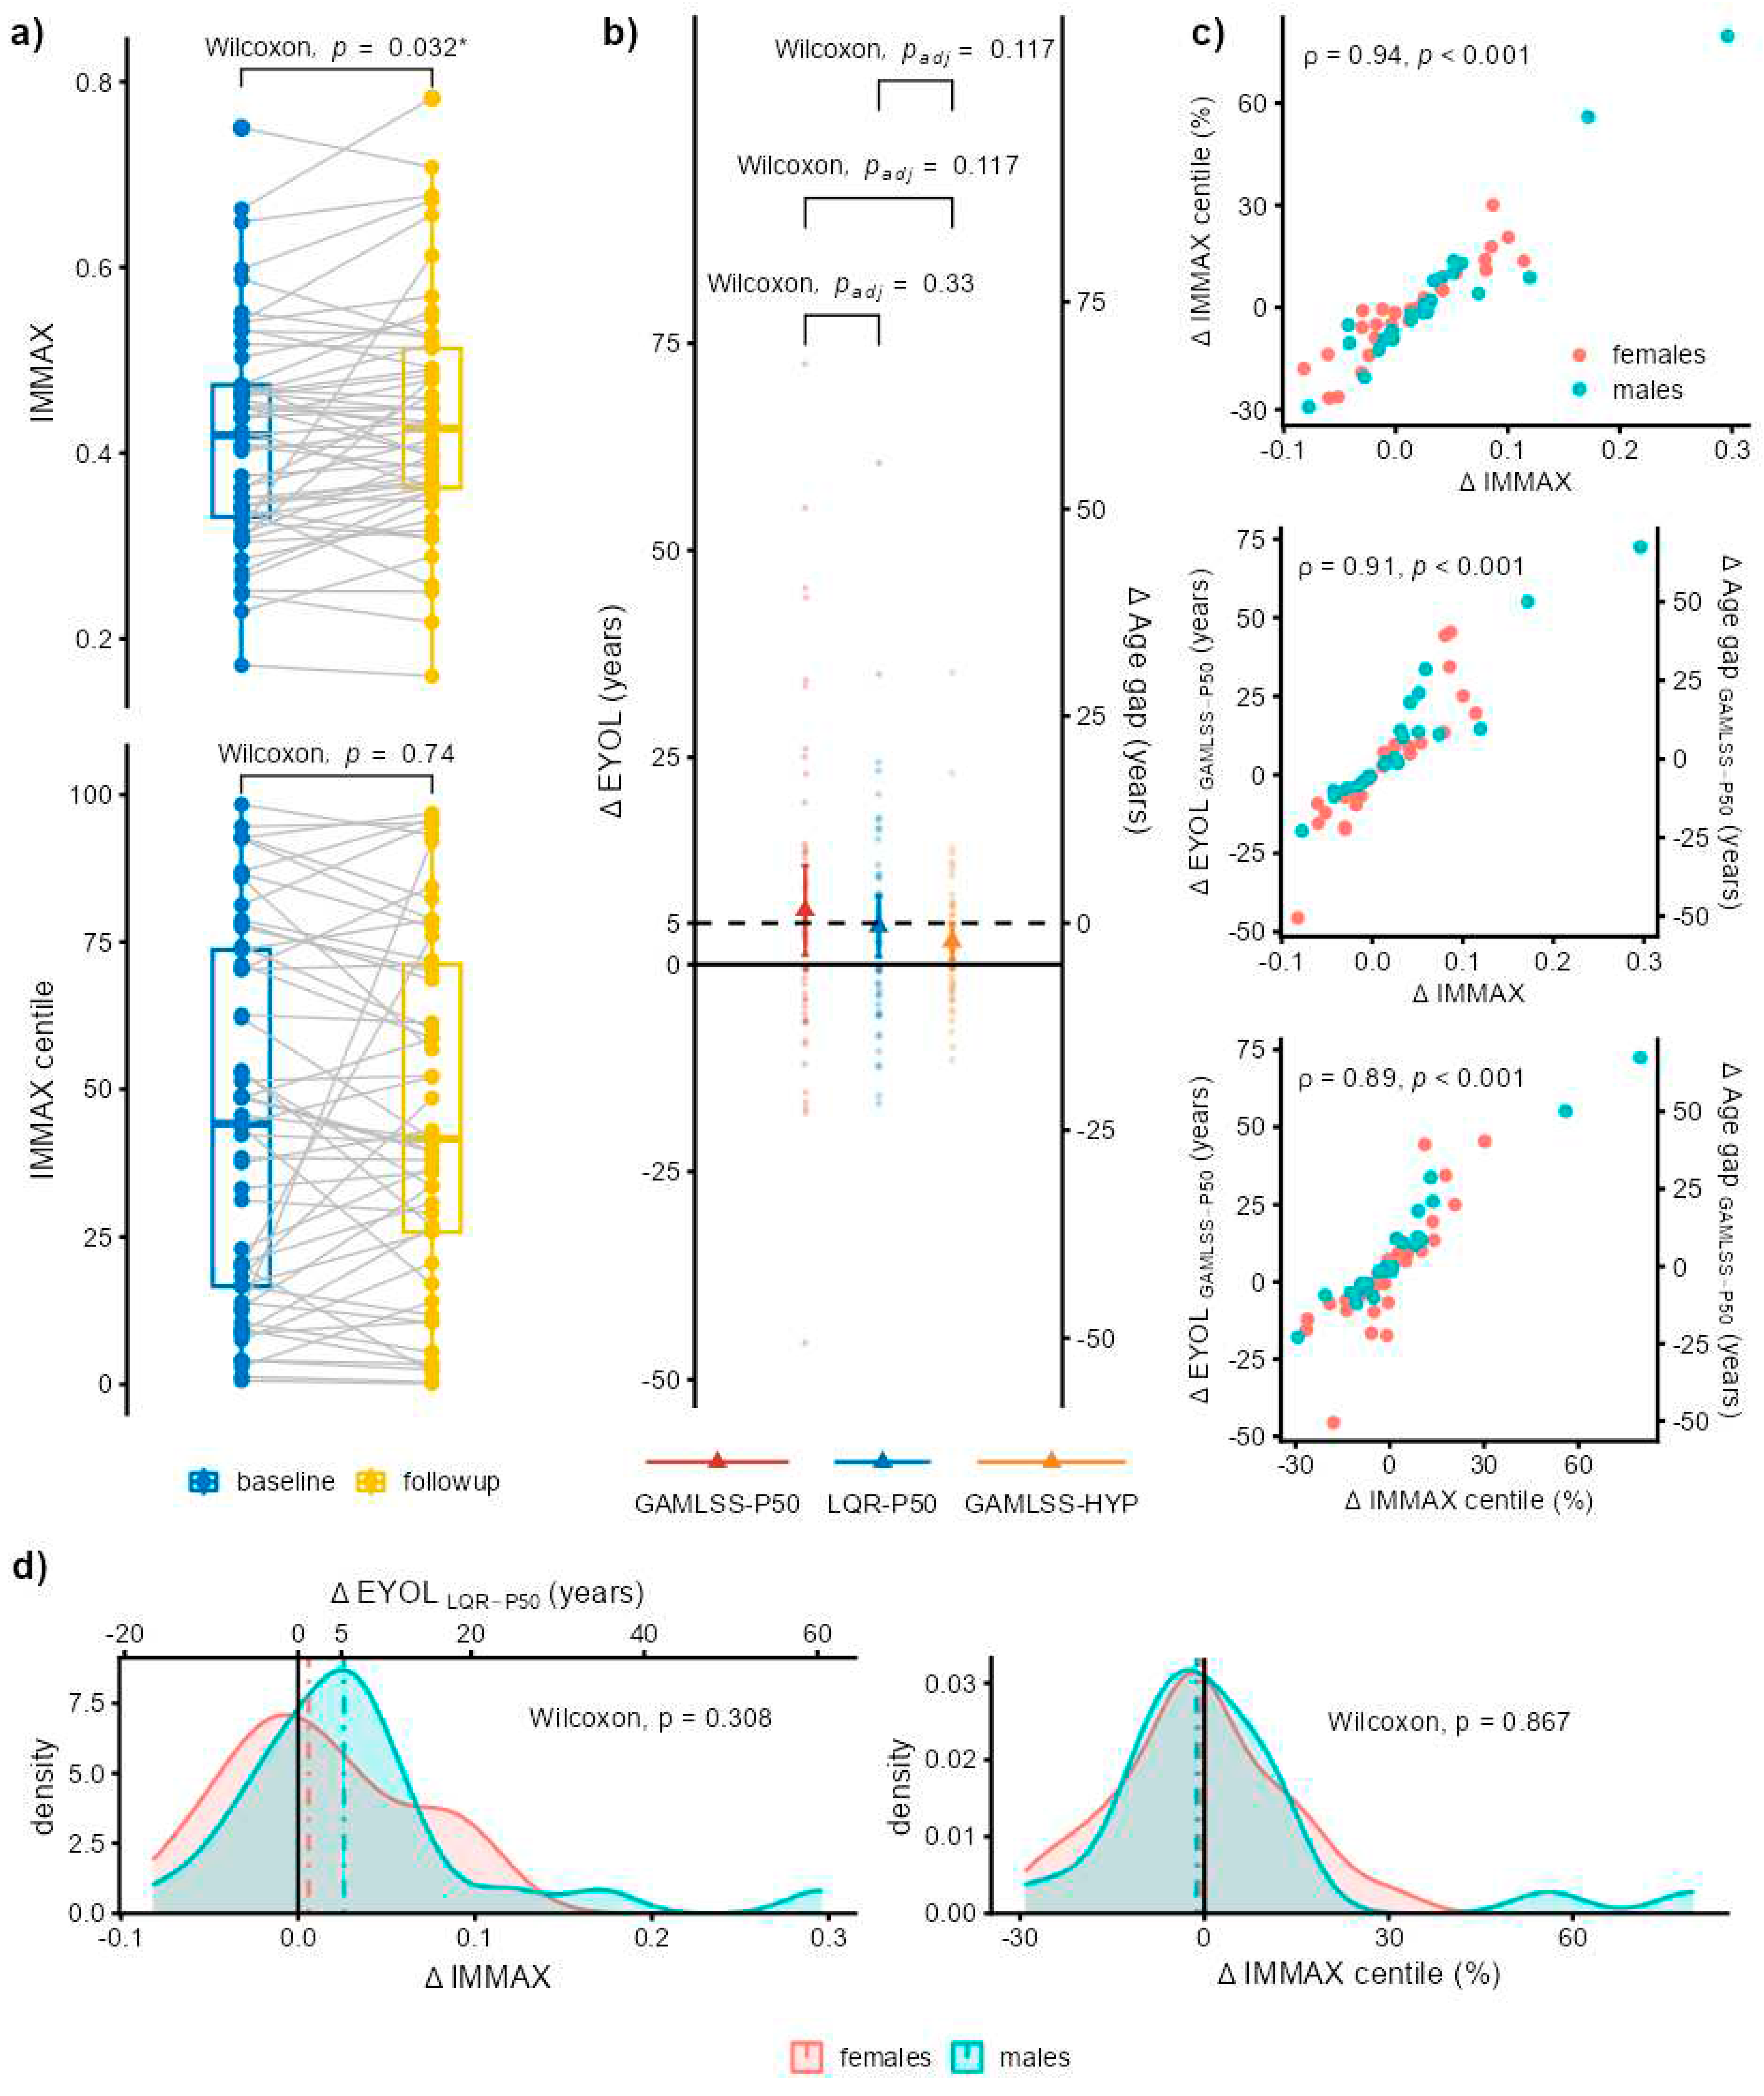
2.3. Application to Longitudinal Data from the Dortmund Vital Study
3. Discussion
4. Materials and Methods
4.1. Data Sets
4.2. Molecular Biomarkers of Immunosenescence by Flow Cytometry
4.3. Data Analysis and Statistics
4.4. Preliminary Longitudinal Data from the Dortmund Vital Study
Supplementary Materials
Author Contributions
Funding
Institutional Review Board Statement
Informed Consent Statement
Data Availability Statement
Acknowledgments
Conflicts of Interest
Appendix A
| Characteristic | Training data N = 1,580 |
Test data N = 150 |
|---|---|---|
| Age (years) | 51 ± 20 (18, 97) |
45 ± 16 (21, 93) |
| IMMAX | 0.47 ± 0.14 (0.12, 0.98) |
0.44 ± 0.13 (0.17, 0.85) |
| log (%memory / %naive) CD8 | -1.51 ± 0.77 (-8.17, 0.87) |
-1.44 ± 0.68 (-4.23, 0.03) |
| log (%memory / %naive) CD4 | 1.17 ± 0.60 (-1.22, 4.32) |
1.11 ± 0.50 (0.06, 2.84) |
| logit (%CD8 CD28neg) | 0.55 ± 1.40 (-4.23, 13.81) |
0.31 ± 1.16 (-2.30, 4.48) |
| log (%NK / %T) | 0.57 ± 0.84 (-2.08, 5.43) |
0.43 ± 0.73 (-1.40, 3.42) |
| log (%CD4 / %CD8) | -1.05 ± 1.09 (-5.26, 1.94) |
-1.28 ± 1.00 (-3.80, 1.07) |
 |
References
- Rutledge, J.; Oh, H.; Wyss-Coray, T. Measuring biological age using omics data. Nature Reviews Genetics 2022. [CrossRef]
- Miller, R.A. The Aging Immune System: Primer and Prospectus. Science 1996, 273, 70-74. [CrossRef]
- Fulop, T.; Larbi, A.; Dupuis, G.; Le Page, A.; Frost, E.H.; Cohen, A.A.; Witkowski, J.M.; Franceschi, C. Immunosenescence and Inflamm-Aging As Two Sides of the Same Coin: Friends or Foes? Frontiers in Immunology 2018, 8, 1960. [CrossRef]
- Gayoso, I.; Sanchez-Correa, B.; Campos, C.; Alonso, C.; Pera, A.; Casado, J.G.; Morgado, S.; Tarazona, R.; Solana, R. Immunosenescence of human natural killer cells. J Innate Immun 2011, 3, 337-343. [CrossRef]
- Ligotti, M.E.; Aiello, A.; Accardi, G.; Aprile, S.; Bonura, F.; Bulati, M.; Gervasi, F.; Giammanco, G.M.; Pojero, F.; Zareian, N., et al. Analysis of T and NK cell subsets in the Sicilian population from young to supercentenarian: The role of age and gender. Clin Exp Immunol 2021, 205, 198-212. [CrossRef]
- Pangrazzi, L.; Weinberger, B. T cells, aging and senescence. Experimental Gerontology 2020, 134, 110887. [CrossRef]
- Huff, W.X.; Kwon, J.H.; Henriquez, M.; Fetcko, K.; Dey, M. The Evolving Role of CD8+CD28− Immunosenescent T Cells in Cancer Immunology. International Journal of Molecular Sciences 2019, 20, 2810. [CrossRef]
- Zhang, H.; Weyand, C.M.; Goronzy, J.J. Hallmarks of the aging T-cell system. The FEBS Journal 2021. [CrossRef]
- Fagnoni, F.F.; Vescovini, R.; Passeri, G.; Bologna, G.; Pedrazzoni, M.; Lavagetto, G.; Casti, A.; Franceschi, C.; Passeri, M.; Sansoni, P. Shortage of circulating naive CD8+ T cells provides new insights on immunodeficiency in aging. Blood 2000, 95, 2860-2868. [CrossRef]
- Garrido-Rodríguez, V.; Herrero-Fernández, I.; Castro, M.J.; Castillo, A.; Rosado-Sánchez, I.; Galvá, M.I.; Ramos, R.; Olivas-Martínez, I.; Bulnes-Ramos, Á.; Cañizares, J., et al. Immunological features beyond CD4/CD8 ratio values in older individuals. Aging (Albany NY) 2021, 13, 13443-13459. [CrossRef]
- Alpert, A.; Pickman, Y.; Leipold, M.; Rosenberg-Hasson, Y.; Ji, X.; Gaujoux, R.; Rabani, H.; Starosvetsky, E.; Kveler, K.; Schaffert, S., et al. A clinically meaningful metric of immune age derived from high-dimensional longitudinal monitoring. Nature Medicine 2019, 25, 487-495. [CrossRef]
- Sayed, N.; Huang, Y.; Nguyen, K.; Krejciova-Rajaniemi, Z.; Grawe, A.P.; Gao, T.; Tibshirani, R.; Hastie, T.; Alpert, A.; Cui, L., et al. An inflammatory aging clock (iAge) based on deep learning tracks multimorbidity, immunosenescence, frailty and cardiovascular aging. Nature Aging 2021, 1, 598-615. [CrossRef]
- Rizzo, L.B.; Swardfager, W.; Maurya, P.K.; Graiff, M.Z.; Pedrini, M.; Asevedo, E.; Cassinelli, A.C.; Bauer, M.E.; Cordeiro, Q.; Scott, J., et al. An immunological age index in bipolar disorder: A confirmatory factor analysis of putative immunosenescence markers and associations with clinical characteristics. International Journal of Methods in Psychiatric Research 2018, 27, e1614. [CrossRef]
- Ramasubramanian, R.; Meier, H.C.S.; Vivek, S.; Klopack, E.; Crimmins, E.M.; Faul, J.; Nikolich-Žugich, J.; Thyagarajan, B. Evaluation of T-cell aging-related immune phenotypes in the context of biological aging and multimorbidity in the Health and Retirement Study. Immunity & Ageing 2022, 19, 33. [CrossRef]
- Guerville, F.; De Souto Barreto, P.; Ader, I.; Andrieu, S.; Casteilla, L.; Dray, C.; Fazilleau, N.; Guyonnet, S.; Langin, D.; Liblau, R., et al. Revisiting the Hallmarks of Aging to Identify Markers of Biological Age. The Journal of Prevention of Alzheimer's Disease 2020, 7, 56-64. [CrossRef]
- Frasca, D.; Diaz, A.; Romero, M.; Garcia, D.; Blomberg, B.B. B Cell Immunosenescence. Annual Review of Cell and Developmental Biology 2020, 36, 551-574. [CrossRef]
- Xu, W.; Wong, G.; Hwang, Y.Y.; Larbi, A. The untwining of immunosenescence and aging. Seminars in Immunopathology 2020, 42, 559-572. [CrossRef]
- Pawelec, G. The human immunosenescence phenotype: does it exist? Seminars in Immunopathology 2020, 42, 537-544. [CrossRef]
- Foster, M.A.; Bentley, C.; Hazeldine, J.; Acharjee, A.; Nahman, O.; Shen-Orr, S.S.; Lord, J.M.; Duggal, N.A. Investigating the potential of a prematurely aged immune phenotype in severely injured patients as predictor of risk of sepsis. Immunity & Ageing 2022, 19, 60. [CrossRef]
- Bröde, P.; Claus, M.; Gajewski, P.D.; Getzmann, S.; Golka, K.; Hengstler, J.G.; Wascher, E.; Watzl, C. Calibrating a Comprehensive Immune Age Metric to Analyze the Cross Sectional Age-Related Decline in Cardiorespiratory Fitness. Biology (Basel) 2022, 11, 1576. [CrossRef]
- Gajewski, P.D.; Rieker, J.A.; Athanassiou, G.; Bröde, P.; Claus, M.; Golka, K.; Hengstler, J.G.; Kleinsorge, T.; Nitsche, M.A.; Reinders, J., et al. A Systematic Analysis of Biological, Sociodemographic, Psychosocial, and Lifestyle Factors Contributing to Work Ability Across the Working Life Span: Cross-sectional Study. JMIR Form Res 2023, 7, e40818. [CrossRef]
- Claus, M.; Bröde, P.; Urlaub, D.; Wolfsdorff, N.; Watzl, C. Investigation of the relationship between Immune Age and Vaccination against SARS-CoV-2. European Journal of Immunology 2022, 52, 168.
- Bafei, S.E.C.; Shen, C. Biomarkers selection and mathematical modeling in biological age estimation. npj Aging 2023, 9, 13. [CrossRef]
- Verschoor, C.P.; Belsky, D.W.; Andrew, M.K.; Haynes, L.; Loeb, M.; Pawelec, G.; McElhaney, J.E.; Kuchel, G.A. Advanced biological age is associated with improved antibody responses in older high-dose influenza vaccine recipients over four consecutive seasons. Immunity & Ageing 2022, 19, 39. [CrossRef]
- Bröde, P.; Fiala, D.; Blazejczyk, K.; Holmér, I.; Jendritzky, G.; Kampmann, B.; Tinz, B.; Havenith, G. Deriving the operational procedure for the Universal Thermal Climate Index (UTCI). International Journal of Biometeorology 2012, 56, 481-494. [CrossRef]
- Ahadi, S.; Zhou, W.; Schüssler-Fiorenza Rose, S.M.; Sailani, M.R.; Contrepois, K.; Avina, M.; Ashland, M.; Brunet, A.; Snyder, M. Personal aging markers and ageotypes revealed by deep longitudinal profiling. Nature Medicine 2020, 26, 83-90. [CrossRef]
- WHO Multicentre Growth Reference Study Group; de Onis, M. WHO Child Growth Standards based on length/height, weight and age. Acta Paediatrica 2006, 95, 76-85. [CrossRef]
- Rigby, R.A.; Stasinopoulos, D.M. Generalized additive models for location, scale and shape. Journal of the Royal Statistical Society: Series C (Applied Statistics) 2005, 54, 507-554. [CrossRef]
- Koenker, R.W.; D'Orey, V. Computing Regression Quantiles. Journal of the Royal Statistical Society. Series C (Applied Statistics) 1987, 36, 383-393. [CrossRef]
- Muggeo, V.M.R.; Torretta, F.; Eilers, P.H.C.; Sciandra, M.; Attanasio, M. Multiple smoothing parameters selection in additive regression quantiles. Statistical Modelling 2021, 21, 428-448. [CrossRef]
- Gajewski, P.D.; Getzmann, S.; Bröde, P.; Burke, M.; Cadenas, C.; Capellino, S.; Claus, M.; Genç, E.; Golka, K.; Hengstler, J.G., et al. Impact of Biological and Lifestyle Factors on Cognitive Aging and Work Ability in the Dortmund Vital Study: Protocol of an Interdisciplinary, Cross-sectional, and Longitudinal Study. JMIR Res Protoc 2022, 11, e32352. [CrossRef]
- Hayes, A.F.; Krippendorff, K. Answering the Call for a Standard Reliability Measure for Coding Data. Communication Methods and Measures 2007, 1, 77-89. [CrossRef]
- Pawelec, G. Hallmarks of human “immunosenescence”: adaptation or dysregulation? Immunity & Ageing 2012, 9, 15. [CrossRef]
- Ogrodnik, M.; Gladyshev, V.N. The meaning of adaptation in aging: insights from cellular senescence, epigenetic clocks and stem cell alterations. Nature Aging 2023, 3, 766-775. [CrossRef]
- Bröde, P.; Claus, M.; Urlaub, D.; Wolfsdorff, N.; Watzl, C. Immune age: the feminine side of firemen? In Proceedings of 10th European Conference on Protective Clothing, Arnhem, The Netherlands, 9–12 May 2023; pp. 156-157.
- Claus, M.; Dychus, N.; Ebel, M.; Damaschke, J.; Maydych, V.; Wolf, O.T.; Kleinsorge, T.; Watzl, C. Measuring the immune system: a comprehensive approach for the analysis of immune functions in humans. Archives of Toxicology 2016, 90, 2481-2495. [CrossRef]
- Stasinopoulos, M.D.; Rigby, R.A.; Bastiani, F.D. GAMLSS: A distributional regression approach. Statistical Modelling 2018, 18, 248-273. [CrossRef]
- Koenker, R.W. quantreg: Quantile Regression. R package version 5.95. 2023. Availabe online: https://CRAN.R-project.org/package=quantreg (accessed on 2023-07-19).
- Muggeo, V.M.R.; Sciandra, M.; Tomasello, A.; Calvo, S. Estimating growth charts via nonparametric quantile regression: a practical framework with application in ecology. Environmental and Ecological Statistics 2013, 20, 519-531. [CrossRef]
- Krippendorff, K. Computing Krippendorff's Alpha Reliability; Penn collection, Departmental Papers (ASC) 43; University of Pennsylvania: Philadelphia, 2011. Availabe online: https://repository.upenn.edu/handle/20.500.14332/2089 (accessed on 2023-07-15).
- R Core Team. R: A Language and Environment for Statistical Computing. R Foundation for Statistical Computing: Vienna, Austria, 2023. Availabe online: https://www.R-project.org/ (accessed on 2023-07-09).
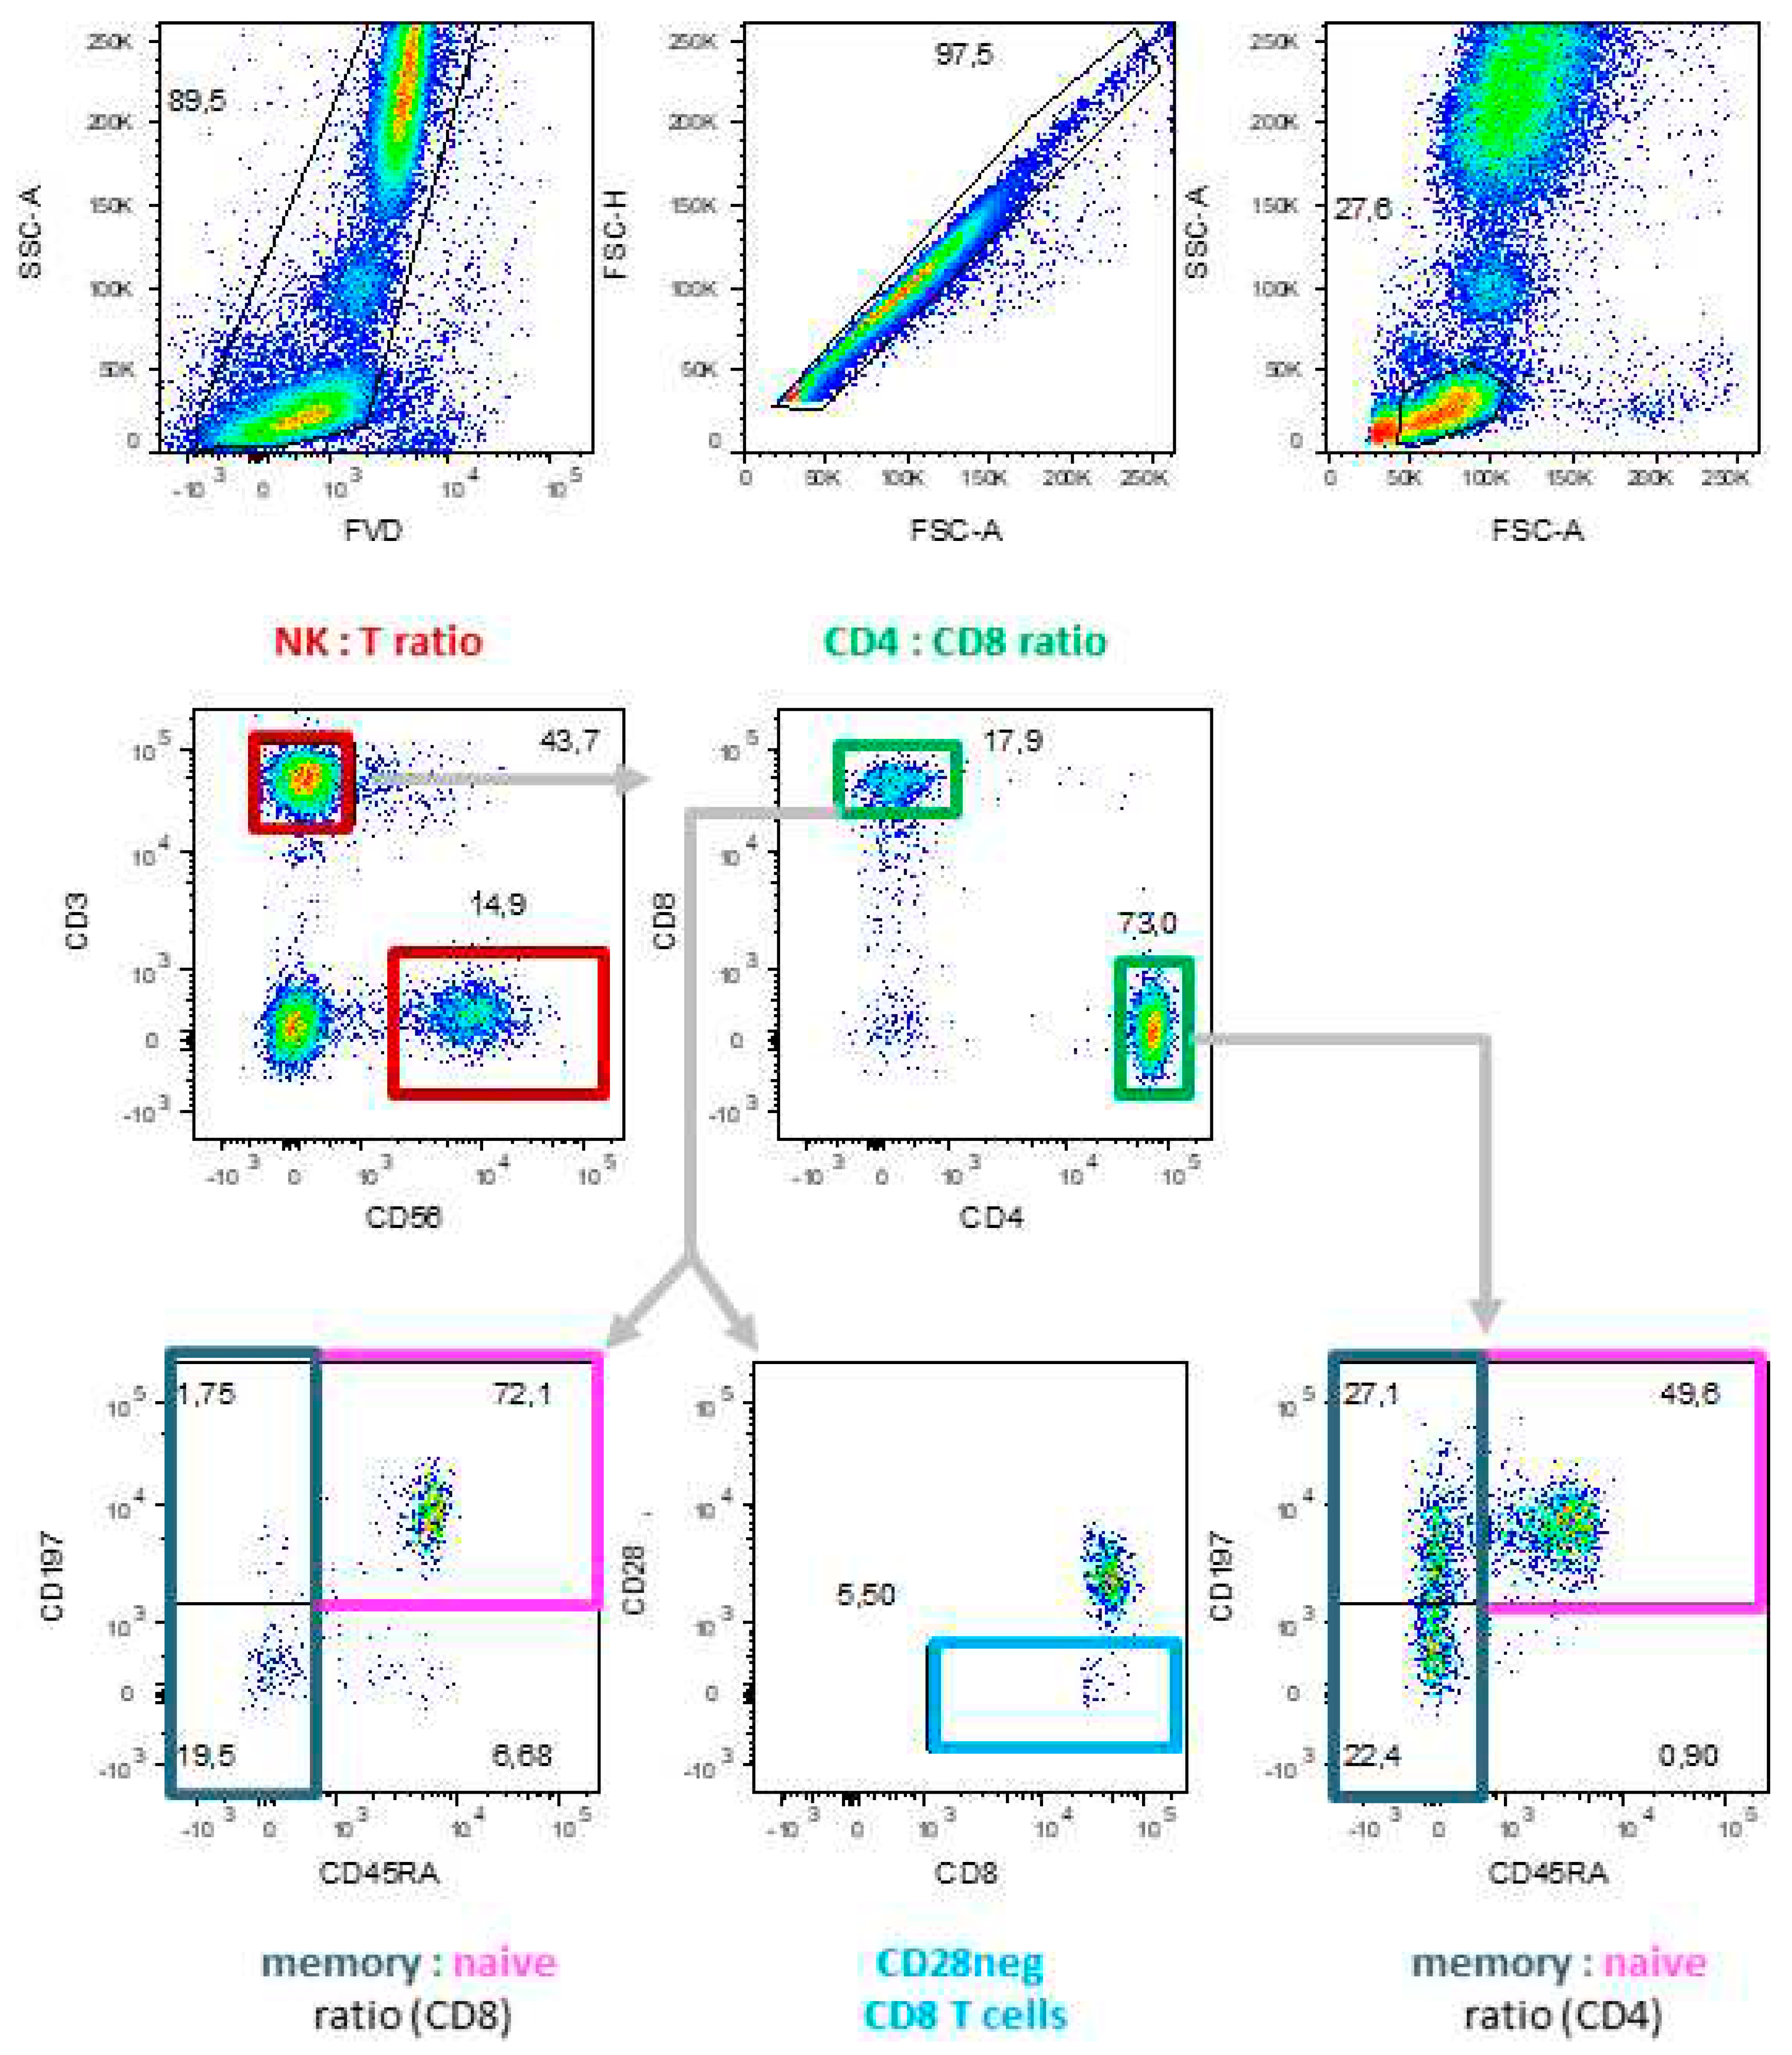
| Sample | Antigen | Clone | Fluorochrome | Company | Dilution 1/x |
|---|---|---|---|---|---|
| DVS | live / dead | zombie Yellow | Biolegend | 1000 | |
| CD3 | UCHT1 | BV510 | BD Horizon™ | 400 | |
| CD56 | B159 | PE-CF594 | BD Pharmingen™ | 100 | |
| CD4 | RPA-T4 | APC-H7 | BD Pharmingen™ | 100 | |
| CD8 | RPA-T8 | FITC | BD Pharmingen™ | 200 | |
| CD197 (CCR7) | 150503 | Alexa Fluor® 647 | BD Pharmingen™ | 50 | |
| CD45RA | HI100 | Alexa Fluor® 700 | BD Pharmingen™ | 400 | |
| CD28 | CD28.2 | PerCP-Cy™5.5 | BD Pharmingen™ | 100 | |
| VAC | live / dead | Fixable Viability Dye eFluor™ 780 | ThermoFisher Scientific | 400 | |
| CD3 | UCHT1 | BV510 | BD Horizon™ | 100 | |
| CD56 | B159 | PE-Cy™5 | BD Pharmingen™ | 50 | |
| CD4 | RPA-T4 | BV421 | BD Horizon™ | 100 | |
| CD8 | RPA-T8 | BB515 | BD Horizon™ | 400 | |
| CD197 (CCR7) | 3D12 | PE | BD Pharmingen™ | 100 | |
| CD45RA | HI100 | Alexa Fluor® 700 | BD Pharmingen™ | 100 | |
| CD28 | CD28.2 | PerCP-Cy™5.5 | BD Pharmingen™ | 100 |
Disclaimer/Publisher’s Note: The statements, opinions and data contained in all publications are solely those of the individual author(s) and contributor(s) and not of MDPI and/or the editor(s). MDPI and/or the editor(s) disclaim responsibility for any injury to people or property resulting from any ideas, methods, instructions or products referred to in the content. |
© 2023 by the authors. Licensee MDPI, Basel, Switzerland. This article is an open access article distributed under the terms and conditions of the Creative Commons Attribution (CC BY) license (http://creativecommons.org/licenses/by/4.0/).


