1. Introduction
Gliomas are the most common type of primary brain and spinal cord tumor, accounting for 81% of malignancies in the central nervous system (CNS) [
1,
2]. Histologically, they resemble normal glial cells and are named accordingly [
1]. Gliomas typically originate from glial or precursor cells and develop into astrocytoma, oligodendroglioma, ependymoma, or oligoastrocytoma [
1,
3,
4]. In recent years, advances in cancer genetics and molecular characterization have greatly expanded our understanding of glioma biology. According to the World Health Organization (WHO) classification, gliomas are divided into four grades, with grades 1 and 2 indicating low-grade gliomas and grades 3 and 4 indicating high-grade gliomas (HGG) [
3]. Generally, the higher the grade, the poorer the prognosis [
5]. Pilocytic astrocytoma (grade I) has the highest 5-year relative survival rate of approximately 95% [
5], while glioblastoma, the most common glioma histology (accounting for approximately 45% of all gliomas), has a 5-year relative survival rate of approximately 5% [
6,
7]. It has recently been discovered that glioma patients with isocitrate dehydrogenase (IDH) mutations have a relatively favorable prognosis [
8,
9]. Gliomas are also 40-50% more common in adult males than in females [
10]. Adults over the age of 65 have the highest incidence of higher-grade and more aggressive gliomas, while lower-grade and less aggressive forms are more common in younger adults, particularly those between the ages of 20 and 40 [
10]. Despite the discovery of various cancer drugs in recent decades, few have been approved by the Food and Drug Administration (FDA) for the treatment of gliomas. One reason for this lack of progress is the blood-brain barrier, which consists of endothelial cells, capillaries, and basement membranes. This unique structure in the CNS prevents most antitumor drugs from entering the brain, posing challenges for the development of antiglioma drugs [
11].
Tripartite motif-containing proteins (TRIM), of which there are over 70, play crucial roles in immune responses, cancer growth, and chemoresistance [
12,
13,
14]. Tripartite motif-containing protein 6 (TRIM6) is a member of the TRIM family of proteins. The TRIM6 gene is located on chromosome 11p15 and is part of a cluster of TRIM genes that also includes the TRIM5, TRIM21, TRIM22, TRIM34 genes, and a TRIM pseudogene [
15]. Like other members of the TRIM family, TRIM6 has a tripartite motif and exhibits E3-ubiquitin ligase activity [
16]. Previous research has identified roles for TRIM6 in viral infection and inflammatory responses. According to Rajsbaum et al., TRIM6 can activate IKK and enhance the induction of type I interferon (IFN-I)-stimulated genes (ISGs), facilitating the regulation of viral infection [
16]. Van Tol S et al. showed that depletion of TRIM6 in human cells results in increased WNV replication and alters the expression and function of other components of the IFN-I pathway through VAMP8 [
17]. Shuier Zheng et al. reported that TRIM6 promotes colorectal cancer cell proliferation and response to thiostrepton via TIS21/FoxM1 [
18]. However, the potential involvement of TRIM6 in cancer development has received little attention.
In this study, we demonstrate that TRIM6 expression is significantly upregulated in glioma samples and investigate the association between TRIM6 expression and clinical characteristics of glioma patients. To better understand the role of the TRIM6 gene in gliomas, we analyzed the correlation between TRIM6 expression and patient prognosis using data from The Cancer Genome Atlas (TCGA). Additionally, we conducted GO, KEGG, and GSEA analyses to identify potential pathways and processes. Furthermore, we validated the expression of TRIM6 and 9 key genes closely related to TRIM6 in gliomas using RT-qPCR experiments. Moreover, we experimentally confirmed in vitro that knockdown of TRIM6 can inhibit the proliferation, invasion, and migration abilities of glioma cells, while overexpression of TRIM6 can enhance these abilities. Finally, we investigated the relationship between TRIM6 and tumor-infiltrating lymphocytes (TILs). Our findings suggest that TRIM6 may serve as a biomarker for predicting the prognosis and immune infiltration of individuals with gliomas.
2. Materials and Methods
2.1. RNA expression and data mining
Patient Datasets: We downloaded messenger RNA (mRNA) expression data, including 689 glioma samples and 1157 non-tumor samples, from the TCGA database (
https://cancergenome.nih.gov) and the GTEx database (
https://commonfund.nih.gov/gtex). The data were extracted in TPM format, and clinical information was obtained from the TCGA database. Our data filtering strategy involved removing normal samples and samples without clinical information. The data processing method used was log2(value + 1). Our study was conducted in accordance with the publication guidelines provided by TCGA. To further validate our findings, we also downloaded gene expression profiles from the GEO database (
https://www.ncbi.nlm.nih.gov/geo/), including GSE109569 (comprising 3 glioma samples and 3 paired adjacent non-tumor samples) and GSE76070 (comprising 3 glioma samples and 3 paired adjacent non-tumor samples). We used the Human Protein Atlas (HPA) database (
http://www.proteinatlas.org/) to verify the expression of TRIM6 in glioma at the protein level.
2.2. Survival analysis
Based on the median value of TRIM6 expression levels, TCGA glioma data were divided into high and low TRIM6 groups. We used the Kaplan-Meier method and a two-sided log-rank test to analyze differences in overall survival (OS) between the high-risk and low-risk groups. The Stats [4.2.1], survival [3.3.1], survminer, and car packages in R were used to estimate the correlation between TRIM6 expression and the survival rate of various clinical features in glioma patients, and the hazard ratio (HR) and log-rank p-value of the 95% confidence interval were calculated.
2.3. Construction and prediction of the nomogram
In this study, we used Cox regression analysis to select all independent clinicopathological prognostic factors and generated a contingency table to analyze the 1-, 3-, and 5-year overall survival (OS) probabilities of glioma patients using the rms package in R. Calibration and discrimination are the most common methods for evaluating model performance. Receiver operating characteristic (ROC) analysis was used to assess the predictive accuracy of the combined model’s line chart compared to the line charts of other clinicopathological prognostic variables.
2.4. GO, KEGG and GSEA analysis
We used the DESeq2 [
19] package to analyze differentially expressed genes (DEGs) between the high and low TRIM6 expression groups in glioma patients. DEGs were identified using an unpaired t-test, with a threshold value of adjusted P < 0.05 and |logFC| > 2, calculated using the Benjamini-Hochberg method. Gene Ontology (GO) analysis revealed that these genes were represented in various functional categories, including biological processes, molecular functions, and cellular components. KEGG enrichment and pathway analyses of DEGs were conducted using the Database for Annotation, Visualization, and Integrated Discovery (DAVID) online tools (
https://david.ncifcrf.gov). The KEGG pathway database is a resource for understanding the high-level functions and utilities of biological systems, including various biochemical pathways. In this study, we used the clusterProfiler package [
20] for GO and KEGG analyses.
2.5. Protein interaction PPI network construction and hub genes analysis
The STRING Database (
https://string-db.org/) is a search engine for known protein-protein interactions. After obtaining data from the STRING database, you can use Cytoscape, an open-source network visualization and analysis application. Its primary goal is to provide a basic functional layout and query network, and to construct a protein mutual PPI network by combining basic data into a visual network. The Cytoscape plugin cytoHubba (version 0.1) can identify hub genes in the PPI network.
2.6. Tissue samples collection
Four glioma samples and corresponding non-tumor tissue samples were obtained from Sun Yat-sen University Cancer Center under protocols approved by the institutional review board at Sun Yat-sen University Cancer Center. Written informed consent was obtained from all patients enrolled in the study. All experiments using clinical samples were carried out in accordance with the approved guidelines.
2.7. Cell culture and reagents
The U251 and U373 cell line was maintained in the State Key Laboratory of Oncology in South China of SYSUCC (Guangzhou, China). Cells were grown in DMEM medium (Thermo Fisher Scientific, Waltham, MA, USA) supplemented with 10% fetal calf serum (FBS), 100 g/ml Penicillin, and 100 g/ml Streptomycin at 37°C in a humidified incubator containing 5% carbon dioxide.
2.8. Cell transfection and RNA knockdown
To study TRIM6’s function, we performed cell transfection and RNA knockdown experiments. Lentiviral construct containing the full length TRIM6 (GeneCopoeia, Germantown, MD, USA) was packaged into 293T cells using the ViraPower Mix (Invitrogen, Carlsbad, CA, USA) according to the manufacturer’s instructions. U373 cells were stably transfected with TRIM6-expressing lentivirus or lentiviral vector plus 10 mg/mL polybrene (Beyotime Biotechnology, Haimen, China). To establish TRIM6 knockdown cells, short hairpin RNAs (shRNA) in lentivirus against TRIM6 (GeneCopoeia, Germantown, MD, USA) were stably transduced into U251 cells. Confirmed siRNA targeting sequences and the reference gene were listed in
Table S3.
2.9. RNA preparation and quantitative RT-qPCR
Total cellular RNA was extracted using TRI Reagent (Invitrogen, Carlsbad, CA, USA) follow the manufacturer’s instructions. cDNA was synthesized using Hifair® III 1st Strand cDNA Synthesis SuperMix (Yeasen Biotechnology, Shanghai, China). Then, RT-qPCR was performed using Hieff® qPCR SYBR® Green Master Mix (Yeasen Biotechnology, Shanghai, China) on the LightCycler® 480 Real-Time PCR System to determine the mRNA expression of targeted genes. The amplification of glyceraldehyde-3-phosphate dehydrogenase (GAPDH) gene was used as an internal control. The primer sequences used for analysis are shown in
Table S3.
2.10. Antibodies and Western Blot analysis
Western blot analysis was performed according to the standard protocol with antibodies against TRIM6 (Affinity biosciences, Jiangsu, China), β-actin (Cell Signaling Technology, Danvers, MA, USA).
2.11. Cell proliferation and foci formation assay
Cell Counting Kit-8 (CCK-8) revealed the presence of cellular proliferation (Dojindo, Shanghai, China). The cells were grown in the 96well plate (3×10³ cells/well) in the 37°C CO2 incubator for 0 hours, 24 hours, 48 hours, 72 hours and 96 hours before 10 μl of the CCK-8 mixture was added to each well. After incubating the cells at 37°C for 2 hours, the absorbance was measured at 450 nm using a microplate reader. In foci formation assay, 1×10³ cells were seeded in six-well plate. After 14 days culture, cell colonies were counted by crystalviolet staining.
2.12. Wound healing assay and Transwell assay
The capacity for cell migration was detected using wound healing assay. Cells were seeded into a six well plate (5×10⁵ per well) and cultured to 90% confluence before 200μl pipette tips were used to make scratches. The six well plates were then cultured for 48 hours at 37°C and 5% CO2 in a cell culture incubator. The migratory distance of the cells was captured using the FSX100 BioImage System (Media Cybernetics, Rockville, MD) and analyzed using Imagepro plus at 0 and 48 hours after wound scratching. The percentage of wound closure was determined as (wound closure area/initial area) 100 percent. (*p < 0.05)
The Transwell assay was performed using 24-well Transwell inserts (8 μm pore size). The U251 and U373 cells were cultured in DMEM supplemented with FBS and penicillin-streptomycin. The Transwell inserts were coated with or without Matrigel, and 1 × 10^5 cells were seeded onto the upper chamber. The lower chamber contained DMEM supplemented with FBS as a chemoattractant. The plates were incubated at 37°C and 5% CO2 for 48 hours. After incubation, the Transwell inserts were removed, and migrated cells on the lower surface were fixed, stained, and imaged. Cell quantification was performed using image analysis software. Statistical analysis was conducted using Student’s t-test.
2.13. Statistical analysis
To assess the degree of TRIM6 gene expression in patients with Gliomas, box plots and scatter plots were used. The median method of gene expression was determined to be the TRIM6 expression cutoff value. The relationship between TRIM6 expression and the clinical features of Gliomas was examined using the Wilcoxon signed-rank test and logistic regression. The log-rank test was used to look at the p-value. The chi-square test was used for categorical data, whereas the t test was used for numerical variables. To find pertinent predictive factors, both univariate and multivariate Cox analyses were used. In all analyses, *, **, and *** indicate p < 0.05, p < 0.01 and p < 0.001, respectively.
4. Discussion
TRIM proteins are well known to involve in immune responses and carcinogenesis [
22]. TRIM6 has a tripartite motif and possesses E3-ubiquitin ligase activity like other TRIM family members [
16]. The functions of TRIM6 in viral infection and inflammatory responses have been identified in earlier investigations. However, the role of TRIM6 in the development of cancer has rarely been reported. The mechanism of Gliomas’ tumorigenesis remains unknown. The relationship between viral infection and Glioma is one of the most important research fields [
23]. Anna E Coghill et al., reported evidence of an inverse association between exposure to EBV and glioma and cytomegalovirus exposure may be related to a higher likelihood of the nonglioblastoma subtype [
24]. Zehao Cai et al., reported the degree of CMV, HPV and HHV-6 infection infection have a significant impact on the prognosis of glioma patients in a meta-analysis [
23].
According to the 2016 WHO classification, glioma is first classified according to histological features, and then more subtypes are classified according to molecular characteristics. There are a variety of indicators that are widely used in clinical practice (such as GFAP, EMA, MGMT, P53, NeuN, Oligo2, EGFR, VEGF, IDH1, Ki-67, 1p/19q), and these indicators are highly correlated with the prognosis of the patients [
25,
26,
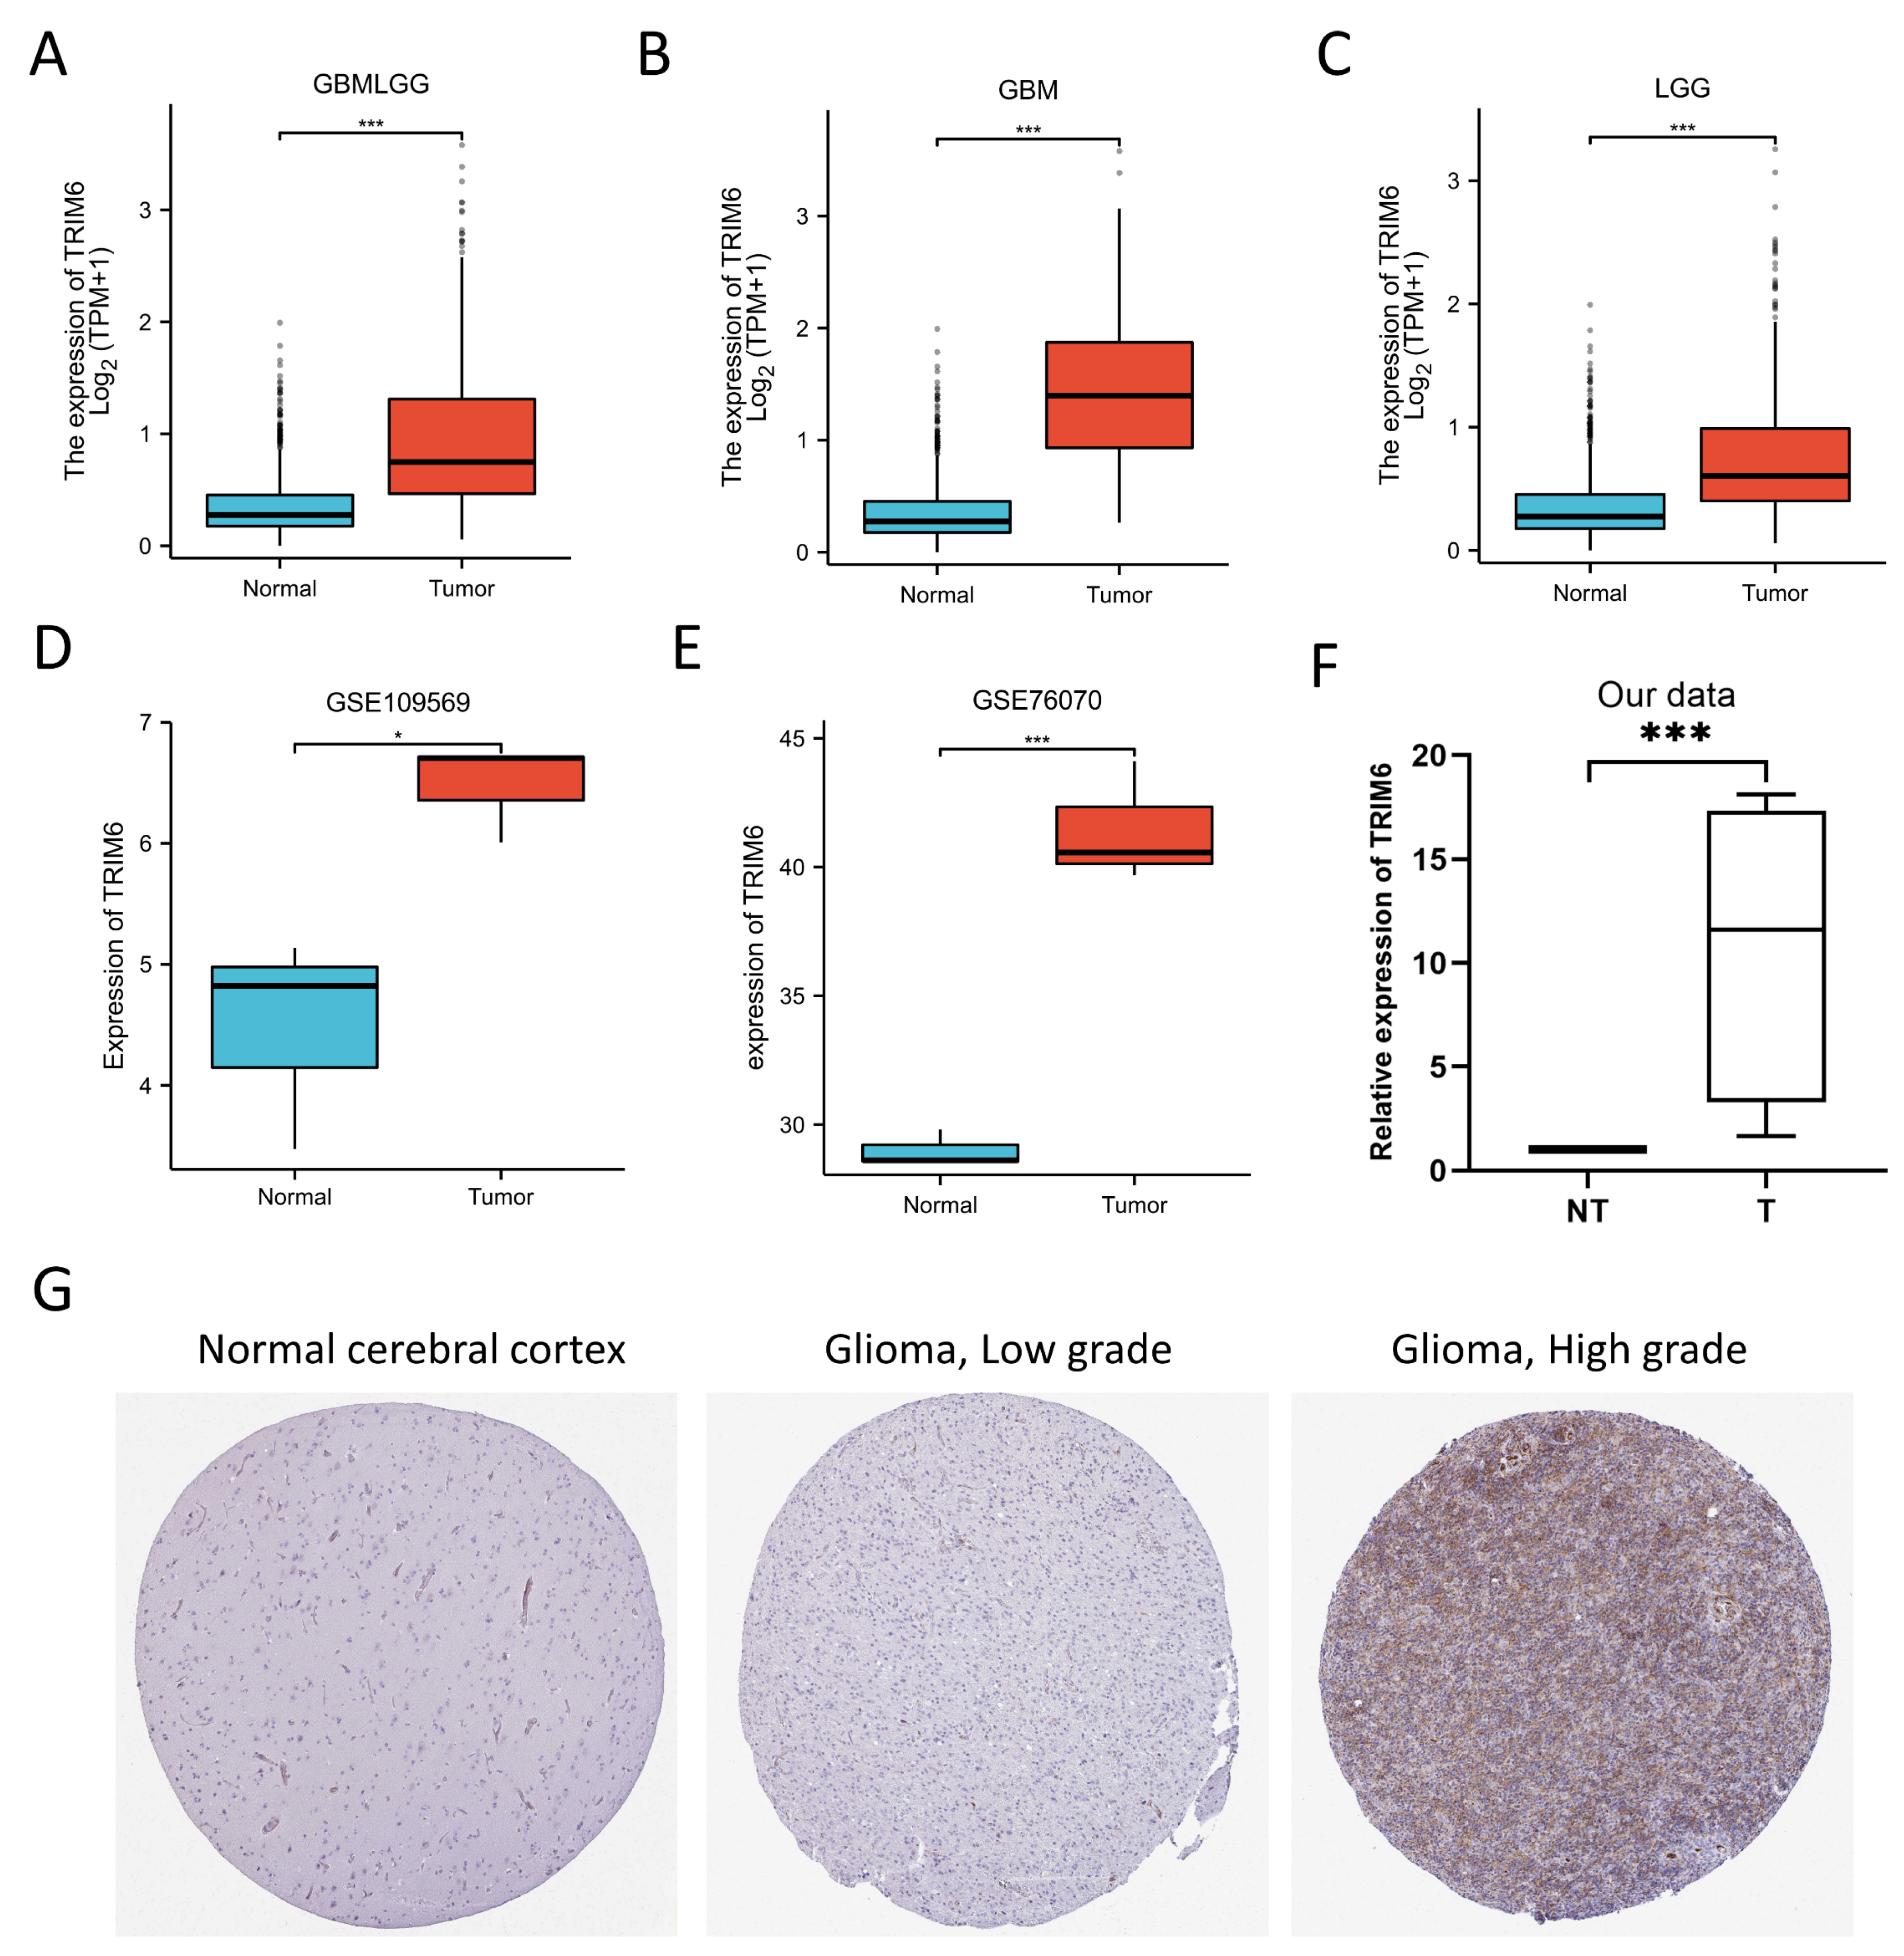
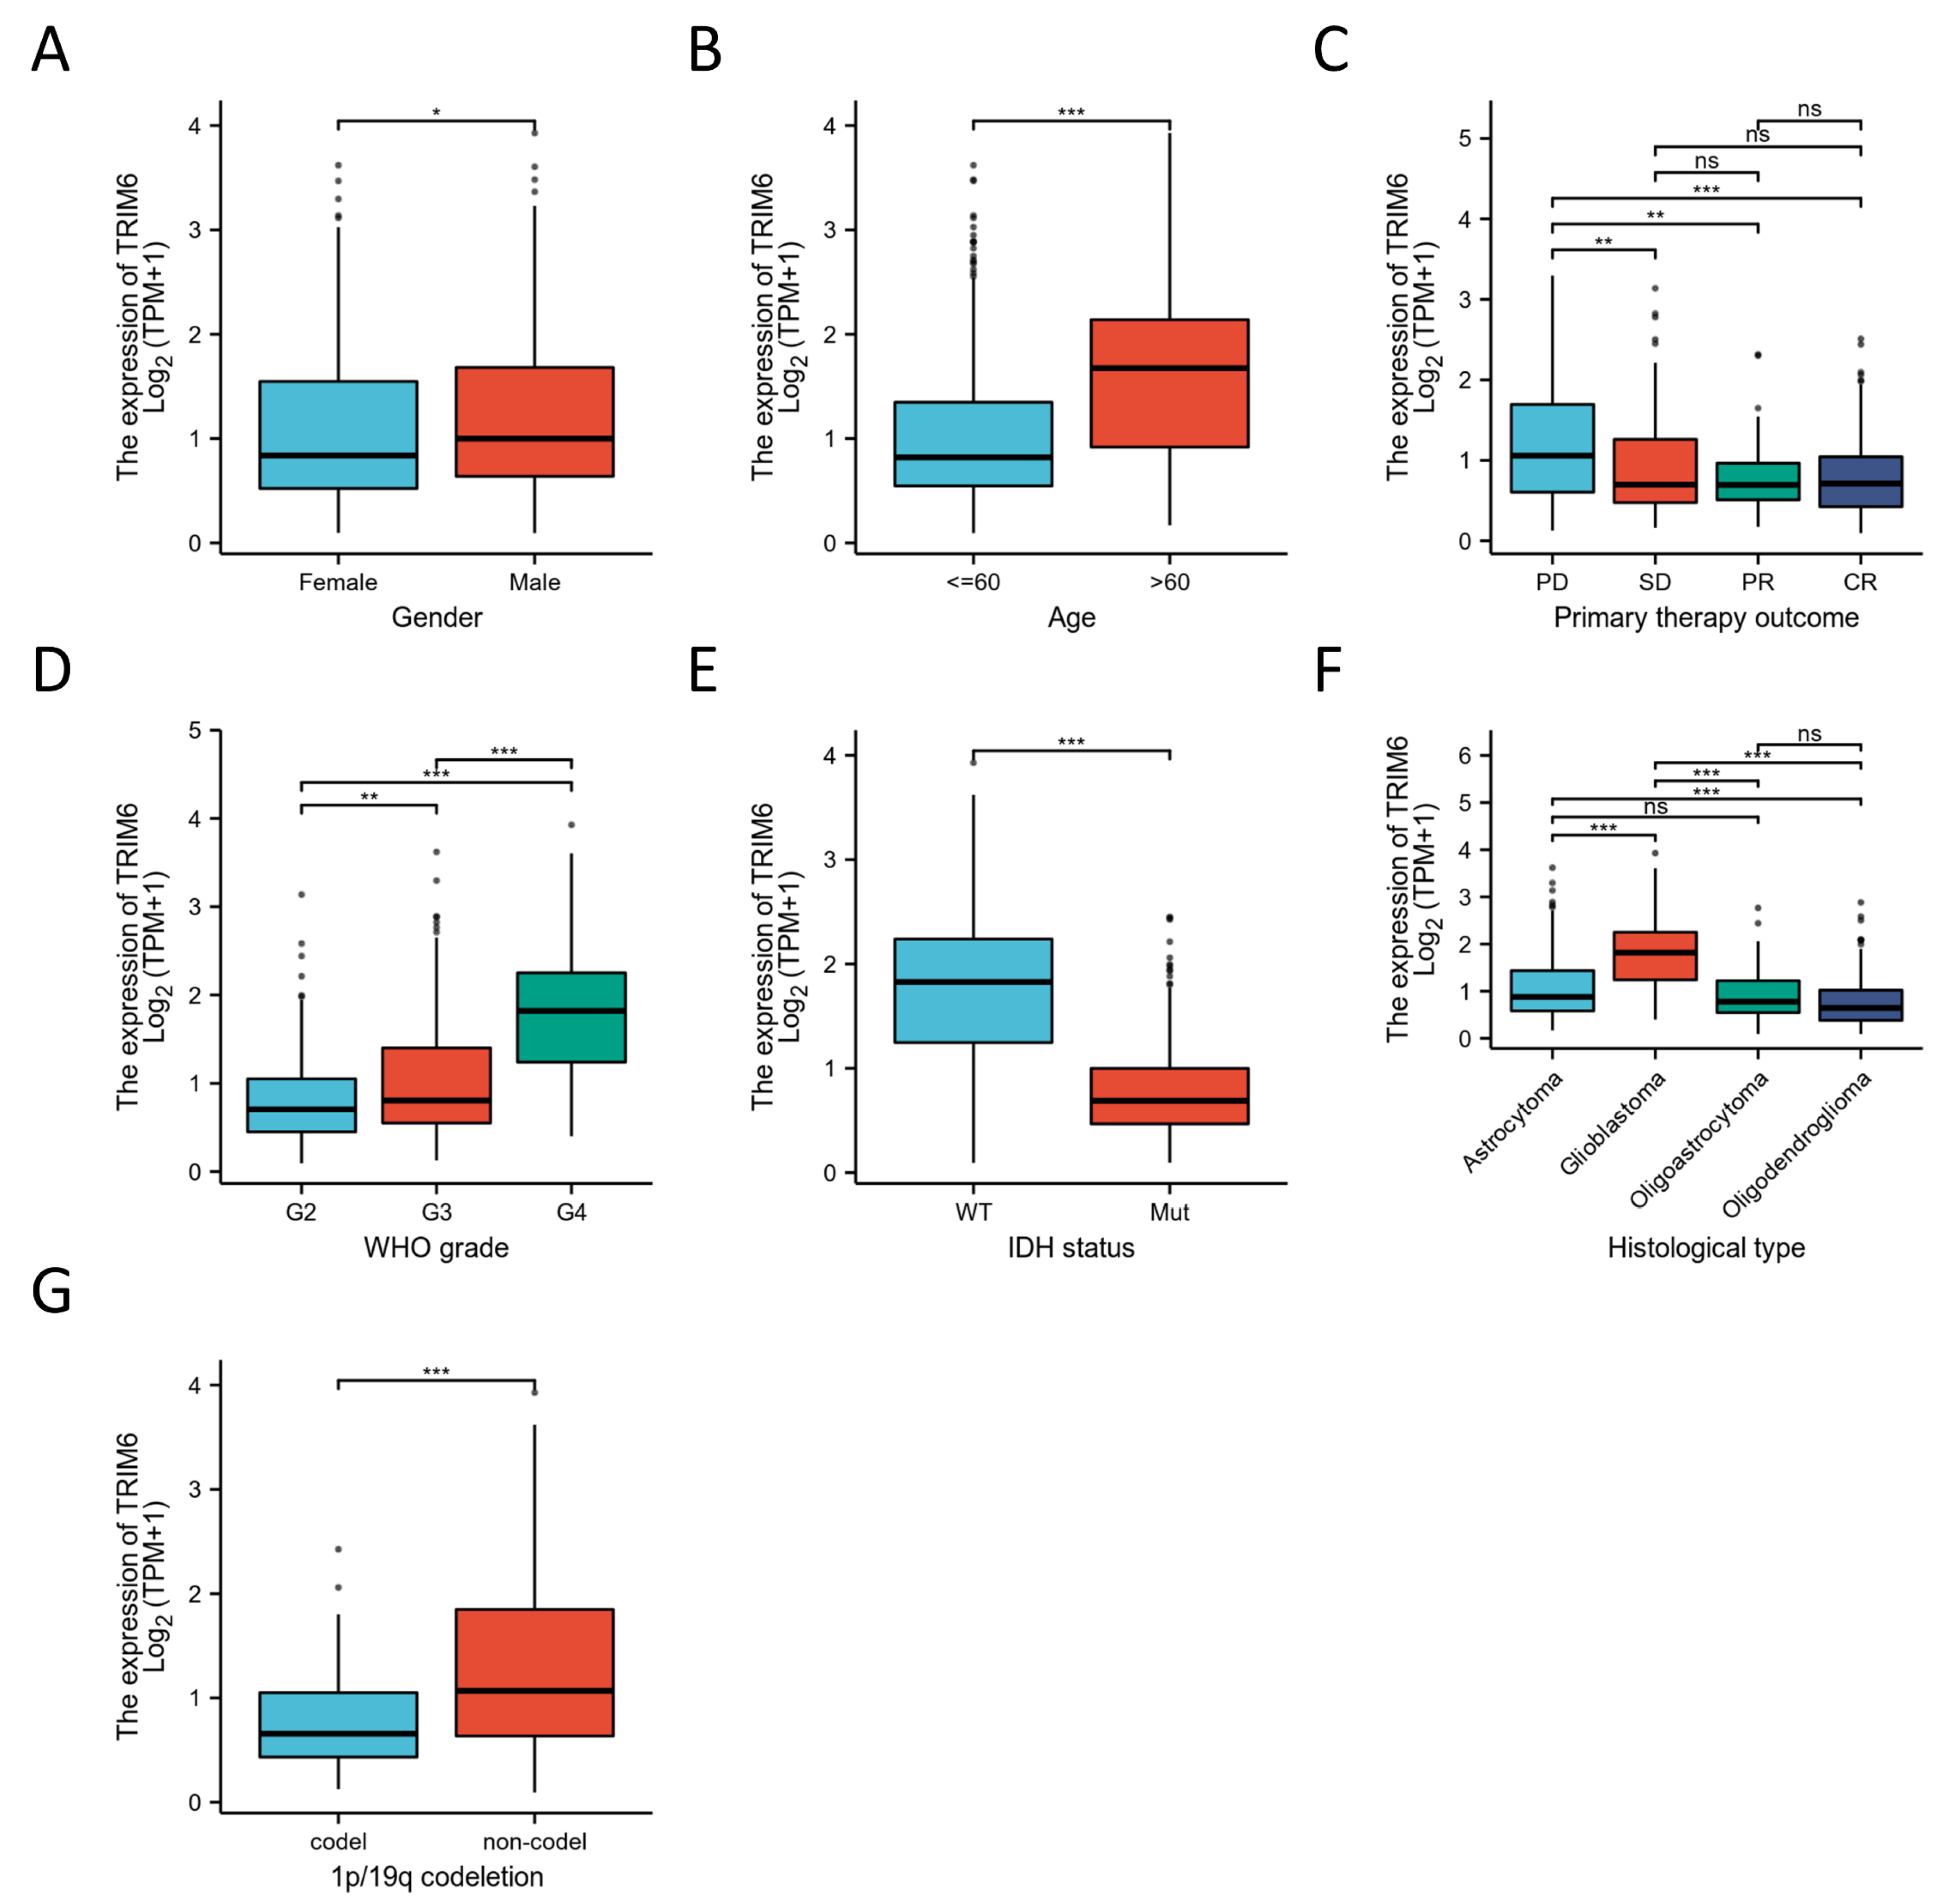
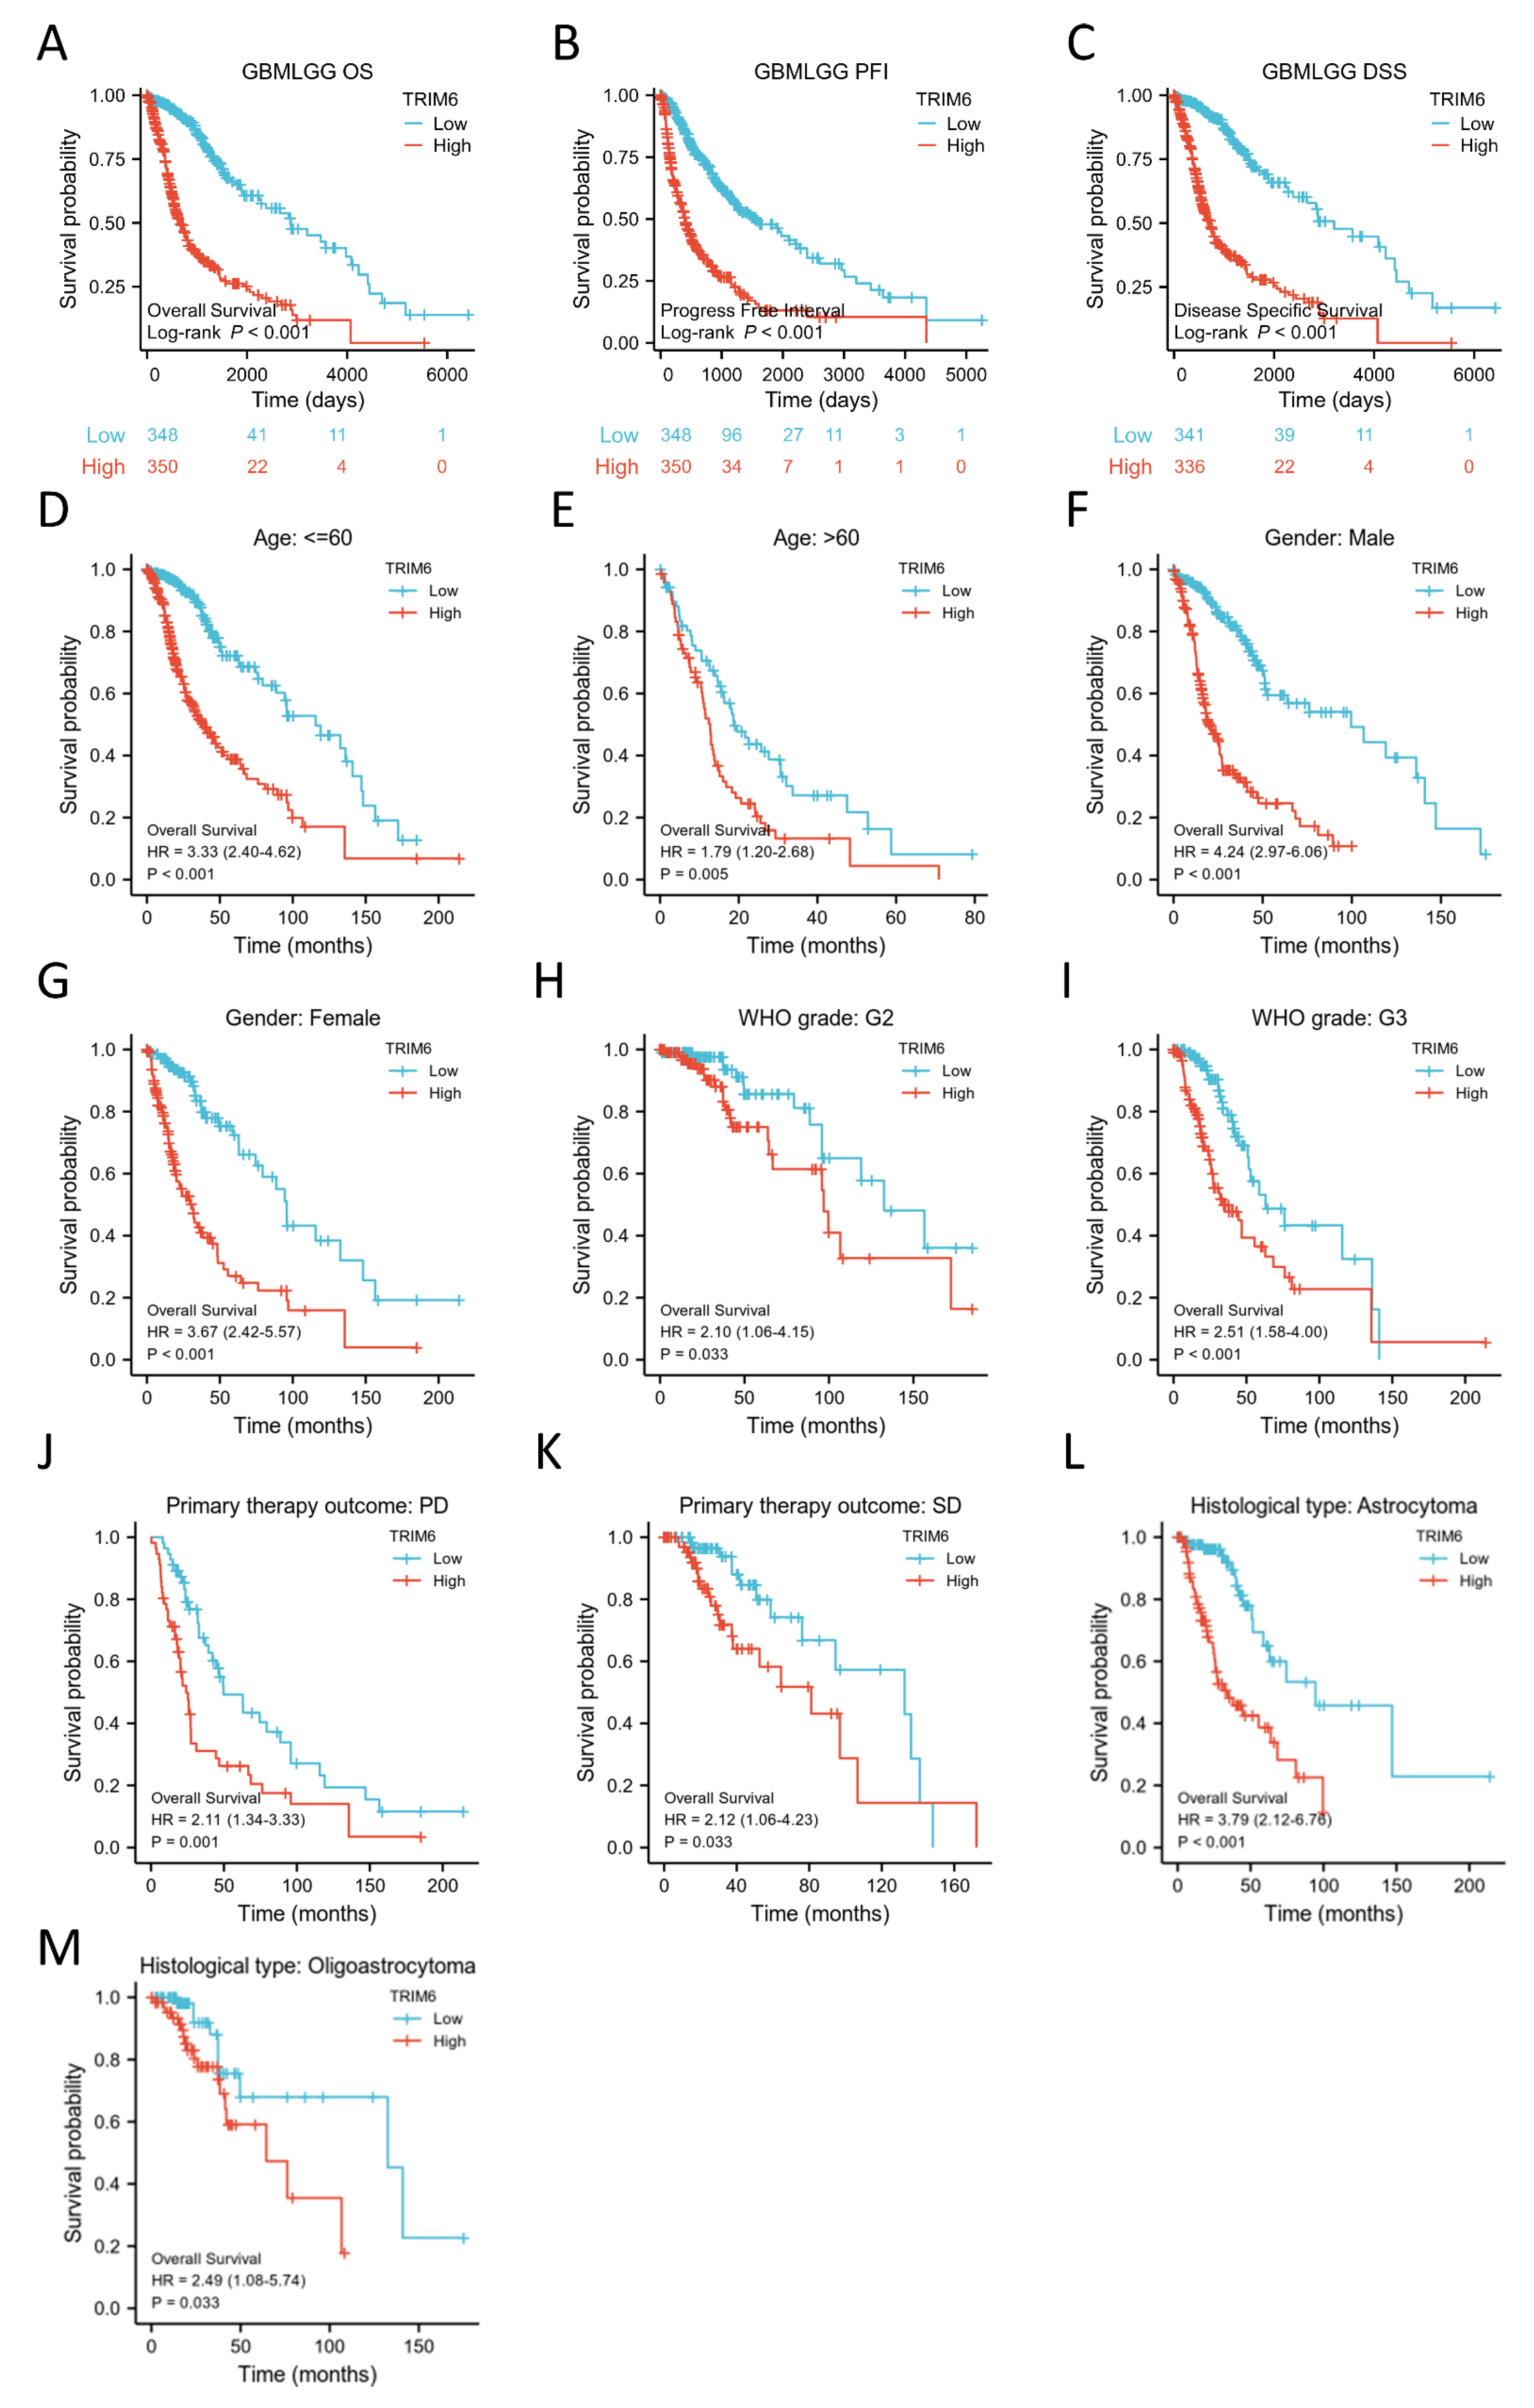
27]. Our results demonstrated that the expression of TRIM6 was significantly up-regulated in Gliomas samples compared to normal tissues, suggesting that TRIM6 may be a suitable target for the development of diagnostic techniques for patients with Gliomas and may be exploited in therapeutic settings. In addition, a high TRIM6 expression in Gliomas is associated with poor OS, DSS, and PFI. Moreover, the expression of TRIM6 in Gliomas was related with advanced clinicopathological features, according to our findings (WHO grade, Histological type, age sex and Primary therapy outcome). Expression of TRIM6 was associated with clinical and pathological indicators of a poor prognosis, as determined by univariate analysis utilizing logistic regression. We employed univariate and multivariate analysis to determine the impact of TRIM6 expression on Glioma patients. These findings strongly suggest that TRIM6 may be exploited as an oncogene and prognostic biomarker. Our findings are in agreement with the conclusions derived from the study of Shuier Zheng et al. apparently supporting the tumor-promoting effect of TRIM6 [
18]. However, further study is necessary to reach a definite conclusion.
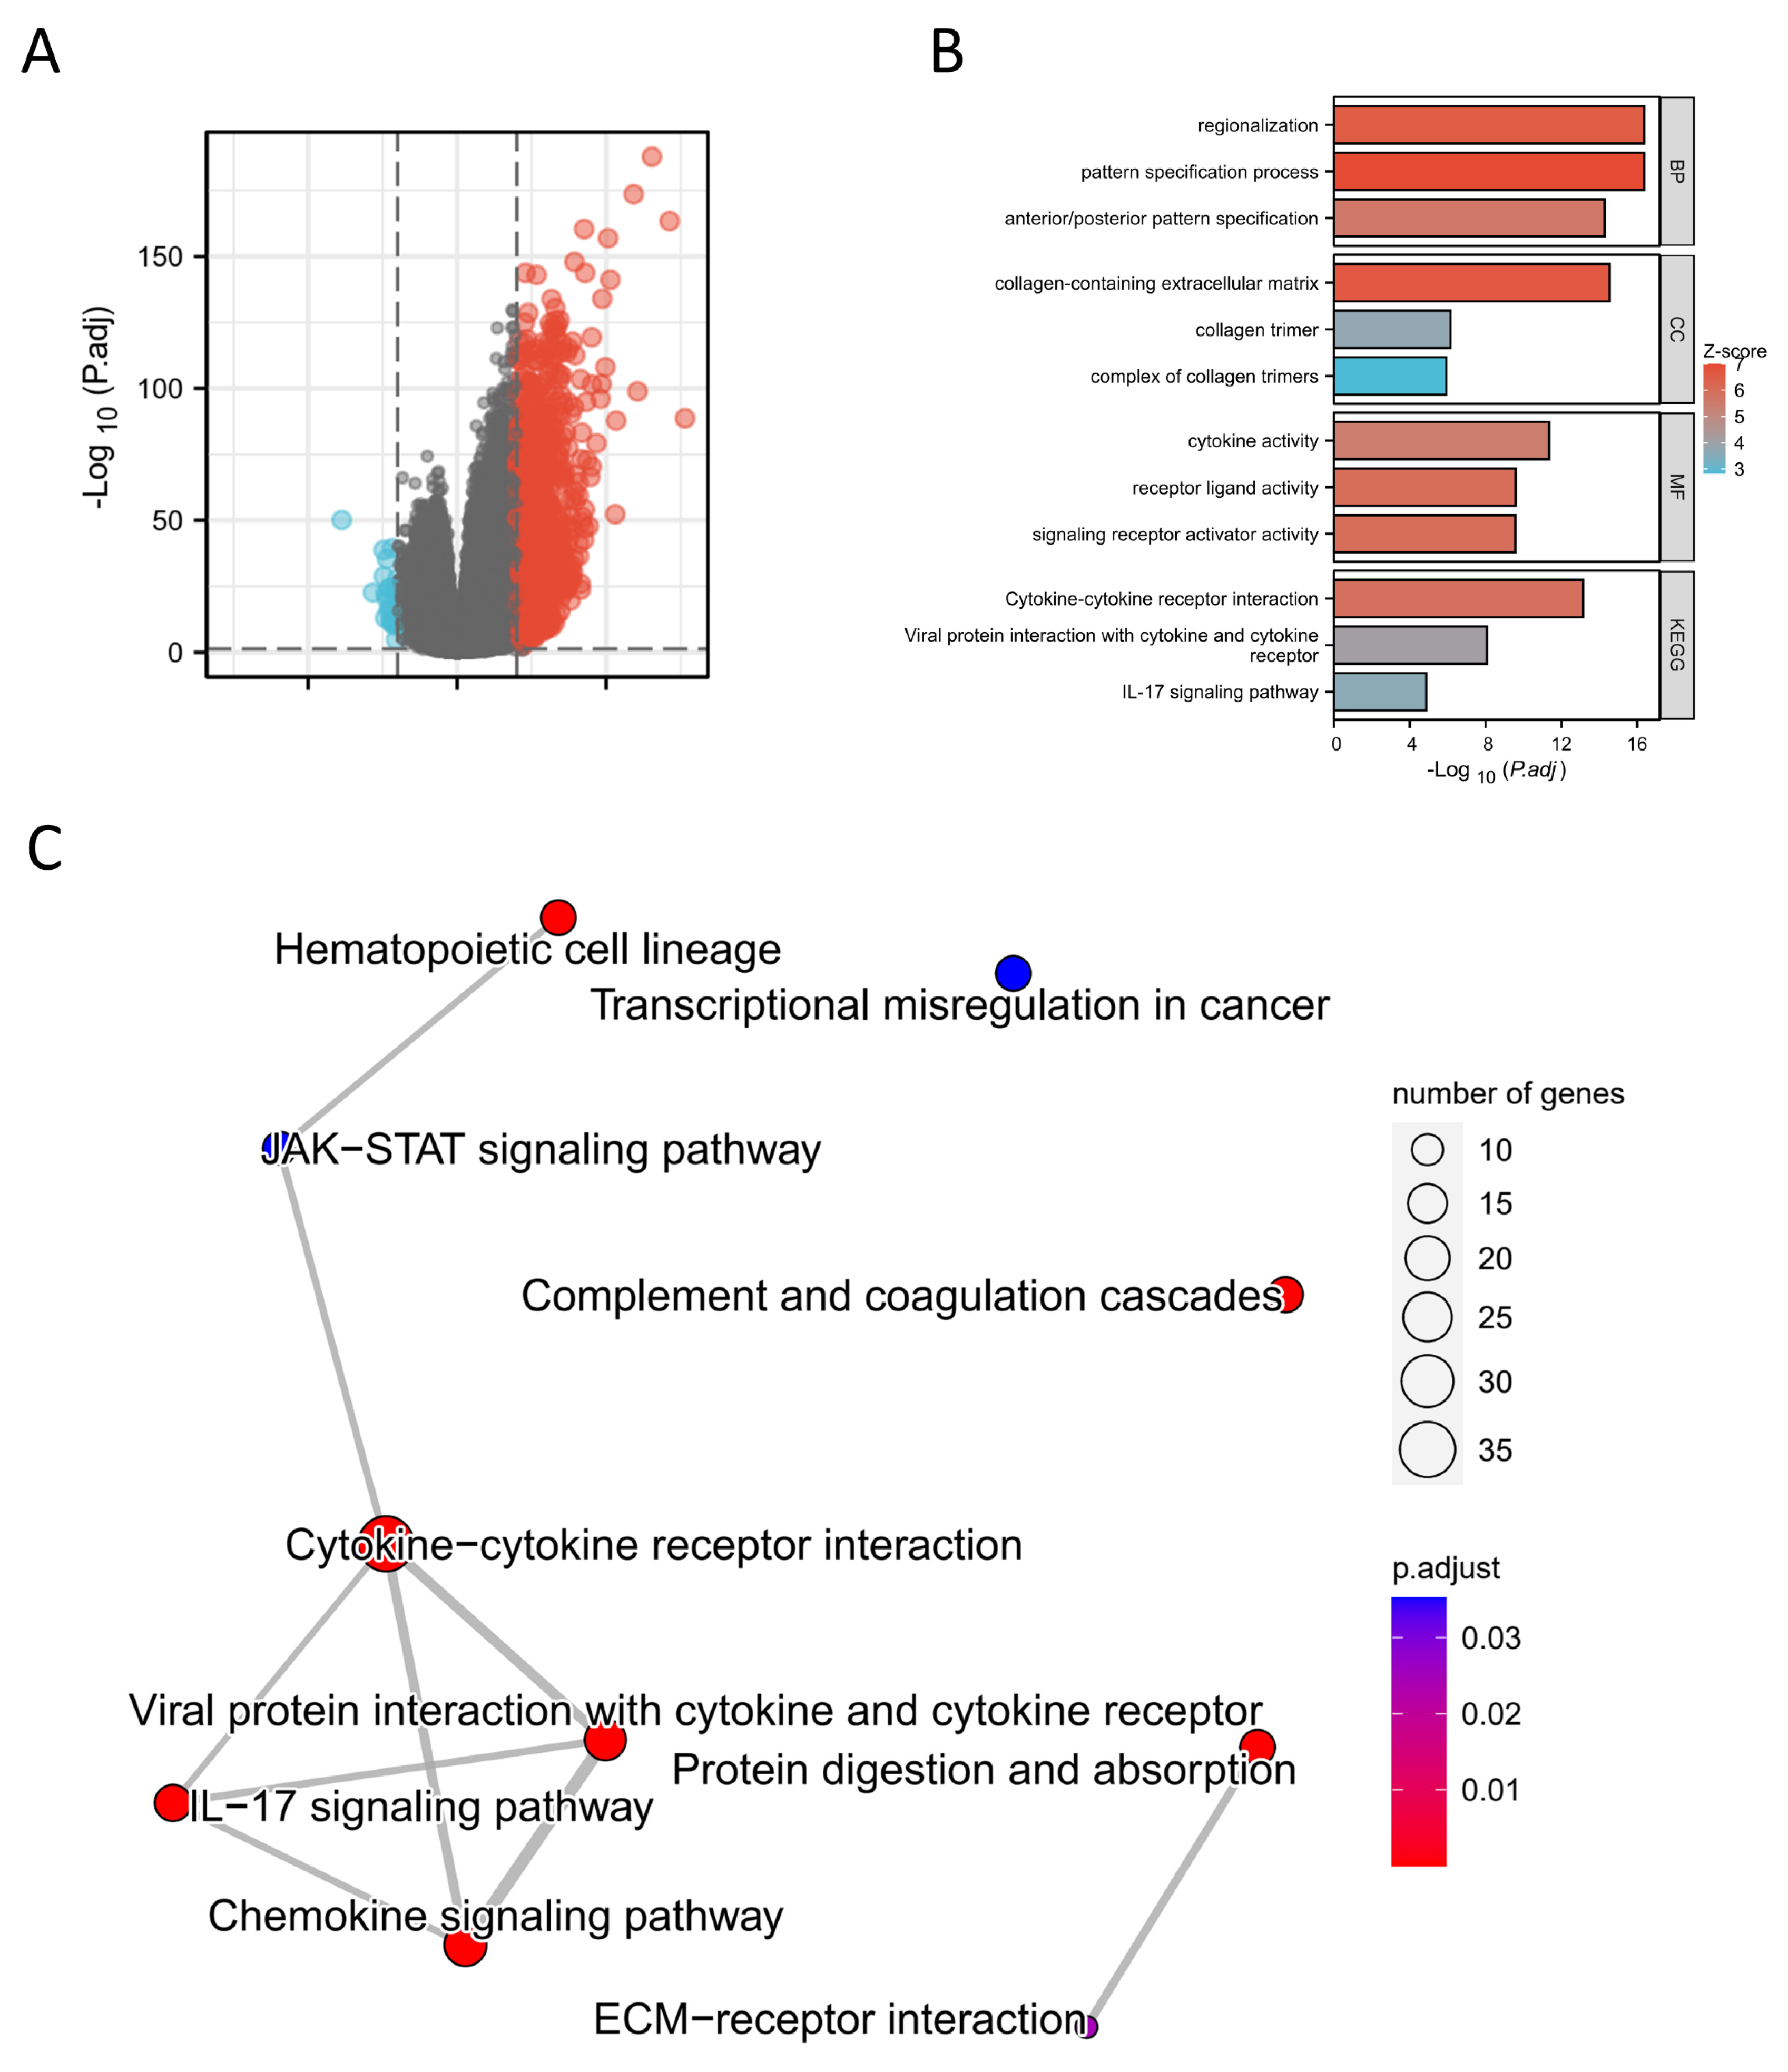
To explain the underlying molecular mechanism by which TRIM6 influences the prognosis of Gliomas, we compared the gene expression profiles between TRIM6 high- and low-expression groups using the TCGA-GBMLGG database. DEGs were detected. In the category ‘MF’, the DEGs were clearly enriched in the categories of ‘cytokine activity’, ‘receptor ligand activity’, and ‘signaling receptor ligand activity’, which indicated that TRIM6 may play a molecular function by regulating cytokines and receptors. Cytokines and their receptors play an important role in immunomodulation, inflammatory response, tumor metastasis and other physiological and pathological processes [
28,
29], and also play an important role in the directional migration of immune cells [
30,
31,
32,
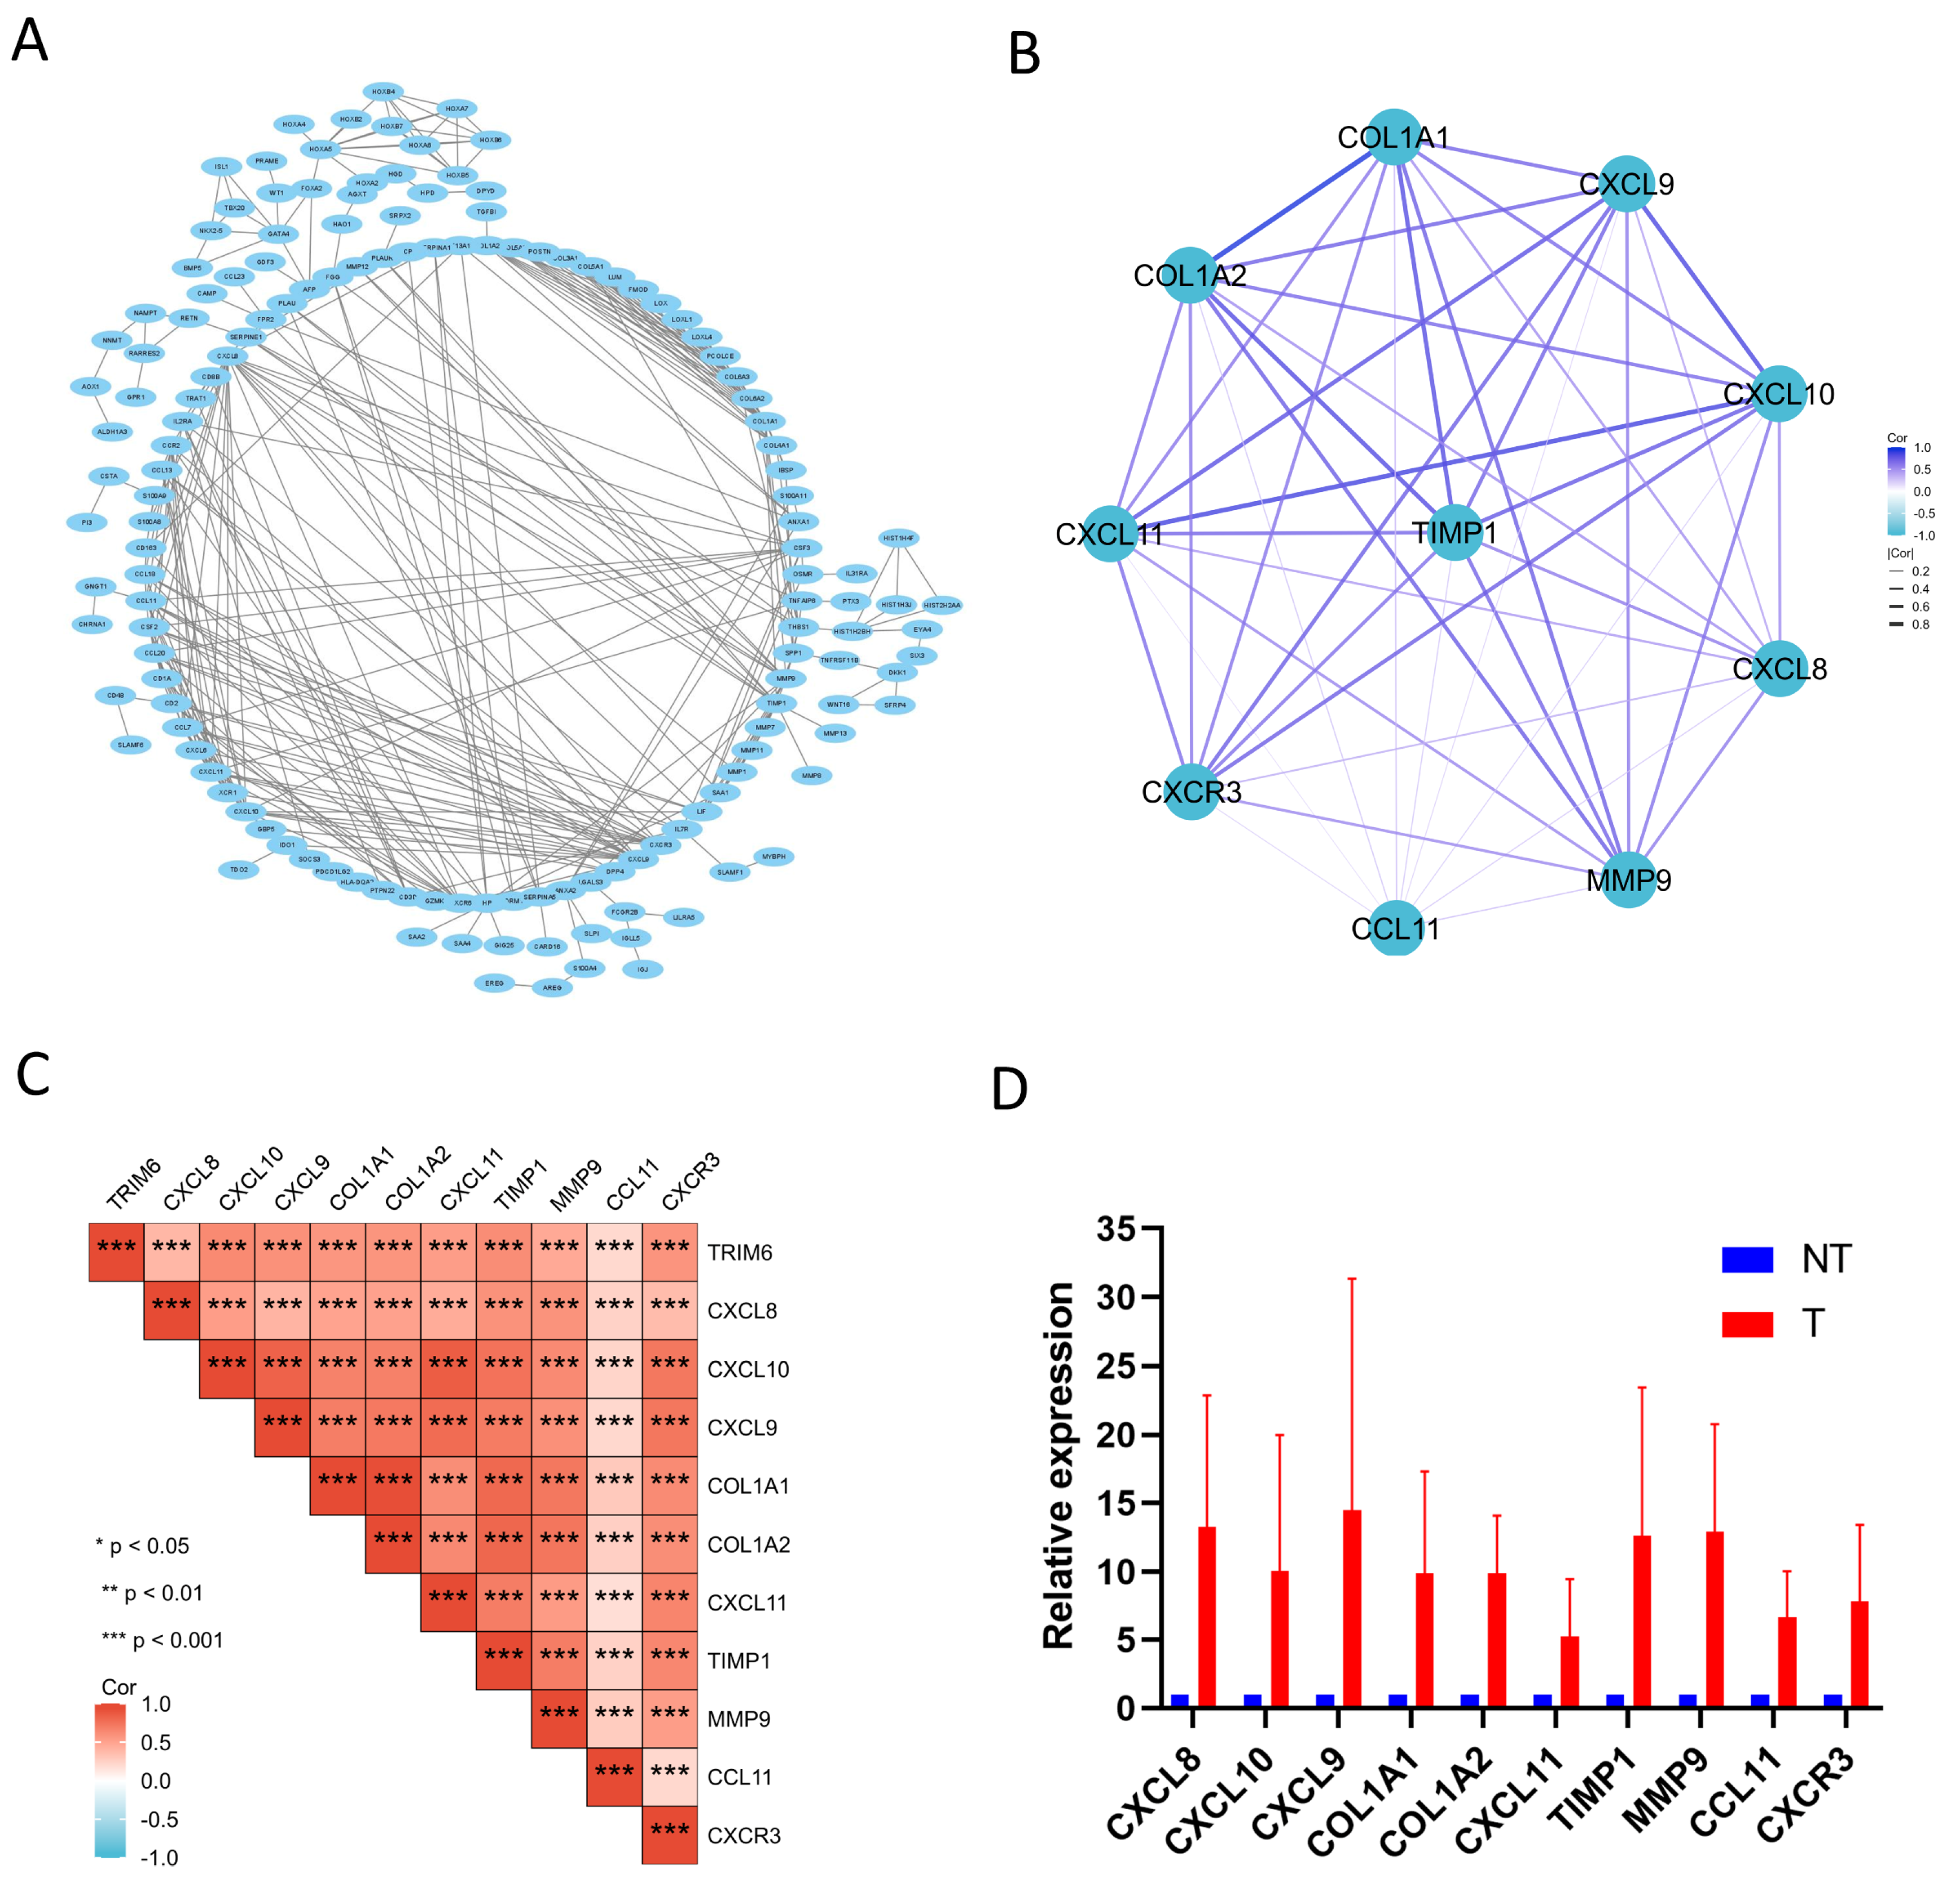
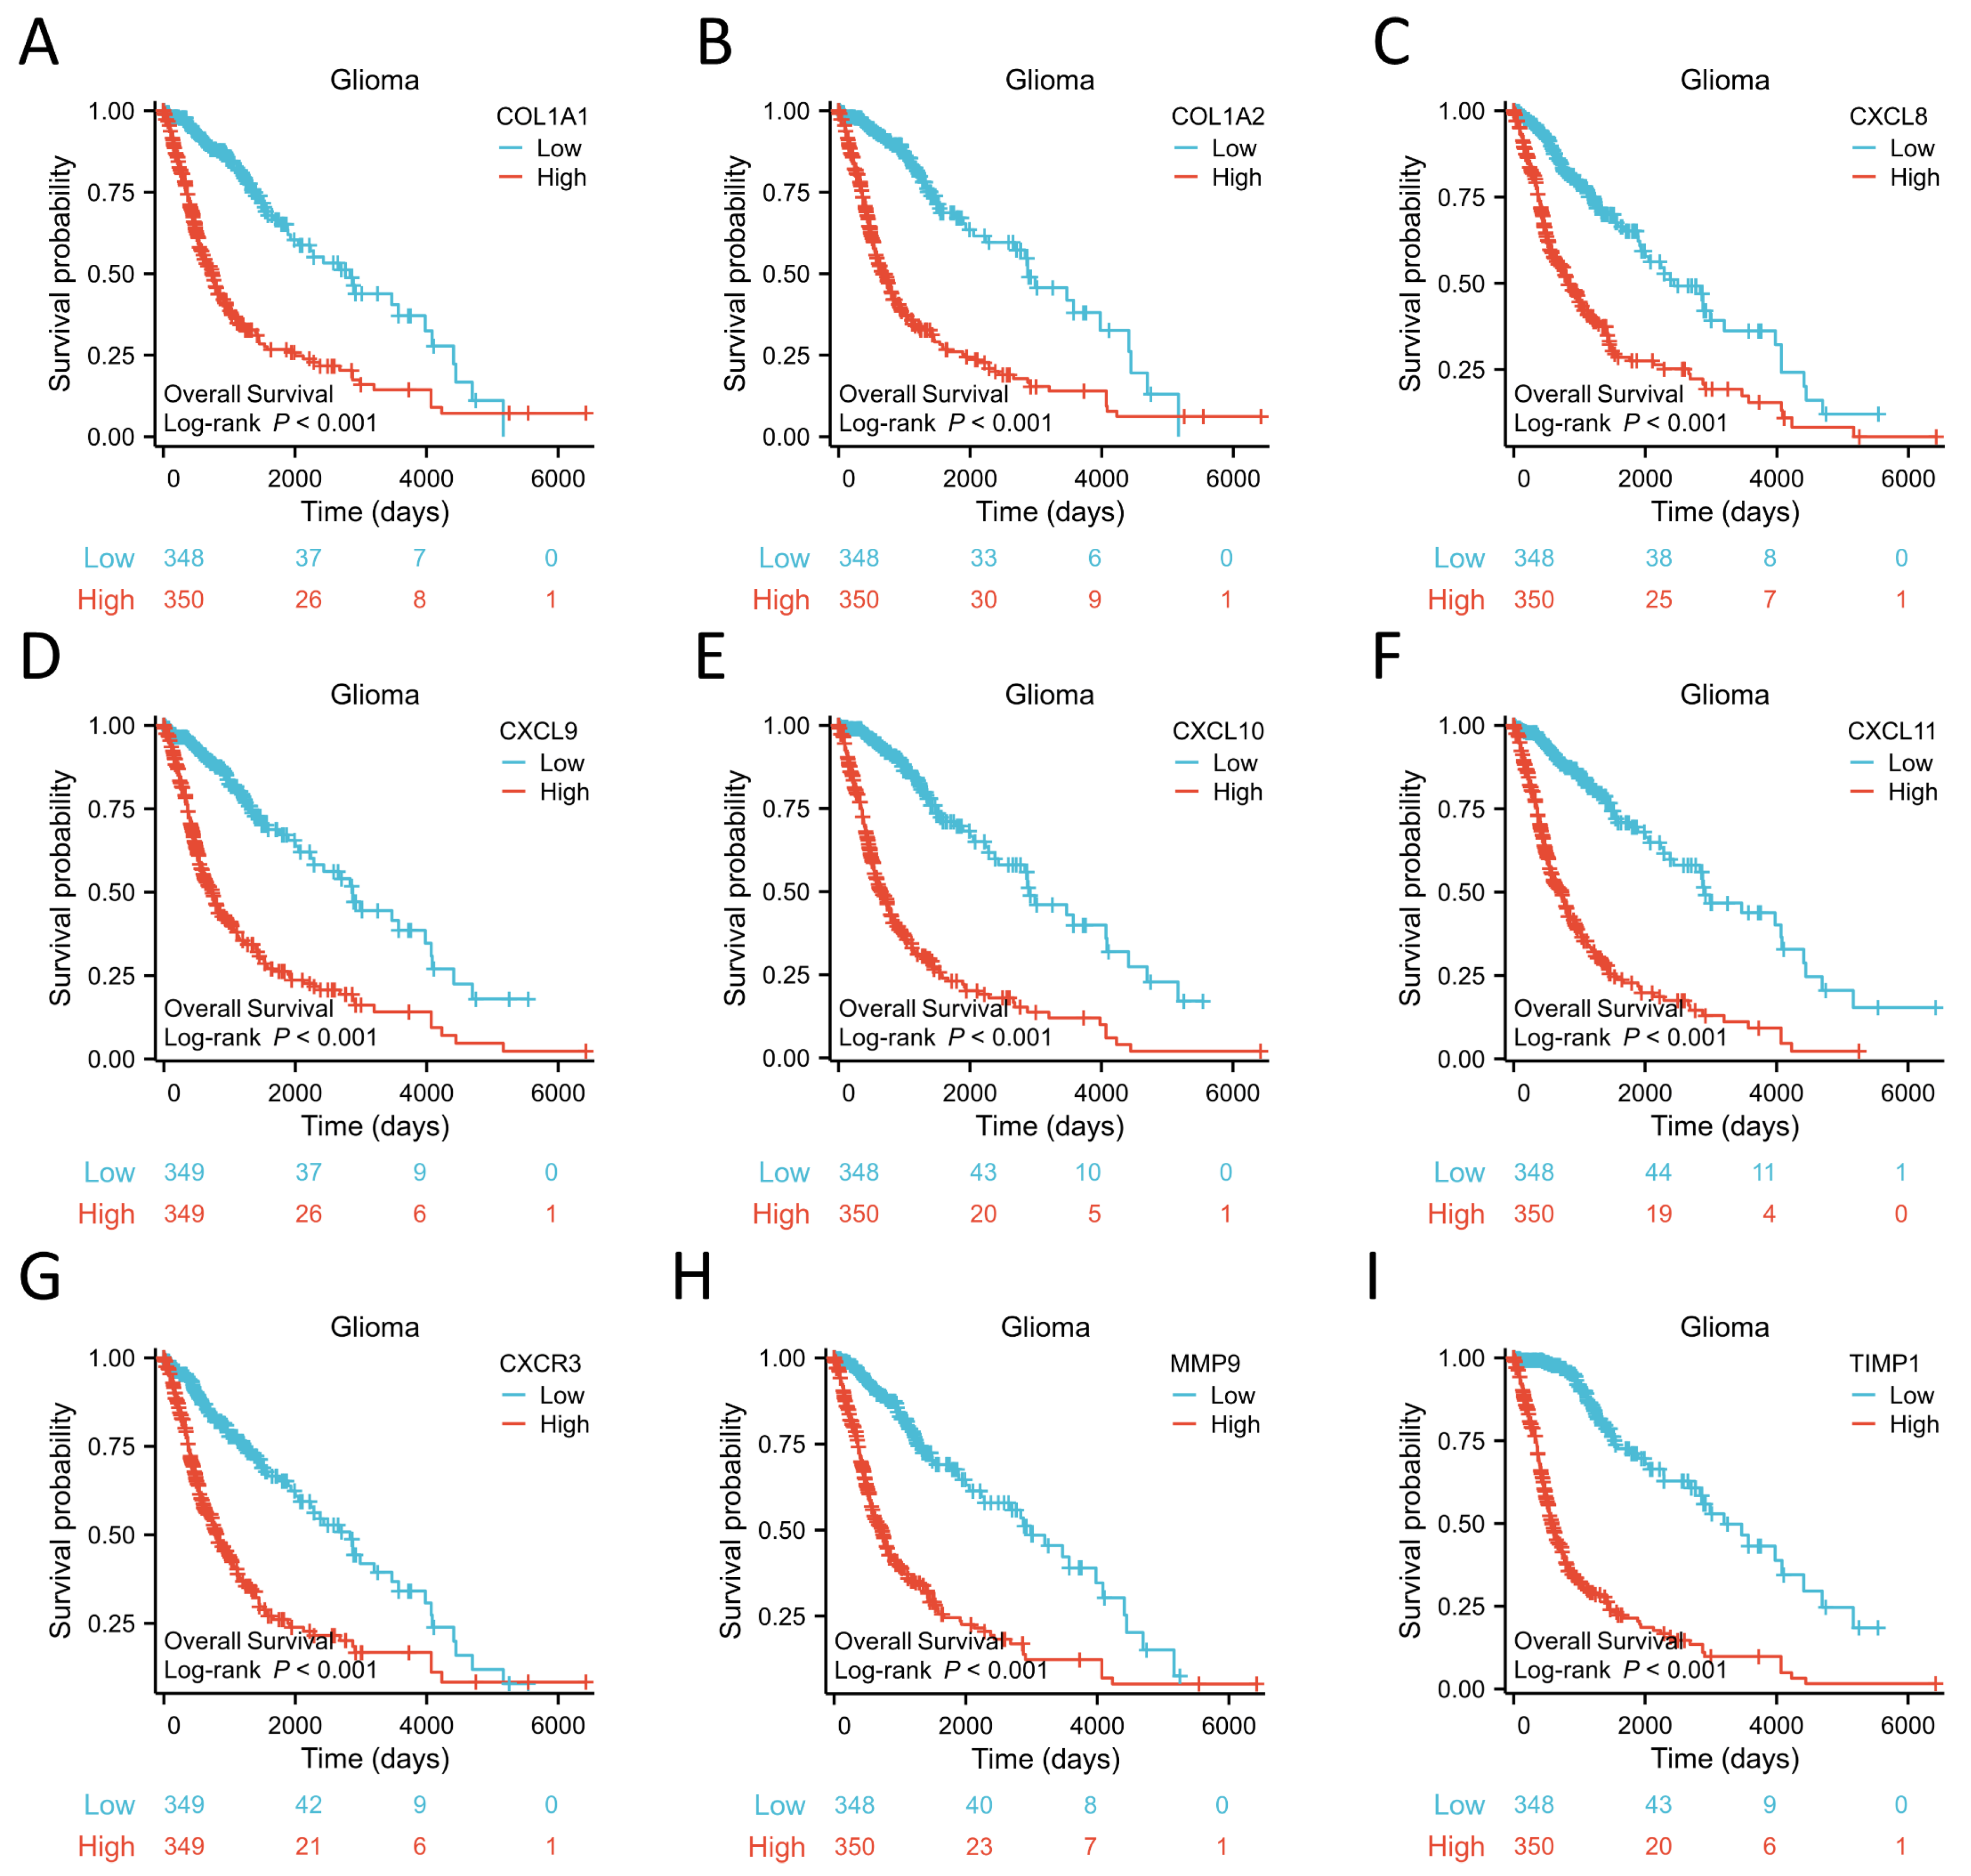
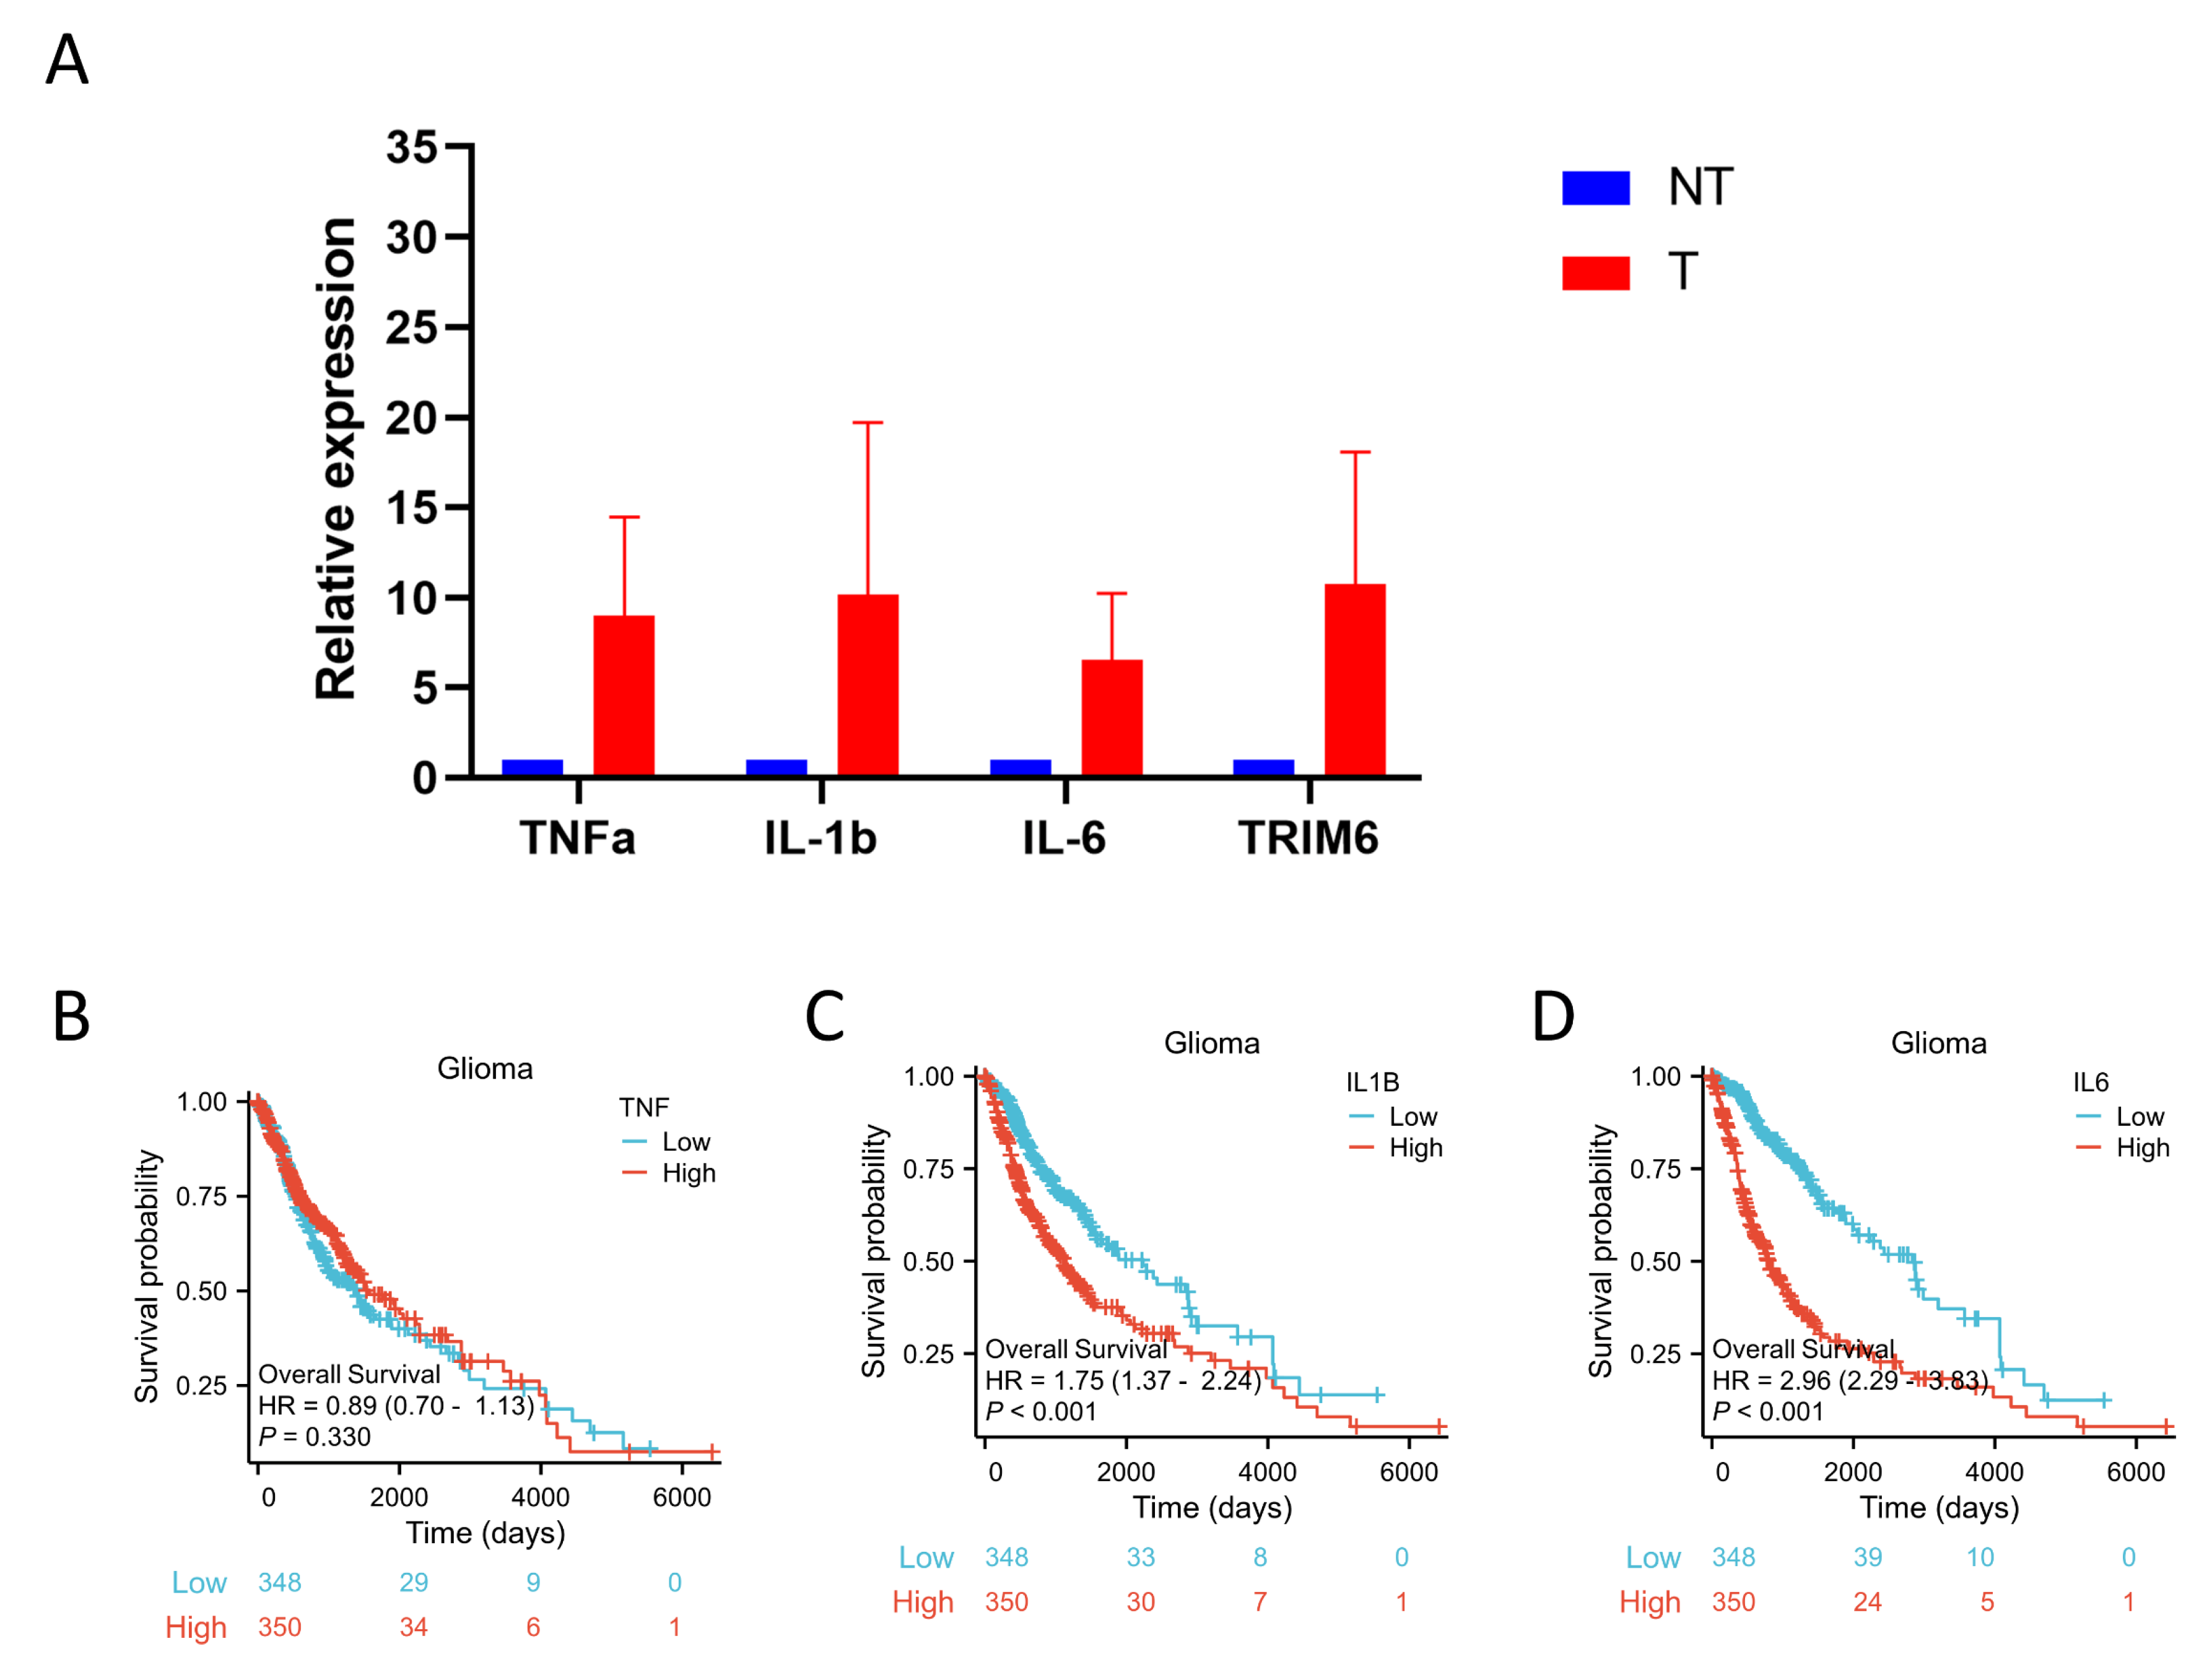
33]. KEGG enrichment analysis found that the DEGs were mostly enriched in ‘Cytokine-cytokine receptor interaction’, which supports the above conclusion. Moreover, ‘IL-17 signaling pathway’ and ‘Viral protein interaction with cytokine and cytokine receptor’ were also enriched. GSEA result indicated that Cytokine-cytokine receptor interaction signaling pathway was one of the most activated pathways. We defined 10 genes, including COL1A1, COL1A2, CXCL8, CXCL9, CXCL10, CXCL11, CXCR3, MMP9, and TIMP1, from the TRIM6 gene network as our hub genes. To our surprise, the high expression of these 10 hub genes was associated with poor prognosis of Gliomas. Moreover, the expression of these 10 hub genes was positively correlated with TRIM6. Notably, most of them are important genes in the Cytokine-cytokine receptor interaction pathway.
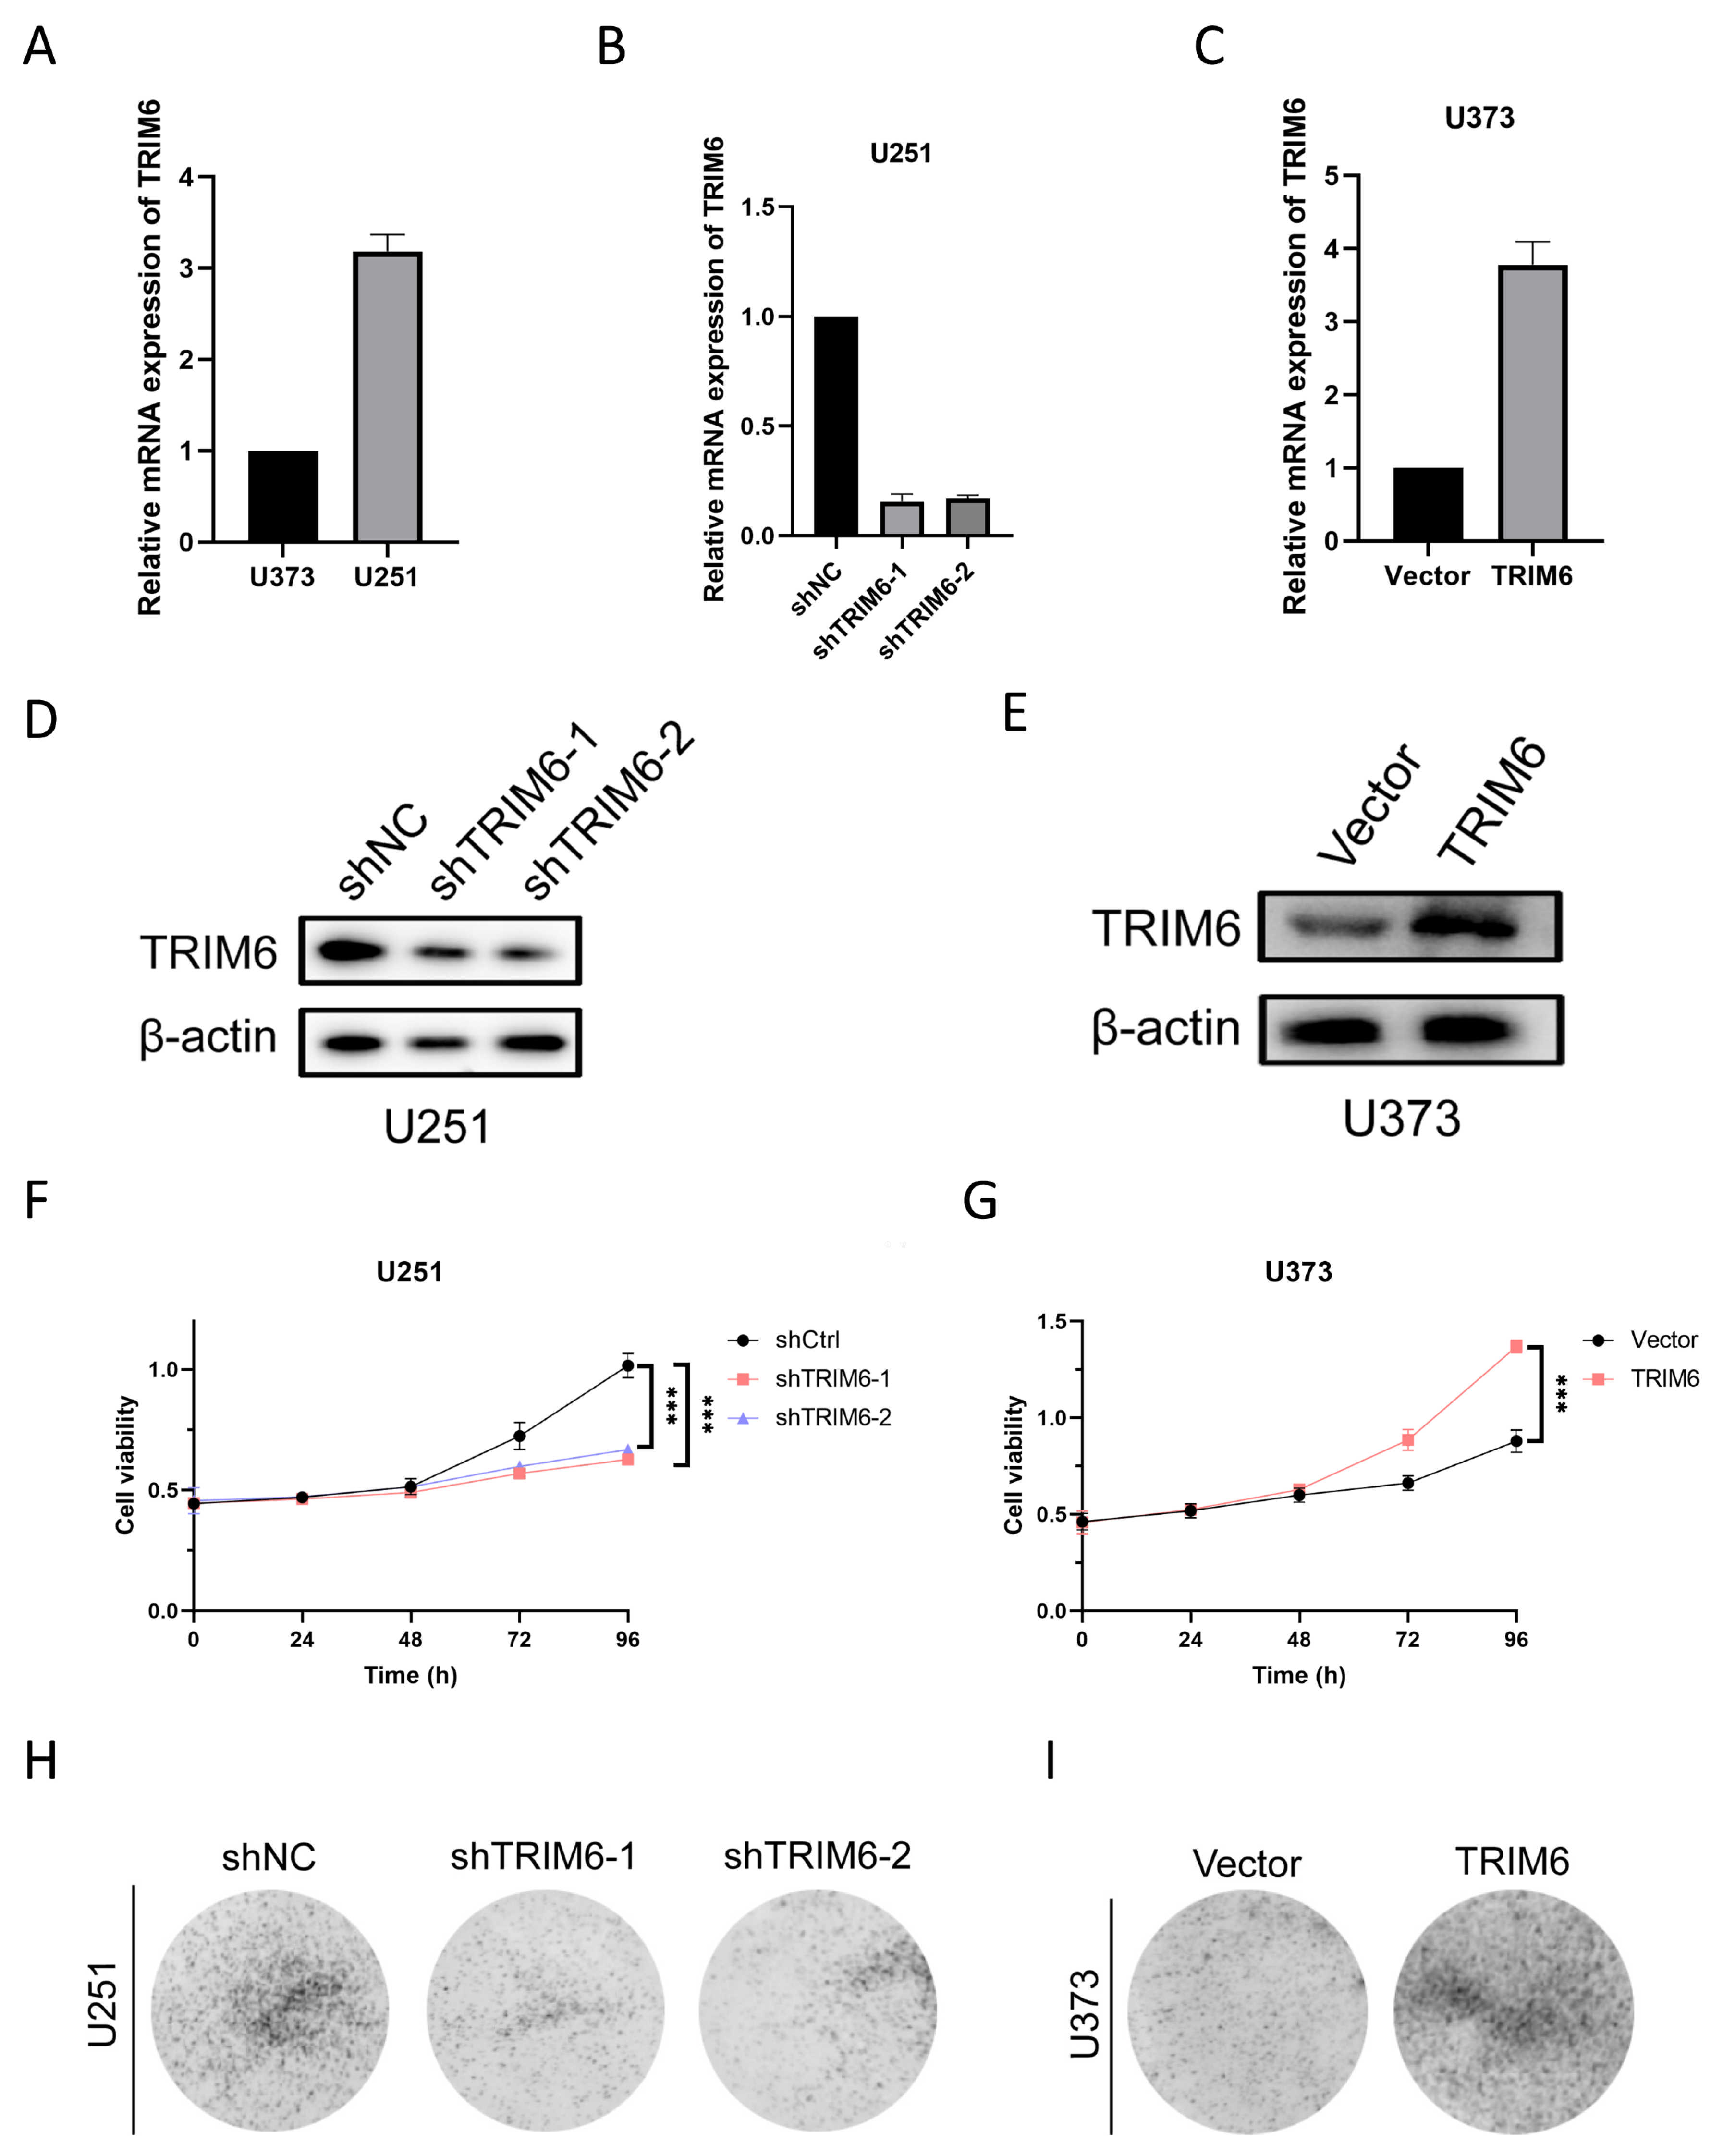
Our findings from the CCK8 assay demonstrated that the knockdown of TRIM6 in U251 glioma cells resulted in a significant decrease in cell viability compared to the control group. This suggests that TRIM6 may play a role in promoting cell survival and proliferation in U251 cells. The colony formation assay further supported the inhibitory role of TRIM6 knockdown in U251 cells. The decreased number of colonies formed by the shTRIM6-1 and shTRIM6-2 groups compared to the shNC group suggests that TRIM6 knockdown suppressed the clonogenic potential of U251 cells. This finding is consistent with the observed decrease in cell viability and indicates that TRIM6 may contribute to the proliferative capacity of U251 cells. In the scratch assay, we observed that the knockdown of TRIM6 in U251 cells resulted in a wider scratch gap compared to the control group, indicating impaired cell migration. The Transwell assay provided additional evidence for the involvement of TRIM6 in glioma cell invasion and migration. In U251 cells, the knockdown of TRIM6 significantly reduced the number of invading and migrating cells compared to the shNC group. Conversely, in U373 cells, the overexpression of TRIM6 led to a significant decrease in invasion and migration abilities compared to the Vector control group. These results are consistent with previous studies that have implicated TRIM6 in cancer cell growth and survival [
18].
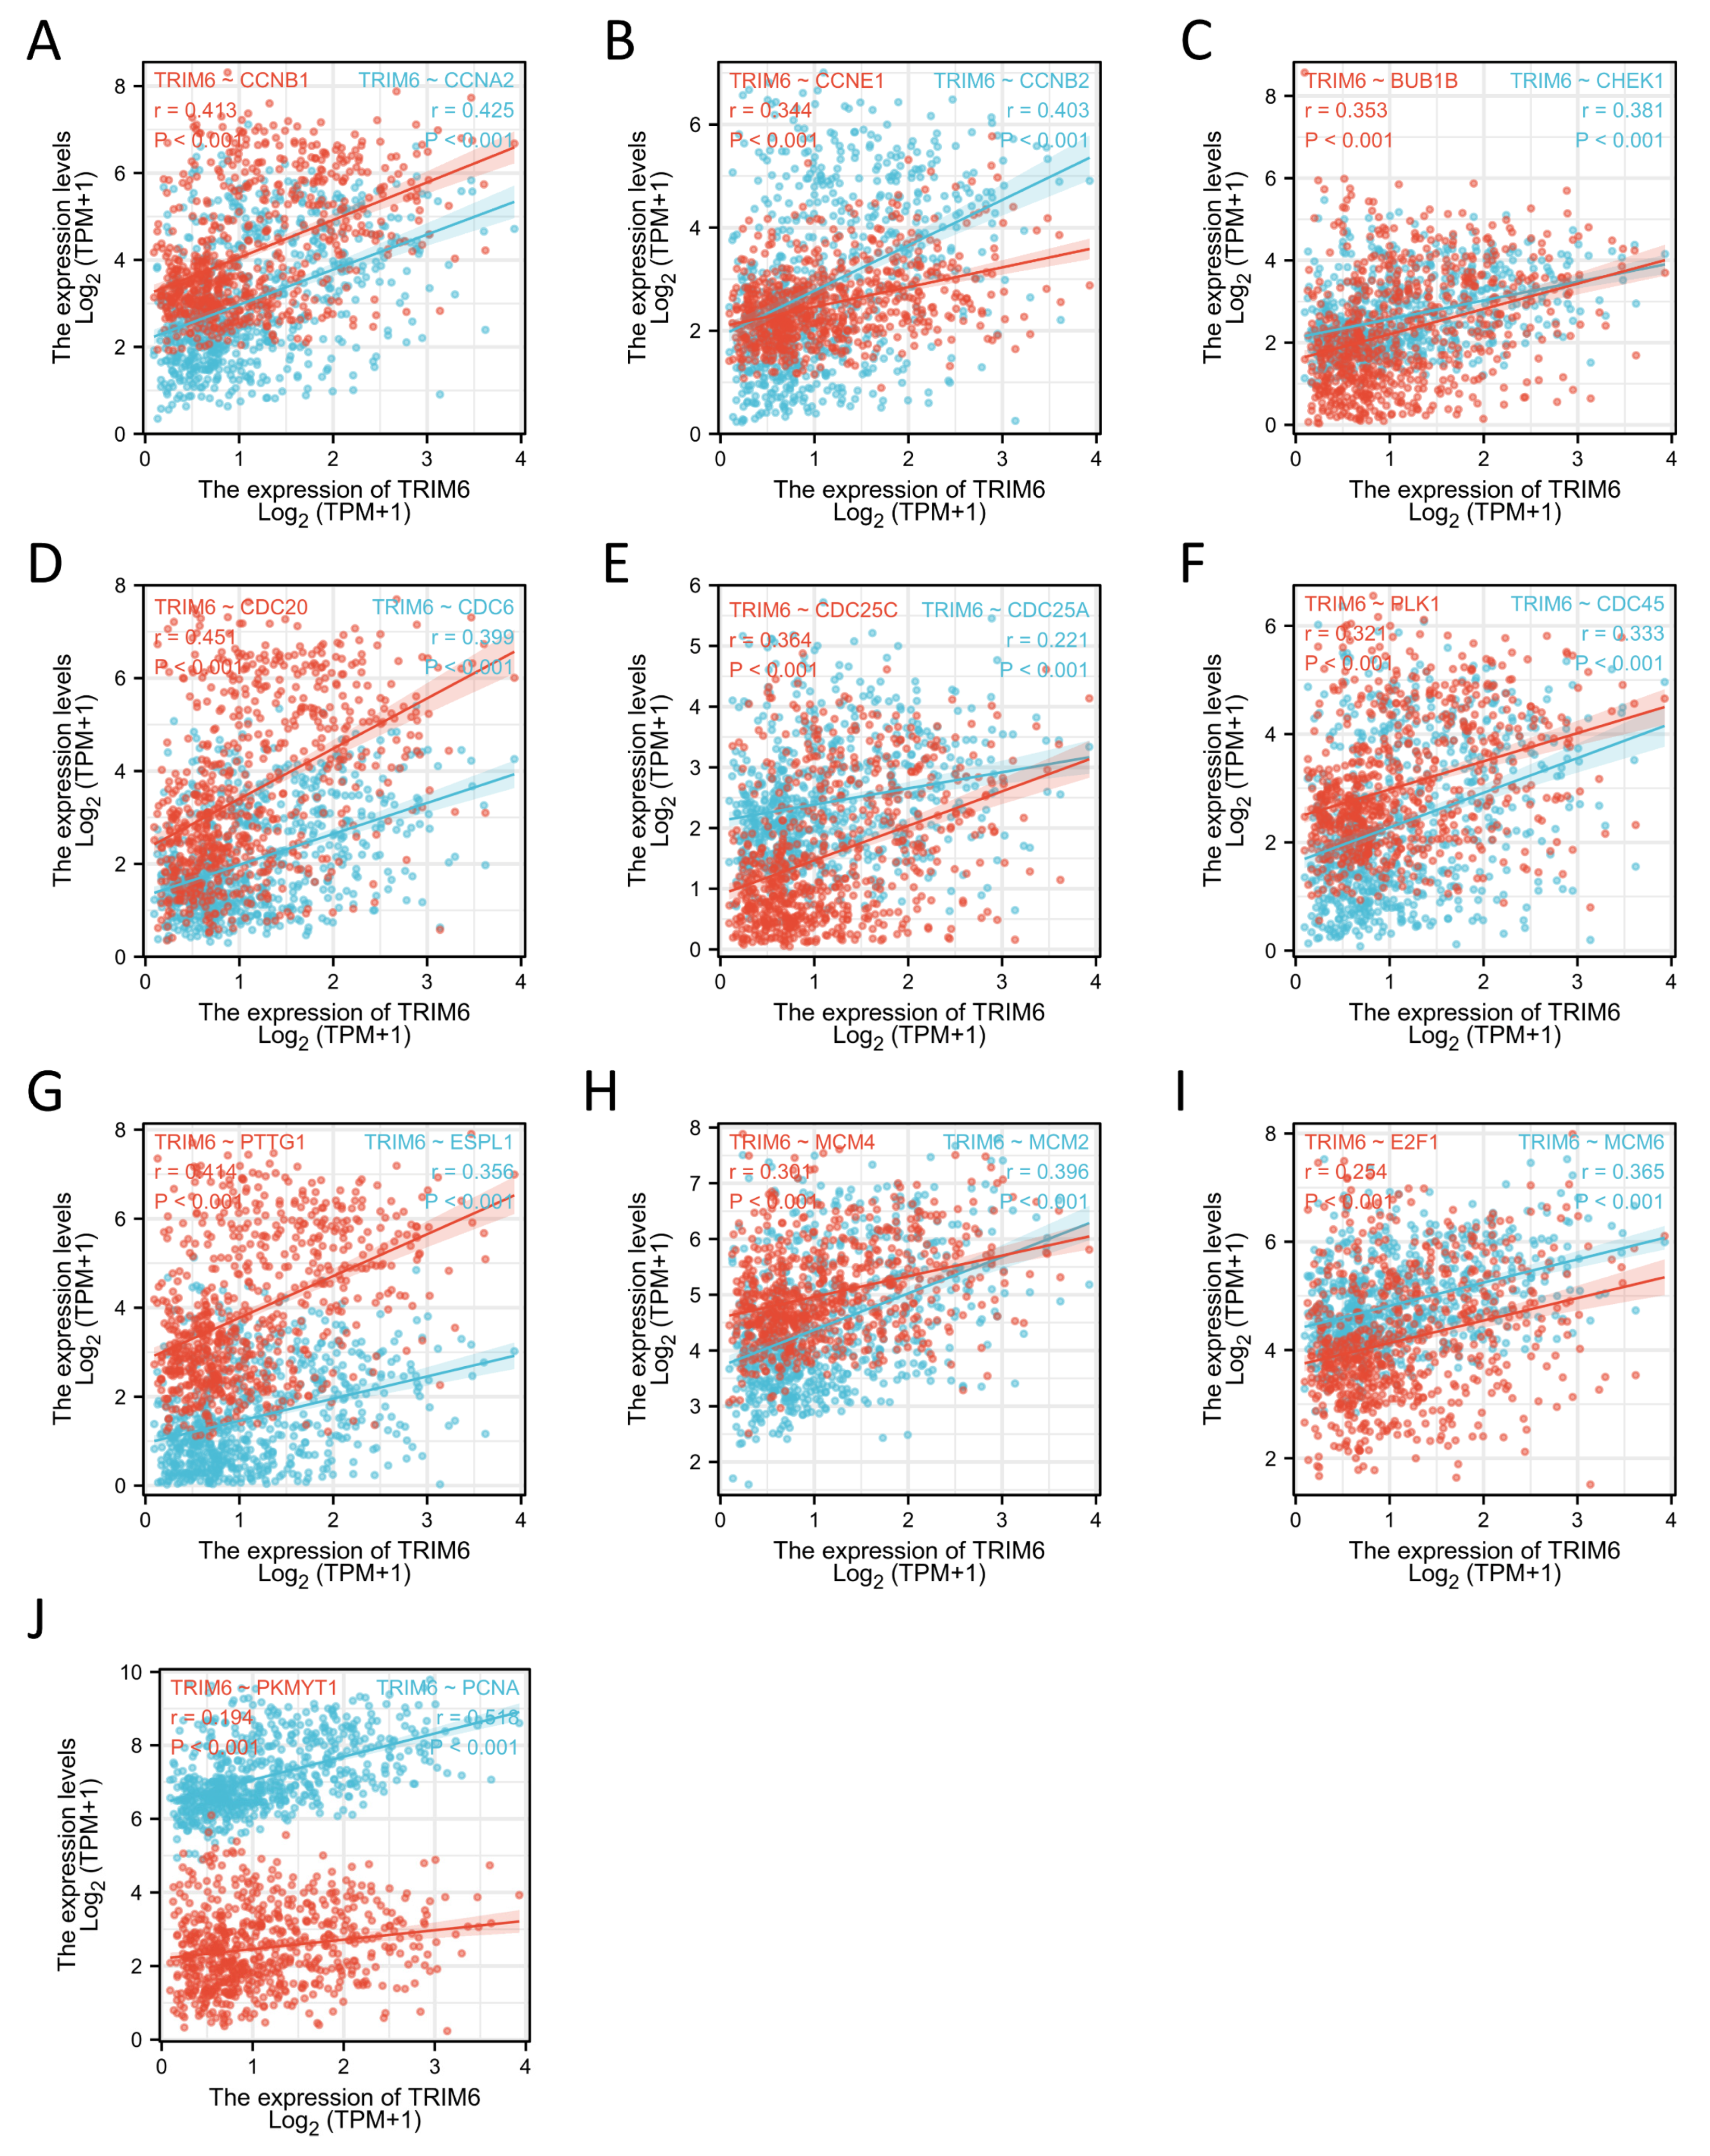
Our study also found that TRIM6 was positively correlated with the expression of most cell cycle regulation genes, including CCNA2, CCNB1, CCNE1, etc. Our data suggest that TRIM6 may promote the progression of Gliomas by regulating the cell cycle.
Tumor microenvironment (TME) and surrounding environment of tumor are closely related to the development of cancer [
34]. TME contains immune cells, extracellular matrix, mesenchymal cells, and inflammatory mediators that affect tumor growth, metastasis, and clinical survival [
26]. Despite the fact that an effective immune response can have antitumor effects, cancer cells have evolved a variety of mechanisms, including a dysfunction in antigen presentation and a recruitment of immune suppressors to evade the attack of immune cells [
35,
36,
37]. A number of studies have found that immune infiltration can affect the prognosis of patients [
38,
39,
40]. We explored the correlation between the expression of TRIM6 and the level of immune infiltration of Gliomas. The present study found that the TRIM6 expression was positively correlated with the abundance of innate immune cells (eg, Macrophages, Neutrophils, Eosinophils, aDC, iDC, Cytotoxic cells, CD56dim NK cells, Th2 cells, NK cells and B cells), and negatively correlated with the abundance of adaptive immunocytes (eg, pDC, Tgd, NK CD56bright cells, CD8 T cells, Tcm and TFH). According to these findings, TRIM6 may play an essential regulatory role in the development of Gliomas and the tumor immune microenvironment.
Figure 1.
Expression analysis and validation of TRIM6. (A-C) Differences in TRIM6 expression between normal and Gliomas, GBM and LGG tissues in TCGA database. (D-E) showed that the transcription level of TRIM6 in Gliomas compared with in normal adjacent tissues from GSE109569 and GSE76070 datasets. (F, G) Validation of the expression level of TRIM6 between normal cerebral cortex and Gliomas tissues using four cases of glioma specimens collected in our center and the Human Protein Atlas database (immunohistochemistry).
Figure 2.
The correlation of the expression of TRIM6 and clinical features in Gliomas. Gender(A), Age(B), primary therapy outcome(C), WHO grade(D), IDH status(E), Histological type(F) and 1p/19q codeletion(G). *p < 0.05, **p < 0.01, ***p < 0.001.
Figure 2.
The correlation of the expression of TRIM6 and clinical features in Gliomas. Gender(A), Age(B), primary therapy outcome(C), WHO grade(D), IDH status(E), Histological type(F) and 1p/19q codeletion(G). *p < 0.05, **p < 0.01, ***p < 0.001.
Figure 3.
Kaplan–Meier survival curve analysis of the prognostic significance of a high and a low expression of TRIM6 in Gliomas using The Cancer Genome Atlas (TCGA) databases. (A-C) Kaplan–Meier estimates of the overall survival, disease specific survival and progress free interval probability of TCGA patients in all Gliomas patients. Subgroup analysis for age under 60 years (D), greater than 60 years (E), Male (F), Female (G), WHO grade G2 (H), WHO grade G3 (I), progression disease/stable disease (PD/SD) (J, K), Astrocytoma/Oligoastrocytoma (L, M).
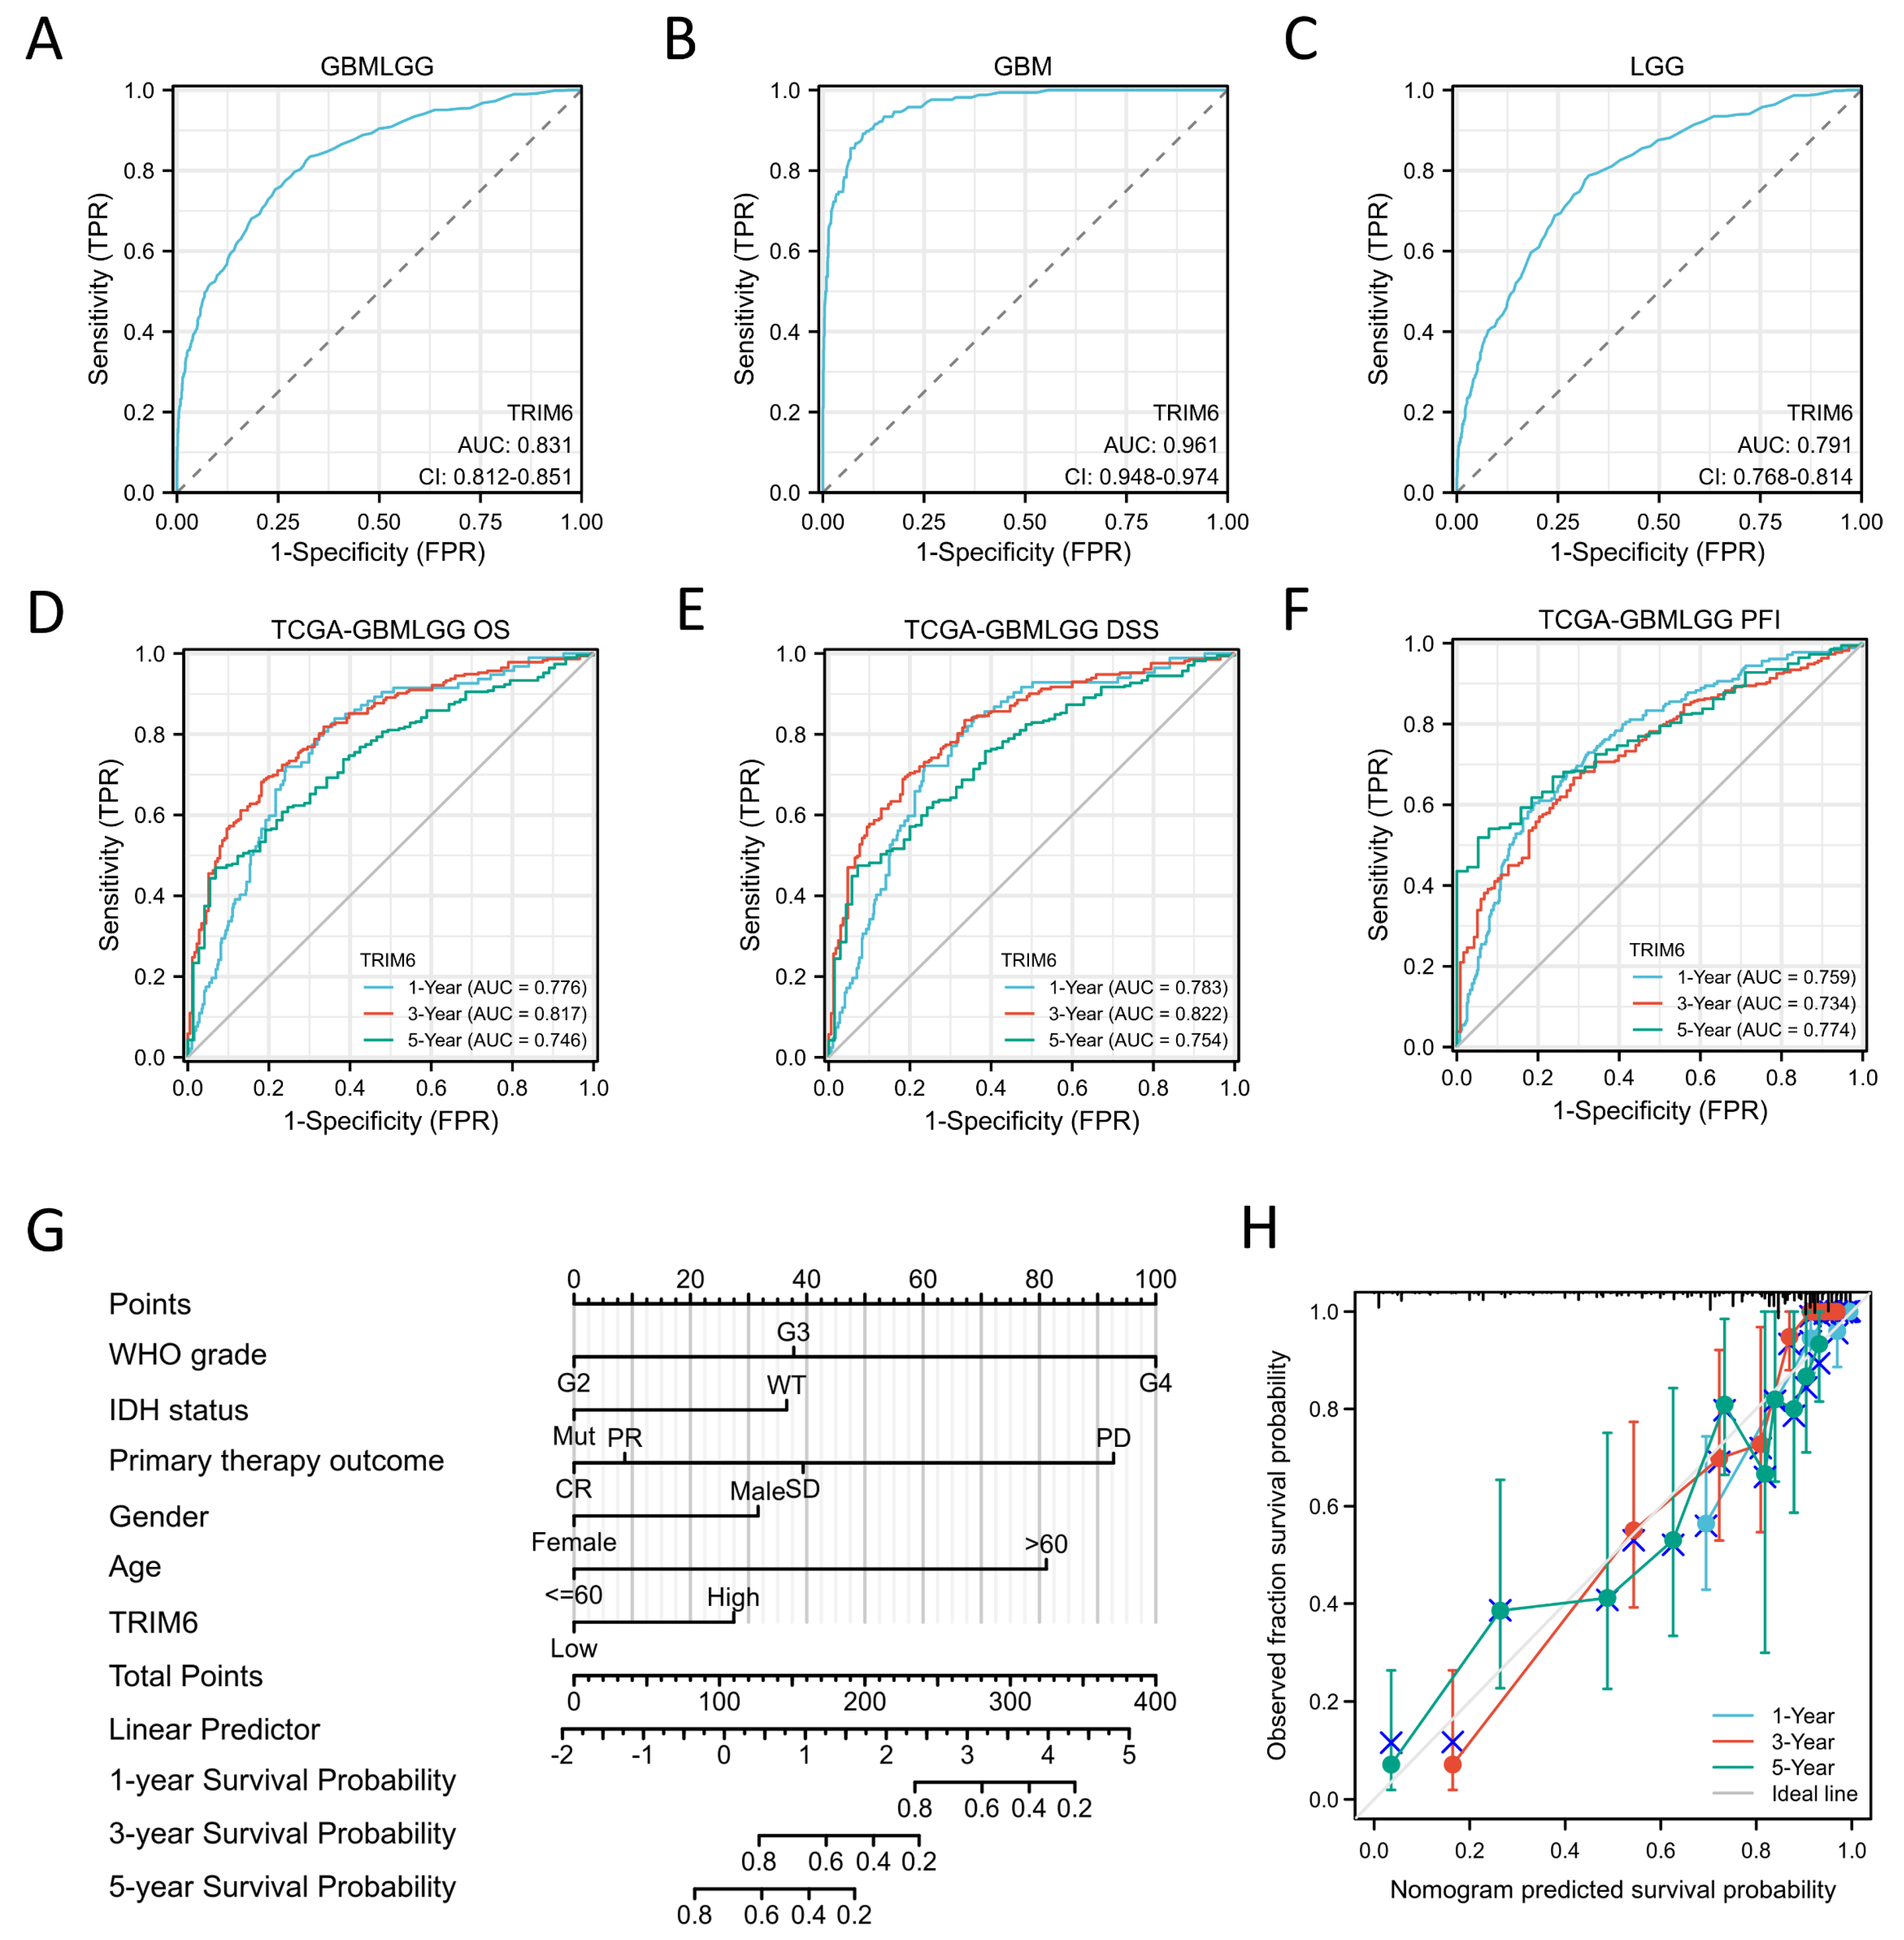
Figure 4.
Diagnostic and prognosistic value of TRIM6 expression in Gliomas. (A-C) Validation of diagnostic value of TRIM6 upregulation for Gliomas, GBM and LGG using ROC curve. (D-E) Time depended ROC curve analysis of overall survival (OS), disease specific survival (DSS) and progress free interval (PFI) for TRIM6 expression in Gliomas. (G) Nomogram survival prediction chart for predicting the 1-, 3-, and 5-year OS using the risk scores and clinical features in Gliomas. (H) Calibration curve predicting OS.
Figure 5.
Differential expression analysis of high and low expression TRIM6 groups in Gliomas. (A) the volcano map shows the differentially expressed genes (DEGs) between high and low expression TRIM6 groups. (B) The cnetplot demonstrates the KEGG enrichment results of DEGs. (C) The barplot shows the GO and KEGG analysis of DEGs.
Figure 6.
Figure 6 Single gene difference analysis between high expression TRIM6 group and low expression TRIM6 group. (A) Enrichment plots from gene set enrichment analysis (GSEA). (B-C) mountain map of top 10 KEGG Gene sets. (D) Pathview map of Cytokine-cytokine receptor interaction (map040600).
Figure 6.
Figure 6 Single gene difference analysis between high expression TRIM6 group and low expression TRIM6 group. (A) Enrichment plots from gene set enrichment analysis (GSEA). (B-C) mountain map of top 10 KEGG Gene sets. (D) Pathview map of Cytokine-cytokine receptor interaction (map040600).
Figure 7.
PPI network analysis and correlation analysis between TRIM6 and hub genes. (A) Visual map of the protein-protein interaction network for high and low expression TRIM6 groups. (B) Cytoscape’s plug-in cytoHubba uses the Degree algorithm to select the hub genes from the PPI network. (C) Heatmap demonstrates the correction between TRIM6 and hub genes. (D) Detection of hub genes expression levels in Glioma tumor tissues and corresponding adjacent non-tumor tissues using qPCR experiment.
Figure 8.
Prognostic analysis of 9 hub genes. COL1A1 (A), COL1A2 (B), CXCL8 (C), CXCL9 (D), CXCL10 (E), CXCL11 (F), CXCR3 (G), MMP9 (H), TIMP1 (I).
Figure 8.
Prognostic analysis of 9 hub genes. COL1A1 (A), COL1A2 (B), CXCL8 (C), CXCL9 (D), CXCL10 (E), CXCL11 (F), CXCR3 (G), MMP9 (H), TIMP1 (I).
Figure 9.
Constructing and validating the effects of TRIM6 knockdown and overexpression on cell proliferation in glioma cell lines. (A) Relative mRNA expression levels of TRIM6 in U251 and U373 cells. (B, D) qPCR and Western blot validation of TRIM6 knockdown effect in U251 cell line. (C, E) qPCR and Western blot validation of TRIM6 overexpression effect in U373 cell line. (F, G) The CCK-8 assay was used to detect the cell viability after knocking down TRIM6 in the U251 cell line and overexpressing TRIM6 in the U373 cell line at 24h, 48h, 72h, and 96h. The data represents the mean ± standard deviation (SD) of three independent experiments. (H, I) The colony formation was evaluated using the plate cloning assay after knocking down TRIM6 in the U251 cell line and overexpressing TRIM6 in the U373 cell line. (*p < 0.05, **p < 0.01, ***p < 0.001).
Figure 10.
Investigate the effects of knocking down or overexpressing TRIM6 on cell invasion and migration abilities in glioma cell lines. Graphical representation of wound healing assay results is shown in (A, C). (B, D) The stacked bar graph demonstrates the relative wound width in U251 cells and U373 cells in various treatment groups, respectively. Graphical representation of the Transwell assay results is shown in (E, H). The upper panel illustrates the migration of cells across the Transwell membrane, while the lower panel depicts the invasion of cells through the Matrigel-coated membrane. (F, I) Invasion: The stacked bar graph demonstrates the percentage of invasive U251 cells in various treatment groups. (G, J) Migration: The bar graph represents the relative number of migrated U373 cells in different experimental conditions. Data are presented as mean ± deviation (SD). Statistical analysis was performed using t-test, and p < 0.05 was considered statistically significant (*p < 0.05, **p < 0.01, ***p < 0.001).
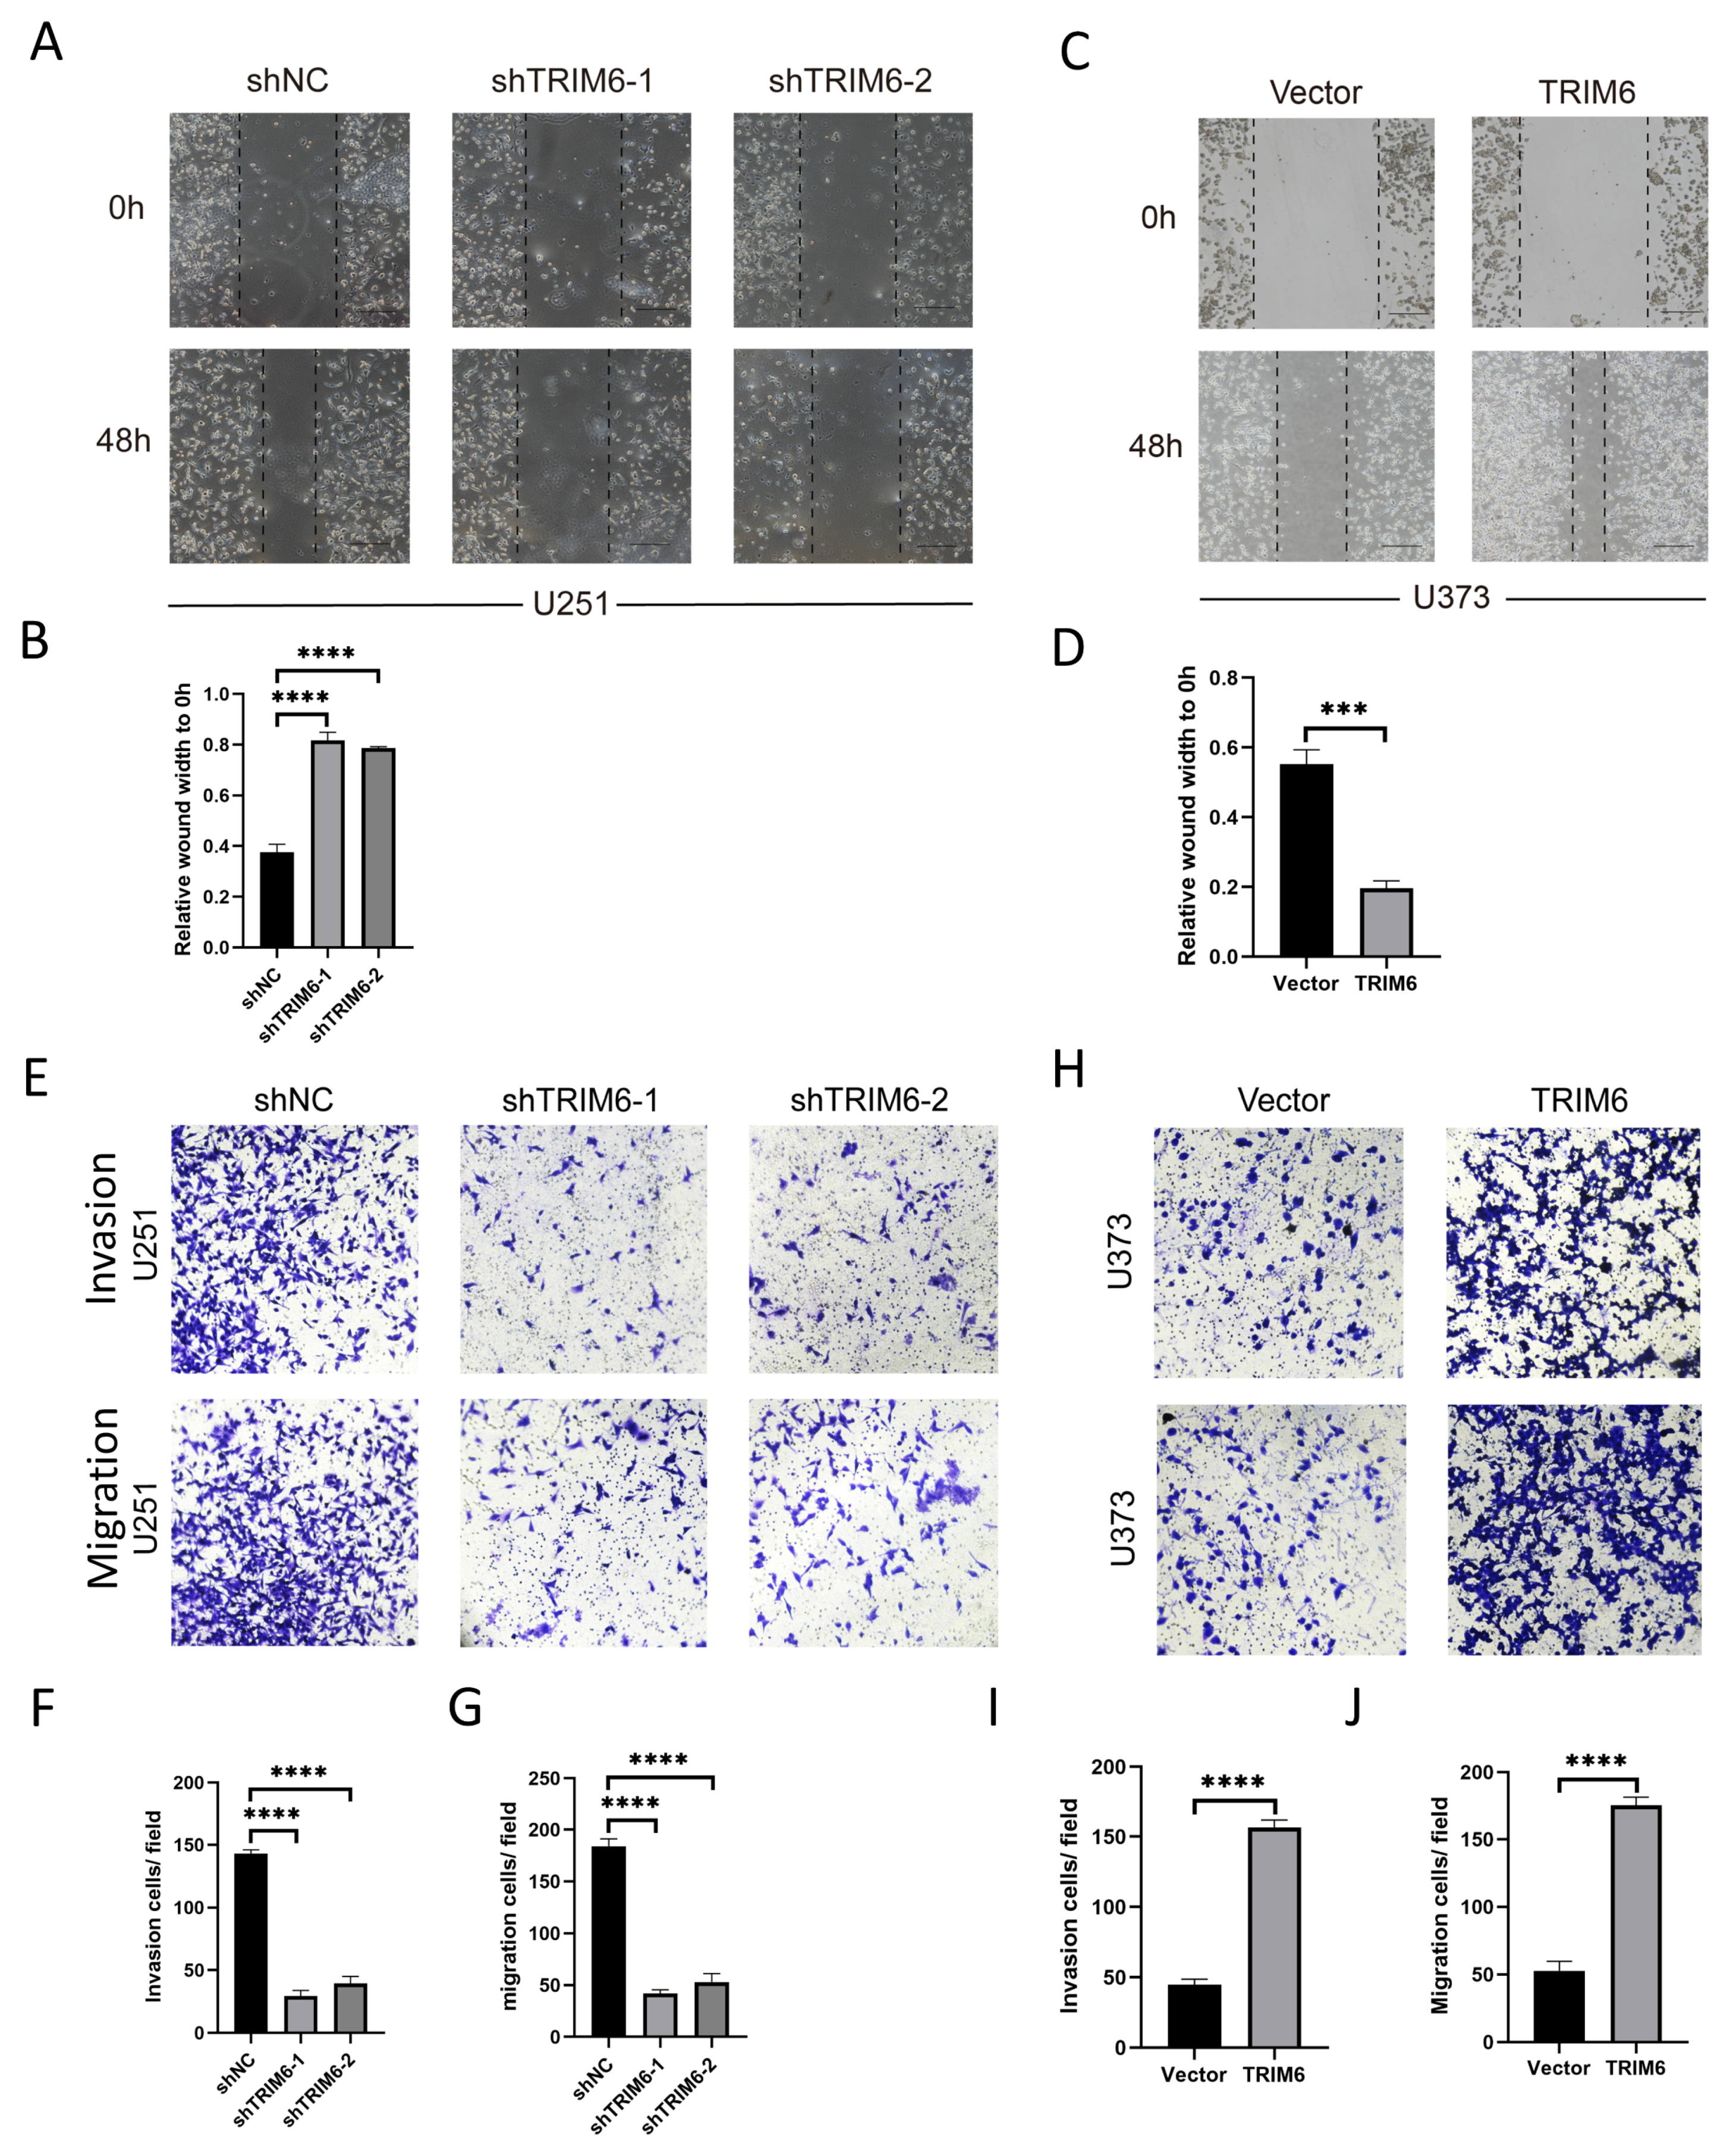
Figure 11.
Correlation analysis between TRIM6 and the cell cycle regulatory genes in Gliomas in The Cancer Genome Atlas (TCGA). (A) CCNA2, CCNB1, (B) CCNB2, CCNE1, (C) CHEK1, BUB1B, (D) CDC6, CDC20 (E) CDC25A, CDC25C, (F) CDC45, PLK1, (G) EXPL1, PTTG1, (H) MCN2, MCM4, (I) MCM6, E2F1, (J) PCNA, PKMYT1.
Figure 12.
Correlation analysis of TRIM6 expression and immune infiltration in Gliomas. (A) Correlation between TRIM6 expression level and Glioma immune cell infiltration level. (B) Group comparison between high and low expression TRIM6 groups in Glioma immune cell immersion. *P < 0.05, **P< 0.01; ***P< 0. 001.
Table 1.
Features of the TCGA Glioma patients based on the TRIM6 expression.
Table 1.
Features of the TCGA Glioma patients based on the TRIM6 expression.
| Characteristic |
Low expression of TRIM6 |
High expression of TRIM6 |
p |
| n |
348 |
348 |
|
| WHO grade, n (%) |
|
|
< 0.001 |
| G2 |
153 (24.1%) |
71 (11.2%) |
|
| G3 |
139 (21.9%) |
104 (16.4%) |
|
| G4 |
18 (2.8%) |
150 (23.6%) |
|
| IDH status, n (%) |
|
|
< 0.001 |
| WT |
31 (4.5%) |
215 (31.3%) |
|
| Mut |
314 (45.8%) |
126 (18.4%) |
|
| 1p/19q codeletion, n (%) |
|
|
< 0.001 |
| codel |
124 (18%) |
47 (6.8%) |
|
| non-codel |
223 (32.4%) |
295 (42.8%) |
|
| Gender, n (%) |
|
|
0.026 |
| Female |
164 (23.6%) |
134 (19.3%) |
|
| Male |
184 (26.4%) |
214 (30.7%) |
|
| Age, n (%) |
|
|
< 0.001 |
| <=60 |
312 (44.8%) |
241 (34.6%) |
|
| >60 |
36 (5.2%) |
107 (15.4%) |
|
| Histological type, n (%) |
|
|
< 0.001 |
| Astrocytoma |
109 (15.7%) |
86 (12.4%) |
|
| Glioblastoma |
18 (2.6%) |
150 (21.6%) |
|
| Oligoastrocytoma |
77 (11.1%) |
57 (8.2%) |
|
| Oligodendroglioma |
144 (20.7%) |
55 (7.9%) |
|
| Age, median (IQR) |
40 (32.75, 51) |
53 (38, 63) |
< 0.001 |
Table 2.
Cox regression analyses to explore the independent indicators of OS in Gliomas.
Table 2.
Cox regression analyses to explore the independent indicators of OS in Gliomas.
| Characteristics |
Total(N) |
Univariate analysis |
|
Multivariate analysis |
| Hazard ratio (95% CI) |
P value |
Hazard ratio (95% CI) |
P value |
| WHO grade |
634 |
|
|
|
|
|
| G2 |
223 |
Reference |
|
|
|
|
| G3 |
243 |
2.999 (2.007-4.480) |
<0.001 |
|
1.770 (1.104-2.837) |
0.018 |
| G4 |
168 |
18.615 (12.460-27.812) |
<0.001 |
|
5.070 (1.567-16.398) |
0.007 |
| IDH status |
685 |
|
|
|
|
|
| WT |
246 |
Reference |
|
|
|
|
| Mut |
439 |
0.117 (0.090-0.152) |
<0.001 |
|
0.498 (0.285-0.870) |
0.014 |
| 1p/19q codeletion |
688 |
|
|
|
|
|
| codel |
170 |
Reference |
|
|
|
|
| non-codel |
518 |
4.428 (2.885-6.799) |
<0.001 |
|
1.002 (0.517-1.942) |
0.996 |
| Primary therapy outcome |
461 |
|
|
|
|
|
| PD |
112 |
Reference |
|
|
|
|
| SD |
147 |
0.440 (0.294-0.658) |
<0.001 |
|
0.361 (0.214-0.608) |
<0.001 |
| PR |
64 |
0.170 (0.074-0.391) |
<0.001 |
|
0.189 (0.067-0.534) |
0.002 |
| CR |
138 |
0.133 (0.064-0.278) |
<0.001 |
|
0.167 (0.077-0.364) |
<0.001 |
| Gender |
695 |
|
|
|
|
|
| Female |
297 |
Reference |
|
|
|
|
| Male |
398 |
1.262 (0.988-1.610) |
0.062 |
|
1.651 (1.049-2.598) |
0.030 |
| Age |
695 |
|
|
|
|
|
| <=60 |
552 |
Reference |
|
|
|
|
| >60 |
143 |
4.668 (3.598-6.056) |
<0.001 |
|
4.071 (2.438-6.796) |
<0.001 |
| Histological type |
695 |
|
|
|
|
|
| Astrocytoma |
195 |
Reference |
|
|
|
|
| Glioblastoma |
168 |
6.791 (4.932-9.352) |
<0.001 |
|
|
|
| Oligoastrocytoma |
134 |
0.657 (0.419-1.031) |
0.068 |
|
1.132 (0.655-1.956) |
0.657 |
| Oligodendroglioma |
198 |
0.580 (0.395-0.853) |
0.006 |
|
0.612 (0.347-1.078) |
0.089 |
| TRIM6 |
695 |
|
|
|
|
|
| Low |
347 |
Reference |
|
|
|
|
| High |
348 |
4.023 (3.077-5.261) |
<0.001 |
|
1.591 (1.027-2.466) |
0.038 |
