Preprint
Article

Experimental Study of the Train-Induced Vibration Propagation on Over-Track Buildings over Metro Depots

Altmetrics

Downloads

110

Views

53

Comments

0

This version is not peer-reviewed

Submitted:

08 August 2023

Posted:

08 August 2023

You are already at the latest version

Alerts
Abstract
Transit-oriented development (TOD), such as metro depot and over-track building complexes, has expanded rapidly in China. Over-track building construction has the advantage of comprehensive utilization of land resources, ease of commuting to work, and provide funds for subway construction. However, there still has a pending problem, disturbance of railway vibration, for TOD. Excessive noise and vibration seriously affect people’s life. To address this challenge, field measurements are used to obtain the vibration source characteristics and vibration propagation of the ground and the superstructure in this study. And the typical metro depot with over-track building in Wuhan was selected. The effects of vibration on the surrounding ground and adjacent buildings caused by the operation of trains have been measured, and the propagation law of train-induced ground vibration acceleration in the time and frequency domains has been analyzed. The distribution and propagation laws of vibration noise, structural noise and secondary structure noise in sensitive areas such as the throat area, depot area, test section and access section of the over-track buildings and their impact laws on the over-track buildings are obtained. And the effectiveness of the vibration and noise reduction methods used were evaluated. Results show that within 43 m from the train running track, the train running induced vertical vibration acceleration level in the high-rise building peak size of 58.8 dB, the average value of 55.62 dB; vibration frequency components are mainly 40-60 Hz. The findings might provide useful insight for designing vibration mitigation systems in new metro depots with over-track buildings.
Keywords: 
Subject: Engineering  -   Architecture, Building and Construction

1. Introduction

Transit oriented development (TOD), a model of over-track buildings development on railway lines, has been increasingly used in China in recent years [1]. TOD is a combination of regional planning, urban regeneration, suburban renewal and walkable communities, providing not only greater accessibility but also a lifestyle choice. It is an important sustainable development strategy that addresses a range of regional issues such as the preservation of developed space, traffic congestion, air quality, affordable housing, economic lifestyles [2,3], and infrastructure costs. "Integration of transport and land use" and "priority for public transport" are two of its main components [4,5,6].
An important constraint to railway over-track building development is the nuisance of railway vibration and noise to people’s daily lives. Excessive noise and vibration will seriously affect the normal life of people along the tracks [7,8,9], even endangering their health. Usually it is difficult to sleep when the vibration reaches 69 dB, and to 79 dB will wake everyone up [10,11,12]. If exposed to low frequency vibration for a long time, it can easily lead to damage to the heart, lungs, spleen, kidneys, liver and other organs. Vibration transmitted into buildings causes secondary structure noise with low frequency dominance, which is more difficult to isolate than primary noise. People who are disturbed by low-frequency noise for a long period of time are prone to various neurological disorders such as neurasthenia, insomnia, headaches and reduced overall judgement [13,14,15].
The vibration and noise test results of the already operating railway lines show that: the residents along the line reported noticeable vibration, and the general lot vibration in 75-80 dB [16,17,18,19]; the vibration of the serious lot reaches more than 90 dB, some brick and wood structure of the building vibration is particularly serious. The noise tests and investigations along the elevated line show that the noise level around the elevated line reaches more than 80 dB within 25 meters, and up to 90 dB in the steel beam lot, which seriously affects the normal living environment of the residents along the line [20,21,22,23].
The depot covers a large area with many lines, and at the same time features many small radius curves, many turnouts, etc. The vehicles are mostly running empty, with medium to low speed mainly [24,25,26,27]. Compared with the main line, it is characterized by a wide excitation frequency band, with non-stationary shock excitation, need to consider multi-directional dynamic excitation, and vibration noise source and transmission route complex. It is one of the key technologies in the development of over-track buildings to enable targeted measures to be taken to reduce vibration and noise to a minimum, based on the vibration and noise characteristics of the depot, differing from those of the main line [28,29,30,31].
Field measurements were conducted in this study to obtain the vibration source characteristics, vibration propagation laws of ground and over-track buildings, environmental noise and structural noise in the operating lines of Wuhan in typical metro depot. And the distribution and propagation laws of vibration noise, structural noise and secondary structure noise in sensitive areas such as the throat area, depot area, test section and access section of the over-track buildings and their impact laws on the over-track buildings were analyzed. Meanwhile, the effectiveness of the vibration and noise reduction methods used is evaluated. The findings might provide useful insight for designing vibration mitigation systems in new metro depots with over-track buildings.

2. Field measurements of over-track buildings in metro depots

2.1. Site introductions

The measured metro station selected for the study was located in the city of Wuhan.
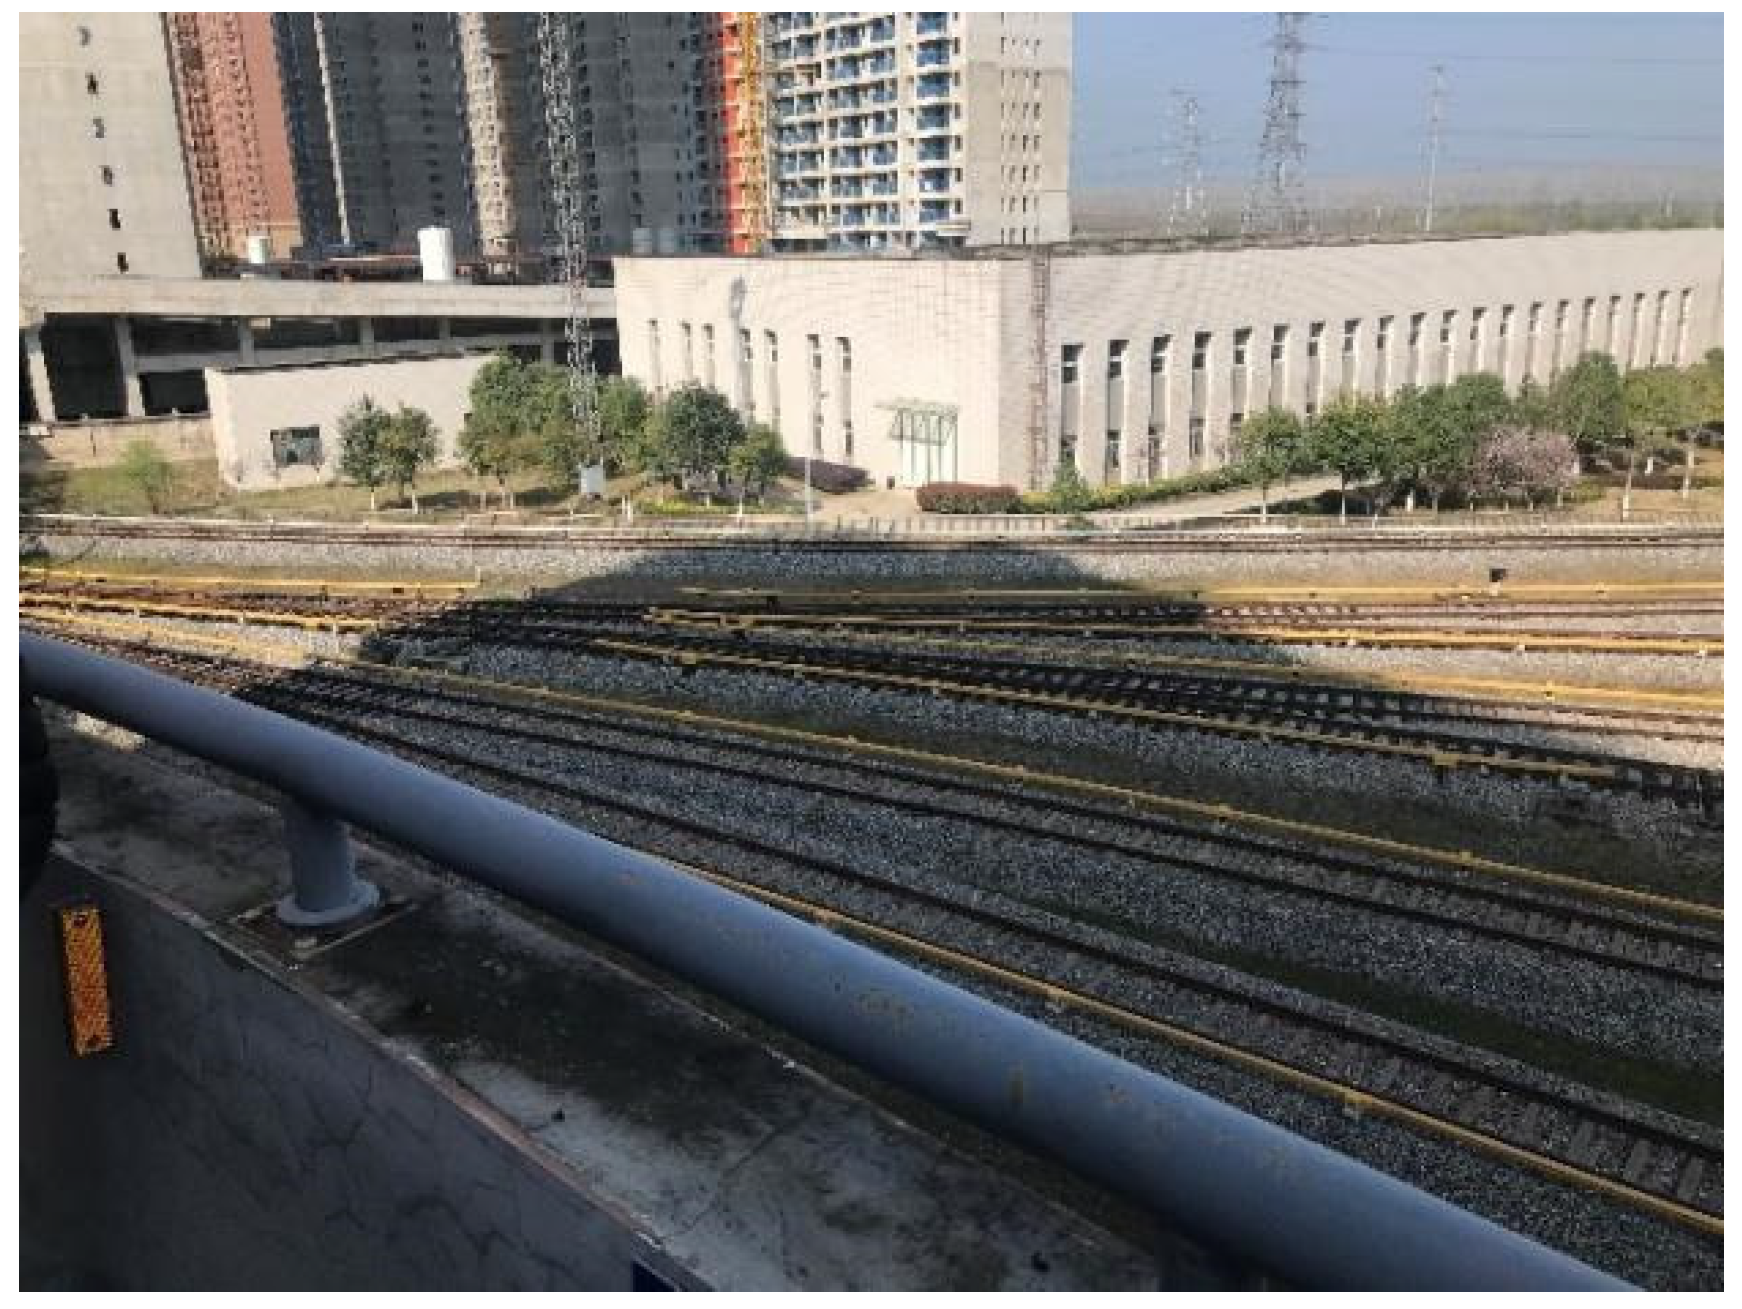
The measured locations and layout of Wuhan are shown in Figure 1 and Figure 2. The metro depot in Wuhan occupies a total construction area of 524,000 m2 and a total land area of 171,942 m2, with a total of 635 houses. The metro depot, the largest metro vehicle base currently in Wuhan, covers an area of 548,667 m2 and can park 32 trains, including repair spaces for 4 trains. The depot can be divided into parking inspection, monthly inspection, joint depot, material depot, engineering depot, locomotive depot and auxiliary facilities (washing depot, dangerous goods depot, sewage treatment station, substation, etc.), according to the functional partition. It covers the whole of the parking and monthly inspection depot, the materials depot, the engineering depot, the locomotive depot and a part of the vehicle in and out terminal. Due to the early construction of the depot, no high level of vibration damping measures were used. For example, damping measures such as damping fasteners and seamless lines were used for the inner line of the depot, while damping connecting clamps were used for the outer line of the depot. The realistic view of the metro depot is shown in Figure 3.

2.2. Field measurement setups

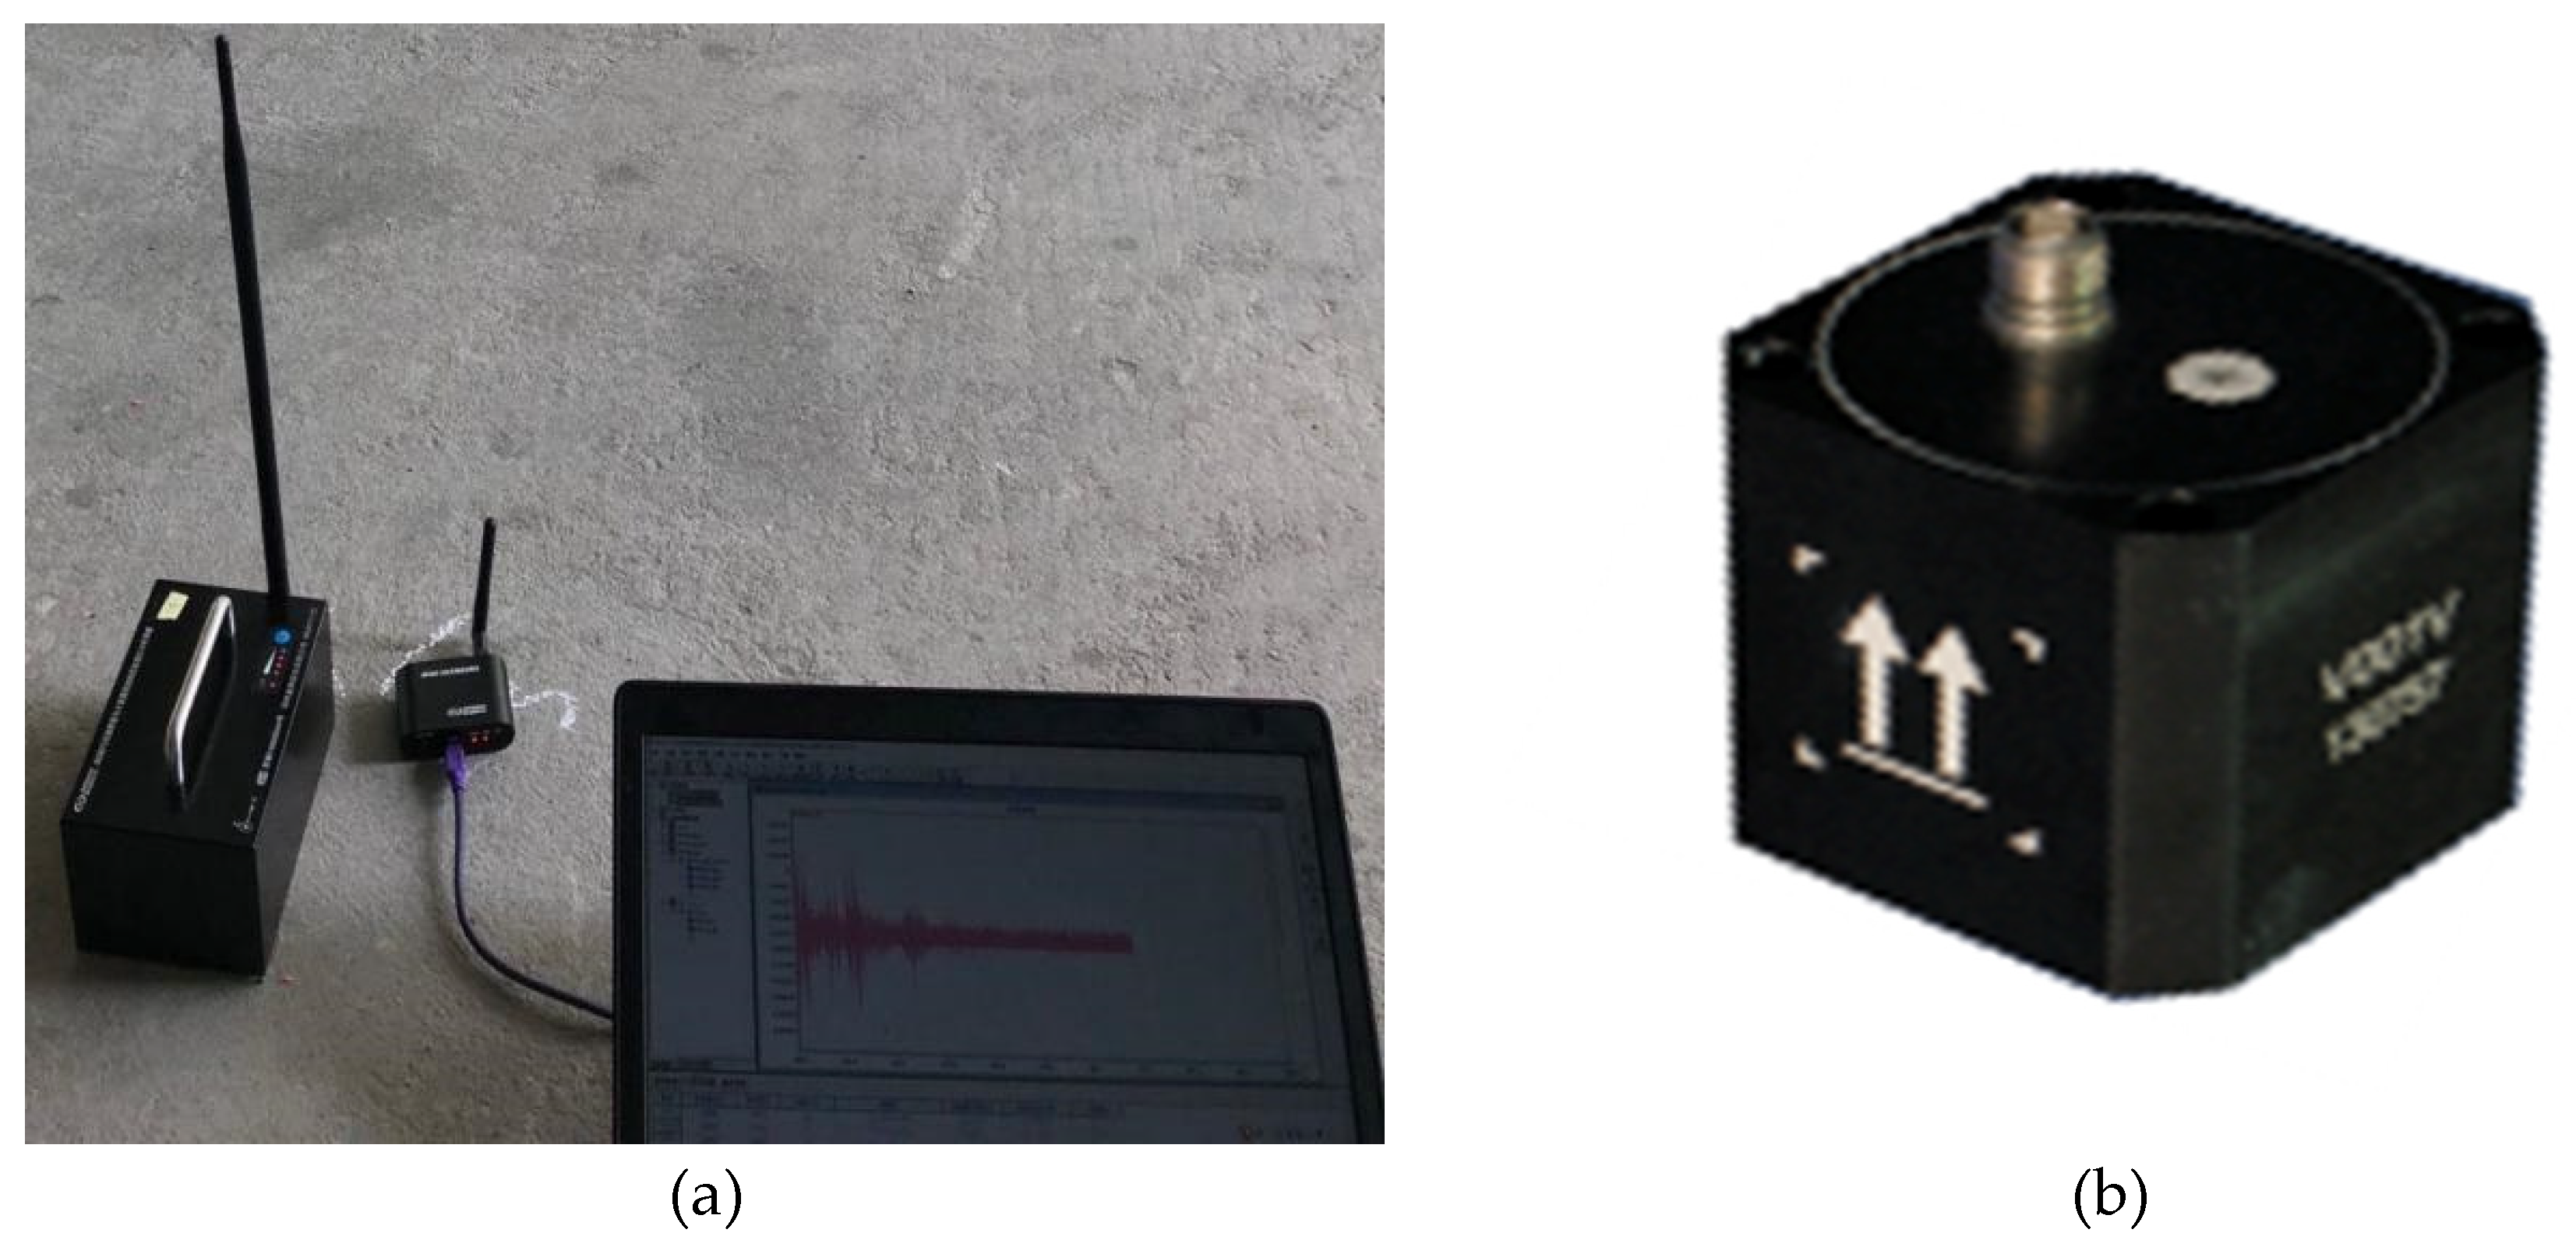
The JM3873 wireless vibration test system as shown in Figure 4a was used for this vibration test. Based on the IEEE802.15.4/ZigBee communication protocol (highly reliable wireless data transmission network), it has a built-in bi-directional V001 magneto-electric velocity sensor shown in Figure 4b, with 1 external pickup input. The built-in pickup has four ranges of acceleration, large speed, medium speed and small speed, with a maximum of 3000x multi-step gain per channel that can be programmed. Each channel has a built-in selectable integration network with independent 24bits ADC per channel and parallel synchronous acquisition. The three test areas include the logistics building adjacent to the access line, the over-track platform directly above the access line and the test line.
Five sections were selected for this measurement from Lot C of the Wuhan metro depot overlay property near the throat area and access line. Details of the 5 sections of the Wuhan metro depot are shown in Table 1.
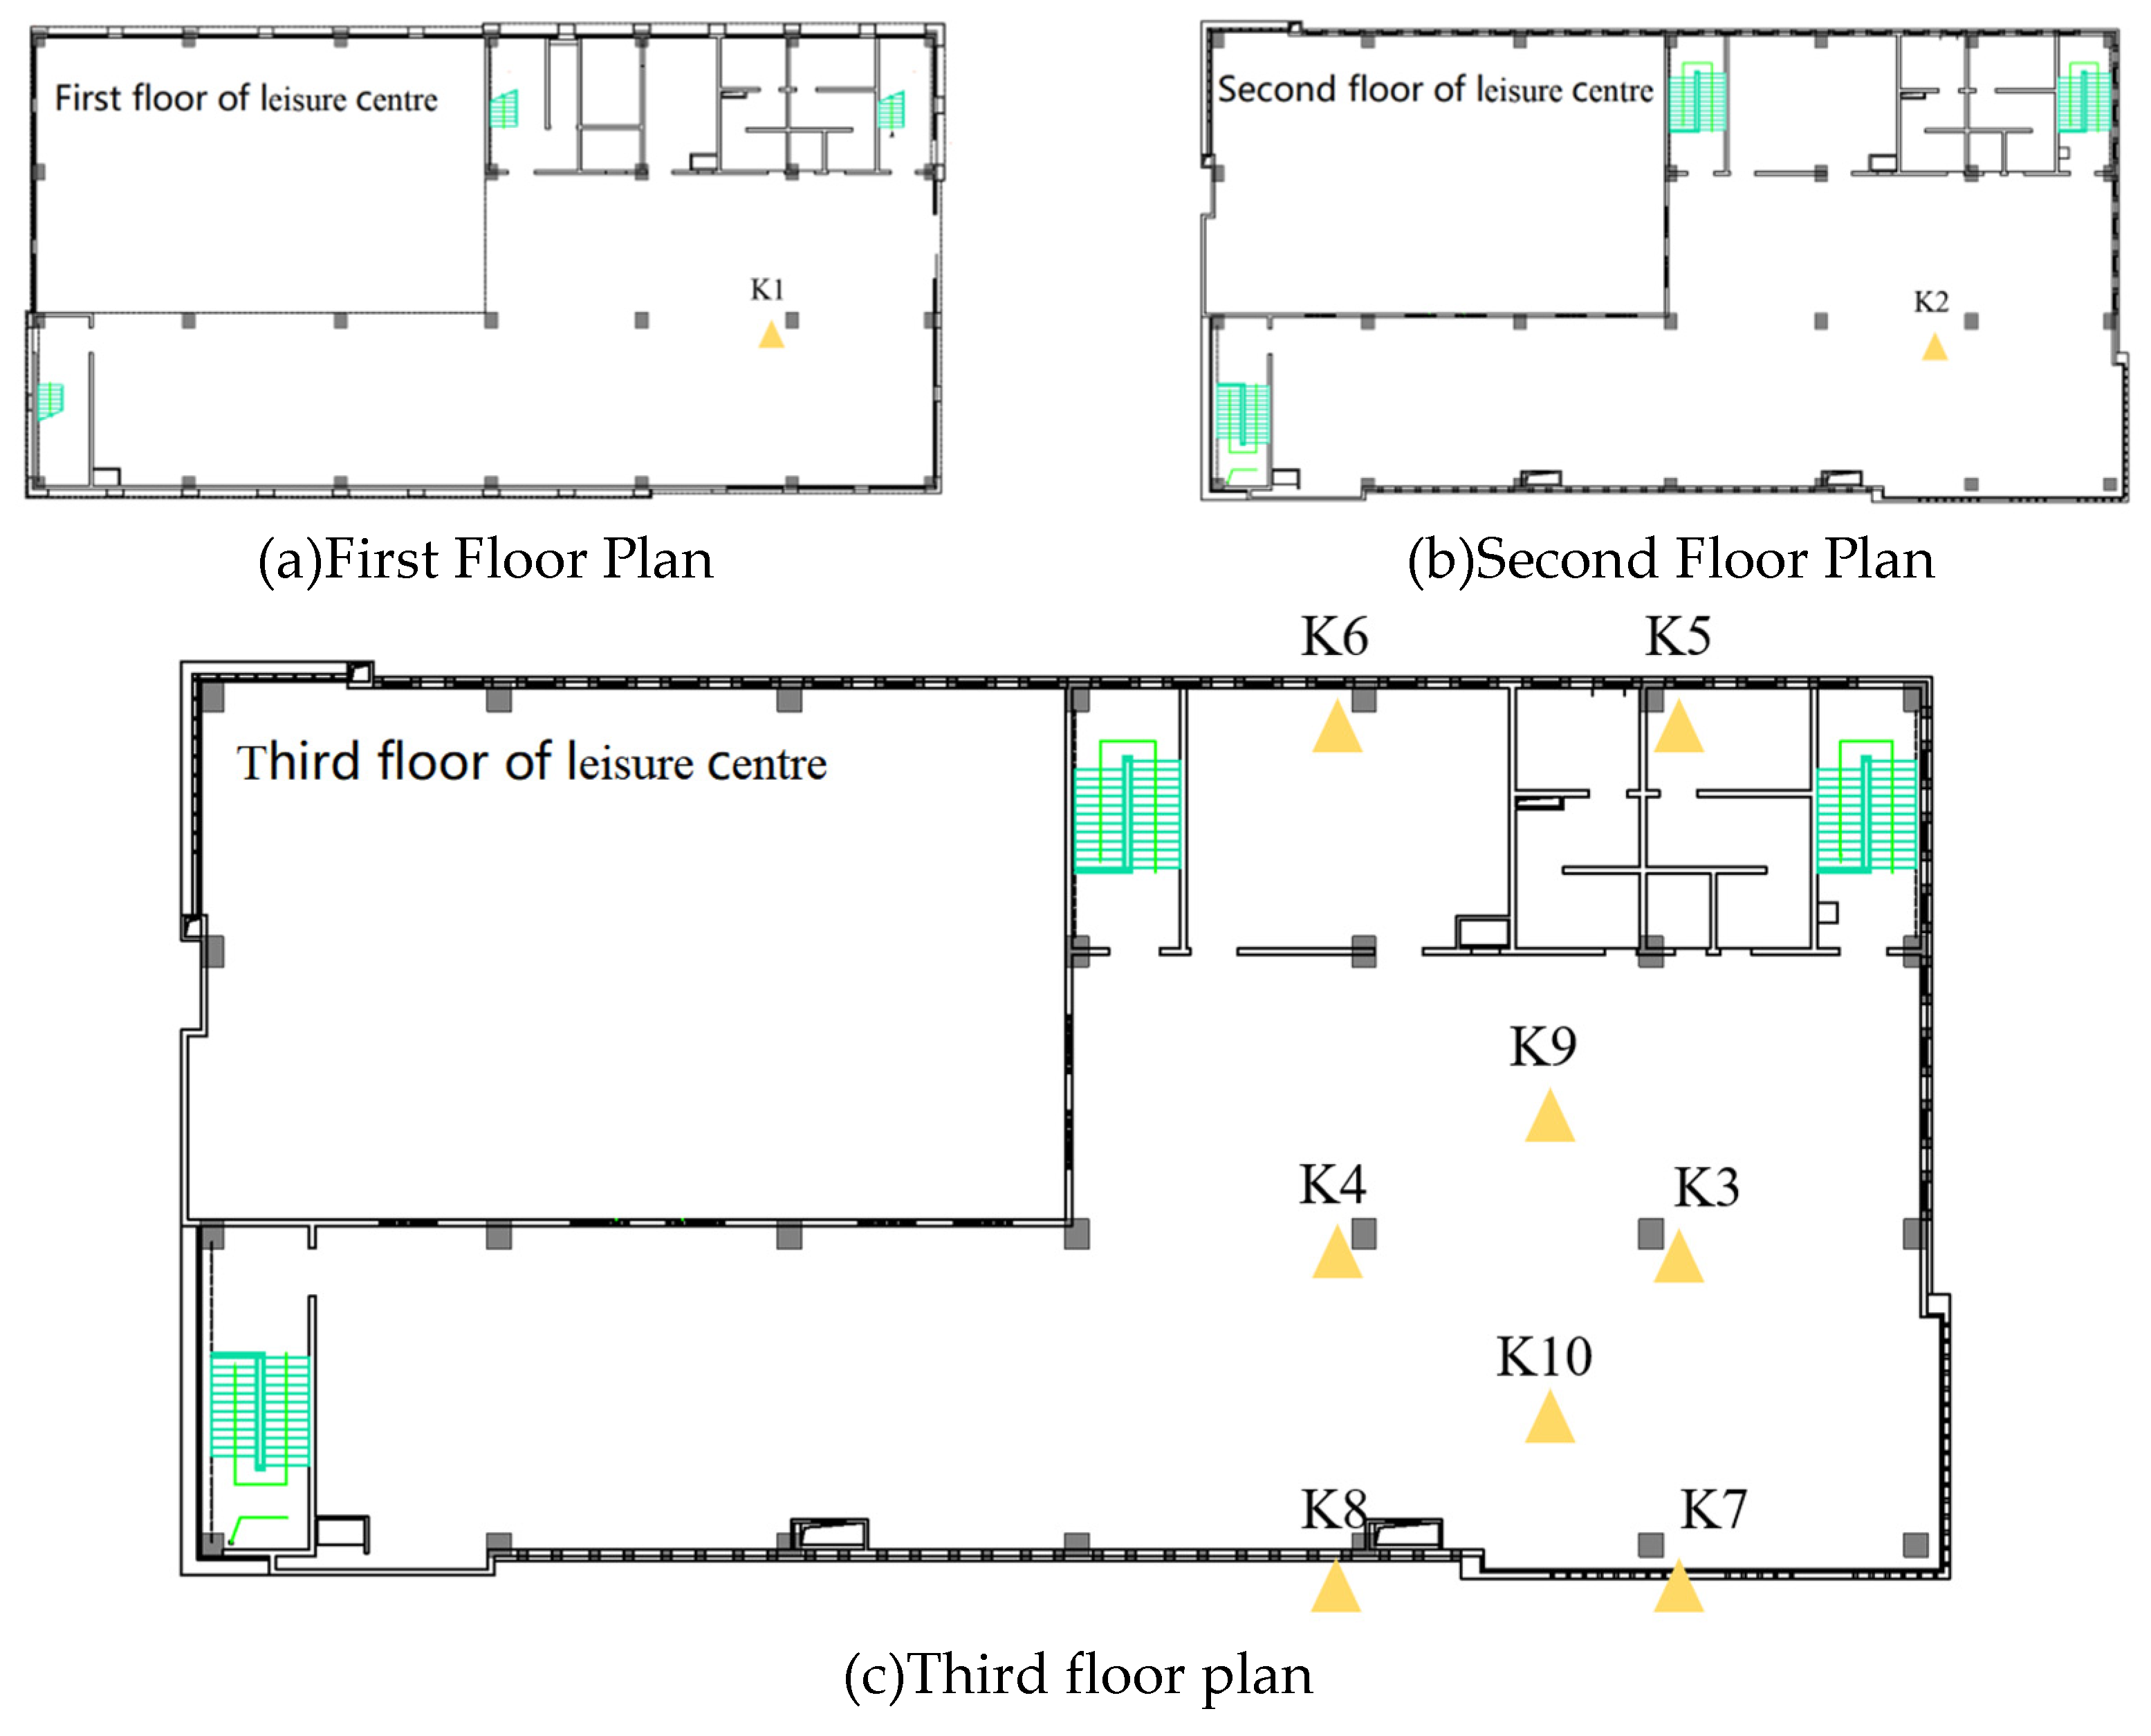
Section 1 mainly measures the vibration of the upper building located directly above the train access line. As shown in Figure 5, the Leisure Centre is a three-storey building and the test was carried out with 10 measurement points: one acceleration sensor was placed next to the same column on the first floor (K1) and one on the second floor (K2); on the third floor, six sensors were placed next to the column, one of which corresponded to the measurement points on the first and second floors (K3), in order to investigate the propagation of vibration with floor height; two measurement points (K9 and K10) were also placed in the centre of the floor on the third floor. The 10 sensors work together to measure the vertical and vertical track acceleration caused by the passage of trains. There are three tracks running underneath the building and the measurement point K9 is located directly above the second track in the third floor slab; K5 and K6 are 8.5 m away from the second track; K3 and K4 are 8.4m away from the second track; K7 and K8 are 18.9 m away from the track; the distance between K10 and the track in the slab is 15 m; the distance between the two adjacent columns in the down-track direction is 9 m.
Section 2 tested the vibration of a 27-storey building located 46.5 m from the underground track access line, the throat area. The train speed was approximately 25.2 km/h and data was collected for 27 trips through. A total of 10 measurement points were arranged within the high-rise, located on the 1st, 2nd, 4th, 10th, 13th, 16th, 19th, 23rd, 25th and 27th floors. The rooms in the upper floors are distributed on both sides, with a through gallery in the middle in the direction of the tracks. As shown in Figure 6, the measurement points on the 2nd floor and above were placed near the track side, at the centre of the floor of the room at the end of the corridor; as the 1st floor was partly used for shops, the instrument was placed at the centre of the floor of the second room.
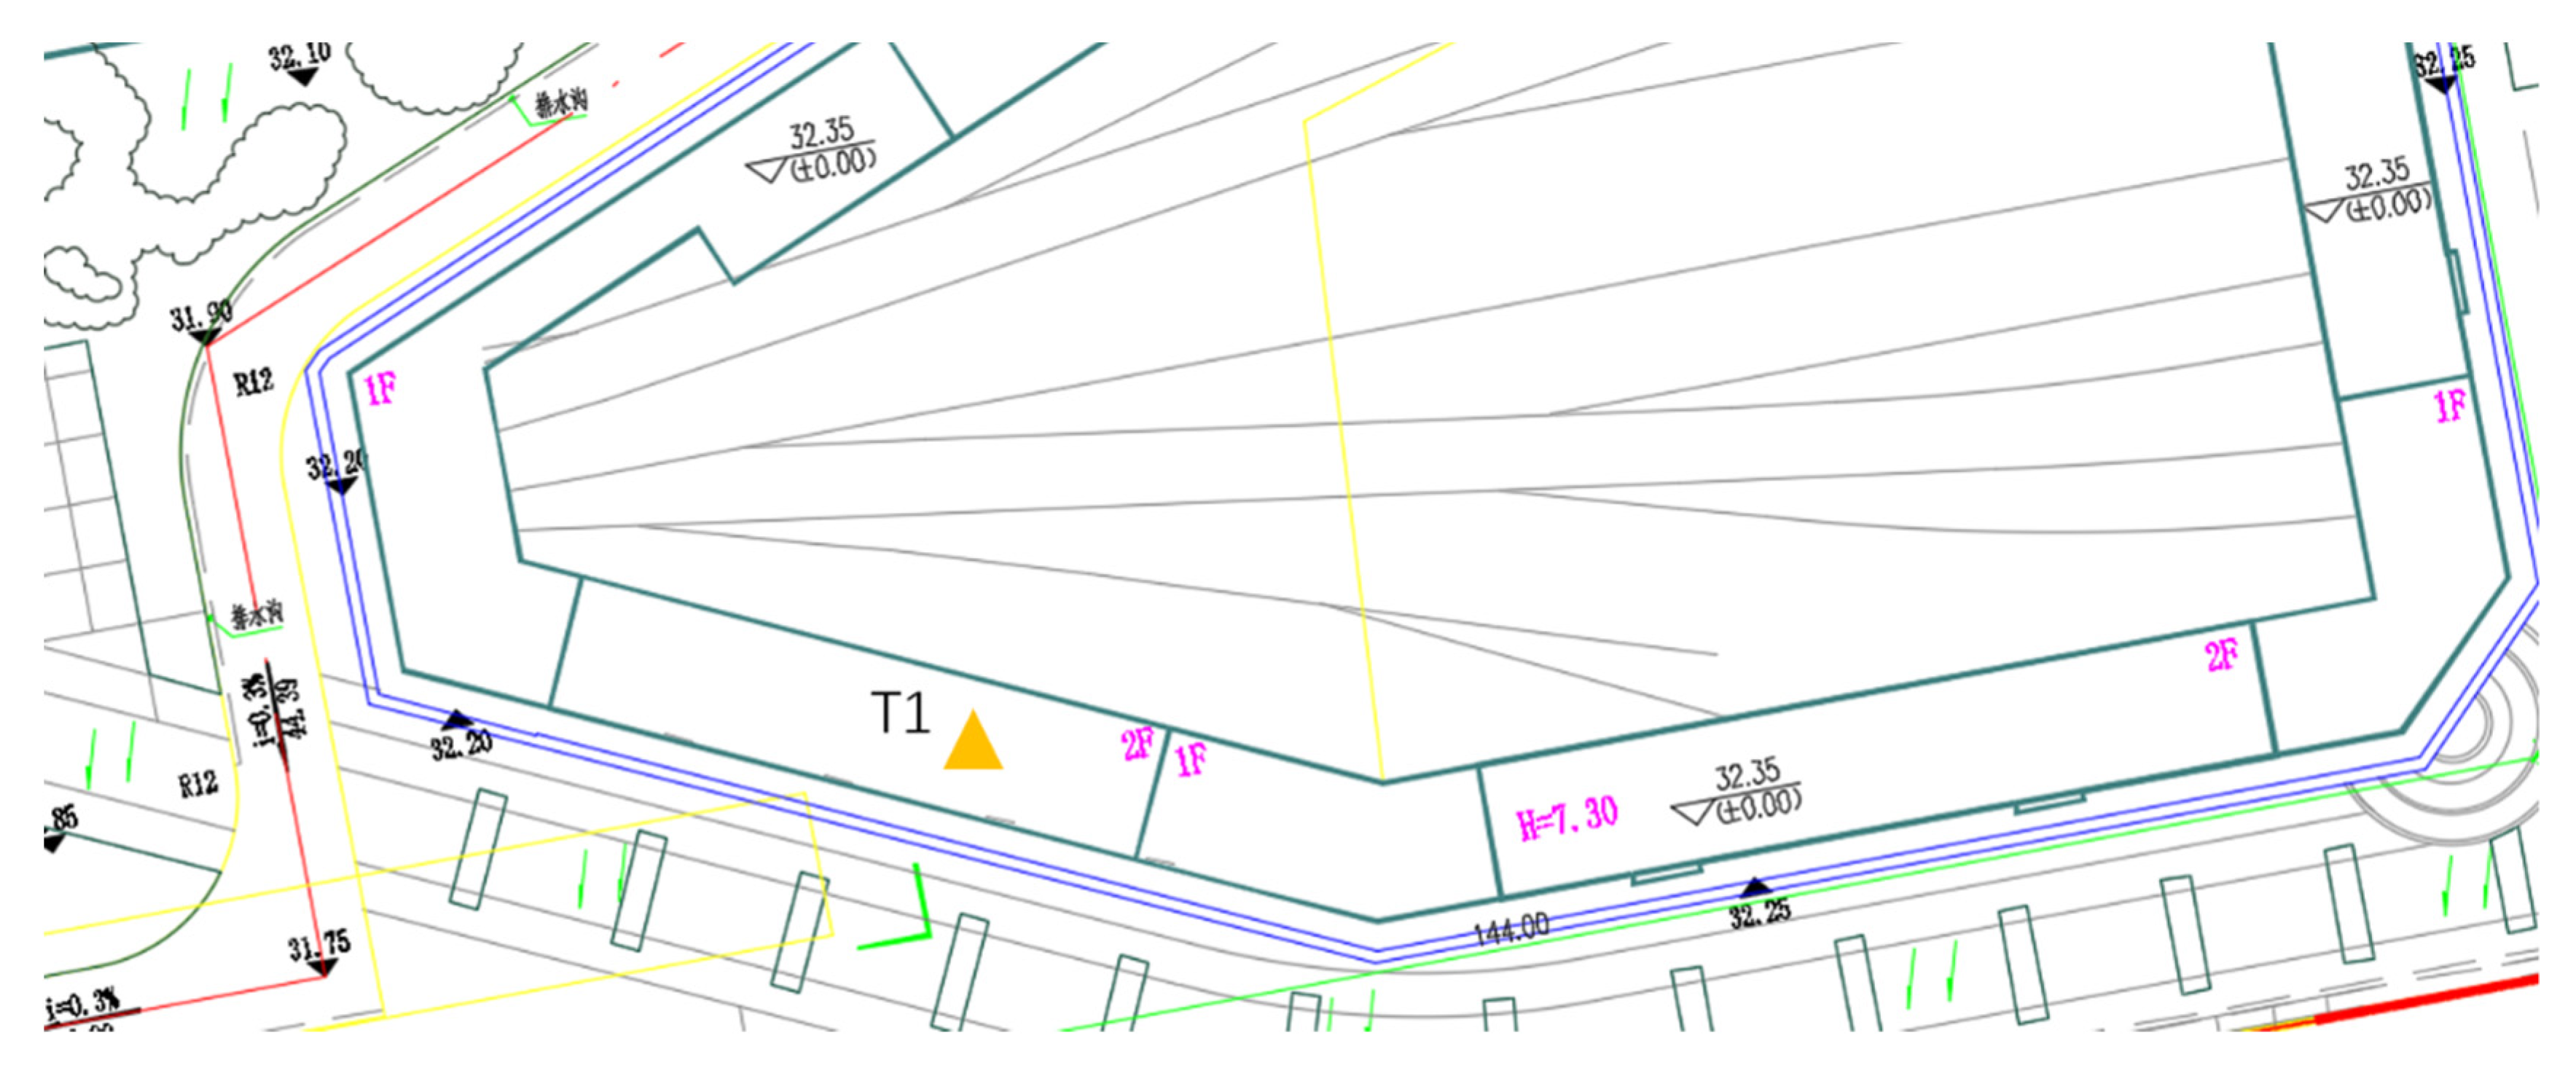
Section 3 is located in a two-storey building on a covered platform next to the track, with the kindergarten at a distance of 7 m from the nearest first track. 6 measurement points are arranged in this section, as shown in Figure 7. Instruments are placed at the bottom of the column at 18 m from the second track on the first floor, as measurement point Y1; in the slab, as measurement point Y2; in the near and far track rooms, as measurement points Y4 and Y3 respectively; where the second floor The distance from the track is 15.6 m at the near track and 21 m from the second track at the far track.
Section 4 records the effect of vibration on the surrounding buildings as the metro train enters the parking garage, with the upper high-rise residential building as the test building and two measurement points on its first floor, as shown in Figure 8.
Section 5 was located on the 2nd floor of the shop at the triangular skylight above the throat area. The main observation was to record the effect of vibration generated by the movement of trains in the throat area on the superstructure, and one measurement point was arranged on the 2nd floor, as shown in Figure 9.

3. Measurement data analysis and comparisons

3.1. Time domain analysis

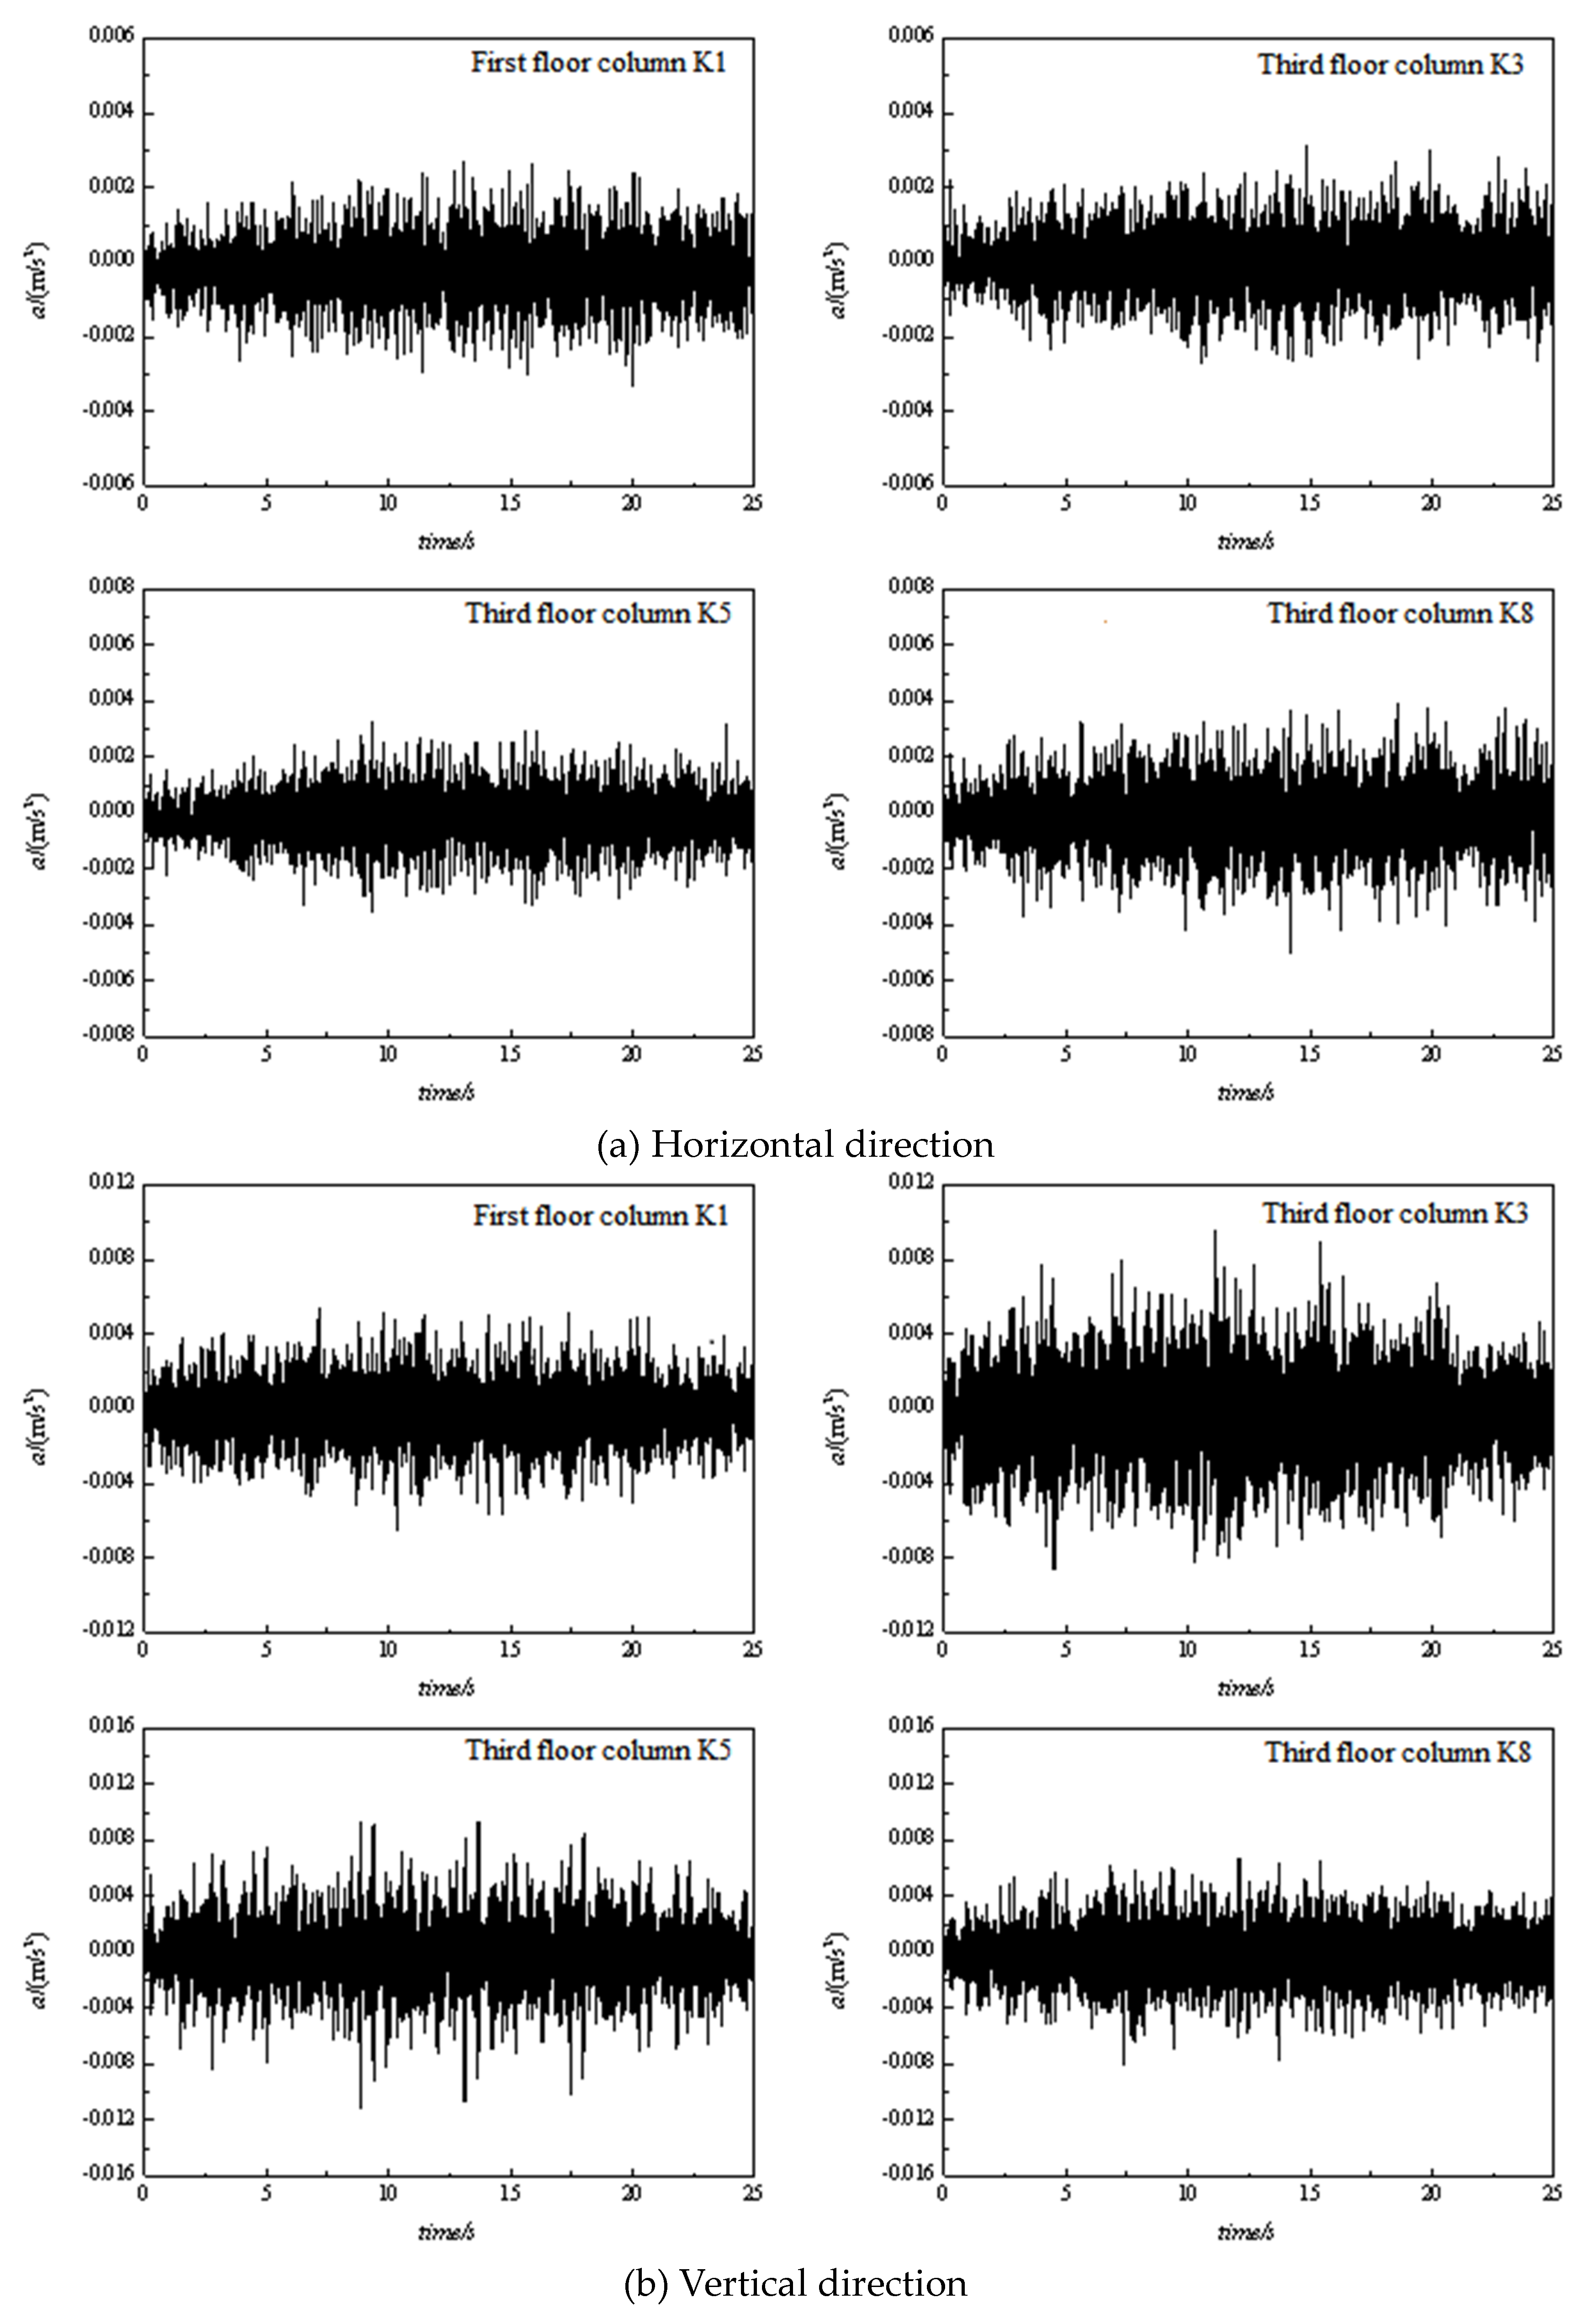
From Figure 10, it can be seen that the vertical vibration acceleration at the measurement points on the third floor of the Leisure Centre is much greater than the horizontal one, which is consistent with the findings of previous studies; while the difference between the horizontal and vertical vibration acceleration on the first and first floors is slightly smaller than that on the third floor. Comparing the acceleration time curves of the measurement points at the third level, it can be seen that the vibration acceleration in the slab is greater compared to the measurement points next to the columns, and the vertical vibration acceleration can reach 0.05m/s2.
The vibration duration of the underground in the throat area is about 25s, and the underground uses a 6-part B-type train. The operating speed of the underground train when passing through the test section can be deduced from the train length and passage time to be about 16km/h. Overall, the vibration intensity caused by the underground operation is greater than the background vibration.
From the acceleration time curve of the third floor column measurement point, we can see that the train shows a certain loading and unloading process when passing near the measurement point: when the first carriage is still some distance away from the measurement point, the loading process starts and the acceleration gradually increases; when the first carriage reaches a position closer to the measurement point, the loading process ends and the acceleration starts to stabilise; when the last carriage passes the building, the unloading process starts and the acceleration gradually decreases; when the last carriage passes the building, the acceleration gradually decreases. When the last carriage passes the building, the unloading process starts and the acceleration gradually decreases; when the last carriage leaves a certain distance, the unloading process ends.
According to the data obtained from the same column on the first, second and third floors, the acceleration of vibration caused by the operation of the metro train increases with the increase of the floor height, and the increase in the vertical direction is about 0.002 m/s2 per floor.
Looking at the vertical acceleration time curve in Figure 10b, it can be seen that the acceleration values at measurement points K3, K4 and K5 and K6 (8.5m from the track), which are closer to the track where the metro is running, are slightly larger than those at K7 and K8 (18.9 m from the track), which are slightly further away from the track, and the peaks of loading and unloading are more obvious when the wheels are in contact with the track. This shows that the vibration caused by the operation of the metro train attenuates with the increase of distance in the process of propagation, reflecting a certain law of vibration propagation, which should be related to the geological structure of the soil layer, the driving characteristics of the metro train and other influencing factors.
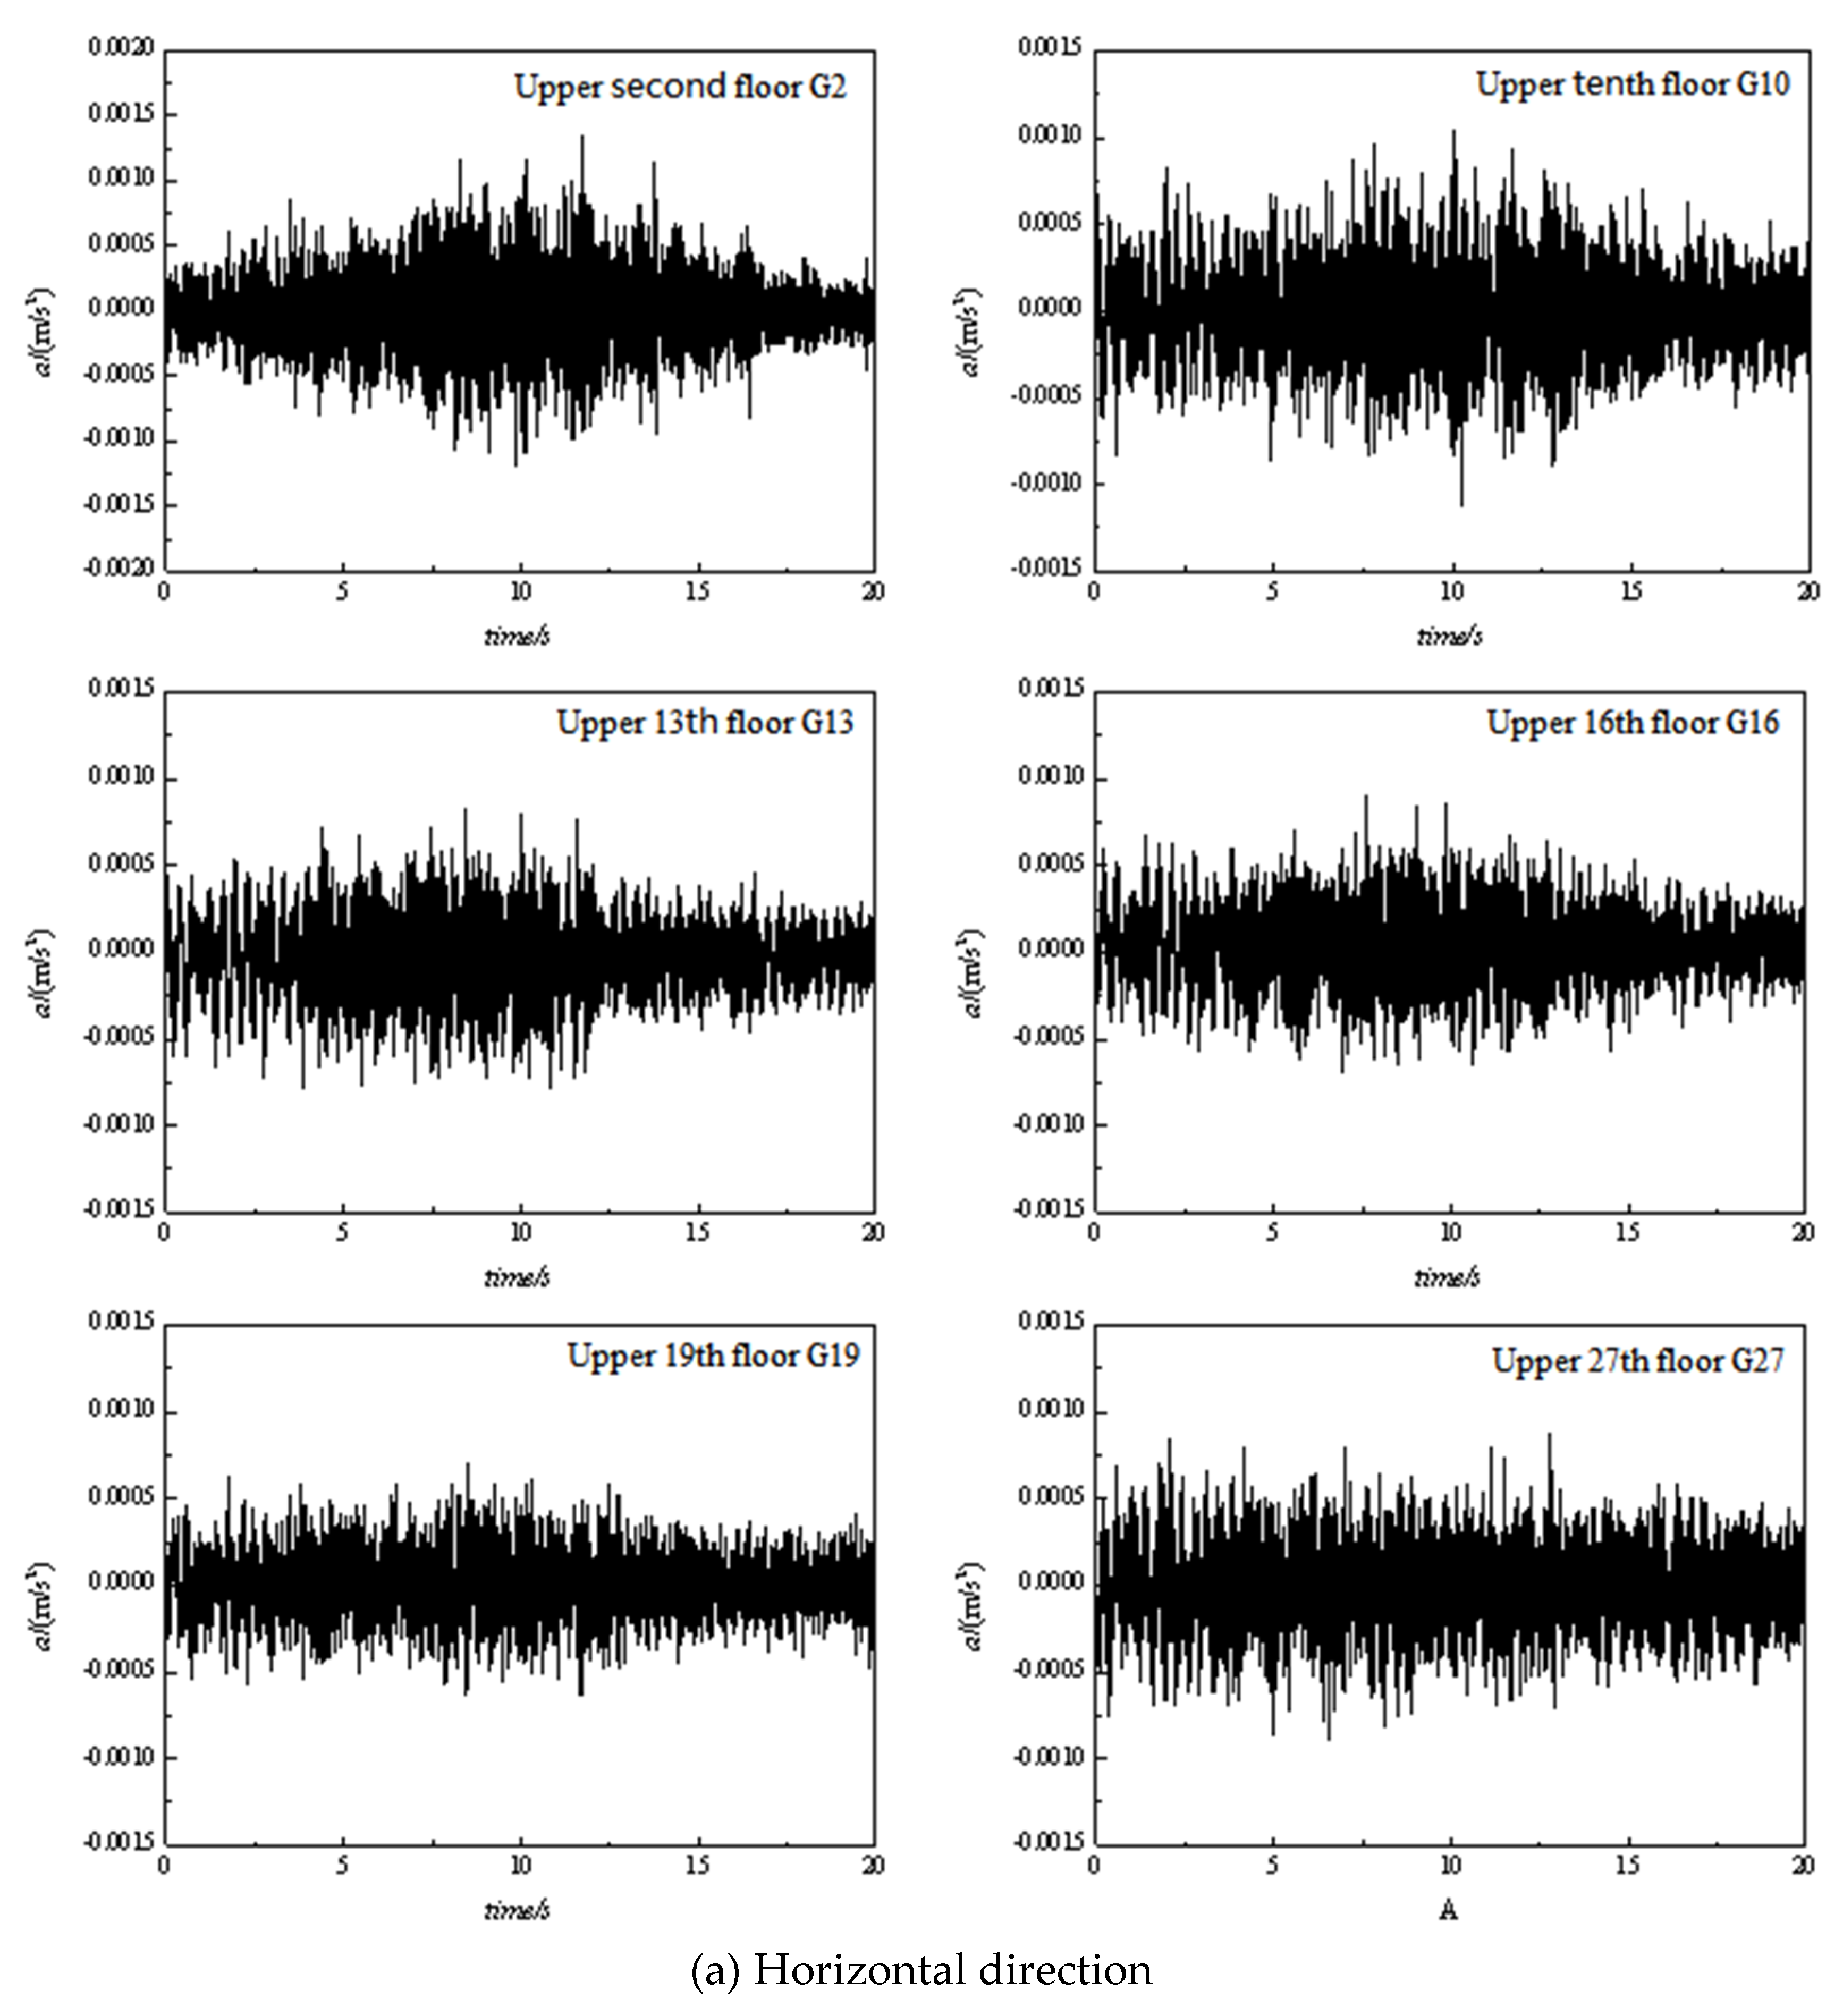
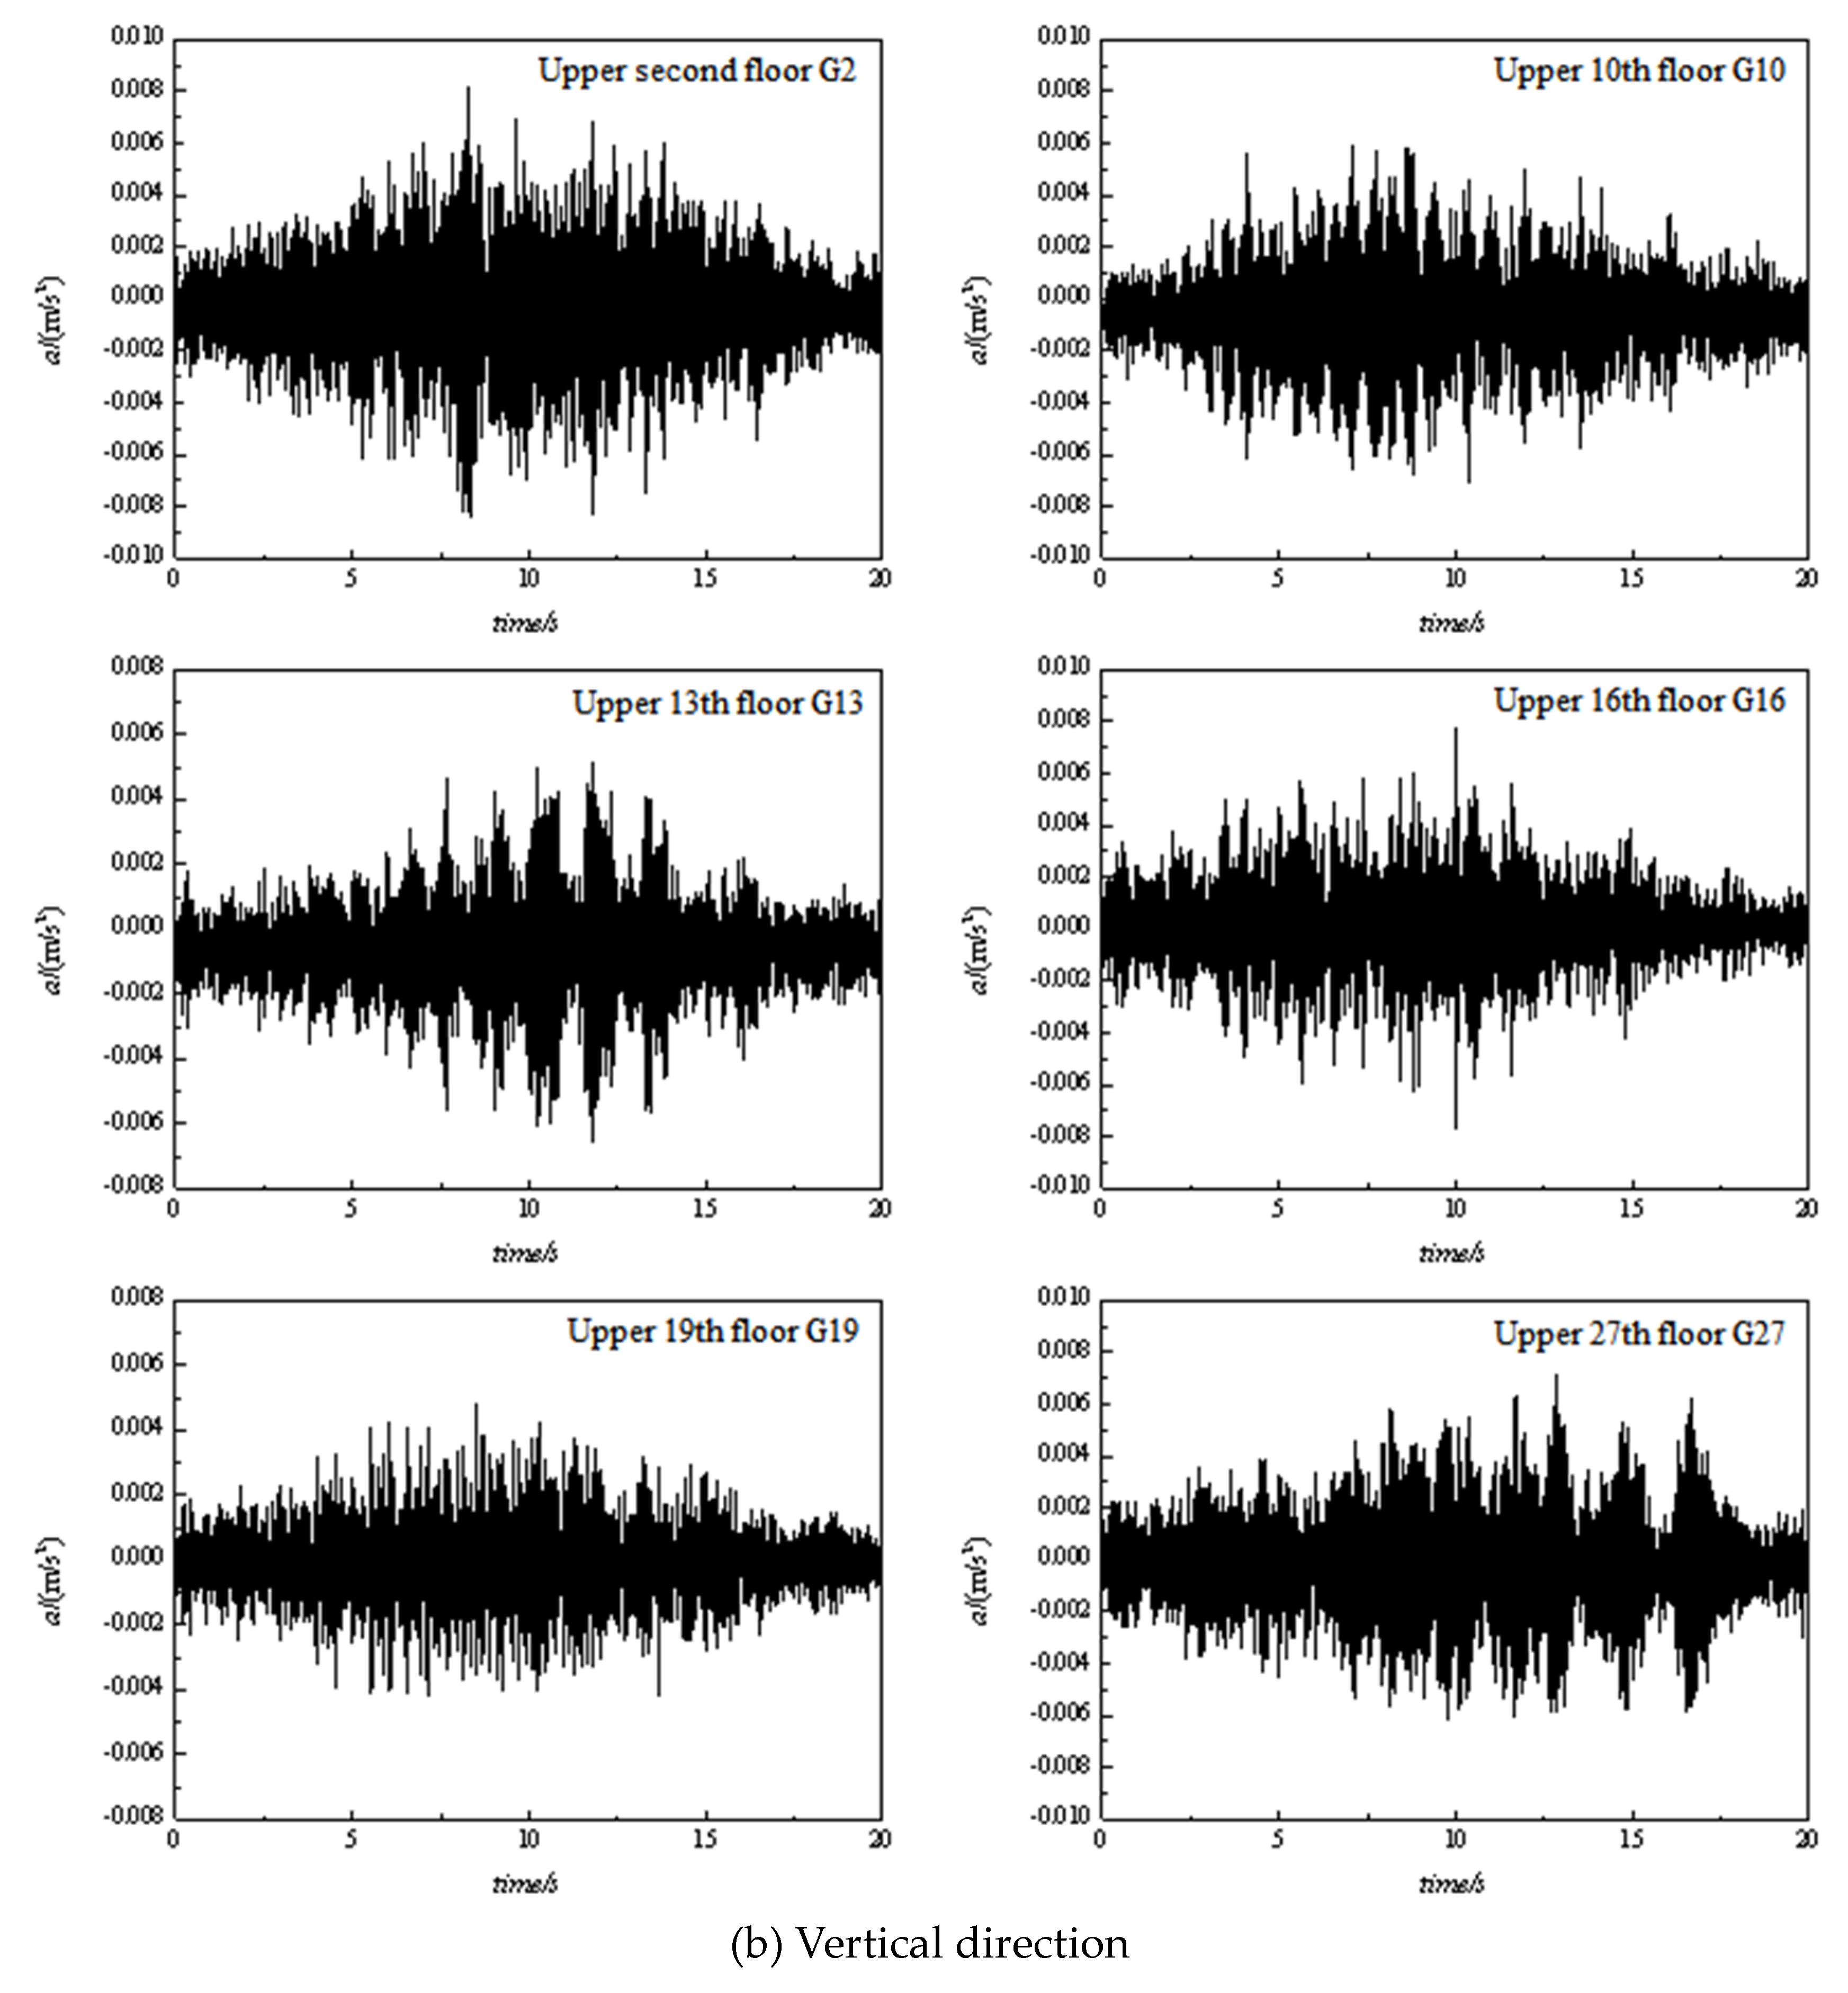
The section 2 is at a certain distance from the track and is slightly less affected by vibrations than section 1. However, due to the high number of layers in this section, it is possible to study the propagation and variation of vibration due to train operation along the layer height direction. From Figure 11, it can be seen that the duration of vibration in the throat area and the access line is about 20s, which can be inferred from the train running speed of 20.5km/h.
As can be seen from Figure 11a, the vibration acceleration in the horizontal direction is within the range of -0.0015~0.0015m/s2 and tends to decrease with the increase of storey height. 1, 2 and 4 storeys do not differ significantly in vibration acceleration, and the vibration acceleration obtained from the measurement points at 13 storeys and above gradually decreases to two-thirds of that at 1 storey. Comparing Figure 11b, the vibration in the vertical direction is much greater than that in the horizontal direction, in the range of -0.008~0.008 m/s2, similar in the horizontal direction, and tends to decrease with the increase of storey height, and the wave crest generated by the wheel is more obvious than that in the horizontal direction.
The vibration peaks at the middle floors, such as the 10th and 13th floors, are more obvious than those at the other floors. 1 floor is connected to the cover, so the vibration is relatively large.
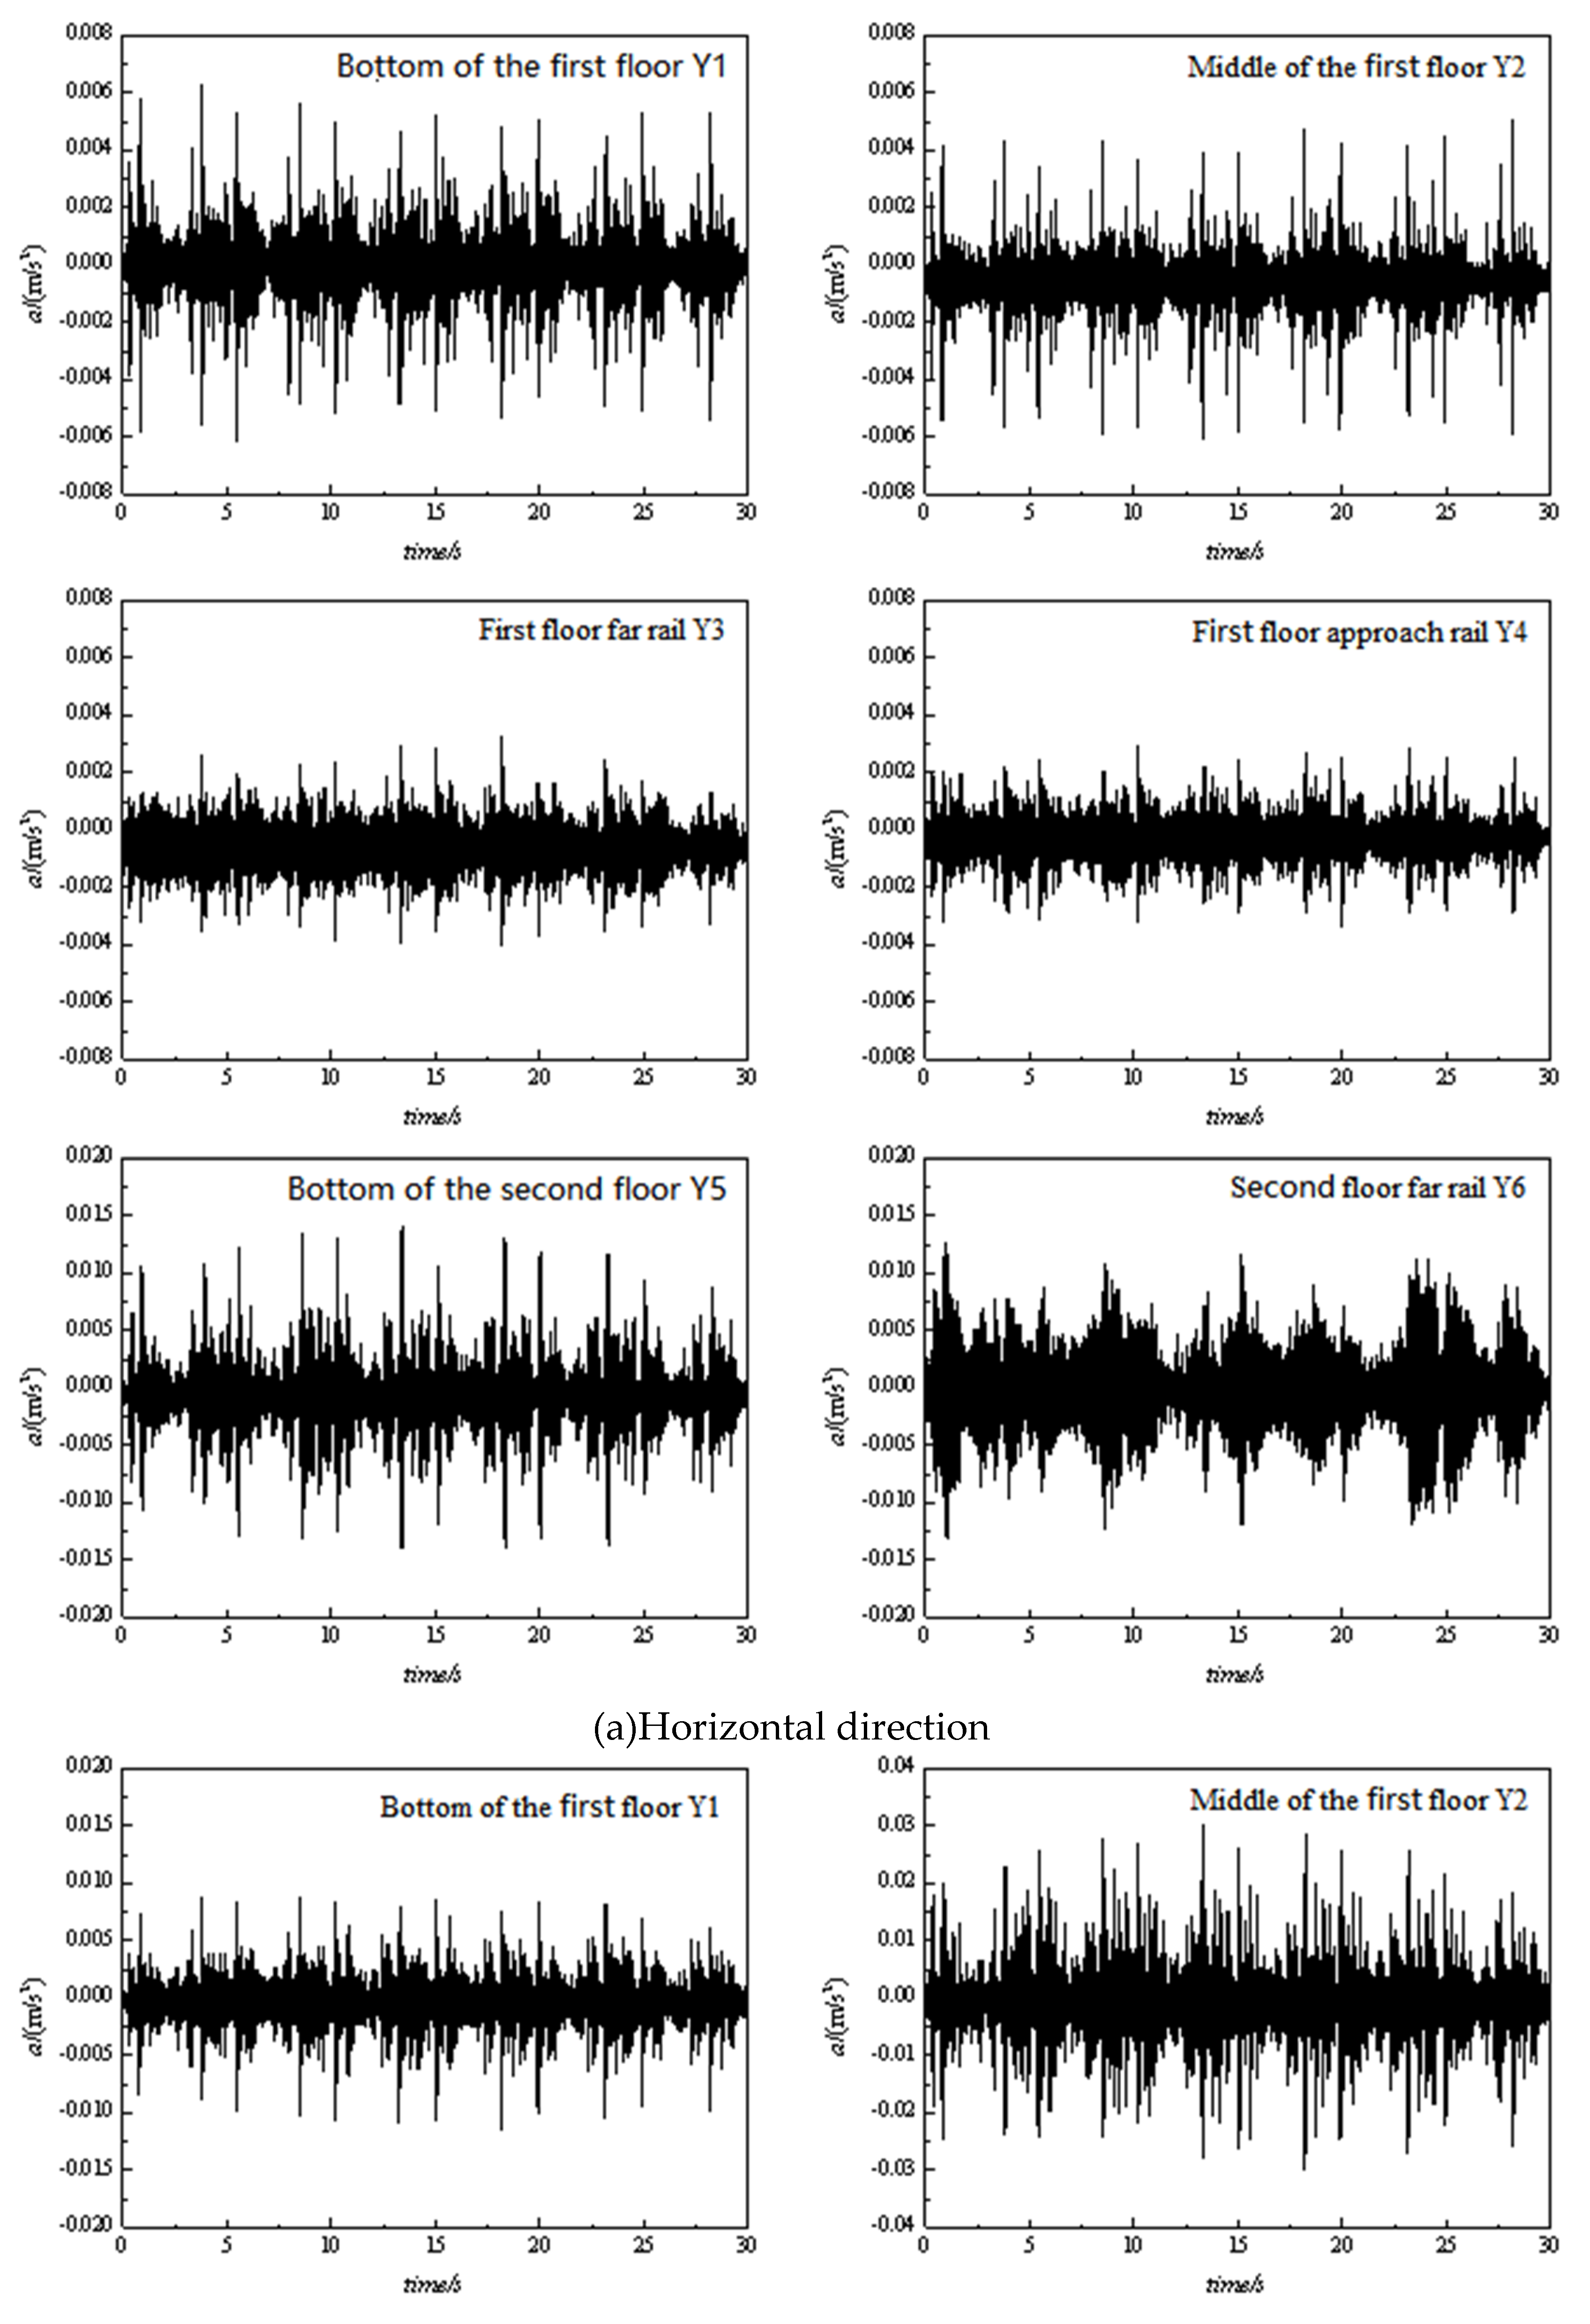
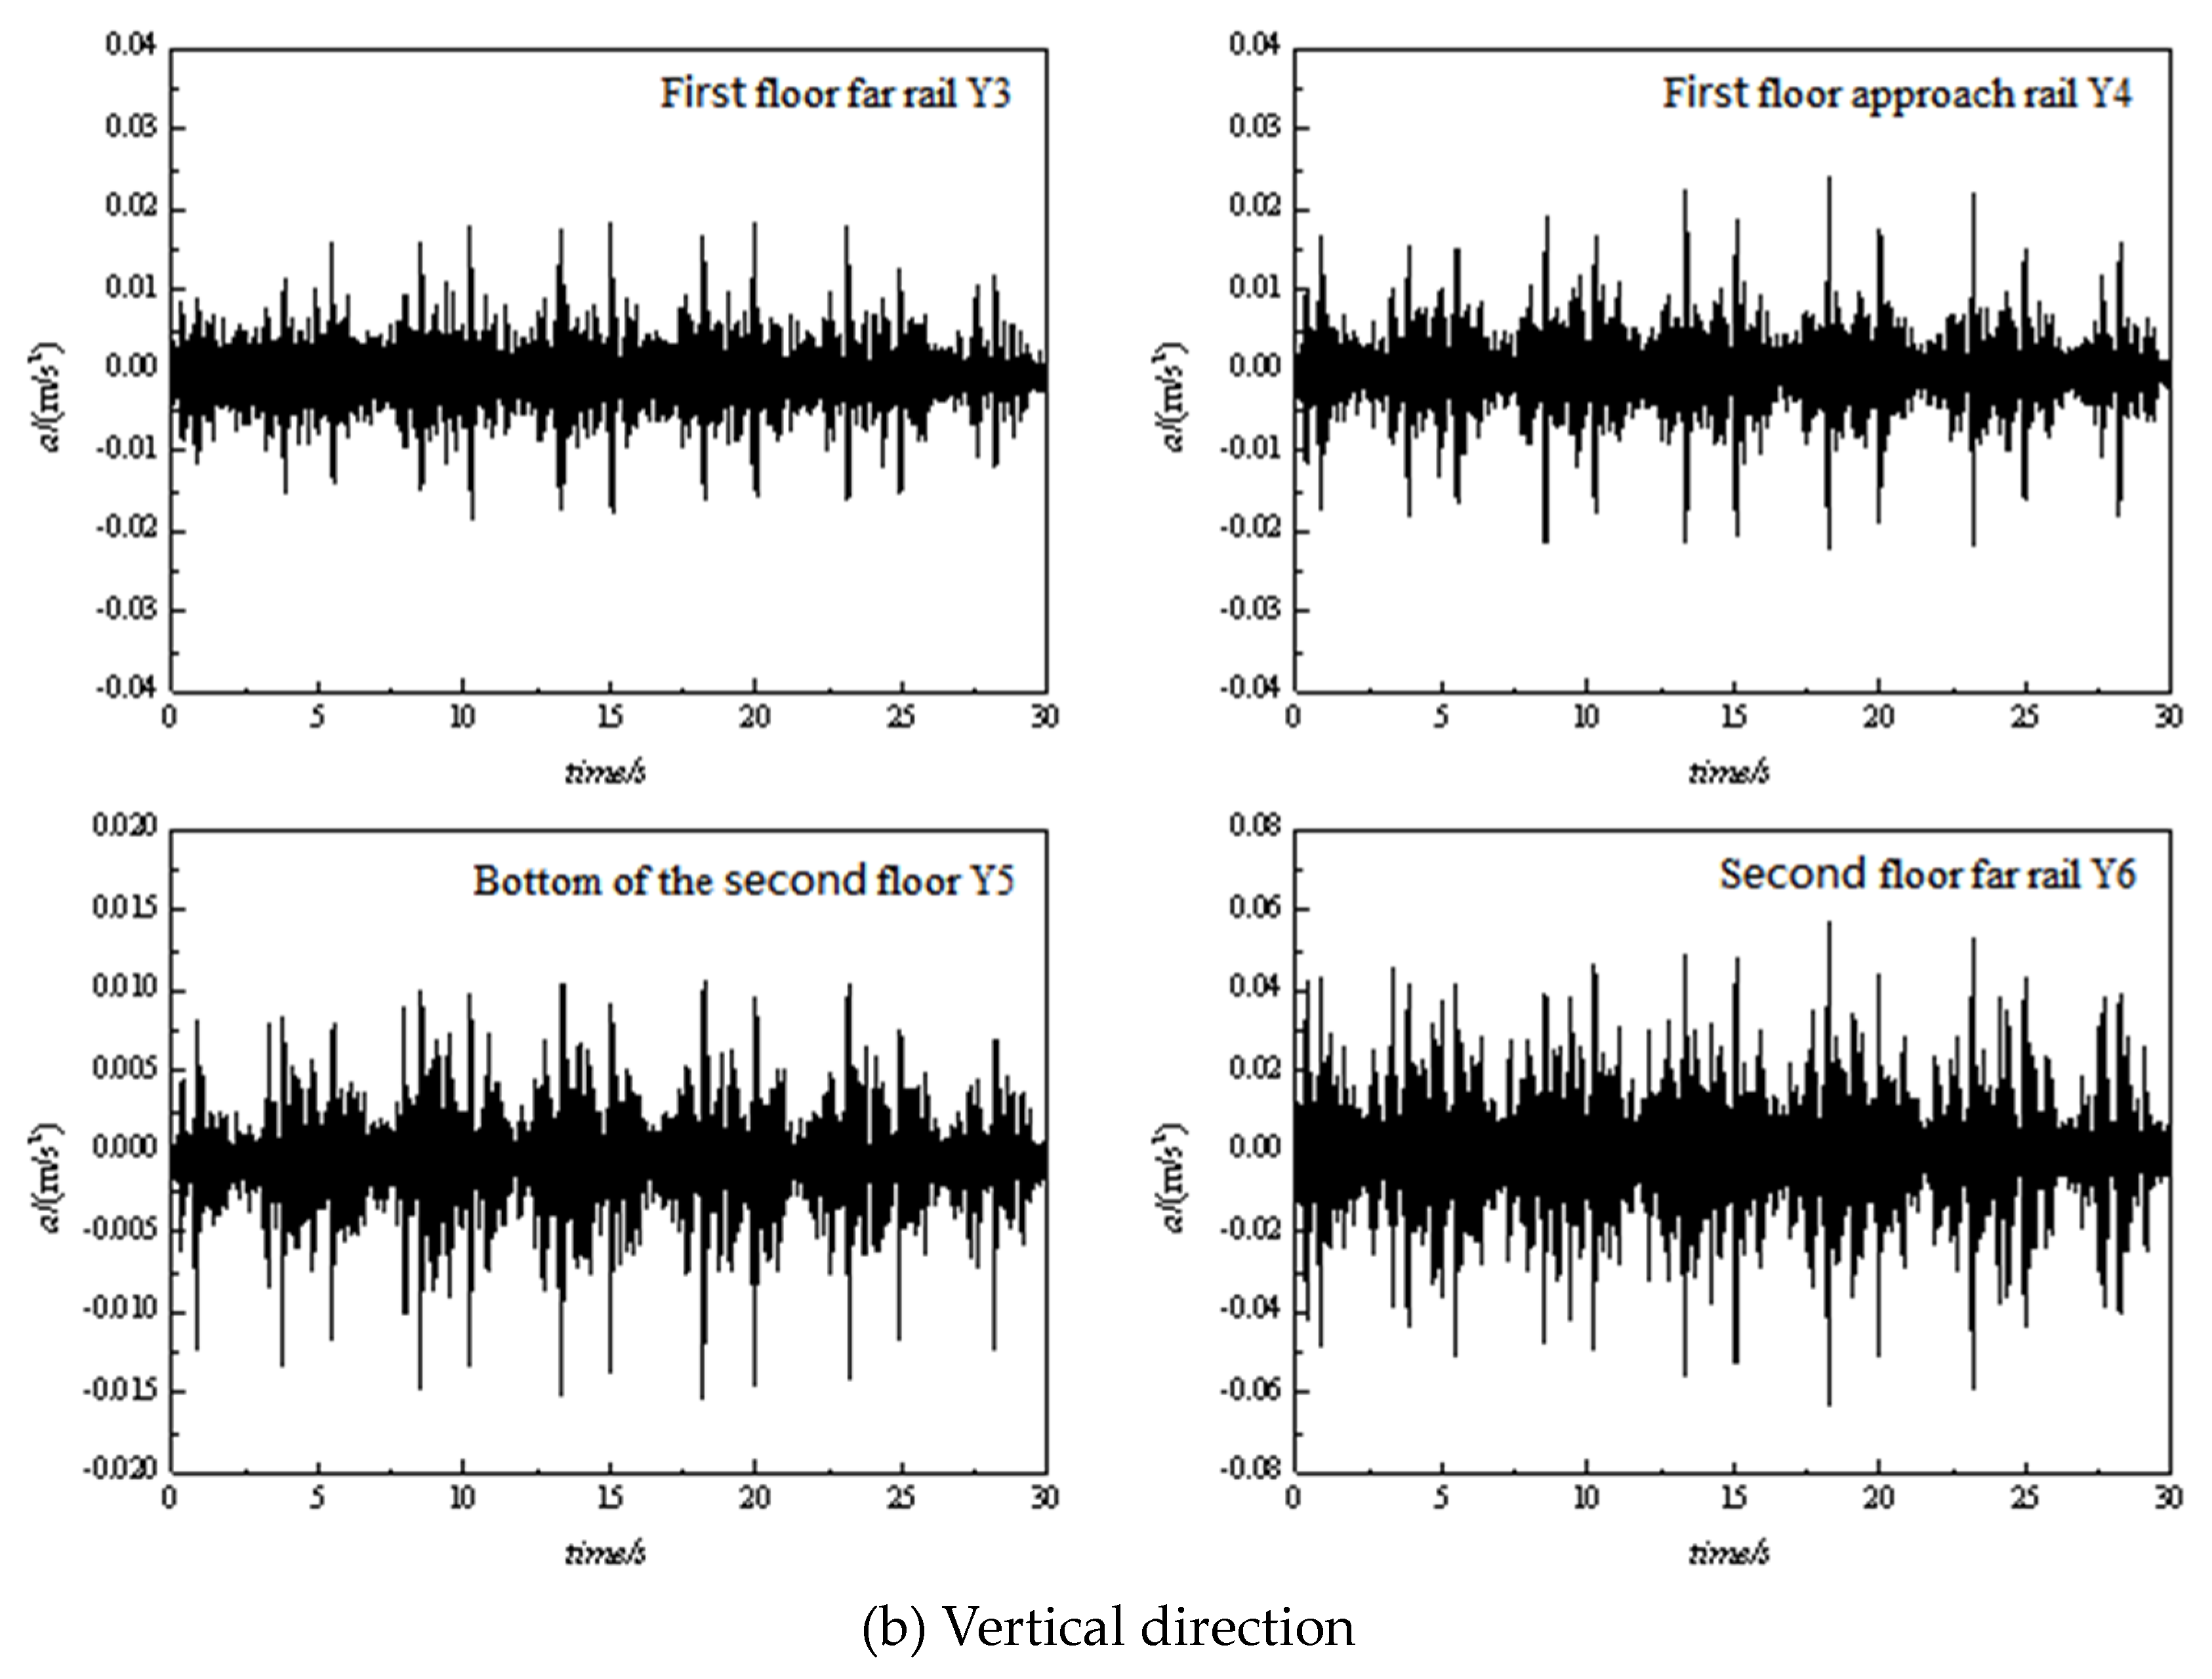
As can be seen from Figure 12, the section 3 times course curve is similar to the pattern reflected in the first two sections, with the train passing for approximately 30 seconds, inverse to the train speed of 13.68 km/h. As the train is running at a slower speed than the first two sections, it is easier to identify the 12 wave peaks generated by the front and rear wheels.
Comparing the horizontal and vertical vibration acceleration values reveals that the building is more affected by vertical vibration. The acceleration of vertical vibration at the same measurement point is generally greater than that in the horizontal direction by more than 0.005 m/s2. In the analysis of the vibration propagation law, vertical vibration is the main focus. Comparing the data from the measured points in the ground floor slab of the kindergarten with the data from the bottom of the column, the results are similar to those obtained in the Leisure Centre, where the vibration acceleration in the slab is greater than that in the column.
Near and far track room measurement points Y4, Y3 data compared, after nearly 6m of decay, can be seen from the track farther away from the measurement point Y3, the recorded vibration acceleration value than Y4 slightly smaller than 0.005 m/s2; with the increase in floor height, observation of different floors near the track at the room measurement points Y4, Y6, can be seen compared to the first floor vibration acceleration value has increased, the peak value is about one floor measured acceleration value The peak value is about twice the acceleration value measured on the first floor, close to 0.06 m/s2.
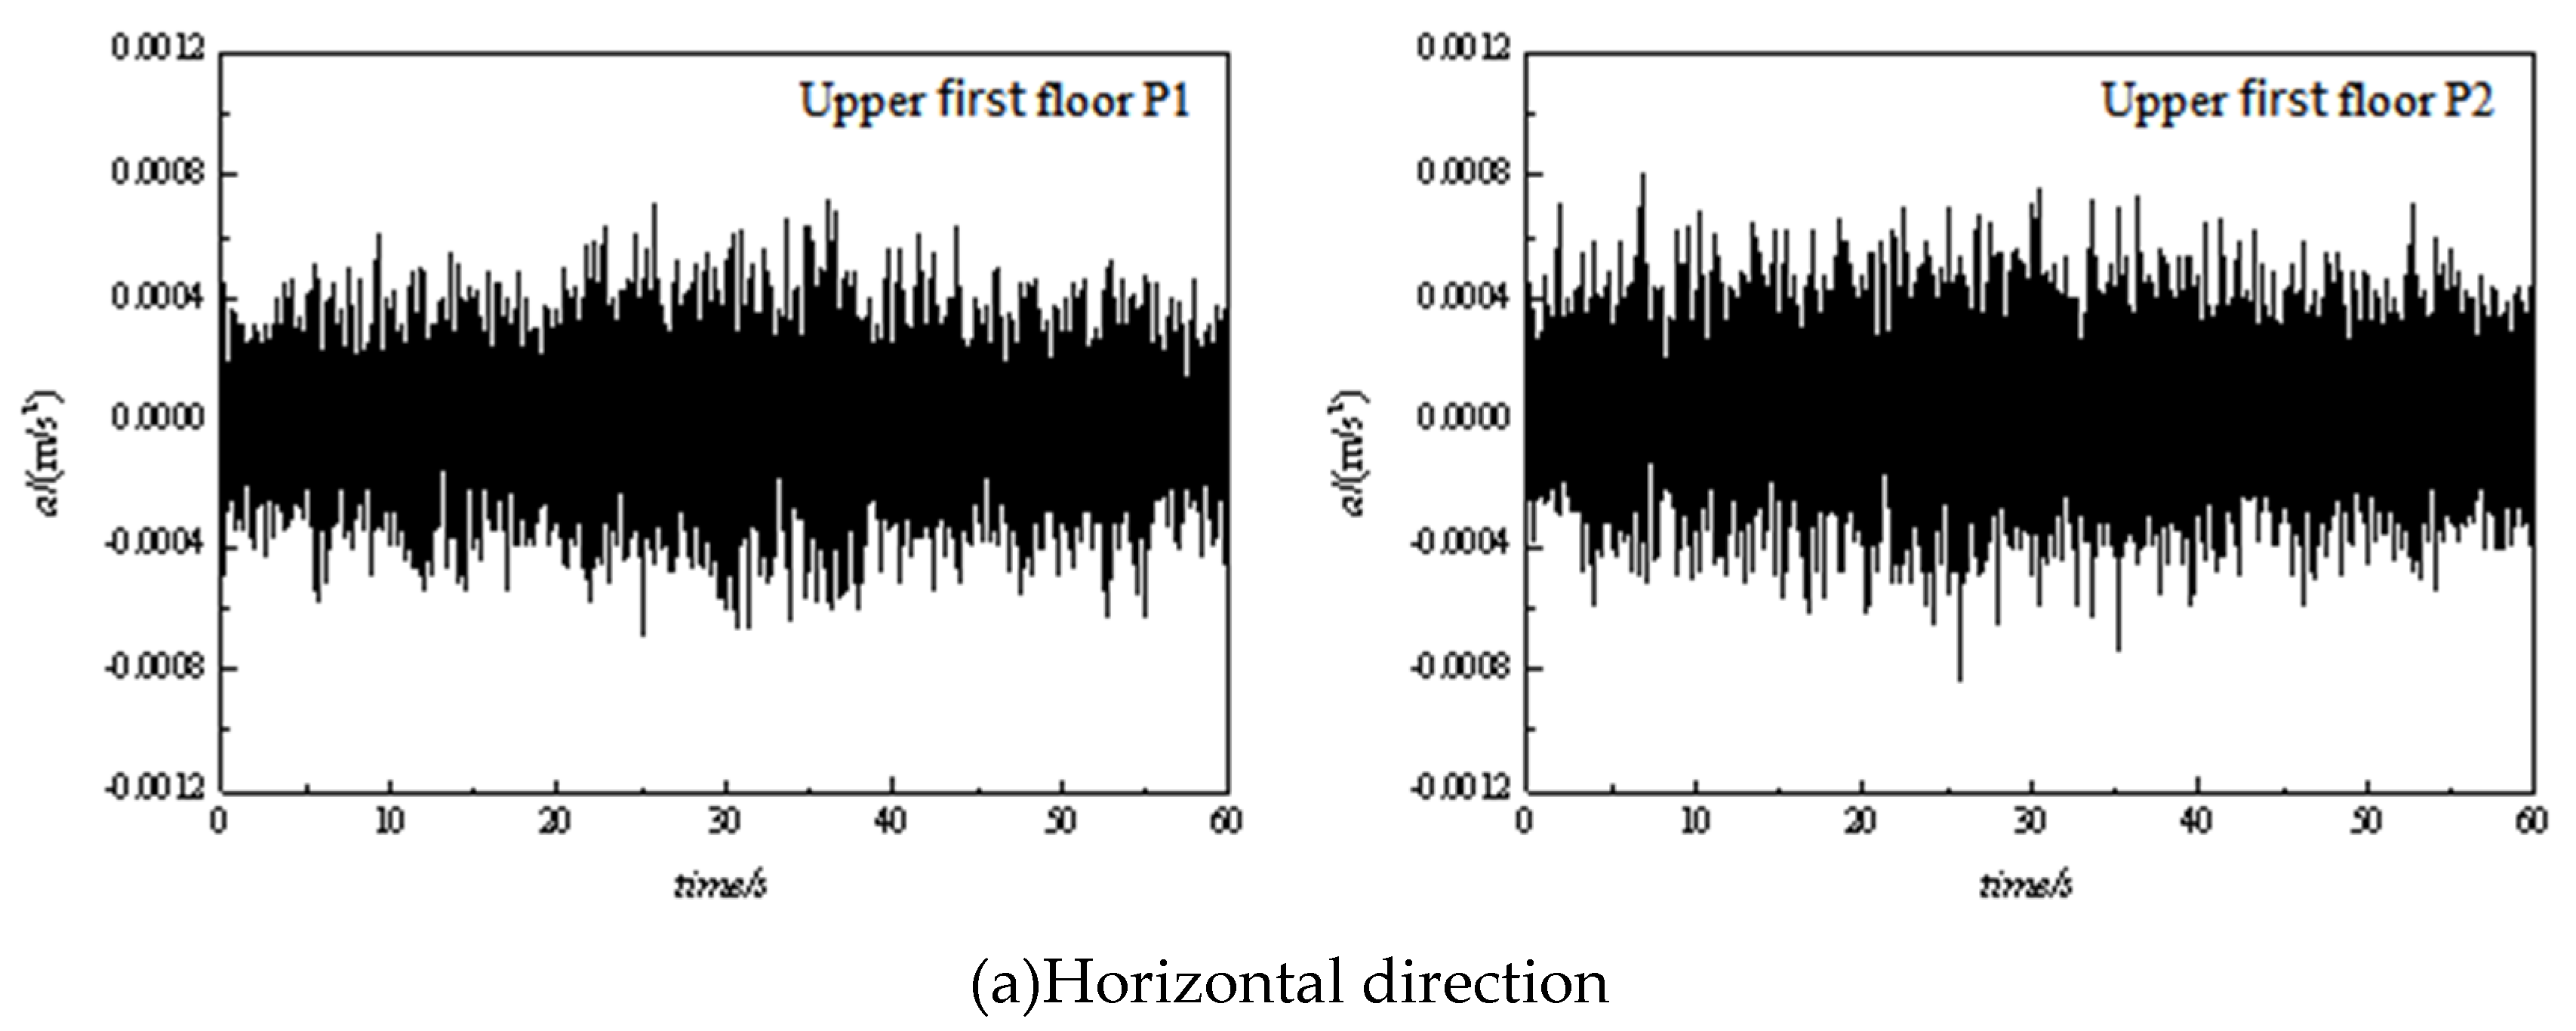
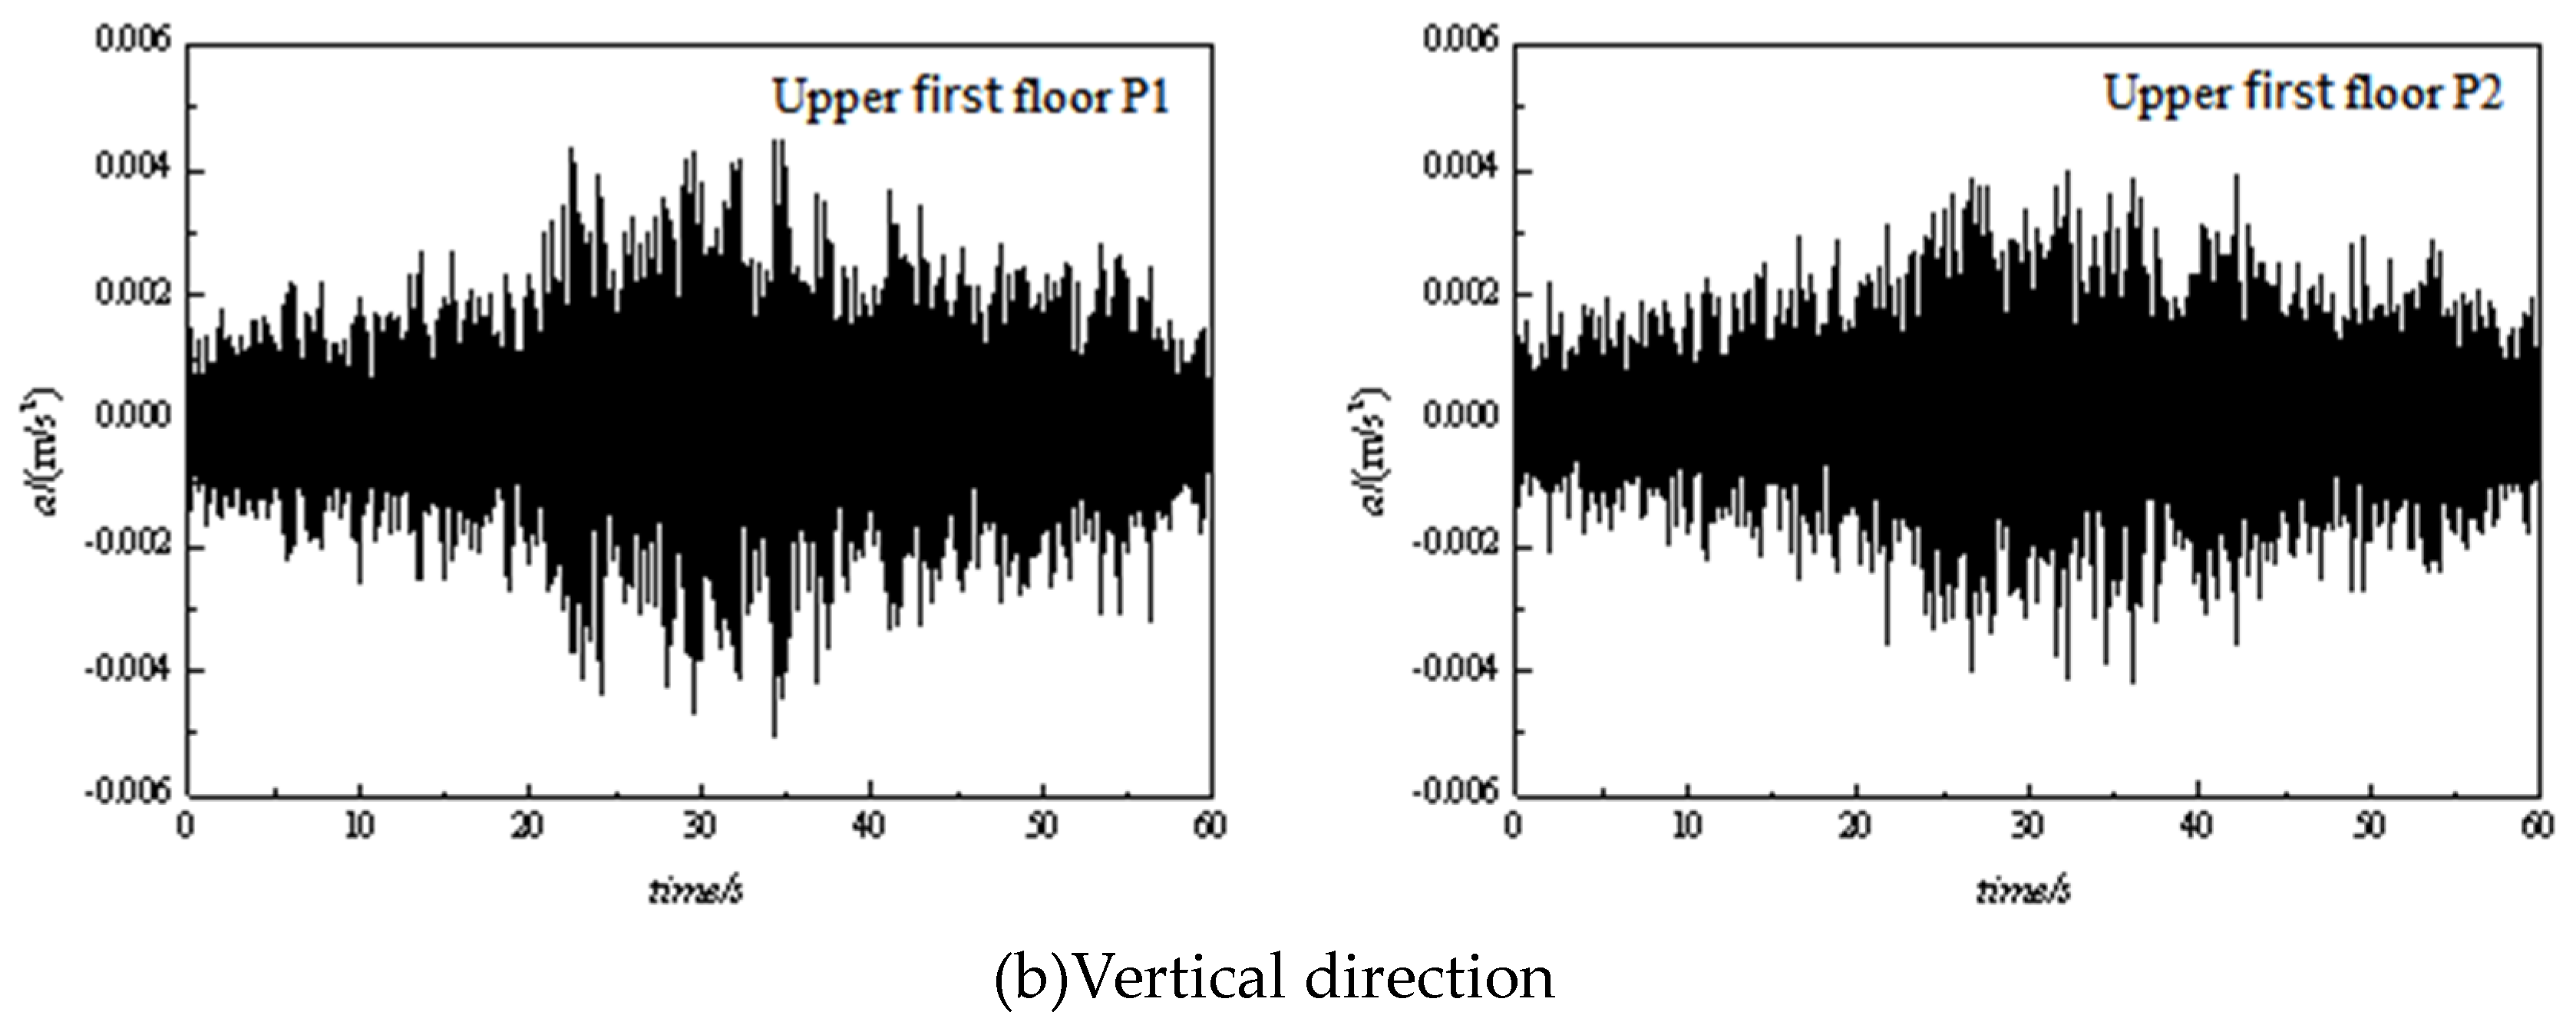
As can be seen from Figure 13, the vibration in section 4 is also induced by the train running into the parking garage, the speed of the train is lower, the operation is smoother, the vibration induced is smaller, and the crest generated by the wheel-rail contact is not obvious; the horizontal vibration acceleration range is -0.0008-0.0008m/s2; the vertical acceleration is -0.005-0.005 m/s2; it can be seen that the vertical vibration acceleration is still much larger than the horizontal.
Comparing the ground floor measurement point G1 in section 2 with the two measurement points in this section, it can be seen that the vibration acceleration values differ at different speeds.
The speed of the train in section 2 is about 20.52 km/h, which is more than twice the speed of the train measured in section 4, causing a horizontal vibration acceleration in the range of -0.0015-0.0015 m/s2 and a vertical acceleration of -0.006-0.006 m/s2; it can be seen that as the speed of the train increases, the horizontal and vertical vibration acceleration increases, and due to the operation of the train The vertical vibration is much larger than the horizontal one, so the growth of vertical vibration is more significant.
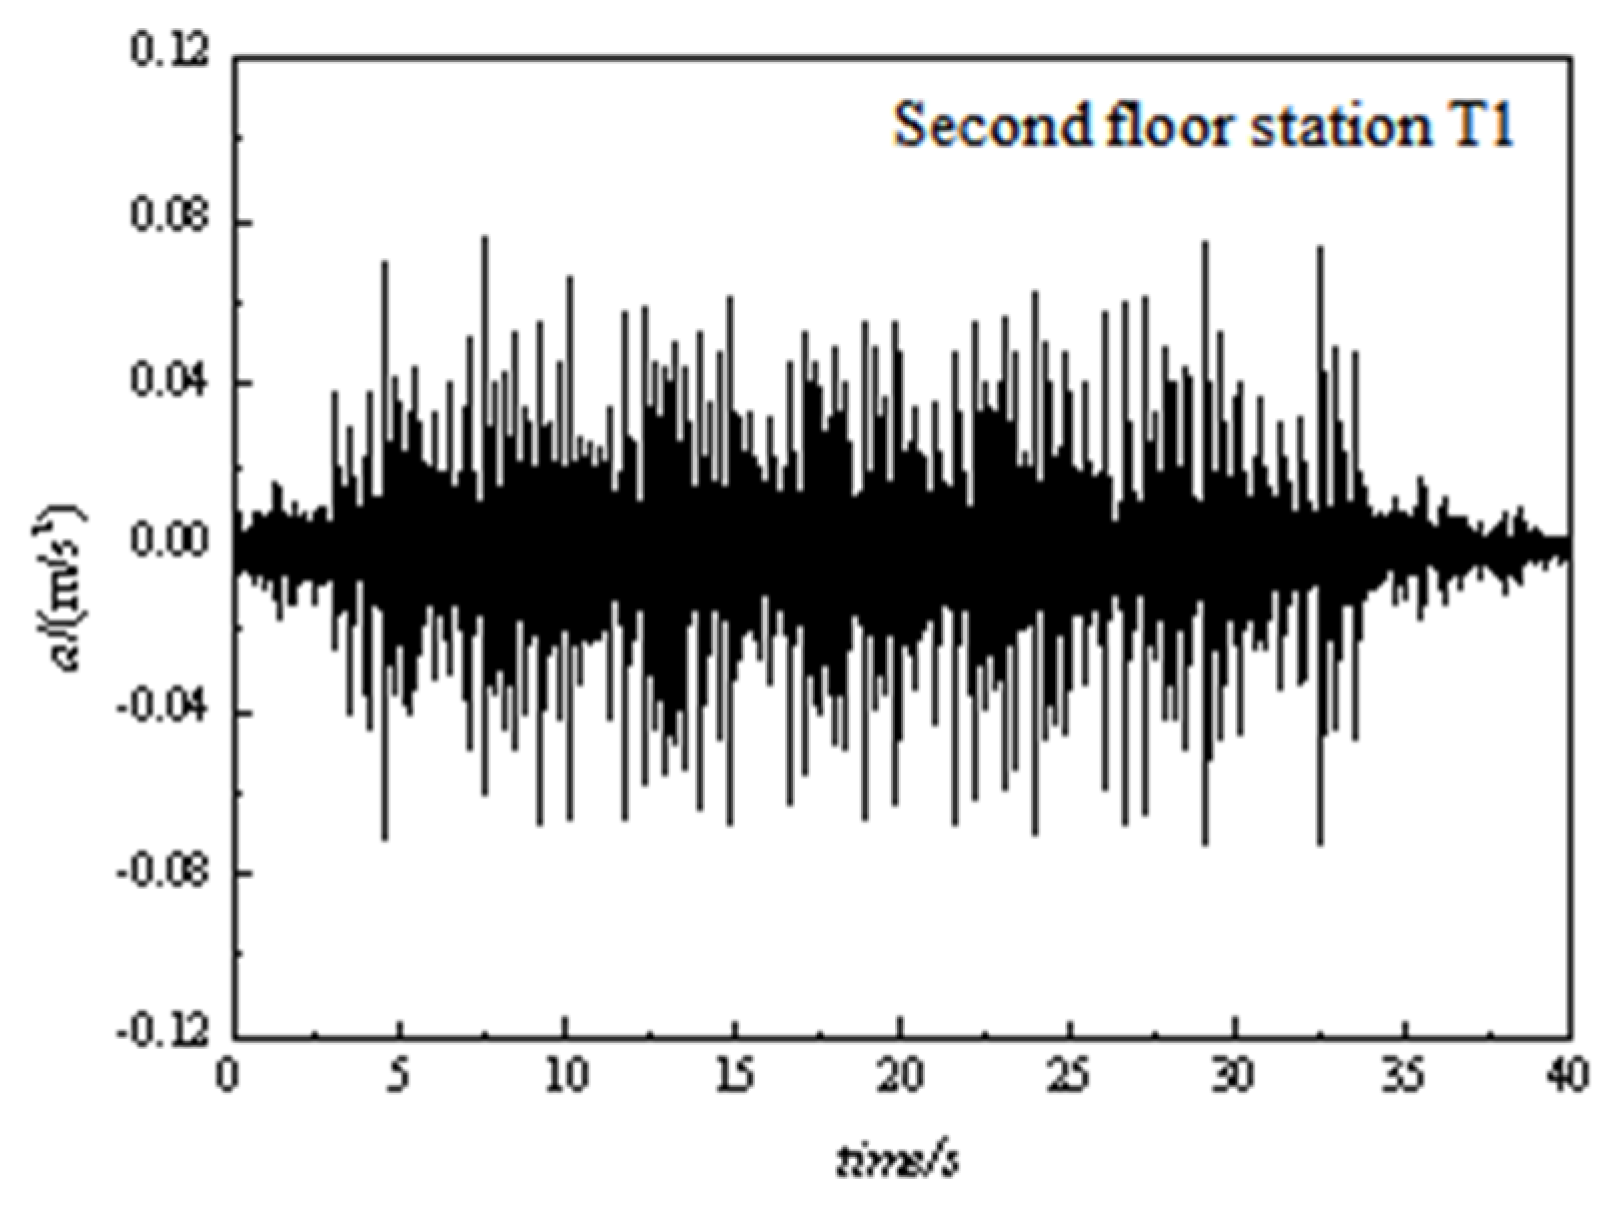
As can be seen from Figure 14, the section 5 times curve train passage time is approximately 32 seconds and the train speed is approximately 14 km/h, which is in line with the range of train operating speeds in the throat area and easily identifies the wave crests generated by the front and rear wheels. The vertical acceleration values are then in the range of -0.08 to 0.08 m/s2, with a peak acceleration of 0.077 m/s2.
The distance between the measurement point and the nearest track is known to be 5 m. Comparing the second level kindergarten measurement point Y6 in section 3, which is 15.6 m from the track, it is found that after about 10m of attenuation, the vertical acceleration of the vibration due to the operation of the metro train attenuates by about 0.02 m/s2. It can be seen that as the distance to the source increases, a corresponding attenuation of vibration occurs in the process.

3.2. Frequency domain analysis

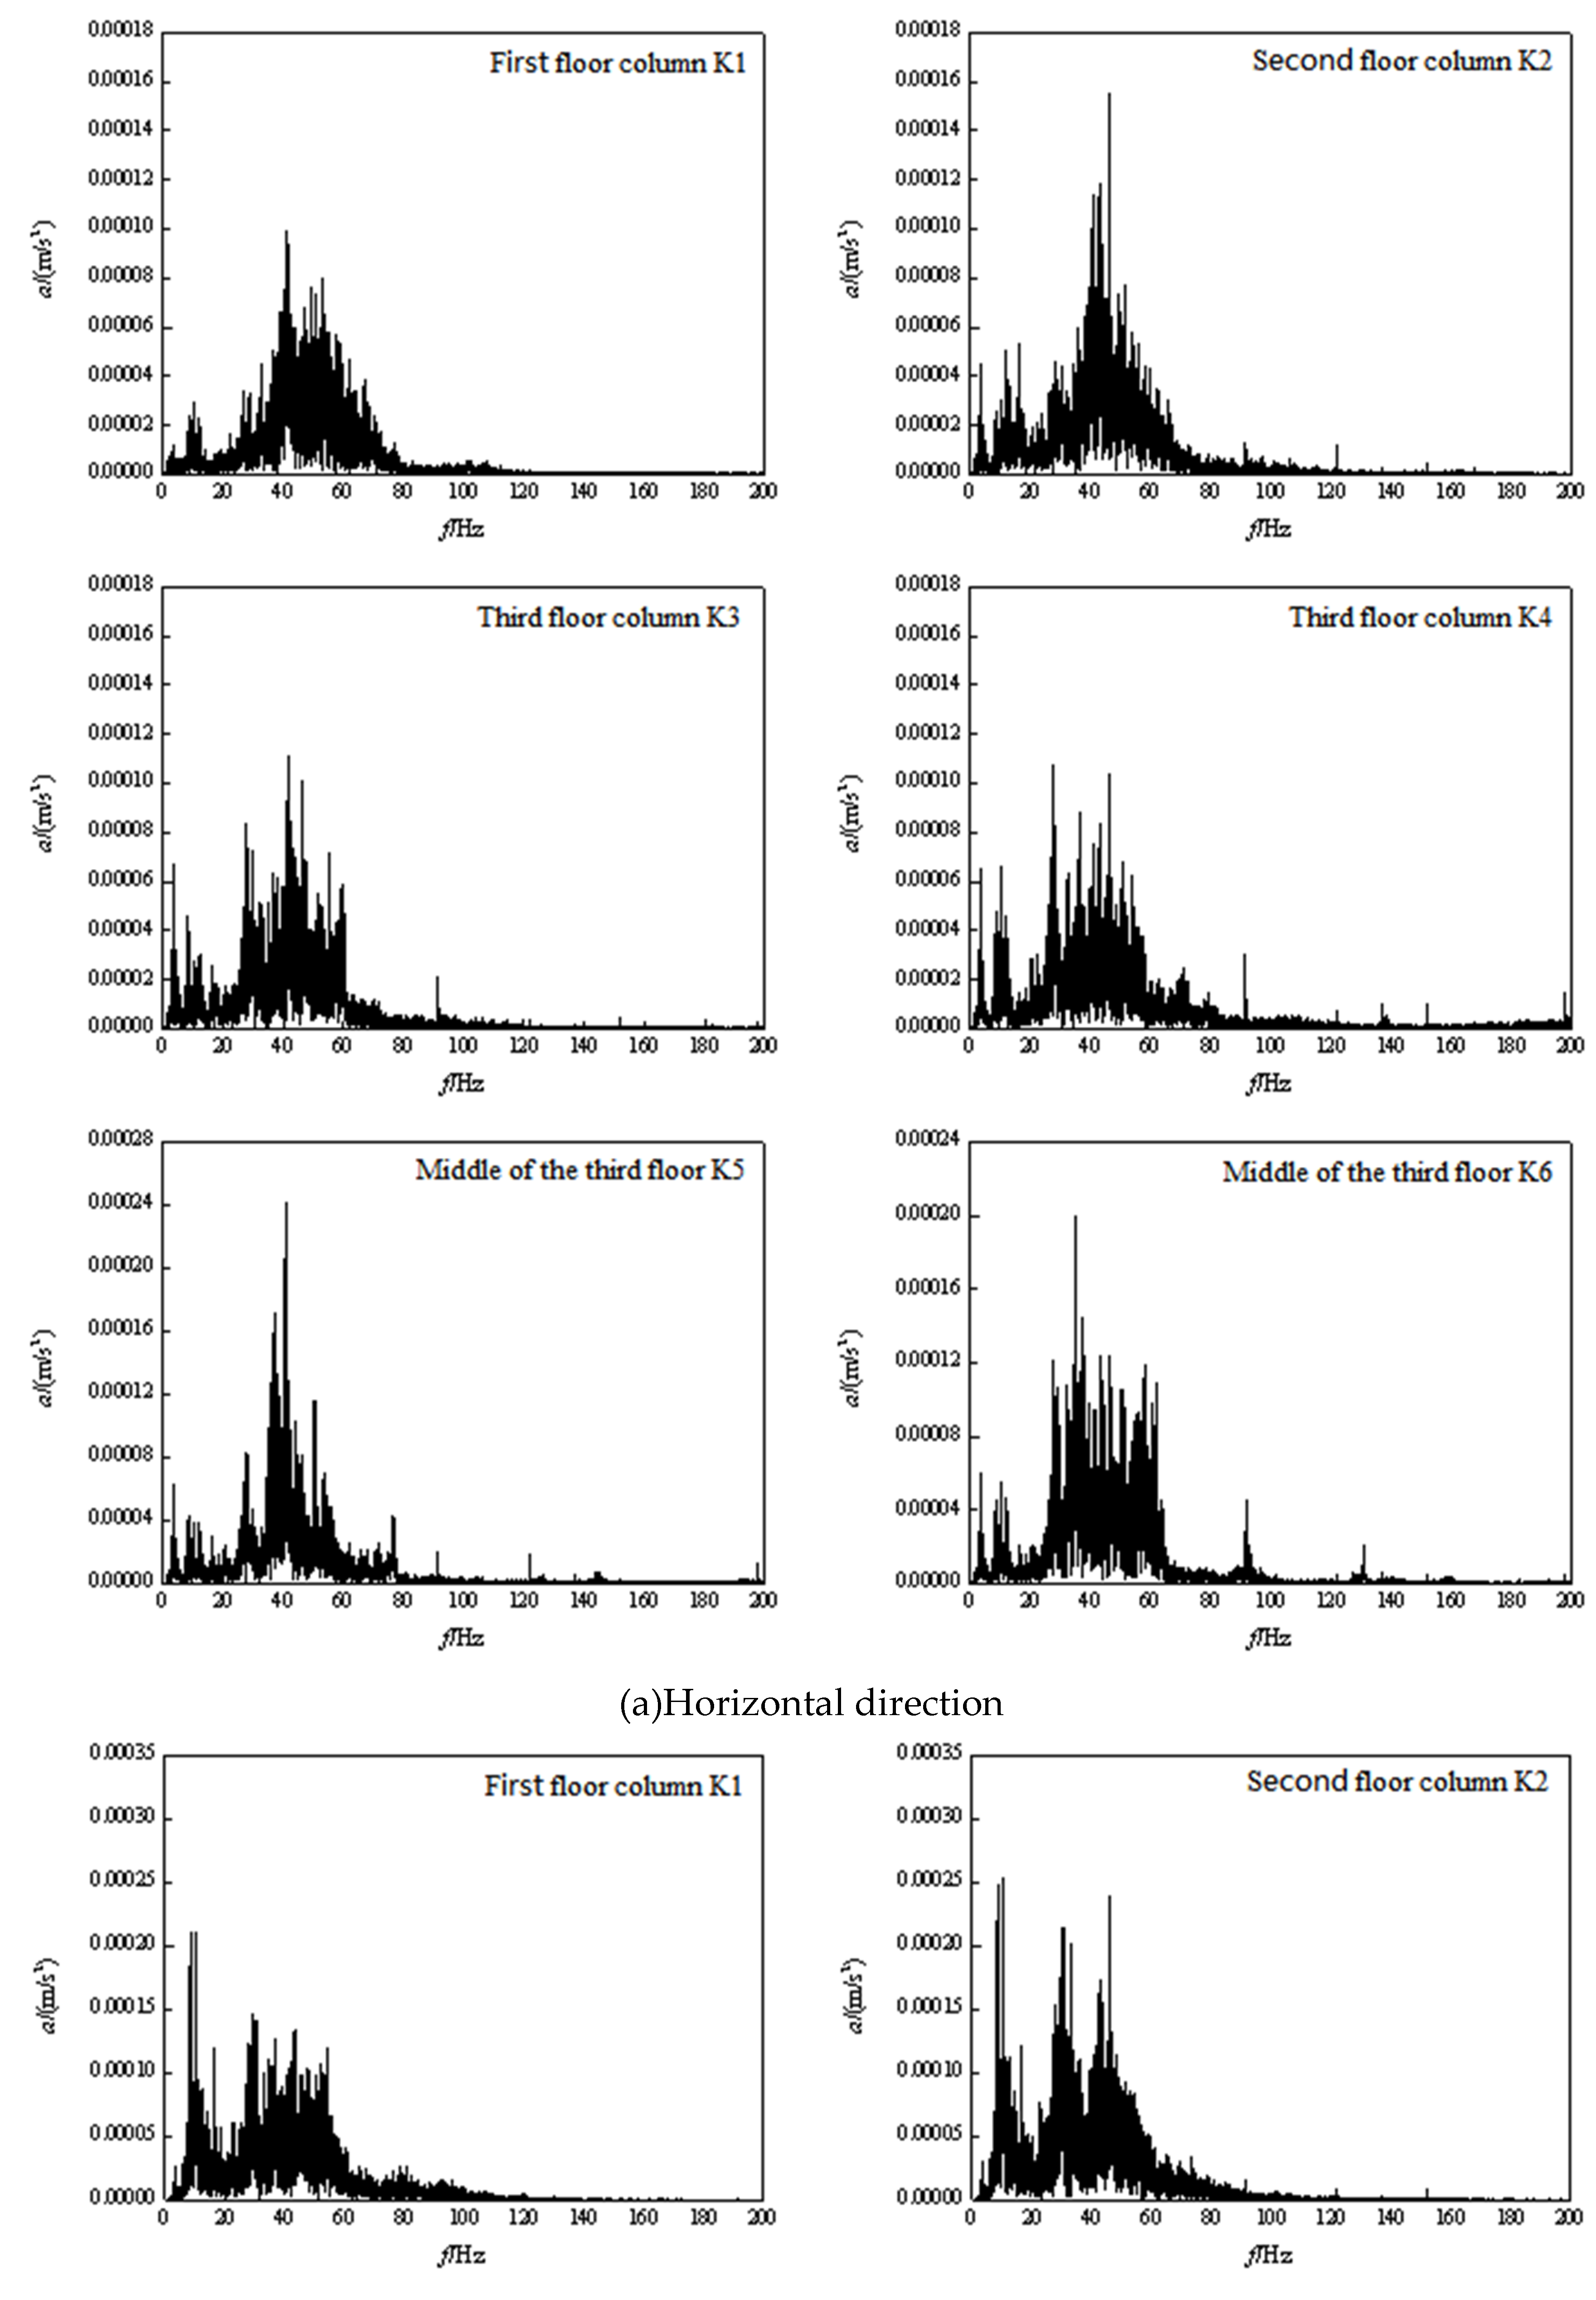
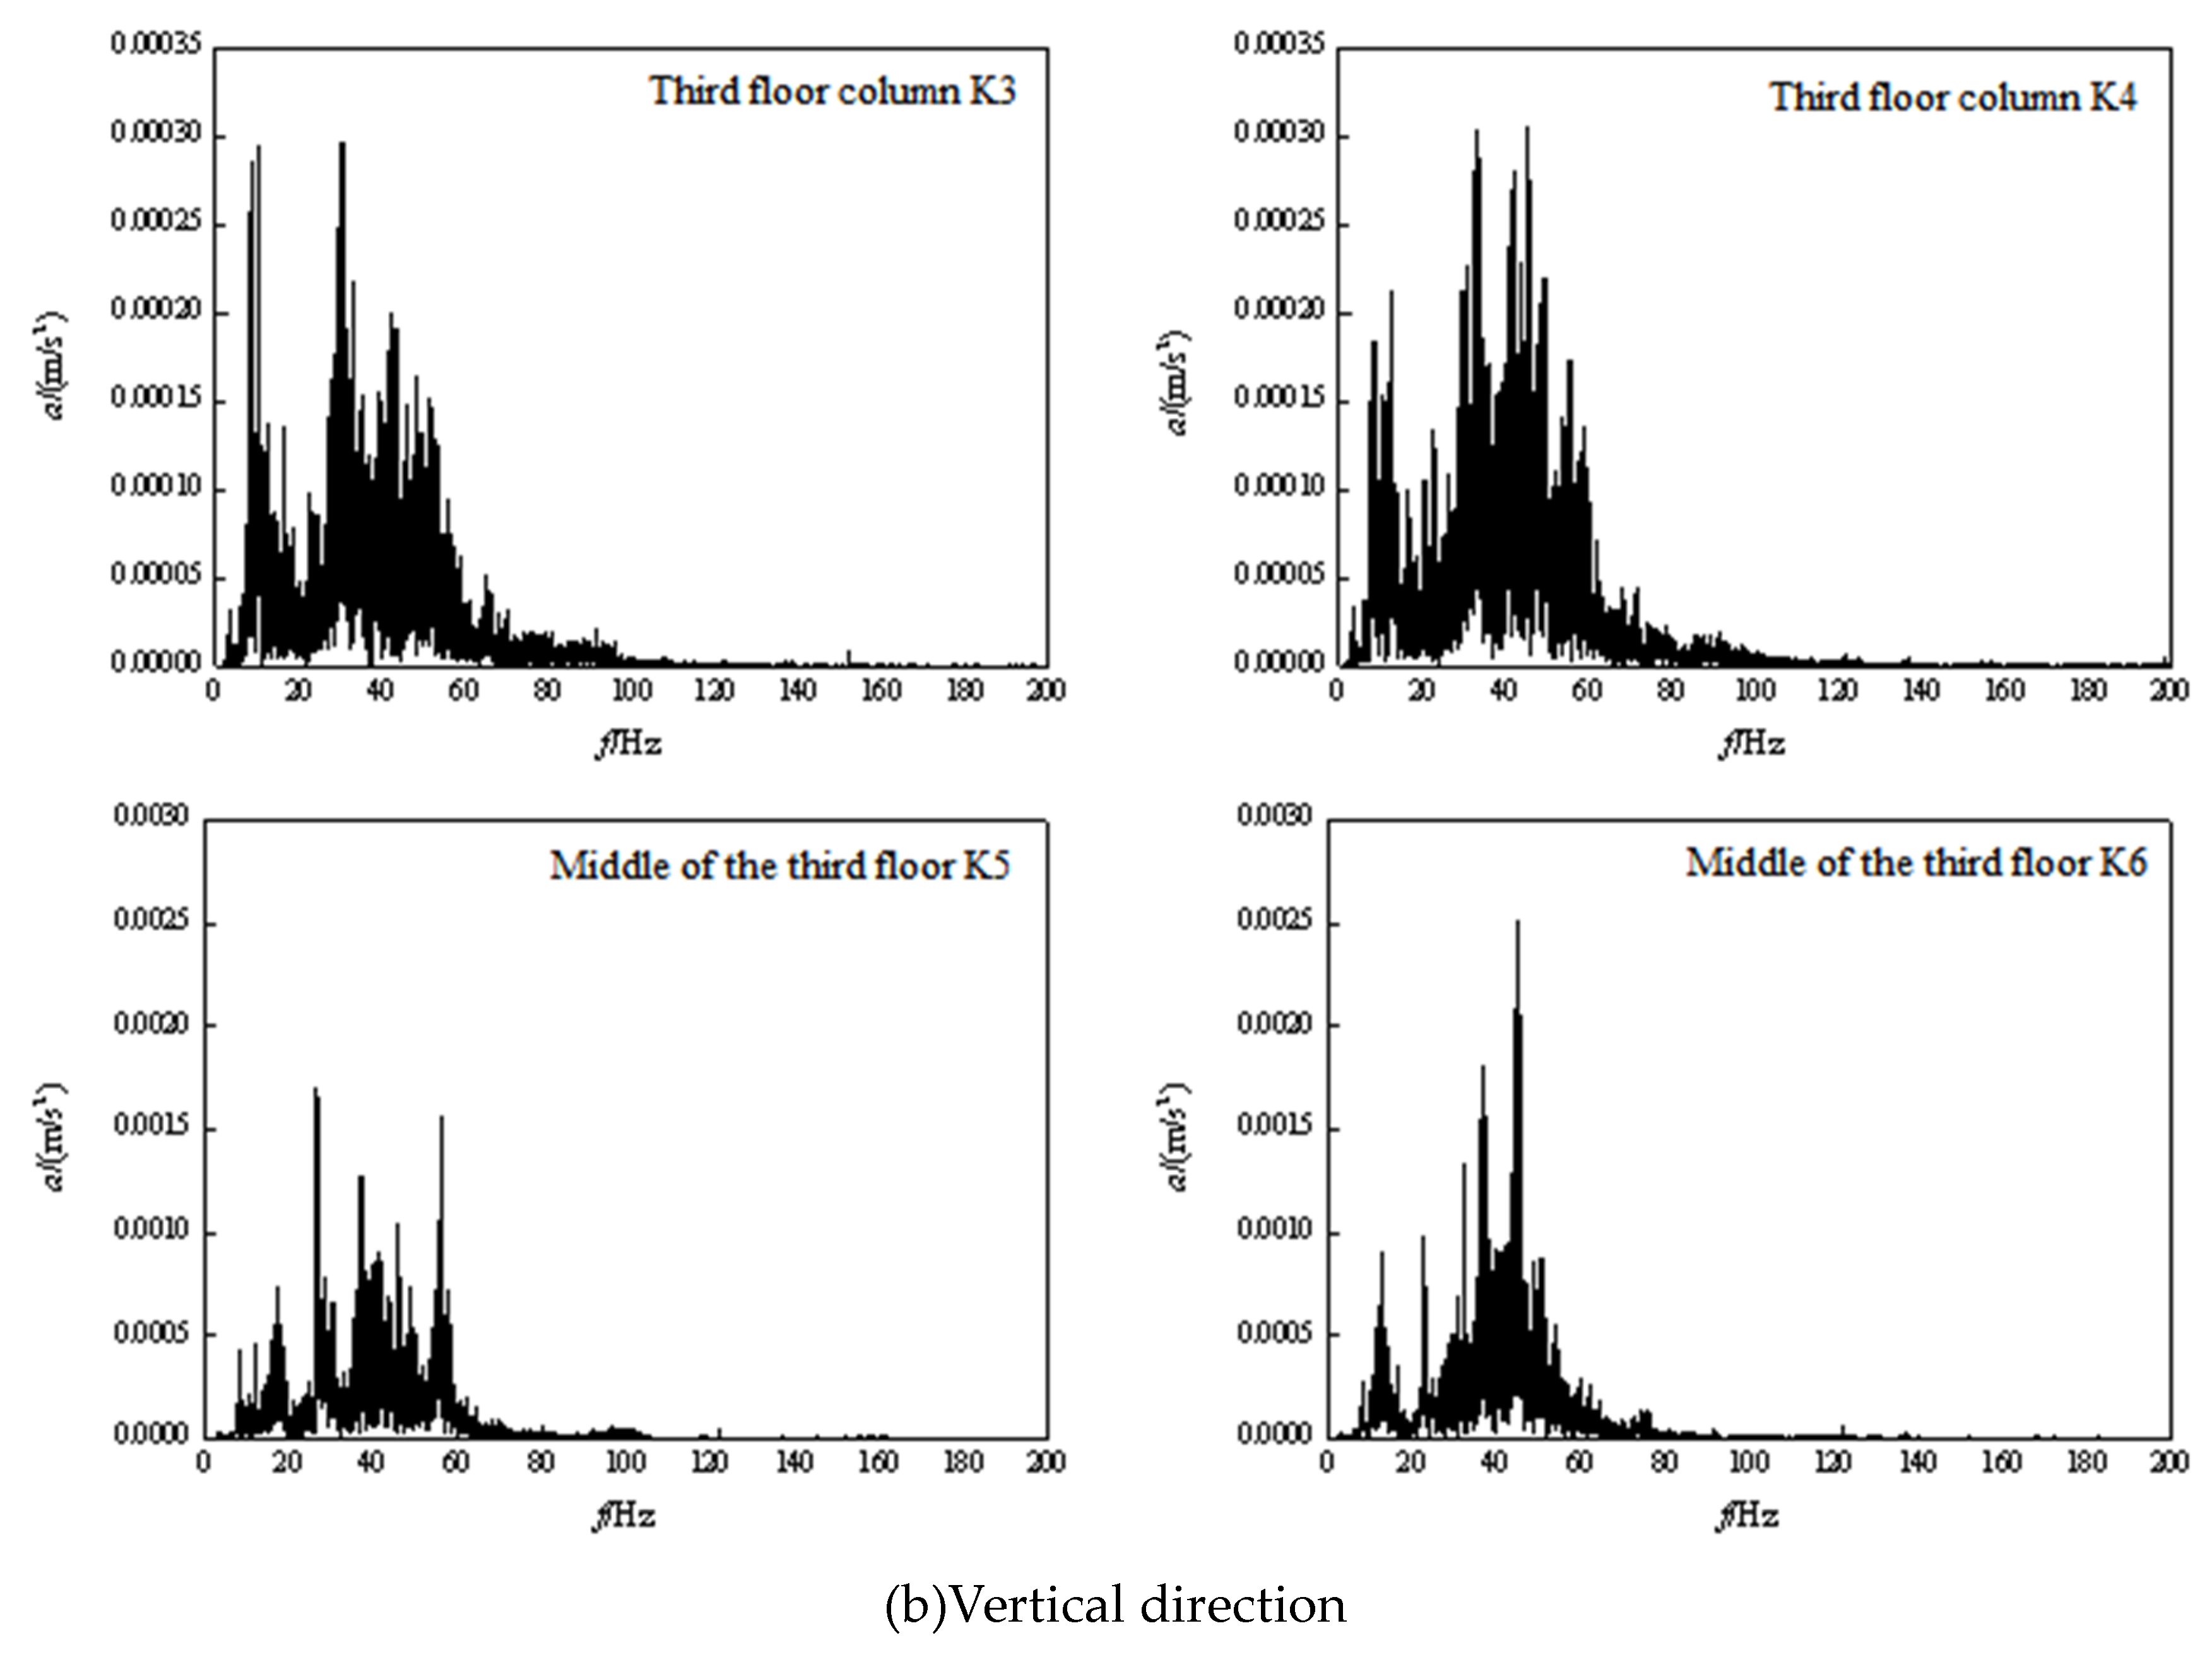
In order to study in depth the frequency structure of the vibration triggered by the operation of the train in the vehicle section, reveal the vibration signal each frequency composition and the size of each frequency component, the measured time course data is fast Fourier transformed to obtain the vibration spectrum. Figure 15 shows the spectrum corresponding to the time-domain graph of the car.
The horizontal ground vibration acceleration spectrum response band width in the 0-140Hz are distributed, the peak frequency band is mainly concentrated in the vicinity of 40-60 Hz; vertical band width is slightly narrower than the horizontal direction, distributed in the 0-120 Hz, the dominant frequency band is 40-60 Hz, the frequency band of the measurement point in the plate is mainly distributed in the 0-80 Hz, slightly narrower than the band width of the measurement point next to the column.
Comparing the measurement points K5 and K6, which are 8.5 m away from the track centre line, with the measurement points K7 and K8, which are 18.9 m apart, it is found that the vibration amplitude in the main response band of 20-60 Hz decreases as the distance from the track increases.
Looking at the frequency bands of the points in the plate and the points next to the column, it can be seen that the points next to the column have a peak vibration amplitude in the low frequency band around 10 Hz.
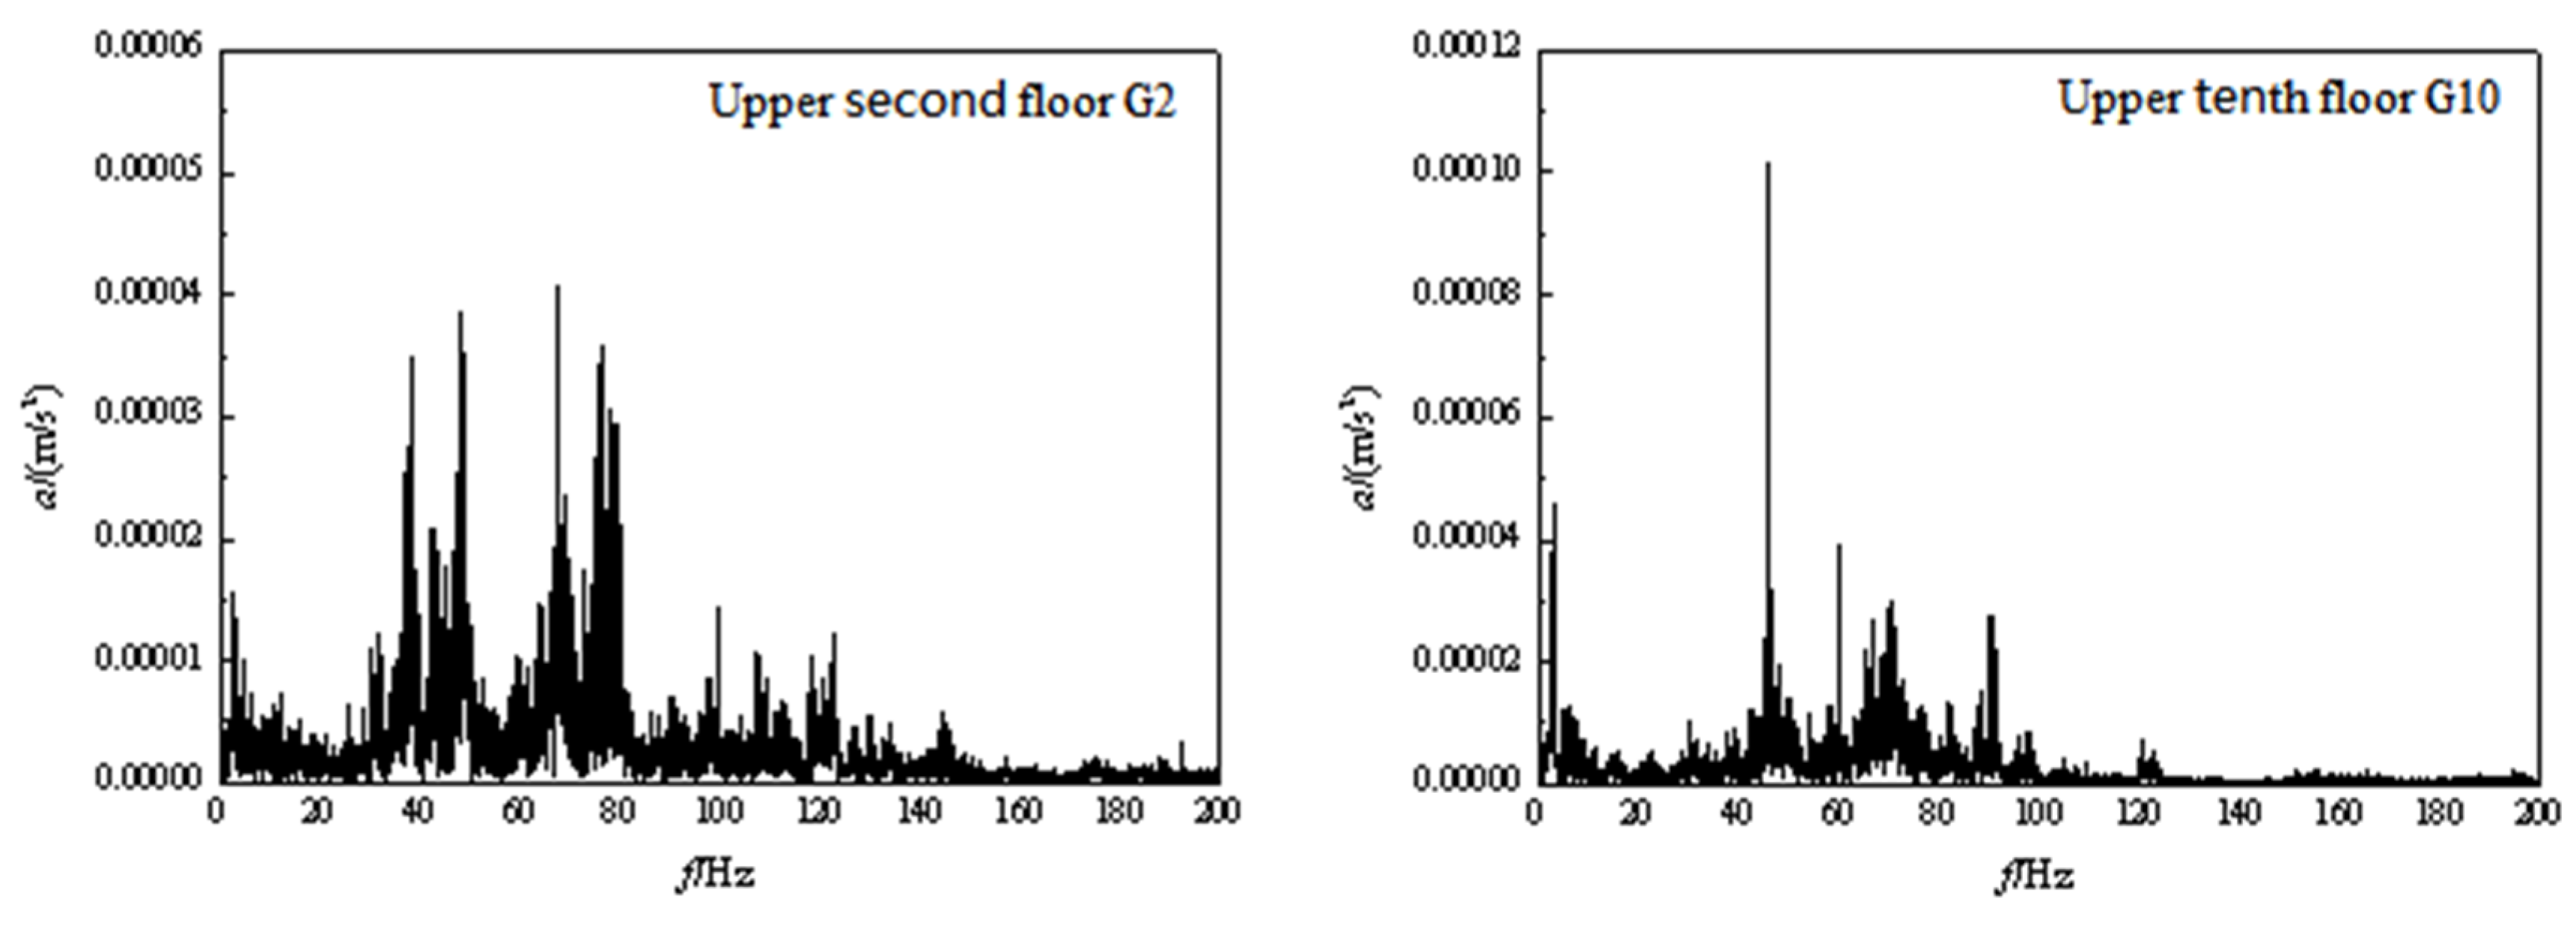
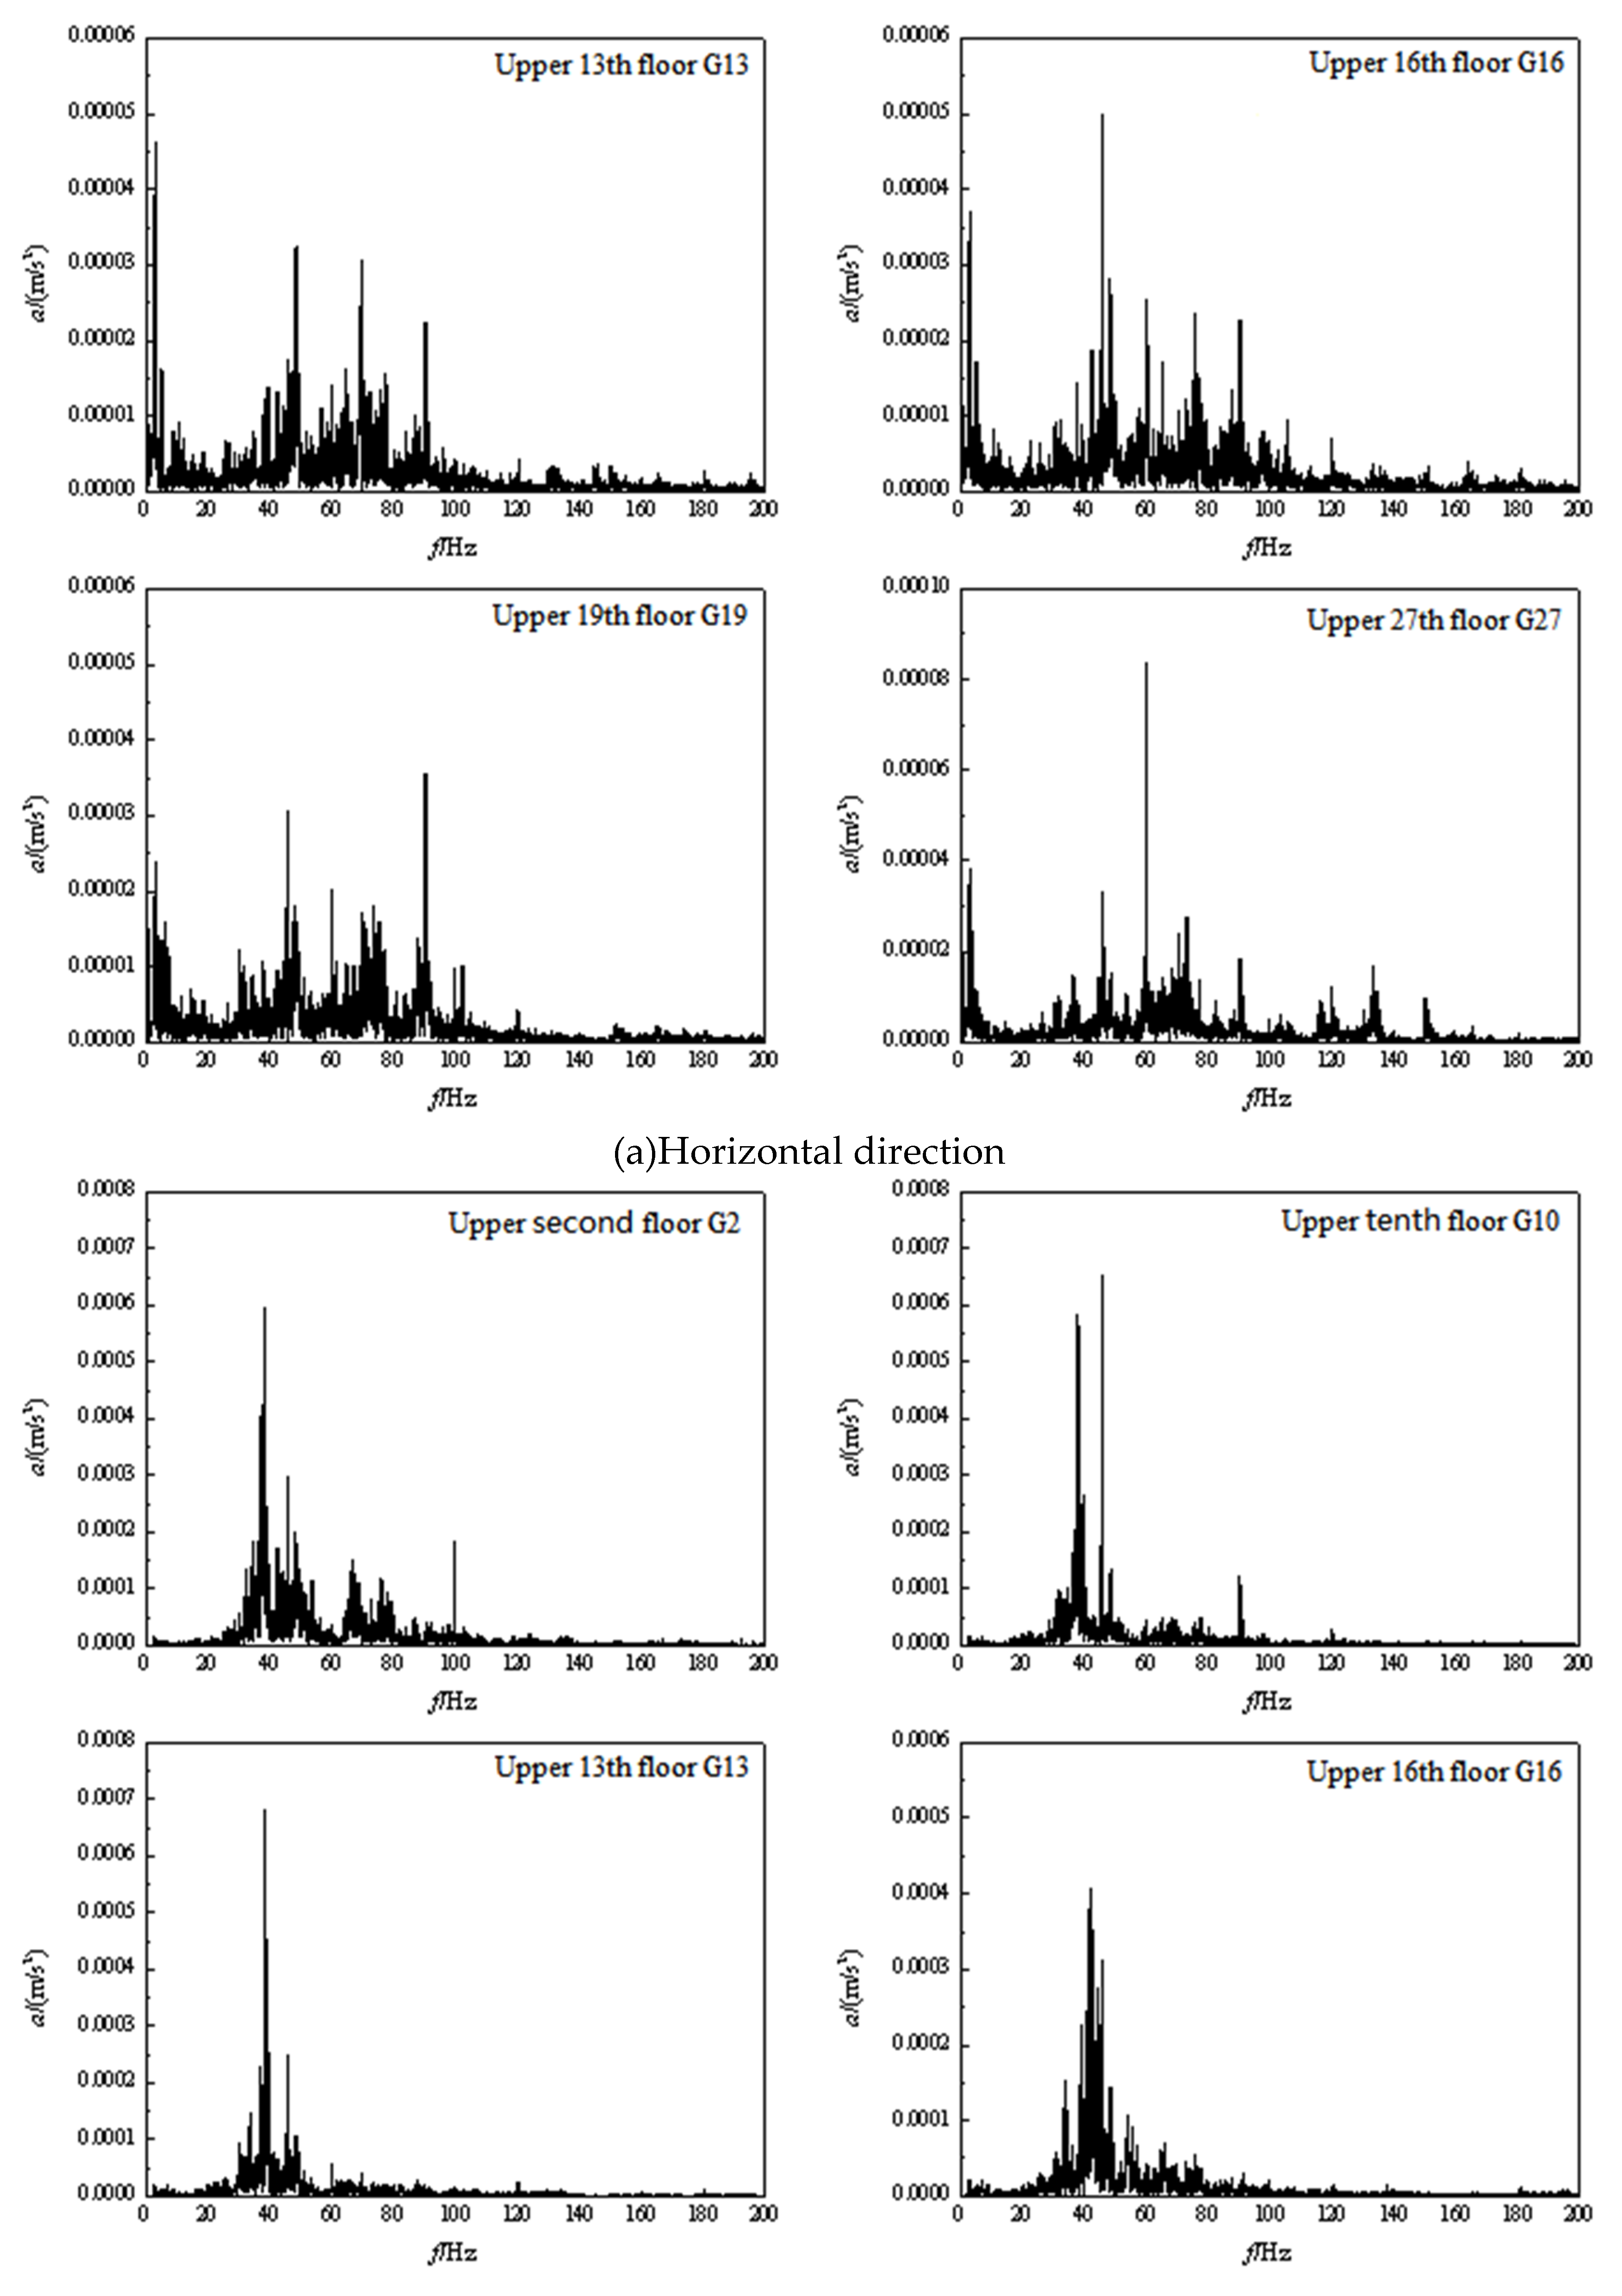
Similar to section 1, the measured acceleration time range of section 2 was fast Fourier transformed to obtain the corresponding Fourier spectrum, Figure 16 shows the acceleration spectrum of a measured vehicle vibration at each measurement point.
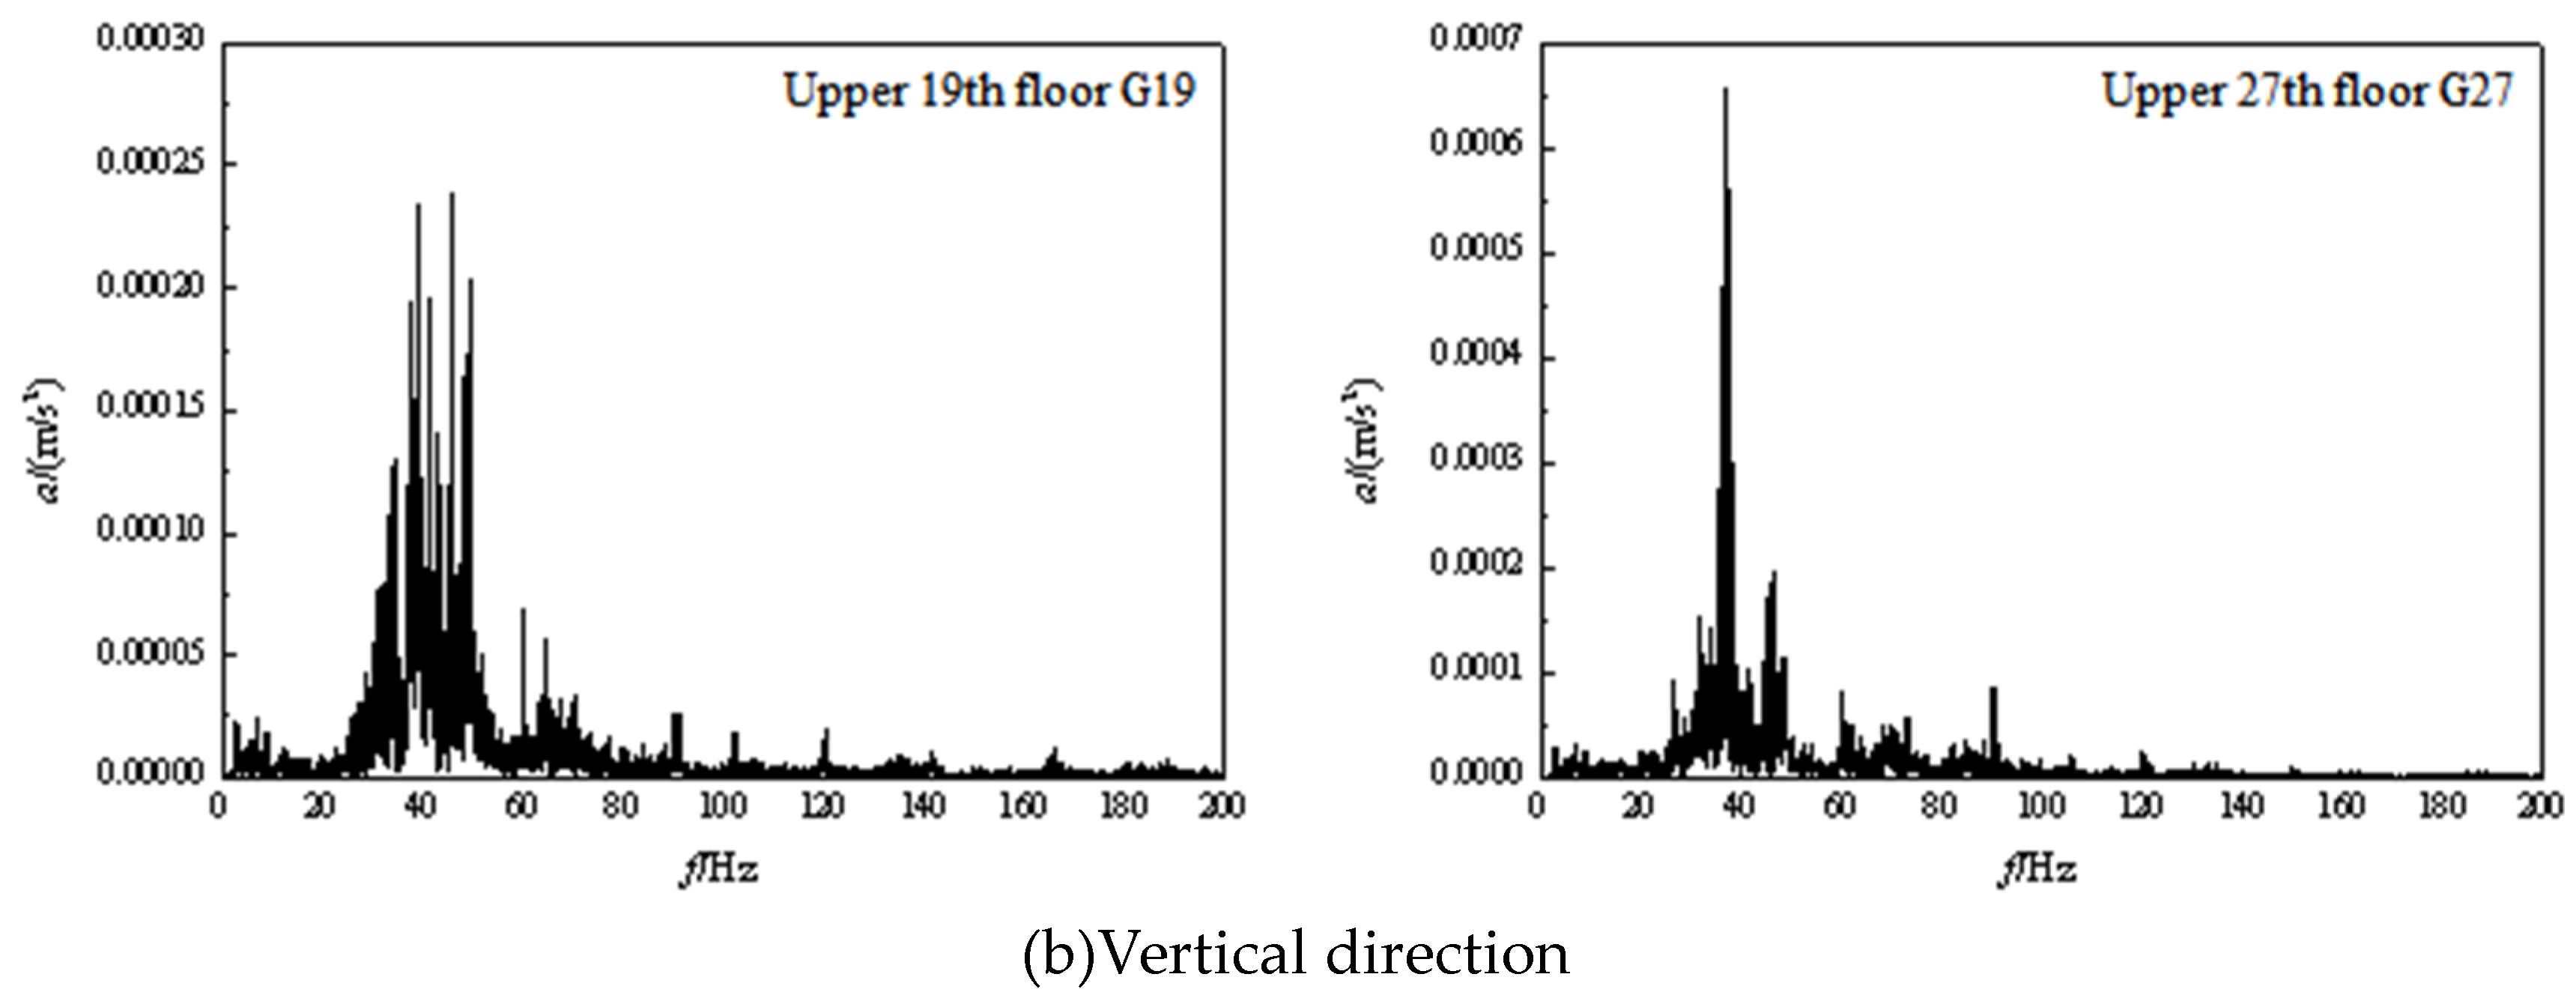
From Figure 16 can be seen, and section 1 is different, section 2 horizontal vibration response band width distribution is wider, covering 0-200 Hz, the main vibration frequency is not the same, there are high frequency components, in addition to the ground floor measurement point G1 location and vehicle section cover cover connected, the main frequency concentration in 40-60 Hz; the rest of the floor measurement point vibration frequency in the 40-120 Hz band near all There are peaks in the 40-120 Hz range. In the middle floors G13 and G16 there are large peaks in the low frequency region around 10 Hz.
In contrast, the response band width in the vertical direction is narrower and the peaks are more homogeneous. The vibration frequencies in the vertical direction are mainly concentrated in the low and medium frequencies from 20 to 60 Hz, with the peak condition generally occurring around 40 Hz. As the floor increases, the vibration frequency distribution gradually homogenises, the high frequency component decreases and the main frequency range is concentrated.
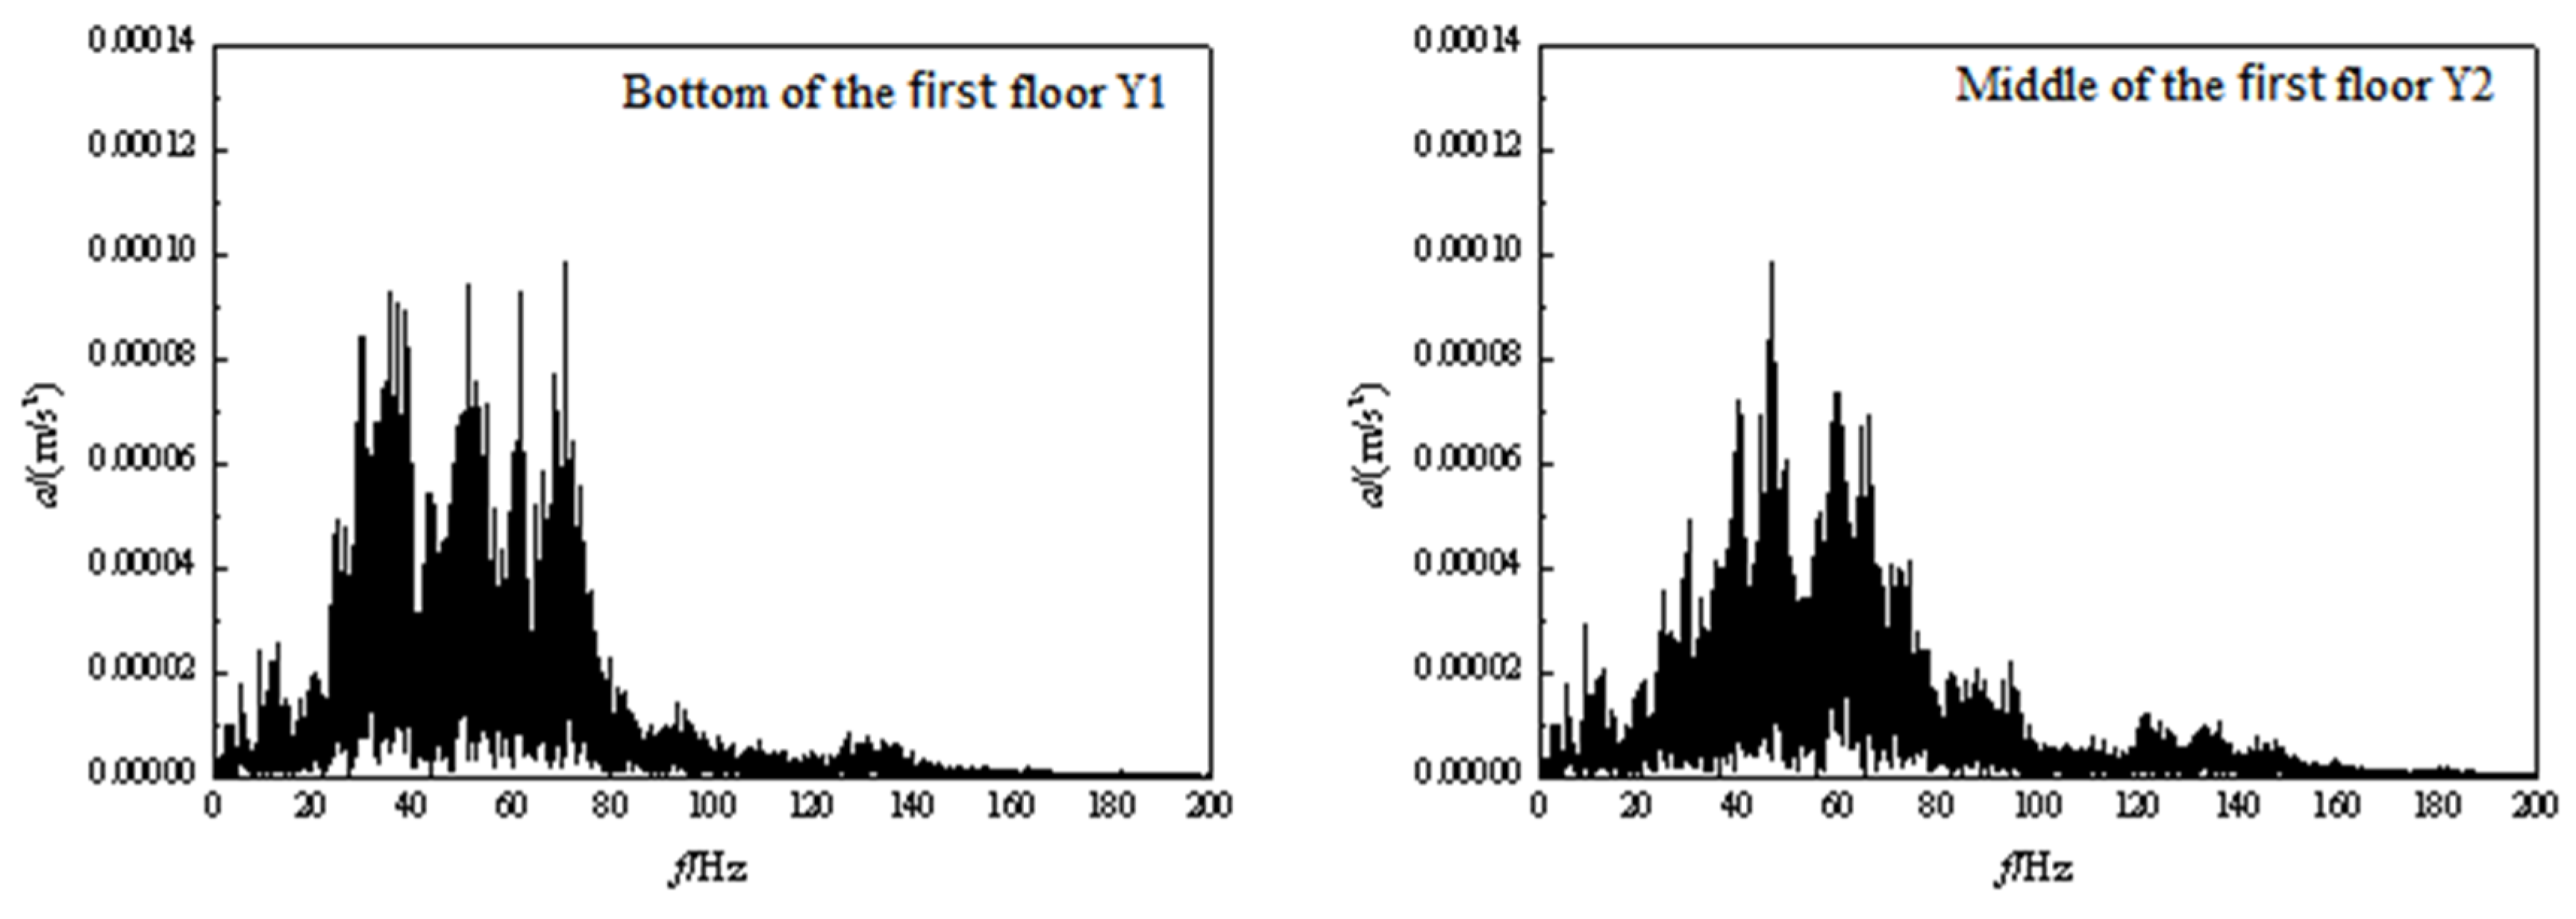
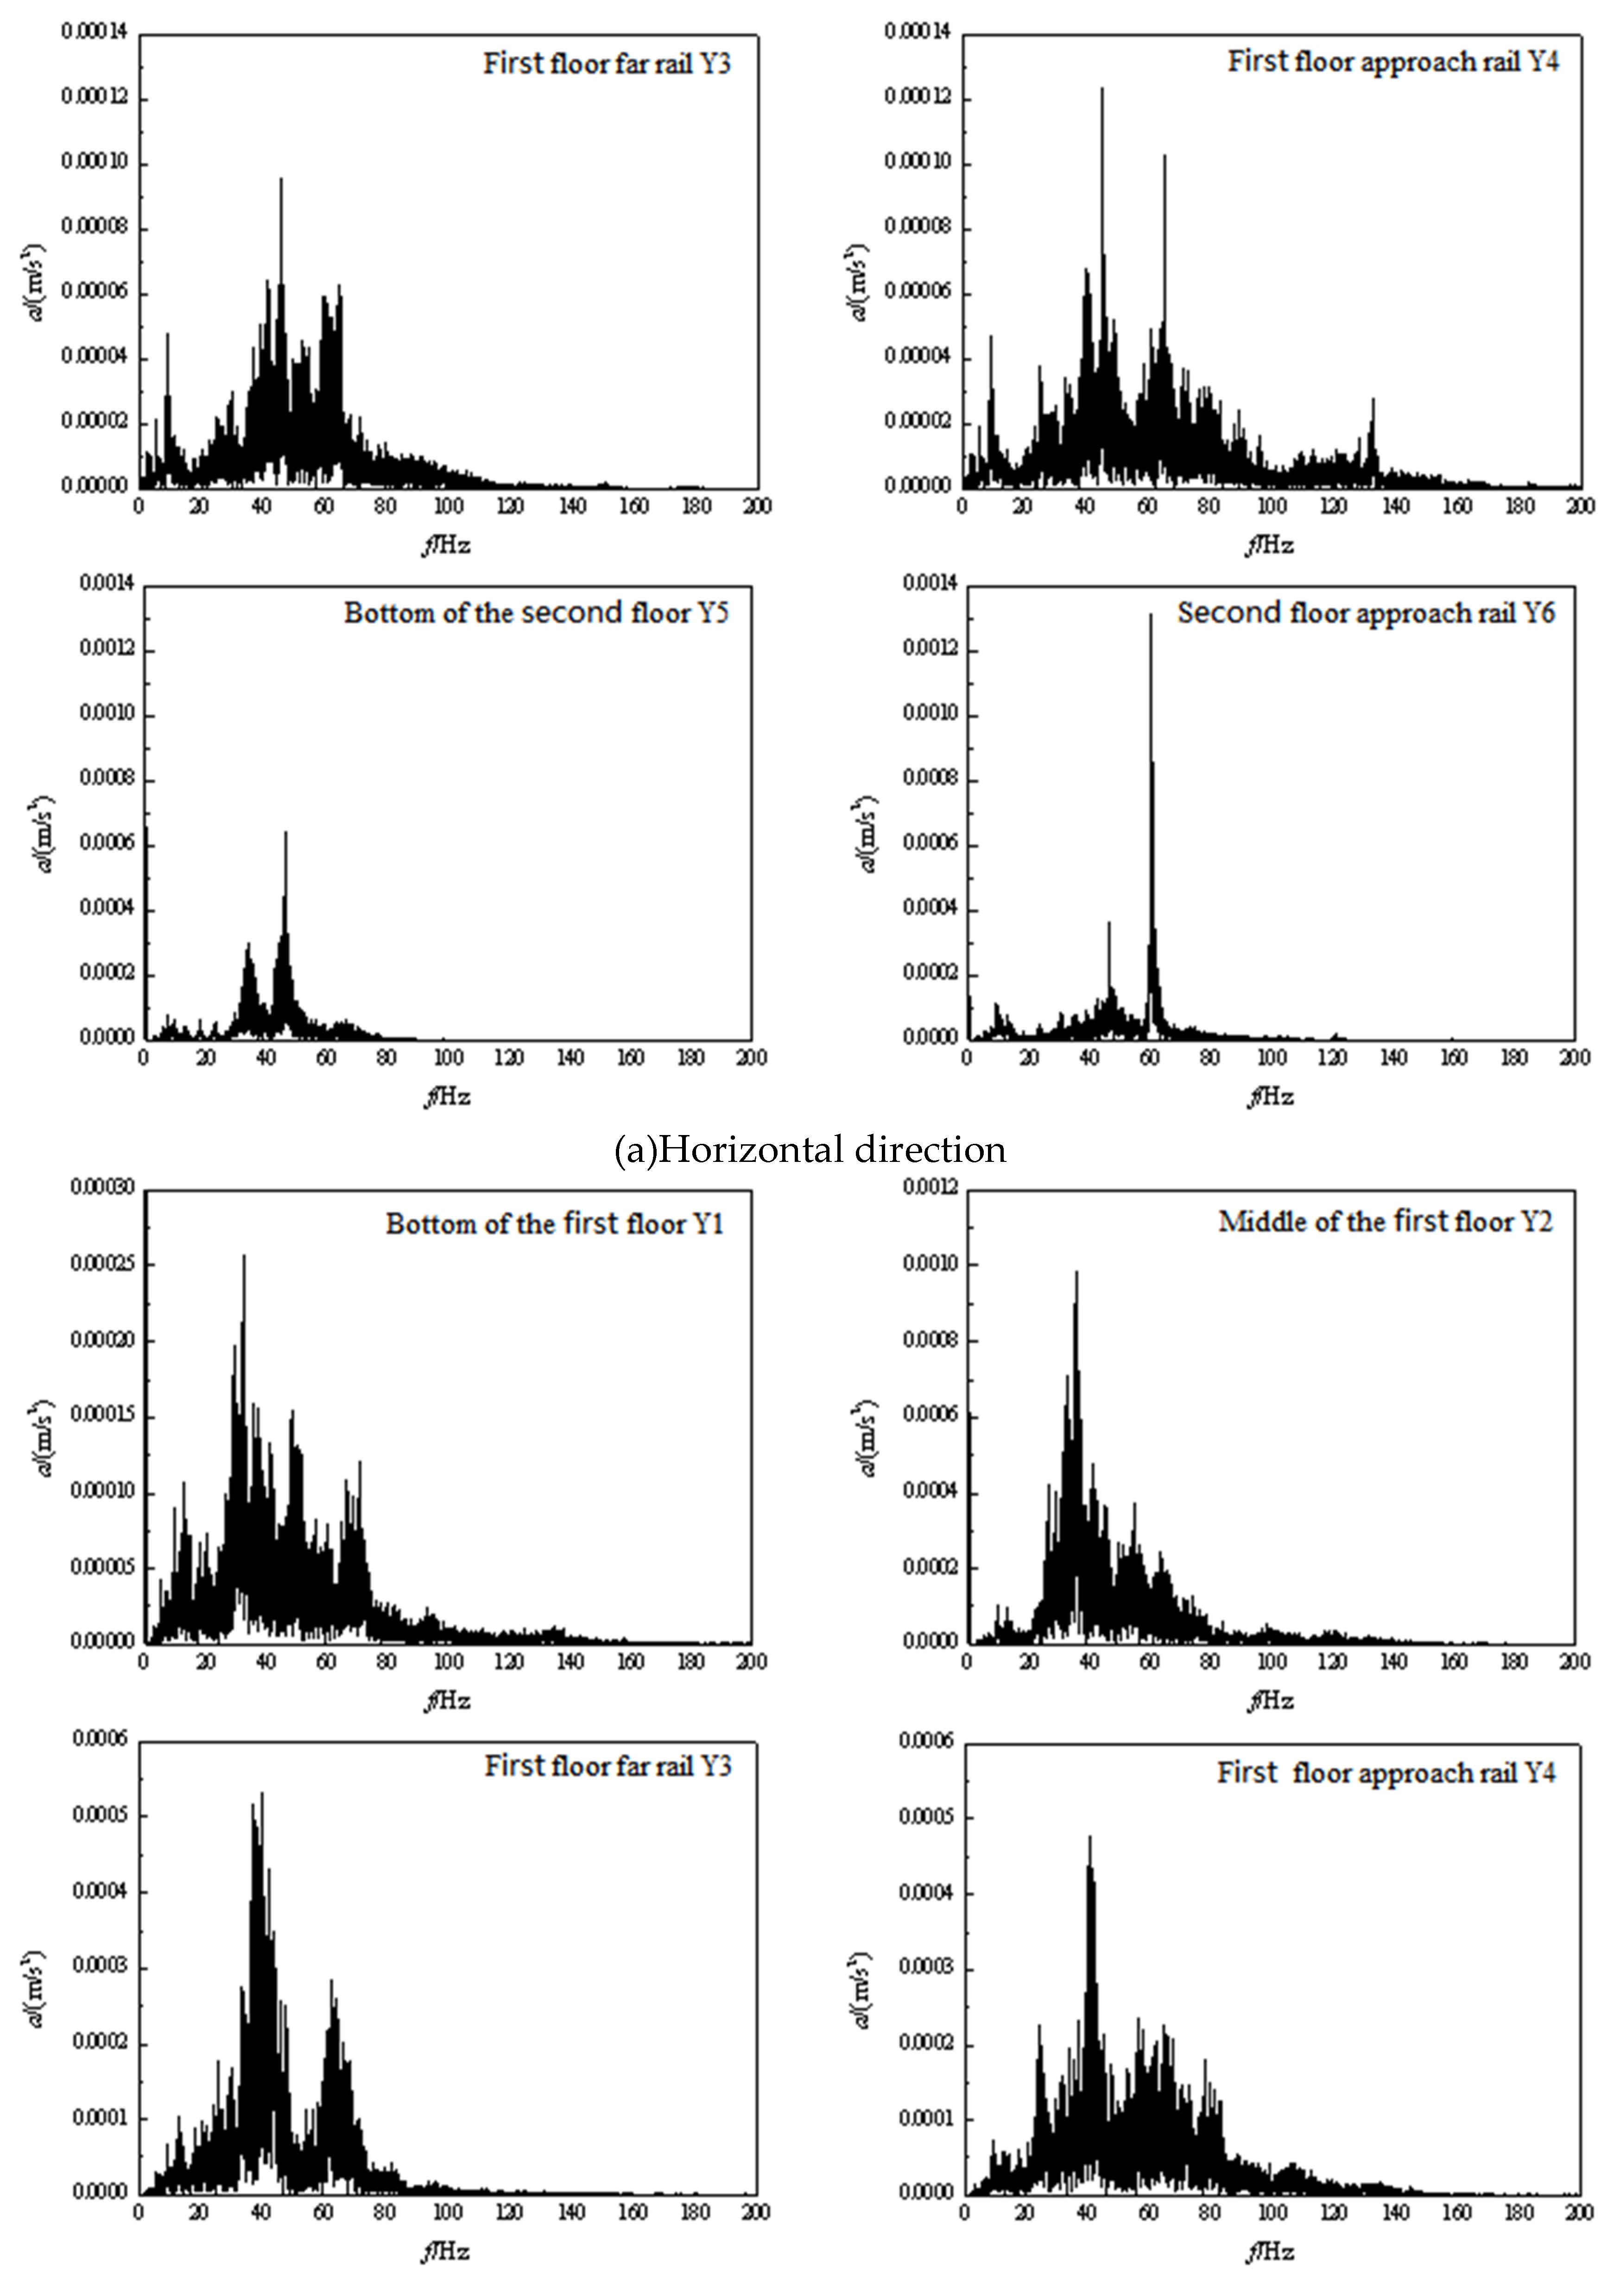
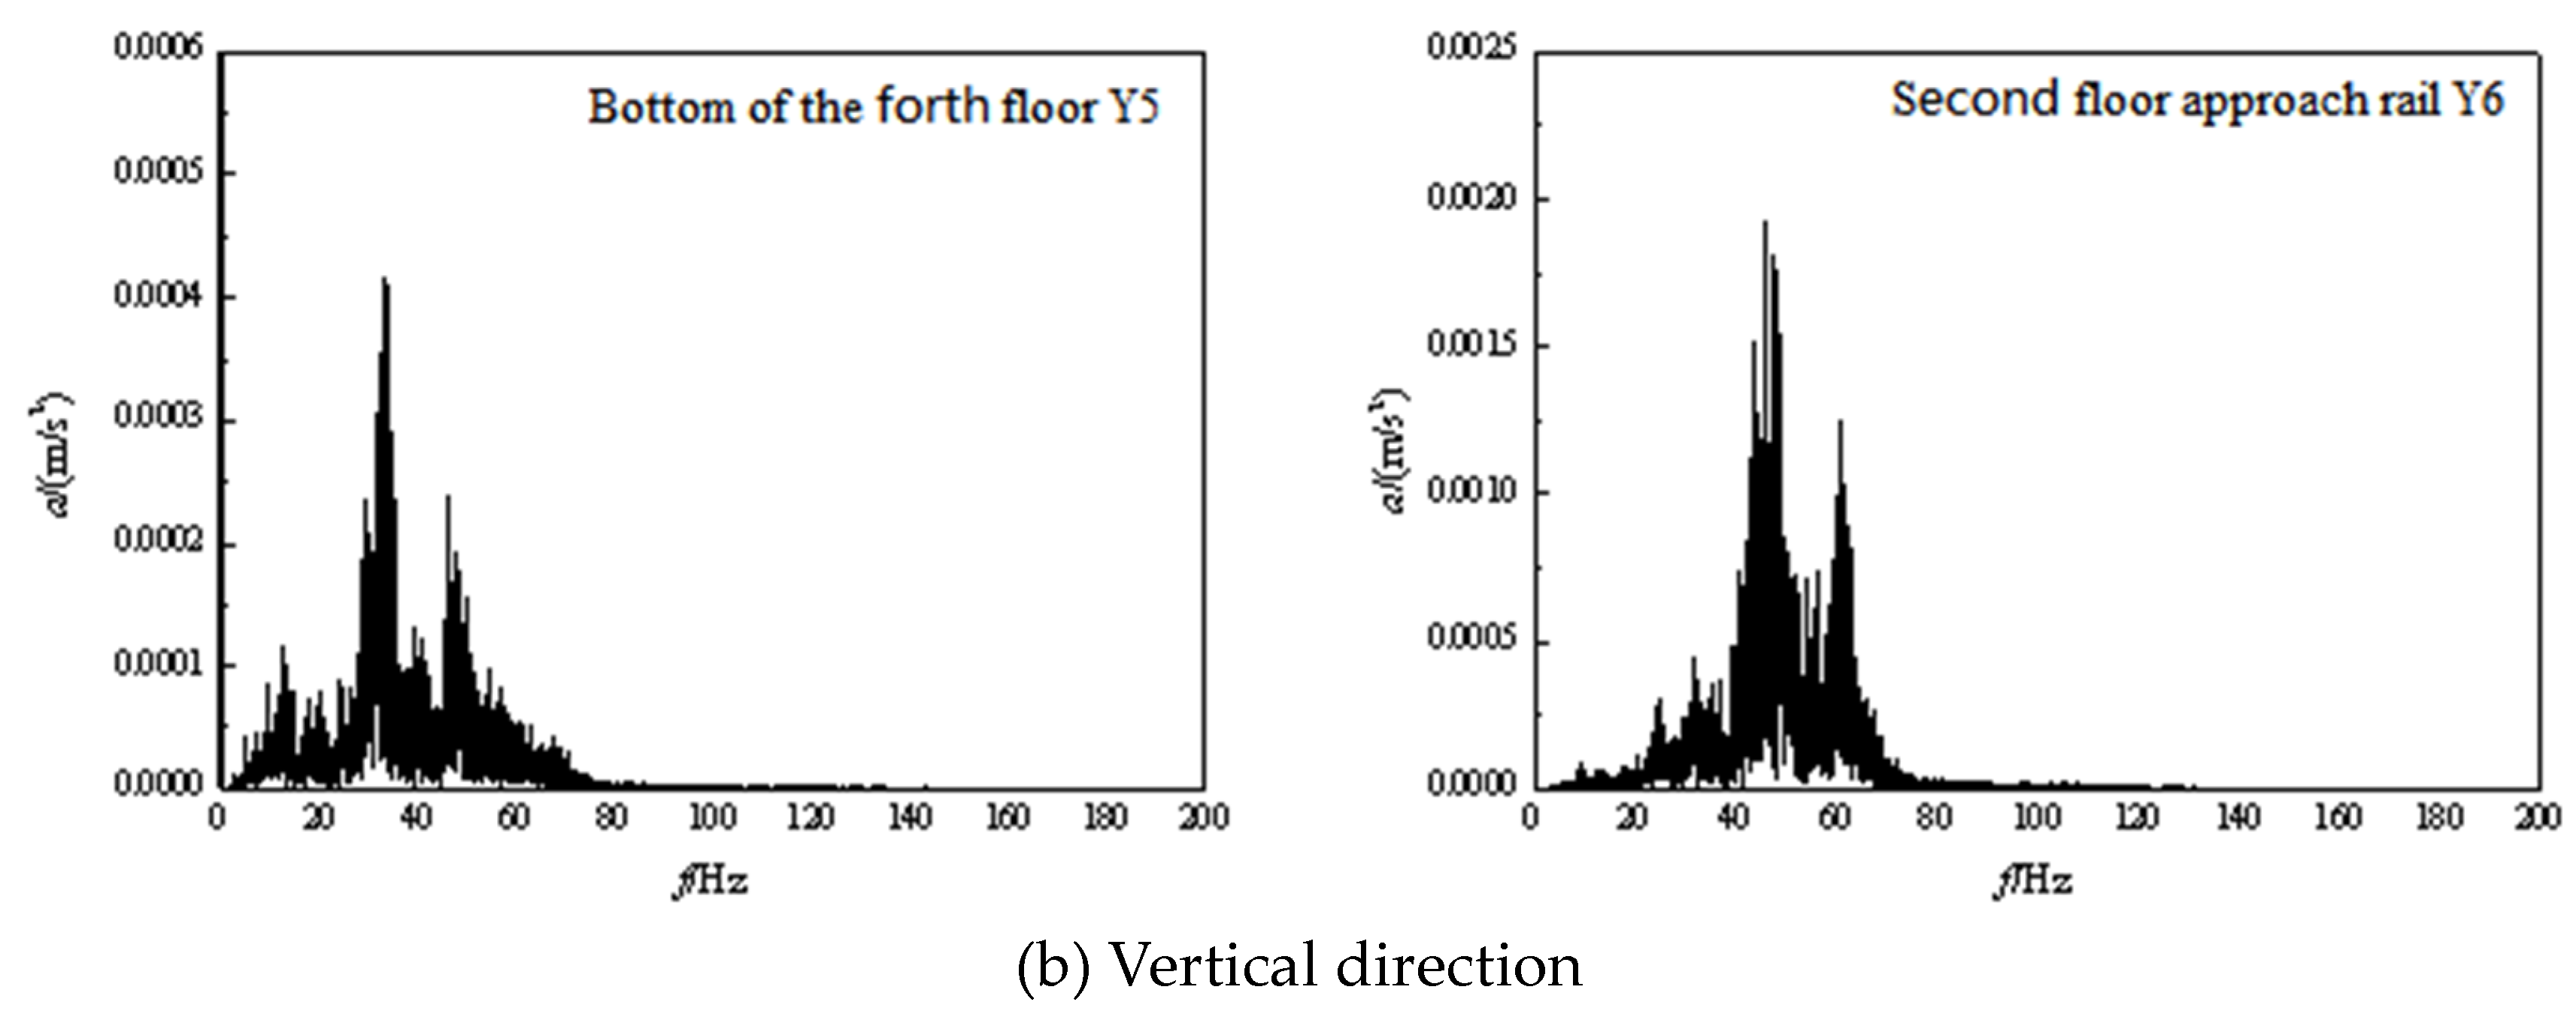
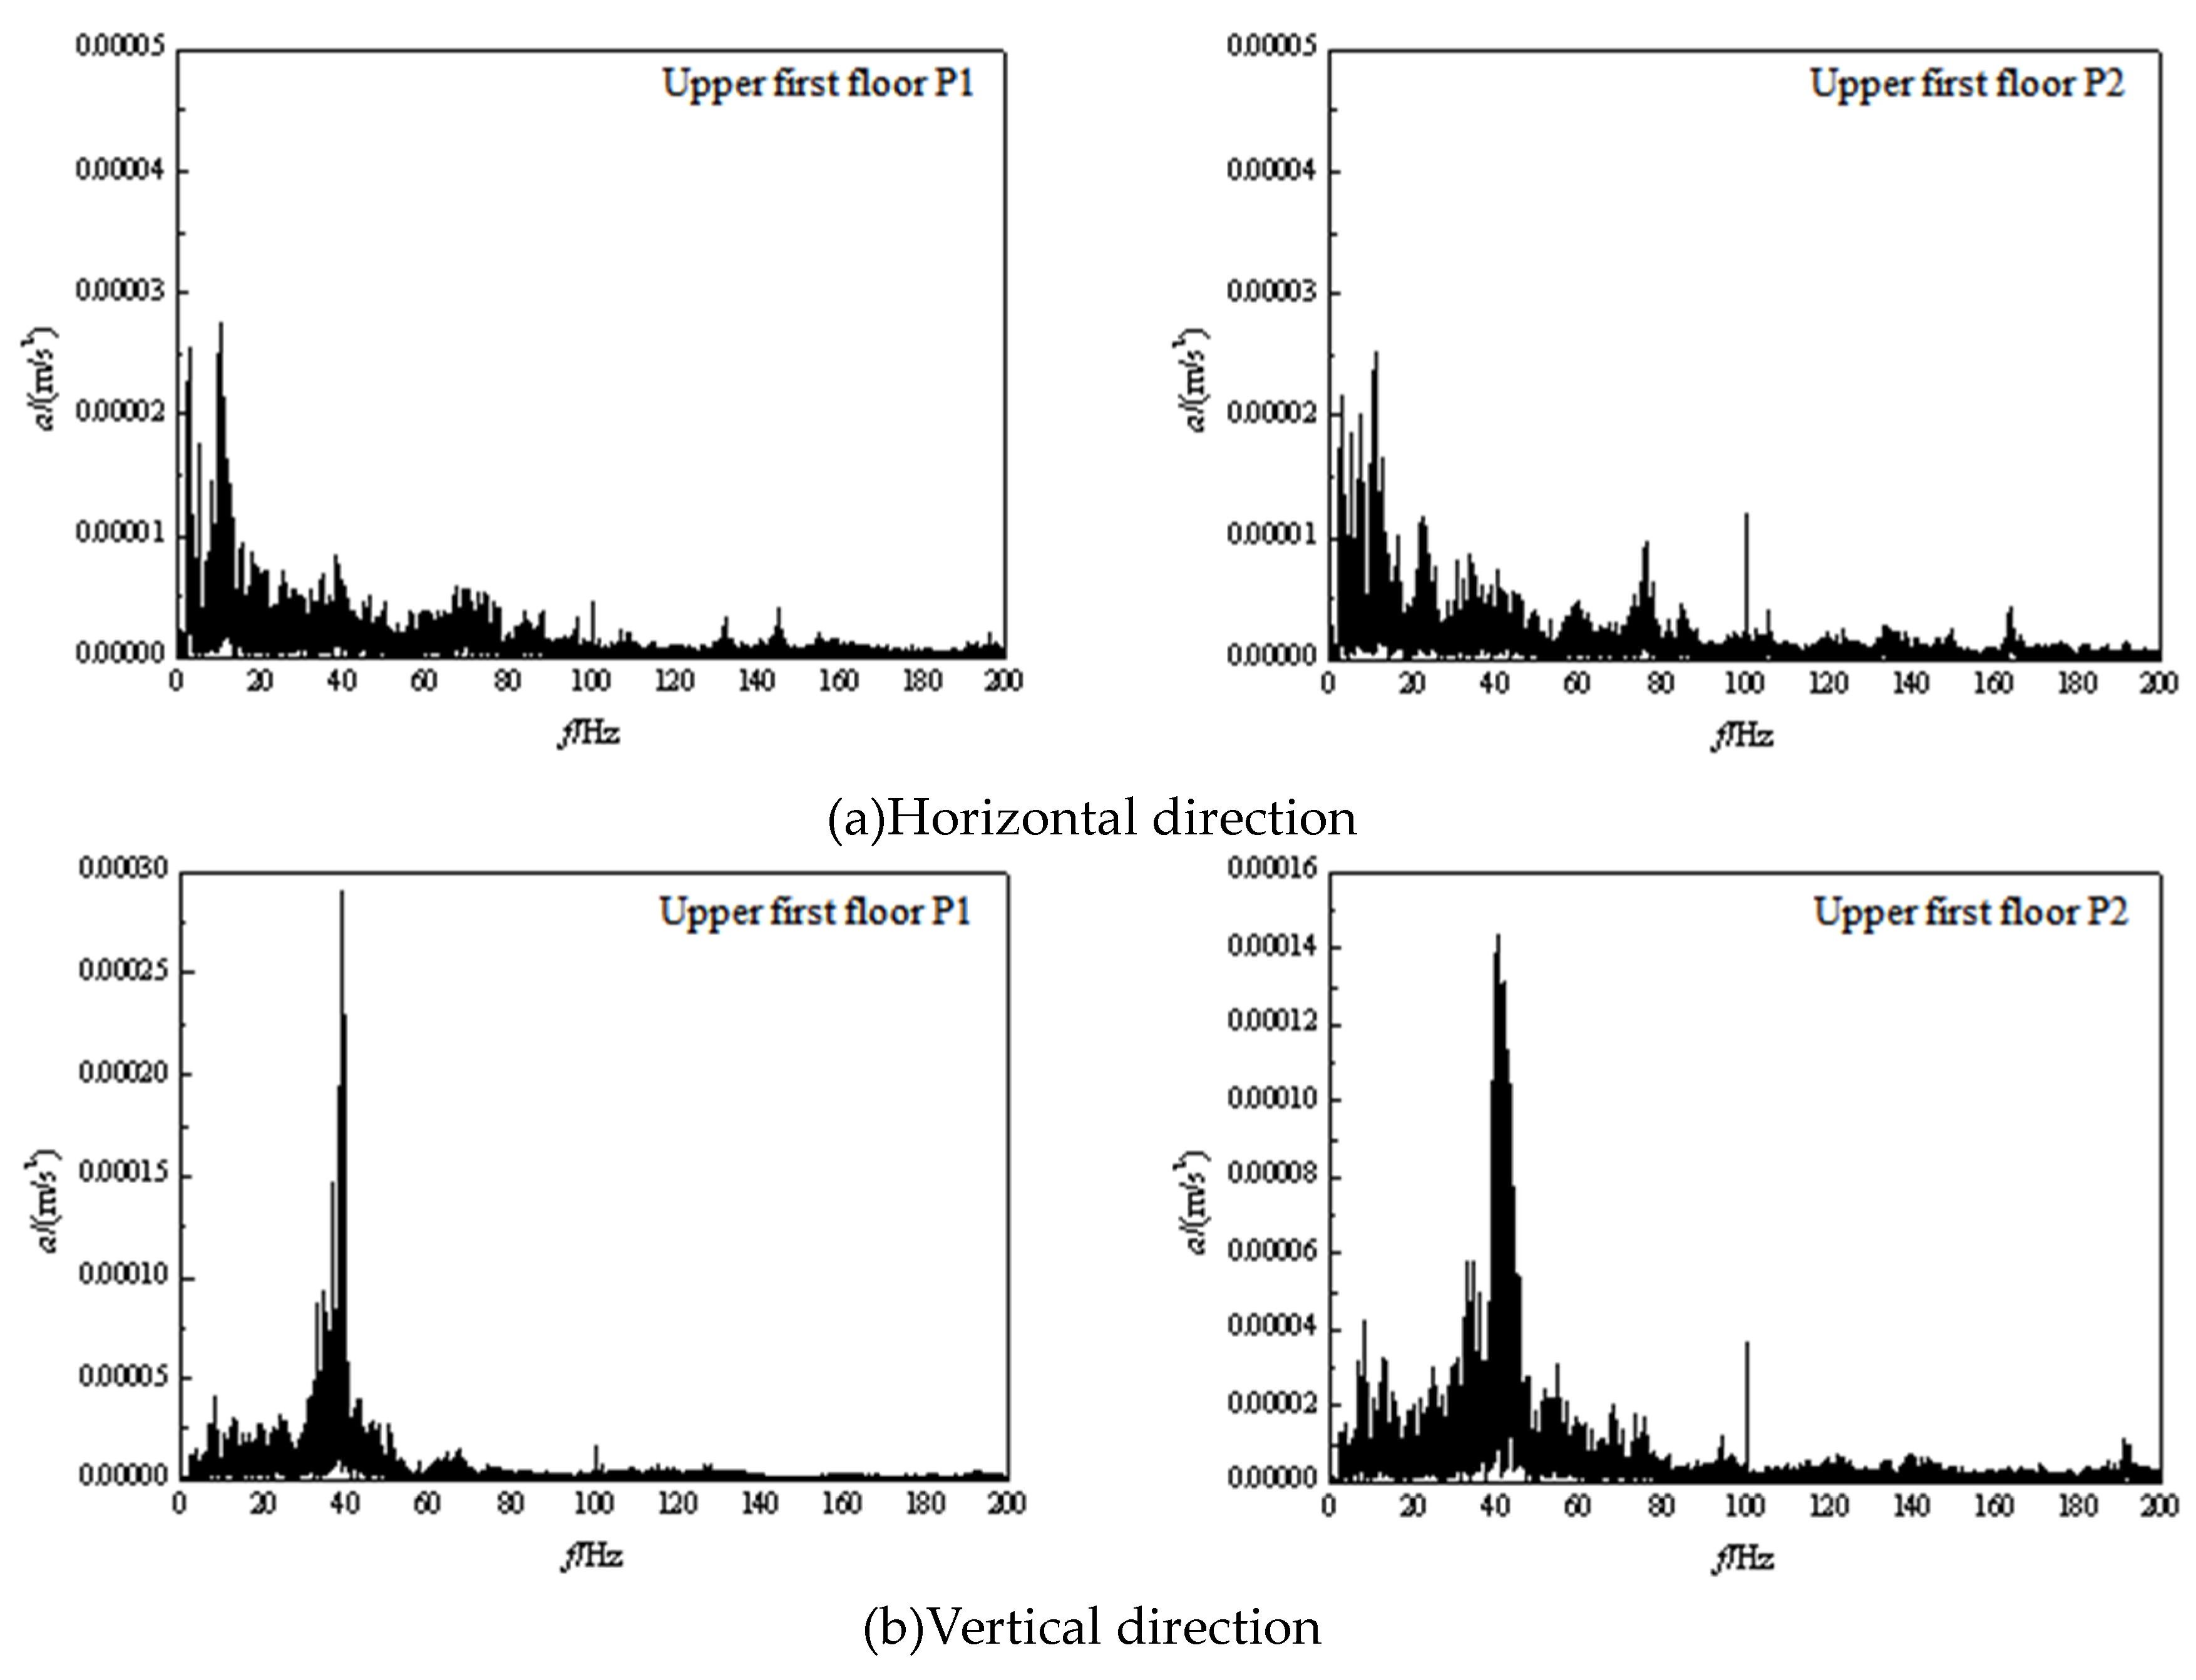
Figure 17 shows the horizontal direction of the ground floor measurement points Y1-Y4 vibration response band in the 0-120 Hz are distributed, the wave peak is mainly concentrated in the 20-60 Hz range, the wave peak more undulating; first floor measurement points of the frequency band distribution is significantly narrower, above 80 Hz high frequency significantly reduced, the peak in 40Hz and 60Hz near; and compare the first floor near the rail plate measurement point Y6 and the foot of the column measurement point Y5. It can be seen that the vibration amplitude in the plate is significantly greater than that in the foot of the column.
The acceleration spectrum in the vertical direction in Figure 17b is also similar to that in the horizontal direction. The vibration response frequency band of the ground floor measurement points is distributed in the range of 0-160 Hz, and the vibration propagates vertically, and the high frequency component of the vibration decays after reaching the first floor. The vertical vibration amplitude peaks at 40 Hz, and the amplitude measured in the middle of the slab is much greater than that at the foot of the column.
In order to analyse the vibration attenuation pattern in the horizontal direction in the frequency domain, the spectra of Y3 and Y4 were compared. After the attenuation in the 6m range at ground level, as in the previous section, the high frequency component in the vibration response band of Y3 was reduced, and the vibration amplitude peak value was reduced. However, due to the limitation of the site area, the vibration propagation relationship at long distances (above 10 m) could not be further investigated.
The peak value of vibration amplitude is concentrated in the low frequency band near 0-20 Hz, and there are occasional small peaks in the middle and high frequency band of 80-100 Hz; the acceleration of vertical vibration is obviously reduced in the high frequency band, and the dominant frequency band and peak value are concentrated near 40 Hz, and the vibration amplitude is much larger than that in the horizontal direction, which proves that the train The vibration caused by the train is mainly in the vertical direction.
Compared with measurement point G1 in section 2, the peak amplitude of vibration response in the horizontal direction of measurement point G1 is around 50Hz, which belongs to the middle frequency band, indicating that the dominant frequency band of vibration generated by train operation at different speeds is different; the vibration amplitude of measurement point G1 is significantly larger than that of measurement point 4 in section; in the vertical direction, the dominant frequency of G1 is around 20-40Hz, and the vibration amplitude is significantly larger than that of measurement point 4 in section.
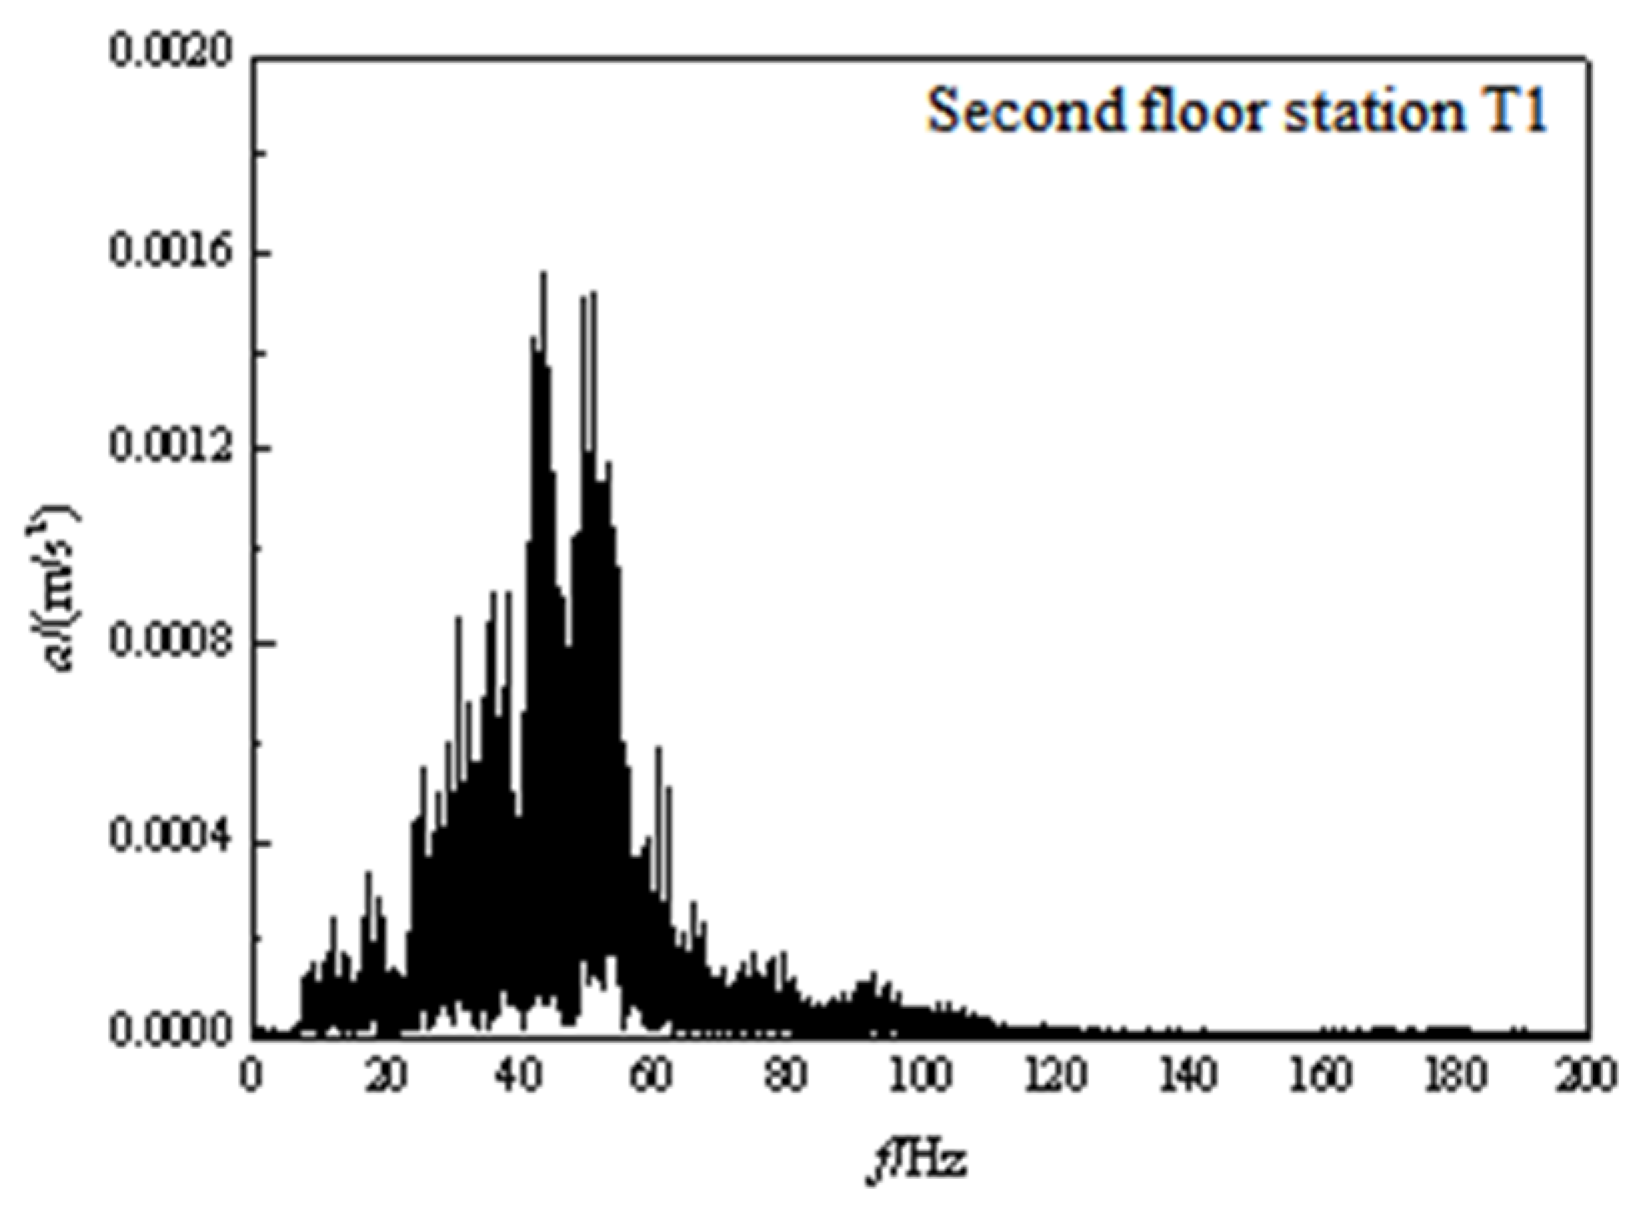
In order to facilitate the study of the frequency structure of the vibration triggered by the operation of the train in the vehicle section, the vibration signal is explored for each frequency component and the magnitude of each frequency component, and a fast Fourier transform is carried out on the measured time course data to obtain the vibration spectrum. Figure 19 shows the spectrum corresponding to the time domain graph of this vehicle.
The vertical acceleration spectrum shows that within 5 m of the track in the throat area, the main frequency distribution of the vibration is in the low to medium frequency range of 20-60 Hz, with a peak in spectral amplitude near 40 Hz.

4. Discussions

In this study, field measurements were carried out on metro depots in Wuhan to analyse the propagation patterns and magnitudes of vibration caused by metro operation in the metro depots on the ground, in the adjacent and superstructure buildings, and thus provide reference for the design of reasonable and feasible vibration and noise reduction solutions.
Through the field measurement of Wuhan metro depot, this study found that the vibration generated by the metro operation will have some attenuation with the increase of horizontal distance during the propagation process, while the vibration increases with the increase of floor level when it is transmitted to the superstructure. The vibration in the slab is greater than that in the column, and the vibration felt by a person standing in the centre of the slab is relatively stronger. Within 40 m of the source, the high frequency component of vertical vibration decays faster than the horizontal direction, and the high frequency component of vertical vibration above 40 Hz decays rapidly. In the vertical direction, the transmission of vibration is not simply a single change with increasing floor height; the vibration changes little at the lower floors as the floor rises, then decays slowly, and then gradually amplifies near the top floors. The vibration induced by the metro in the adjacent buildings along the line is predominantly vertical. As the distance from the track increases, a certain amount of vibration attenuation occurs in the propagation process, where high frequency vibration attenuates faster with increasing distance and low frequency vibration does not change much. The effect of vibration also diminishes with decreasing train speed.

5. Conclusions

The effects of vibration on the surrounding ground and adjacent buildings caused by the operation of trains in Wuhan metro depots have been measured, and the propagation law of train-induced ground vibration acceleration in the time and frequency domains has been analysed. The following conclusions can be drawn.
(1) within 43 m from the train running track, the train running induced vertical vibration acceleration level in the high-rise building peak size of 58.8 dB, the average value of 55.62 dB; vibration frequency components are mainly 40-60 Hz; vibration in the vertical direction of the propagation is not a single with the floor increases or attenuation, showing a certain complexity.
(2) when the vehicle section train into the parking garage, causing the vertical vibration of the high-rise building is slightly less than the vibration caused by the normal speed train driving, the measured maximum vertical vibration acceleration level is 58.55 dB, the vibration response band is 0-60 Hz, the vibration peak occurs at 40 Hz.
(3) Comprehensive indoor test results of different buildings in each area and the vibration effects caused by different vehicle speeds, it is considered that within the range of 0~20 m from the track, the vibration of buildings exceeds the limit value of relevant standards and codes in China, and vibration damping is required to ensure human comfort in this environment according to the characteristics of the area; outside the range of 43 m from the track, the vibration effects caused by train operation are attenuated, and further investigation can be carried out at some measurement points where the vibration level exceeds the limit value. Further studies can be carried out at some of the measurement points where the vibration levels exceed the limits to determine whether vibration damping should be carried out.
(4) The vibration impact of underground train operation on the adjacent buildings in the access line is relatively small, the vibration level of each measurement point in section 1-1 and 2 all meet the requirements of the corresponding limit value of the standard; in the range of 12-30 m from the track, as the distance increases, the vibration response band width becomes narrower, and the vibration produces a certain attenuation, the attenuation of vertical vibration is greater than the horizontal direction; Z vibration level after 18 m attenuation, approximately reduced by 13dB.
(5) With the increase of the distance to the source, the vertical vibration attenuation rate is the largest in the range of 17-22 m from the source, and in the range of 40-200 Hz at the centre frequency, the vibration acceleration level of each measurement point with the increase of the distance to the source and attenuation, vibration acceleration level in the frequency range of 31.5-200 Hz vibration attenuation in the range of 25-46 dB.

Data Availability Statement

The data used to support the findings of this study are currently under embargo while the research findings are commercialized. Requests for data, [12 months] after publication of this article, will be considered by the corresponding author.

Acknowledgments

This research was funded by the National Natural Science Foundation of China (Project No. 52008115), the (Chinese) State Key Laboratory of Subtropical Building Science (Project: No. 2021ZB08).

Conflicts of Interest

The authors declare that they have no conflicts of interest.

References

  1. Lundqvist A, Dahlberg T. Dynamic train/track interaction including model for track settlement evolvement [J]. Vehicle system dynamics, 2004, 41: 667-676. Thompson D, Thompson D J. Railway Noise and Vibration: Mechanisms, Modelling and Means of Control[M]. Holland: Elsevier Science & Technology, 2009.
  2. Rossi F, Nicolini A. A simple model to predict train-induced vibration: Theoretical formulation and experimental validation[J]. Environmental Impact Assessment Review, 23(3): 305-322,2003. [CrossRef]
  3. Auersch L. Dynamic interaction of various beams with the underlying soil–finite and infinite, half-space and Winkler models [J]. European Journal of Mechanics-A/Solids, 2008, 27(5): 933-958. [CrossRef]
  4. Meng Ma, Weining Liu, Chunyu Qian, Guohua Deng, Yudong Li, “Study of the train-induced vibration impact on a historic Bell Tower above two spatially overlapping metro lines,” Soil Dynamics and Earthquake Engineering, vol. 81, pp. 58-74, 2016. [CrossRef]
  5. Kouroussis G, Gazetas G, Anastasopoulos I; et al. Discrete modelling of vertical track–soil coupling for vehicle–track dynamics [J]. Soil Dynamics and Earthquake Engineering, 2011, 31(12): 1711-1723. [CrossRef]
  6. Chao Zou, Yimin Wang, James A. Moore, Masoud Sanayei, “Train-induced field vibration measurements of ground and over-track buildings,” Science of the Total Environment, vol. 575, pp. 1339-1351, 2017. [CrossRef]
  7. X. Lei and C. Jiang, “Analysis of vibration reduction effect of steel spring floating slab track with finite elements,” Journal of Vibration and Control, Vol. 22, pp. 1462–1471, 2016. [CrossRef]
  8. Masoud Sanayei, Anish Kayiparambil P., James A. Moore, Cory R. Brett, “Measurement and prediction of train-induced vibrations in a full-scale building,” Engineering Structures, vol. 77, pp. 119-128, 2014. [CrossRef]
  9. Meng Ma, Weining Liu, Chunyu Qian, Guohua Deng, Yudong Li, “Study of the train-induced vibration impact on a historic Bell Tower above two spatially overlapping metro lines,” Soil Dynamics and Earthquake Engineering, vol. 81, pp. 58-74, 2016. [CrossRef]
  10. Zhai W, Wang K. Lateral hunting stability of railway vehicles running on elastic track structures [J]. Journal of Computational and Nonlinear Dynamics, 2010, 5(4): 041009. [CrossRef]
  11. Torstensson P T, Nielsen J C O. Simulation of dynamic vehicle–track interaction on small radius curves [J]. Vehicle System Dynamics, 2011, 49(11): 1711-1732. [CrossRef]
  12. Handy, S. Smart growth and the transportation-land use connection: What does the research tell us? [J] International Regional Science Review, 2005, 28 (2): 146-167. [CrossRef]
  13. P. Galvín, D.López Mendoza, D.P. Connolly, G. Degrande, G. Lombaert, A. Romero, “Scoping assessment of free-field vibrations due to railway traffic.” Soil Dynamics and Earthquake Engineering, vol. 114, pp. 598-614, 2018. [CrossRef]
  14. Sheng X, Jones C J C, Thompson D J. A theoretical study on the influence of the track on train-induced ground vibration [J]. Journal of Sound and Vibration, 2004, 272(3): 909-936. [CrossRef]
  15. C. Madshus, B. Bessason, L. Hårvik, “PREDICTION MODEL FOR LOW FREQUENCY VIBRATION FROM HIGH SPEED RAILWAYS ON SOFT GROUND,” Journal of Sound and Vibration, vol. 193, no. 1, pp. 195-203, 1996. [CrossRef]
  16. Zhai W, Wang K, Cai C. Fundamentals of vehicle–track coupled dynamics [J]. Vehicle System Dynamics, 2009, 47(11): 1349-1376. [CrossRef]
  17. M.F.M. Hussein, H.E.M. Hunt, “A numerical model for calculating vibration from a railway tunnel embedded in a full-space,” Journal of Sound and Vibration, vol. 305, no. 3, pp. 401-431, 2007. [CrossRef]
  18. X. Sheng, C.J.C. Jones, D.J. Thompson, “A theoretical model for ground vibration from trains generated by vertical track irregularities,” Journal of Sound and Vibration, vol. 272, no. 3, pp. 937-965, 2004. [CrossRef]
  19. Costa P A, Calcada R, Cardoso A S. Influence of train dynamic modelling strategy on the prediction of track–ground vibrations induced by railway traffic [J]. Proceedings of the Institution of Mechanical Engineers, Part F: Journal of Rail and Rapid Transit, 2012. [CrossRef]
  20. Kouroussis G, Verlinden O, Conti C. A two-step time simulation of ground vibrations induced by the railway traffic [J]. Proceedings of the Institution of Mechanical Engineers, Part C: Journal of Mechanical Engineering Science, 2012, 226(2): 454-472. [CrossRef]
  21. Federal Transit Administration. T ransit Noise and Vibration Impact Assessment Manual; U.S. Department of Transportation: Washington, DC, USA, 2018.
  22. Auersch L, “Wave propagation in the elastic half-space due to an interior load and its application to ground vibration problems and buildings on pile foundations,” Dynamics and Earthquake Engineering, vol. 30, no. 10, pp. 925-936, 2010. [CrossRef]
  23. Auersch L, “Dynamic Stiffness of Foundations on Inhomogeneous Soils for a ReaJistic Prediction of Vertical Building,” Resonance, vol. 134, no. 3, pp. 328-340, 2008. [CrossRef]
  24. S. François, L. Pyl, H.R. Masoumi, G. Degrande, “The influence of dynamic soil–structure interaction on traffic induced vibrations in buildings,” Soil Dynamics and Earthquake Engineering, vol. 13, no. 5, pp. 652-664, 2016. [CrossRef]
  25. Liang Ruihua, Liu Weifeng, Ma Meng, Liu Weining, “An efficient model for predicting the train-induced ground-borne vibration and uncertainty quantification based on Bayesian neural network,” Journal of Sound and Vibration, vol. 495, pp. 115908-, 2020. [CrossRef]
  26. D. López-Mendoza, A. Romero, D.P. Connolly, P. Galvín, “Scoping assessment of building vibration induced by railway traffic,” Soil Dynamics and Earthquake Engineering, vol. 93, pp. 147-161, 2017. [CrossRef]
  27. Pyl L, Degrande G, Clouteau D. Validation of a Source–Receiver Model for Road Traffic-Induced Vibrations in Buildings. II: Receiver Model[J]. Journal of Engineering Mechanics, 2004, 130(12): 1394-1406. [CrossRef]
  28. Chao Zou, Yimin Wang, Xu Zhang, Ziyu Tao, “Vibration isolation of over-track buildings in a metro depot by using trackside wave barriers,” Journal of Building Engineering, vol. 30, pp. 101270, 2020. [CrossRef]
  29. Connolly D, Giannopoulos A, Forde M C. Numerical modelling of ground borne vibrations from high speed rail lines on embankments[J]. Soil Dynamics and Earthquake Engineering, 2013, 46(0): 13-19. [CrossRef]
  30. Walker J G, Chan M F K. HUMAN RESPONSE TO STRUCTURALLY RADIATED NOISE DUE TO UNDERGROUND RAILWAY OPERATIONS[J]. Journal of Sound and Vibration, 1996. [CrossRef]
  31. D.P. Connolly, G. Kouroussis, A. Giannopoulos, O. Verlinden, P.K. Woodward, M.C. Forde, “Assessment of railway vibrations using an efficient scoping model,” Soil Dynamics and Earthquake Engineering, vol. 58, pp. 37-47, 2014. [CrossRef]
Figure 1. Location of Wuhan metro depot.
Preprints 81868 g001
Figure 2. Layout of the Wuhan metro depot.
Preprints 81868 g002
Figure 3. Realistic view of Wuhan metro depot.
Preprints 81868 g003
Figure 4. Wireless vibration test system equipment. (a)Diagram of JM3873 wireless vibration test system; (b) Speed sensor with built-in V001 magneto-electric type.
Preprints 81868 g004
Figure 5. Measurement points layout plan of the Leisure Centre.
Preprints 81868 g005
Figure 6. Measurement points layout plan for section 2 high rise building.
Preprints 81868 g006
Figure 7. Measurement points layout plan for the kindergarten.
Preprints 81868 g007
Figure 8. Measurement points layout plan for the 1st floor of the parking depot superstructure.
Preprints 81868 g008
Figure 9. Measurement points layout plan for the 2nd floor of the shop in the throat area.
Preprints 81868 g009
Figure 10. Measured vibration acceleration time profiles at each level of the Leisure Centre in Wuhan metro depot.
Preprints 81868 g010
Figure 11. Measured vibration acceleration time profiles at each level of the High-rise building in Wuhan metro depot.
Preprints 81868 g011aPreprints 81868 g011b
Figure 12. Measured vibration acceleration time profiles at each level of the Kindergarten in Wuhan metro depot.
Preprints 81868 g012aPreprints 81868 g012b
Figure 13. Measured vibration acceleration time profiles at the 1st floor measurement point of a high-rise building in Wuhan metro depot.
Preprints 81868 g013aPreprints 81868 g013b
Figure 14. Measured vertical vibration acceleration time profiles at the 2nd floor measurement point of the commercial shop in the throat area in Wuhan metro depot.
Preprints 81868 g014
Figure 15. Measured acceleration spectra at each level of the Leisure Centre in Wuhan metro depot.
Preprints 81868 g015aPreprints 81868 g015b
Figure 16. Measured acceleration spectra at each floor measurement point on the upper floors in Wuhan metro depot.
Preprints 81868 g016aPreprints 81868 g016bPreprints 81868 g016c
Figure 17. Measured acceleration spectra at each level of the kindergarten in Wuhan metro depot.
Preprints 81868 g017aPreprints 81868 g017bPreprints 81868 g017c
Figure 18. Measured vibration acceleration spectrum at 1st floor measurement point on high floor in Wuhan metro depot.
Preprints 81868 g018
Figure 19. Measured vertical acceleration spectra at shop measurement points in the throat area in Wuhan metro depot.
Preprints 81868 g019
Table 1. Details of the 5 sections of the Wuhan metro depot.
No. Location Vibration source Speed (km/h) Track structure
1 Throat area/access section line junction 3-storey building on the upper cover 15~20 Gravel bed, concrete track sleepers
2 Throat area 28-storey building on white ground to the south 15~20 Gravel bed, concrete sleeper
3 Throat area 2 storey kindergarten in the upper building to the north 10~15 Gravel bed, concrete sleeper
4 Parking depot 11-storey building in the upper cover 5~10 Integral bed
5 Throat area 2-storey building in the upper cover 10~15 Gravel bed, wooden sleepers
Disclaimer/Publisher’s Note: The statements, opinions and data contained in all publications are solely those of the individual author(s) and contributor(s) and not of MDPI and/or the editor(s). MDPI and/or the editor(s) disclaim responsibility for any injury to people or property resulting from any ideas, methods, instructions or products referred to in the content.
Copyright: This open access article is published under a Creative Commons CC BY 4.0 license, which permit the free download, distribution, and reuse, provided that the author and preprint are cited in any reuse.
Prerpints.org logo

Preprints.org is a free preprint server supported by MDPI in Basel, Switzerland.

Subscribe

© 2024 MDPI (Basel, Switzerland) unless otherwise stated