Preprint
Article

Validation and cross-species transferability of SSR markers developed from whole genome sequence (WGS) of Mungbean (Vigna radiata L. Wilczek) and their application of population genetics in Vigna species

Altmetrics

Downloads

220

Views

99

Comments

0

Submitted:

07 August 2023

Posted:

08 August 2023

You are already at the latest version

Alerts
Abstract
The genus Vigna is penta-tropical having more than 200 species with many desirable economically important traits. The aim of study was to validate the in-silico polymorphism of whole genome sequence developed mungbean specific SSR markers and their transferability among the different Vigna species. The present study utilized a set of 200 SSR markers developed from whole genome sequence of mungbean and validated using a diversity panel of 25 accessions which belongs to 13 Vigna species. Out of 200 SSR markers, 130 markers (65%) were polymorphic across the various Vigna species and the number of alleles amplified varied between 7 to24. The SSR markers showed more than 90 percent transferability across the different Vigna species accessions. Based on allelic data, the 25 Vigna accessions grouped into three clusters based upon the unweighted pair group method with arithmetic mean (UPGMA) phylogenetic tree. The principal co-ordinates analysis (PCA) biplot graph and UPGMA based neighbor joining clustering diagram showed similar pattern of Vigna accessions distribution. The population structure assessment has grouped the cultivated and wild species accessions into two sub-population. The estimated marker parameters such as polymorphic information content (0.09 – 0.84), marker index (0.091 – 3.342) and effective multiplex ratio (1.0 – 4.0) suggested their adequacy in several genetic studies such as parental selection, hybrid testing, genetic mapping and marker aided breeding programmes for genetic enhancement of species belonging to the Vigna genus.
Keywords: 
Subject: Biology and Life Sciences  -   Agricultural Science and Agronomy

1. Introduction

Among the legumes, Vigna is an agriculturally important taxon. The genus Vigna belonging to subgenus Ceratotropis, tribe Phasleoleae, family Fabaceae, include more than 150 Vignaspecies. The majority of members belonging to Vigna are wild species from Asia and Africa continents [1,2]. The domesticated members of Vigna include 10 species such as mungbean (V. radiata L. Wilczek), ricebean (V. umbellata (Thunb.) Ohwi & Ohashi), adzuki bean (V. angularis (Willd.) Ohwi & Ohashi), urdbean (V. mungo L. Hepper), moth bean (V. aconitifolia (Jacq.) Marechal), cowpea (V. unguiculata L. Walpers), creole bean (V. reflex-pilosa) and Bambara groundnuts (V. subterranean (L.) Verdc.) [3,4]. Except creole bean (2n=2x=44, tetraploid), all these cultivated species are diploid in nature (2n=2x=22). The subgenus Ceratotropis is further grouped in three divisions namely Ceratotropis (mungbean,blackgram), Aconitifoliae (mothbean) and Angularis (adzuki bean and creole bean) [5]. This subgenus is the dockyard of desirable adaptive genes for evolution of climate resilient Vigna cultigens. In India, enormous diversity of Vigna species occur in the Western Ghats (Gujrat, Maharashtra, Nilgiris, Karnataka, Kerala, Tamil Nadu), Eastern Ghats (Odisha, West Bengal), Central plateu (Chhatisgarh, Madhya Pradesh, Maharashtra); North Western Himalayas (parts of Uttaranchal and Himachal Pradesh) [6].
Among Vigna, Mungbean (Vignaradiata L. Wilczek) is a major pulse popularly referred as green gram, golden gram, oregon pea, chickasawpea and mung [7]. It is autogamous crop with 2n=2x= 22 chromosomes which spanned about 574 Megabasepairgenetic material [8]. The small genome size makes it a suitable model crop for studying the evolutionary and genetic diversity studies [9]. It contains ample amount of easily digestible protein which is very much useful in addressing health problems such as diabetes and malnutrition. The haulms of mungbean is generally used in animal husbandry for feeding to domesticated animals as it does not have any negative effects on animal health [10,11].The mungbean seeds are free of anti-nutritional factors (trypsin inhibitors, tannin, phytohemagglutinin, etc.,) [12]. Apart from its use as food and feed, mungbean is sought-after for its N-fixing ability in soil through symbiotic association with Rhizobium spp., Bradyrhizobium bacteria in their root nodules.The nitrogen fixation mechanism enhances the soil fertility which in turn increases the financial condition of small and marginal farmers. The crop is also acclaimed for its ability to perform well in marginal lands, under limited moisture and essential mineral elements available in surroundings mainly owing to their symbiotic association with N-fixingRhizobium bacteria and arbuscularmycorrhizal (AM) fungi that help to ameliorate themineral elements acquisition from humus and crop-establishment in such lands [13].
The crop is grown popularly in South and North America, West Indies, Australia, Asia and Tropical and Subtropical Africa. Currently, mungbean is grown on about 7.3 million hectares mainly in Asia across different seasons (spring, summer, kharifandrabi) and the cultivation is expanding into Africa and Australia [14,15]. The worldwide mungbean harvest is 5.3 million tons and 51% is from India after Myanmar and China [15]. In India, mungbean occupies 4.32 million hectares area mainly in Rajasthan, Maharashtra, Andhra Pradesh, Karnataka, Odisha, Uttar Pradesh and Bihar and resulted into a harvest of 2.17 million tons [16]. At global level, India produced about 54% of total mungbean production with 65% acreage of world mungbean acreage [17]. The Asian continent exhibited a knee-high average productivity of mungbean due to the inherently low yielding potential of the cultivars and their susceptibility to fungal, bacterial, viral and other foliar diseases [18,19]. However, in the present scenario themungbean cultivars which matures in less time, photo-insensitive, stable and high level of resistance against disease and insect pests and high yielding in nature provides a chance to cultivate mungbean as catch crop in cereal cropping system (rice-wheat-mungbean). The diverse edapho-climatic conditions of India are well suited for sustainable food production and food security [20]. Further expansion of mungbean cultivation is linked to pace of genetic improvement which depends upon genetic and genomic resources. Mungbean is lagging in genomics research and application of genomics assisted breeding techniques than other legume crops. Till date, 18 genetic linkage maps are available in mungbean based on RFLP, RAPD, STS, SSR from mungbean and other species [21]. Several researchers [22,23,24] developed mungbean specific DNA markers i.e. genic SSRs and these markers used to amplify the mungbean genome are mostly other legume crop specific. The SSR markers from within Vigna species (cowpea, common bean, adzuki bean) and other genera such as soybean have been applied in mungbean and of these adzuki bean and common bean SSR markers showed a high rate of amplification of 72.7% and 60.6% [25,26]. The unigene based SSR markers showed a high transferability rate of 88% in different Vigna species [27].
The SSR markers are most preferably used in the limited resourceful laboratories due to non-affordability of modern technologies [28]. The general methodology of SSR development consists of three steps i.e. preparation of SSR library, PCR and sequencing. This process is very cumbersome and expensive. Now a day’s several workers [29,30,31,32,22,33,34,35,36,37] have developed SSR markersbutstill limited SSR markers are available in mungbean. This has further limited the molecular mapping of many desirable characters pertaining to stress resistance in the crop. Trait based mapping is urgently required for mungbeanto strengthen the molecular marker based improvement programme.With the help of next generation sequencing (NGS) technologies, it has become possible to develop and identify large numbers of SSR and other markers at low price. NGS technologies, coupled with bioinformatics approaches can massively increase the number of SSRs availability for carrying outgenetical investigations in under studied and economically important crops such as mungbean. Whole genome sequences of mungbean and urdbean varieties (ML 267 and Mash 114) was assembled at Punjab Agricultural University (PAU), Ludhiana and an aggregate of 443,867 SSR markers were discovered in V. radiata (cv. ML267) and V. mungo (cv. Mash 114), of which 4,10,282 were found polymorphic in silico. In present study, of the 250 WGS based SSR markers, a set of 200in silico polymorphic SSRs were validated for their transferability across different Vigna species and elucidating the underlying genetic diversity in genus Vigna.

2. Materials and Methods

2.1. Plant Material

Phenotypically diverse accessions fromdiverse geographic regions were included to enhance the likelihood of detecting polymorphic marker loci. The diversity panel comprising of 25 Vigna accessions across 13 species were procured from ICAR-Indian Institute of Pulse Research (IIPR), Kanpur, Uttar Pradesh (Table 1). The present work was carried out at experimental area of Department of Plant Breeding and Genetics, Punjab Agricultural University (PAU), Ludhiana located at 244 meter above mean sea level (AMSL) (latitude: 300 90’N and longitudes: 750 85’ E)with semi-arid climate zone.Each accession was sown in a single line in a bed of 3meter length at spacing of 40 cm between rows during kharif season, 2019.

2.2. DNA Extraction and Quantification

Total genomic DNA was isolated from fresh young and tender leaves of each accession employing standard CTAB method [38]. RNA contamination was removed with RNase at 370C for 45 minutes. The quantity and quality of DNA was examined with agarose gel (0.8%) with lambda DNA as reference. The integrity and quantity of DNA based onagarose gel was optimized to 20 ng/µland used for amplification process.

2.3. SSR Markerdesigning

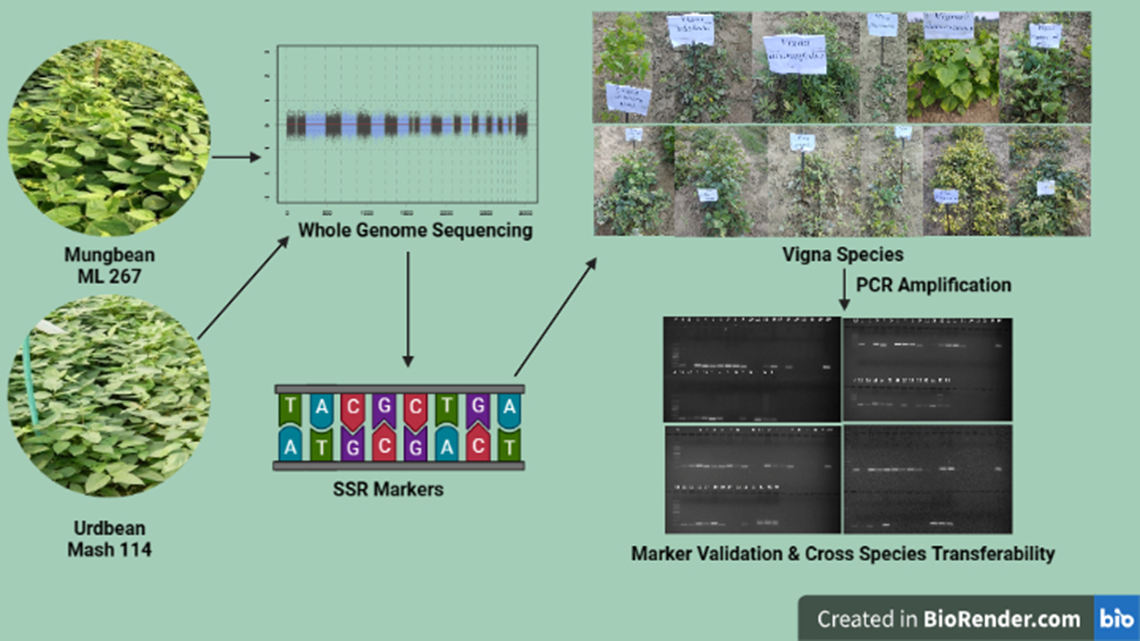
The whole genome contig assembly and scaffolding of WGS based SSR markers was done by using CLC assembler and SOAP de novo respectively at School of Agricultural Biotechnology, Punjab Agricultural University, Ludhiana and further used for SSR mining and identification of in silico polymorphism through MIcroSAtelllite (MISA). A total of 2,18,508 and 2,25,359 SSRs were detected from 4,71,725 and 4,44,059 sequences in V. mungo cv. Mash114 and V. radiata cv. ML267 respectively (Table 2) [39]. Using these SSR sequences, 250 in silico polymorphic mungbean SSR primers were mapped on urdbean contigs based upon 20-50 bp distance between mungbean and urdbean using e-PCR. The in silico polymorphism was discovered by e-PCR of SSR markers obtained from V. radiata cv. ML267 and V. mungo cv. Mash114. Descriptive information including strand, marker type, repeat numbers, contig, amplicon size, GC content, start- and end-position and chromosome numbers were obtained for each SSR markers. The primers were designed using Primer3 software with deafault parameters; melting temperature (55-65℃), guanine-cytosine (GC) content (40-70%), primer size of 18-27 bp length and product size of 150-280 bp. A series of250 di-nucleotide whole genome sequence (WGS) based SSR markers were synthesized from Promega Biotech and of these 200 SSR markers were used for validation of WGS derived polymorphism as well as transferability to other Vigna species (Table S1) (Figure 1).

2.4. SSR Validation

The PCR reaction (SSR amplification) was performed in total of 20 µl reaction volume with 40 ng/µl of DNA template, 10µM of primer (forward and reverse), 10 mMdNTPs, 4.0 µl of 5X PCR buffer, 25mM of MgCl2 and one unit of 5 µl Taq polymerase (Promega). The PCR profile for the amplification of DNA was set as denaturation at 94°C for 3 minutes, annealing at 55°C which comprised of 35 cycles and followed by extension at 72°C for 10 minuts. The amplified PCR product was run on 2.5% agarose gel, stained with ethidiumbromidein horizontal gel electrophoresis unit and visualized under gel documentation system (Alpha Imager, USA).

2.5. GeneticDiversity, AMOVA and PCoA in Vigna Species

Amongst the 25 accessions, the total number of alleles, amplicon size, and number were recorded in each of Vigna species. The amplified fragment were scored in base pair size and convert to 1 (amplification) and 0 (no amplification) format. Then each marker was assessed for number of alleles (Na), number of effective alleles (Ne), observed heterozygosity (Ho), expected heterozygosity (He), unbiased heterozygosity (uHe), Shannon Information Index (I) and fixation index (F) were calculated using GENALExV.6.5 software [40]. TheGENALExV.6.5 also used todetect population differentiation utilizing SSRmarkers byanalysis of molecular variance (AMOVA) and principal co-ordinate analysis (PCoA).

2.6. Population Structure Analysis

Population structure analysis was carried out with STRUCTURE V.2.3.1 [41]. For identification of number of populations (K), the project run time was set to 100,000 Markov Chain Monte Carlo (MCMC) iterations and 100,000 burning period length with probability of admixture and independent allele frequency. The K value was setwith each10 independent run between 1 – 10 K. The optimal Delta-K value was determined with STRUCTURE HARVESTER [42]. Further, the accessions were assembled into clusters based upon the dissimilarity matrix using unweighted pair group method with arithmetic mean (UPGMA) neighbor joining method using DARwin6 software [43].

2.7. Data Analysis

2.7.1. Polymorphic Information Content (PIC)

Polymorphic information content (PIC) value provides an estimate of the discriminatory power of a locus or loci, by taking into consideration of number of alleles; relative frequency of alleles was estimated using the Botstein et al. [44] equation.
P I C = 1 i = 1 n ( P i j ) 2 { i = 1 n ( P i j ) 2 } 2 + i = 1 n ( P i j ) 2 } 2
where, Pij is the frequency of jth allele in the ith primer and summation extends over ‘n’ patterns.

2.7.2. Effective Multiplex Ratio (EMR)

The average number of DNA fragments amplified or detected per genotype using a marker system is considered as multiplex ratio (n). The number of loci polymorphic in the germplasm set of interest, analyzed per experiment is known as effective multiplex ratio.
E f f e c t i v e   M u l t i p l e x   R a t i o   E M R = n   x   β
where, n = Average number of fragments amplified by a genotype
β = Fraction of polymorphic band to the total polymorphic and monomorphic bands
β = P B ( P B + M B )
where,
PB = Number of polymorphic bands,
MB = Number of monomorphic bands

2.7.3. Marker Index (MI)

It is measured as product of polymorphic information content (PIC) and effective multiplex ratio (EMR). It is estimated using formula given by Powell et al. [45]
M a r k e r   I n d e x   ( M I ) = P I C     x   E M R
where,
PIC = Polymorphic information content
EMR = Effective multiplex ratio

2.7.4. Resolving Power (RP)

It is the measure of ability of each primer to detect level of variation between individuals. It is calculated according to Prevost and Wilkinson [46].
R e s o l v i n g   P o w e r   ( R P ) = I b
where, Ib = Informative fragments
I b = 1 [ 2 0.5 P i ]
where, Pi = Proportion of genotypes containing the ith band

3. Results

3.1. WGS Based SSR Markers Development

The whole genome sequencing (WGS) of ML267 and Mash114 was performed by [39] at School of Agricultural Biotechnology, PAU, Ludhiana. From the WGS, a total of 4,43867 SSRs were identified in V. radiata cv. ML267 and V. mungo cv. Mash114, of which 4,10,282 poly SSR primers were designed in silico by e-PCR. Out of these primers, a total of 250 in silico polymorphic mungbean SSR primers were mapped on urdbean contigs based upon the 20-50 bp distance between mungbean and urdbean using e-PCR (Figure 1). These 250 SSR markers were flanking dinucleotide SSR motifs and covered all 11 linkage groups of mungbean and urdbean. A maximum of 45 SSRs were from chromosome 7 and a minimum of 8 SSRs from chromosome 9 were used. The remaining SSR (197) were distributed unevenly as 41, 36, 24, 21, 18, 17, 14, 13 and 13 on chromosome 5, 8, 6, 1, 11, 4, 3, 2 and 10. Among these SSR repeats, 10 different dinucleotide repeats: (AT)n, (AG)n, (AC)n, (TA)n, (TG)n, (TC)n, (GA)n, (GT)n, (CA)n and (CT)n were observed (Table 3). The number of (AT)nand (TA)n repeats were most abundant dinucleotide repeat motifs 69 (27.6%) and 62 (24.8%) respectively. These two dinucleotide repeats (AT/TA) accounting 52.4% of the total repeat motifs.

3.2. Validation of SSR Markers on Vigna Species Accession for Transferability Studies

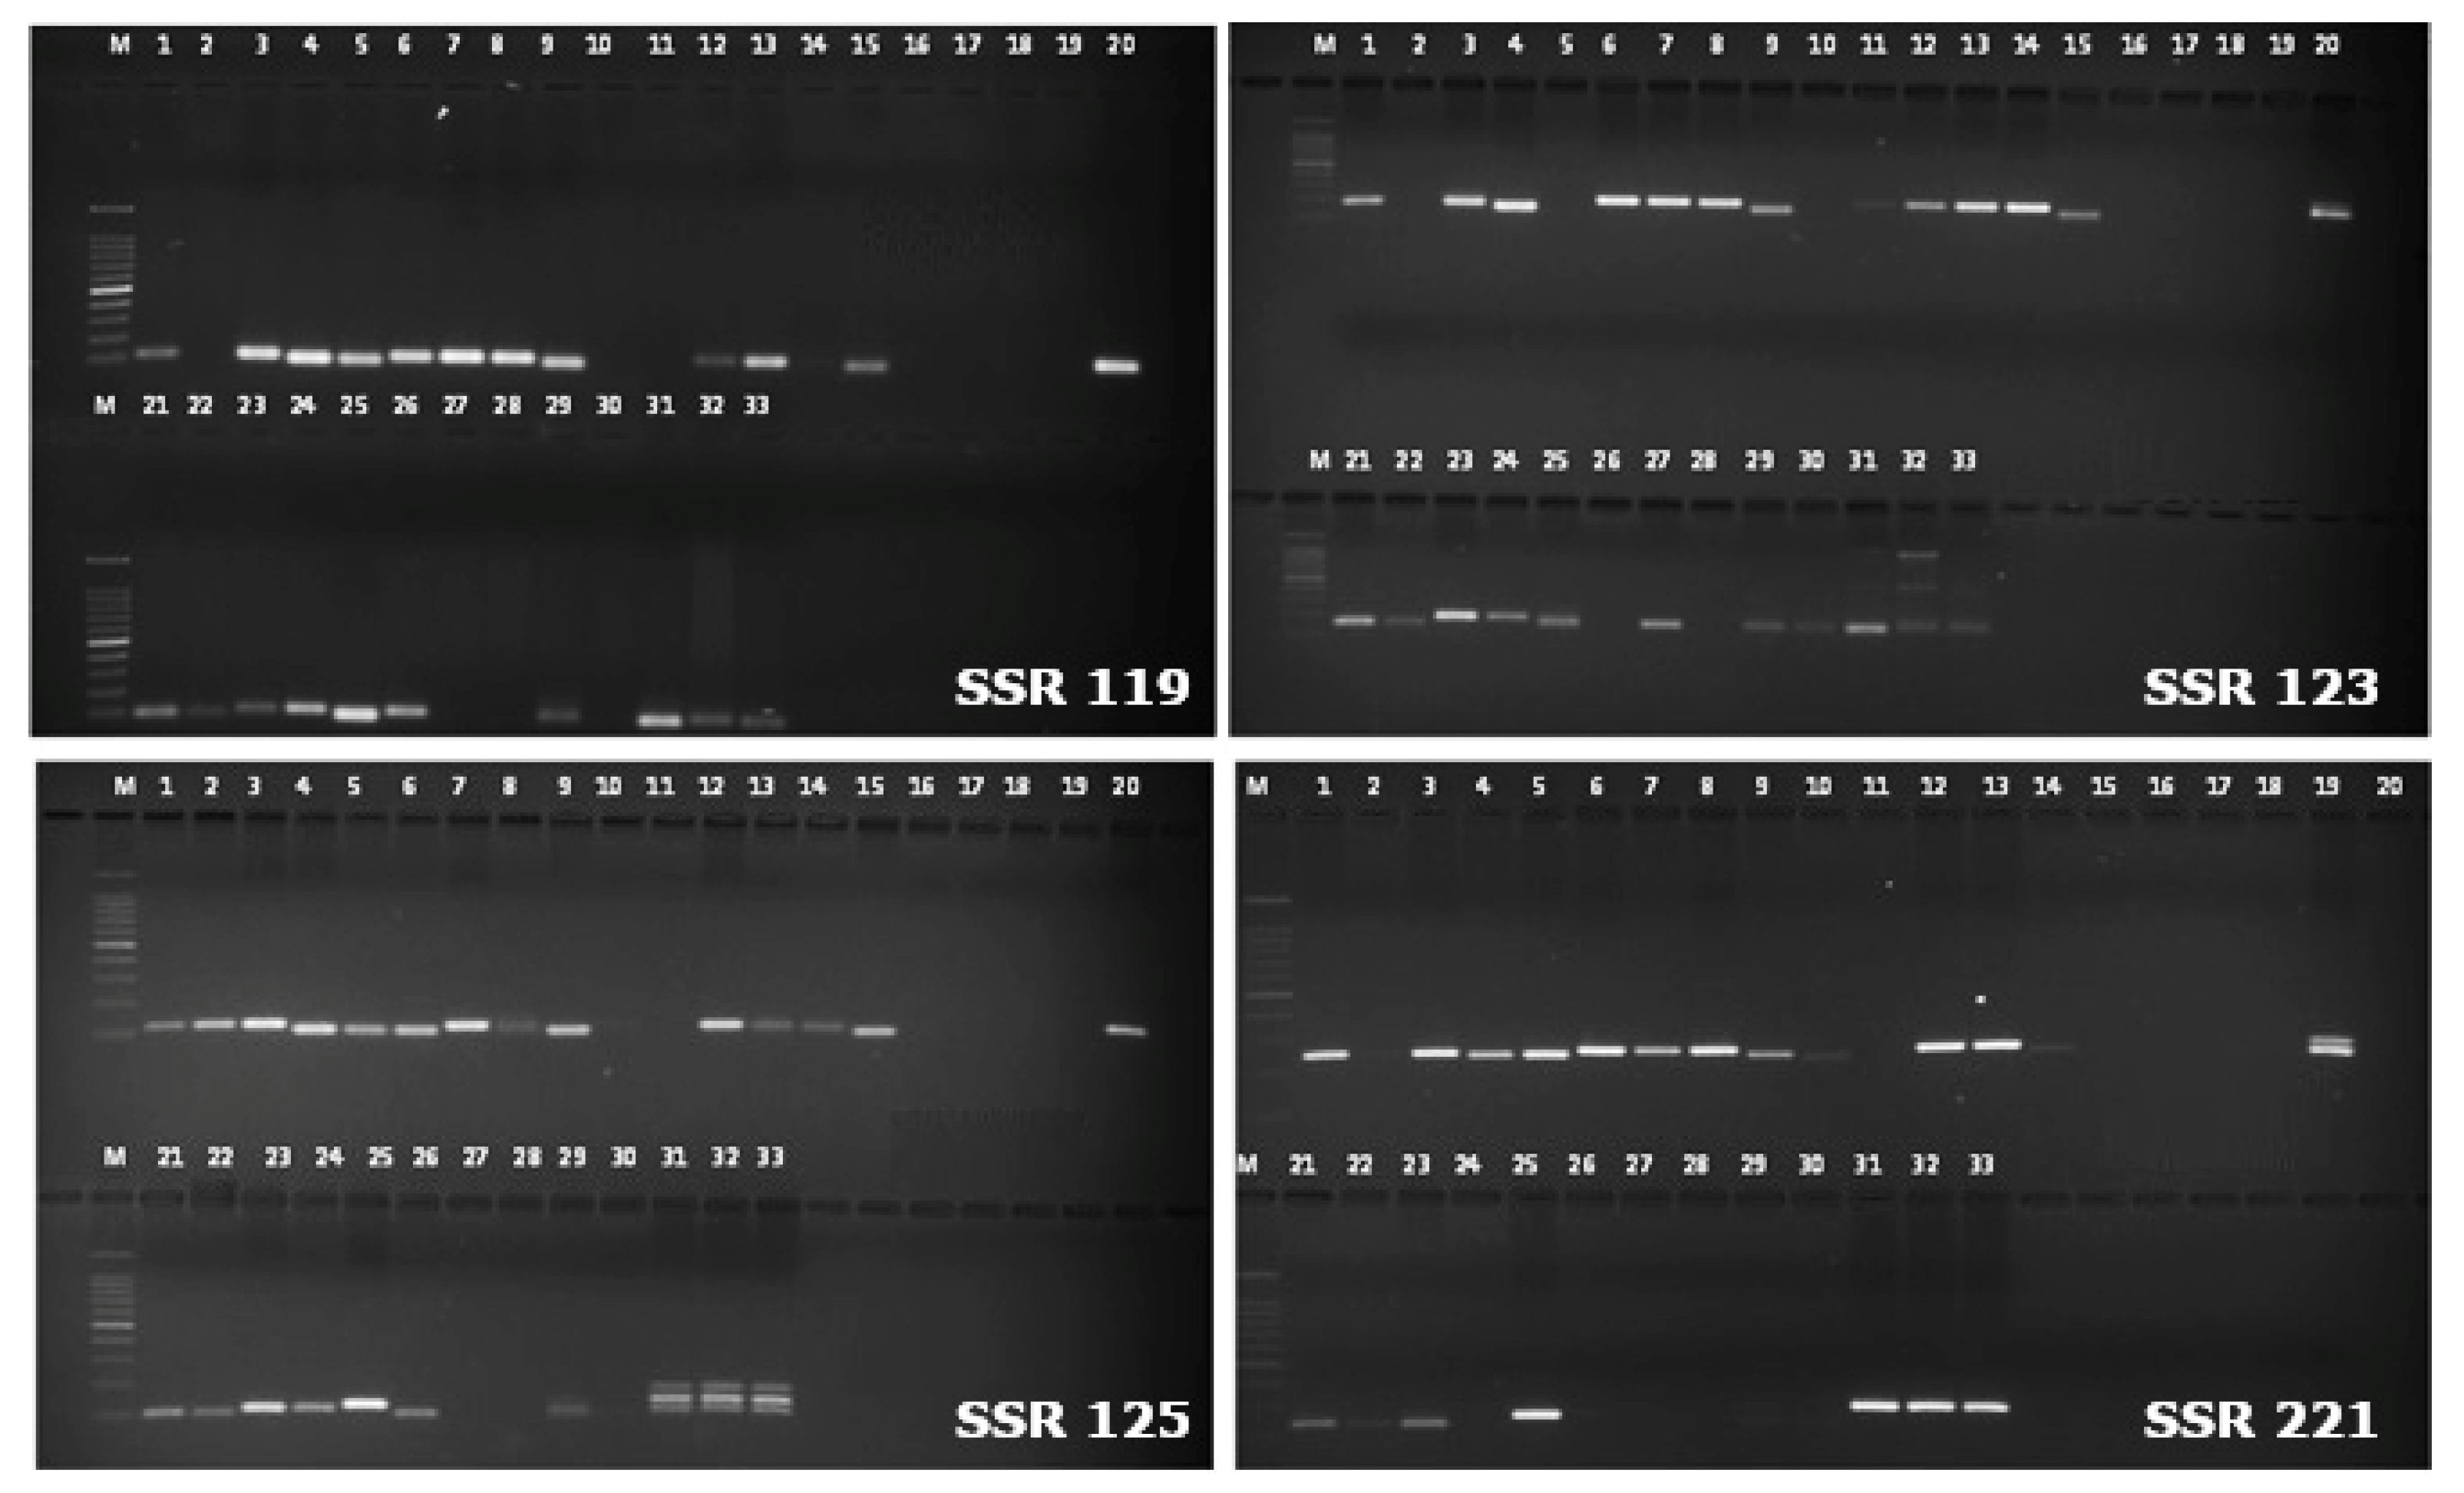
For validation, a set of 25 different Vigna species accessions belonging to 13 species were genotyped with 200 WGS developed SSR markers. All of these 200 SSR markersproduced varying level of amplification in all the accessions, except four [one of V. radiata var. radiata (GP15) and three of V. mungo var. mungo(GP16, GP17 and GP18)] (Table S2). Out of these 200 SSRs used for validation, 130 markers (65%) showed polymorphismwhile 70 markers (35%) exhibited monomorphism in the different Vigna species accessions.
Size-based polymorphism was observed by 402 alleles of the total amplified 2121 alleles with an average of 8.1 alleles per locus.The PCR amplification profile of WGS based SSR markers in different Vigna accessions is given in Figure 2.The number of alleles amplified by WGS-SSRs were ranged as 7 (SSR 274) to 24 (SSR 271). The average number of alleles amplified per marker was estimated at 15.7. Seven SSR markers viz., SSR 271 (24 alleles), SSR 123 (23 alleles), SSR 208, SSR 262, SSR 273, SSR 287 and SSR 289 (21 alleles) amplified more than 20 alleles. With respect to the Vigna species accessions, the minimum of 8 accessions and maximum of 21 accessions showed PCR amplification with these WGS derived SSR markers and the amplicon size varied from 50-1000 base pairs (Table S2).

3.3. SSR Marker Analysis

The marker analysis based upon the average PIC estimates for all the markers arrayed between 0.09 (SSR 262) to0.84 (SSR 269)with 0.31 as an average PIC value (Table S3). Of the 130 polymorphic markers, 85 markers (65.38%) were highly informative (PIC ≥ 0.45), 26 (20.50 %) reasonably informative (PIC = 0.25 – 0.45) and 19 (14.62 %) as slightly informative (PIC < 0.25). The MI value ranged between 0.091 (SSR 262) to 3.342 (SSR 269). Similarly, the EMR also varied from 1.0 to 4.0 (SSR 269). The average MI and EMR for the 130 polymorphic markers was recorded as 0.54 and 1.01 respectively. The RP for all 200 SSR markers varied from 0.56 (SSR 274) to 2.00 (SSR 177) with an average value of 1.27 (Table S3). The other marker utility parameters such as observed and effective allele number, Shannon diversity index and estimates of heterozygosity were also computed (Table S3). The effective number of alleles (Ne) ranged between one to two(average estimate 1.374) and the Shannon diversity index (I) varied as 0.693 to 0(average estimate 0.321). The Shannon information index was the highest for SSR106 and SSR 234 (0.693), followed by SSR253 (0.686), SSR 198 and SSR 251 (0.685), SSR 156 (0.683), SSR241 (0.679), SSR 135 (0.675). The value for observed heterozygosity was obtainedfrom0.188 to 0with 0.016 averageswhile the estimate of expected heterozygosityordered from 0.50 to 0with 0.216 average values. The unbiased expected heterozygosity (uHe) was recorded between 0to 0.526 with an average of 0.235.

3.4. Genetic Diversity Andrelationship Among the Different Vigna Species

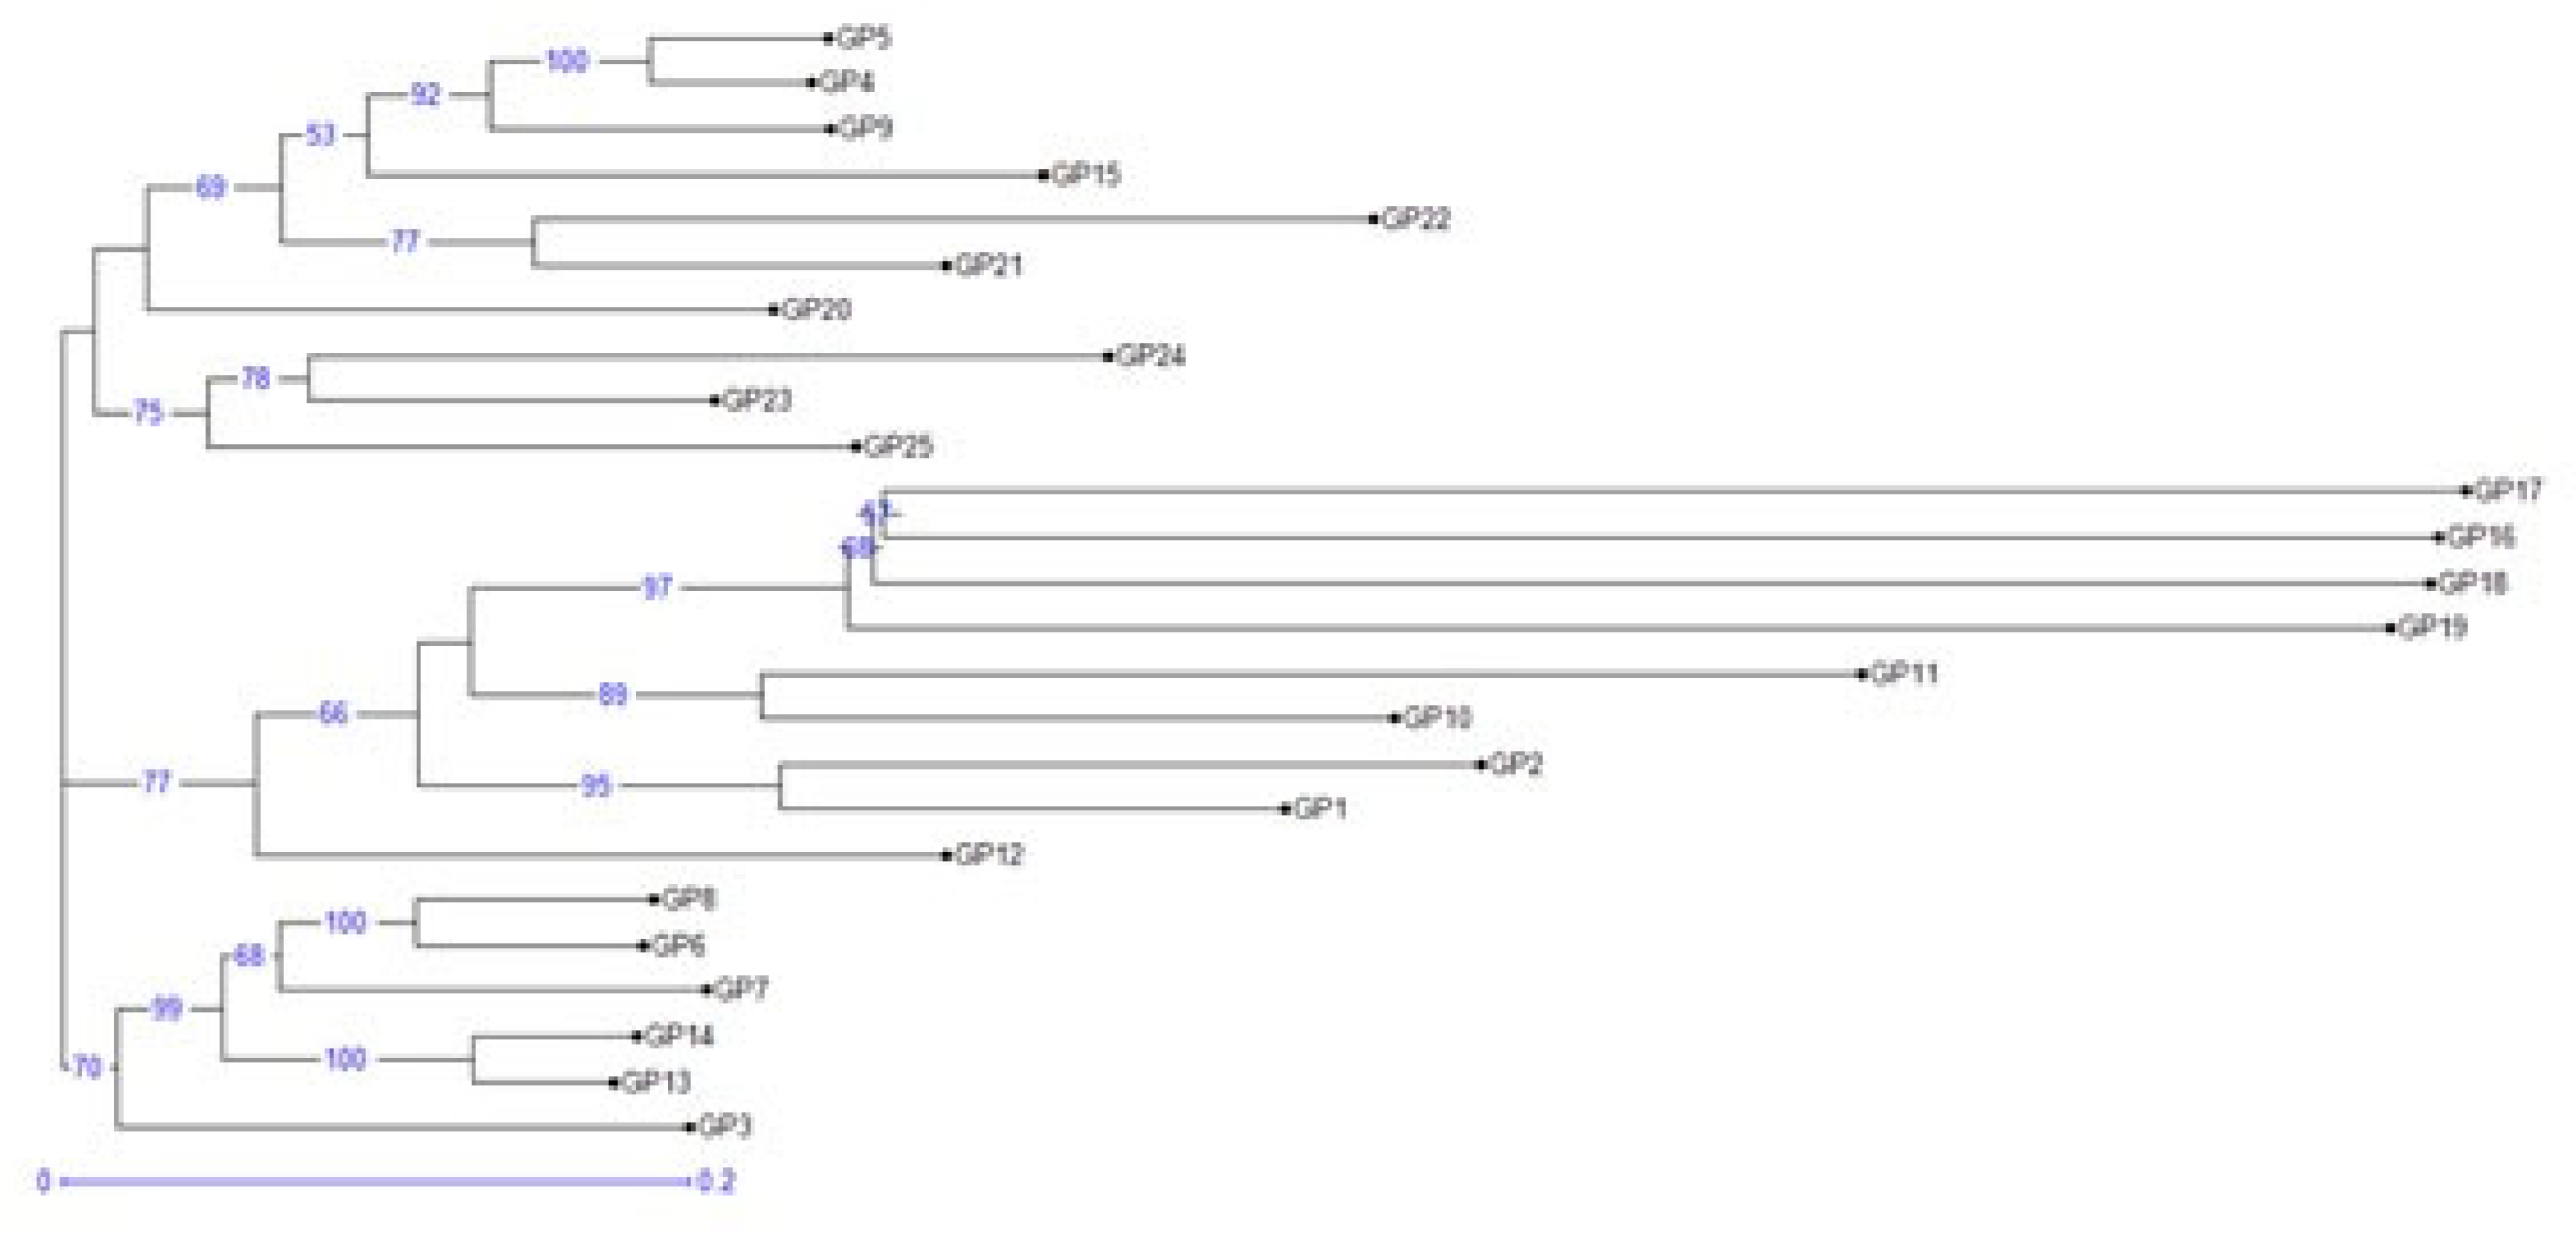
The Vigna accessions were clustered into three main clusters based upon genetic dissimilarity estimated using unweighted pair group method with arithmetic mean (UPGMA) neighbor joining approach (Figure 3). Cluster 1 consists of 10 Vigna accessions which were further divided into two major sub-clusters (Sub-cluster 1a and sub-cluster 1b). Sub-cluster 1a included seven accessions {GP5 (V. sublobata), GP4 (V. sublobata), GP9 (V. trilobata), GP15 (V. radiata var. radiata), GP22 (V. vexillata), GP21 (V. radiata var. setulosa) and GP20 (V. glabrescence)} while, sub-cluster 1b comprised of three accessions {GP 24 (V. dalzelliana), GP23 (V. hainiana) and GP25 (V. unguiculata)}. The second cluster comprised of nine accessions with 8 {GP17 (V. radiata var. mungo), GP16 (V. radiata var. mungo), GP18 (V. radiata var. mungo), GP19 (V. slyestris), GP11 (V. aconitifolia), GP10 (V. aconitifolia), GP2 (V. umbellata cultivated) and GP1 (V. umbellata cultivated)} and 1 accessions (GP12) in sub-cluster 2a and 2b, respectively. The third cluster consisted of 6 accessions that grouped into two sub-clusters namely 3a having 5 accessions {GP8 (V. trilobata), GP6 (V. trilobata), GP7 (V. trilobata), GP14 (V. stipulacea) and GP13 (V. stipulacea)}, and 3b with one accession (GP3 V. umbellata).Nei’s unbiased genetic distance (GD) and genetic identity (GI) were also estimated and based upon the genetic distance, the Vigna accessions were categorized into four populations (pops) (Table 4). The genetic distance between pops ranged from 0.189 (between Pop 4 and 3) and 0.458 (between Pop 4 and 2). The Vigna accessions of Pop 4 and 3 are closely related while accessions from Pop 4 and 2 are distantly related. Pop 1 and Pop3 comprised, four (one of V. sublobata and three of V. mungo) and three accessions (one of V. sublobata, one V. radiata var. radiata and one of V. radiata var. setulosa). While pop 2 comprised of highest of 11 Vigna accessions (three accessions each of V. umbellata, V. trilobata; two each of V. aconitifolia, V. stipulacea and one accession of V. glabrescence) followed by pop 3 having seven accessions (one accession each of V. unguiculata, V. trilobata, V. aconitifolia var. TMV, V. sylvestris, V. vaxillata, V. hainiana and V. dalzelliana).

3.5. Population Structure Analysis

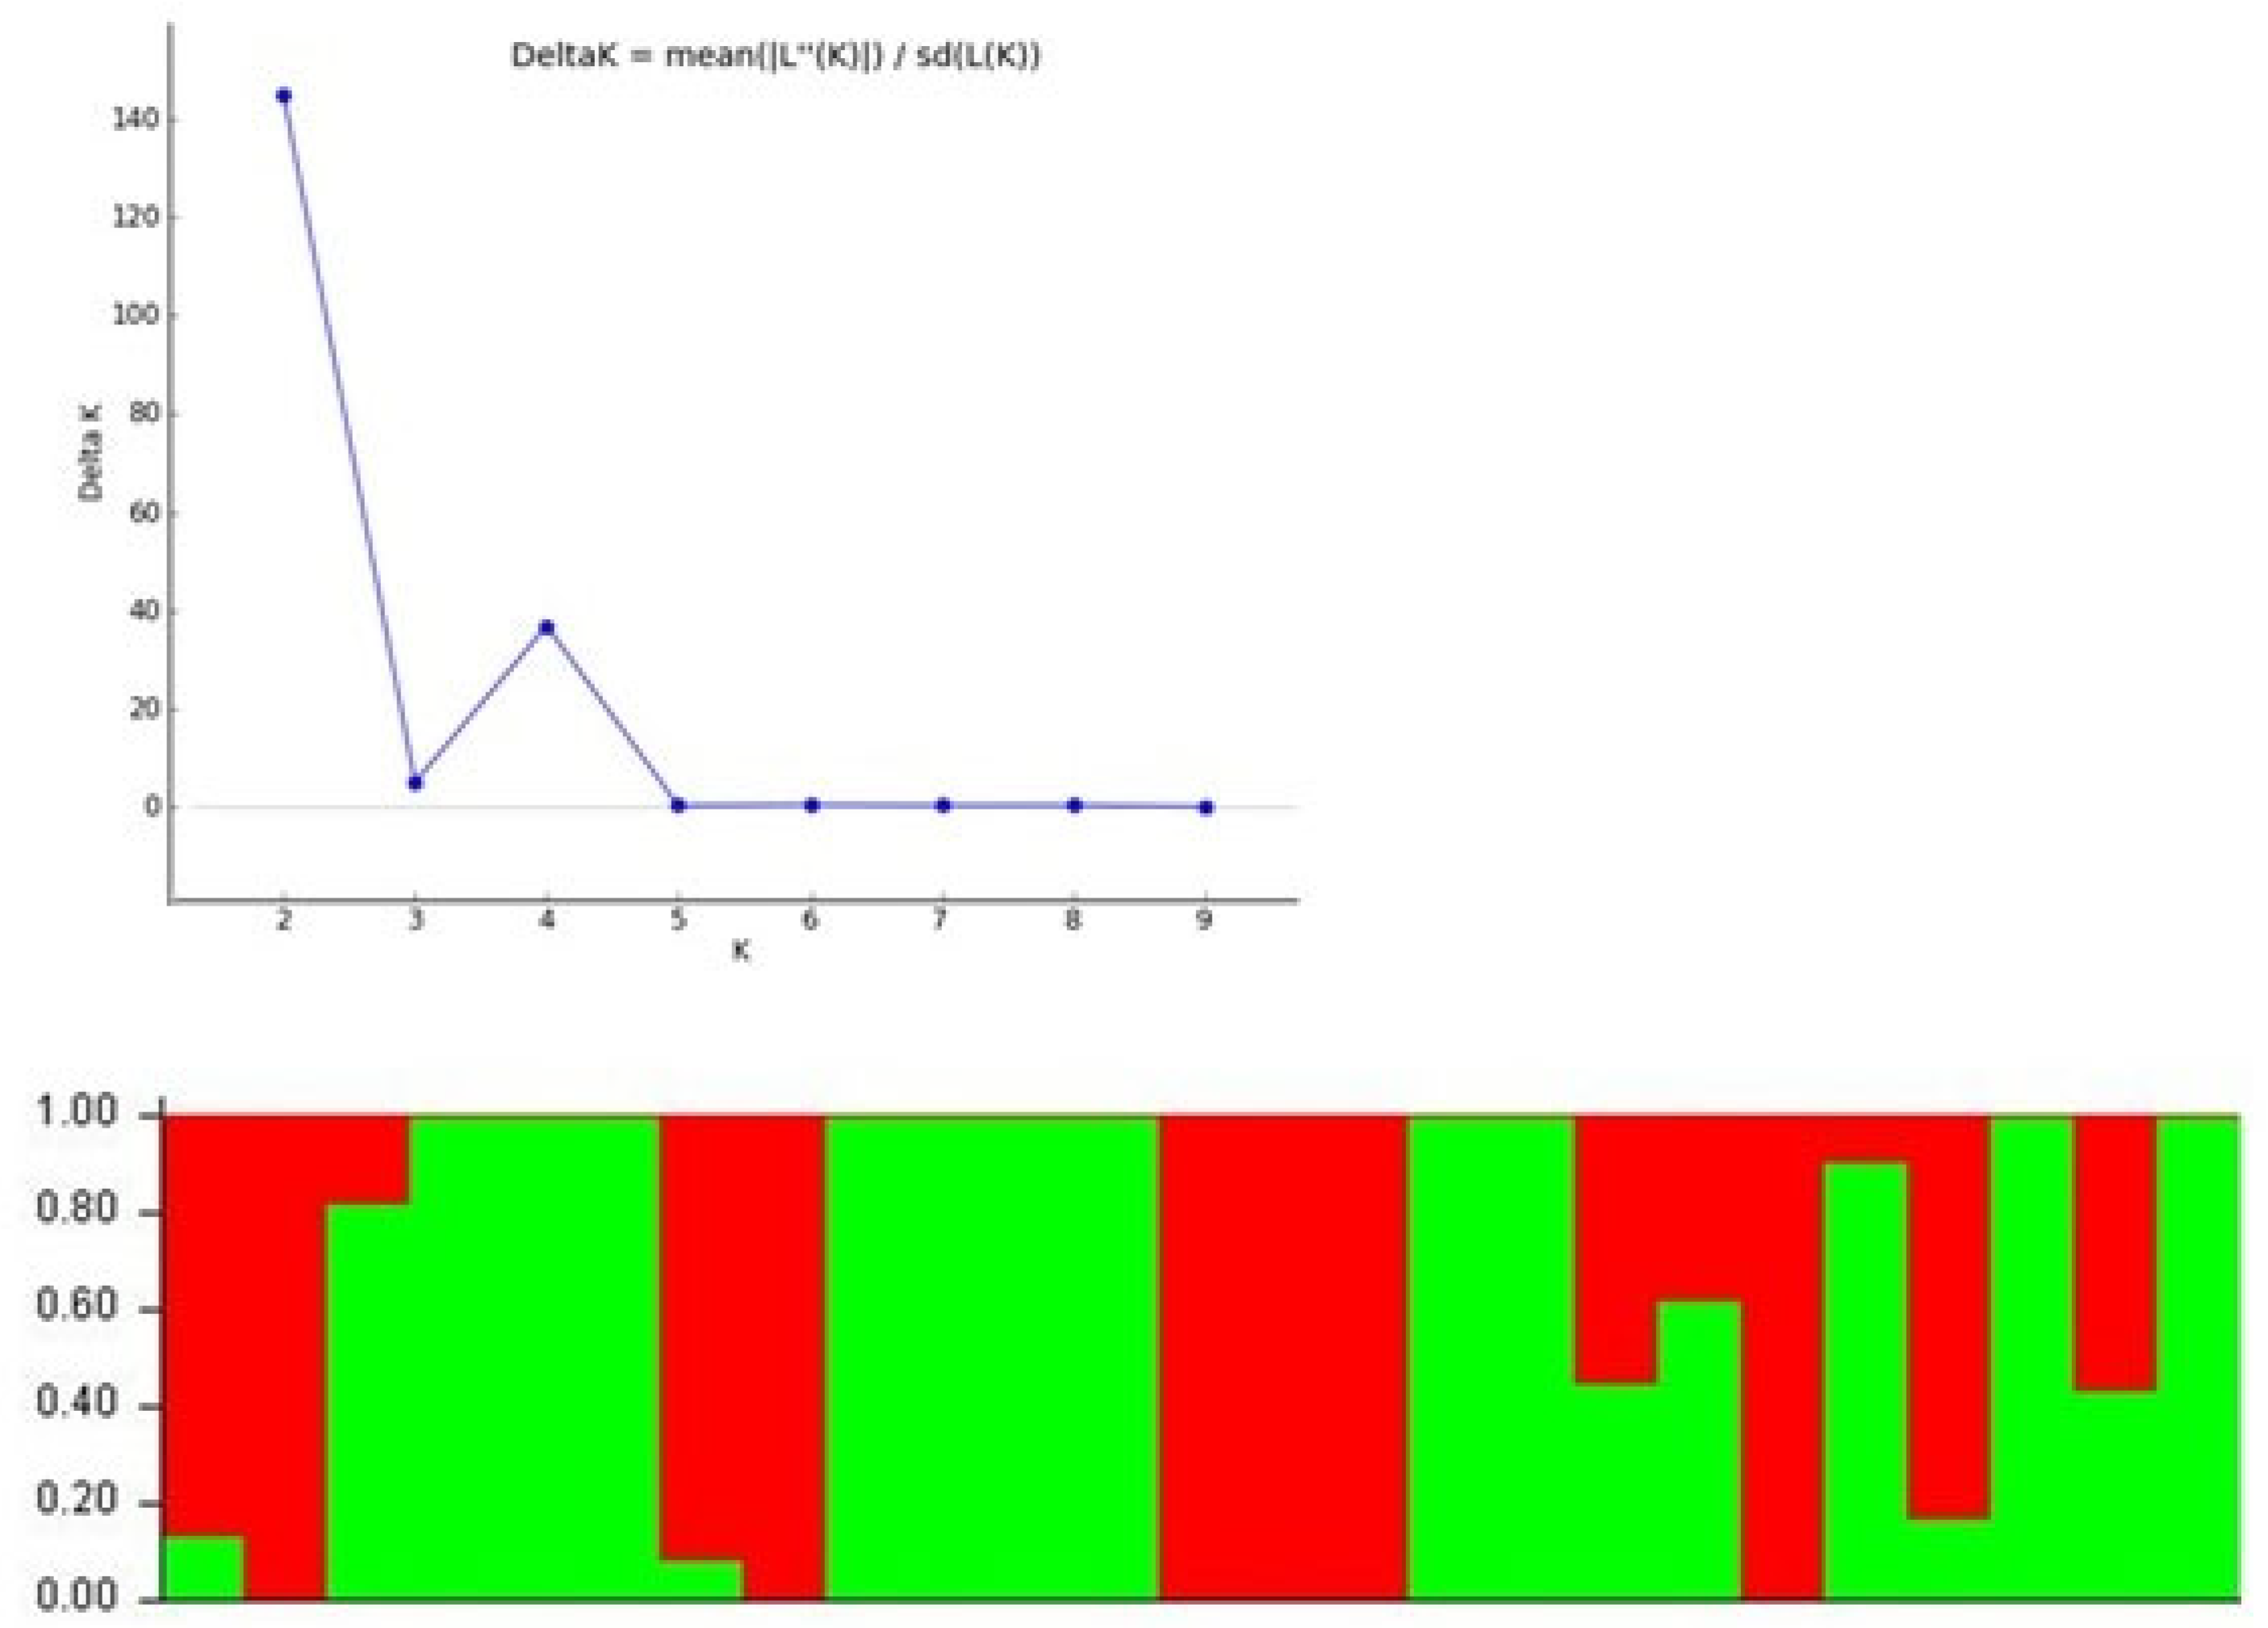
The population structure analysis of 25 Vigna accessions was performed with 130 polymorphicSSR markers. Based upon the admixture model with independent alleles, the maximum delta K value (144.79) draws a sharp peak at K=2 (Figure 4) which divided genotypes into two sub-populations (SP1 and SP2)} (Figure 3). The SP1 comprised of 11 accessions whereas, SP2 had 14 accessions. The sub-population 1 (SP1) included accessions GP1 (V. umbellata cultivated), GP2 (V. umbellata cultivated), GP10 (V. aconitifolia), GP11 (V. aconitifolia), GP12 (V. aconitifolia TMV-1), GP16 (V. radiata var. mungo), GP17 (V. radiata var. mungo), GP18 (V. radiata var. mungo), GP22 (V. vexillata) and GP24 (V. dalzelliana) while, SP2 included GP3 (V. umbellata), GP4 (V. sublobata), GP5 (V. sublobata), GP6 (V. trilobata), GP7 (V. trilobata), GP8 (V. trilobata), GP9 (V. trilobata), GP13 (V. stipulacea), GP14 (V. stipulacea), GP15 (V. radiata var. radiata), GP19 (V. slyestris), GP20 (V. glabrescence), GP21 (V. radiata var. setulosa), GP23 (V. hainiana) and GP25 (V. unguiculata).

3.6. Analysis of Molecular Variance (AMOVA) and Principal Co-Ordinate Analysis (PCoA)

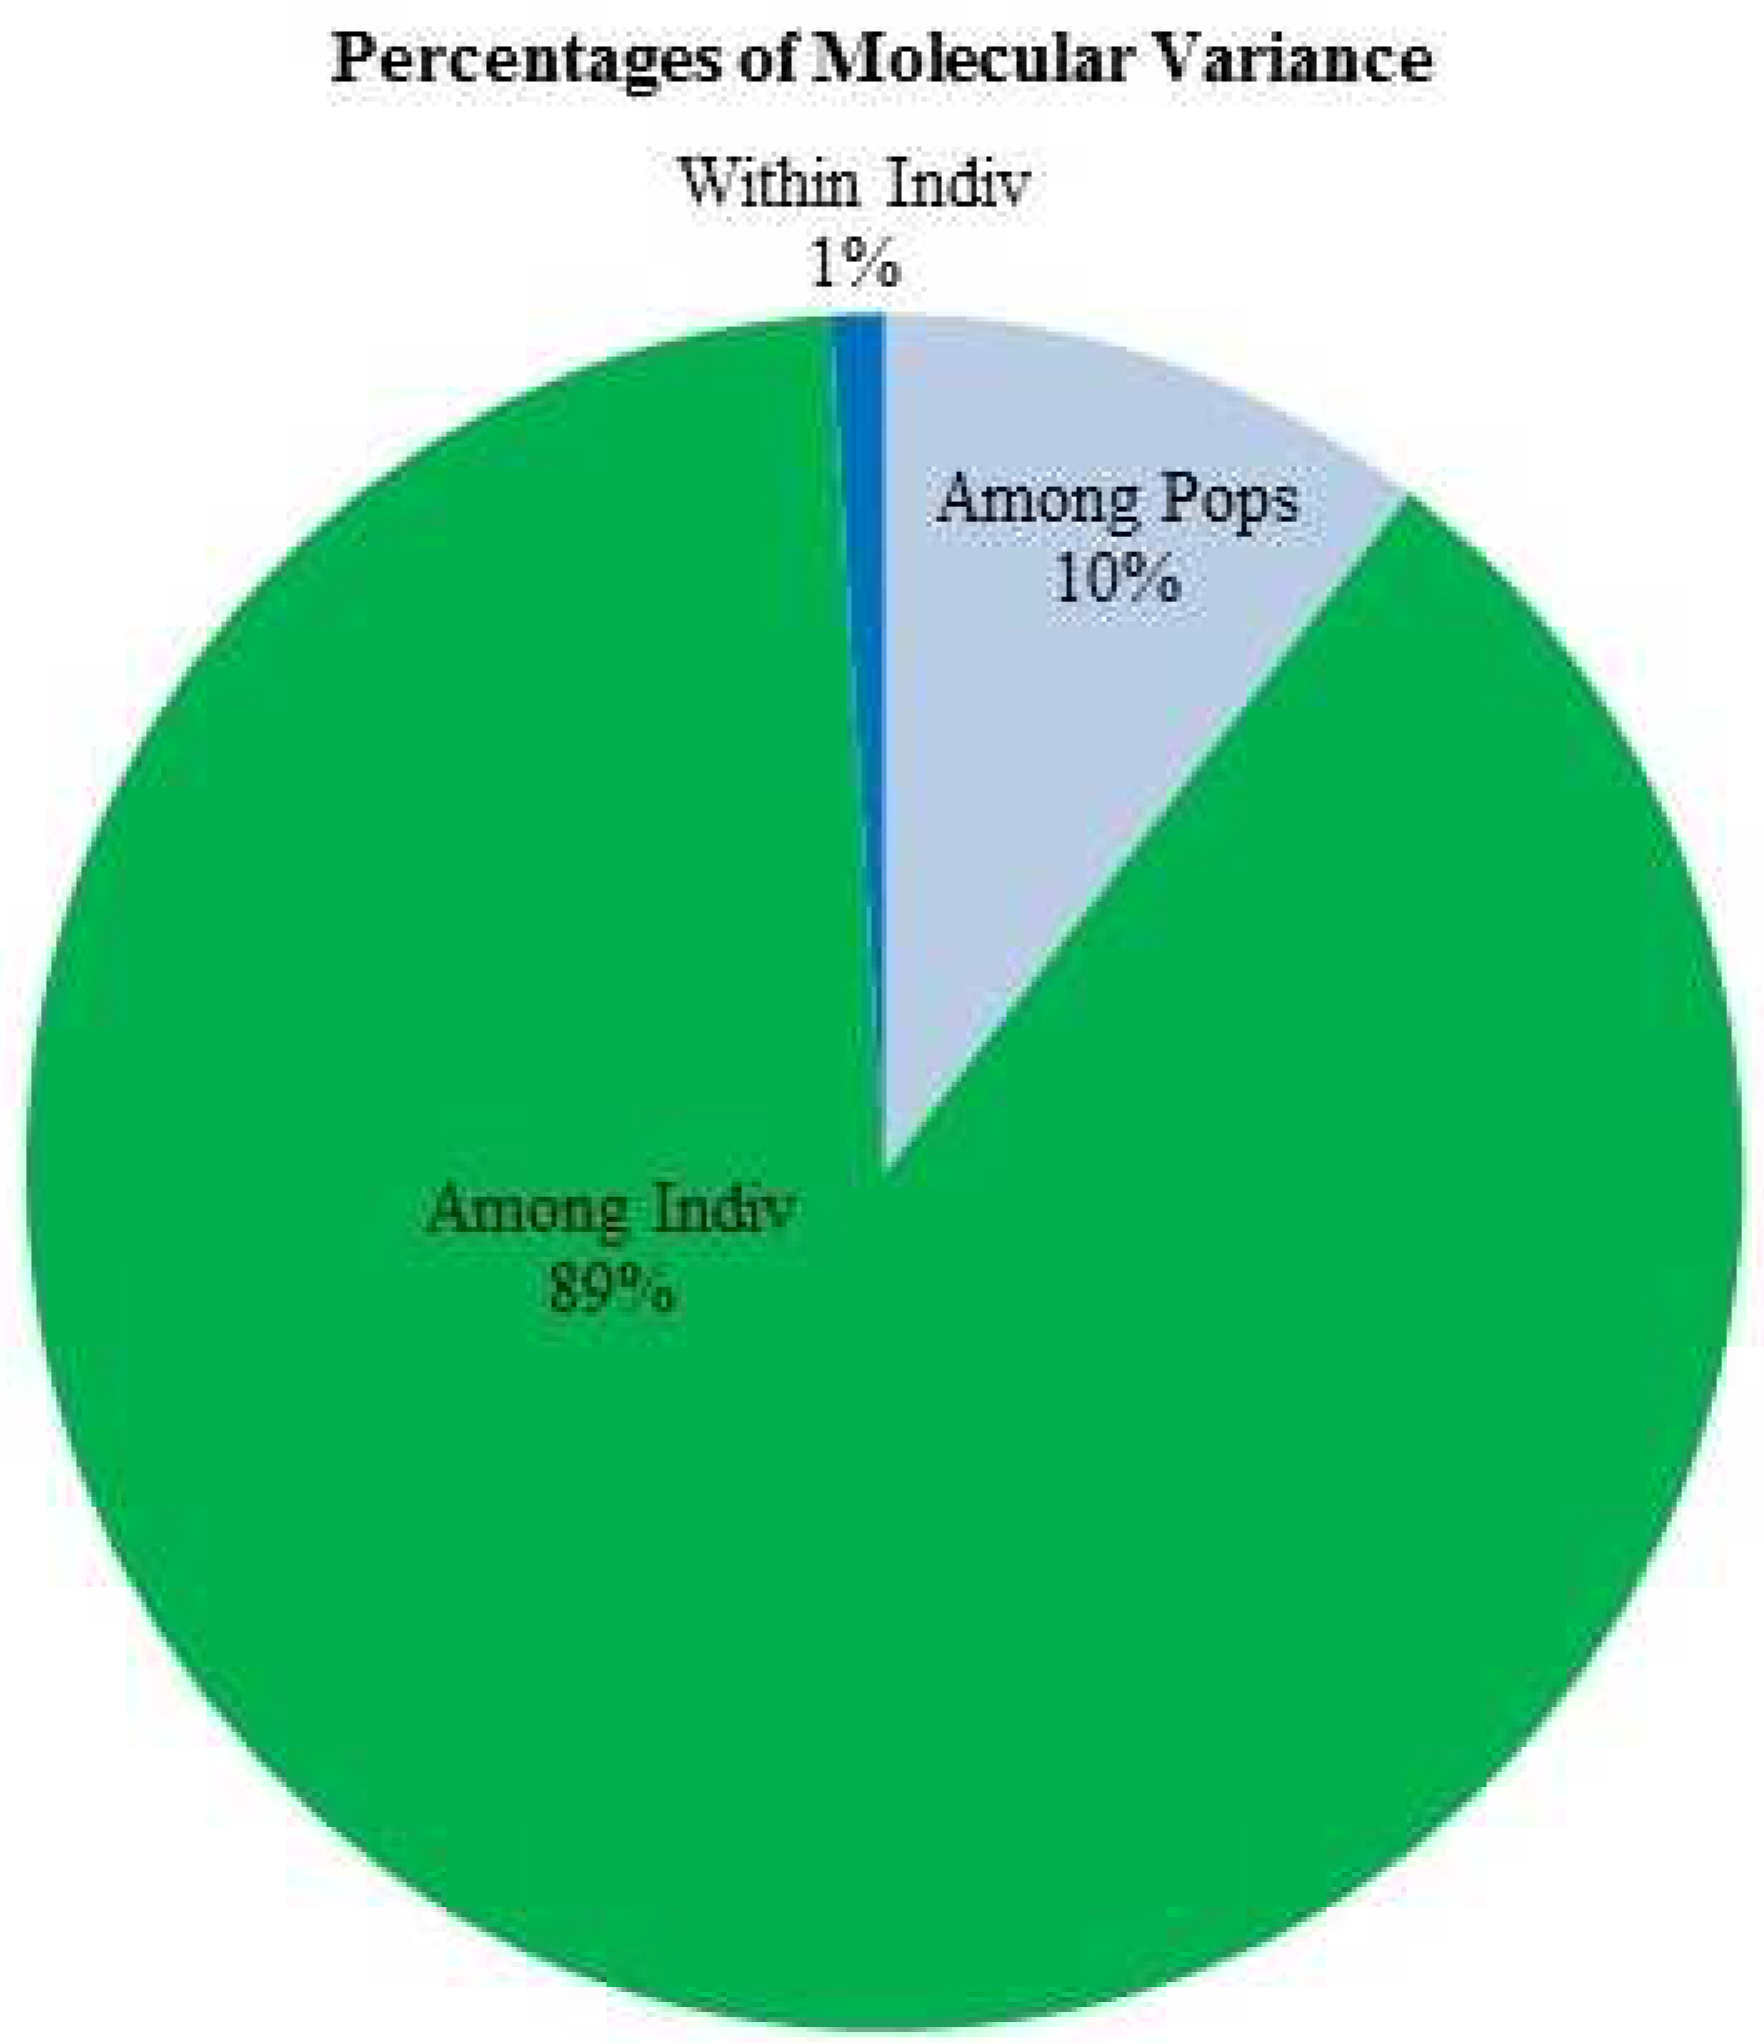
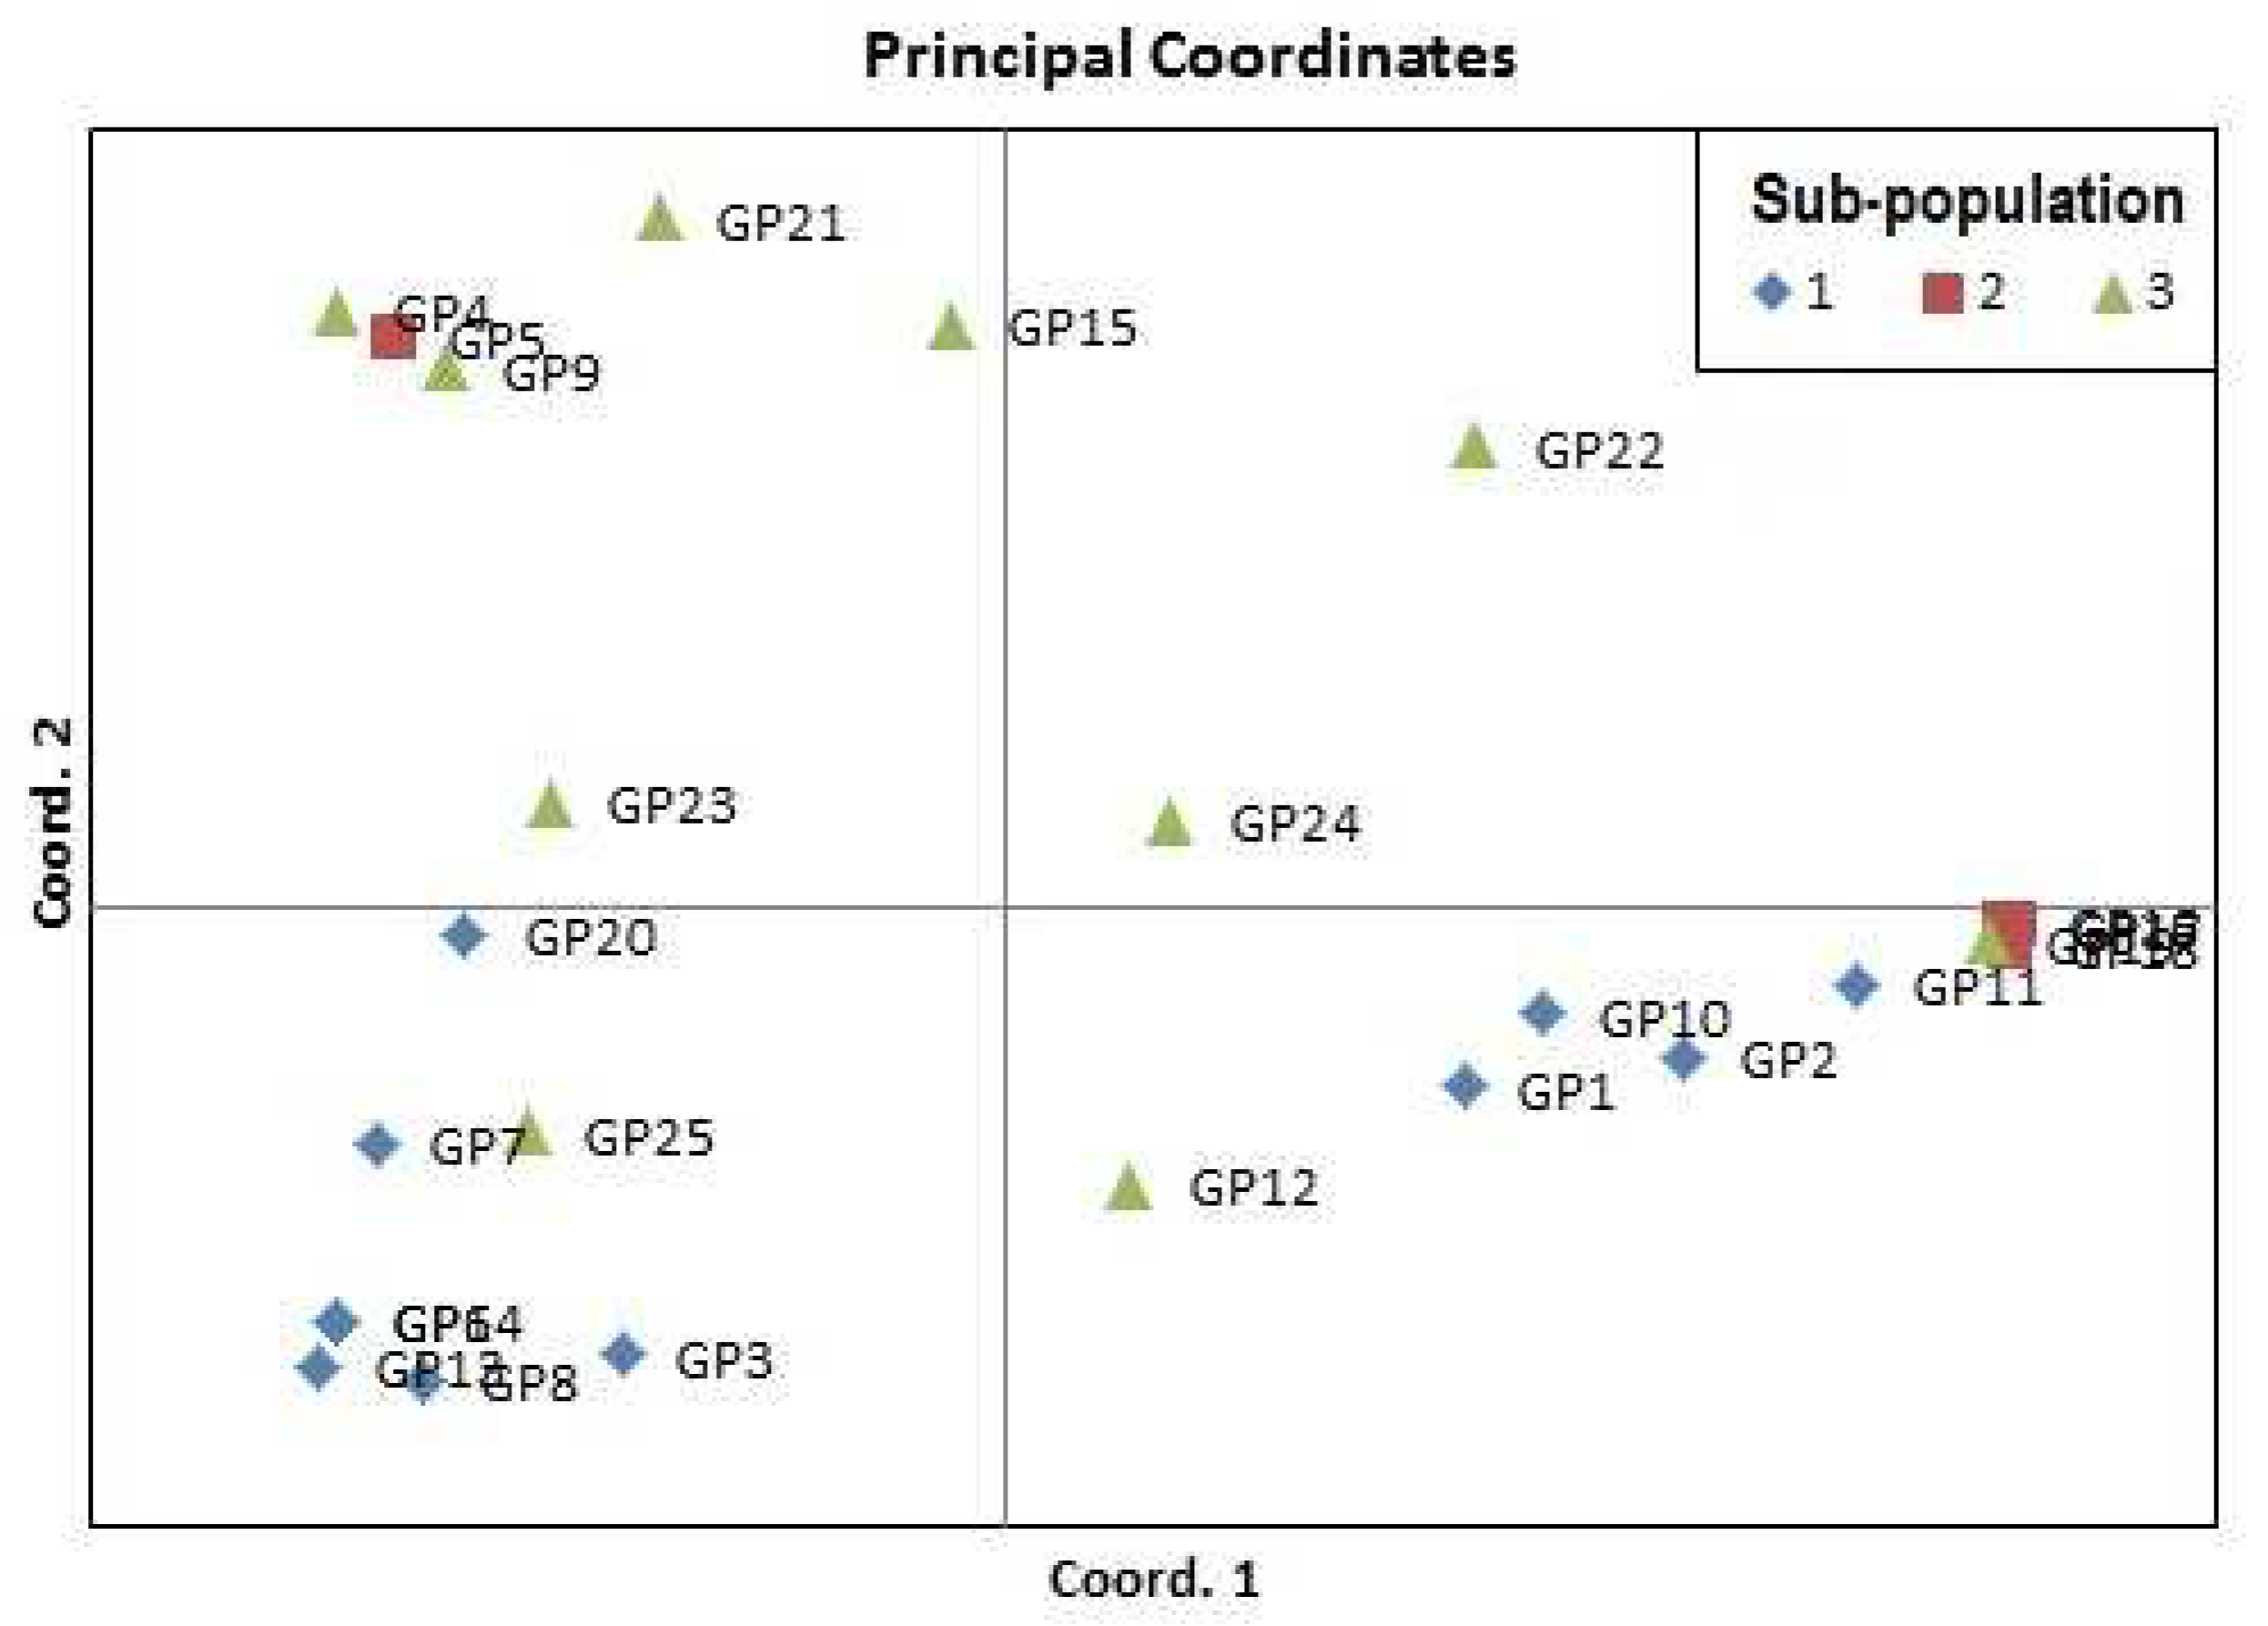
Analysis of molecular variance was performed within and among individuals diversity module. Significant higher genetic variance was observed among the individuals (89%) as compare to within individuals (1%) (Table 5 and Figure 5). Principal co-ordinate analysis (PCoA) revealed that the first and second integral coalitiondeciphering 50.79 and 15.42 per cent of total variance. The PCoA categorized the accessions into four groups involving different species similar to UPGMA-neighbour joining clustering (Figure 6). The biplot PCA showed correlation with UPGMA based phylogenetic tree with respect to grouping of Vigna species accessions.

4. Discussion

Crop improvement is important for every crop species to make it available for mankind. For every crop improvement programmes, availability of accessible genetic variation in the crop genetic resources is indispensable. Determination of genetic diversity provides opportunity for exploitation of useful variation present in the available germplasm in breeding programme as promising parents [47]. Pre-breeding is an approach that harnesses the useful variability in unadapted genetic material which cannot be utilized as such in breeding populationsand serves necessarily as the major stride for employing utilization of genetic variation in improvement programmes [48,49,50,51,52,53,54,55]. The genetic variability existing in the gene banks helps in conservation, characterization and implementation of genetic variation in crop improvement programmes [56]. The Vigna gene pool serves as source of ample amount of untapped genetic polymorphism is available in the wild Vigna species [6,57,4]. For unlocking the available genetic variation, DNA based molecular markers are required but limited genomic resources is available in mungbean.
The present study involved validation of 200 SSR markers out of 250 which were developed from mungbean cv. ML 267 and urdbean cv. Mash 114 using whole genome sequence strategy at School of Agriculture Biotechnology (SAB), Punjab Agricultural University (PAU), Ludhiana [39]. These SSR markers were flanking dinucleotide SSR motifs and covered all 11 linkage groups of mungbean and urdbean. Chromosome 7 has the maximum number of 45 SSR markers whereas chromosome 9 has minimum of 8 SSR markers. Rest of the SSR markers are distributed unevenly on 5, 8, 6, 1, 11, 4, 3, 2 and 10 chromosomes. The SSR markers are comprised of ten different types of dinucleotide repeat motifs and two repeat motifs i.e.(AT)n and (TA)n were predominant. These two dinucleotide repeats (AT/TA) accounted 52.40 per cent of total repeat motifs. In general, it has been observed that di-nucleotide repeats are mainly present in many legume crops [58] but tri-nucleotide repeats have been commonly found in mungbean [35,59,60] and in other legume crops as in pea [61], cowpea [27], chickpea [62], common bean [63] and horse gram [64]. The mononucleotide repeat motifs have been observed in relative abundance in mungbean [65]. Higher number of mono- and tetra-nucleotide repeats was also reported from transcriptome sequencing of adzuki bean [66]. The transcriptome based SSRs can be developed from mononucleotide repeat because such type of markers exhibit high polymorphism. Similarly, the whole genome based SSR developed from mononucleotide repeats will also be more polymorphic than other repeats. However, the chances of error like DNA slippage during PCR amplification by polymerase enzyme machinery cannot be ruled out. Hence, in order to overcome this limitation, dinucleotide repeats were selected for the study.
Simple sequence repeats (SSR) are tandem repeated sequences (1–6 nucleotides), having high rate of polymorphism, reproducibility, co-dominant nature and abundantly distributed throughout the genome. SSRs exhibited excellent degree of transferability betwixt and amongst the closely related species or genera which makes SSR useful molecular marker for the estimation of variation at gene level, mapping of economically important loci and breeding programmes based on molecular markers. The SSR marker transferability is relied on the divergence betwixt the individual accessions. The closer the genetic distance betwixt the accessions, higher the transferability of SSR markers [67]. Within the same species of same genus or across the related genus within families, SSR transferability is higherthan between different genus and families [68]. Marker transferability is a parameter to describe closeness and crossability between the species. Mungbean and other species specific SSR markers have been used in different studies for assessing polymorphism among and between the Vigna accessions or introgression lines. In accordance to the previous reports by Somta et al. [69]; Tangphatsornruang et al. [33]; Gupta et al. [70]; Dikshit et al. [2]; Singh et al. [71]; Gupta et al. [58]; SatinderKaur et al. [72]; Simranjit Kaur et al. [73], the present investigation showed more than 90 per cent marker transferability across the different Vigna accessions. The successful applicability of whole genome sequence based SSRs betwixt different Vigna species accessions showed that the flanking regions of these SSRs are adequately conserved amplification of genomic regions. The very high cross-species transferability percentage depends on the number of species analyzed and genetic distance among them.
The newly developed SSR markers in our study amplified 7 to 24 alleles (average estimate 15.7). The amplification of higher number of alleles is an indicative of the prevalent exalted genetic diversity among the Vigna species. The 4 to 16 alleles per locus have been obtained in the Asiatic mungbean accessions using 53 SSR markers [74]. In another study,GeetaKumari [75] reported 9 to 31 alleles per locus in 119 mungbean accessions of 19 Vigna species. Studies by Dachapak et al. [76], Sarr et al. [77] and Singh et al. [78] also amplified alleles in the range of 15-25 in zombie pea, cowpea and mungbean respectively. Heterozygosity and PIC value are the two important estimates of genetic diversity at genotypic level. The high PIC value in present study is in accordance with other studies [57,76,78,74,77,75] indicated that the microsatellite flanking regions are conserved and highly useful in inferring the phylogenetic relationship between a number of species. Higher estimates of MI and EMR of SSRs suggested high polymorphism of SSR markers. High resolving power (RP) of SSRs (0.5 to 2.0) is another diversity parameter which revealed the marker power for distinguishing betwixt genotypes.Thus, it become clear that, SSR markers have potential in different genetic studies such as crop germplasm characterization, genetic diversity assessment; marker-trait association and marker assisted breeding which helps in development of improved versions of crop varieties.
In general, the results from PCoA and UPGMA clustering were not completely consistent with structure analysis. The progenitor species of mungbean and urdbeani.e. Vignasublobata and Vignasilvestris clustered in two separate clusters as they have been categorized under primary and secondary gene pool. While GeetaKumari et al. [75] reported the grouping of progenitor species in one sub-cluster. Mixed grouping of the members of all three gene pools were also observed after clustering. The primary gene pool (V. radiata var. setulosa) grouped with secondary (V. trilobata) and tertiary gene pool (V. glabrescence, V. vexillata) members under sub-cluster 1a. Similarly, secondary and tertiary gene pool species clustered together in one cluster with two sub-cluster. Similar observations have been recorded by GeetaKumari et al. [75] where secondary (V. trilobata) and tertiary gene pool (V. dalzelliana, V. umbellata and V. vexillata) species accessions clubbed in a sub-cluster.
Population structure analysis depicted two types of populations SP1 and SP2. The highest number of genotypes (14) was grouped into SP2. The accessions in SP1 were mainly of cultivated type whereas most of the wild relatives were grouped into SP2. Based upon the suitable K value which capture the best structure of population, Chen et al. [60] and Noble et al. [78] also divided the mungbean genotypes in cultivated and wild mungbean genotypes having higher genetic similarity. In other Vignaspecies like cowpea, the appropriate K value proved helpful in differentiating the genotypes based upon the geographical as well as genetic similarity [79,80,81]. The accessions of progenitors of mungbean and urdbean (V. sublobata and V. silvestris) and their relative species V. radiata var. setulosa and V. radiata var. mungo categorized separately in SP1 and SP2 while GeetaKumari et al. [75], Singh et al. [78], Pratap et al. [74], Sexena et al. [82], Pandiyan et al. [83], Kumar et al. [84] progenitors categorized with mungbean and urdbean accessions in one group. The secondary gene pool species accession of V. aconitifolia grouped with tertiary gene pool accessions of V. umbellata, V. vexillata, V. dalzellianain SP1 due to their close relationship with each other [6]. Similar to GeetaKumari et al. [75] the V. umbellata and V. trilobata categorized into two groups (SP1 and SP2).The V. hainiana, V. stipulacea, V. glabrescence and V. unguiculata accessions categorized in SP2 as admixture.
AMOVA provides the clues regarding the genetic variation present within and among the individual. The greater variance of 89% among the individuals revealed the presence of high genetic diversity. The low genetic diversity among the population indicates the exchange of germplasm between different regions, distribution of similar Vigna species [60,80,75]. Among the population low level of genetic diversity of 10% has been observed our study while GeetaKumari et al. [75] obtained the high level of genetic diversity of 88.33% among the population. Fst is an estimate of population differentiation on account of genetic composition. Frankham et al. [85] stated that the Fst estimate <0.15 is an important criterion for population discrimination. The obtained Fst value of 0.105 is near to the significant value indicating the low differentiation between individuals. The results of principal co-ordinate analysis (PCoA) and UPGMA based clustering were in agreement showing gene diversity and clear differentiation of cultivated and wild Vigna species.

5. Conclusions

Vigna species gene pool harbors huge genetic diversity with variable alleles that can be harnessed for developing cultivars having high yield potential. Elucidating the underlying genetic variation present in both the wild and cultivated species will be helpful in widening the genetic base of breeding lines and marker assisted introgression of desirable traits into modern cultivars for successful genetic improvement programmes. In the present study the newly developed WGS based SSR markers are highly polymorphic in nature and showed high rate of cross-species transferability among Vignaaccessions, which indicates their usefulness in pre-breeding and genetic dissection of novel genes/QTLs linked with agronomic performance, nutritional quality, resistance to diseases and insect-pests and tolerance towards abiotic stresses.

Authors' Contributions

PS, TSB and AS: Conceived and designed the study. PS: field and laboratory performed experiments. ISY: designed the SSR primers. NL and SAHP: assisted in designing SSR primers. KSM: assisted in field and laboratory experiments. JA: Analysis of data and proof-reading. PS: preparation of manuscript. PS, PS and SN: correction in manuscript. PS, TSB and AS: revised and edited the manuscript.

Declaration of Competing Interest

Authors of the manuscript stated that there is no competing interest regarding the financial as well as individual conflict.

Acknowledgments

Department of Biotechnology, Govt. of India, New Delhi is highly appreciative for providing funding and thankful to Department of Plant Breeding and Genetics, Punjab Agricultural University (PAU), Ludhiana for facilitating in conducting this research.

References

  1. Schrire, B.D. Tribe Phaseoleae. In Legumes of the world. Royal Botanic Gardens; Lewis, G., Schrire, B., Mackinder, B.; Lock, M. Eds.; 2005, pp. 393–431.
  2. Dikshit, H.K.; Singh, D.; Singh, A.; Jain, N.; Kumari, J.; Sharma, T.R. Utility of adzuki bean [Vigna angularis (Willd.) Ohwi & Ohashi] simple sequence repeat (SSR) markers in genetic analysis of mungbean and related Vigna spp. Afr. J. Biotechnol. 2012, 11, 13261–13268. [Google Scholar] [CrossRef]
  3. Tomooka, N.; Yoon, M.S.; Doi, K.; Kaga, A.; Vaughan, D. AFLP analysis in diploid species in the genus Vignasub-genus Ceratotropis. Genet. Resour. Crop Evol. 2002, 49, 521–530. [Google Scholar] [CrossRef]
  4. Takahashi, Y.; Somta, P.; Muto, C.; Iseki, K.; Naito, K.; Pandiyan, M.; Natesan, S.; Tomooka, N. Novel Genetic Resources in the Genus Vigna Unveiled from Gene Bank Accessions. PLoS ONE 2016, 11, e0147568. [Google Scholar] [CrossRef]
  5. Tomooka, N.; Isemura, T.; Naito, K.; Kaga, A.; Vaughan, D. Vigna species. In Broadening of Genetic Base of Grain Legumes; Singh, M., et al., Eds. Springer: India, 2014; pp. 175–208. [Google Scholar] [CrossRef]
  6. Bisht, I.S.; Bhat, K.V.; Lakhanpaul, S.; Latha, M.; Jayan, P.K.; Biswas, B.K.; Singh, A.K. Diversity and genetic resources of wild Vigna species in India. Genet. Resour. Crop Evol. 2005, 52, 53–68. [Google Scholar] [CrossRef]
  7. Akbar, W.; Akhtar, M.A.; Murtaza, G.; Hussain, A.; Javed, H.M.; Arshad, M.; Maqbool, M.A. Mungbean Yellow Mosaic Disease and its Management. J. Agric. Basic Sci. 2019, 4, 34–44. [Google Scholar]
  8. Kang, Y.J.; Kim, S.K.; Kim, M.Y.; Lestari, P.; Kim, K.H.; Ha, B.K.; Jun, T.H.; et al. Genome sequence of mungbean and insights into evolution within Vigna species. Nat. Commun. 2014, 5, 5443. [Google Scholar] [CrossRef] [PubMed]
  9. Rohilla, V.; Yadav, R.K.; Poonia. A.; Sheoran, R.; Kumari, G.; Shanmugavadivel, P.S.; Pratap, A. Association Mapping for Yield Attributing Traits and Yellow Mosaic Disease Resistance in Mung Bean [Vignaradiata (L.)Wilczek]. Front. Plant Sci. 2022, 12, 749439. [Google Scholar] [CrossRef] [PubMed]
  10. Garg, D.D.; Arya, R.S.; Sharma, T.; Dhuria, R.K. Effect of replacement of sewan straw (Lasiruss indicus) by moong (Phaseolus aureus) chara on rumen and haemato-biochemical parameters in sheep. Vet. Pract. 2004, 5, 70–73. [Google Scholar]
  11. Agboola, A.A.; Fayemi, A.A.A. Fixation and excretion of nitrogen by tropical legumes. Agron. J. 1972, 64, 409–412. [Google Scholar] [CrossRef]
  12. Chen, X.; Sorajjapinun, W.; Reiwthongchum, S.; Srinives, P. Identification of parental mungbean lines for production of hybrid varieties. Chiang Mai Univ. J. 2003, 2, 97–105. [Google Scholar]
  13. Yasmeen, T.; Hameed, S.; Tariq, M.; Ali, S. Significance of arbuscularmycorrhizal and bacterial symbionts in a tripartite association with Vignaradiata. Acta Physiologiae Plantarum 2012, 34, 1519–1528. [Google Scholar] [CrossRef]
  14. Huttner, E. The international mungbean improvement network. In Souvenir International Conference Pulses as the Climate Smart Crops: Challenges and Opportunities at International Convention Centre (Minto Hall); Bhopal, India, 2020, pp. 33–36.
  15. Nair, R.M.; MahbubulAlam, A.K.M.; Douglas, C.; Gowda, A.; Aditya Pratap; Win, M.M.; Karimi, R.; Emmanuel, M.K.; Binagwa, P.; Boddepalli, V.N.; Chaudhari, S.; et al. Establishing the International Mungbean Improvement Network. Australian Centre for International Agricultural Research. FR2021-086. 2022, Available Online:. Available online: https://www.aciar.gov.au/sites/default/files/2022-03/CIM-2014-079-final-report_0.pdf (accessed on 17 January 2023).
  16. 16. Annonymous. Project Coordinator’s Report, All India Coordinated Research Project on MULLARP.ICAR-Indian Institute of Pulses Research, Kanpur, 2018.
  17. Baraki, F.; Gebregergis, Z.; Belay, Y.; Berhe, M.; Zibelo, H. Genotype x environment interaction and yield stability analysis of mungbean (Vigna radiata (L.) Wilczek) genotypes in Northern Ethiopia. Cogent Food Agric. 2020, 6, 1729581. [Google Scholar] [CrossRef]
  18. Chauhan, Y.S.; Douglas, C.; Rachaputi, R.C.N.; Agius, P.; Martin, W.; King, K.; et al. Physiology of mungbean and development of the mungbean crop model. In: Proceedings of the Ist Australian Summer Grains Conference, Gold Coast, QL. 2010.
  19. Pratap, A.; Gupta, S.; Basu, P.S.; Tomar, R.; Dubey, S.; Rathore, M.; et al. Towards development of climate smart mungbean: Challenges and opportunities. In Genomic Designing of Climate-Smart Pulse Crops; Springer: Cham, Switzerland, 2019; pp. 235–264. [Google Scholar] [CrossRef]
  20. Hinz, R.; Sulser, T.B.; Hüfner, R.; Mason-D’Croz, D.; Dunston, S.; Nautiyal, S.; et al. Agricultural development and land use change in India: A scenario analysis of trade-offs between UN sustainable development goals (SDGs). Earth’s Future 2020, 8, e2019EF001287. [Google Scholar] [CrossRef]
  21. Saini, P. Inheritance Studies and Mapping of Yellow Mosaic Disease Resistance in an Interspecific Cross of Mungbean (Vigna radiata (L.) Wilczek) and Urdbean (Vigna mungo (L.) Hepper). Ph.D. Dissertation, Punjab Agricultural University, Ludhiana, India, 2020; pp. 1–150. [Google Scholar]
  22. Somta, P.; Musch, W.; Kongsamai, B.; Chanprame, S.; Nakasathien, S.; Toojinda, T.; Sorajjapinun, W.; Seehalak, W.; Tragoonrung, S.; Srinives, P. New microsatellite markers isolated from mungbean (Vignaradiata(L.) Wilczek). Mol. Ecol. Resour. 2008, 8, 1155–1157. [Google Scholar] [CrossRef]
  23. Lestari, P.; Kim, S.K. ; Reflinur; Kang, Y.J.; Dewi, N.; Lee Suk-Ha. Genetic diversity of mungbean (Vignaradiata L.) germplasm in Indonesia. Plant Genet. Resour. 2014, 12, S91–S94. [Google Scholar] [CrossRef]
  24. Savithramma, D.L.; Ramakrishnan, C.K.D. Development and characterization of newly developed genomic SSR markers in Mung bean (Vignaradiata(L. In ) Wilczek). In Proceedings of the 2nd International Conference on Genetic & Protein Engineering, Atlanta, GA, USA, 14–16 November 2016; 43p. [Google Scholar]
  25. Somta, P.; Srinives, P. Genome research in mungbean [Vignaradiata (L.)Wilczek] and blackgram [V. mungo (L.) Hepper]. Science Asia 2007, 1, 69–74. [Google Scholar] [CrossRef]
  26. Chaitieng, B.; Kaga, A.; Tomooka, N.; Isemura, T.; Kuroda, Y.; Vaughan, D.A. Development of a black gram [Vigna mungo (L.)Hepper] linkage map and its comparison with an azuki bean [Vigna angularis (Willd.) Ohwi and Ohashi] linkage map. Theor. Appl. Genet. 2006, 113, 1261–1269. [Google Scholar] [CrossRef]
  27. Gupta, S.K.; Gopalakrishna, T. Development of unigene-derived SSR markers in cowpea (Vignaunguiculata) and their transferability to other Vigna species. Genome 2010, 53, 508–523. [Google Scholar] [CrossRef]
  28. Singh, B.; Das, A.; Parihar, A.K.; Bhagawati, B.; Singh, D.; Pathak, K.N.; Dwivedi, K.; Das, N.; Keshari, N.; Midha, R.L.; et al. Delineation of Genotype-by-Environment interactions for identifcation and validation of resistant genotypes in root-knot nematode (Meloidogyne incognita) using GGE biplot. Sci. Rep. 2020, 10, 4108. [Google Scholar] [CrossRef]
  29. Kumar, S.V.; Tan, S.G.; Quah, S.C.; Yusoff, K. Isolation of microsatellite markers in mungbean, Vigna radiata. Mol. Ecol. Notes 2002, 2, 96–98. [Google Scholar] [CrossRef]
  30. Kumar, S.V.; Tan, S.G.; Quah, S.C.; Yusoff, K. Isolation and characterization of seven tetranucleotide microsatellite loci in mungbean, Vigna radiata. Mol. Ecol. Notes 2002, 2, 293–295. [Google Scholar] [CrossRef]
  31. Miyagi, M.; Humphry, M.; Ma, Z.Y.; Lambrides, C.J.; Bateson, M.; Liu, C.J. Construction of bacterial artificial chromosome libraries and their application in developing PCR-based markers closely linked to a major locus conditioning bruchid resistance in Mungbean [Vigna radiata (L.) Wilczek]. Theor. Appl. Genet. 2004, 110, 151–156. [Google Scholar] [CrossRef] [PubMed]
  32. Gwag, J.G.; Chung, W.K.; Chung, H.K.; Lee, J.H.; Ma, K.H.; Dixit, A.; Park, Y.J.; Cho, E.G.; Kim, T.S.; Lee, S.H. Characterization of new microsatellite markers in mungbean. Mol. Ecol. Notes 2006, 6, 1132–1134. [Google Scholar] [CrossRef]
  33. Tangphatsornruang, S.; Somta, P.; Uthaipaisanwong, P.; Chanprasert, P.; Sangsrakru, D.; Seehalak, W.; Sommanas, W.; Tragoonrung, S.; Srinives, P. Characterization of microsatellites and gene contents fromgenome shotgun sequences of mungbean (Vignaradiata(L.) Wilczek). BMC Plant Biology 2009, 9, 137. [Google Scholar] [CrossRef]
  34. Singh, N. Development of cost efficient and rapid method for developing homozygous SSR markers in mungbean Vignaradiata (L.)Wilczek and its validation in Vigna species. M.Sc. Thesis, . Tamil Nadu Agricultural University, Tamil Nadu, India, 2011. [Google Scholar]
  35. Singh, N.; Singh, H.; Nagarajan, P. Development of SSR markers in mung bean, Vigna radiata (L.) Wilczek using in silico methods. J. Crop Weed 2013, 9, 69–74. [Google Scholar]
  36. Shrivastava, D.; Verma, P.; Bhatia, S. Expanding the repertoire of microsatellite markers for polymorphism studies in Indian accessions of mungbean (Vigna radiata L. Wilczek). Mol. Biol. Rep. 2014, 41, 5669–5680. [Google Scholar] [CrossRef]
  37. Bangar, P.; Chaudhary, A.; Umdale, S.; Kumari, R.; Tiwari, B.; Kumar, S.; Gaikwad, A.B.; Bhat, K.V. Detection and characterization of polymorphic simple sequence repeats markers for the analysis of genetic diversity in Indian mungbean [Vigna radiata (L.) Wilczek]. Indian J. Genet. 2018, 78, 111–117. [Google Scholar] [CrossRef]
  38. Doyle, J.J.; Doyle, J.L. A rapid DNA isolation procedure for small quantities of fresh leaf tissue. Phytochem. Bull. 1987, 19, 11–15. [Google Scholar]
  39. Thakur, S. Whole genome de novo assembly of Vigna mungo and Vigna radiata and In silico comparative analysis for marker development. Ph.D. Dissertation, Punjab Agricultural University, Ludhiana, India, 2018. [Google Scholar]
  40. Peakall, R.; Smouse, P.E. GenAlEx 6.5: Genetic analysis in Excel. Population genetic software for teaching and research: An update. Bioinformatics 2012, 28, 2537e2539. [Google Scholar] [CrossRef]
  41. Pritchard, J.K.; Stephens, M.; Donnelly, P. Inference of population structure using multilocus genotype data. Genetics 2000, 155, 945–959. [Google Scholar] [CrossRef]
  42. Earl, D.A. STRUCTURE HARVESTER: A website and program for visualizing STRUCTURE output and implementing the evanno method. Conserv. Genet. Resour. 2012, 4, 359–361. [Google Scholar] [CrossRef]
  43. Perrier, X.; Jacquemoud-Collet, J.P. DARwin software: http://darwin. cirad. fr/darwin. 5 edn.Cirad, Montpellier. 2006.
  44. Botstein, D.; White, R.L.; Skolnick, M.; Davis, R.W. Construction of a genetic linkage map in man using restriction fragment length polymorphism. Am. J. Hum. Genet. 1980, 32, 314–331. [Google Scholar] [PubMed]
  45. Powell, W.; Morgante, M.; Andre, C.; Hanafey, M.; Vogel, J.; Tingey, S.; Rafalski, A. The comparison of RFLP, RAPD, AFLP and SSR (microsatellite) markers for germplasm analysis. Mol. Breed. 1996, 2, 225–238. [Google Scholar] [CrossRef]
  46. Prevost, A.; Wilkinson, M.J. A new system of comparing PCR primers applied to ISSR fingerprinting of potato cultivars. Ther. Appl. Genet. 1999, 98, 107–112. [Google Scholar] [CrossRef]
  47. Nayak, S.N.; Song, J.; Villa, A.; Pathak, B.; Ayala-Silva, T.; Yang, X.; Todd, J.; Glynn, N.C.; Kuhn, D.N.; Glaz, B.; et al. Promoting utilization of Saccharum spp. genetic resources through genetic diversity analysis and core collection construction. PLoS ONE 2014, 9, 110856. [Google Scholar] [CrossRef]
  48. Nass, L.L.; Paterniani, E. Pre-breeding: A link between genetic resources and maize breeding. Scientia Agricola 2000, 57, 581–587. [Google Scholar] [CrossRef]
  49. Haussmann, B.I.G.; Parzies, H.K.; Presterl, T.; Susic, Z.; Mieddaner, T. Plant genetic resources in crop improvement. Plant Genet. Resour. 2004, 2, 3–21. [Google Scholar] [CrossRef]
  50. Acosta-Gallegos, J.; Kelly, J.D.; Gepts, P. Prebreeding in common bean and use of genetic diversity from wild germplasm. Crop Sci. 2007, 47, 44–59. [Google Scholar] [CrossRef]
  51. Shimelis, H.; Laing, M. Timelines in conventional crop improvement: Pre-breeding and breeding procedures. Aus. J. Crop Sci. 2012, 11, 1542–1549. [Google Scholar]
  52. Sharma, S.; Upadhyaya, H.D.; Varshney, R.K.; Gowda, C.L.L. Pre-breeding for diversification of primary gene pool and genetic enhancement of grain legume. Front. Plant Sci. 2013, 4, 1–14. [Google Scholar] [CrossRef]
  53. Kumar, V.; Shukla, Y.M. Pre-breeding: Its applications in crop improvement. Research News For U (RNFU) 2014, 16, 199–202. [Google Scholar]
  54. Meena, A.K.; Gurjar, D.; Kumhar, B.L. Pre-breeding is a bridge between wild species and improved genotypes-a review. Chem. Sci. Rev. Lett. 2017, 6, 1141–1151. [Google Scholar]
  55. Jain, S.K. ; Omprakash Pre-breeding: A Bridge between Genetic Resources and Crop Improvement. Int. J. Curr. Microbiol. App. Sci. 2019, 8, 1998–2007. [Google Scholar] [CrossRef]
  56. Singh, R.B.; Singh, B.; Singh, R.K. Evaluation of genetic diversity in Saccharum species clones and commercial varieties employing molecular (SSRs) and physiological markers. Indian J. Plant Genet. Resour. 2018, 31, 17–26. [Google Scholar] [CrossRef]
  57. Wang, M.L.; Barkley, N.A.; Gillaspie, G.A.; Pederson, G.A. Phylogenetic relationships and genetic diversity of the USDA Vigna germplasm collection revealed by gene-derived markers and sequencing. Genet. Res. 2008, 90, 467–480. [Google Scholar] [CrossRef]
  58. Blair, M.W.; Hurtado, N.; Chavarro, C.M.; Munoz-Torres, M.C.; Pedraza, M.F.; Tomins, J.; Wing, R. Gene-based SSR markers for common bean (Phaseolus vulgaris L.) derived from root and leaf tissue ESTs: An integration of the BMC series. BMC Plant Biol. 2011, 11, 50. [Google Scholar] [CrossRef]
  59. Gupta, S.K.; Bansal, R.; Gopalakrishna, T. Development and characterization of genic SSR markers for mungbean (Vigna radiate (L.) Wilczek). Euphytica 2014, 195, 245–258. [Google Scholar] [CrossRef]
  60. Chen, H.; Qiao, L.; Wang, L.; Wang, S.; Blair, M.W.; Cheng, X. Assessment of genetic diversity and population structure of mungbean (Vigna radiata) germplasm using EST-based and genomic SSR markers. Gene 2015, 566, 175–183. [Google Scholar] [CrossRef]
  61. Gong, Y.M.; Xu, S.C.; Mao, W.H.; Hu, Q.Z.; Zhang, G.W.; Ding, J.; Li, Y.D. Developing new SSR markers from ESTs of pea (Pisum sativum L.). J. Zhejiang Univ. Sci. B. 2010, 11, 702–707. [Google Scholar] [CrossRef]
  62. Choudhary, S.; Sethy, N.K.; Shokeen, B.; Bhatia, S. Development of chickpea EST-SSR markers and analysis of allelic variation across related species. Theor. Appl. Genet. 2009, 118, 591–608. [Google Scholar] [CrossRef]
  63. Blair, M.W.; Hurtado, N. EST-SSR markers from five sequenced cDNA libraries of common bean (Phaseolus vulgaris L.) comparing three bioinformatic algorithms. Mol. Ecol. Resour. 2013, 13, 688–695. [Google Scholar] [CrossRef]
  64. Bhardwaj, J.; Chauhan, R.; Swarnkar, M.K.; Chahota, R.K.; Singh, A.K.; Shankar, R.; Yadav, S.K. Comprehensive transcriptomic study on horse gram (Macrotylomauniflorum): De novo assembly, functional characterization and comparative analysis in relation to drought stress. BMC Genomics 2013, 14, 647. [Google Scholar] [CrossRef] [PubMed]
  65. Jasrotia, R.S.; Yadav, P.K.; Iquebal, M.A.; Bhatt, S.B.; Arora, V.; Angadi, U.B.; Tomar, R.S.; Jaiswal, S.; Rai, A.; Kumar, D. VigSatDB: Genome-wide microsatellite DNA marker database of three species of Vigna for germplasm characterization and improvement. Database 2019, 1–13. [Google Scholar] [CrossRef]
  66. Chen, H.; Liu, L.; Wang, L.; Wang, S.; Somta, P.; Cheng, X. Development and validation of EST SSR markers from the transcriptome of adzuki bean (Vigna angularis). PLoS ONE 2015, 10, e0131939. [Google Scholar] [CrossRef] [PubMed]
  67. Luro, F.L.; Constantino, G.; Terol, J.; Argout, X.; Allario, T.; Wincker, P.; Talon, M.; Ollitrault, P.; Morillon, R. Transferability of the ESR-SSRs developed on Nules clementine (Citrus Clementine Hort ex Tan) to other Citrus species and their effectiveness for genetic mapping. BMC Genomics 2008, 9, 287. [Google Scholar] [CrossRef] [PubMed]
  68. Mnejja, M.; Garcia-Mas, J.; Audergon, J.M.; Arús, P. Prunus microsatellite marker transferability across rosaceous crops. Tree Genet. Genomes 2010, 6, 689–700. [Google Scholar] [CrossRef]
  69. Somta, P.; Seehalak, W.; Srinives, P. Development, characterization and cross-species amplification of mungbean (Vignaradiata) genic microsatellite markers. Conserv.Genet. 2009, 10, 1939–1943. [Google Scholar] [CrossRef]
  70. Gupta, S.K.; Bansal, R.; Vaidya, U.J.; Gopalakrishna, T. Development of EST-derived microsatellite markers in mungbean [Vigna radiata (L.) Wilczek] and their transferability to other Vignaspecies. Indian J. Genet. 2012, 72, 468–471. [Google Scholar]
  71. Singh, A.; Dikshit, H.K.; Jain, N.; Singh, D.; Yadav, R.N. Efficiency of SSR, ISSR and RAPD markers in molecular characterization of mungbean and other Vigna species. Indian J. Biotechnol. 2014, 13, 81–88. [Google Scholar]
  72. Satinder Kaur; Gill, R. K.; Bains, T.S.; Kaur, M.; Thakur, S. Comparative assessment of SSR markers derived from different sources in genetic diversity analysis of Vigna genotypes. Agric. Res. J. 2017, 54, 462–468. [Google Scholar] [CrossRef]
  73. Simranjit Kaur; Bains, T. S.; Sirari, A.; Kaur, S. Evaluation and molecular characterization of advanced interspecific lines for genetic improvement in mungbean [Vigna radiata (L.) Wilczek]. Legume Res. 2019, 42, 729–735. [Google Scholar] [CrossRef]
  74. Pratap, A.; Gupta, S.; Malviya, N.; Tomar, R.; Maurya, R.; John, K.J.; et al. Genome scanning of Asiatic Vigna species for discerning population genetic structure based on microsatellite variation. Mol. Breed. 2015, 35, 178. [Google Scholar] [CrossRef]
  75. GeetaKumari; RoopaLavanya, G. ; Shanmugavadivel, P.S.; Singh, Y.; Singh, P.; Patidar, B.; Madhavan, L.; Gupta, S.; Singh, N.P.; Pratap, A. Genetic diversity and population genetic structure analysis of an extensive collection of wild and cultivated Vigna accessions. Mol. Genet. Genomics, 2021, 296, 1337–1353. [Google Scholar] [CrossRef] [PubMed]
  76. Dachapak, S.; Somta, P.; Poonchaivilaisak, S.; Yimram,T. ; Srinives, P. Genetic diversity and structure of the zombi pea (Vignavexillata (L.) A. Rich) gene pool based on SSR marker analysis. Genetica 2017, 145, 189–200. [Google Scholar] [CrossRef] [PubMed]
  77. Sarr, A.; Bodian, A.; Gbedevi, K.M.; et al. Genetic Diversity and population structure analyses of wild relatives and cultivated cowpea (Vigna unguiculata(L.) Walp.)fromsenegal using simple sequence repeat markers. Plant Mol. Biol. Rep. 2020. [Google Scholar] [CrossRef]
  78. Noble, T.J.; Tao, Y.; Mace, E.S.; Williams, B.; Jordan, D.R.; Douglas, C.A.; Mundree, S.G. Characterization of linkage disequilibrium and population structure in a mungbean diversity panel. Front. Plant Sci. 2018, 8, 2102. [Google Scholar] [CrossRef]
  79. Singh, R.B.; Mahenderakar, M.D.; Jugran, A.K.; Singh, R.K.; Srivastava, R.K. Assessing genetic diversity and population structure of sugarcane cultivars, progenitor species and genera using microsatellite (SSR) markers. Gene 2020, 753, 144800. [Google Scholar] [CrossRef]
  80. Xiong, H.; Shi, A.; Mou, B.; Qin, J.; Motes, D.; Lu, W.; Ma, J.; Weng, Y.; Yang, W.; Wu, D. Genetic diversity and population structure of cowpea (Vigna unguiculata L. Walp). PLoS ONE 2016, 11, e0160941. [Google Scholar] [CrossRef]
  81. Chen, H.; Chen, H.; Hu, L.; Wang, L.; Wang, S.; Wang, M.L.; Cheng, X. Genetic diversity and a population structure analysis of accessions in the Chinese cowpea [Vigna unguiculata(L.) Walp.] germplasm collection. The Crop J. 2017, 5, 363–372. [Google Scholar] [CrossRef]
  82. Luo, Z.; Brock, J.; Dyer, J.M.; Kutchan, T.; Schachtman, D.; Augustin, M.; Ge, Y.; Fahlgren, N.; Abdel-Haleem, H. Genetic Diversity and Population Structure of a Camelina sativa Spring Panel. Front. Plant Sci. 2019, 10, 184. [Google Scholar] [CrossRef]
  83. Saxena, S.; Kole, P.R.; Bhat, K.V.; Pandey, S.P. Species diversity and relationship among Vigna radiata (L.) wilczek and its close wild relatives. Bangladesh J. Botany 2016, 45, 567–573. [Google Scholar]
  84. Pandiyan, M.; Senthil, N.; Ramamoorthi, N.; Muthiah, A.R.; Tomooka, N.; Duncan, V. Interspecifc hybridization of Vigna radiata × 13 wild Vigna species for developing MYMV donor. Electron. J. Plant Breed. 2010, 1, 600–610. [Google Scholar]
  85. Kumar, S.; Gupta, S.; Chandra, S.; Singh, B.B. How wide is the genetic base of pulse crops. In Pulses in New Perspective; Ali, M., Singh, B.B., Kumar, S., Dhar, V., Eds.; Indian Society of Pulses Research and Development: Kanpur, India, 2004; pp. 211–221. [Google Scholar]
  86. Frankham, R.; Ballou, J.D.; Briscoe, D.A. Introduction to Conservation Genetics; Cambridge University Press: Cambridge, UK, 2002. [Google Scholar] [CrossRef]
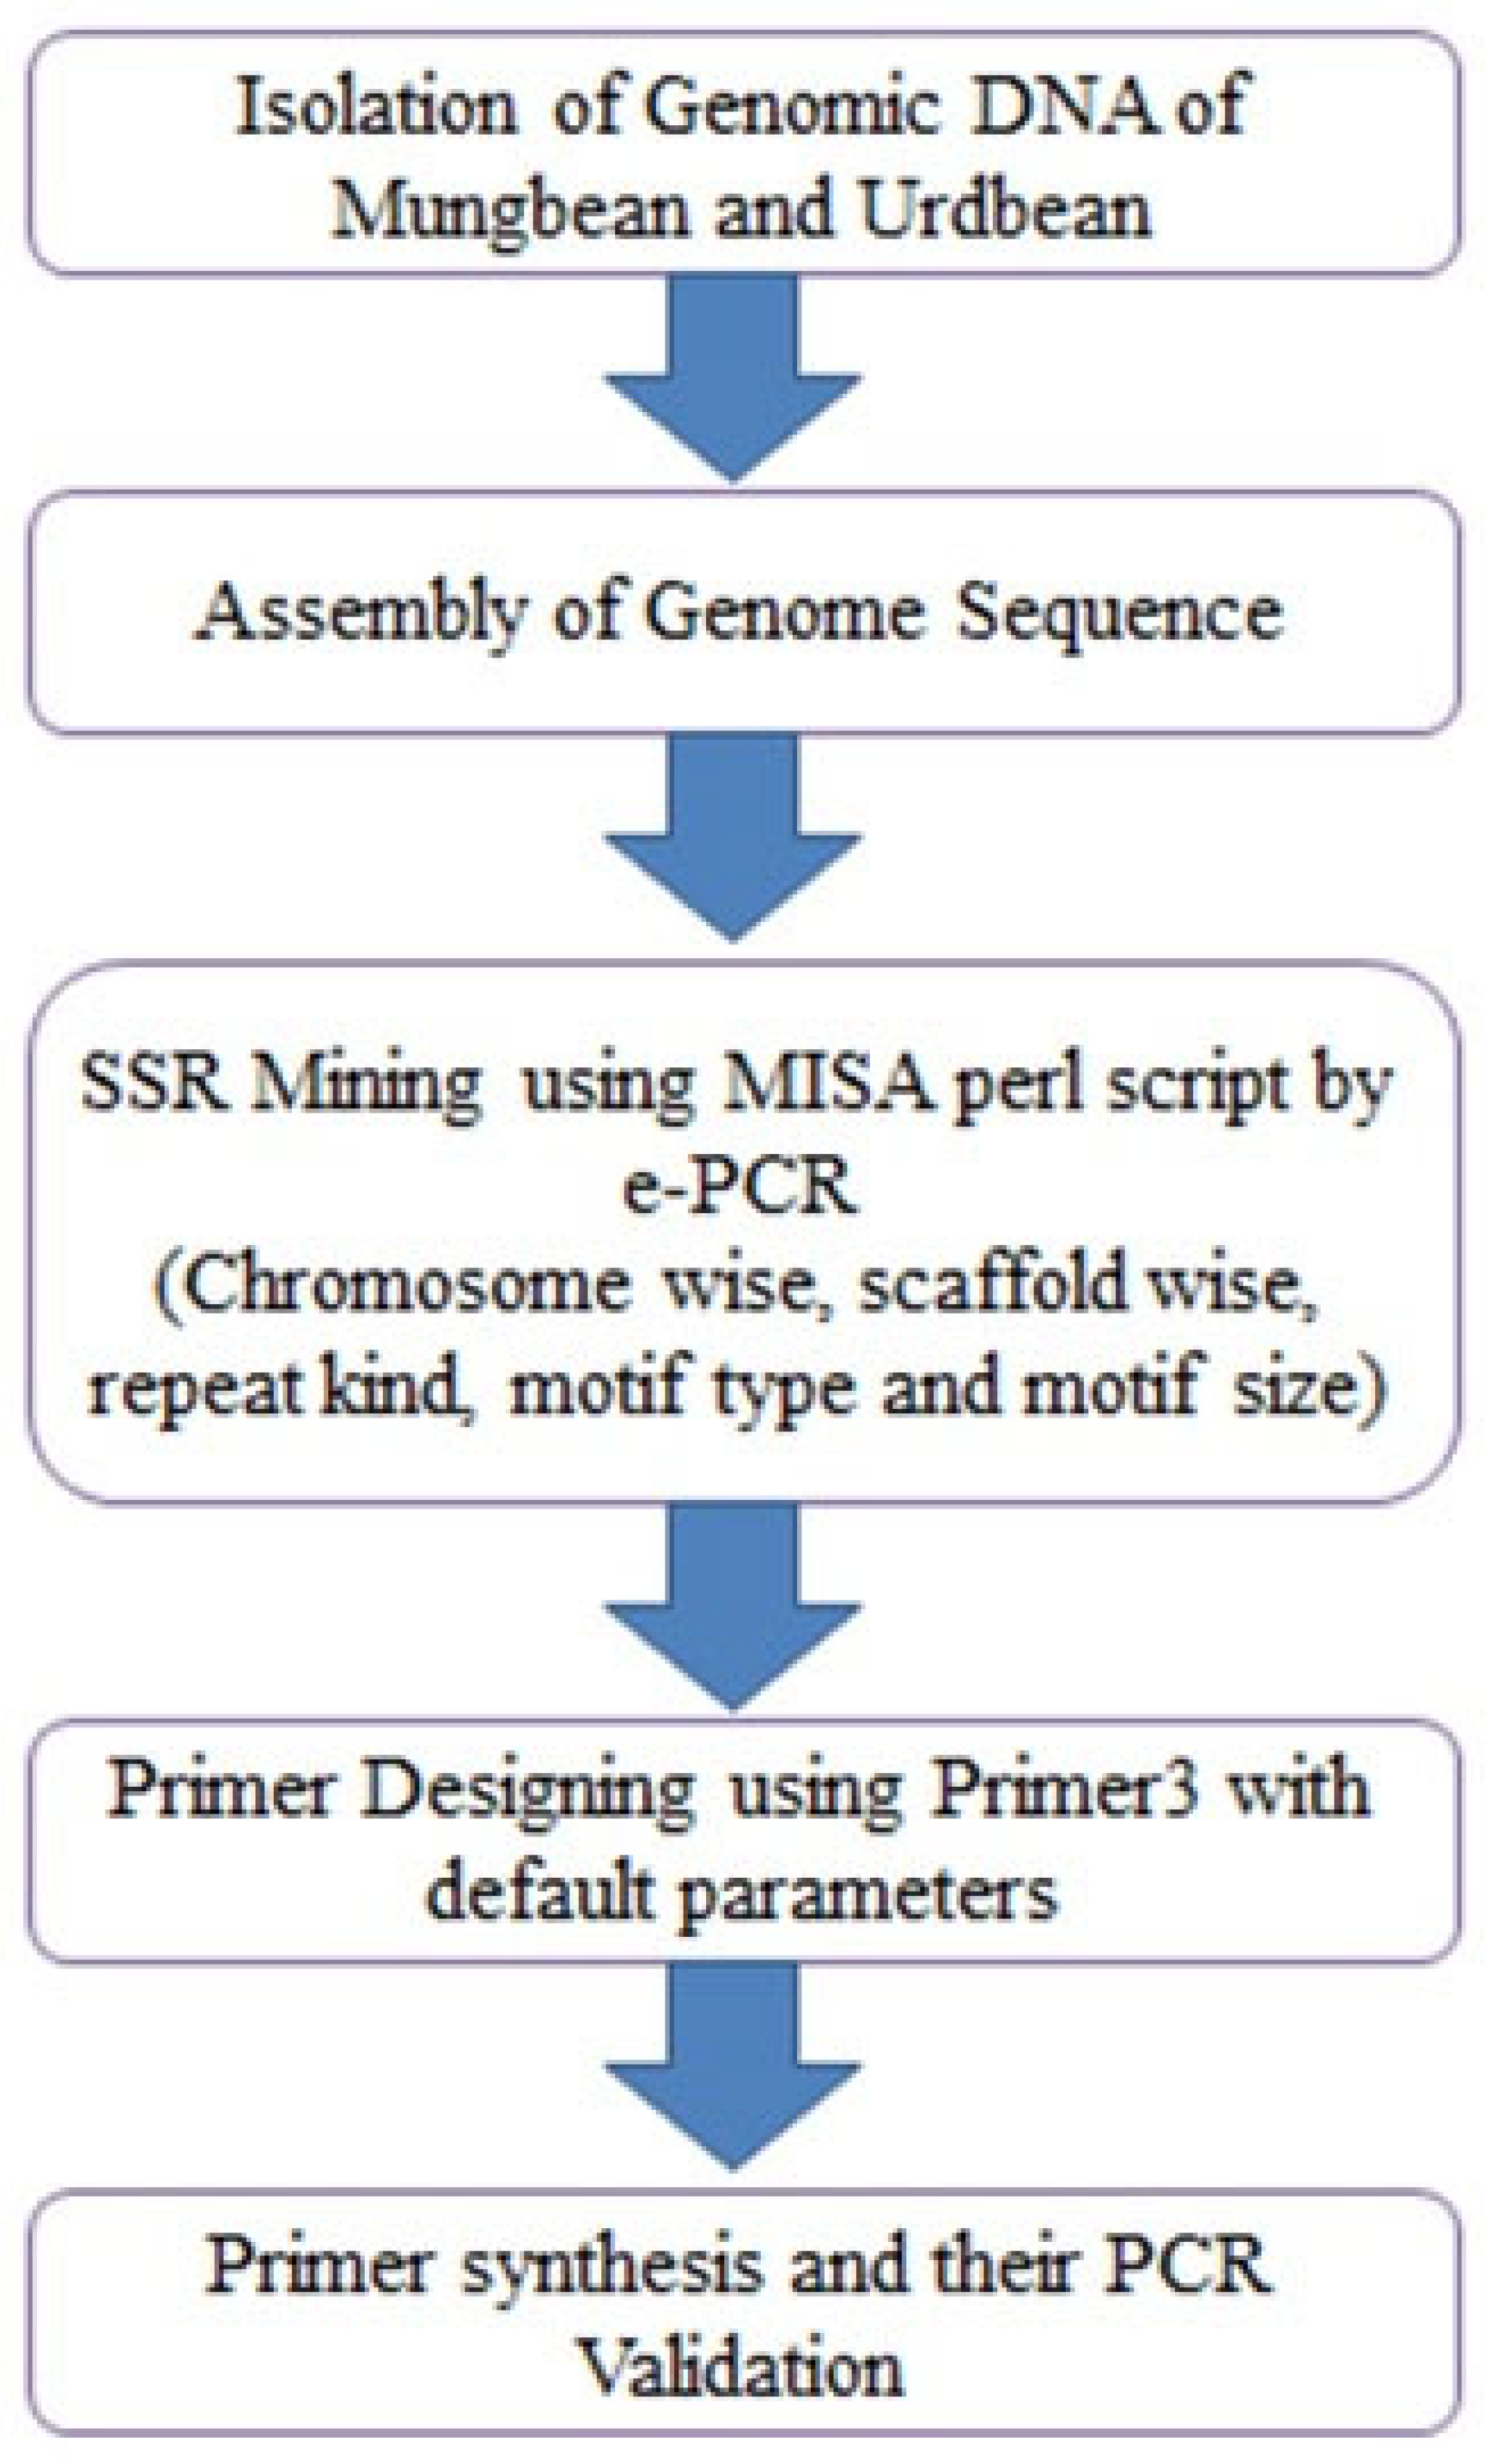
Figure 1. Primer mining, designing and PCR validation of WGS based SSR markers.
Preprints 81755 g001
Figure 2. Transferability of WGS based SSR markers in different Vigna accessions.(1) V.umbellata(Cultivated); (2) V.umbellata(Cultivated); (3) V. umbellata;(4) V.sublobata;(5) V.sublobata;(6) V.trilobata;(7) V.trilobata;(8) V.trilobata;(9) V.trilobata; (10) V.aconitifolia;(11) V. aconitifolia;(12) V.aconitifolia(TMV-1); (13) V. stipulacea;(14) V. stipulacea;(15) V. radiate var. radiata;(16) V. radiatavar.mungo;(17) V. radiatavar.mungo;(18) V. radiatavar.mungo;(19) V. slyestris;(20) V. glabrescence;(21) V. radiatavar.satulosa;(22) V. vexillata;(23) V. hainiana;(24) V. dalzelliana;(25) V. unguiculata.
Preprints 81755 g002
Figure 3. Cluster analysis of different Vigna accessions based on neighbor-joining method.
Preprints 81755 g003
Figure 4. Population structure analysis of 25 Vignaaccessions based on 200 SSR markers (K=2) and graph of estimated membership fraction for K=3.
Preprints 81755 g004
Figure 5. Analysis of Molecular variance (AMOVA) showing the percentage of molecular variance among and within populations and among the various Vigna species genotypes.
Preprints 81755 g005
Figure 6. Principal co-ordinate analysis (PCA) showing the distribution of Vigna species accessions.
Preprints 81755 g006
Table 1. List of Vigna accessions genotyped in the study.
Designation Accessions Designation Accessions
GP1 V. umbellata(Cultivated) GP14 V. stipulacea
GP2 V.umbellata(Cultivated) GP15 V. radiatavar.radiata
GP3 V. umbellata GP16 V. radiatavar.mungo
GP4 V. sublobata GP17 V. radiatavar.mungo
GP5 V. sublobata GP18 V. radiatavar.mungo
GP6 V. trilobata GP19 V. slyestris
GP7 V. trilobata GP20 V. glabrescence
GP8 V. trilobata GP21 V. radiatavar.satulosa
GP9 V. trilobata GP22 V. vexillata
GP10 V. aconitifolia GP23 V. hainiana
GP11 V. aconitifolia GP24 V. dalzelliana
GP12 V. aconitifolia(TMV-1) GP25 V. unguiculata
GP13 V. stipulacea
Table 2. Summary of SSR Mining and frequency of different repeat types identified through whole genome sequencing of (V. radiata cv. ML267) and (V.mungo cv. Mash114) (Shivani, 2018).
Parameters Number of SSR
V. radiata cv. ML267 V. mungo cv. Mash114
SSR Mining
SSR sequences examined 444,059 471,725
SSRs identified 225,359 218,508
SSR containing sequences 130,125 126,749
Sequences containing more than 1 SSR 50,760 46,626
SSRs present in compound formation 16,201 15,565
Repeat Typea
Mononucleotide 173,536 (77%) 170,071 (77.83%)
Dinucleotide 29,559 (13.12%) 27,625 (12.64%)
Trinucleotide 19,732 (8.76%) 18,490 (8.46%)
Tetranucleotide 1939 (0.86%) 1794 (0.82%)
Pentanucleotide 410 (0.18%) 369 (0.17%)
Hexanucleotide 183 (0.08%) 159 (0.08%)
a Data in parentheses is the percentage value of the repeat type.
Table 3. Abundance of dinucleotide repeats in in-silico developed SSR markers between V. radiata (cv. ML267) and V.mungo (cv. Mash 114).
Dinucleotide repeat n Number Percentage
(AT)n 6, 7, 8, 9, 10, 11, 12, 13, 14, 17 69 27.6
(AG)n 6, 7, 8, 9, 10, 13, 14, 16, 17, 22 30 12.0
(AC)n 6, 7, 8, 9 16 6.40
(TA)n 6, 7, 8, 9, 10, 11, 12, 13, 20 62 24.8
(TC)n 6, 7. 8, 9, 10, 11, 13, 14, 16, 17 31 12.4
(TG)n 6, 7, 9 11 4.40
(CT)n 6, 7, 8, 9, 12, 14 13 5.20
(CA)n 6,7 02 0.80
(GA)n 6, 7, 8, 10, 12. 19, 20 10 4.00
(GT)n 6, 7, 14 06 2.40
Table 4. Nei’s unbiased measures of genetic identity and genetic distance based upon 200 SSR markers.
Pop ID Pop 1 Pop 2 Pop 3
Pop 2 0.374 - -
Pop 3 0.208 0.442 -
Pop 4 0.250 0.458 0.189
Table 5. Summary of Analysis of Molecular Variance (AMOVA).
Source of Variation Df Sum of square Mean Sum of square Estimated Variance % Variance F statistics
Among population 2 470.62 235.31 7.24 10 0.105
Among individual 22 2706.18 123.00 61.15 89 0.989
Within individual 25 17.50 0.700 0.70 1 0.990
Total 49 3194.30 69.09 100
Disclaimer/Publisher’s Note: The statements, opinions and data contained in all publications are solely those of the individual author(s) and contributor(s) and not of MDPI and/or the editor(s). MDPI and/or the editor(s) disclaim responsibility for any injury to people or property resulting from any ideas, methods, instructions or products referred to in the content.
Copyright: This open access article is published under a Creative Commons CC BY 4.0 license, which permit the free download, distribution, and reuse, provided that the author and preprint are cited in any reuse.
Prerpints.org logo

Preprints.org is a free preprint server supported by MDPI in Basel, Switzerland.

Subscribe

© 2024 MDPI (Basel, Switzerland) unless otherwise stated