1. Introduction
Ozone and temperature are linked in the middle atmosphere. The positive vertical gradient of temperature in the stratosphere is a consequence of the absorption of solar ultraviolet radiation by stratospheric ozone which heats the stratosphere. The sources and sinks of odd oxygen (atomic oxygen and ozone) are described by the Chapman cycle:
where M represents a collision partner that is inert. In the lower and middle stratosphere, the atomic oxygen which is released by photodissociation of ozone immediately recombines with molecular oxygen to form again ozone.
Trends of lower stratospheric temperature partly depend on trends of lower stratospheric ozone. It was found that the recovery of stratospheric ozone has decelerated the stratospheric cooling since the late 1990s [
1]. A correlation analysis showed that lower stratospheric temperature is mainly regulated by ozone changes [
1]. Alternating advection of ozone-rich, warm air parcels and ozone-poor, cold air parcels explains the correlation of ozone and temperature in planetary wave-like oscillations in the lower stratosphere in winter observed above a mid-latitude station [
2].
In the upper stratosphere, the correlation changes into an anticorrelation of ozone and temperature since the ozone reaction rates are temperature-dependent with a higher ozone loss for a higher temperature. This temperature dependence is valid for the equations 2 and 2 and was described in detail in [
3]. Stratospheric cooling due to increasing greenhouse gas emissions may induce a super recovery of ozone in the upper stratosphere [
4]. Model simulations indicated that the sensitivity coefficient of the ozone response to temperature decreased as chlorine increased in the stratosphere [
5]. Thus, simultaneous measurements of ozone and temperature are valuable to estimate in how far the ozone recovery can be attributed to the decrease of chlorine in the upper stratosphere after the ban of chlorofluorocarbons emissions by the Montreal Protocol in 1987 [
5].
In the upper mesosphere, the upwelling and downwelling of the secondary ozone layer which appears only during nighttime generates a correlation between temperature and nighttime ozone. The upwelling is associated with adiabatic cooling and vertical advection of ozone-poor air from below while the downwelling is associated with adiabatic heating and vertical advection of ozone-rich air from above. Thus, the nighttime ozone fluctuations in the mesopause region are under dynamical control [
6]. Nighttime ozone in the upper mesosphere observed by Aura/MLS also showed an 11 year oscillation which is in phase with the solar cycle [
6].
The annual oscillation (AO) belongs to the natural oscillations in stratospheric ozone which were observed at northern mid-latitudes [
7]. In the upper stratosphere, ozone is decreased during summer due to the higher temperature. Between 4 and 25 hPa, ozone is increased in summer which is due to enhanced production of odd oxygen in summer due to enhanced solar short wave radiation. . The ozone AO reaches an amplitude of about 1.1 ppmv (or 16 %) at Bern in Switzerland [
7]. Below 30 hPa, a further change of the phase of the ozone AO occurred which was not discussed by [
7].
The semiannual oscillation (SAO) mainly occurs in the tropics, partly because the Sun traverses the equator two times per year at equinox. In the stratosphere, it was found that the amplitudes of the temperature and ozone SAO are maximal at the equator [
8]. The ozone and the temperature SAO are anticorrelated in the upper stratosphere and correlated in the lower stratosphere. The phase structure reveals that the temperature SAO descends faster than the ozone SAO [
8].
The frequency dependence of the correlation between ozone and temperature oscillations has not been investigated yet. It is an open question if the correlation coefficients for high frequency fluctuations are similar to those of low frequency fluctuations of ozone and temperature. This knowledge is important for using ozone as tracer of planetary waves and for the assessment of trends in ozone and temperature. Some experiences with other geophysical datasets would suggest that high frequency oscillations of two time series are uncorrelated while their low frequency oscillations may follow a seasonal cycle and would be correlated.
Section 2 describes the dataset and the data analysis of the Aura/MLS ozone and temperature observations.
Section 3 shows the results at mid-latitudes (Bern and its surrounding).
Section 4 shows the results in the equatorial middle atmosphere (SAO and 11 year oscillation).
2. Dataset and Data Analysis
2.1. Dataset
The present study uses ozone and temperature profiles from the Microwave Limb Sounder (MLS) on the NASA satellite Aura which was launched in 2004 [
9]. Aura has a sun-synchronous orbit with two overpasses around noon and midnight at a given place per day. Level 2 data of the retrieval version 5 are analysed in the following, and the data screening described by [
10] was applied. The vertical range of the profiles, used here, is from 260 hPa to 0.001 hPa. The accuracy of the temperature profiles is about 1 K in the stratosphere and about 3 K in the mesosphere [
11]. The accuracy of the ozone profiles changes from about 5-10% in the stratosphere to about 100% in the mesosphere [
10]. In spite of the large error at upper altitudes, the ozone profiles contain valuable informations about the secondary ozone layer which appears during nighttime around the mesopause [
6].
The study focuses on two regions. Firstly, atmospheric profiles are selected in a surrounding of Bern (46.95N, 7.44E). The surrounding is in latitude and in longitude around Bern. The restriction to a certain place at mid-latitudes is useful for the study of regional ozone and temperature variations due to planetary wave-like oscillations and movements of the polar vortex. A zonal mean would smooth out many regional variations. Secondly, the equatorial region is selected. Here, all longitudes are considered in the average, and a latitude range of around the equator is taken. The time interval of the selected Aura/MLS data is from summer 2004 to December 2021.
2.2. Data Analysis
The frequency dependence of the ozone and temperature series are analysed by means of bandpass filtering. The time series are filtered with a digital non-recursive, finite impulse response bandpass filter. Zero-phase filtering is ensured by processing the time series in forward and reverse directions. A Hamming window has been selected for the filter. The number of filter coefficients corresponds to a time window of three times the central period, so that the bandpass filter has a fast response time to temporal changes in the data series. The variable choice of the filter order permits the analysis of wave trains with a resolution that matches their scale. The bandpass cut off frequencies are at
, where
is the cut off frequency and
is the central frequency. Further details about the bandpass filtering are provided by [
12]. For visualization of the long period oscillations of the solar cycle, the ozone time series were filtered by a 5 year lowpass filter with related characteristics as the described bandpass filter. The mean seasonal behaviour of the time series is obtained by sorting the data for the day of the year (DOY) and taking the mean.
3. Results
3.1. Results around Bern at Mid-latitudes
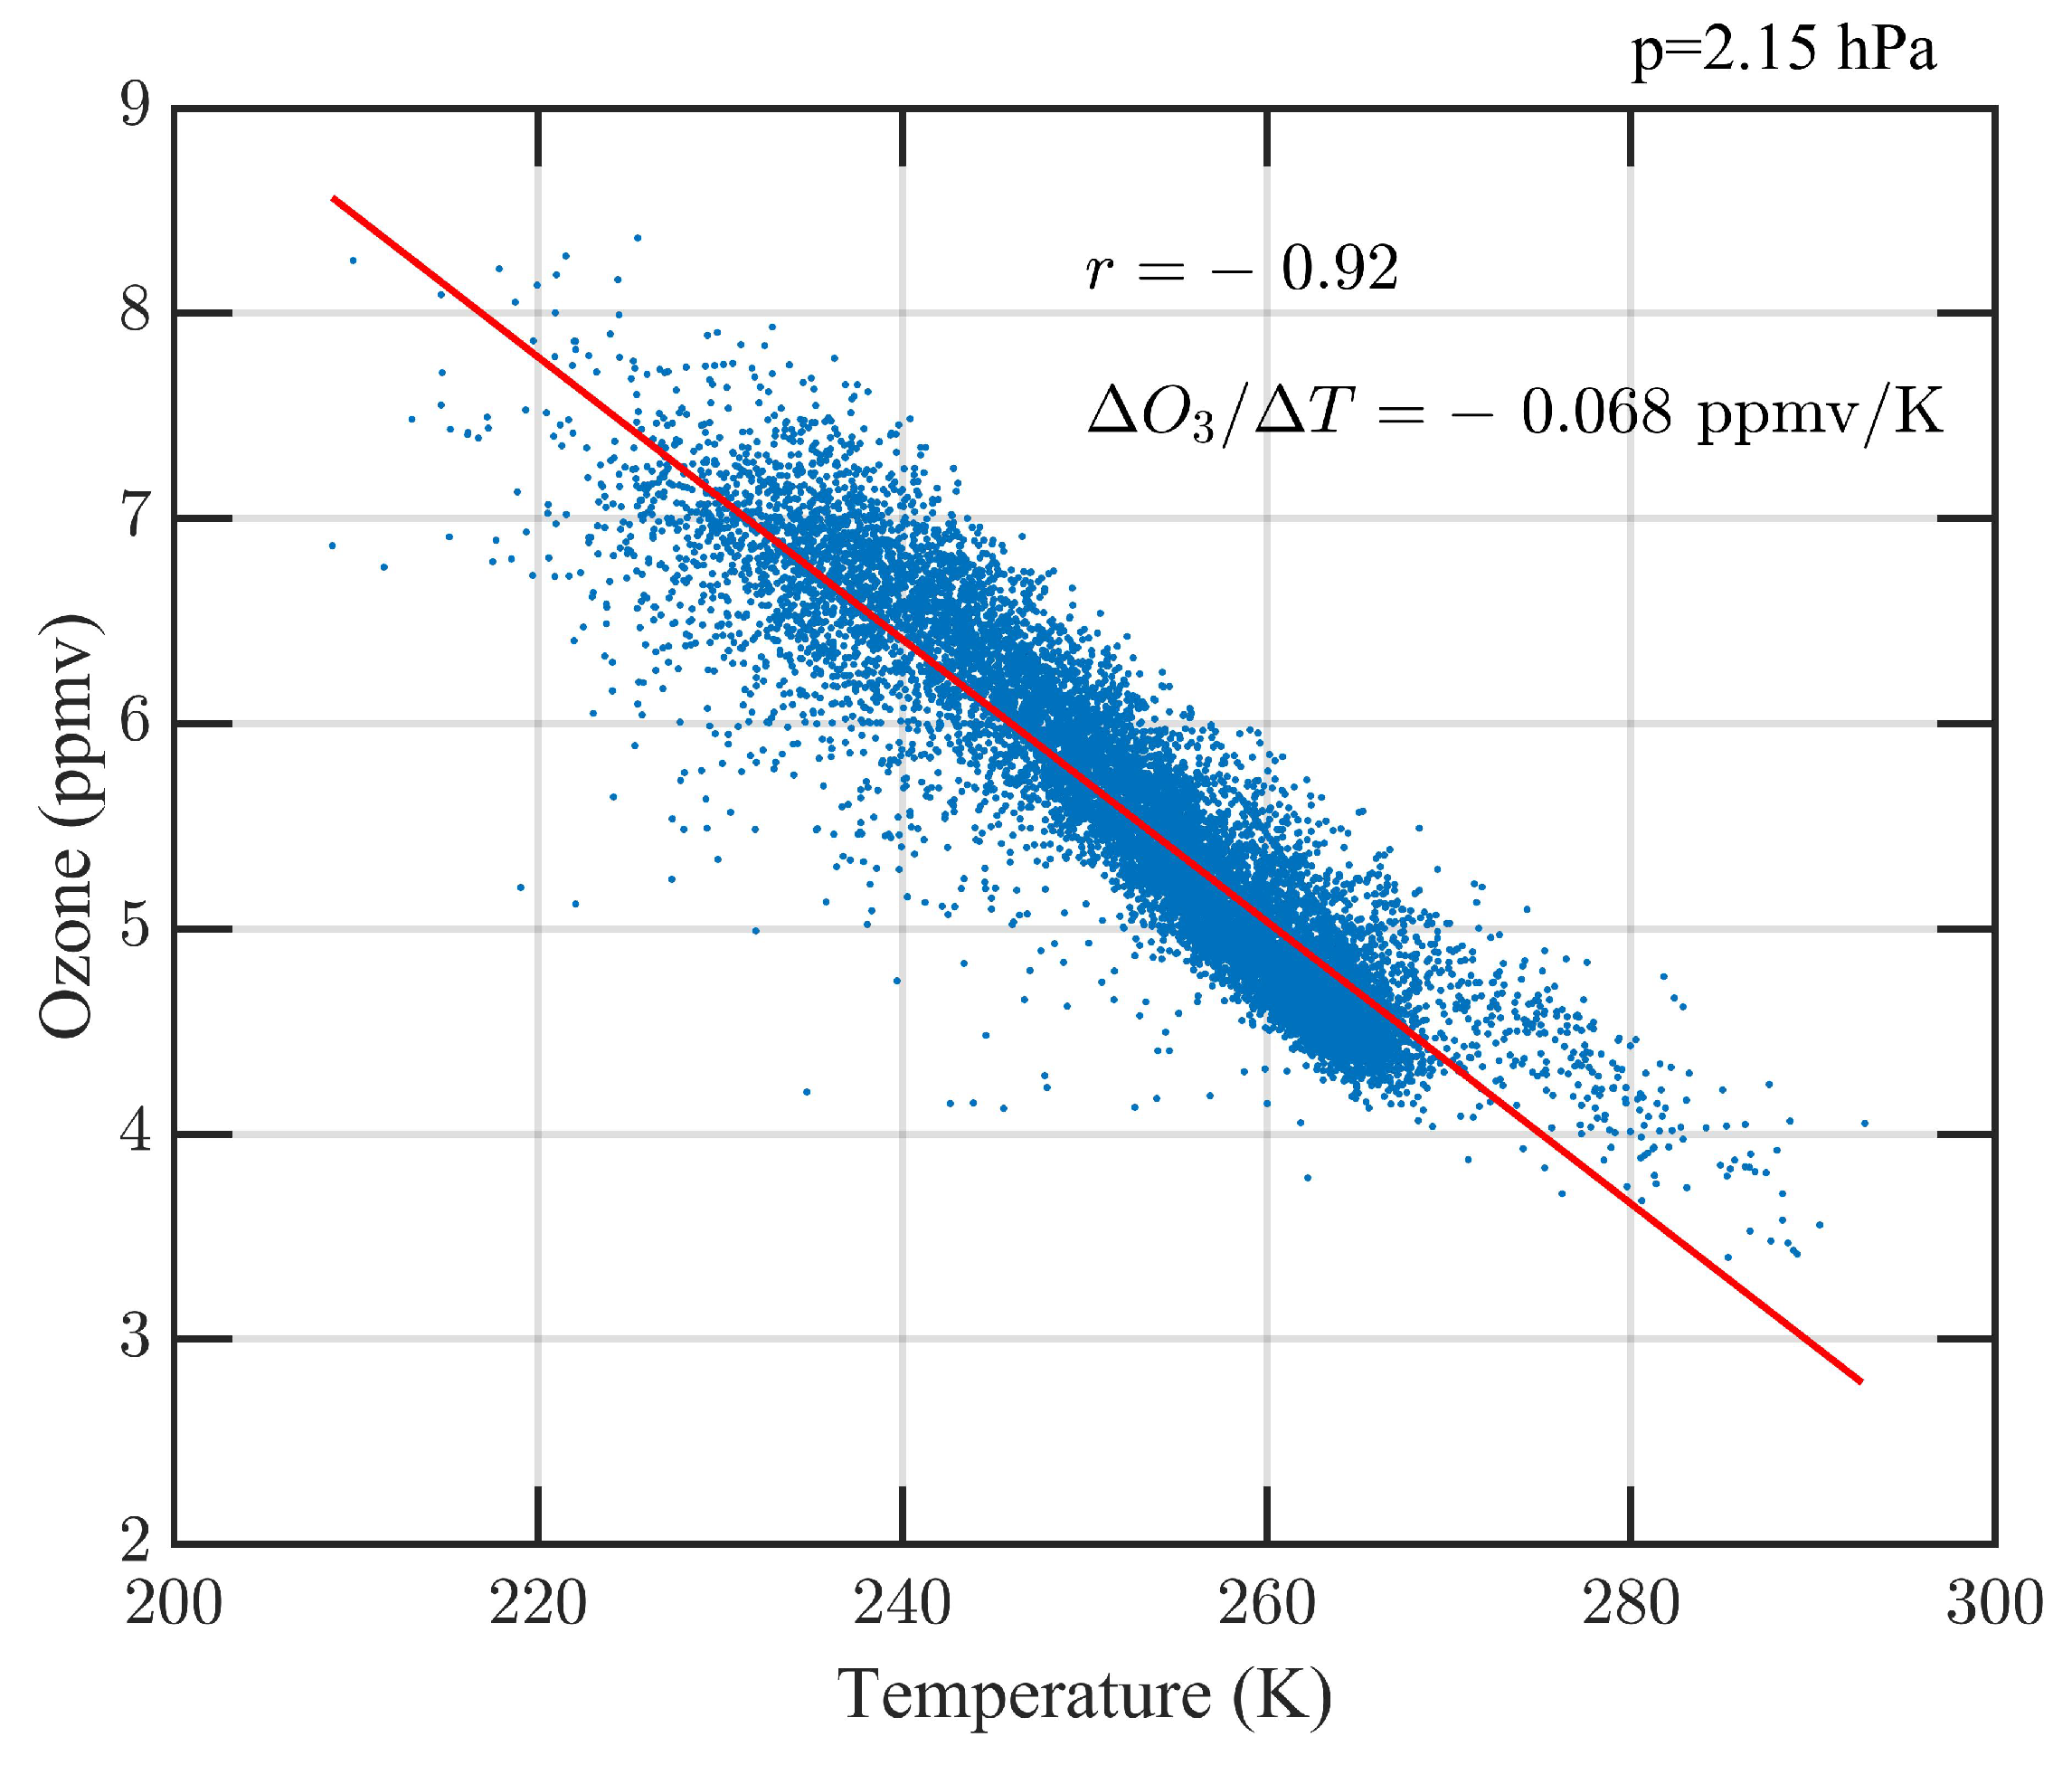
Considering all the ozone and temperature data pairs observed by Aura/MLS around Bern, a scatter plot is drawn in
Figure 1 for the upper stratosphere at the pressure level
hPa. The straight line has a gradient of
ppmv/K and an anticorrelation of
. This anticorrelation is expected for the upper stratosphere. The straight line fit is a good choice, though Stolarski et al. investigate the relation between logarithmus of ozone concentration versus inverse of temperature which is theoretically more justified [
5]. However, in the present study, the simple gradients
and correlations
T and
are computed since we want to have the same data analysis procedure at all heights in the middle atmosphere.
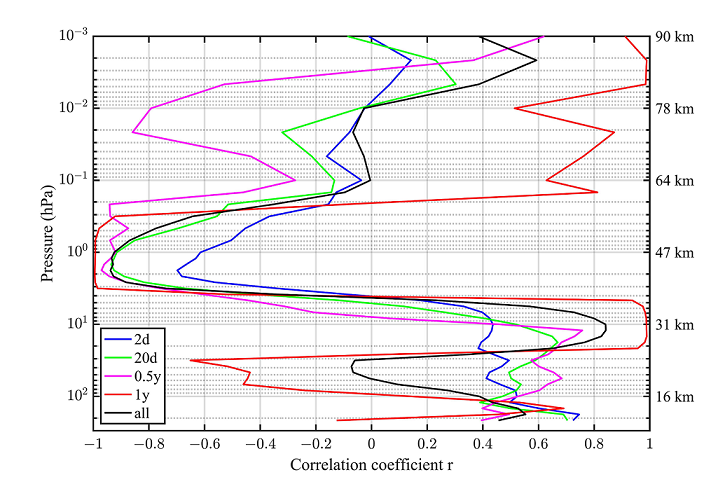
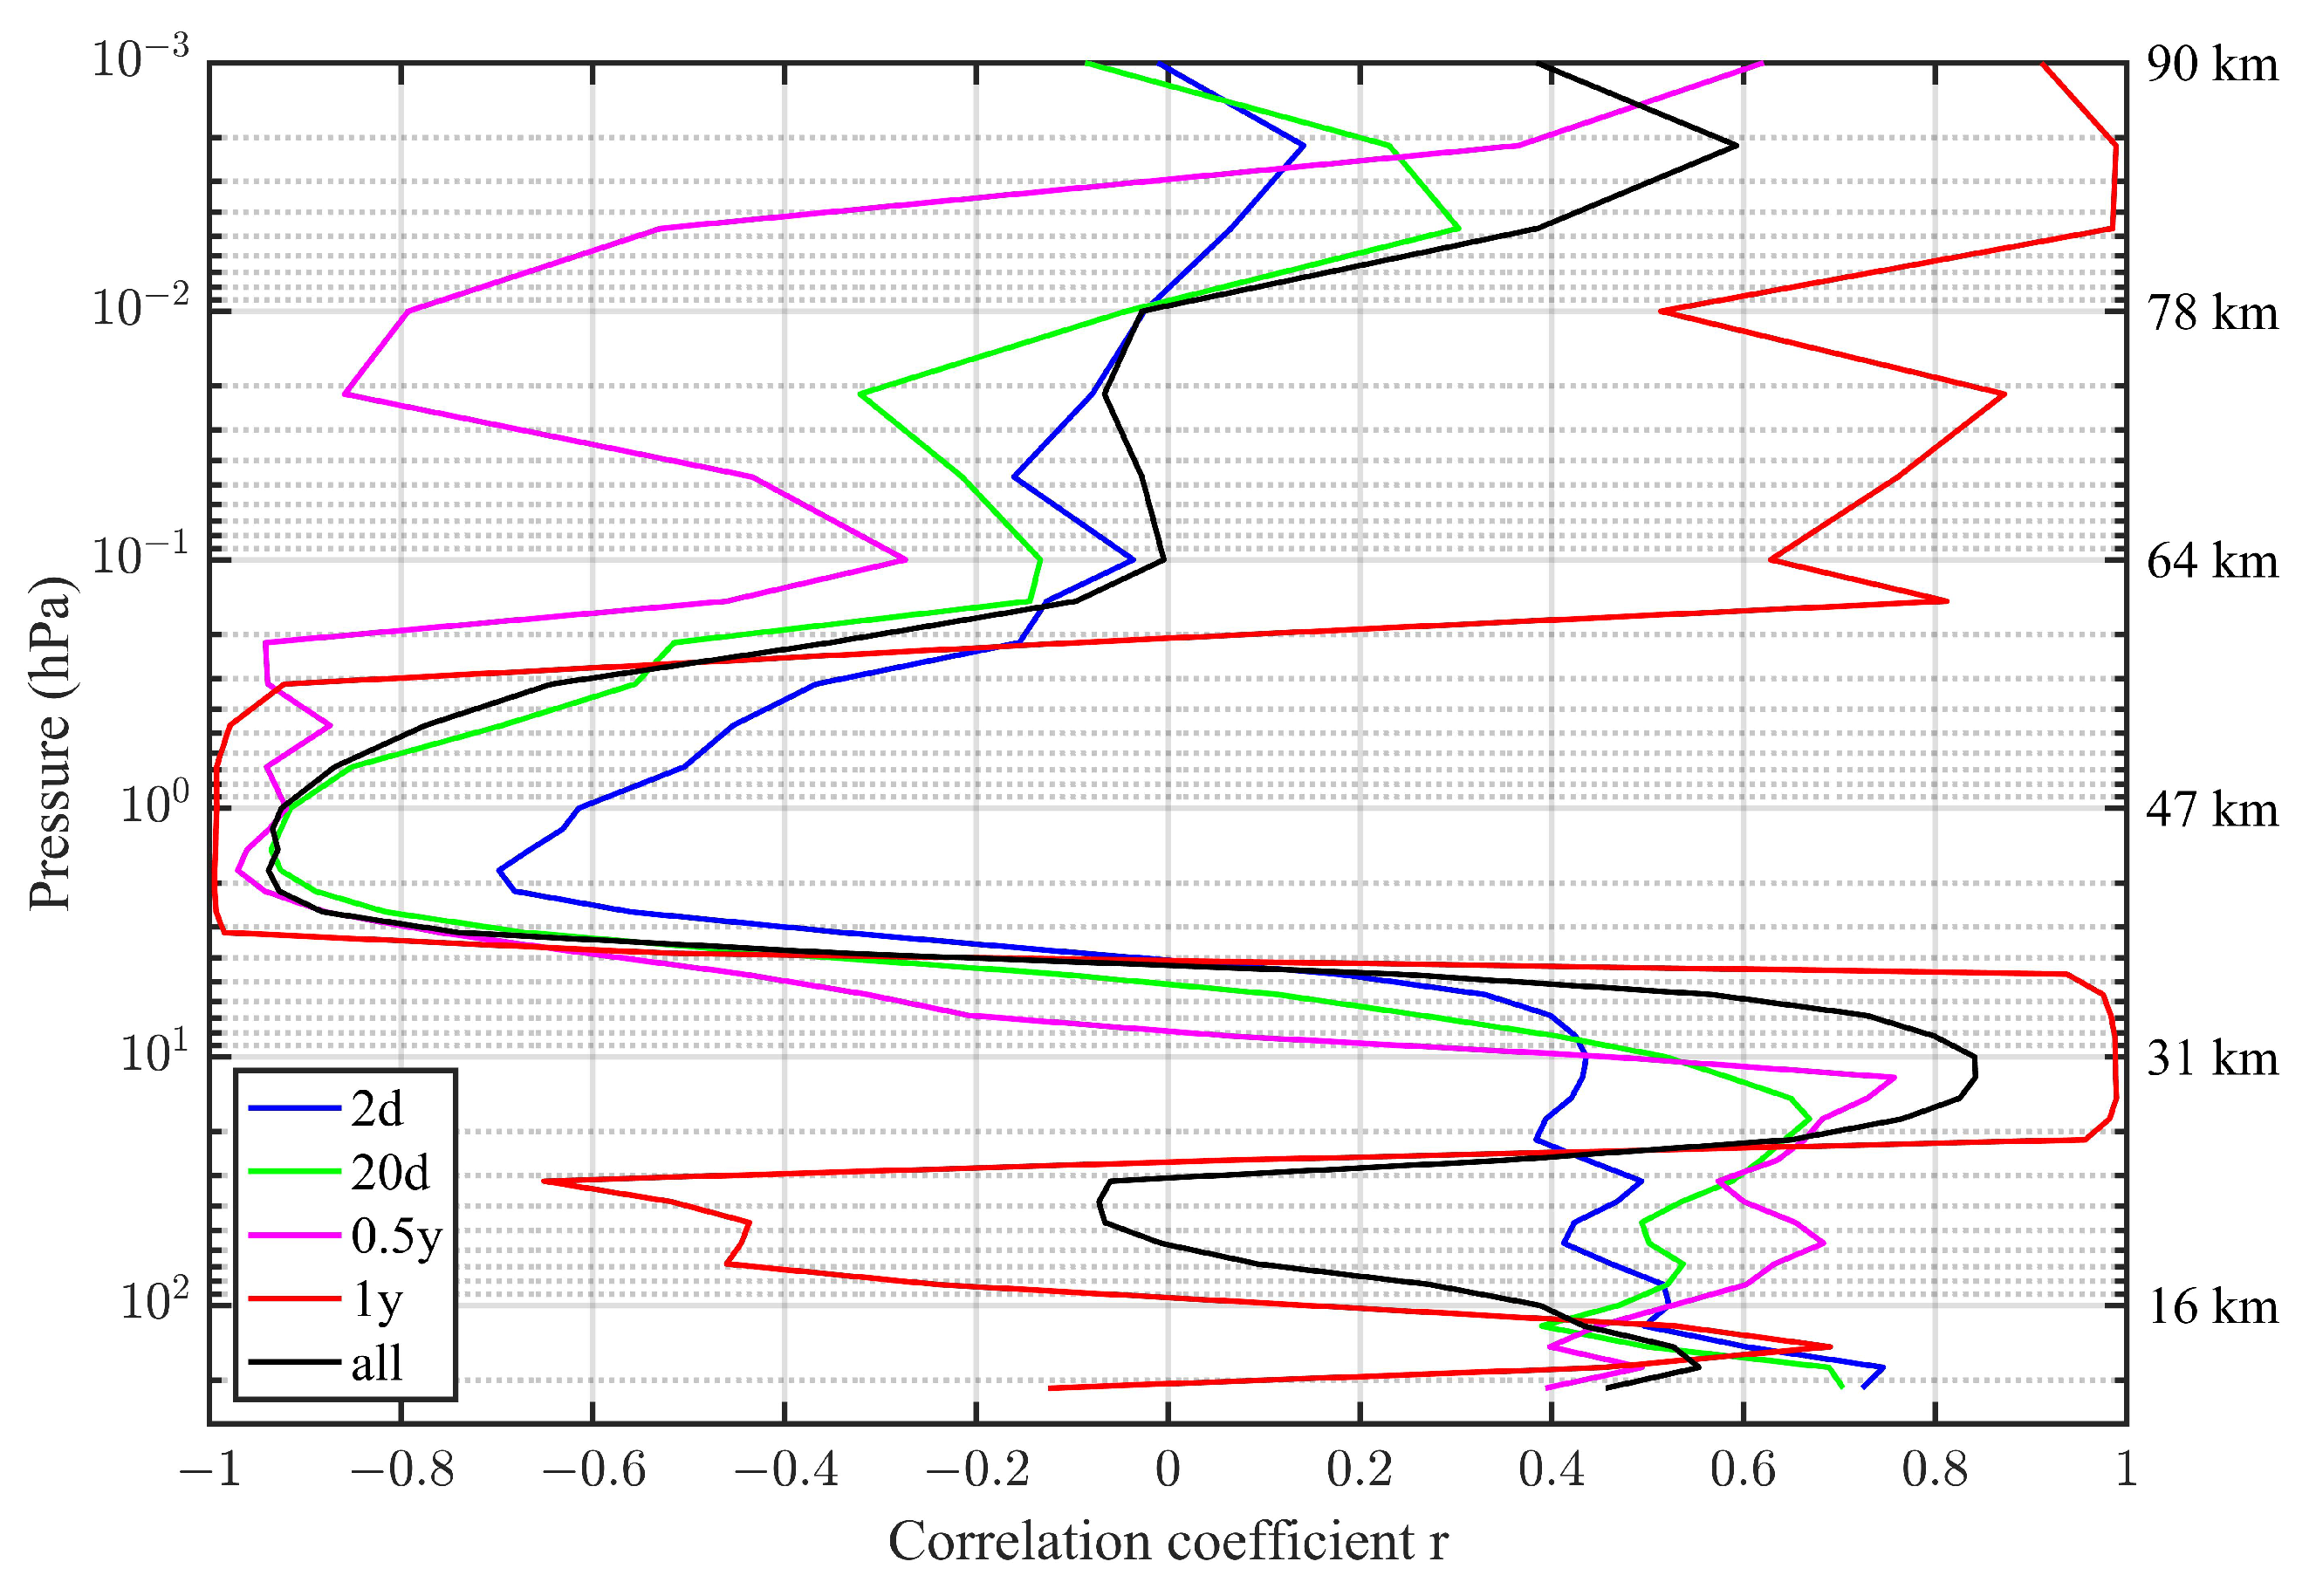
Next, the correlation coefficient of ozone and temperature is computed at all altitudes and shown by the black curve in
Figure 2. Nighttime ozone data are used for a better interpretation in the mesosphere. It is evident that there is a change between height regions of correlation (lower stratosphere, mesosphere) and anticorrelation (upper stratosphere) whereby the areas of correlation are due to a dynamical control of ozone and the area of anticorrelation is related to the photochemical control of ozone. The correlation coefficient can be also calculated for bandpass filtered oscillations of ozone and temperature.
Figure 2 shows the results for the 2 day oscillation, 20 day oscillation, SAO and AO. The correlation of the AO reaches the highest absolute values, almost 1 and
. It is also evident that the correlation of the AO turns into an anticorrelation at about 20 km height which is different to the periods of 2 day, 20 day and 0.5 year.
The anticorrelation in the upper stratosphere also occurs at the short period of 2 days but a bit reduced. Some authors supposed that photochemistry might be too slow for an anticorrelation at short periods but they did not quantify this statement [
2]. It would be interesting if the anticorrelation in the upper stratosphere also is valid for periods less than 2 days. The coarse temporal sampling of Aura/MLS at a given place does not permit this investigation.
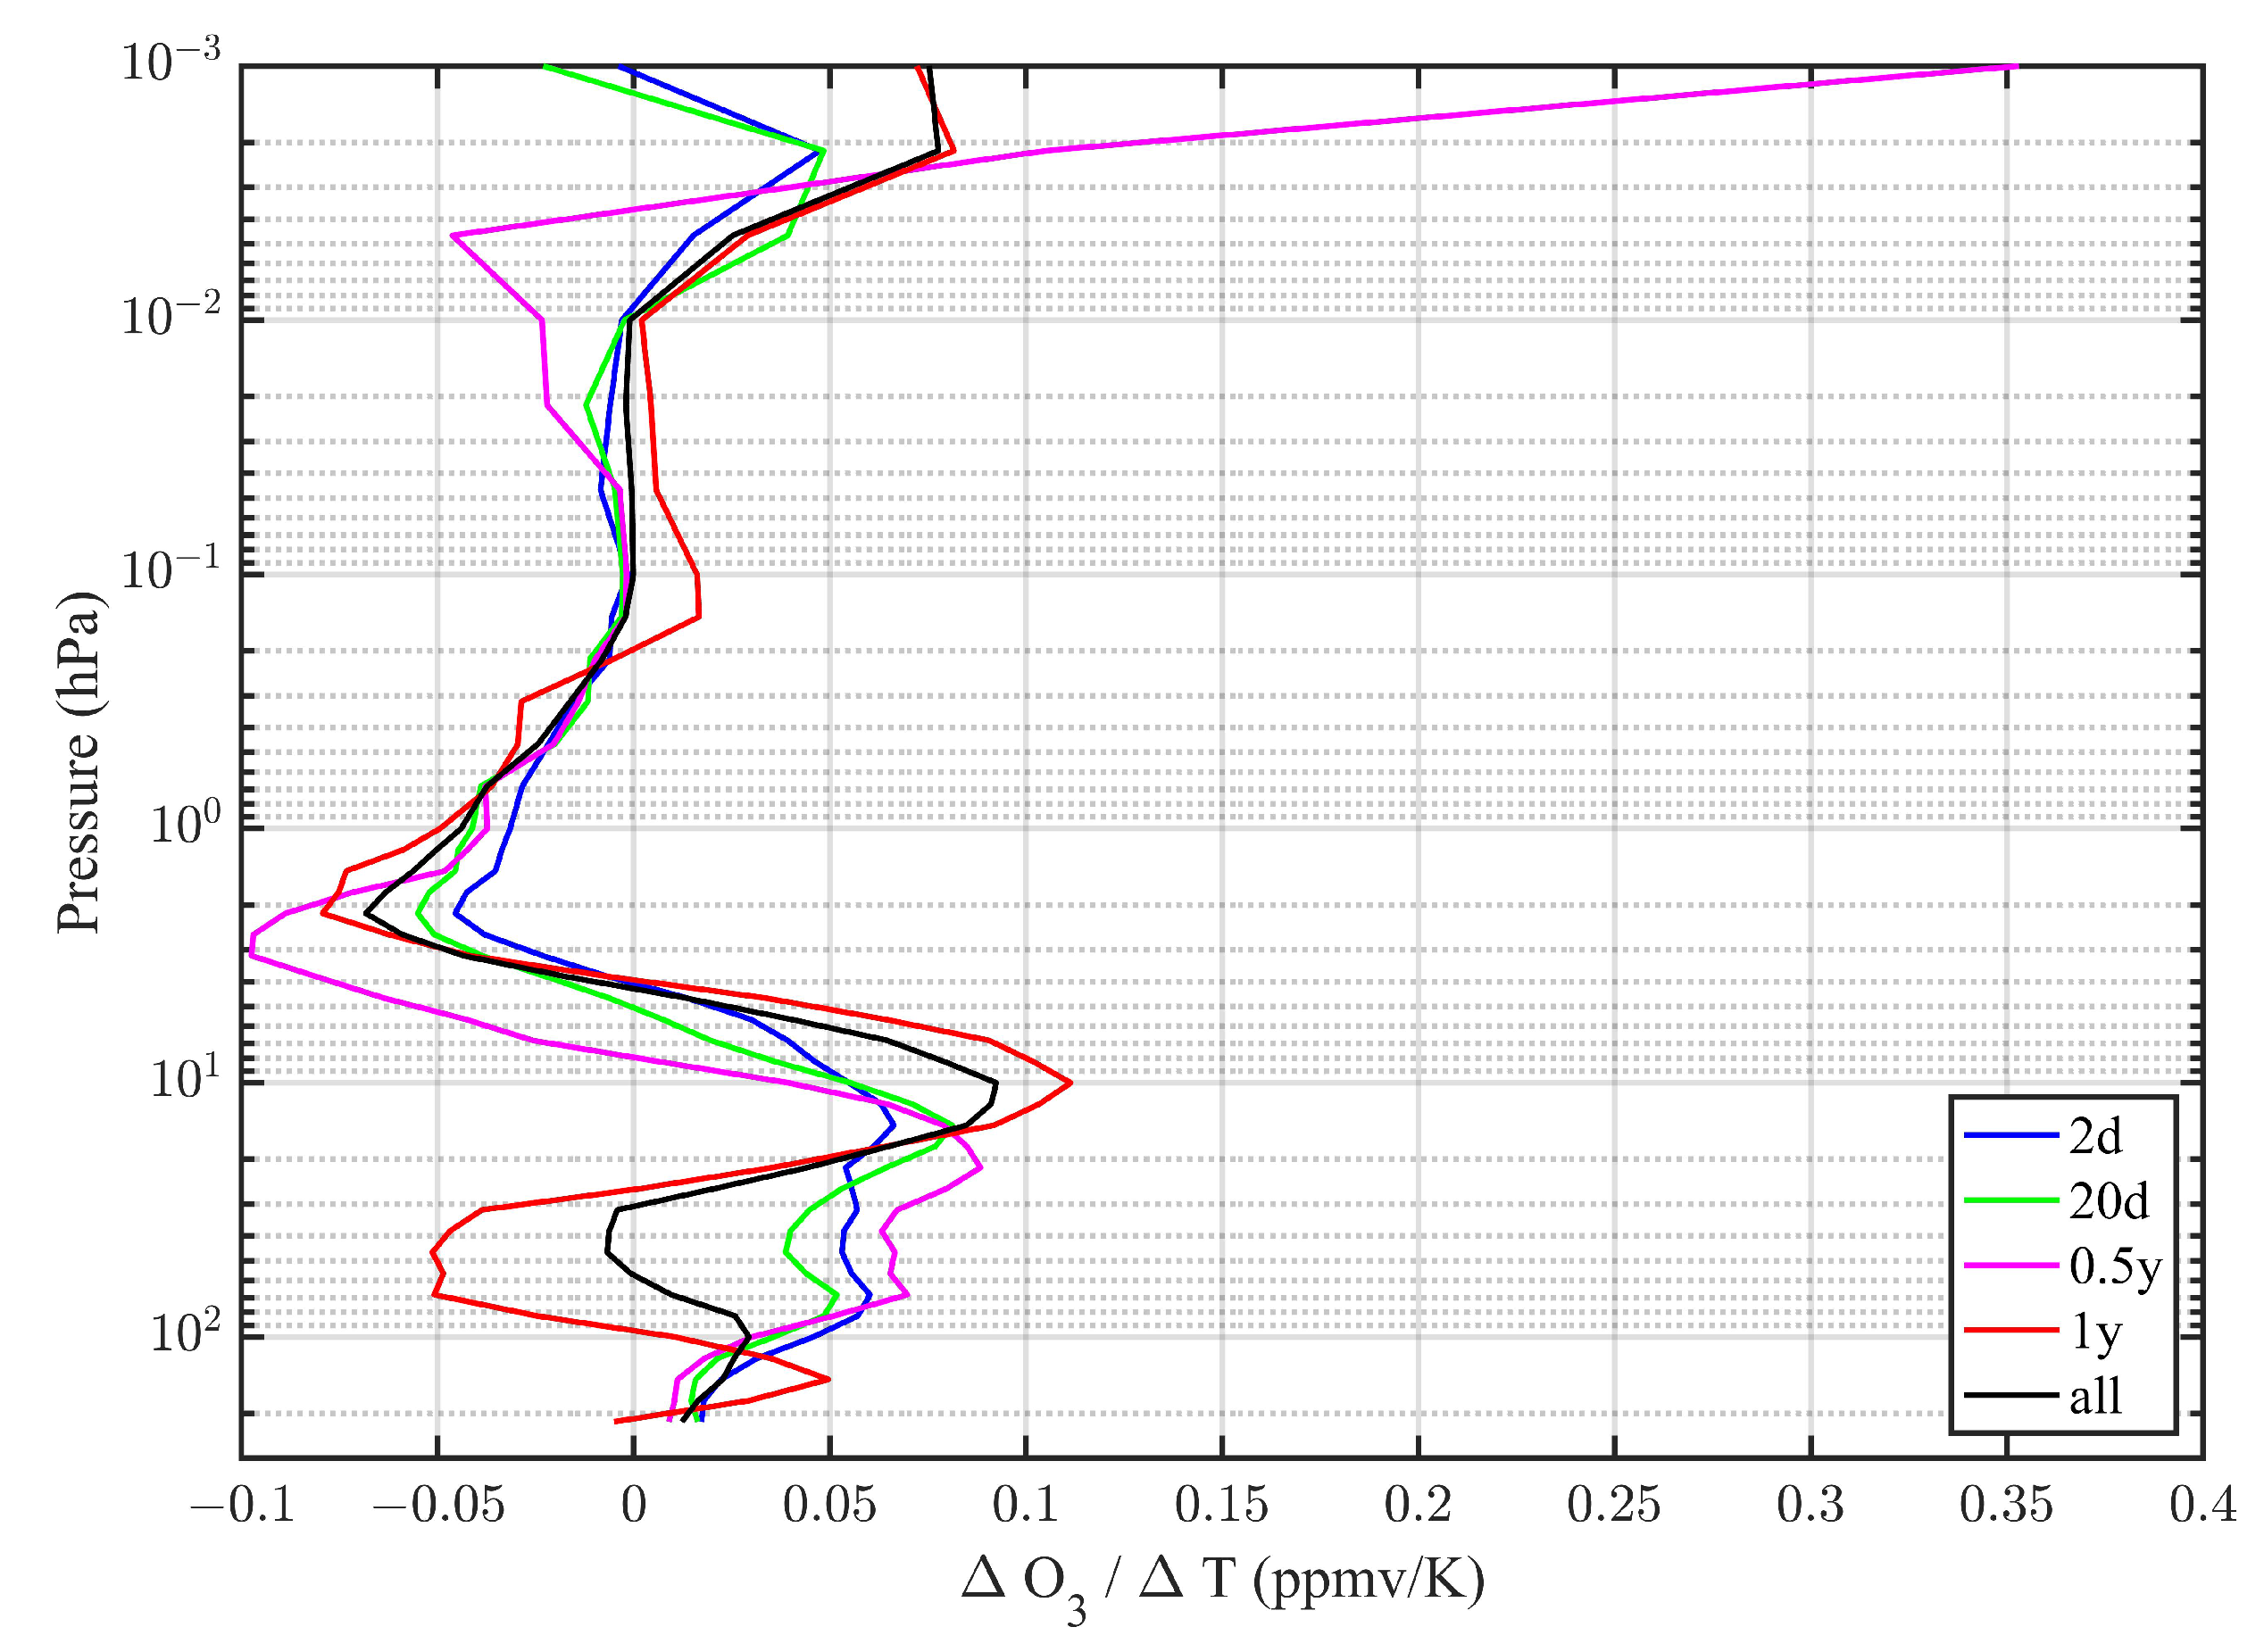
The gradients
are shown in
Figure 3 as function of pressure level. The gradients are switching between positive values (correlation) and negative values (anticorrelation). The gradient of the SAO becomes strong at the mesopause which is due to a strong ozone SAO at upper mesospheric altitudes.
The spectra of
r and
are shown in
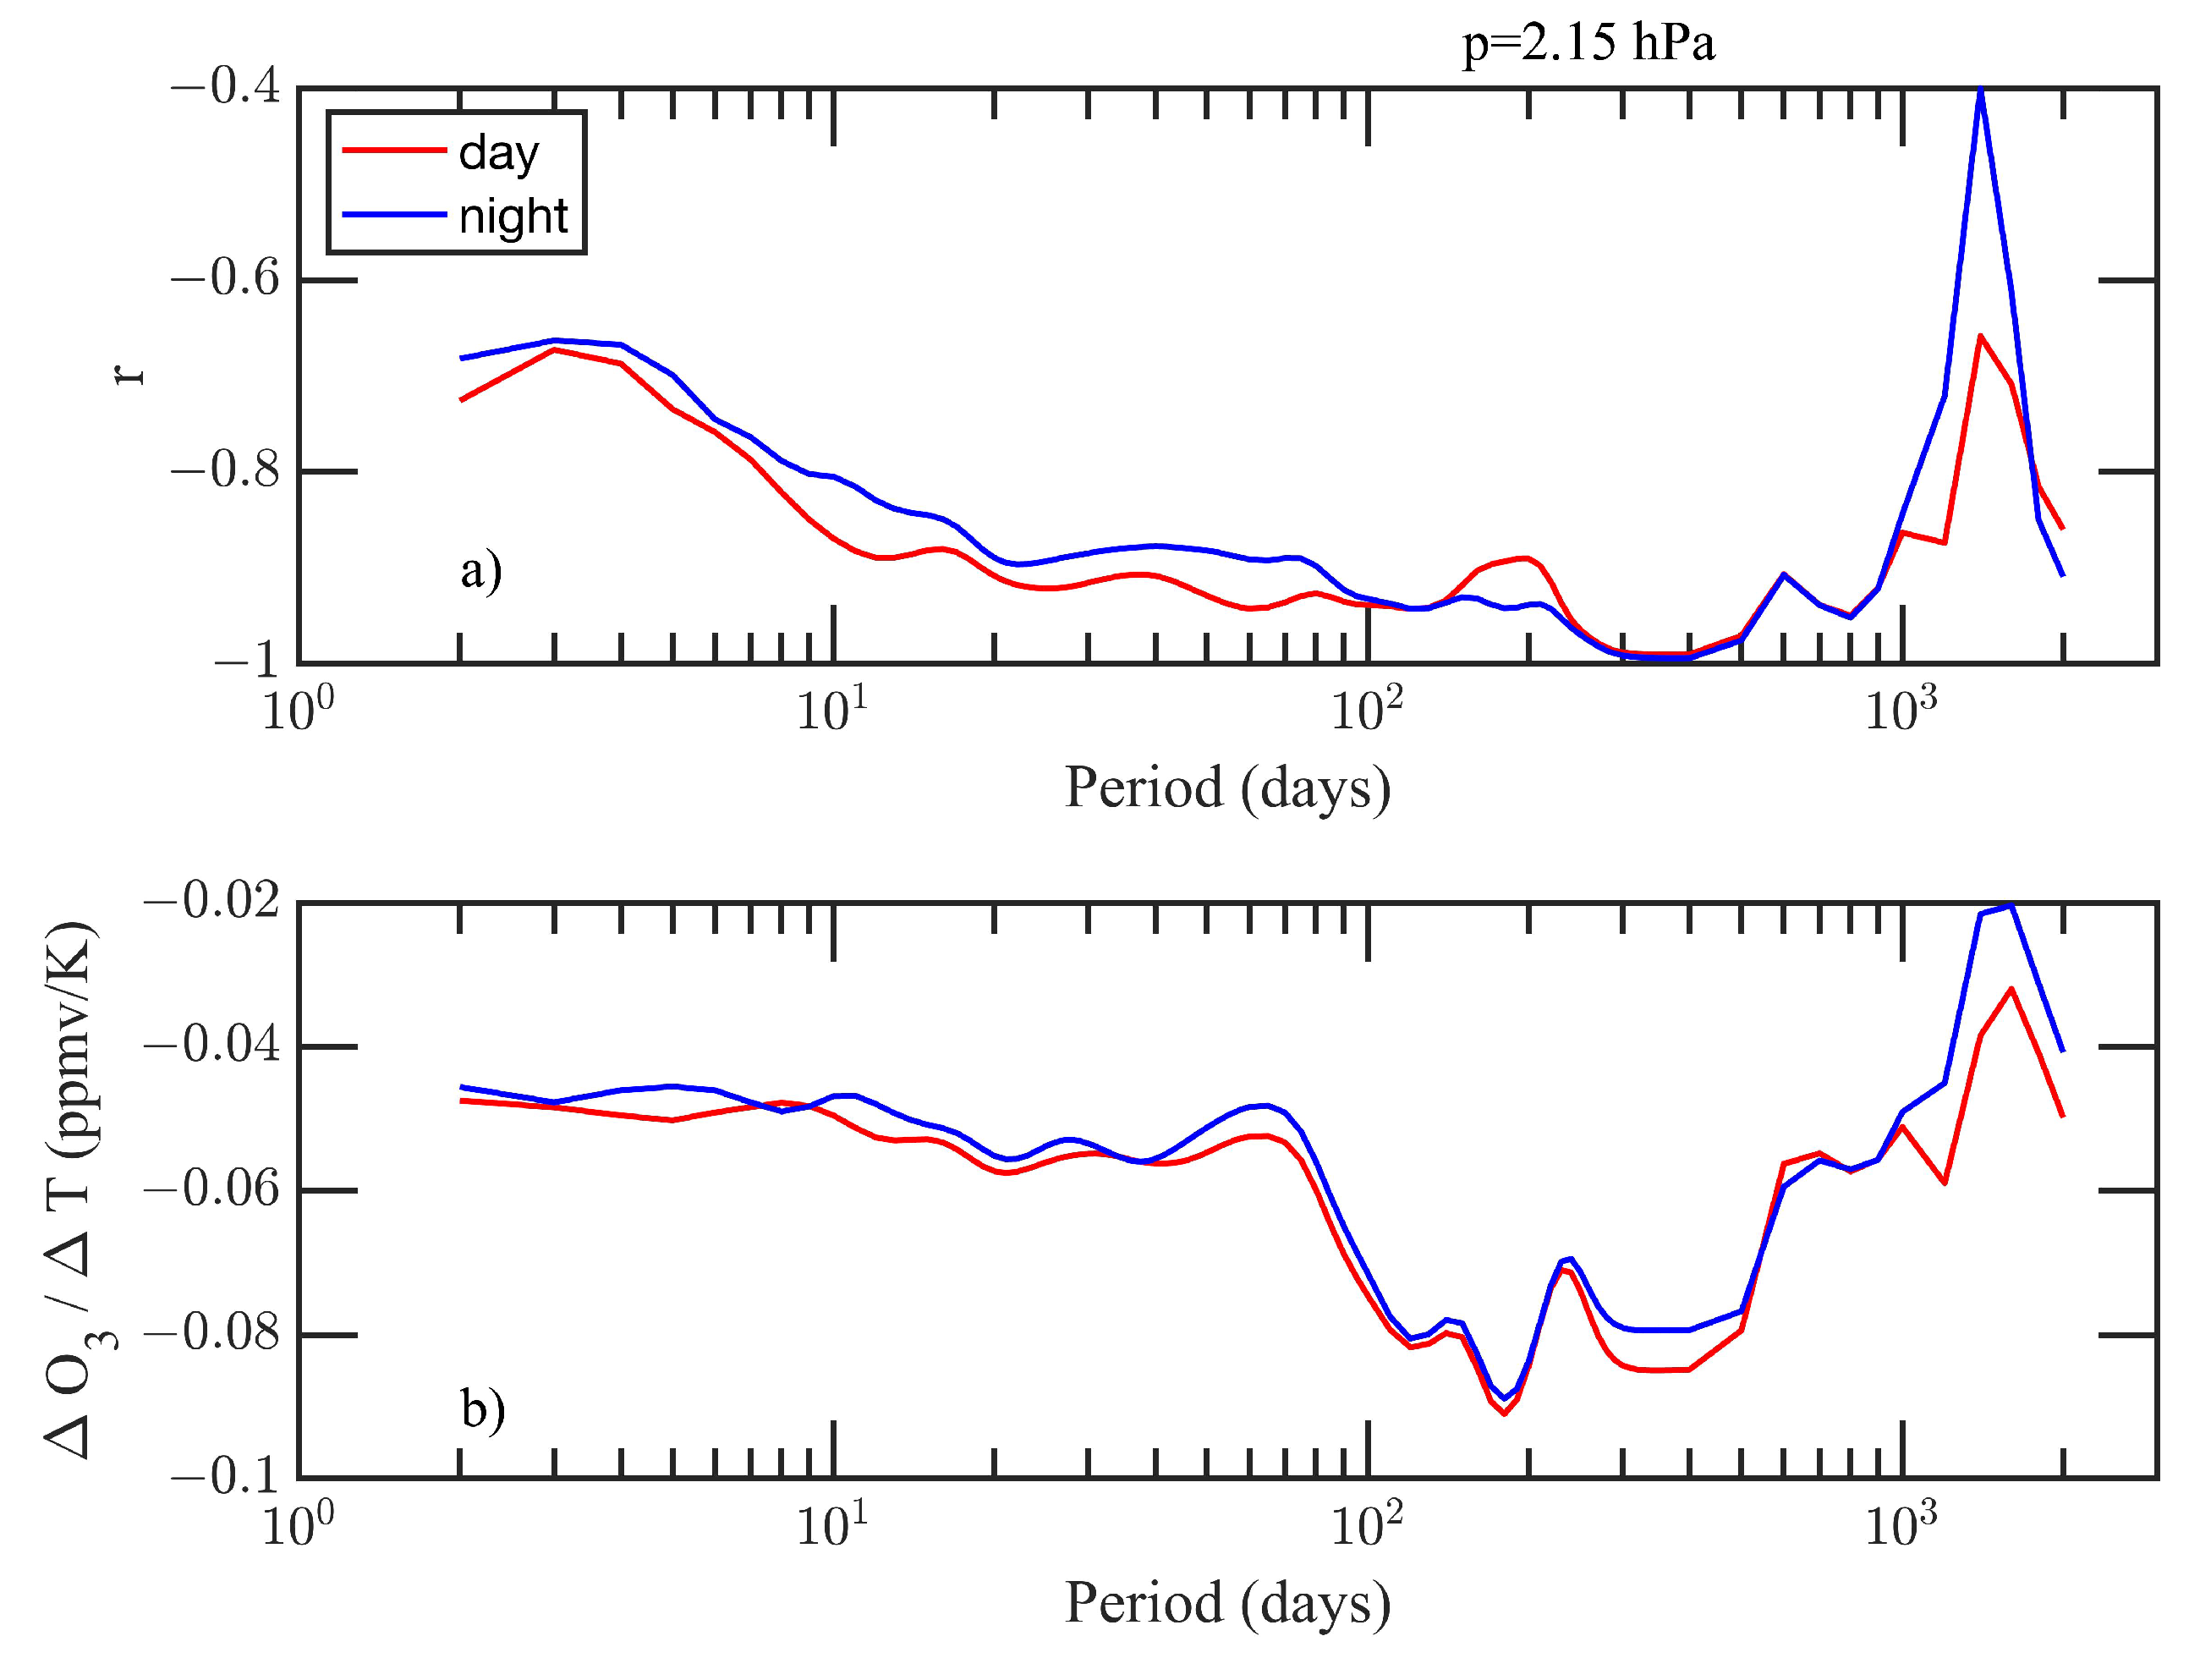
Figure 4 in the upper stratosphere (
hPa). The anticorrelation of ozone temperature is a bit reduced at shorter periods. This might be due to more atmospheric noise at shorter periods. However, one can say that the anticorrelation also exists at a period of 2 days so that ozone can be used as a tracer of short period temperature waves in the upper stratosphere. At expected the anticorrelation is strongest at a period of about 1 year. There is an unexpected reduction of the anticorrelation at a period of about 1500 days (ca. 4 years). Thus, it remains unclear if long period oscillations or trends of ozone and temperature have a strong anticorrelation or not.
The spectra of
r and
are shown in
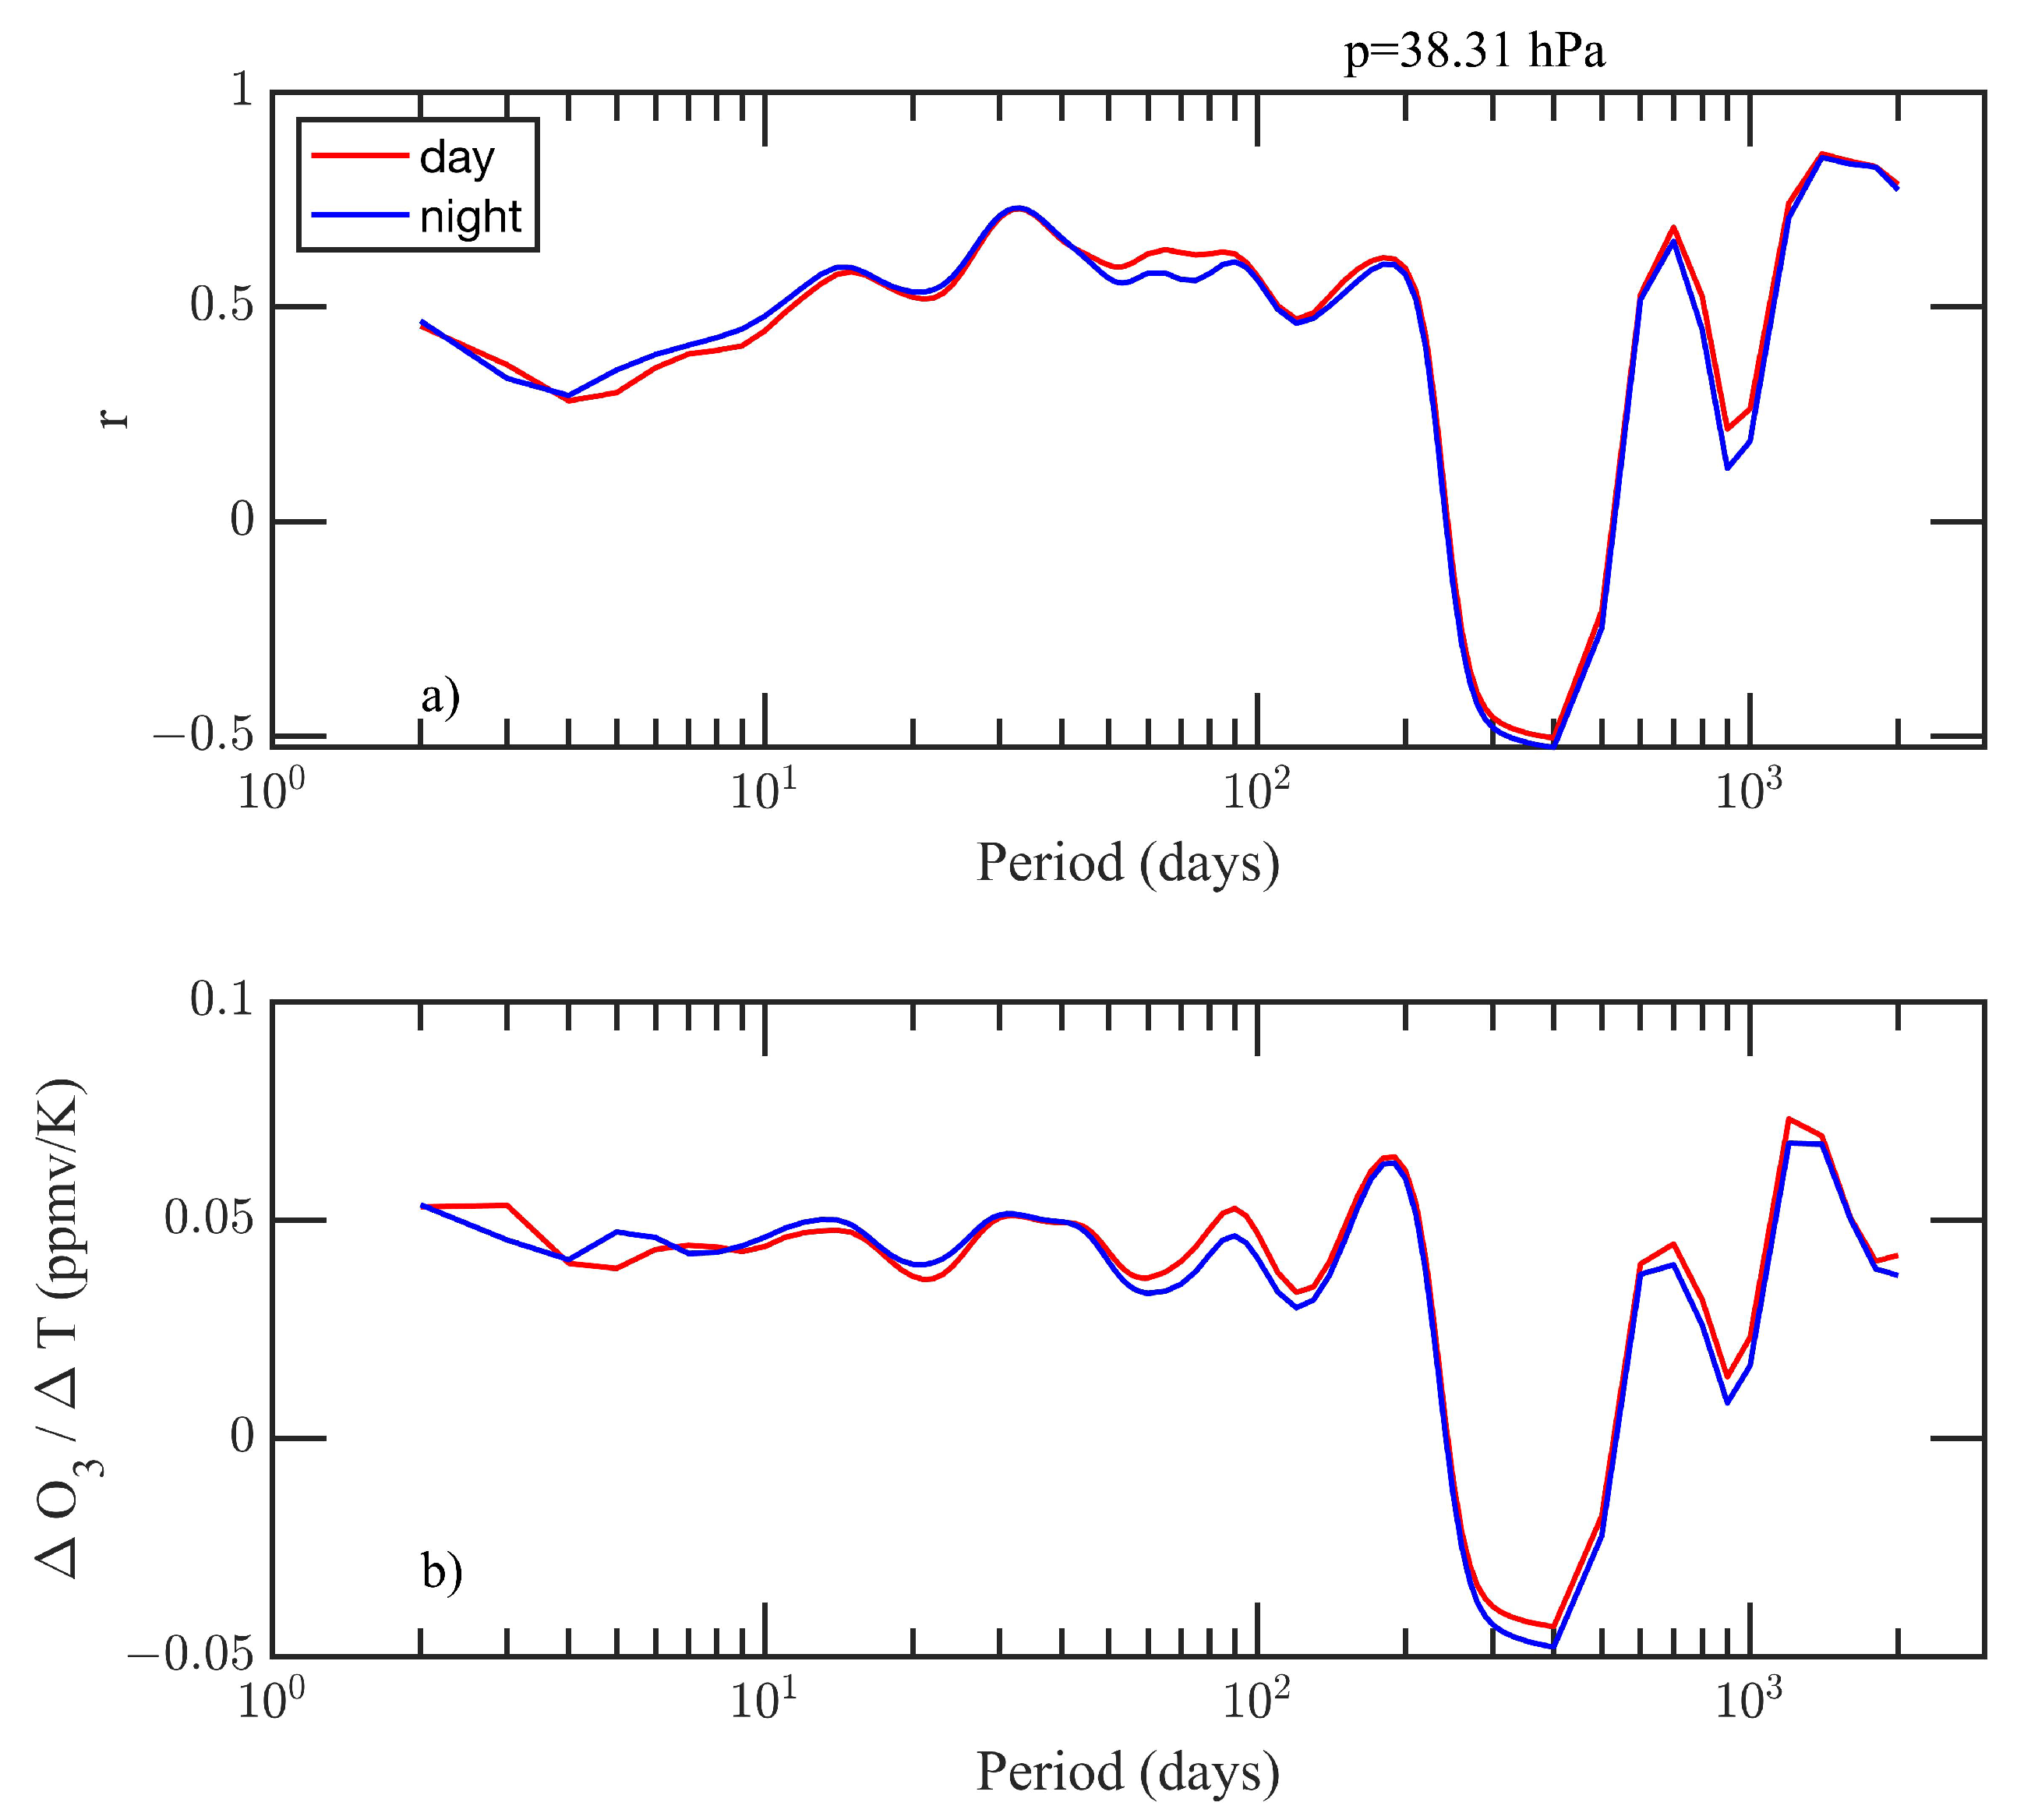
Figure 5 in the lower stratosphere (
hPa). There is a positive correlation of about 0.5 for all periods from 2 days to an half year. This correlation can be explained by the fact that ozone-rich temperature has usually a higher temperature in the lower stratosphere. In the spectrum region of the annual oscillation the correlation switches to an anticorrelation of about
. The reason could be related to the maximum of total column ozone in the winter polar region and to the subsequent transport of polar, cold ozone-rich air to mid-latitudes in spring. This annual transport of ozone may induce an anticorrelation of ozone and temperature observed in the lower stratosphere above a mid-latitude station. At lower periods, the highest correlation of about 0.8 is reached at a period of about 4 years so that it is likely that long-term trends of ozone and temperature are correlated. It is reasonable that increasing ozone values lead to higher temperatures in the lower stratosphere. As expected, there is no significant difference between the spectral curves of daytime and nighttime ozone in the stratosphere.
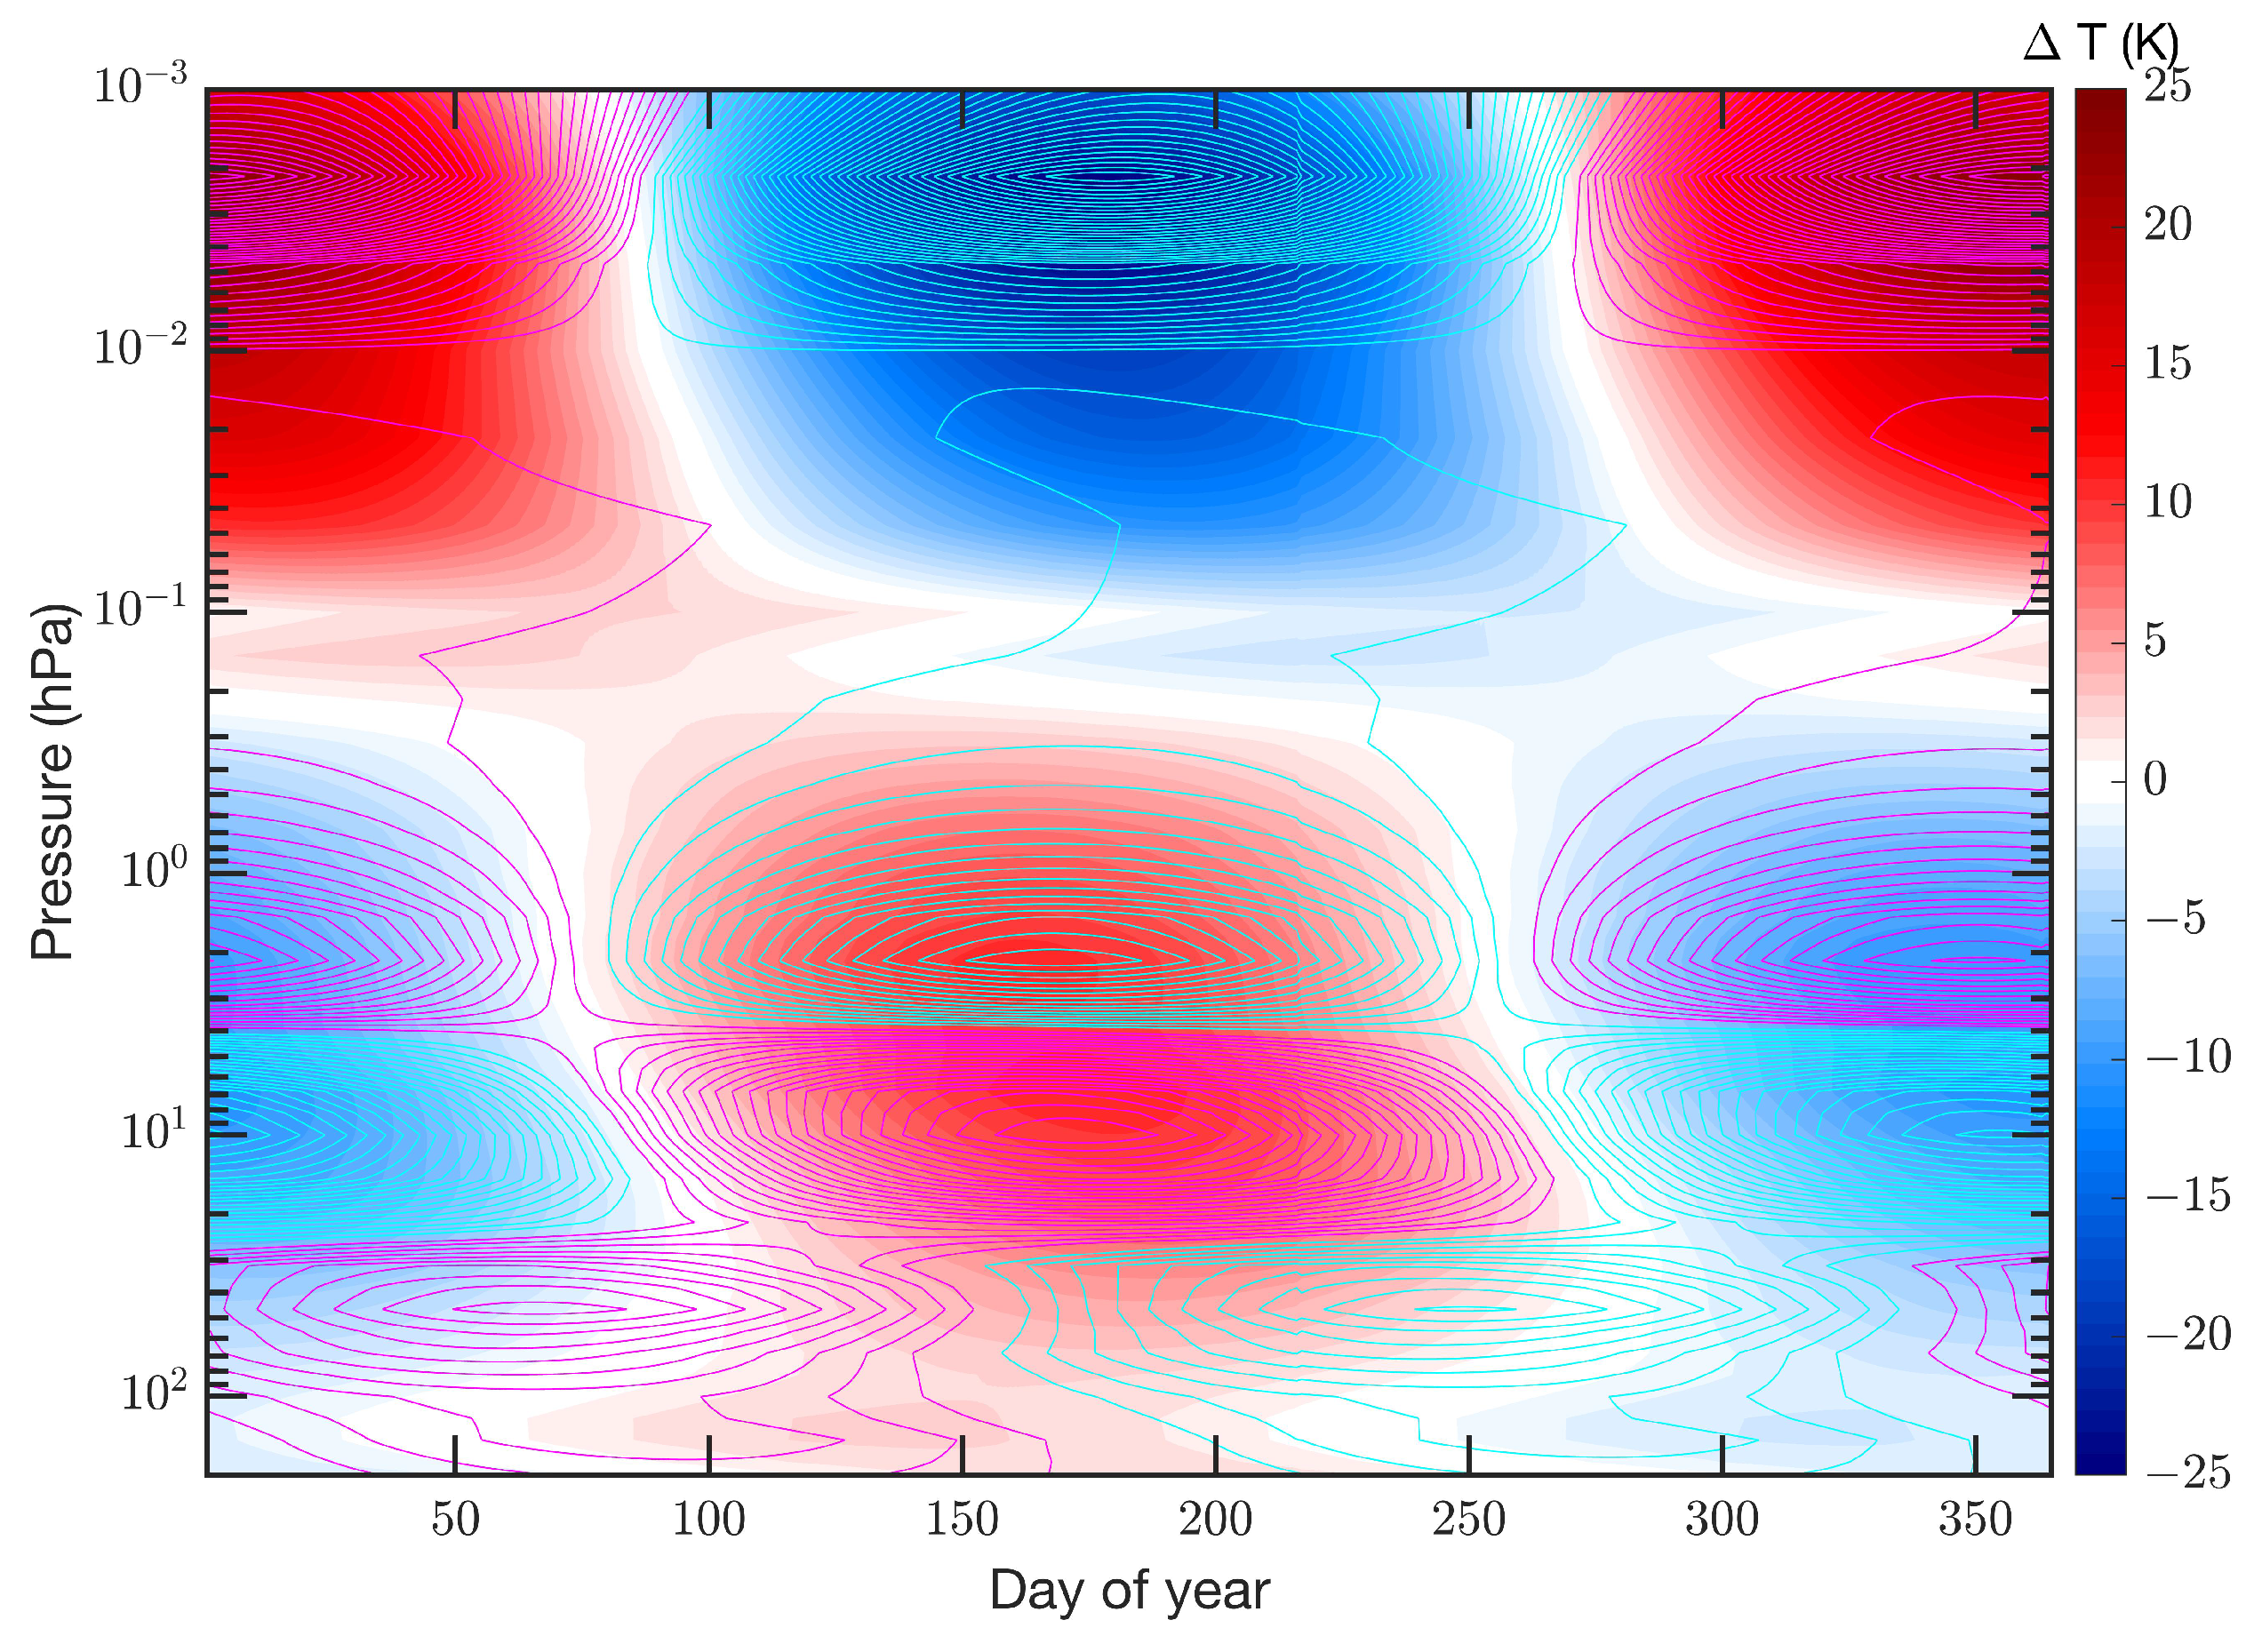
The close relationship between the annual oscillations in temperature and ozone is shown in
Figure 6. It is surprising how fast the correlation between ozone and temperature turns into an anticorrelation at pressure levels above 4 hPa. This phase change is not so rapid at the equator (not shown here). In the lower stratosphere (below 30 hPa) there is a phase reversal of the ozone AO with positive values in late winter. In the upper mesosphere (beyond 0.01 hPa), there is a clear correlation between ozone and temperature with negative values in summer. This is due to the gravity wave-induced upwelling in summer which leads to adiabatic cooling. The nighttime ozone is under dynamical control and ozone-poor air from lower altitudes is vertically advected into the upper mesosphere during summer. There is a region in the lower mesosphere from 0.2 hPa to 0.01 hPa where ozone does not show a significant annual oscillation.
3.2. Results at the Equator
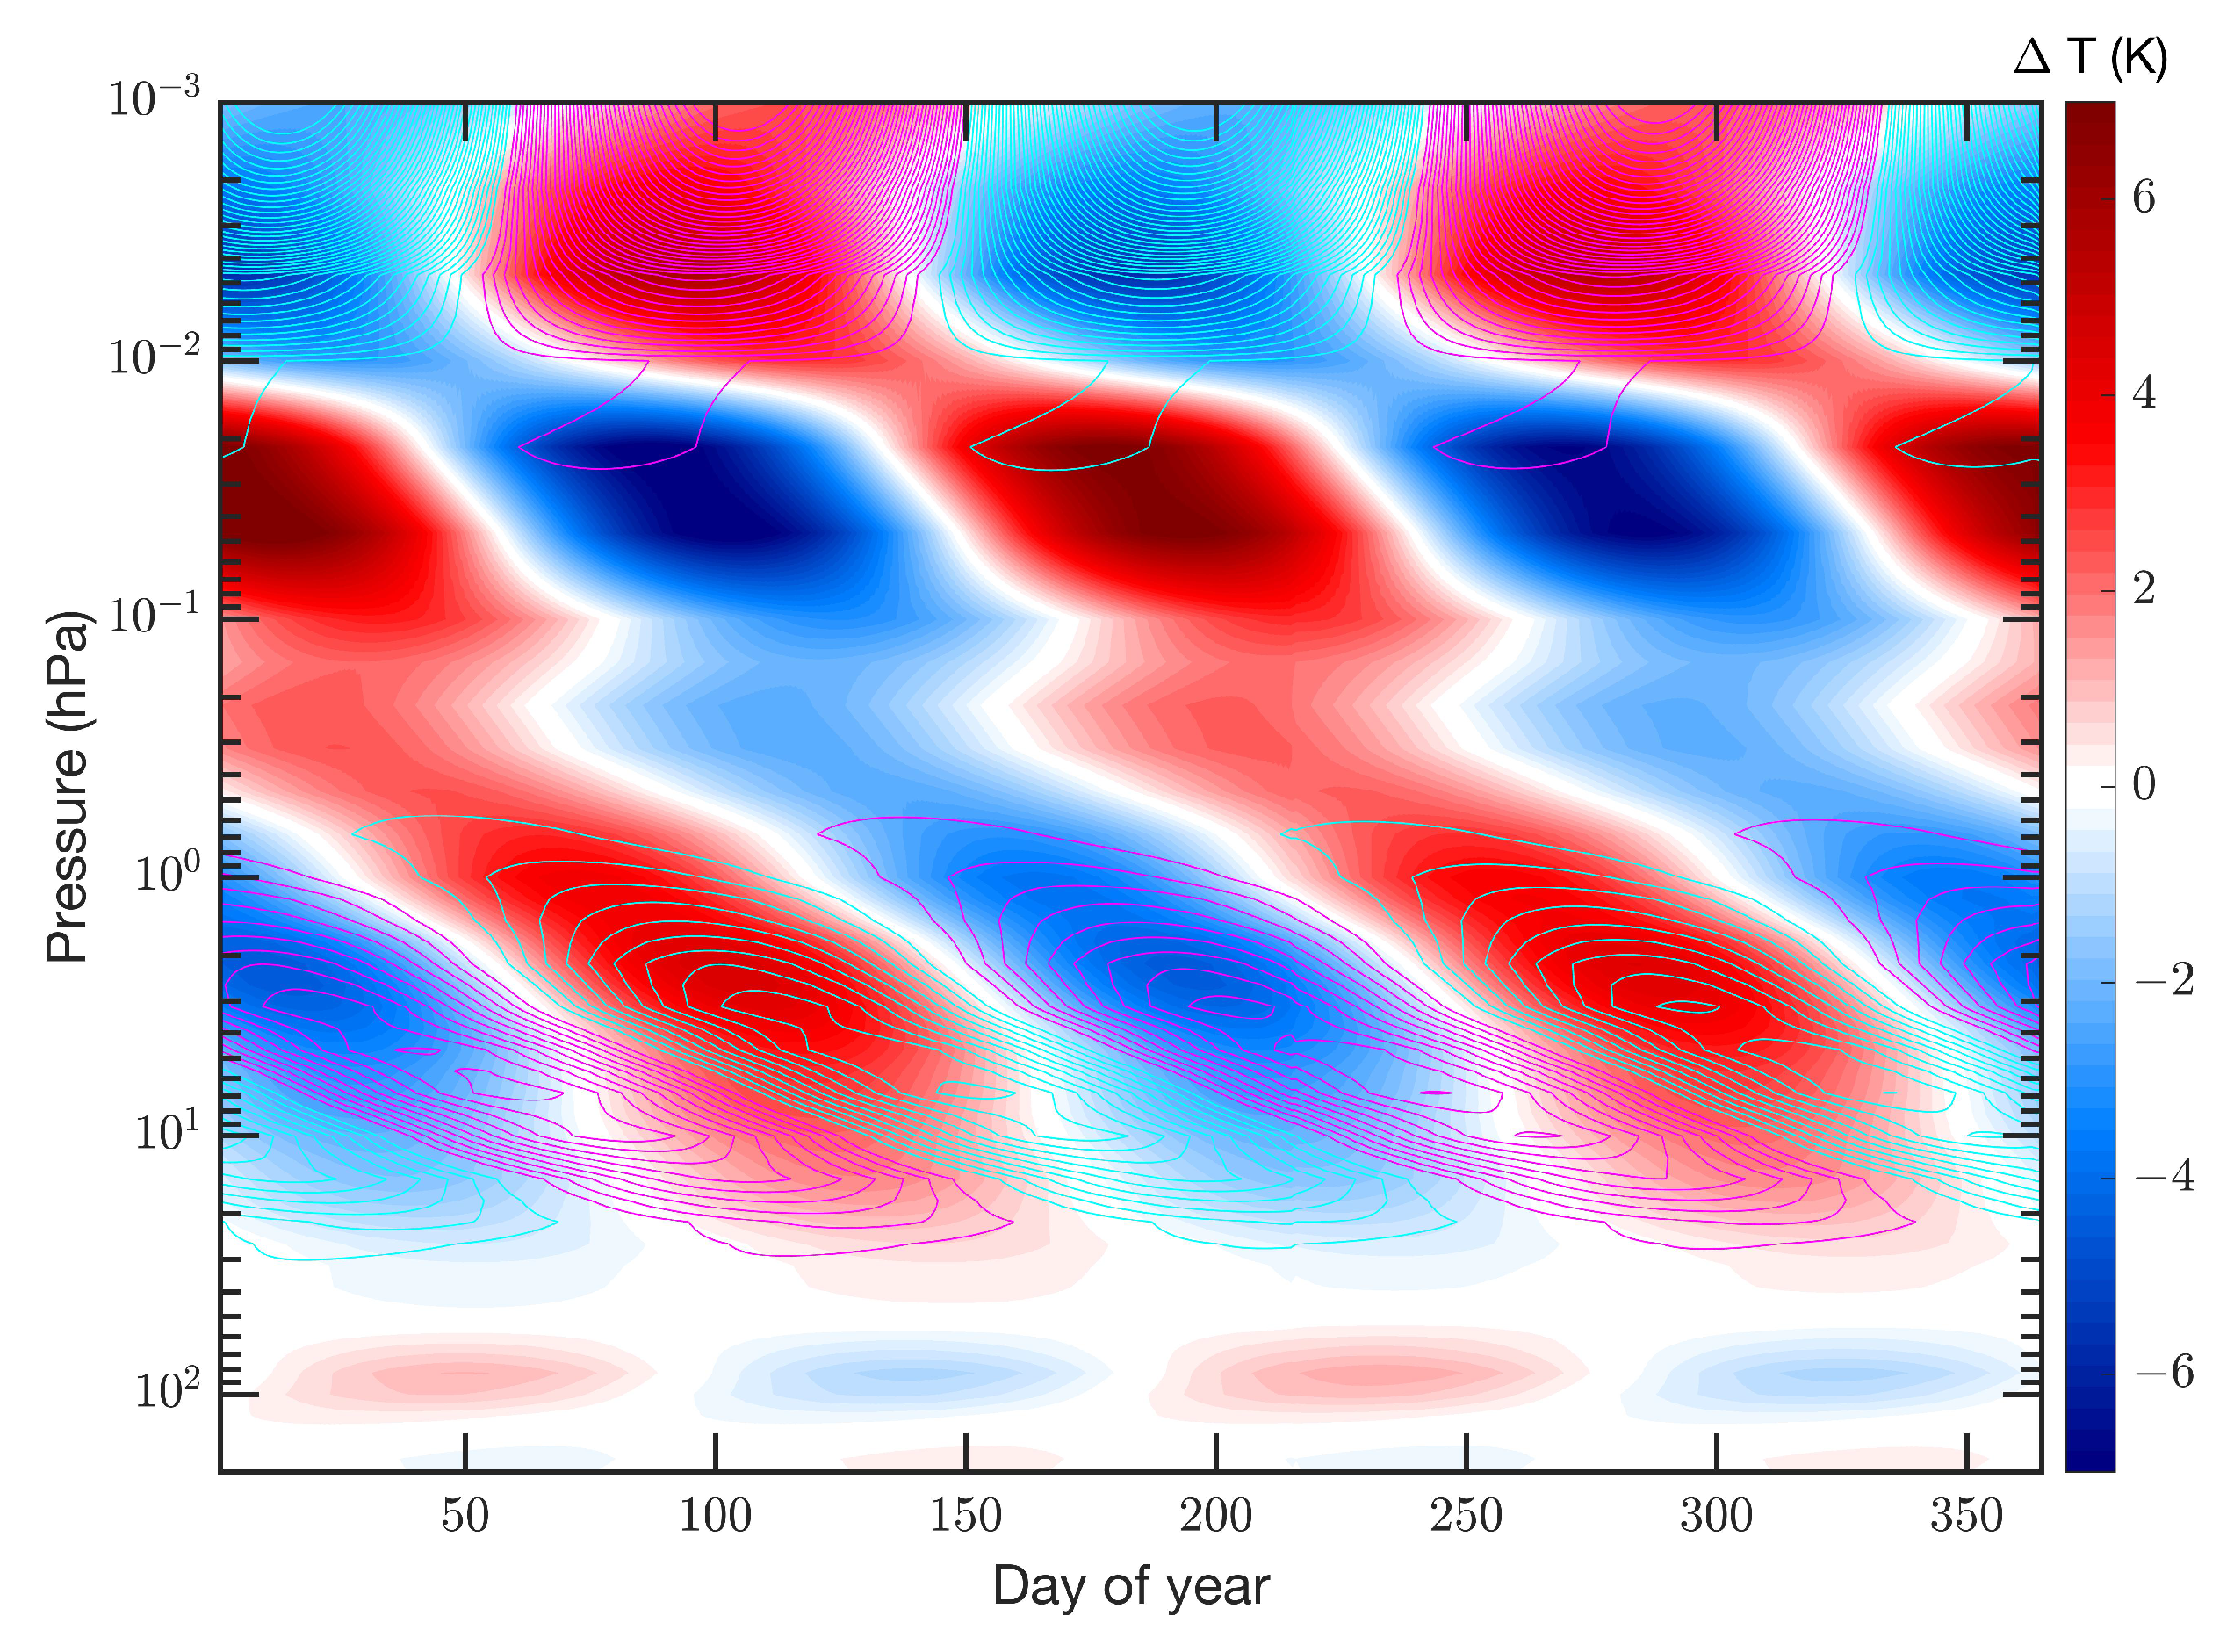
It is certainly interesting to investigate the ozone and the temperature semiannual oscillations at the equator. The climatology of the SAOs in temperature and ozone is shown in
Figure 7. It is evident that the SAO has a phase progression below 0.01 hPa. Between 1 hPa and 30 hPa the phase progression of the ozone SAO is stronger than the phase progression of the temperature SAO. Fadnavis and Beig [
8] reported this in the opposite manner but maybe they meant the vertical steepness of the phase fronts (and not the phase progression) of the SAOs. As in case of the AO at mid-latitudes, there is a region in the lower mesosphere (0.5 hPa to 0.01 hPa) where the ozone oscillation is small while the temperature SAO is maximal. Thus, the photochemical control does not transfer the temperature SAO into the ozone SAO here. Beyond 0.01 hPa, there is a dynamical control of nighttime ozone leading to a strong correlation of the temperature and ozone SAO. The mesospheric SAO in the nighttime values is mainly due to the strong semiannual modulation of the diurnal tide at the equator which shows maximal downwelling during nighttime in April and October [
13].
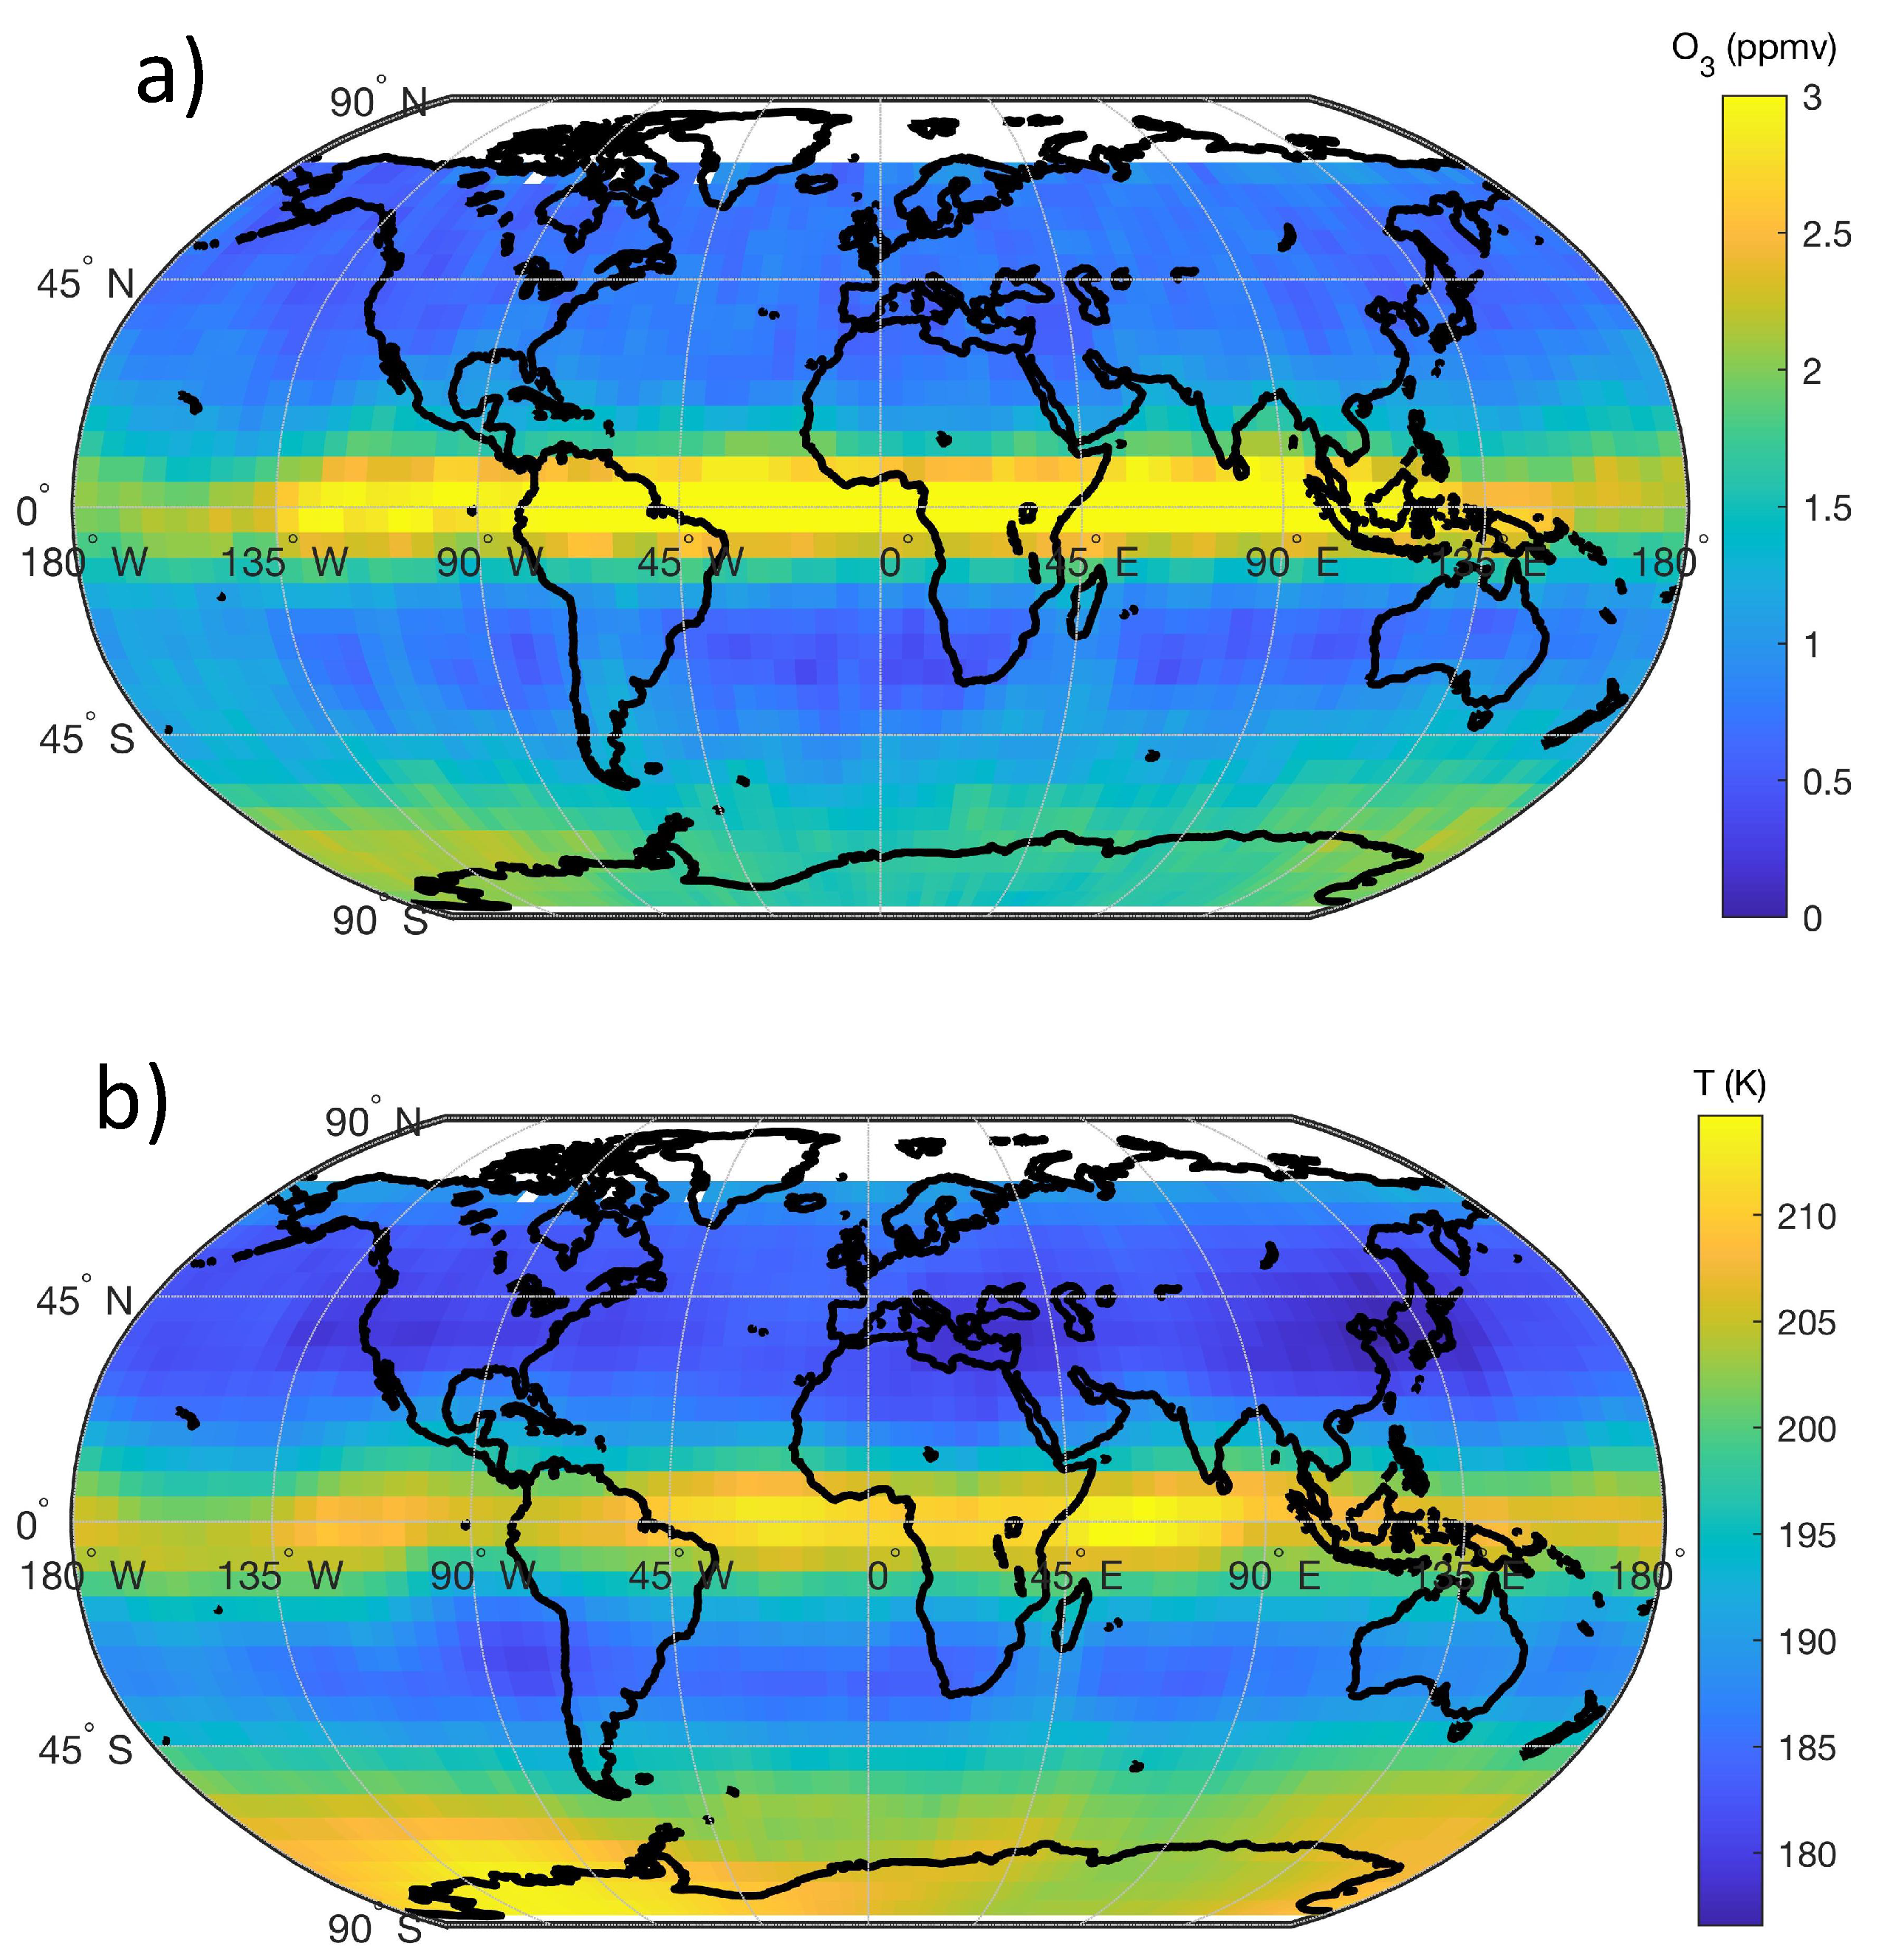
Using the global Aura/MLS observations during nighttime, the signatures of the strong downwelling in nighttime ozone and nighttime temperature at p=0.0046 hPa in the upper mesosphere in April (2005 to 2021) are shown in
Figure 8. The results are similar to the results of [
13] obtained from TIMED/SABER observations of atomic oxygen and temperature. Atomic oxygen and ozone in the mesosphere are in a photochemical equilibrium, and the detailed discussion of the effect of vertical advection of atomic oxygen by the diurnal tide in the equatorial mesosphere [
13] can be applied to nighttime ozone. The enhanced values of ozone and temperature in the Southern polar region are due to downwelling by the residual mean meridional circulation.
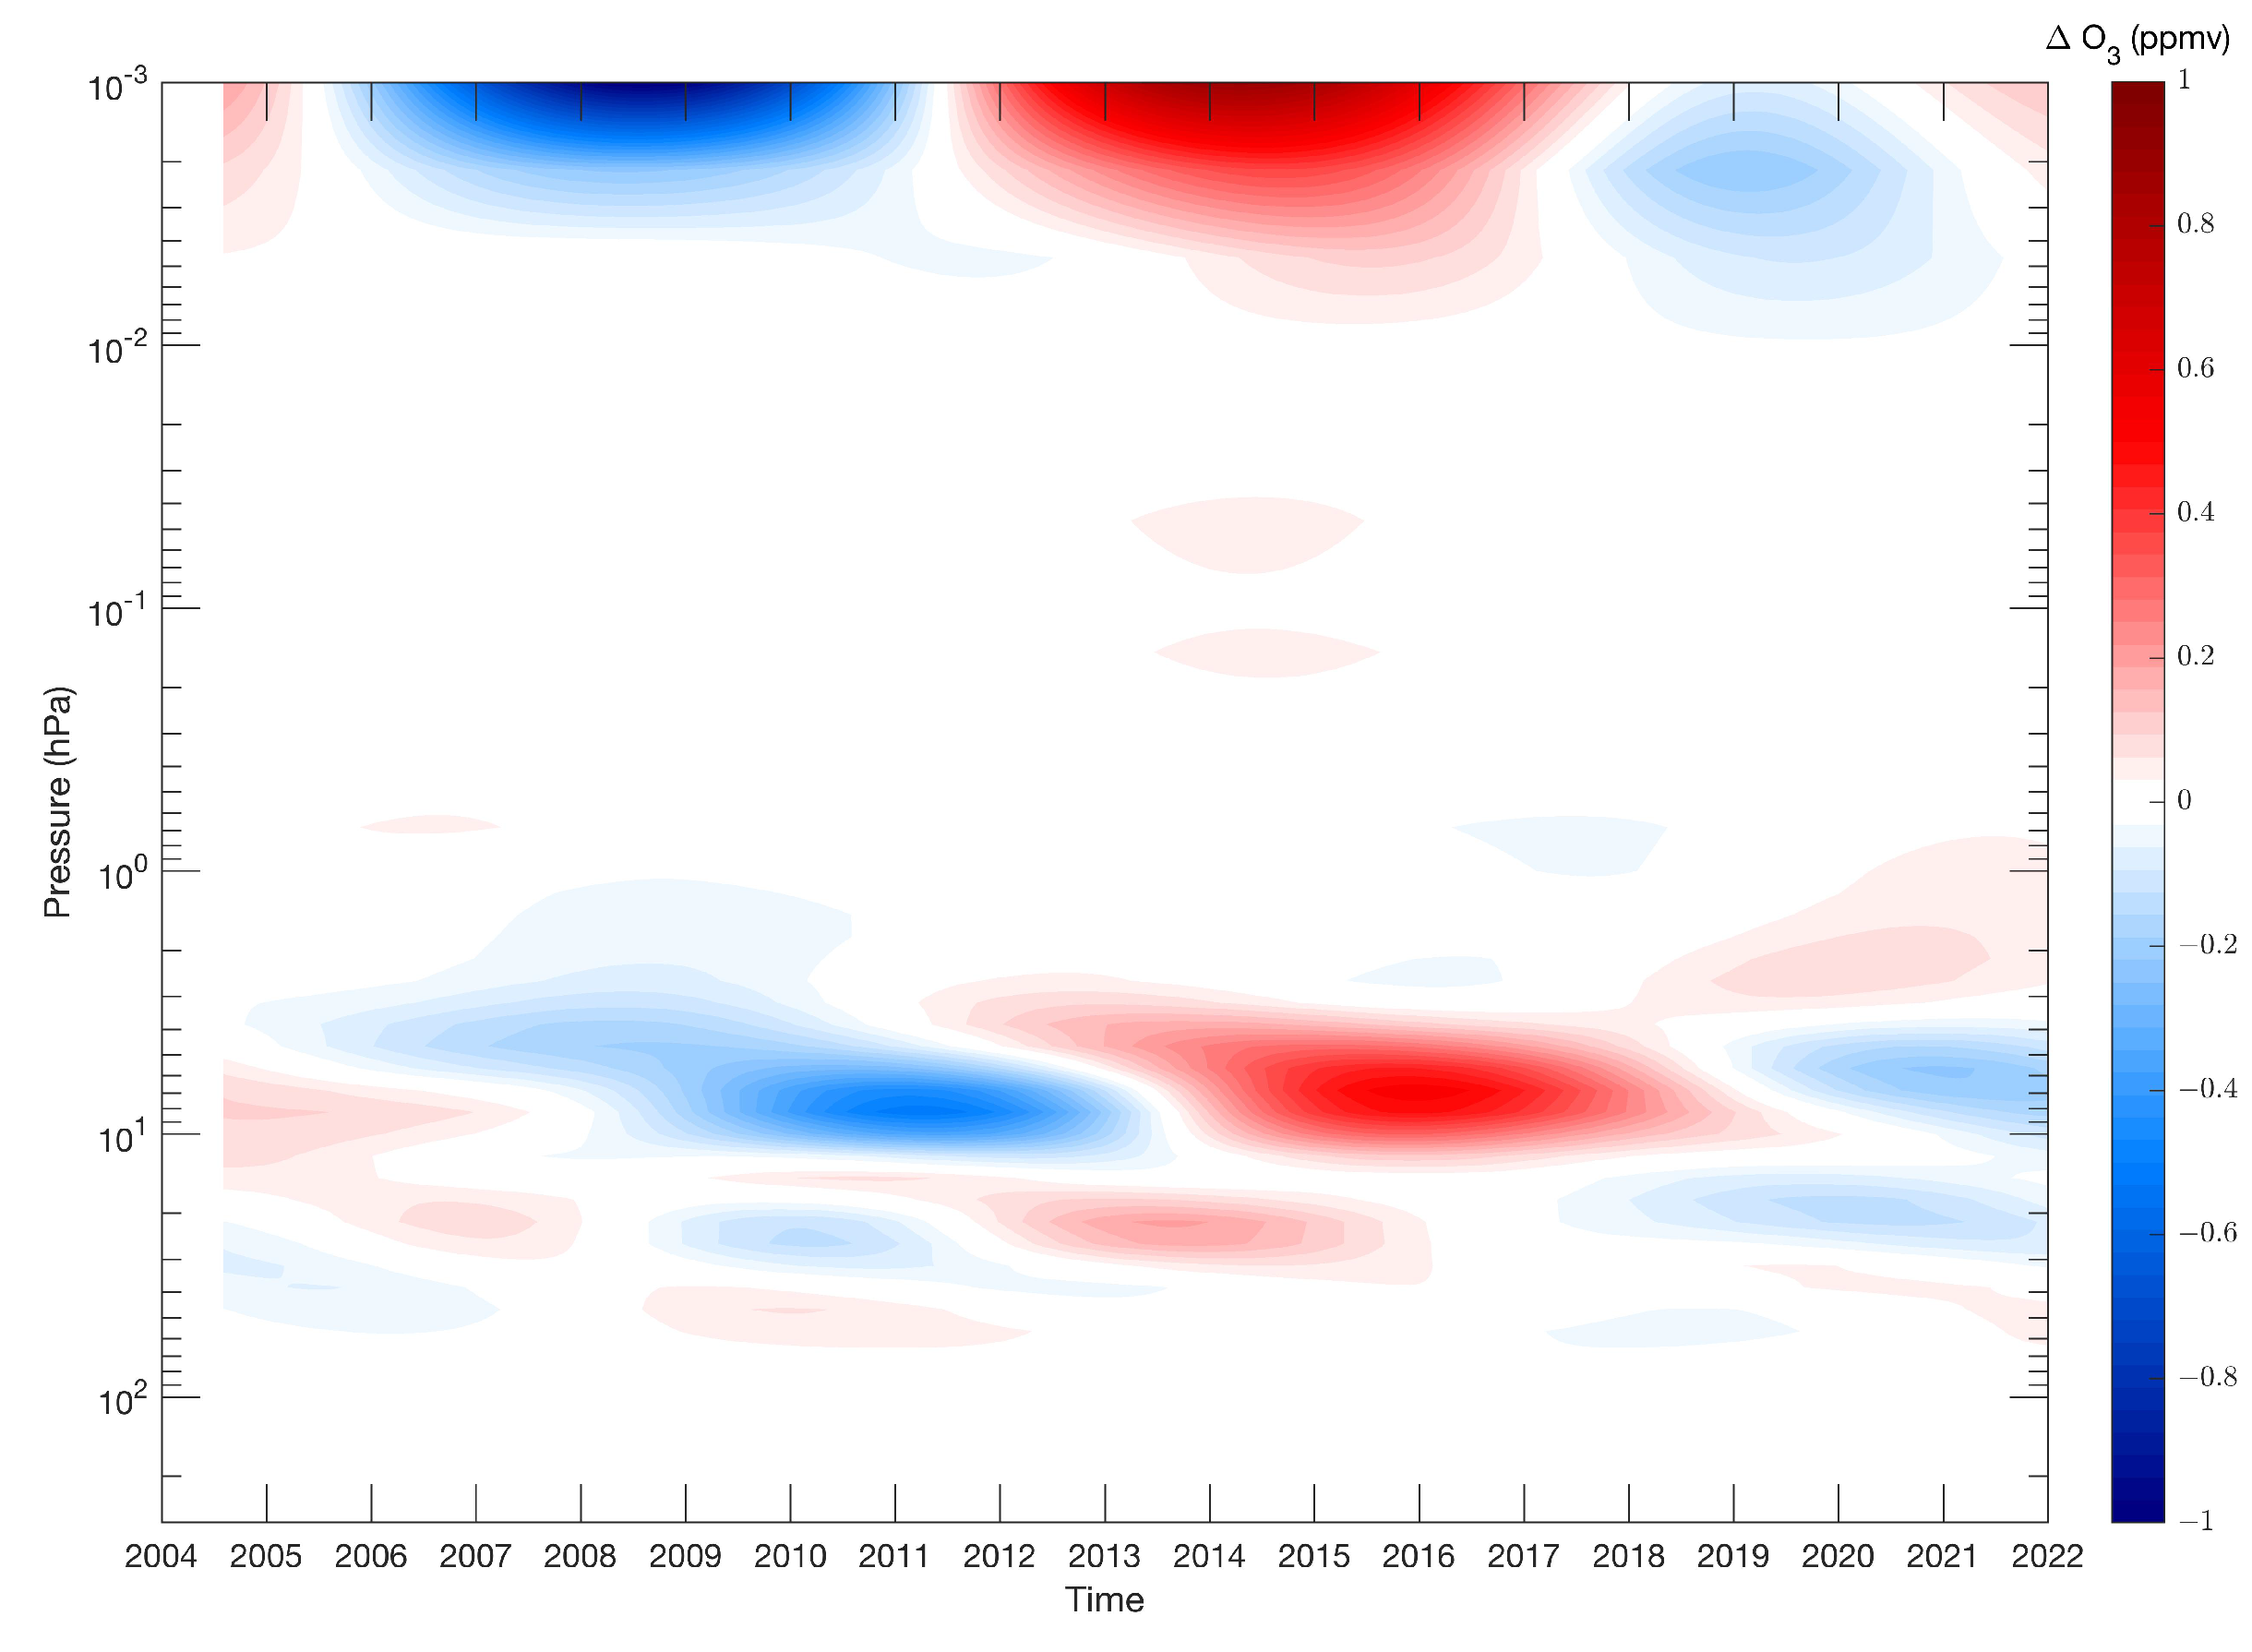
The signal of the 11 year solar cycle in nighttime ozone at the mesopause was investigated by [
6] using Aura/MLS observations. Since the Aura time series is not long enough for bandpass filtering, we apply here a 5 year-lowpass to the equatorial nighttime ozone data in order to emphasize the periods longer than 5 years (
Figure 9). The lowpass ozone series are subtracted by the mean nighttime ozone value at each pressure level. In the upper mesosphere, the filtered ozone oscillation is in phase with the solar cycle which had a maximum in 2014. This finding confirms the study of [
6]. The relative ozone change per solar flux unit is about 40 %/ 100 sfu at 0.001 hPa (sfu: solar flux unit of 10.7 cm solar flux). This magnitude and also the increase of the nighttime ozone response in the upper mesosphere is in a rough agreement with an observational study by [
14] who showed that nighttime ozone in the upper mesosphere and beyond is most sensitive to the solar cycle. Please see [
6] for a comparison between the Aura/MLS results and solar cycle modeling studies.
There is also an ozone variation in the stratosphere at about 10 hPa which has a phase lag of about two years with respect to the solar cycle. Generally, the altitude variation of the nighttime ozone variation in
Figure 9 agree well with [
14] who also found two regions where the ozone response (in ppmv) to the solar cycle is relatively strong: in the mid-stratosphere and in the upper mesosphere.
We also tried lowpass filtering of the temperature but there are too many temperature oscillations with periods greater than 5 years, so that an attribution to the solar cycle becomes more difficult than in case of ozone.
4. Conclusions
The frequency dependence of the correlation between ozone and temperature was investigated for the first time. The study focused on Aura/MLS observations at mid-latitudes. The anticorrelation of ozone and temperature in the upper stratosphere is also found for short periods down to 2 days. However, it remains unclear in how far the anticorrelation is also valid for long periods greater than 4 years and long-term trends of temperature and ozone in the upper stratosphere.
In the lower stratosphere, it seems that the correlation of ozone and temperature is valid at periods greater than 2 years suggesting a correlation of ozone and temperature trends. The annual oscillation (AO) shows an anticorrelation of ozone and temperature in the lower stratosphere. This anticorrelation is not found at other frequencies which showed a correlation. It is supposed that yearly transport of cold and ozone-rich polar air to mid-latitudes may explain this anomaly of the correlation of the AOs.
The mid-latitude AOs and equatorial SAOs of nighttime ozone are strongly correlated with those of the temperature in the upper mesosphere beyond 0.01 hPa. The correlation is due to a dynamical control of nighttime ozone influenced by upwelling and downwelling of the secondary ozone layer. The equatorial SAO is due to vertical advection by the diurnal tide which is associated with enhanced values of nighttime ozone and nighttime temperature, particularly in April and October. The 11-year ozone variation in the equatorial upper mesosphere seems to be in phase with the solar cycle (as already reported by [
6]). In the stratosphere at 10 hPa, there seems to be a 2 year phase lag of the ozone variation with respect to the solar cycle.
Author Contributions
Conceptualization, K.H. and E.S.; methodology, K.H.; software, K.H. and E.S..; formal analysis, K.H.; data curation, E.S.; writing—original draft preparation, K.H.; writing—review and editing, K.H. and E.S.; All authors have read and agreed to the published version of the manuscript..
Funding
This research received no external funding.
Informed Consent Statement
Not applicable.
Acknowledgments
We thank the University of Bern for supporting our study. We thank the Aura/MLS team for their data.
Conflicts of Interest
The authors declare no conflict of interest.
References
- Zhou, L.; Xia, Y.; Zhao, C. Influence of Stratospheric Ozone Changes on Stratospheric Temperature Trends in Recent Decades. Remote Sensing 2022, 14. [Google Scholar] [CrossRef]
- Calisesi, Y.; Wernli, H.; Kämpfer, N. Midstratospheric ozone variability over Bern related to planetary wave activity during the winters 1994–1995 to 1998–1999. J. Geophys. Res. 2001, 106, 7903–7916. [Google Scholar] [CrossRef]
- Schanz, A.; Hocke, K.; Kämpfer, N. Daily ozone cycle in the stratosphere: global, regional and seasonal behaviour modelled with the Whole Atmosphere Community Climate Model. Atmospheric Chemistry and Physics 2014, 14, 7645–7663. [Google Scholar] [CrossRef]
- World Meteorological Organization. Scientific Assessment of Ozone Depletion: 2022; GAW Report No. 278; WMO: Geneva, 2022; 509 pp. [Google Scholar]
- Stolarski, R.S.; Douglass, A.R.; Remsberg, E.E.; Livesey, N.J.; Gille, J.C. Ozone temperature correlations in the upper stratosphere as a measure of chlorine content. Journal of Geophysical Research: Atmospheres 2012, 117. [Google Scholar] [CrossRef]
- Lee, J.N.; Wu, D.L. Solar Cycle Modulation of Nighttime Ozone Near the Mesopause as Observed by MLS. Earth and Space Science 2020, 7, e2019EA001063. [Google Scholar] [CrossRef]
- Moreira, L.; Hocke, K.; Navas-Guzmán, F.; Eckert, E.; von Clarmann, T.; Kämpfer, N. The natural oscillations in stratospheric ozone observed by the GROMOS microwave radiometer at the NDACC station Bern. Atmospheric Chemistry and Physics 2016, 16, 10455–10467. [Google Scholar] [CrossRef]
- Fadnavis, S.; Beig, G. Features of SAO in ozone and temperature over tropical stratosphere by wavelet analysis. International Journal of Remote Sensing 2010, 31, 299–311. [Google Scholar] [CrossRef]
- Waters, J.W.; Froidevaux, L.; Harwood, R.S.; Jarnot, R.F.; Pickett, H.M.; Read, W.G.; Siegel, P.H.; Cofield, R.E.; Filipiak, M.J.; Flower, D.A.; et al. The Earth Observing System Microwave Limb Sounder (EOS MLS) on the Aura satellite. IEEE Transactions on Geoscience and Remote Sensing 2006, 44, 1075–1092. [Google Scholar] [CrossRef]
- Livesey, N.J.; Read, W.G.; Wagner, P.A.; Froidevaux, L.; Santee, M.L.; Schwartz, M.J.; Lambert, A.; Valle, L.F.M.; Pumphrey, H.C.; Manney, G.L.; et al. Earth Observing System (EOS) Aura Microwave Limb Sounder (MLS) Version 5.0x Level 2 and 3 data quality and description document. Technical report. 2022. Available online: https://mls.jpl.nasa.gov/eos-aura-mls/data-documentation.
- Schwartz, M.J.; Lambert, A.; Manney, G.L.; Read, W.G.; Livesey, N.J.; Froidevaux, L.; Ao, C.O.; Bernath, P.F.; Boone, C.D.; Cofield, R.E.; et al. Validation of the Aura Microwave Limb Sounder temperature and geopotential height measurements. Journal of Geophysical Research: Atmospheres 2008, 113. [Google Scholar] [CrossRef]
- Studer, S.; Hocke, K.; Kämpfer, N. Intraseasonal oscillations of stratospheric ozone above Switzerland. Journal of Atmospheric and Solar-Terrestrial Physics 2012, 74, 189–198. [Google Scholar] [CrossRef]
- Smith, A.K.; Marsh, D.R.; Mlynczak, M.G.; Mast, J.C. Temporal variations of atomic oxygen in the upper mesosphere from SABER. Journal of Geophysical Research: Atmospheres 2010, 115. [Google Scholar] [CrossRef]
- Huang, F.T.; Mayr, H.G. Ozone and temperature decadal solar-cycle responses, and their relation to diurnal variations in the stratosphere, mesosphere, and lower thermosphere, based on measurements from SABER on TIMED. Annales Geophysicae 2019, 37, 471–485. [Google Scholar] [CrossRef]
|
Disclaimer/Publisher’s Note: The statements, opinions and data contained in all publications are solely those of the individual author(s) and contributor(s) and not of MDPI and/or the editor(s). MDPI and/or the editor(s) disclaim responsibility for any injury to people or property resulting from any ideas, methods, instructions or products referred to in the content. |
© 2023 by the authors. Licensee MDPI, Basel, Switzerland. This article is an open access article distributed under the terms and conditions of the Creative Commons Attribution (CC BY) license (http://creativecommons.org/licenses/by/4.0/).
