Submitted:
08 August 2023
Posted:
09 August 2023
You are already at the latest version
Abstract
Keywords:
1. Introduction
2. Materials and Methods
2.1. Materials
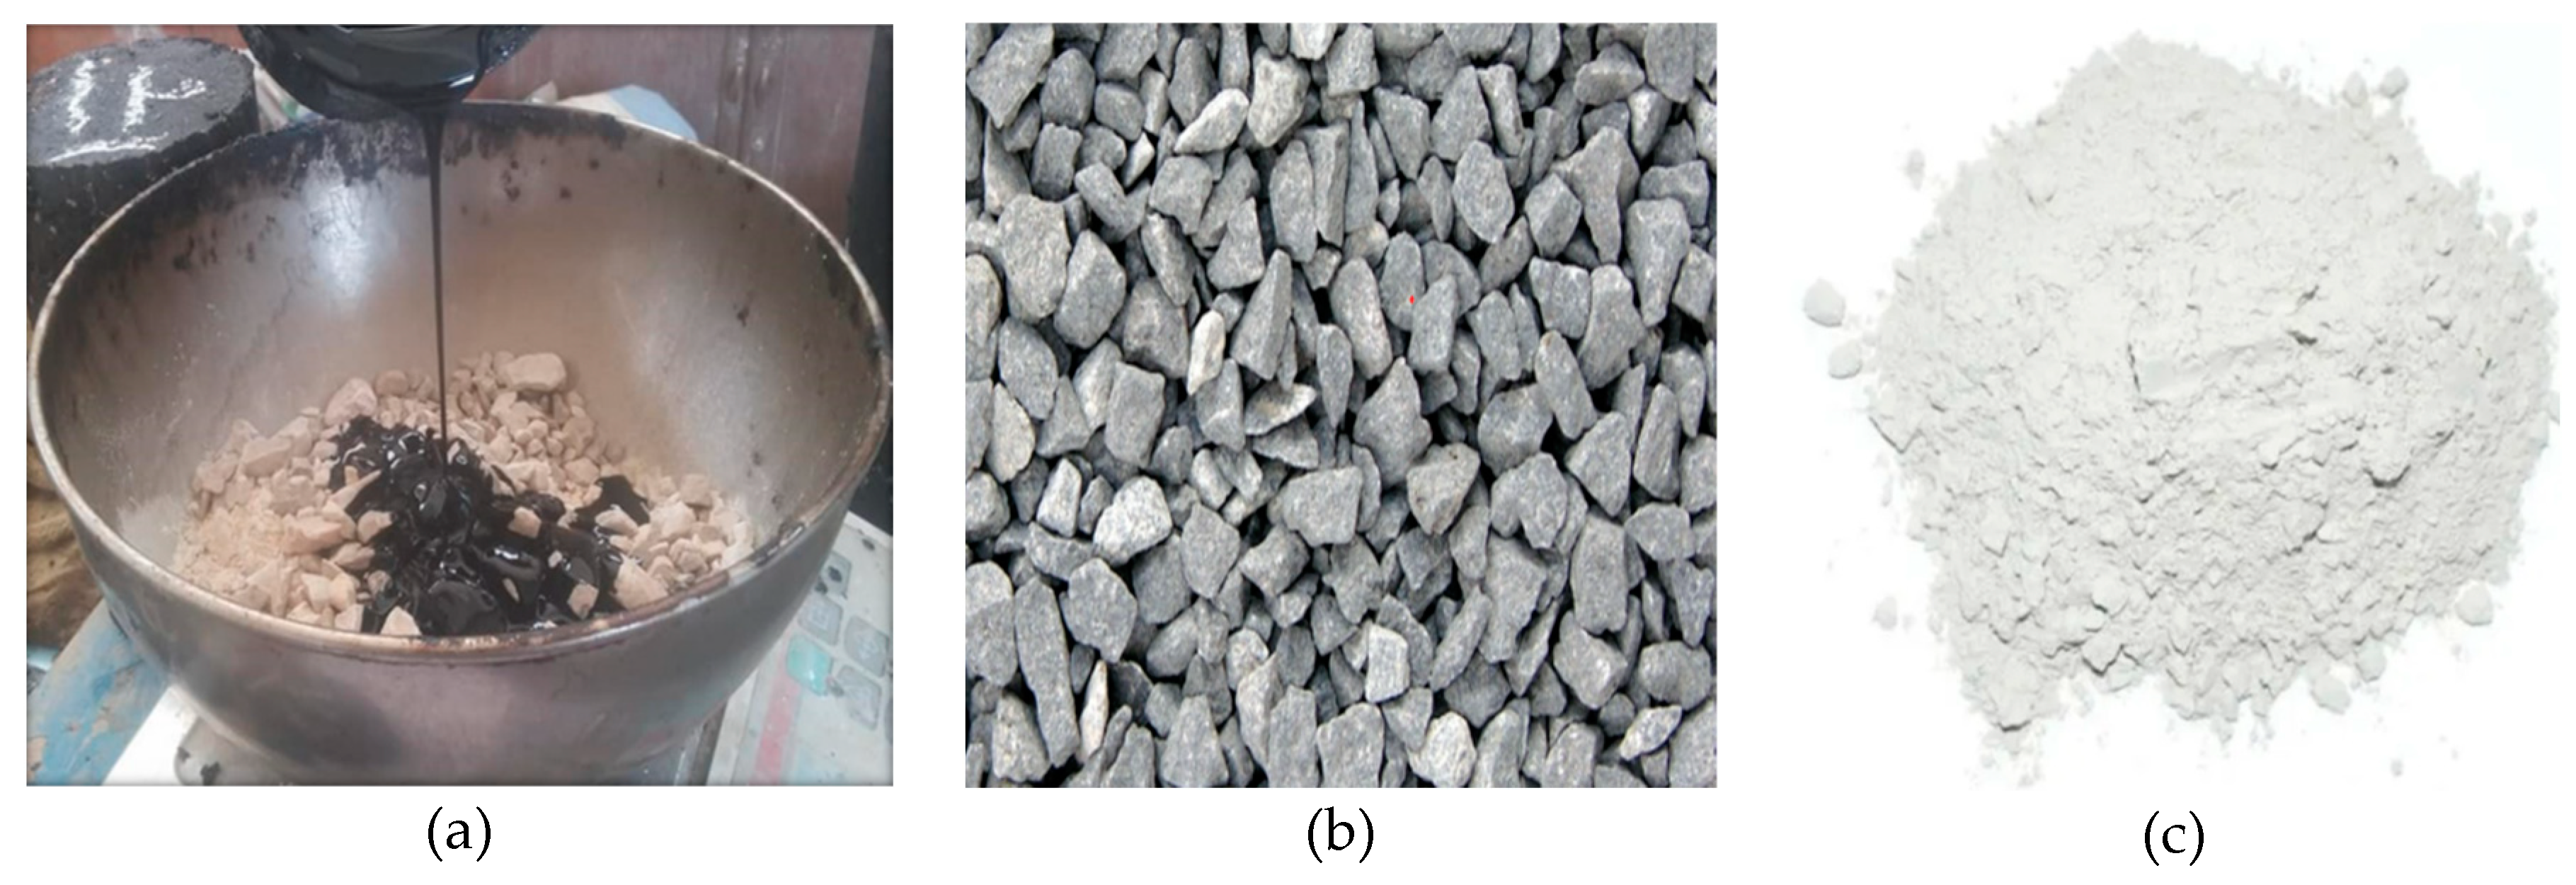
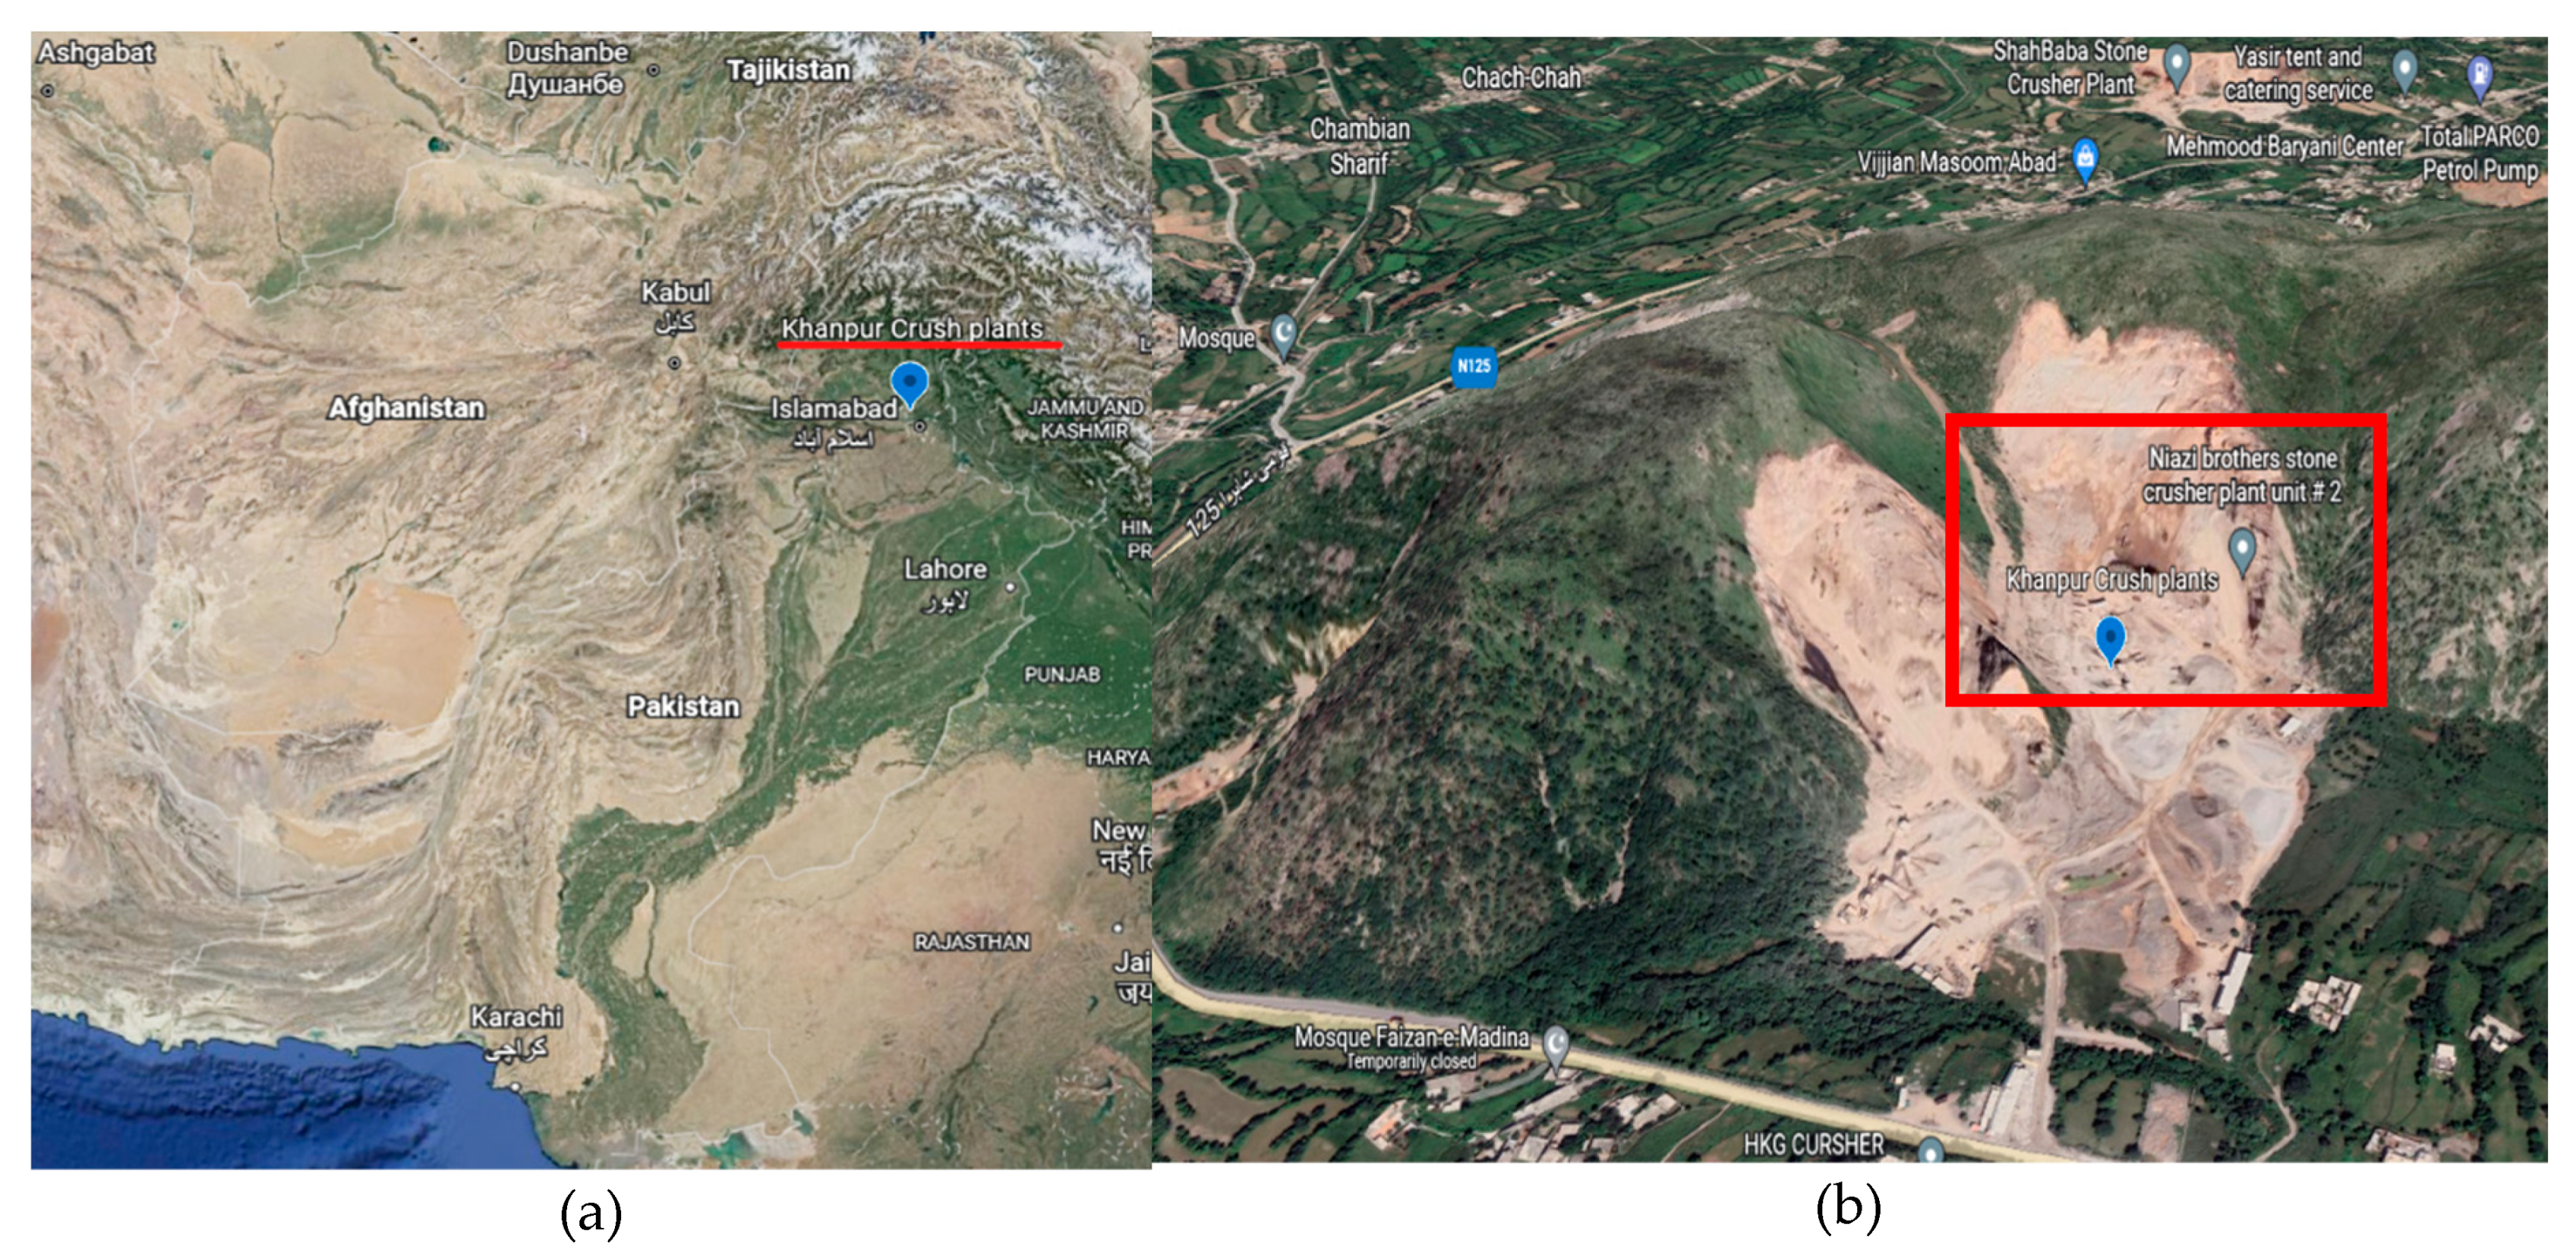
2.1.1. Aggregates
2.1.2. Asphalt Binder
2.1.3. Asphalt Modifier
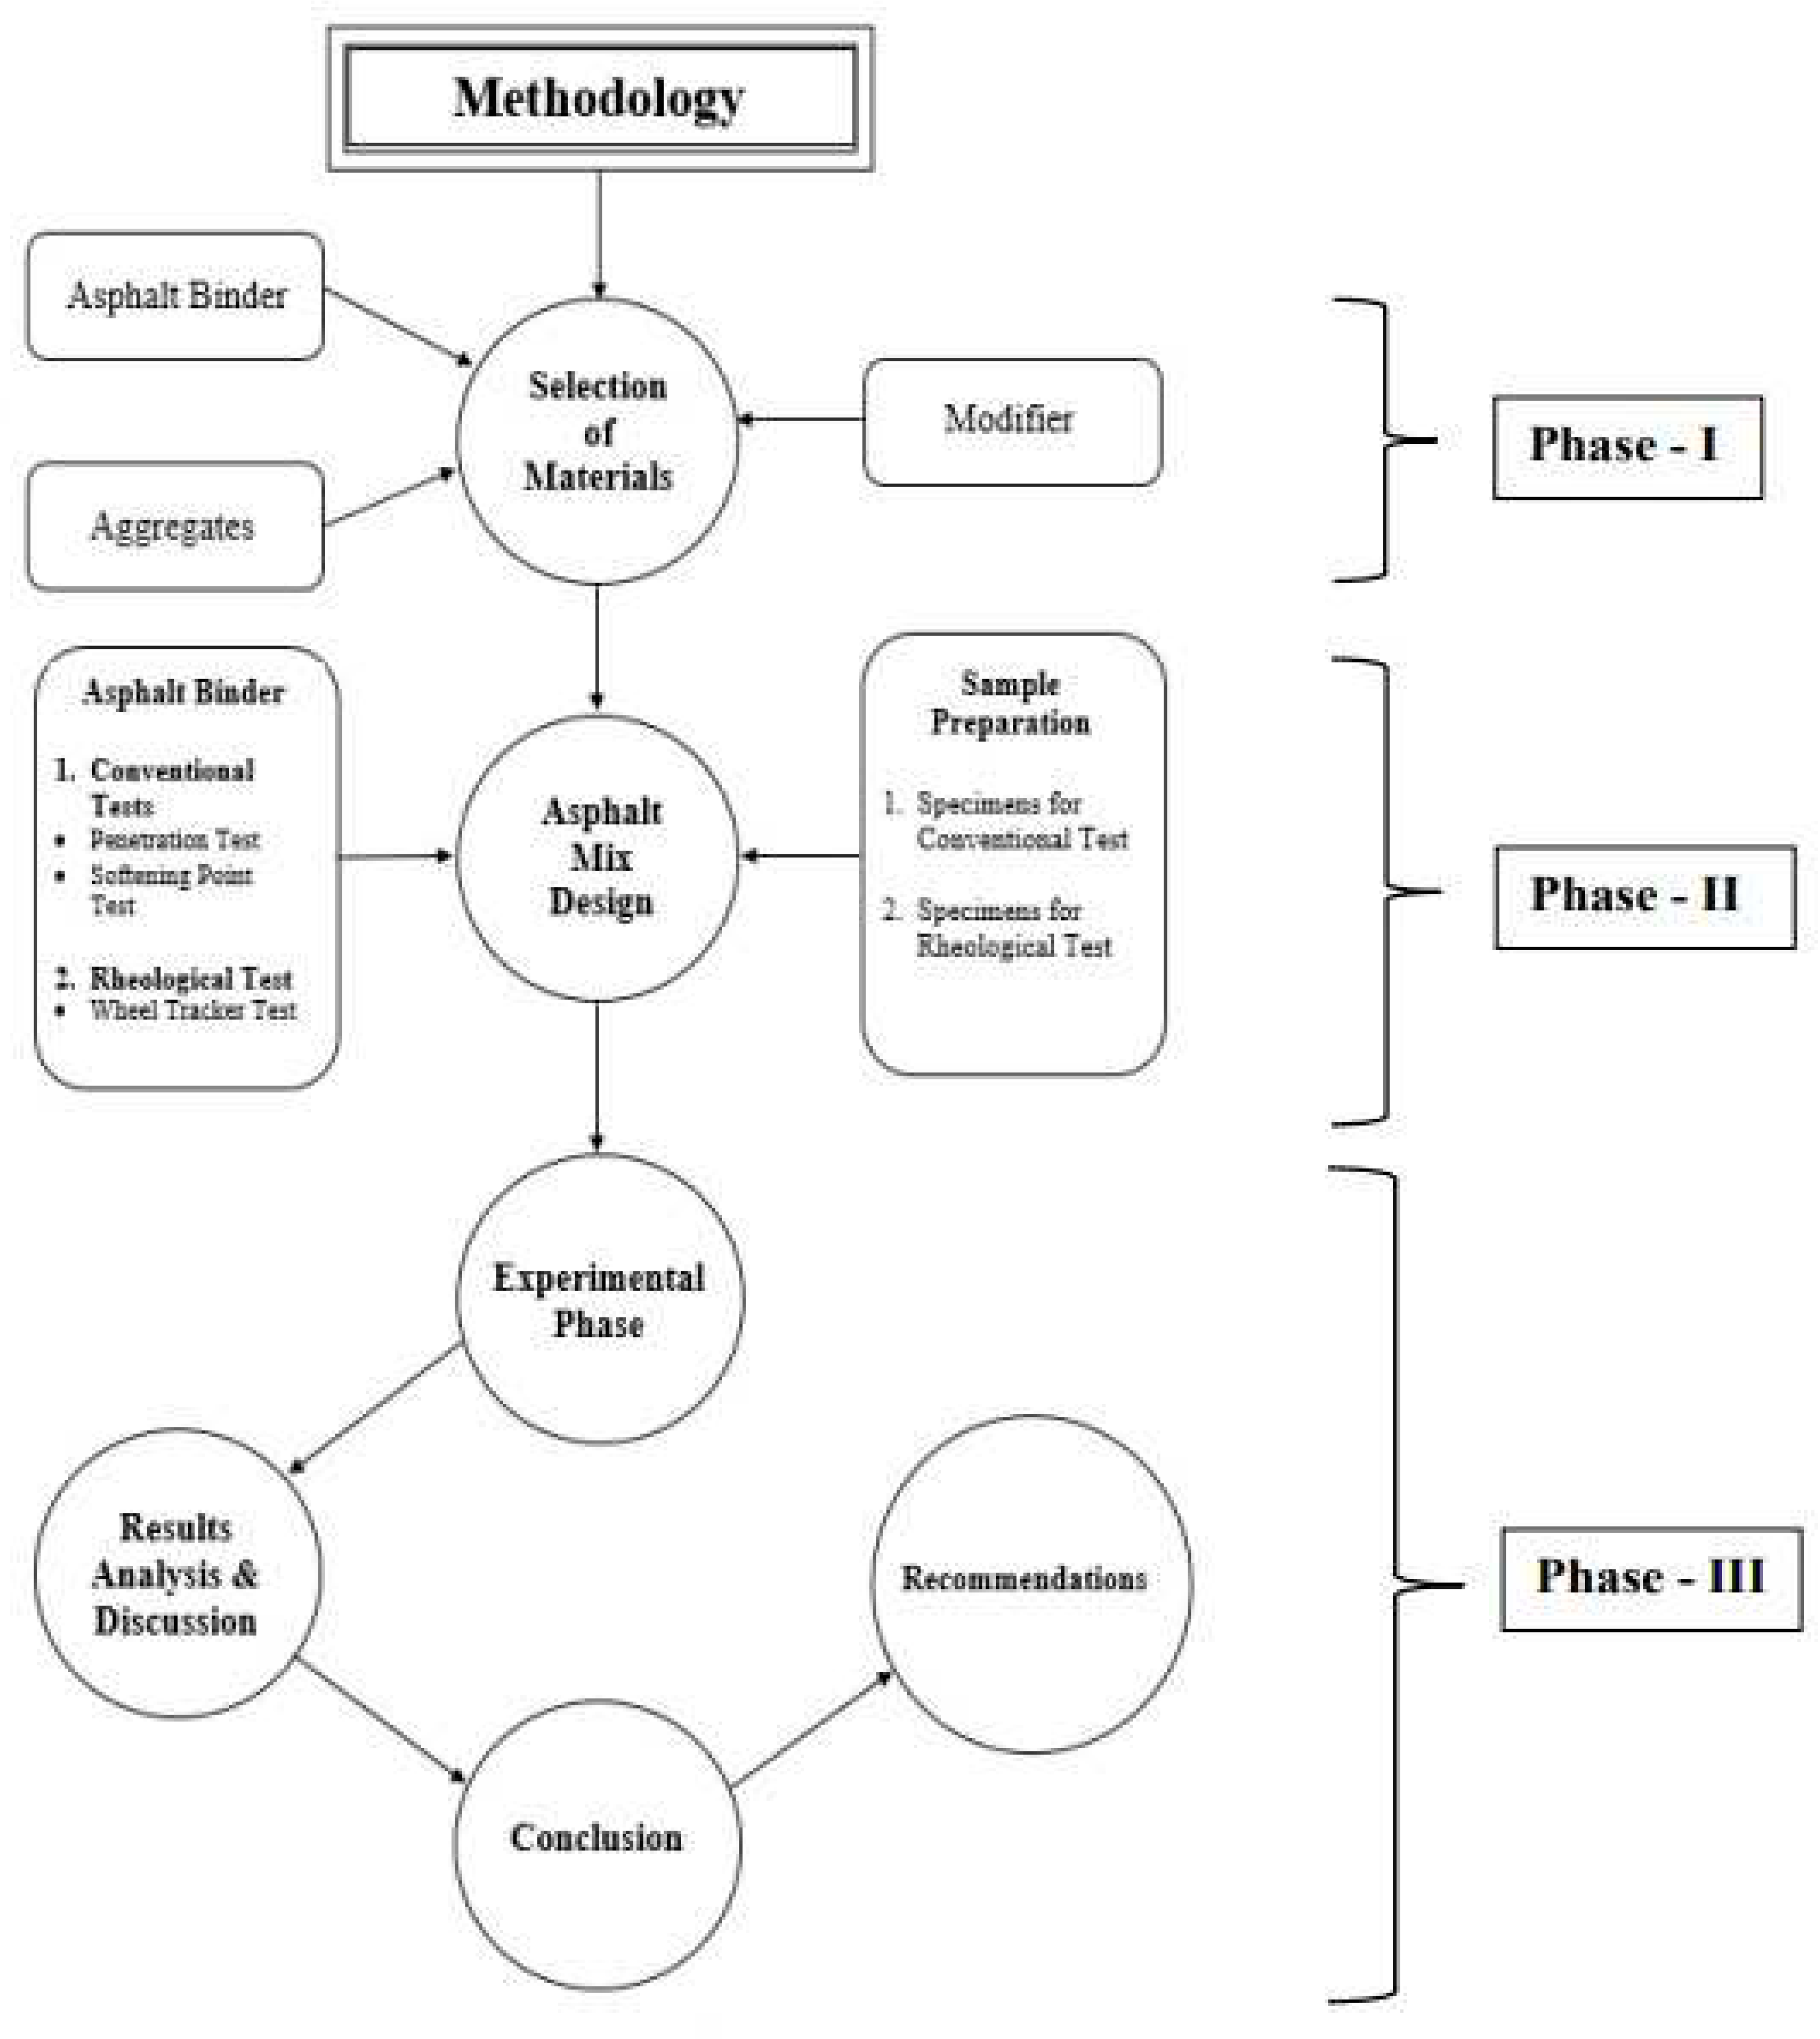
2.2. Asphalt mix design and specimen preparation
2.3. Test Methods
2.3.1. Rotational Viscometer Test
2.3.2. Cooper Wheel Tracker Test (W.T.T.)
3. Results
3.1. Effect of Nano clay on Binder
3.2. Effect of Nano clay on Binder Rheology
3.3. Effect of Nano clay on Rut Resistance
3.4. Effect of Wheel Tracker Test Passes on asphalt mixes
4. Statistical Analysis
4.1. One-Way ANOVA Analysis
4.2. Regression
5. Conclusions
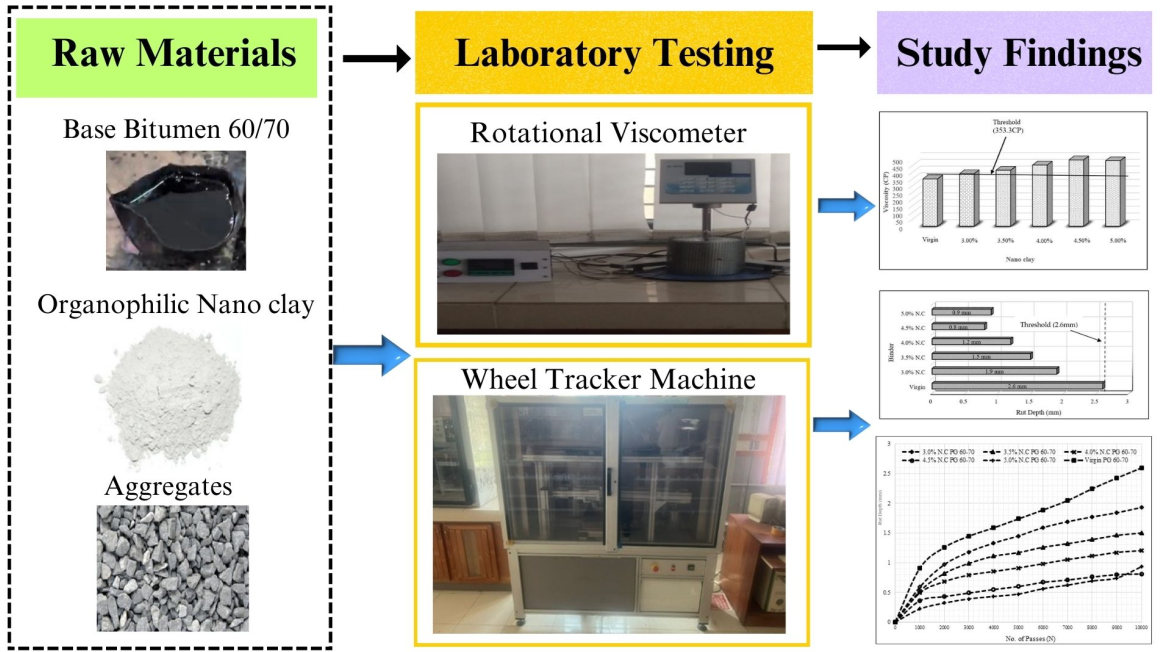
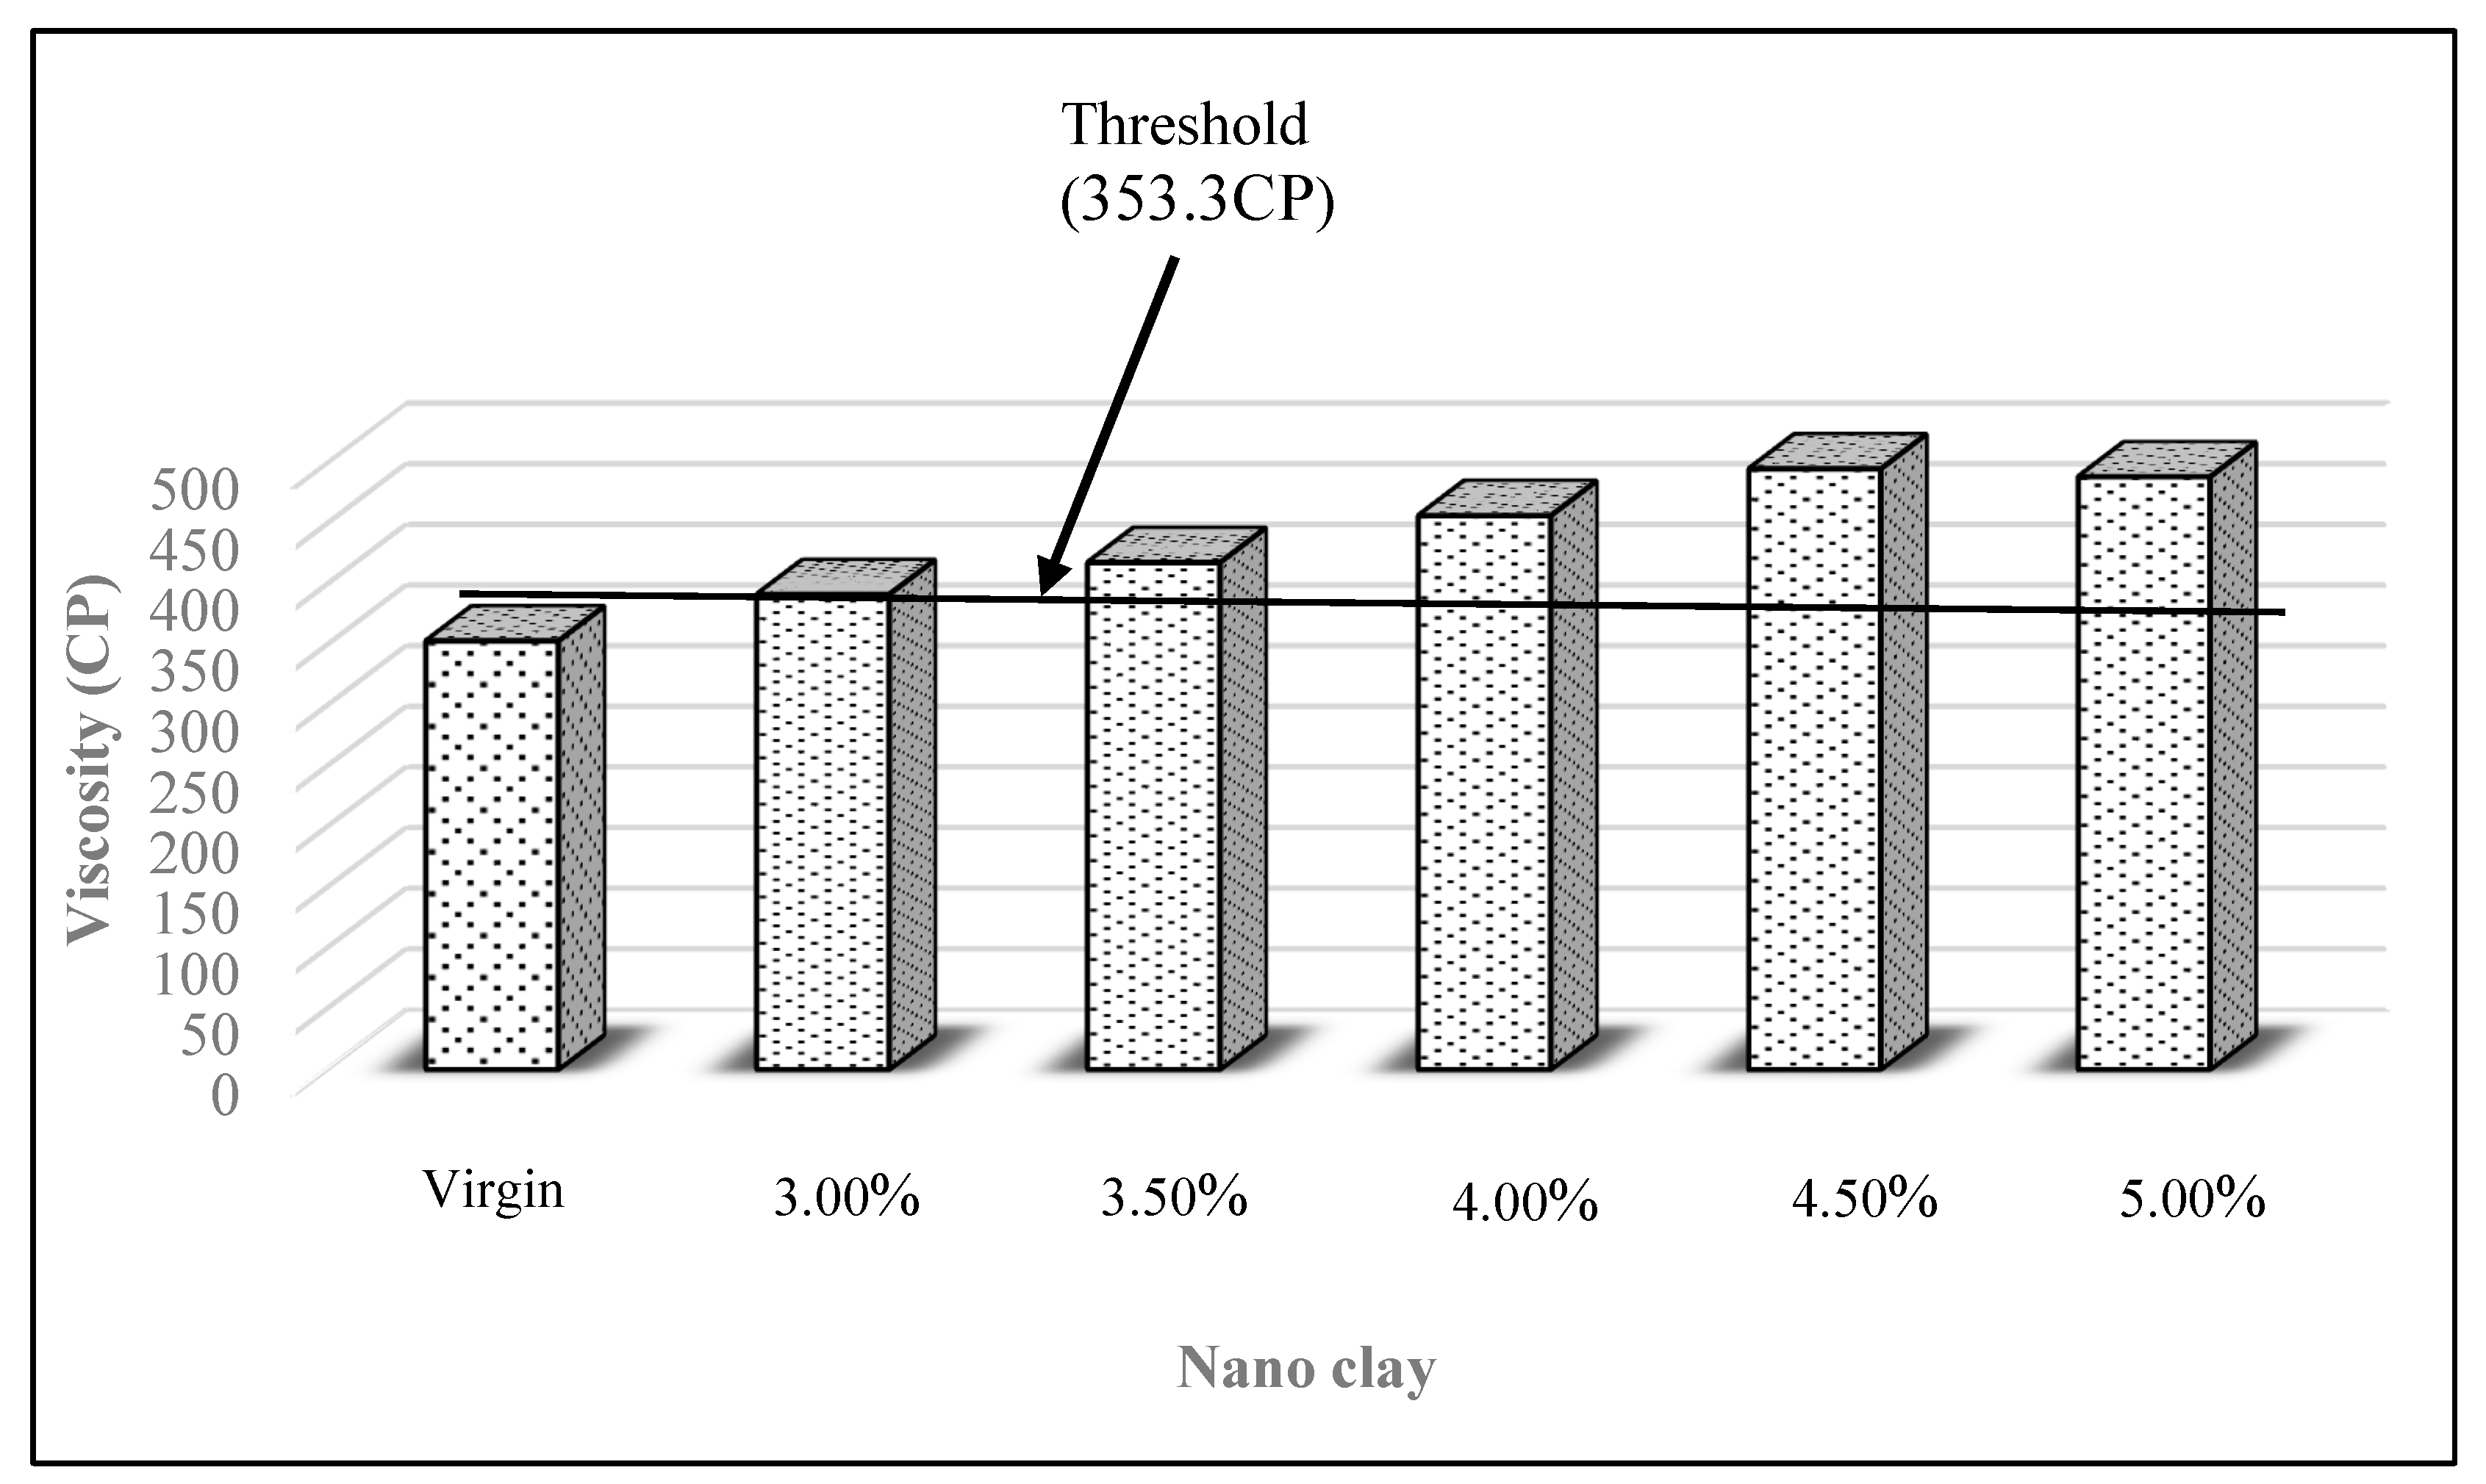
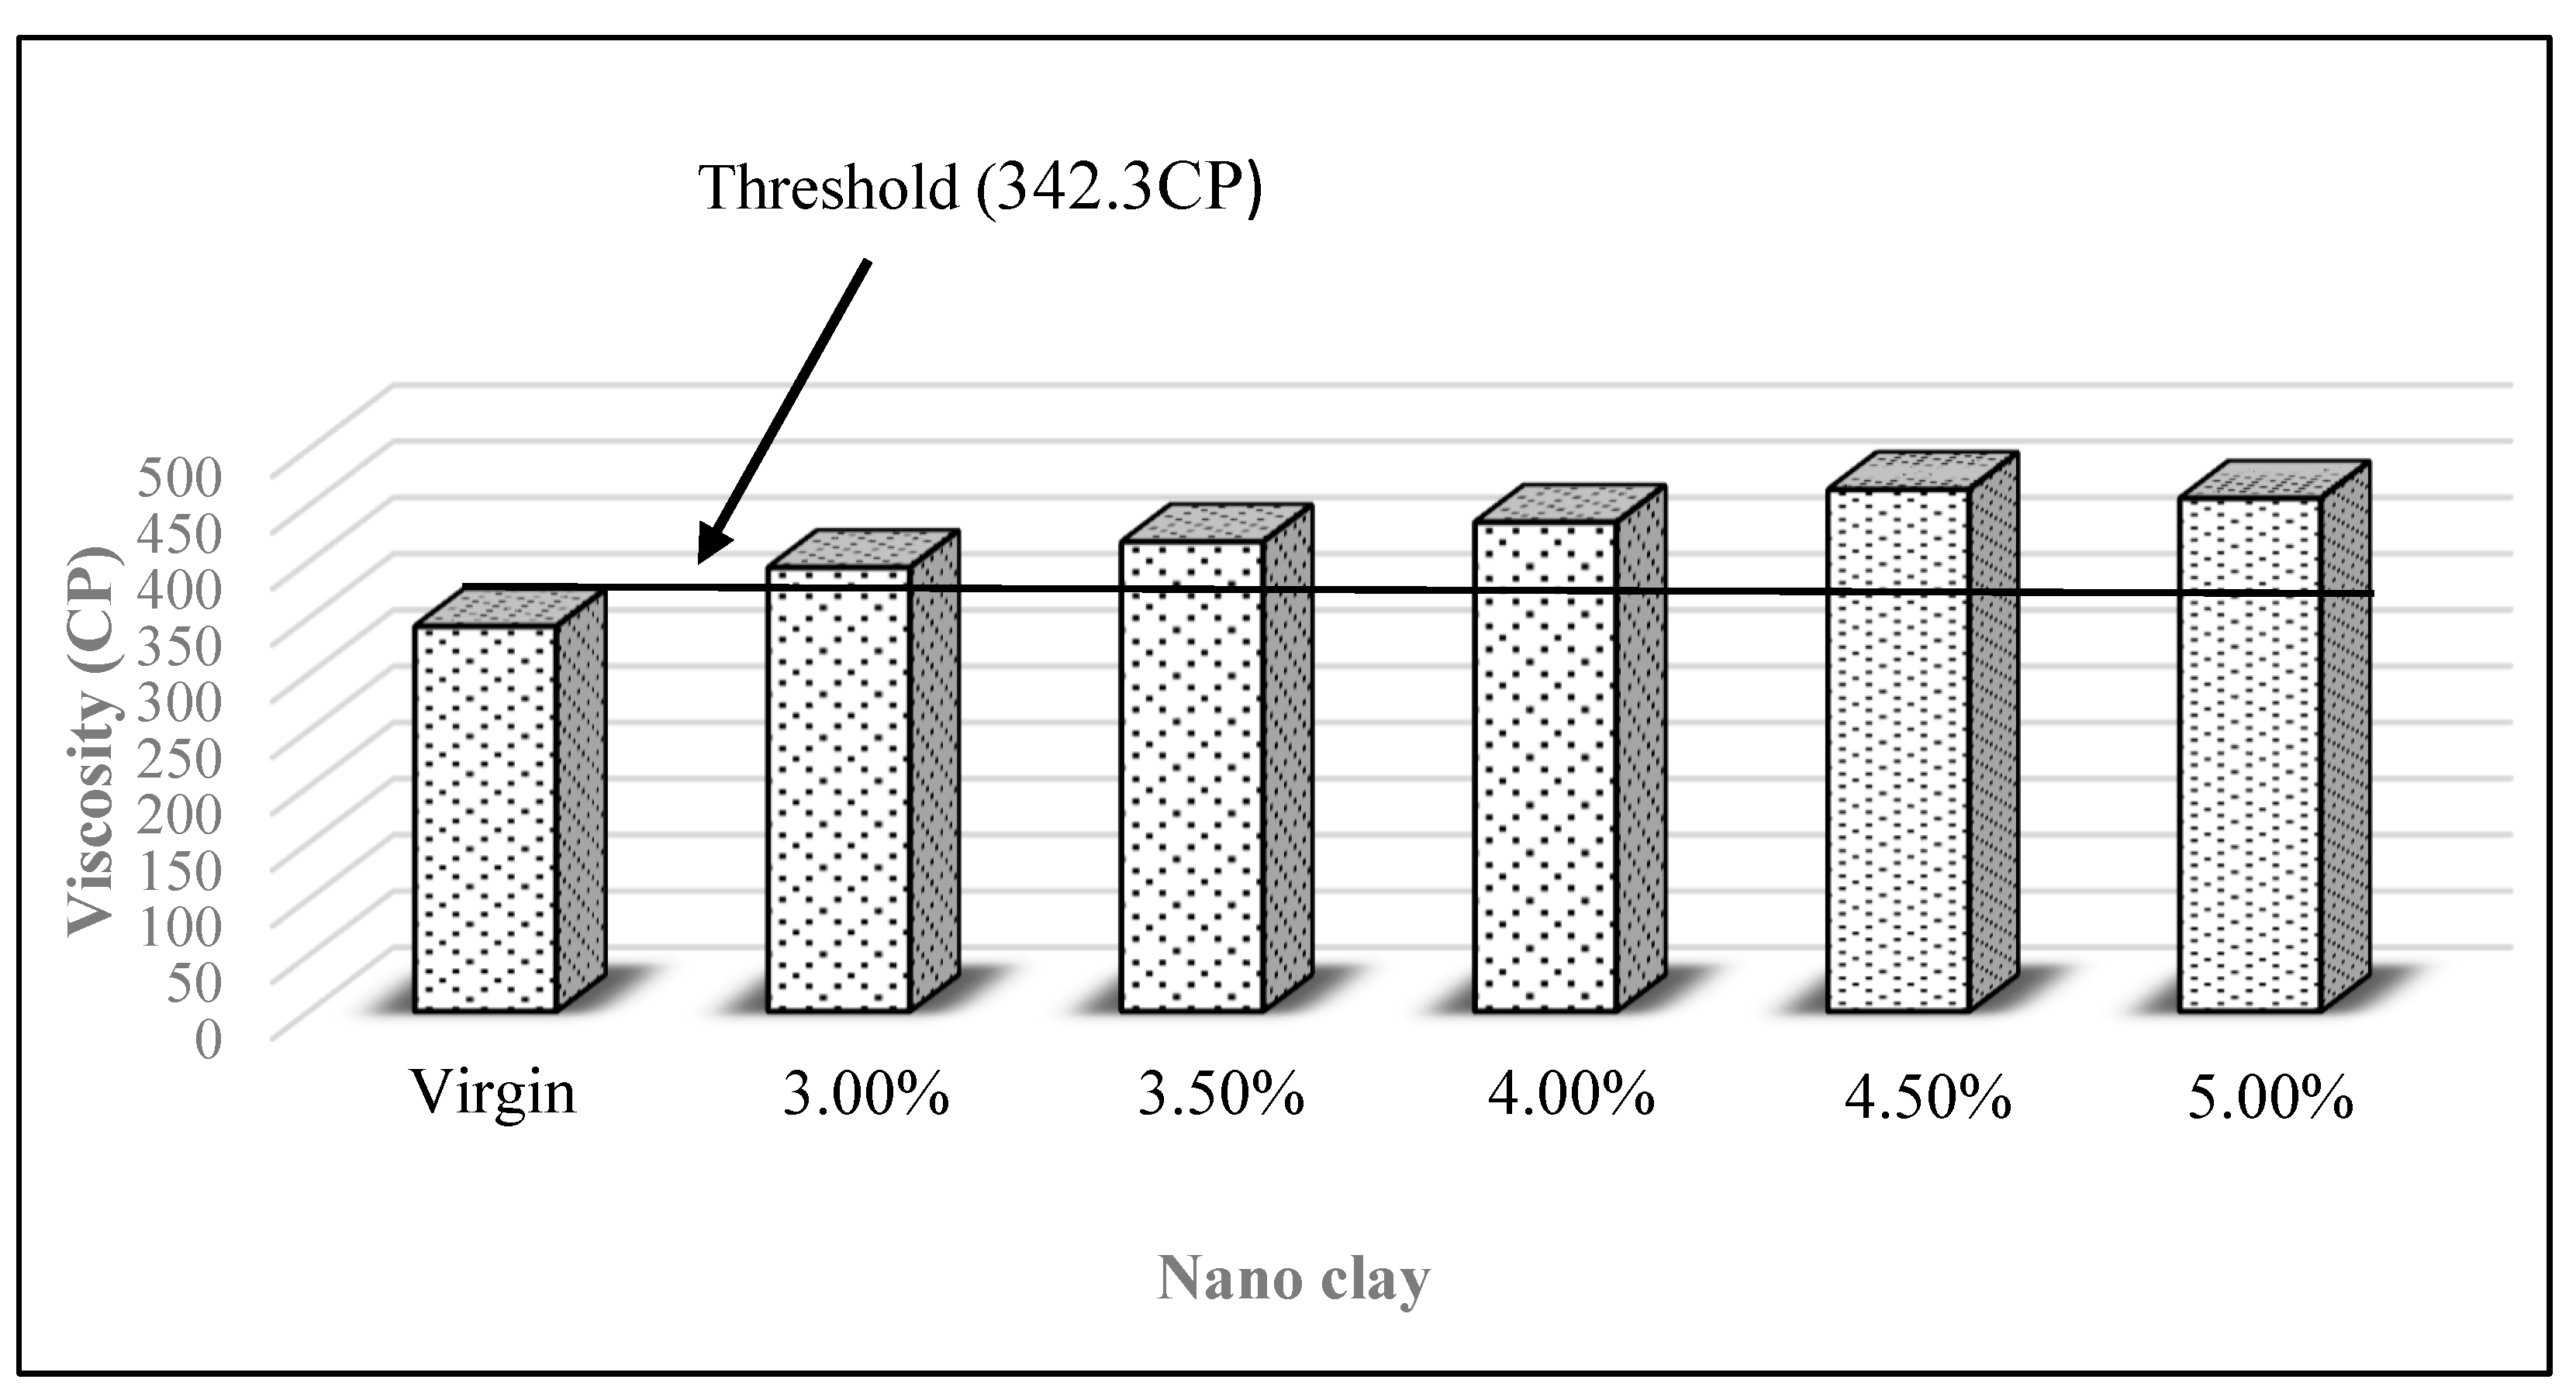
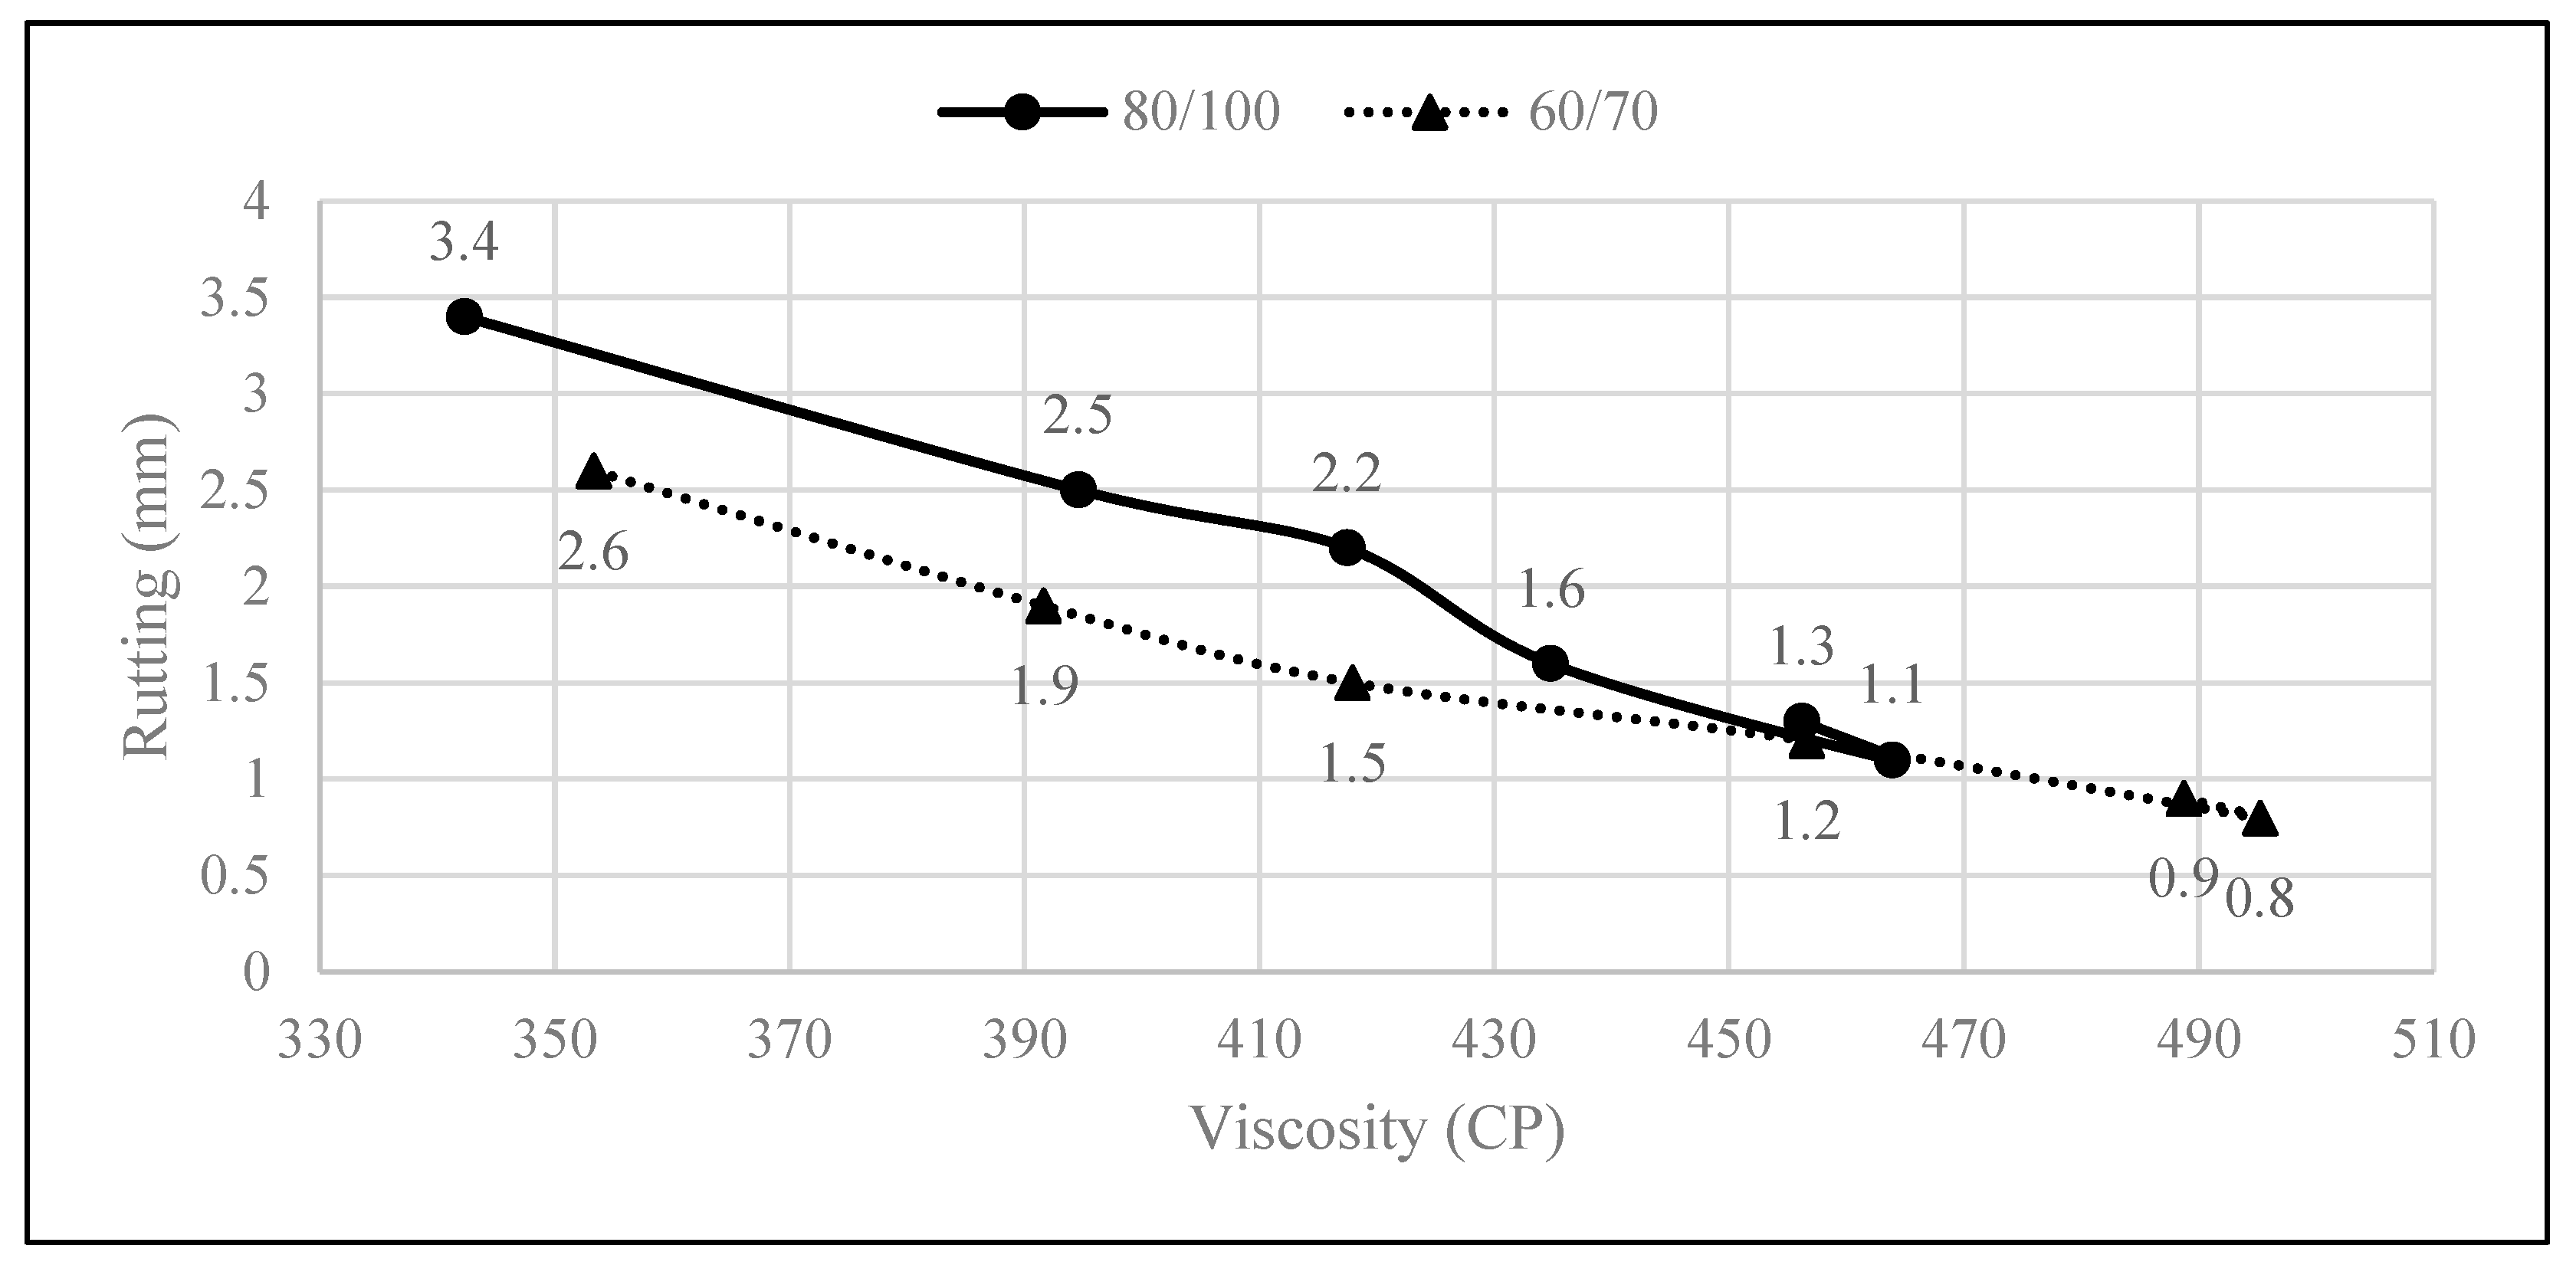
- For N.R.L 60/70 bitumen, the penetration value had increased from 61 to 69, which is an increase of 11.59%. Similarly, for N.R.L 80/100 bitumen, the penetration value had increased from 82 to 89, an increase of 7.0%. For N.R.L 60/70 bitumen, the Softening point decreased from 46°C to 41°C, which is a decrease of 5.0%. Similarly, for N.R.L 80/100 bitumen, the Softening point decreased from 49°C to 44°C, which is a decrease of 10.20%. The viscosity for N.R.L 60/70 bitumen had increased from 353.3 CP to 495.2 CP. It is an increase of 28.65%. Similarly, the viscosity of N.R.L 80/100 bitumen increased from 342.3CP to 463.9CP. It is an increase of 26.21%.
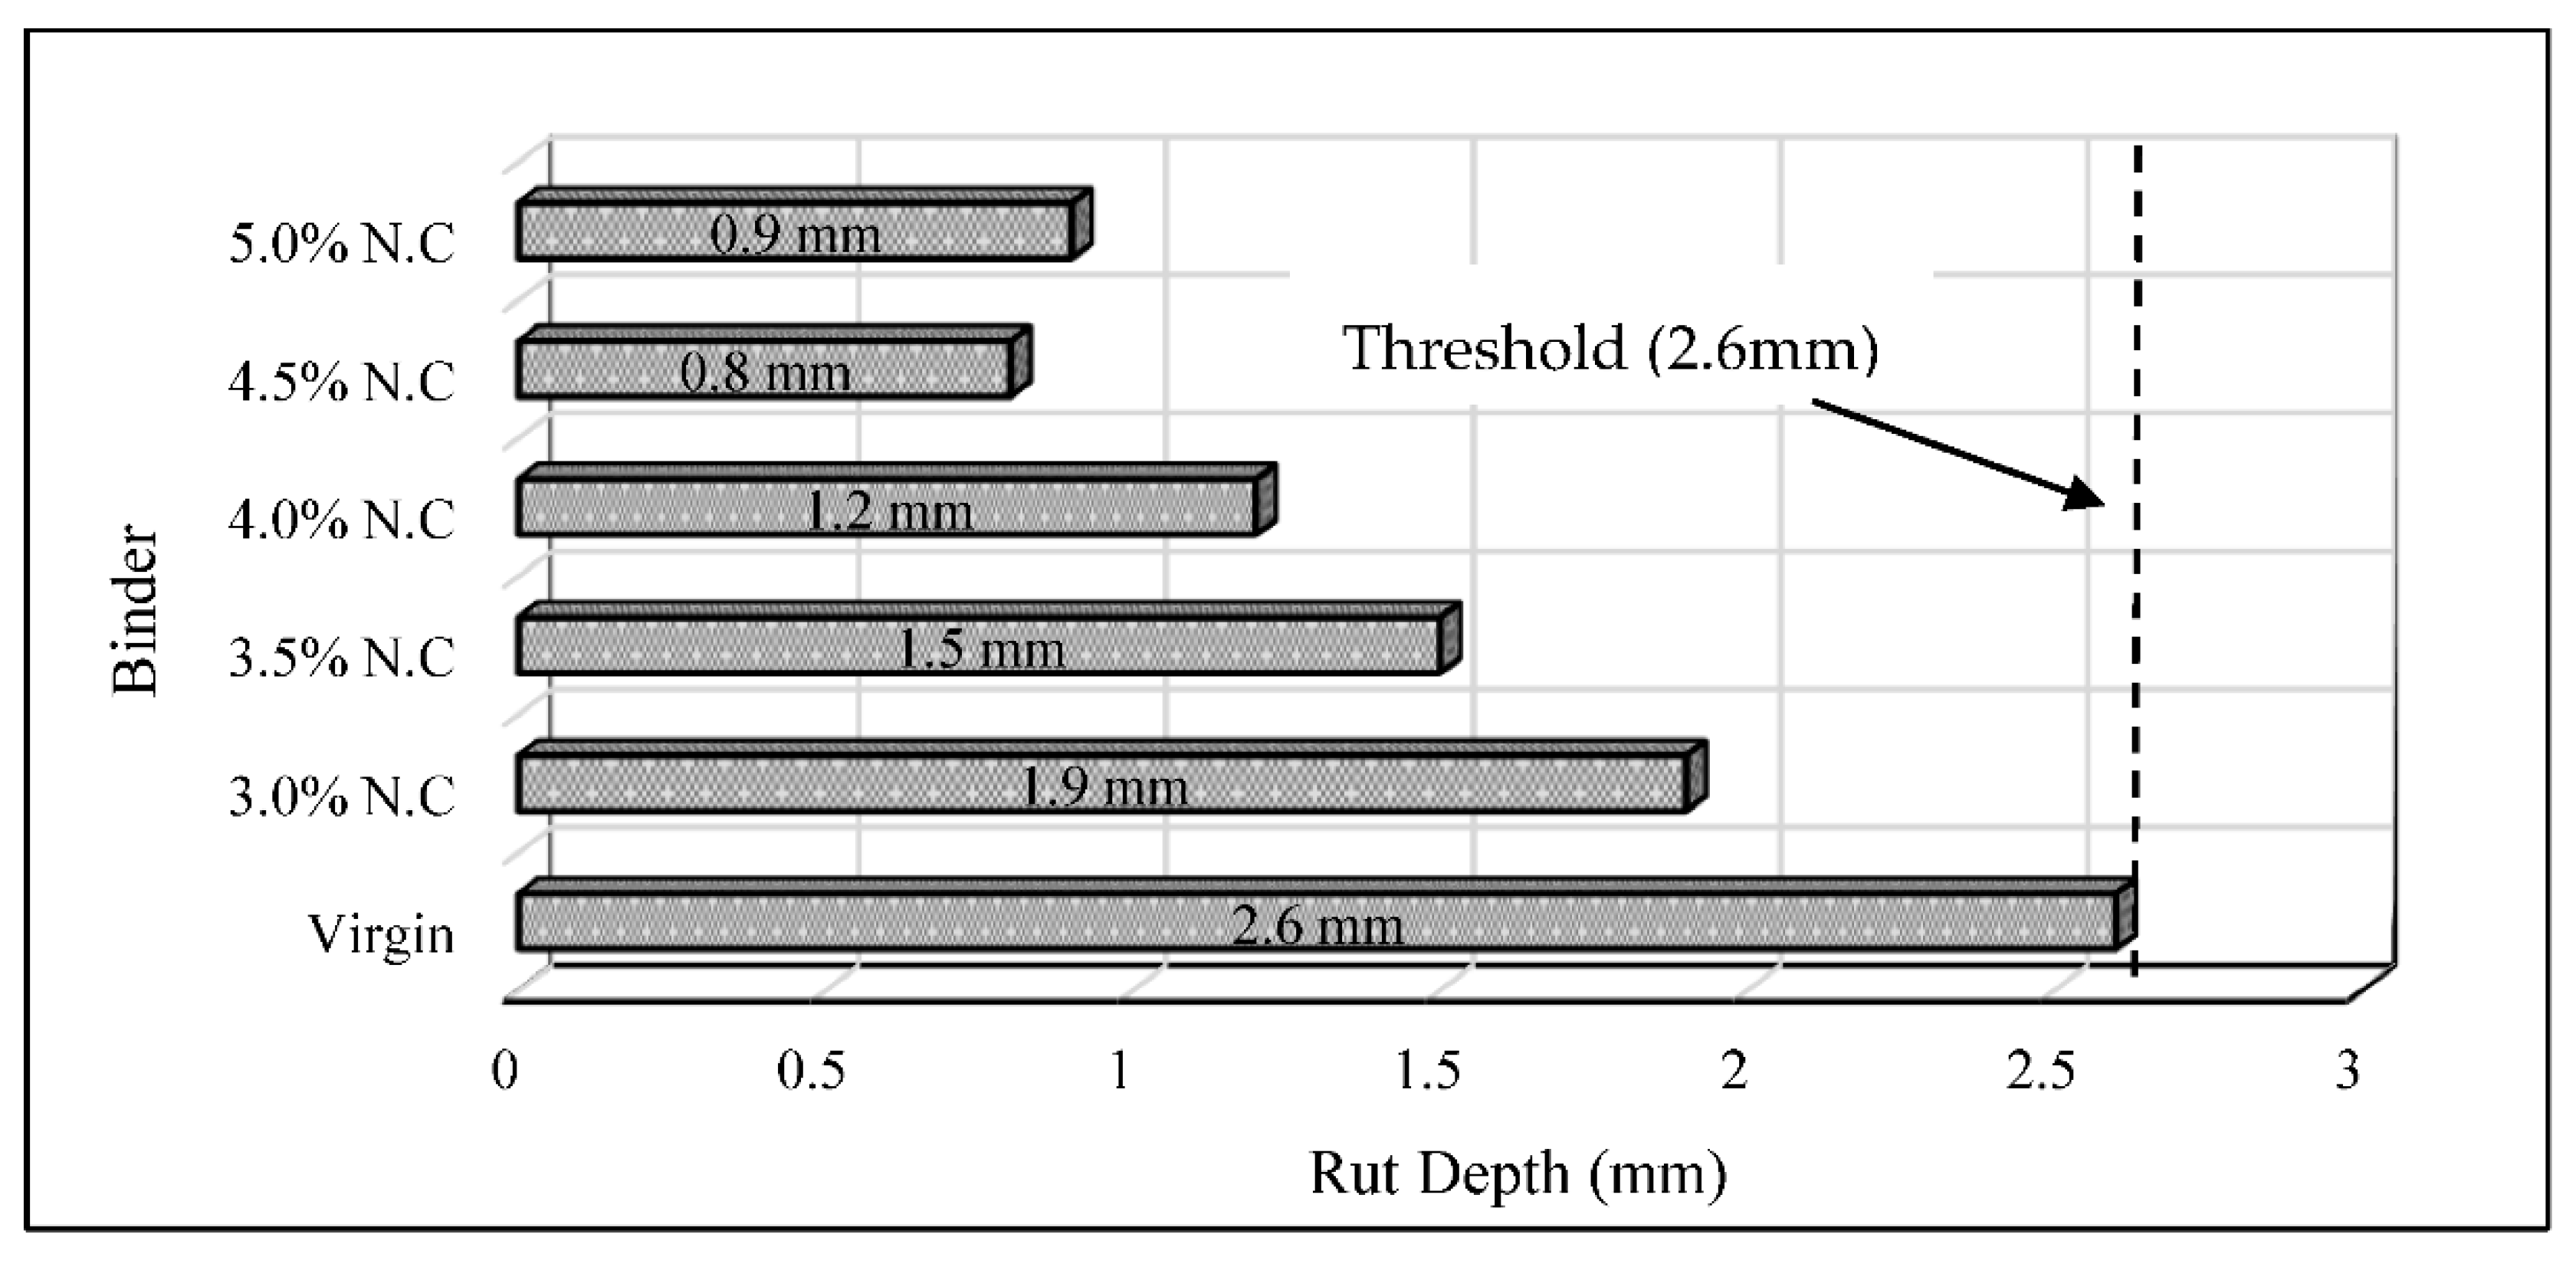
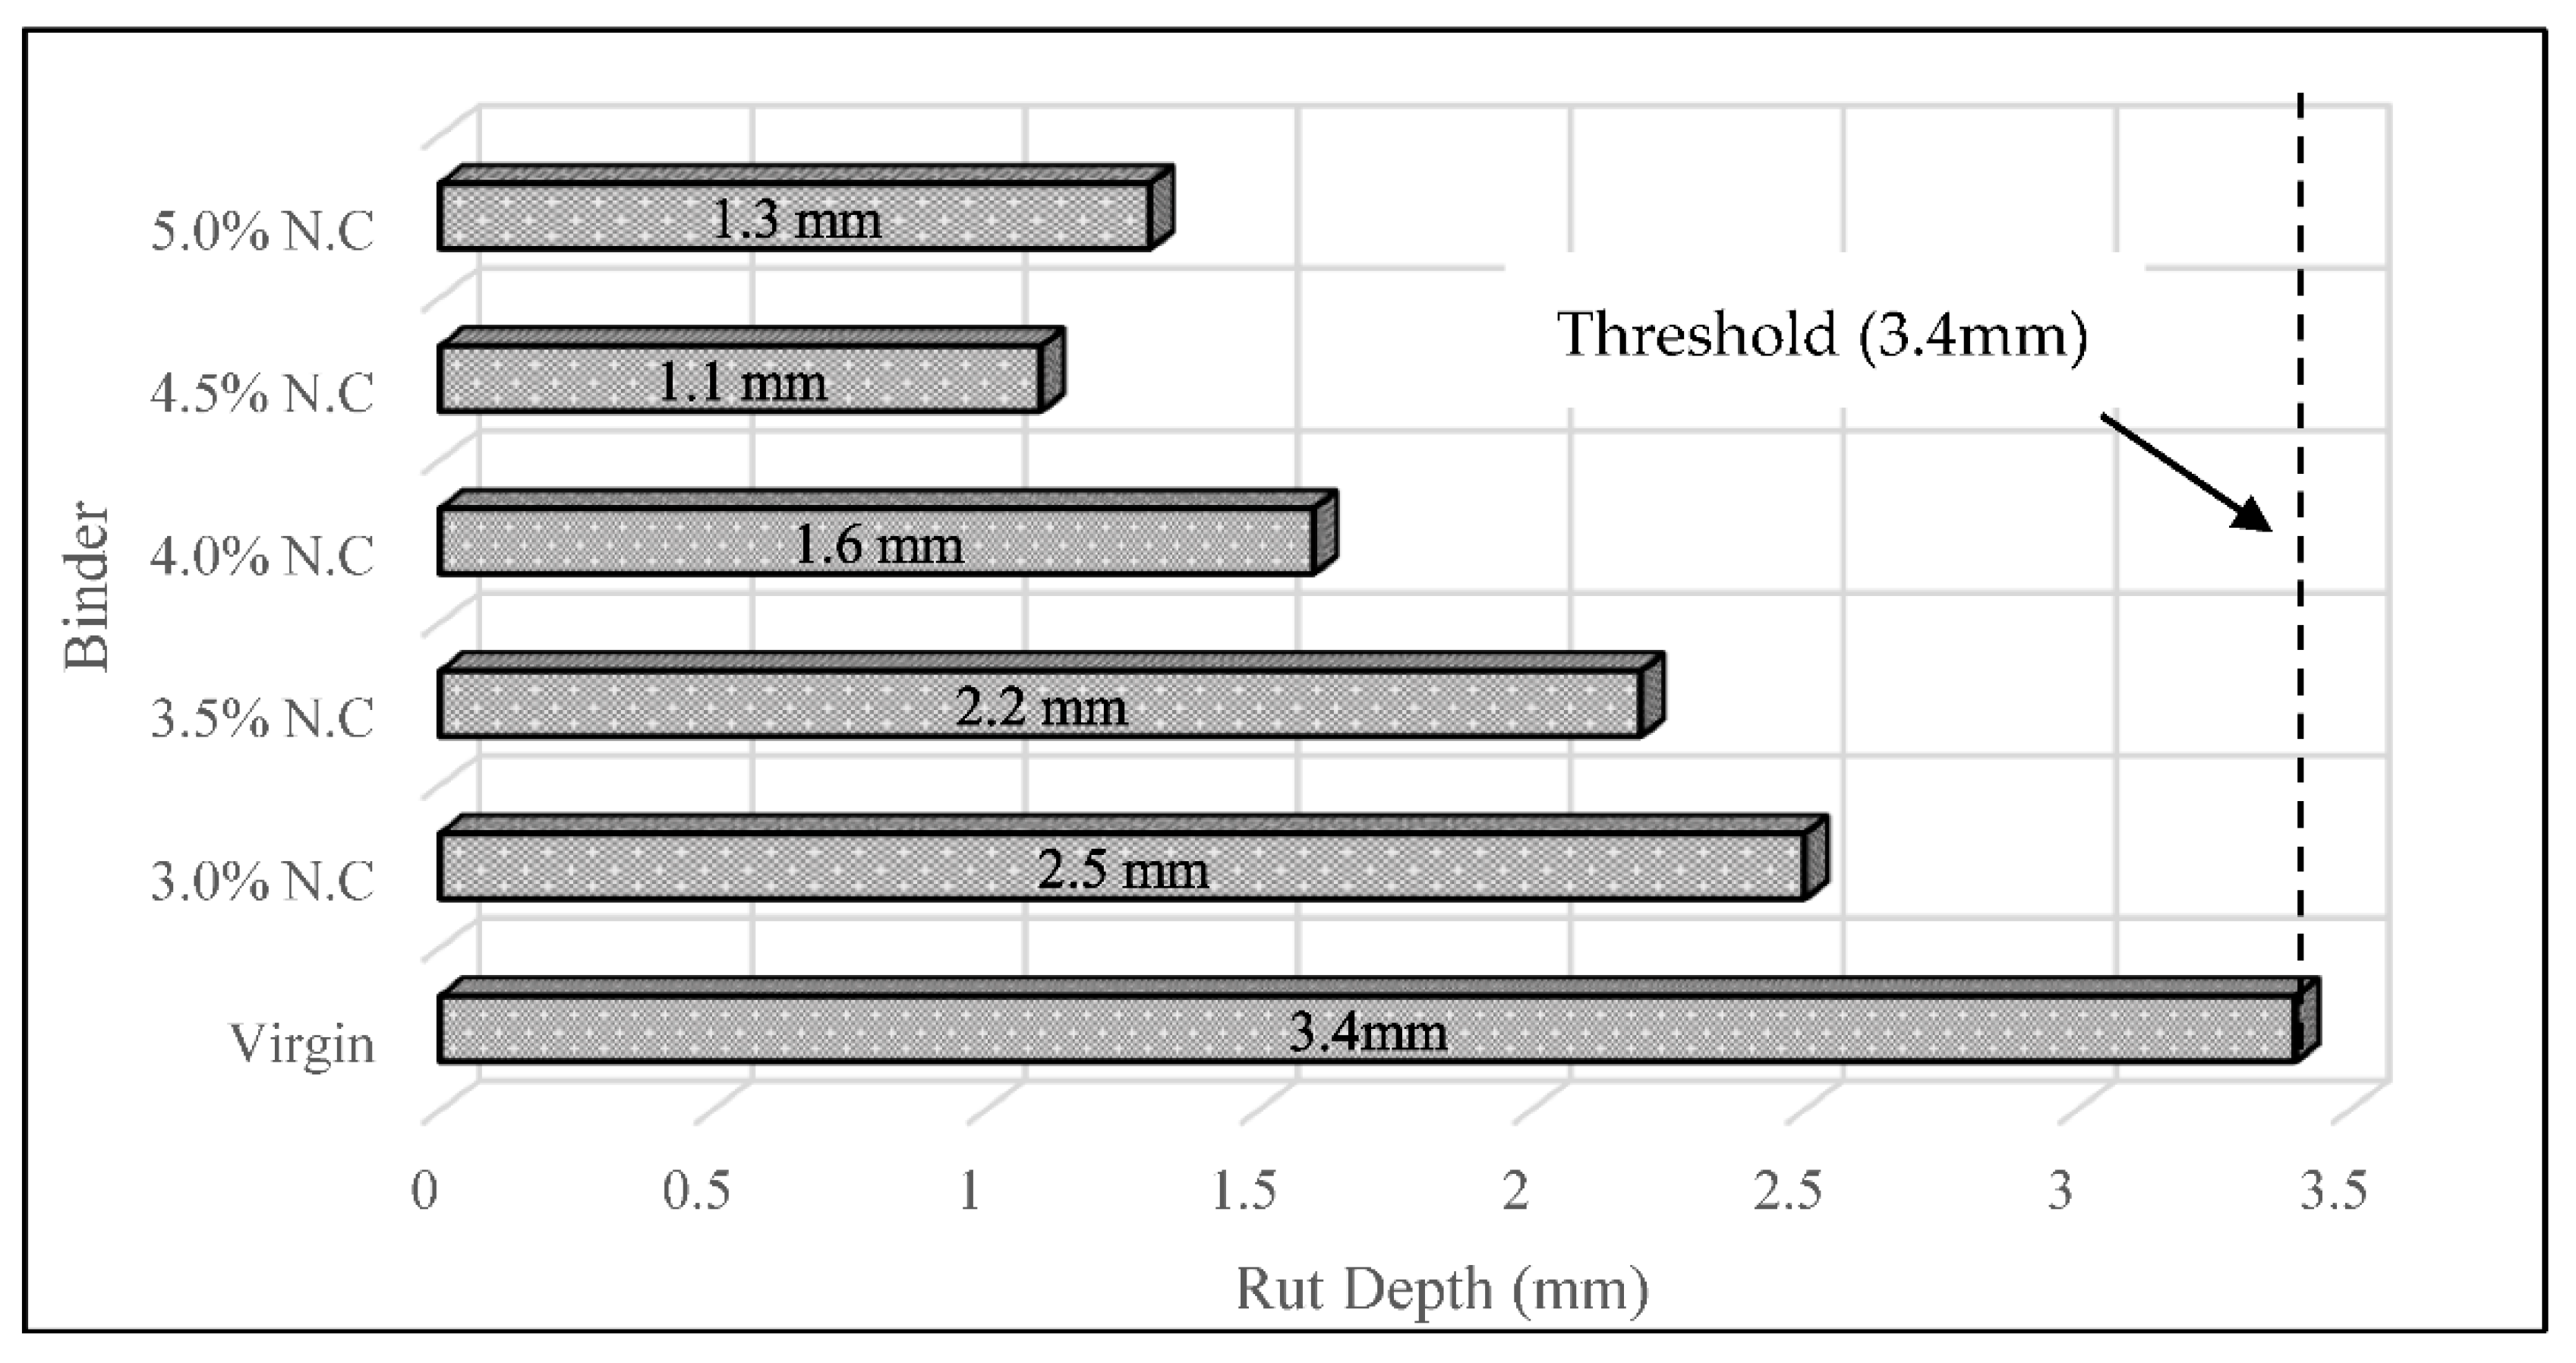
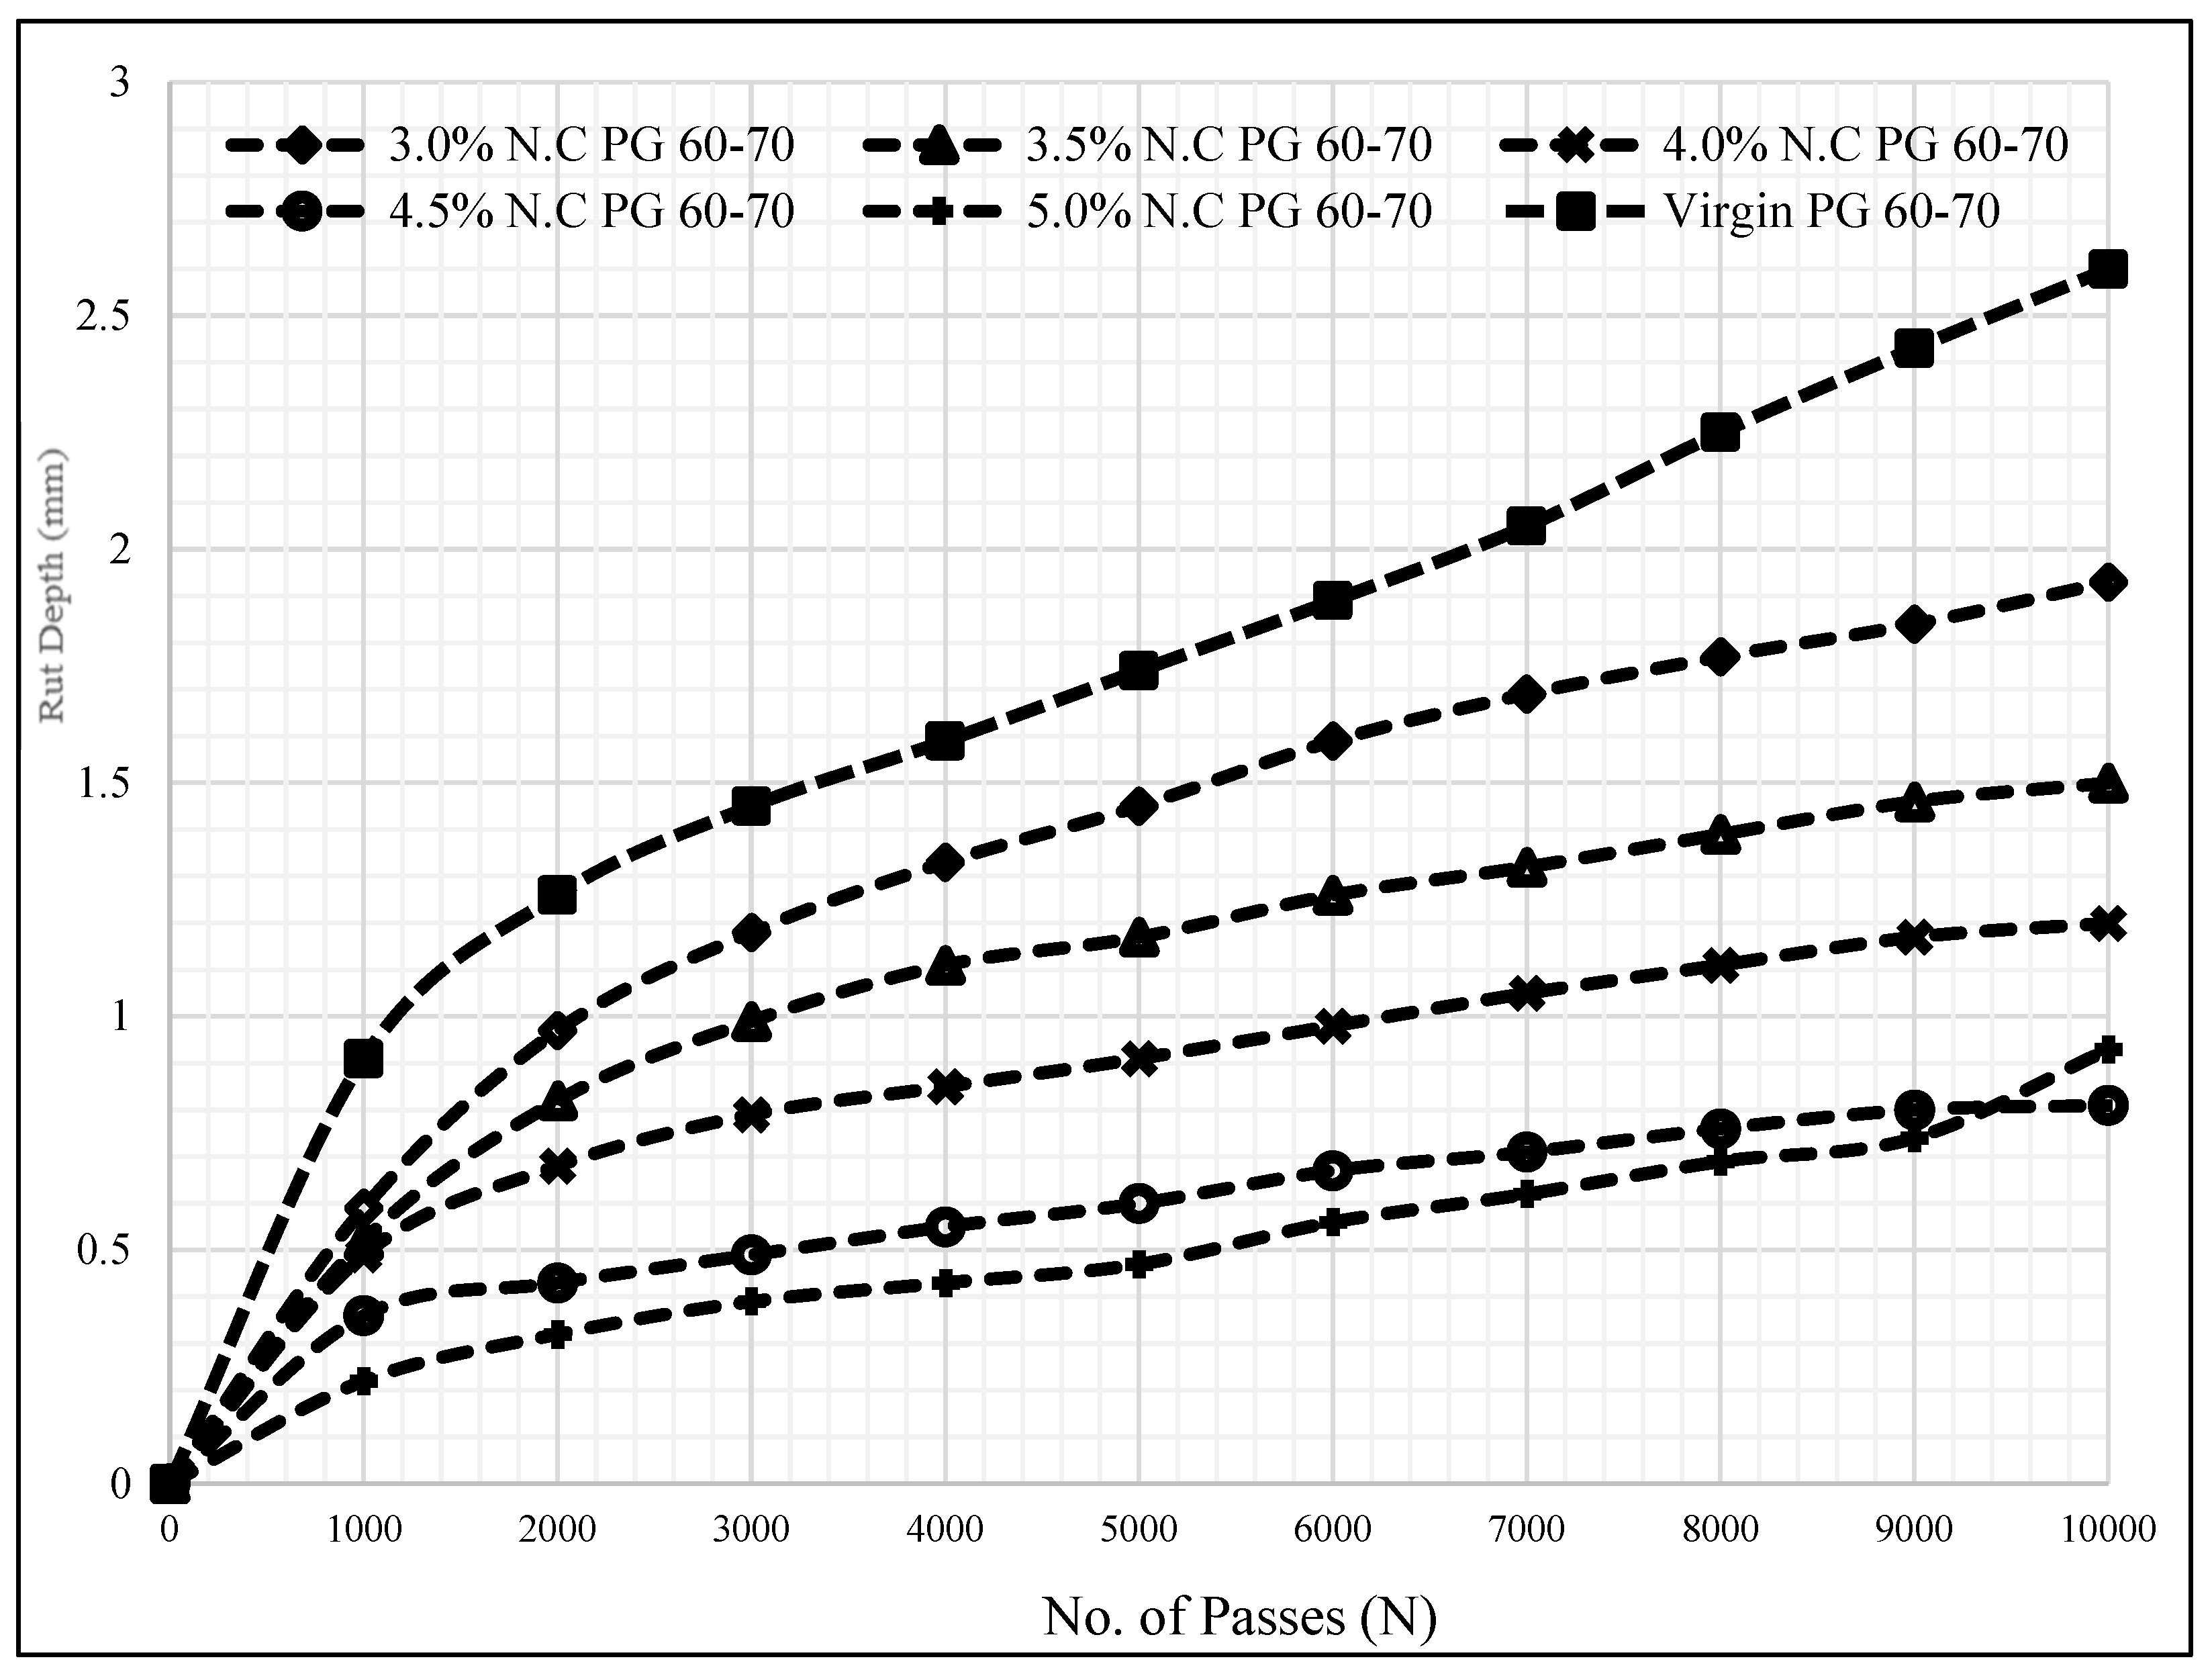
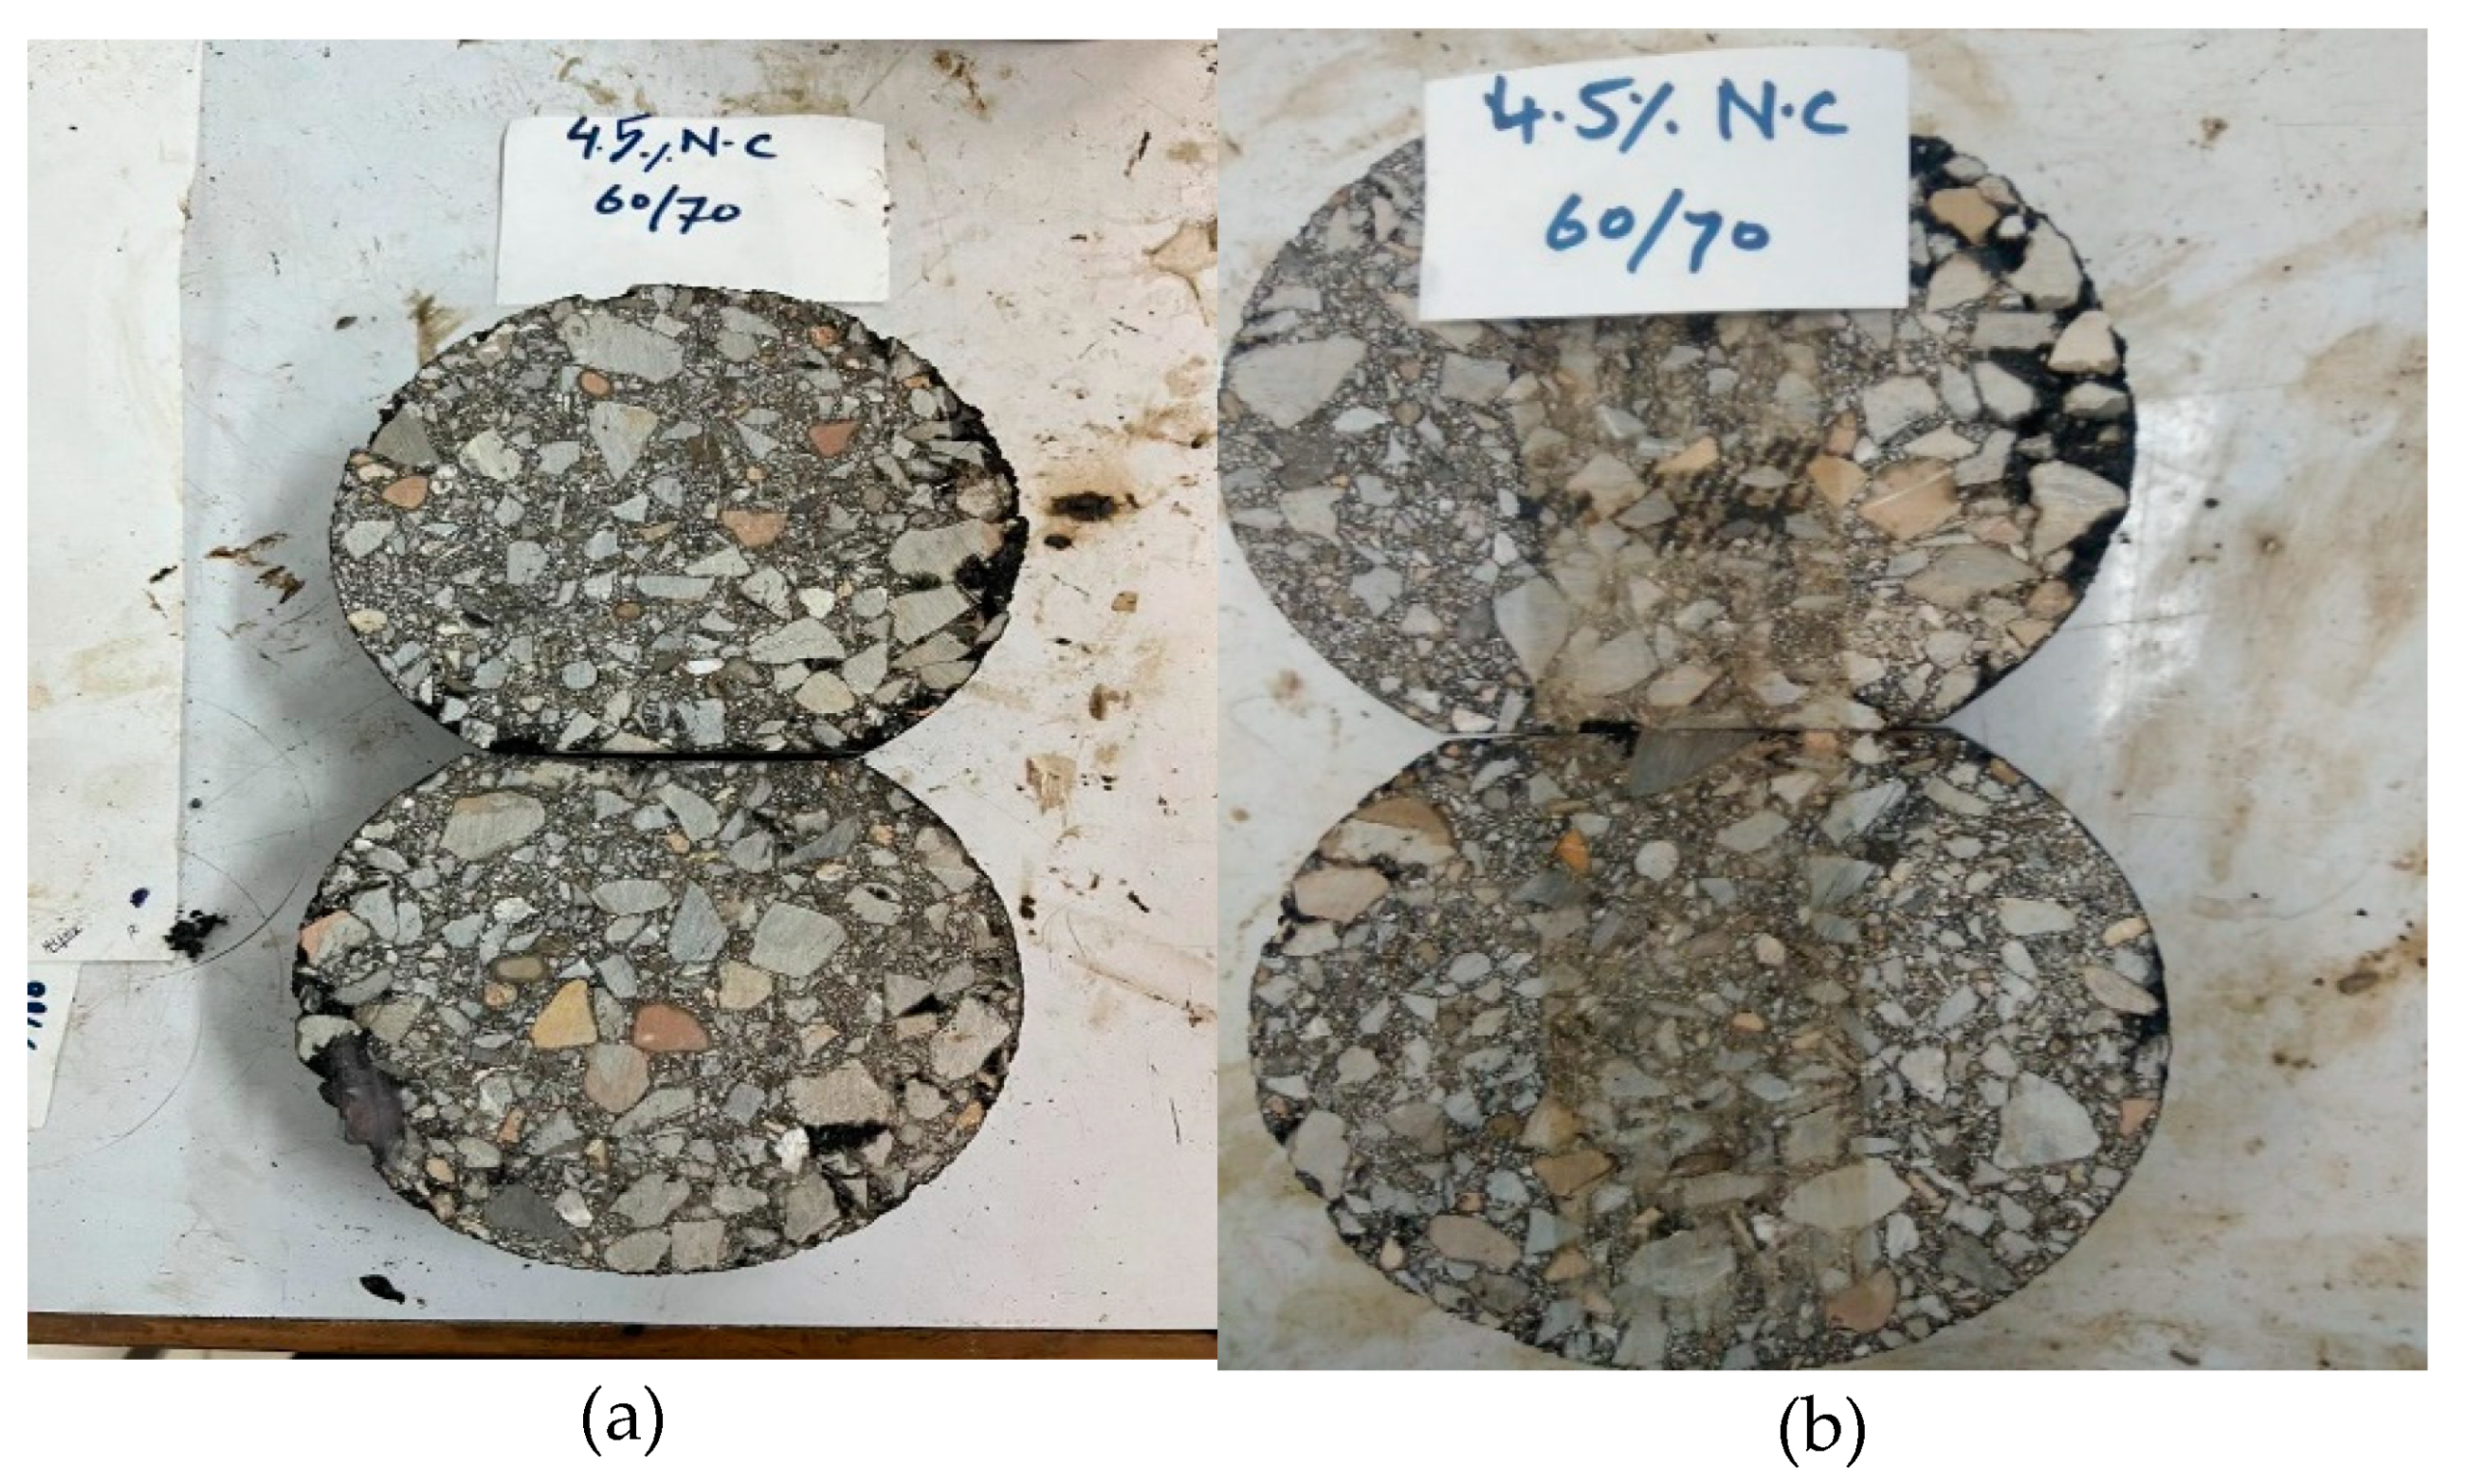
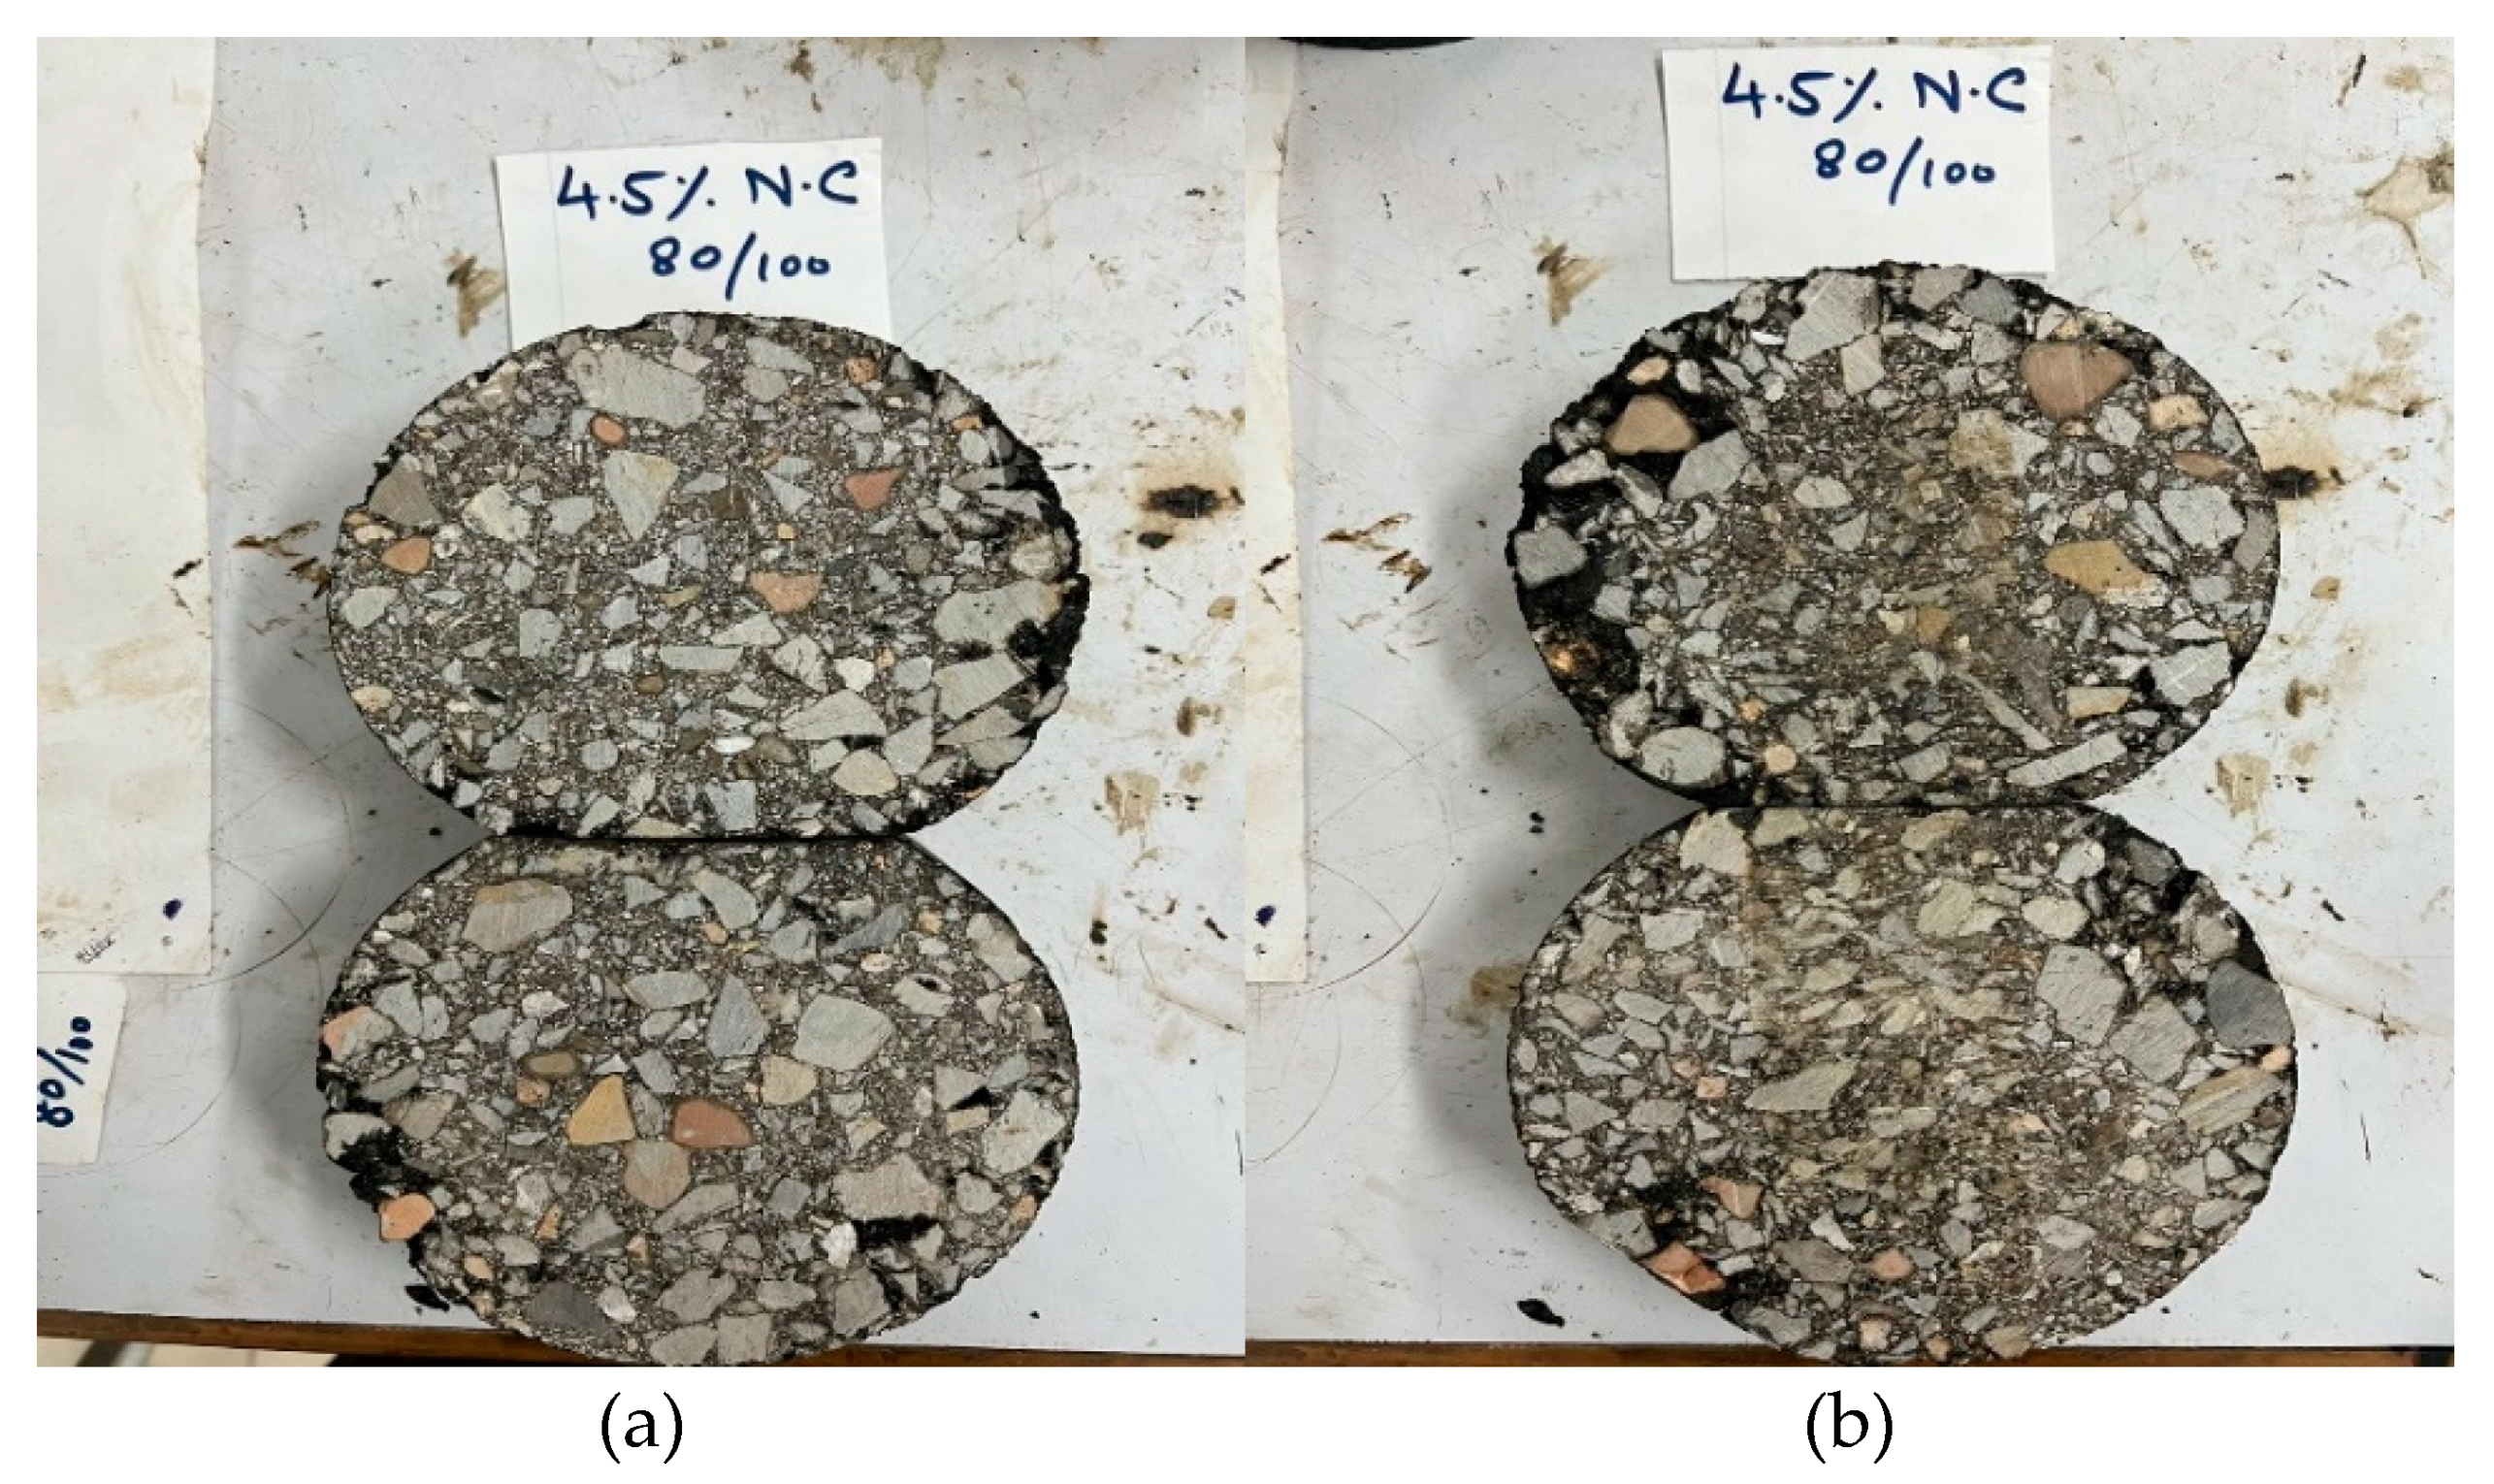
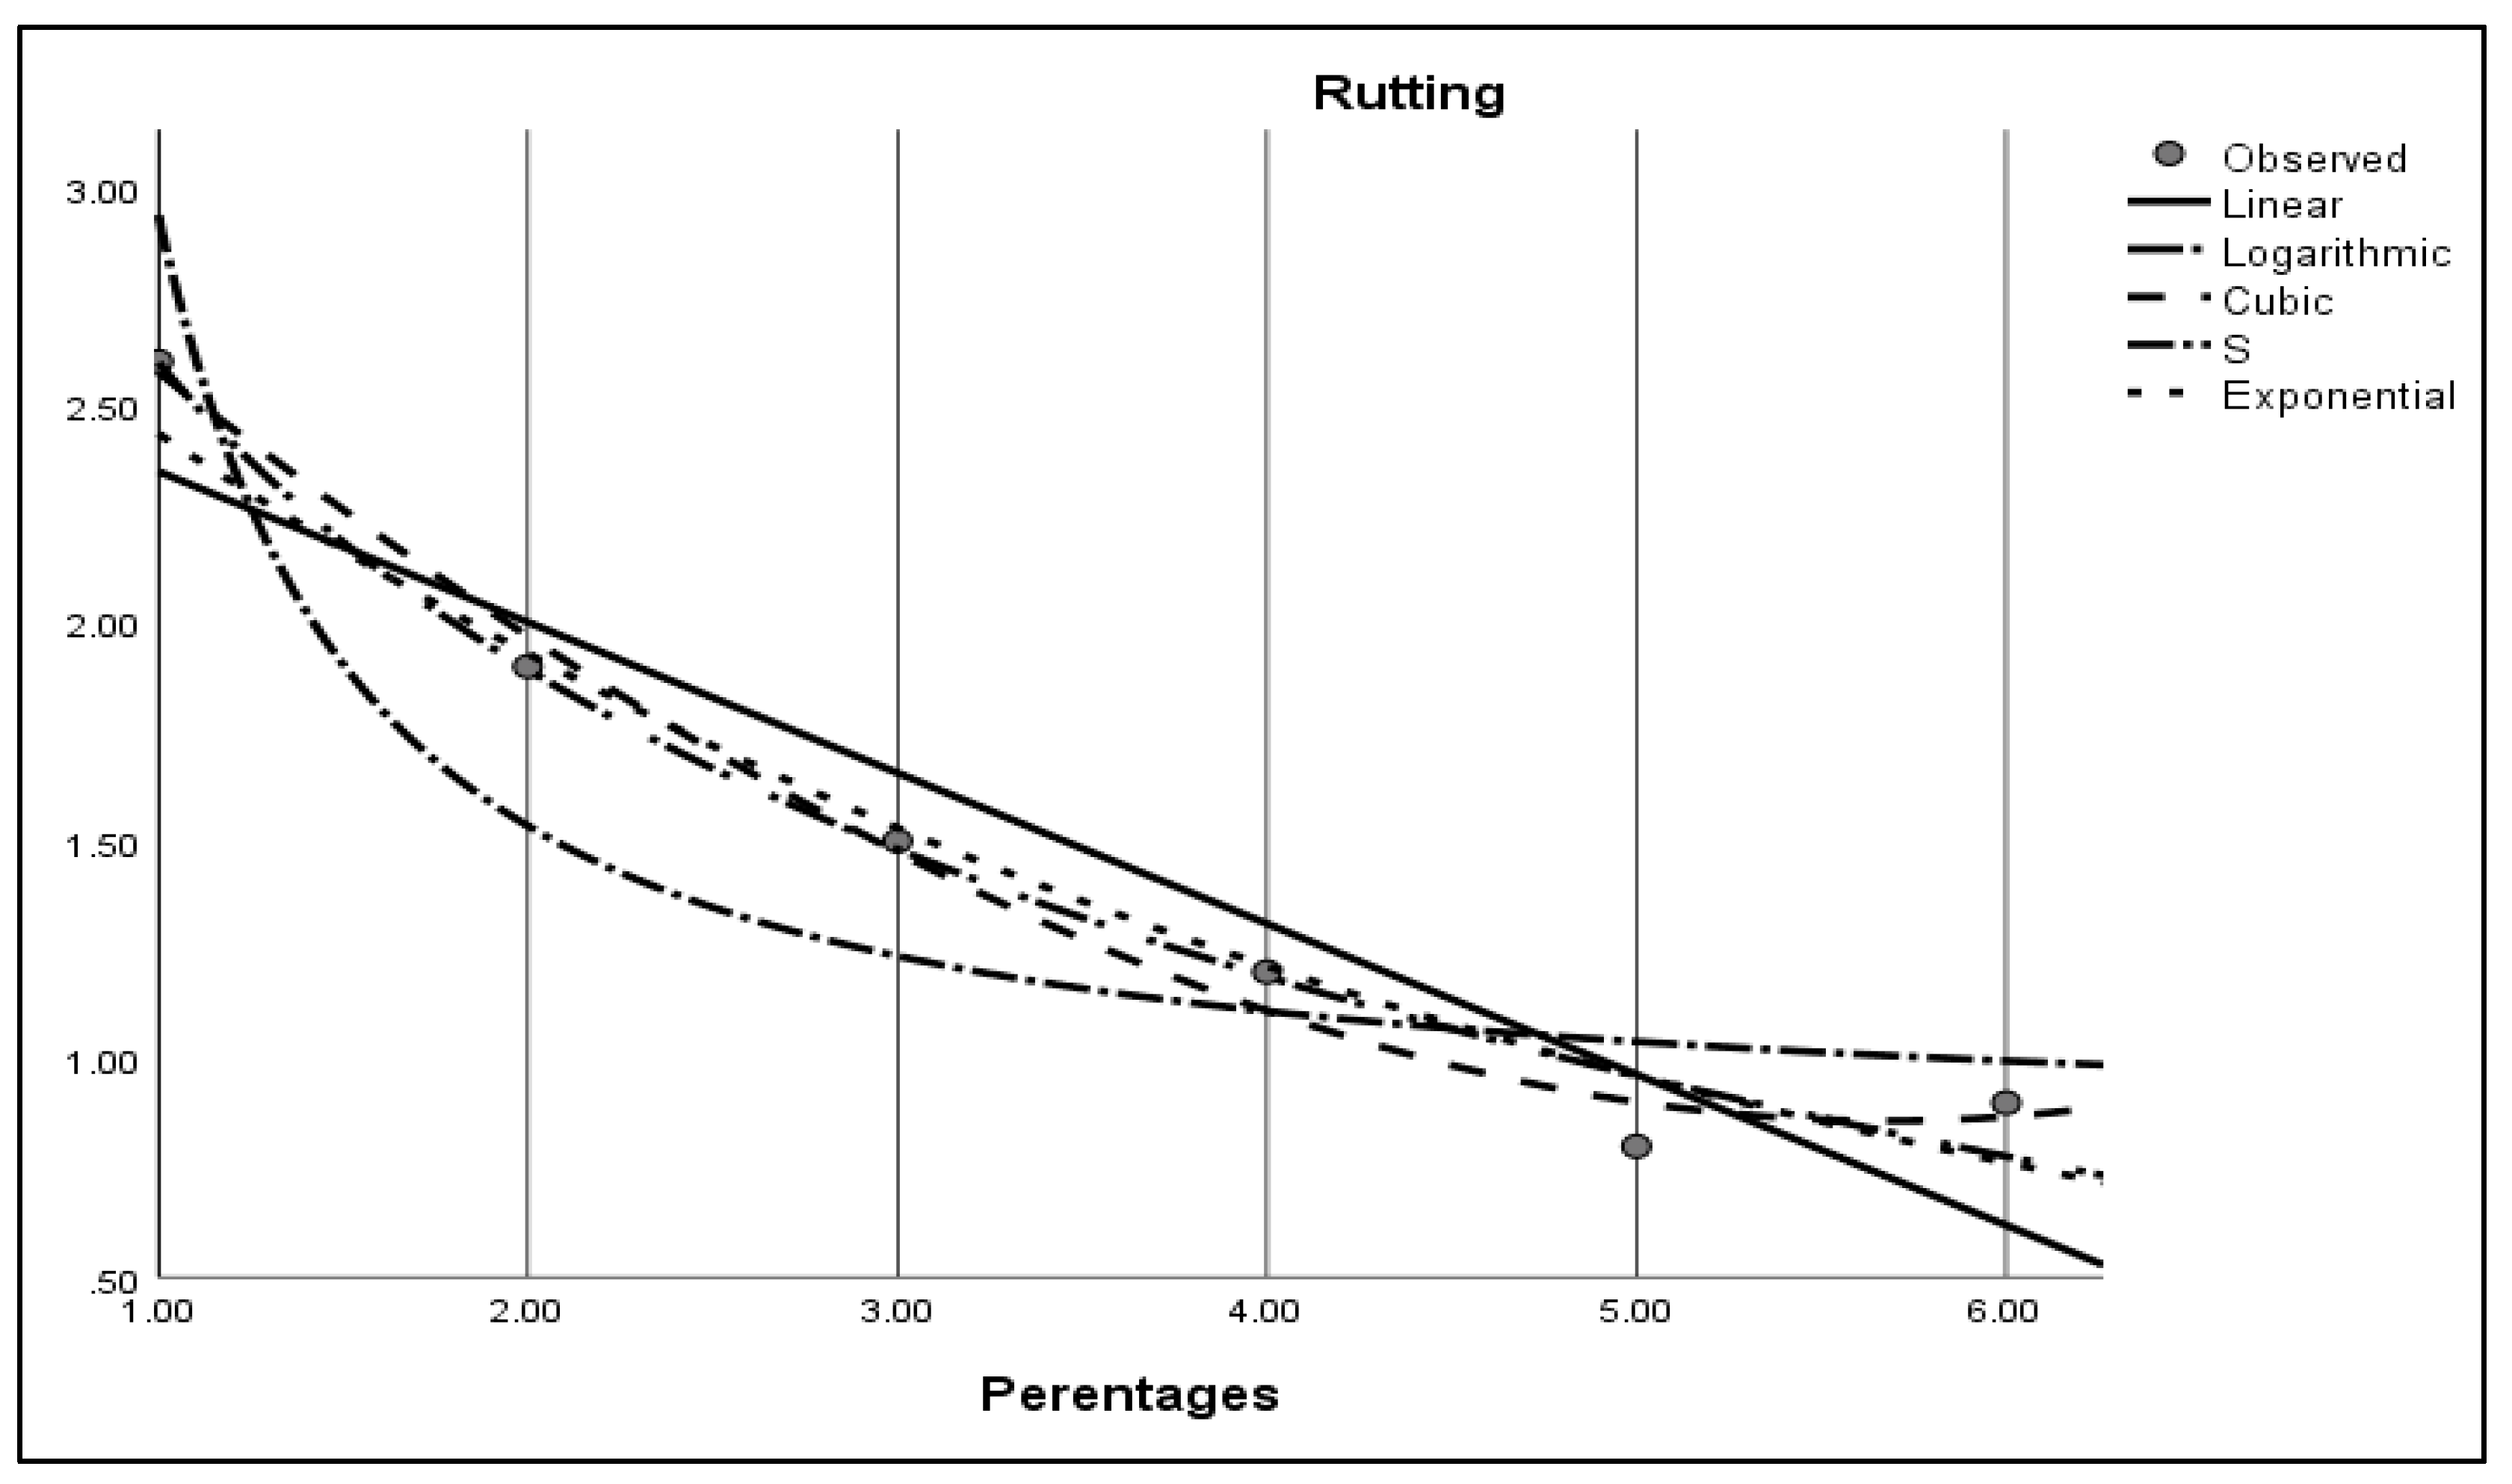
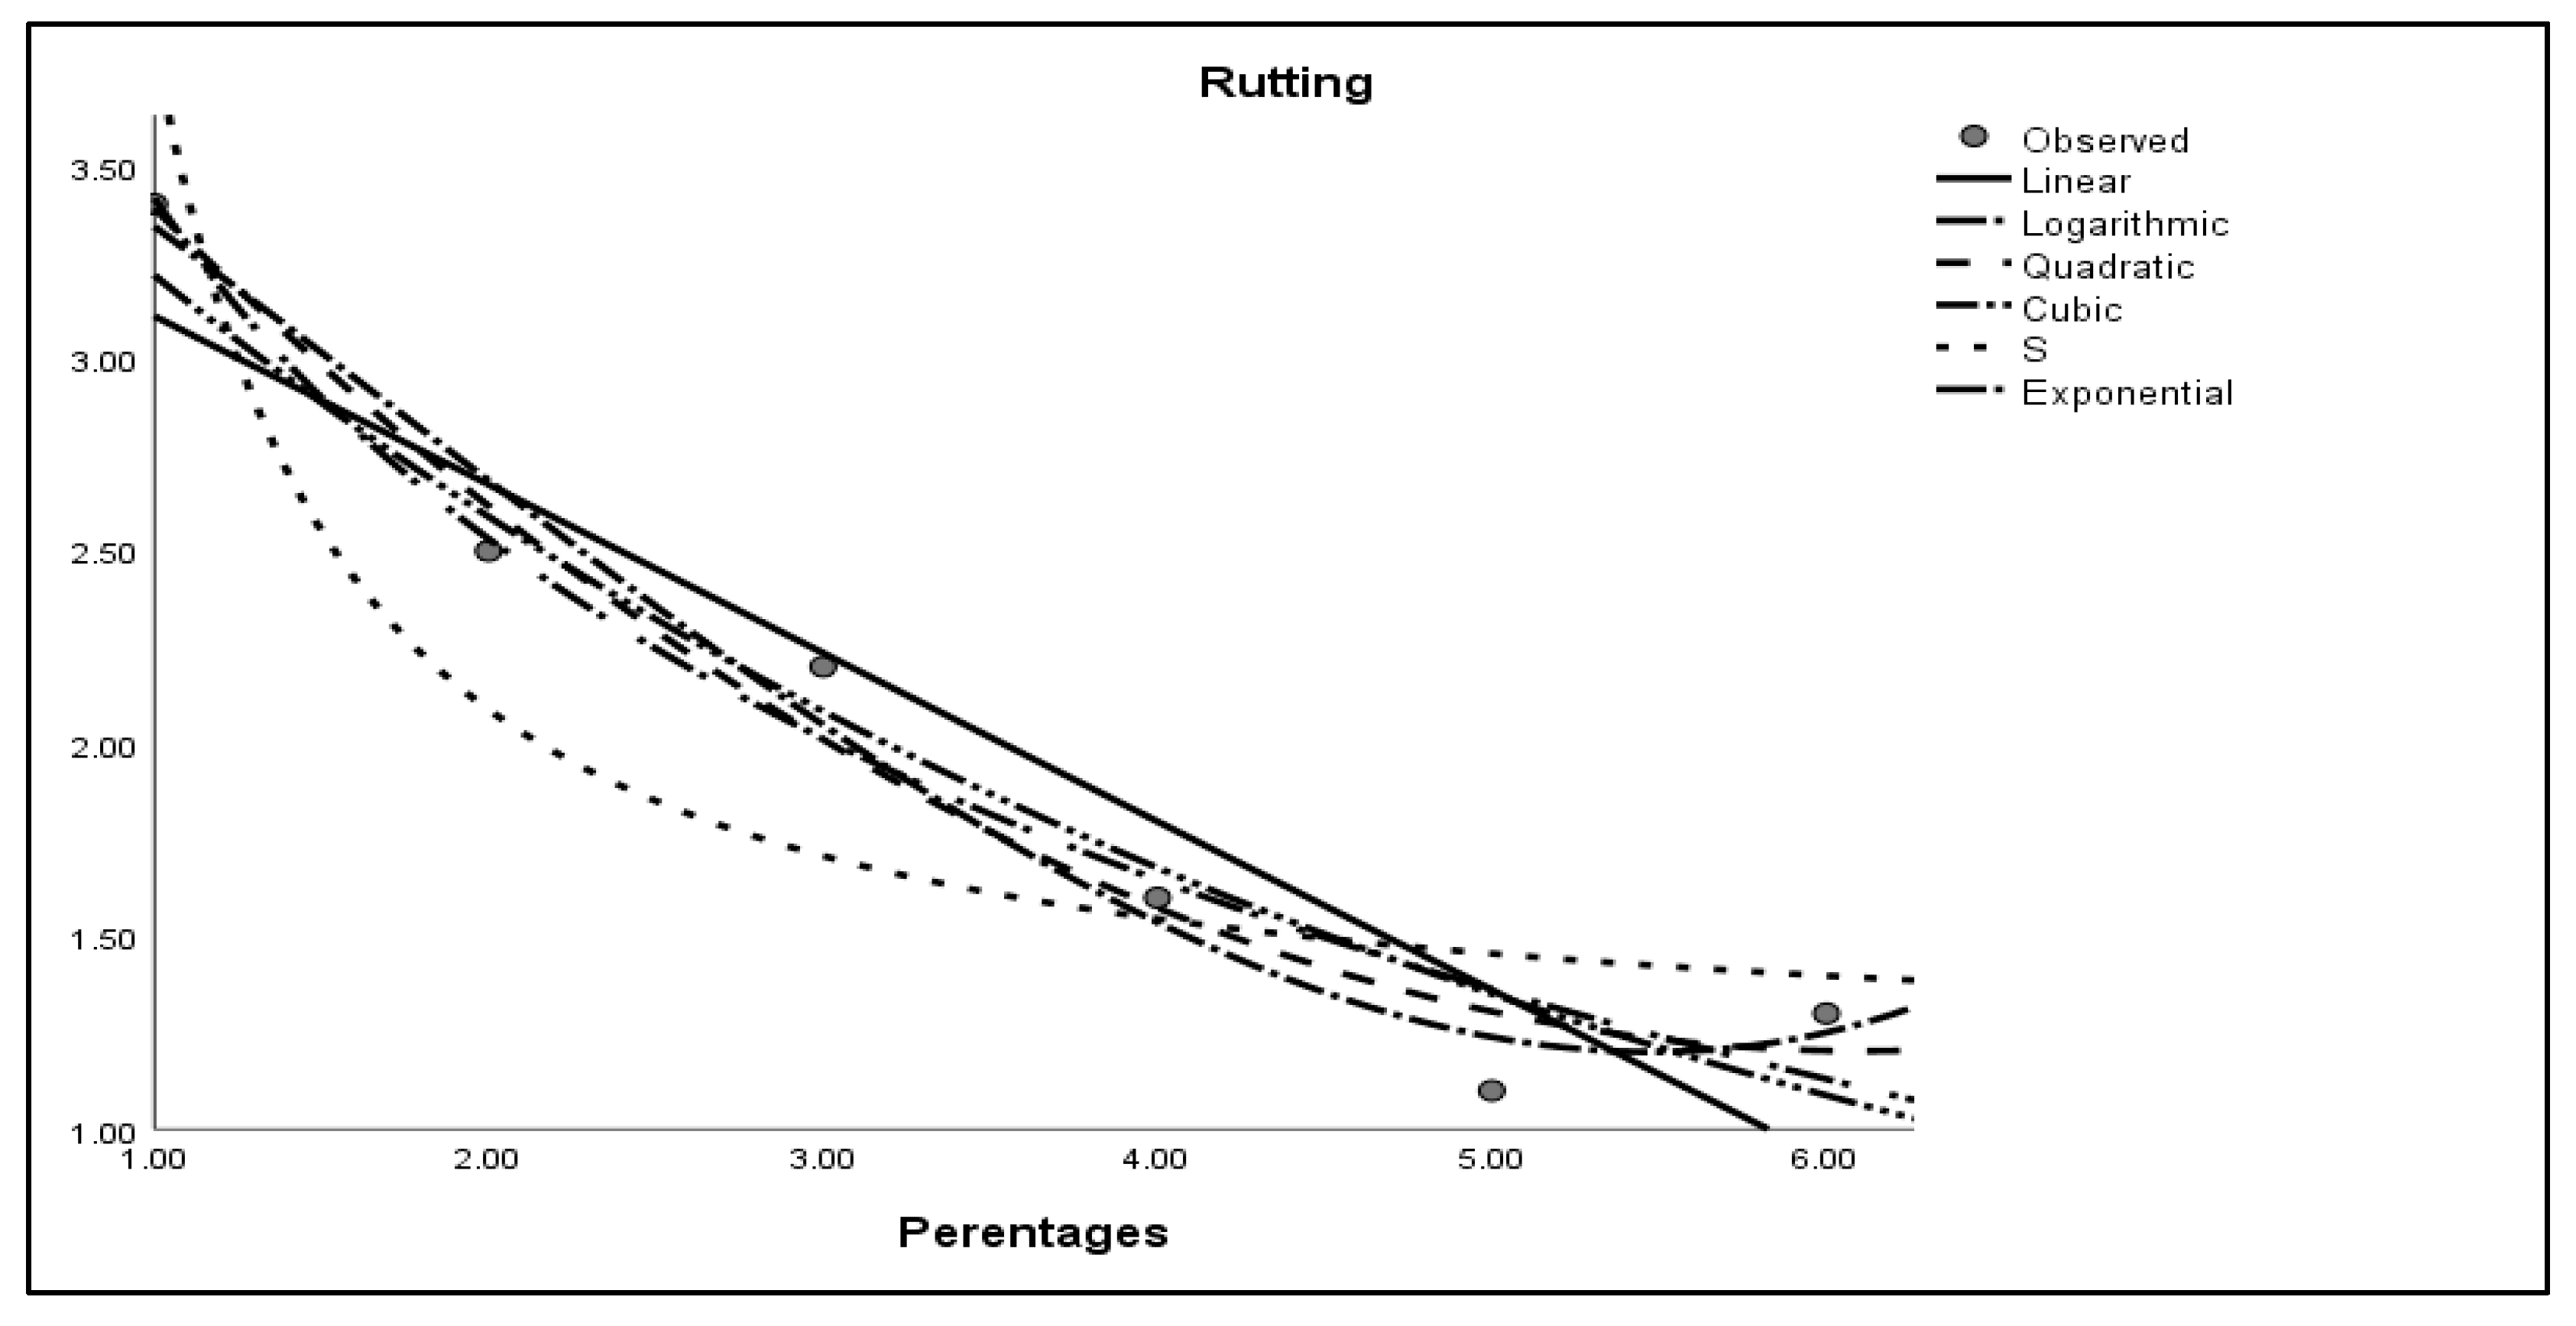
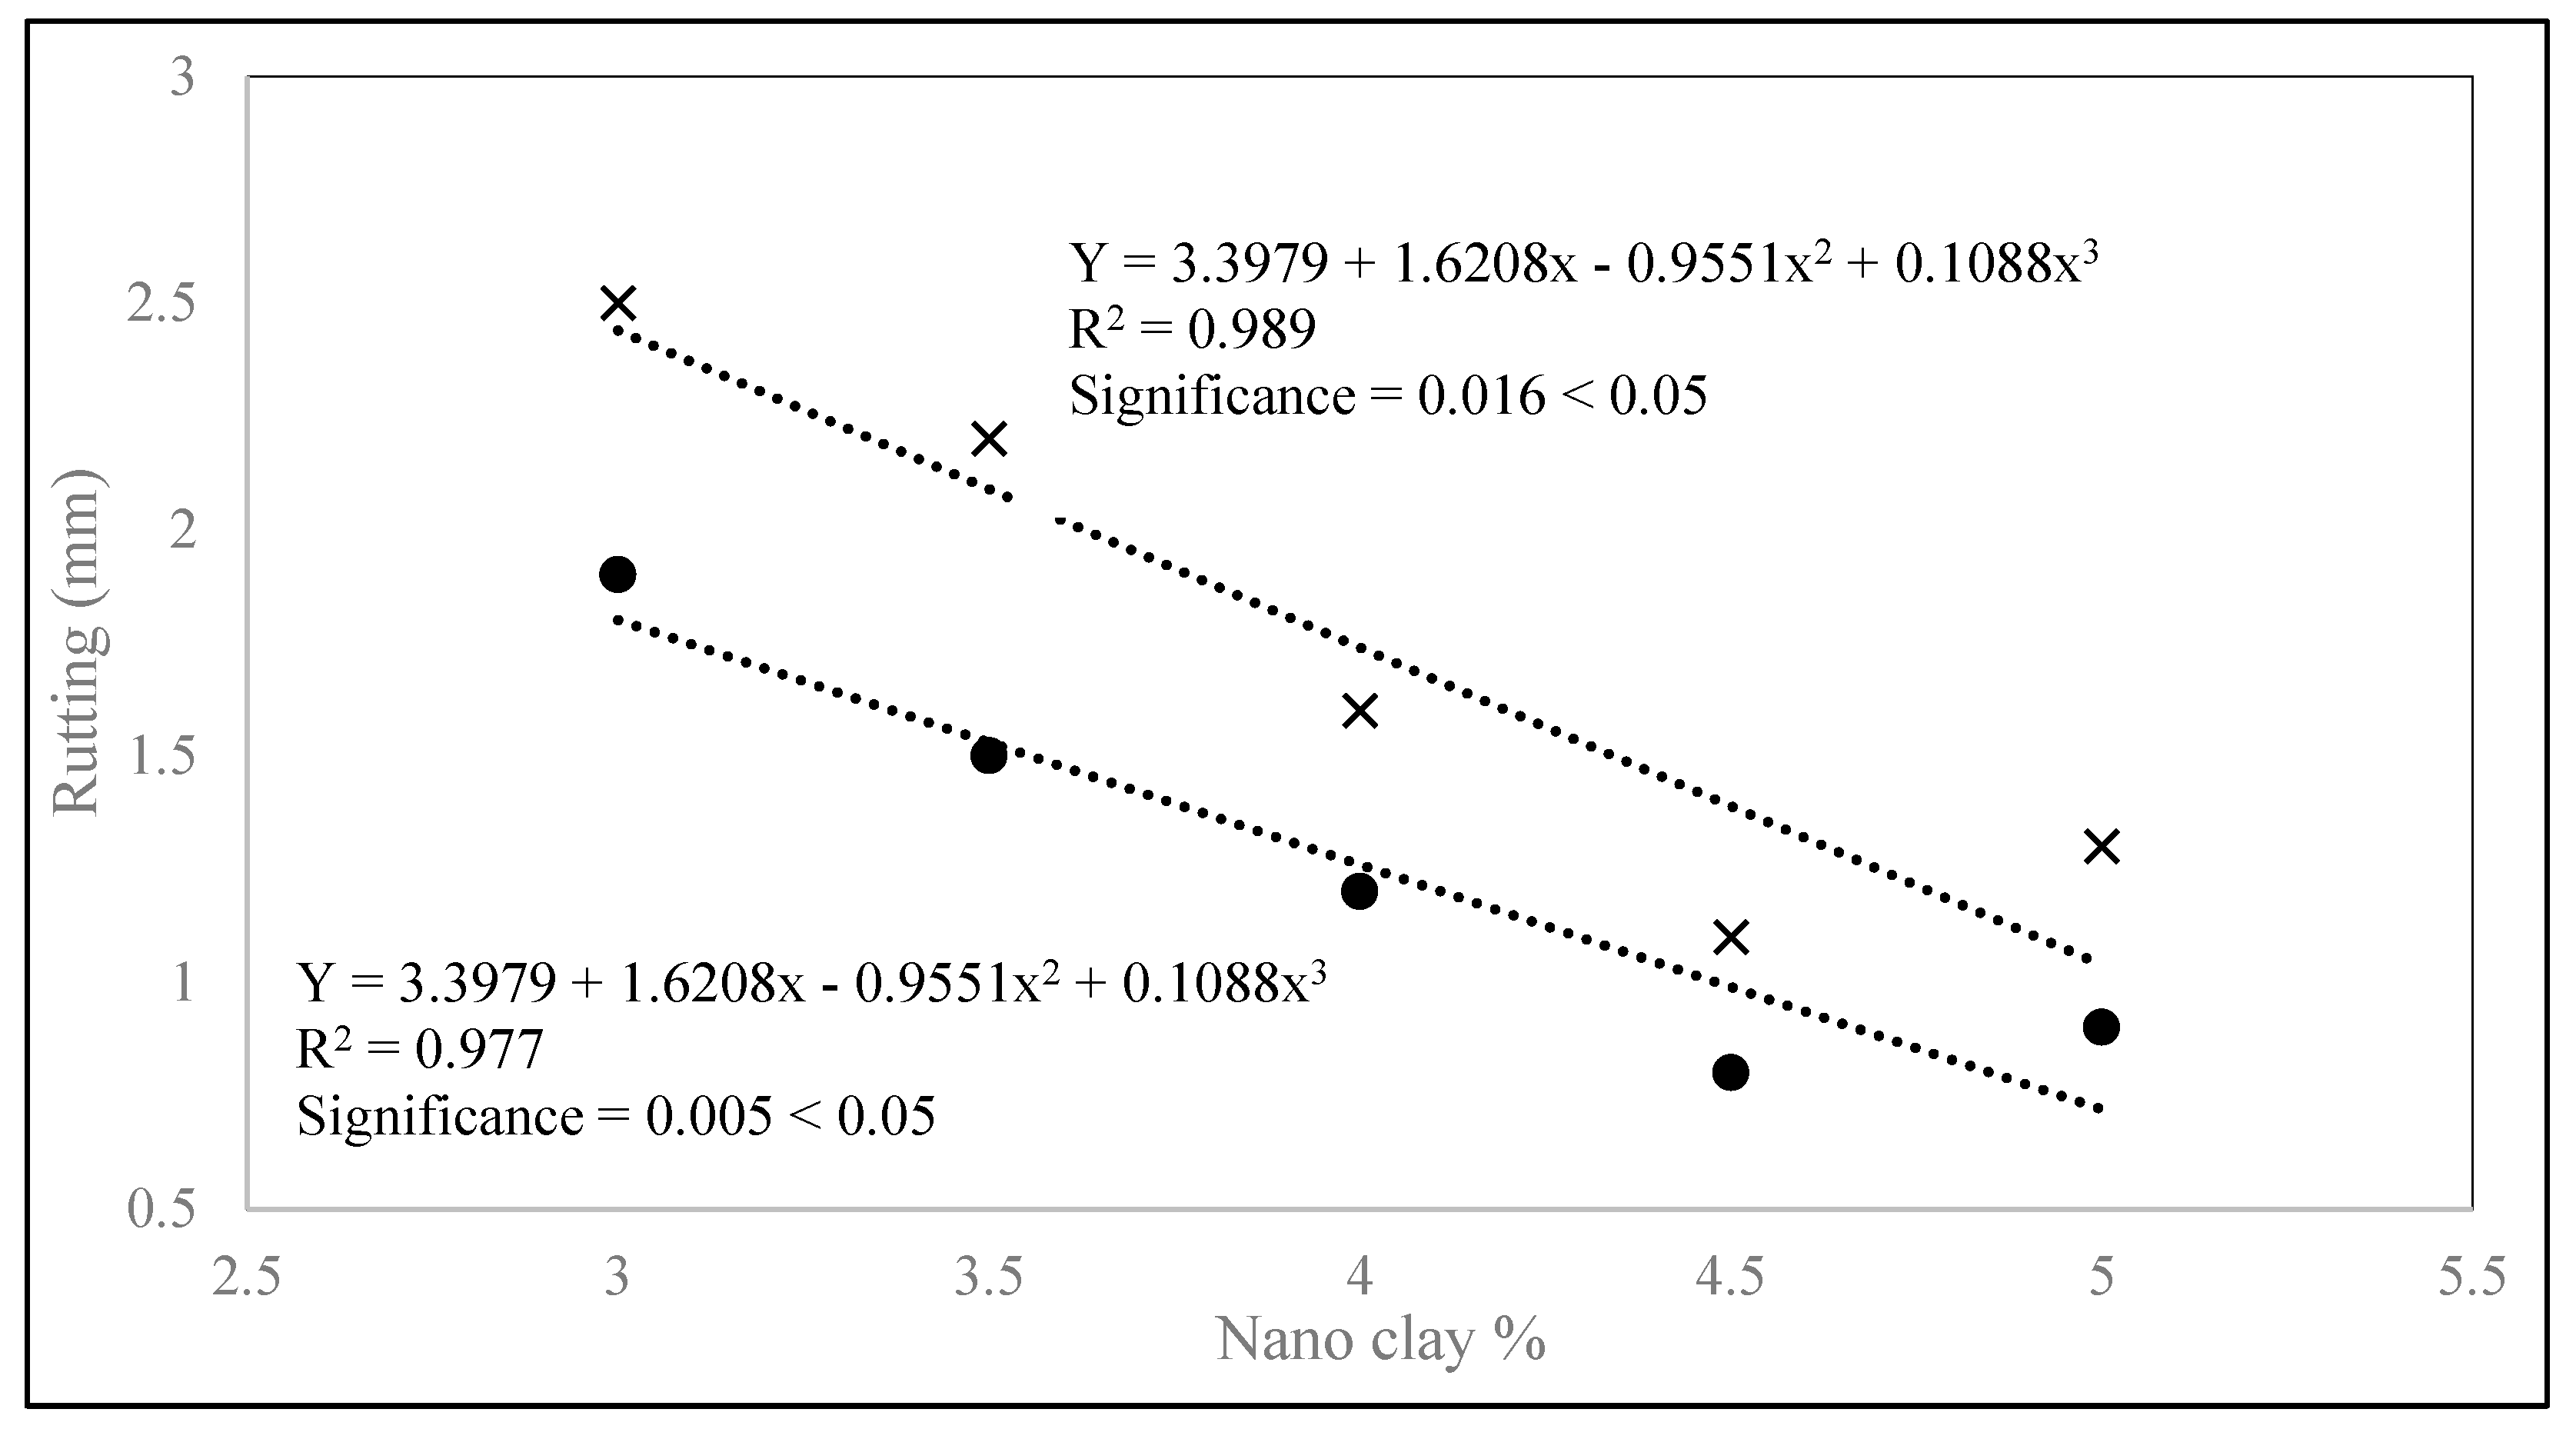
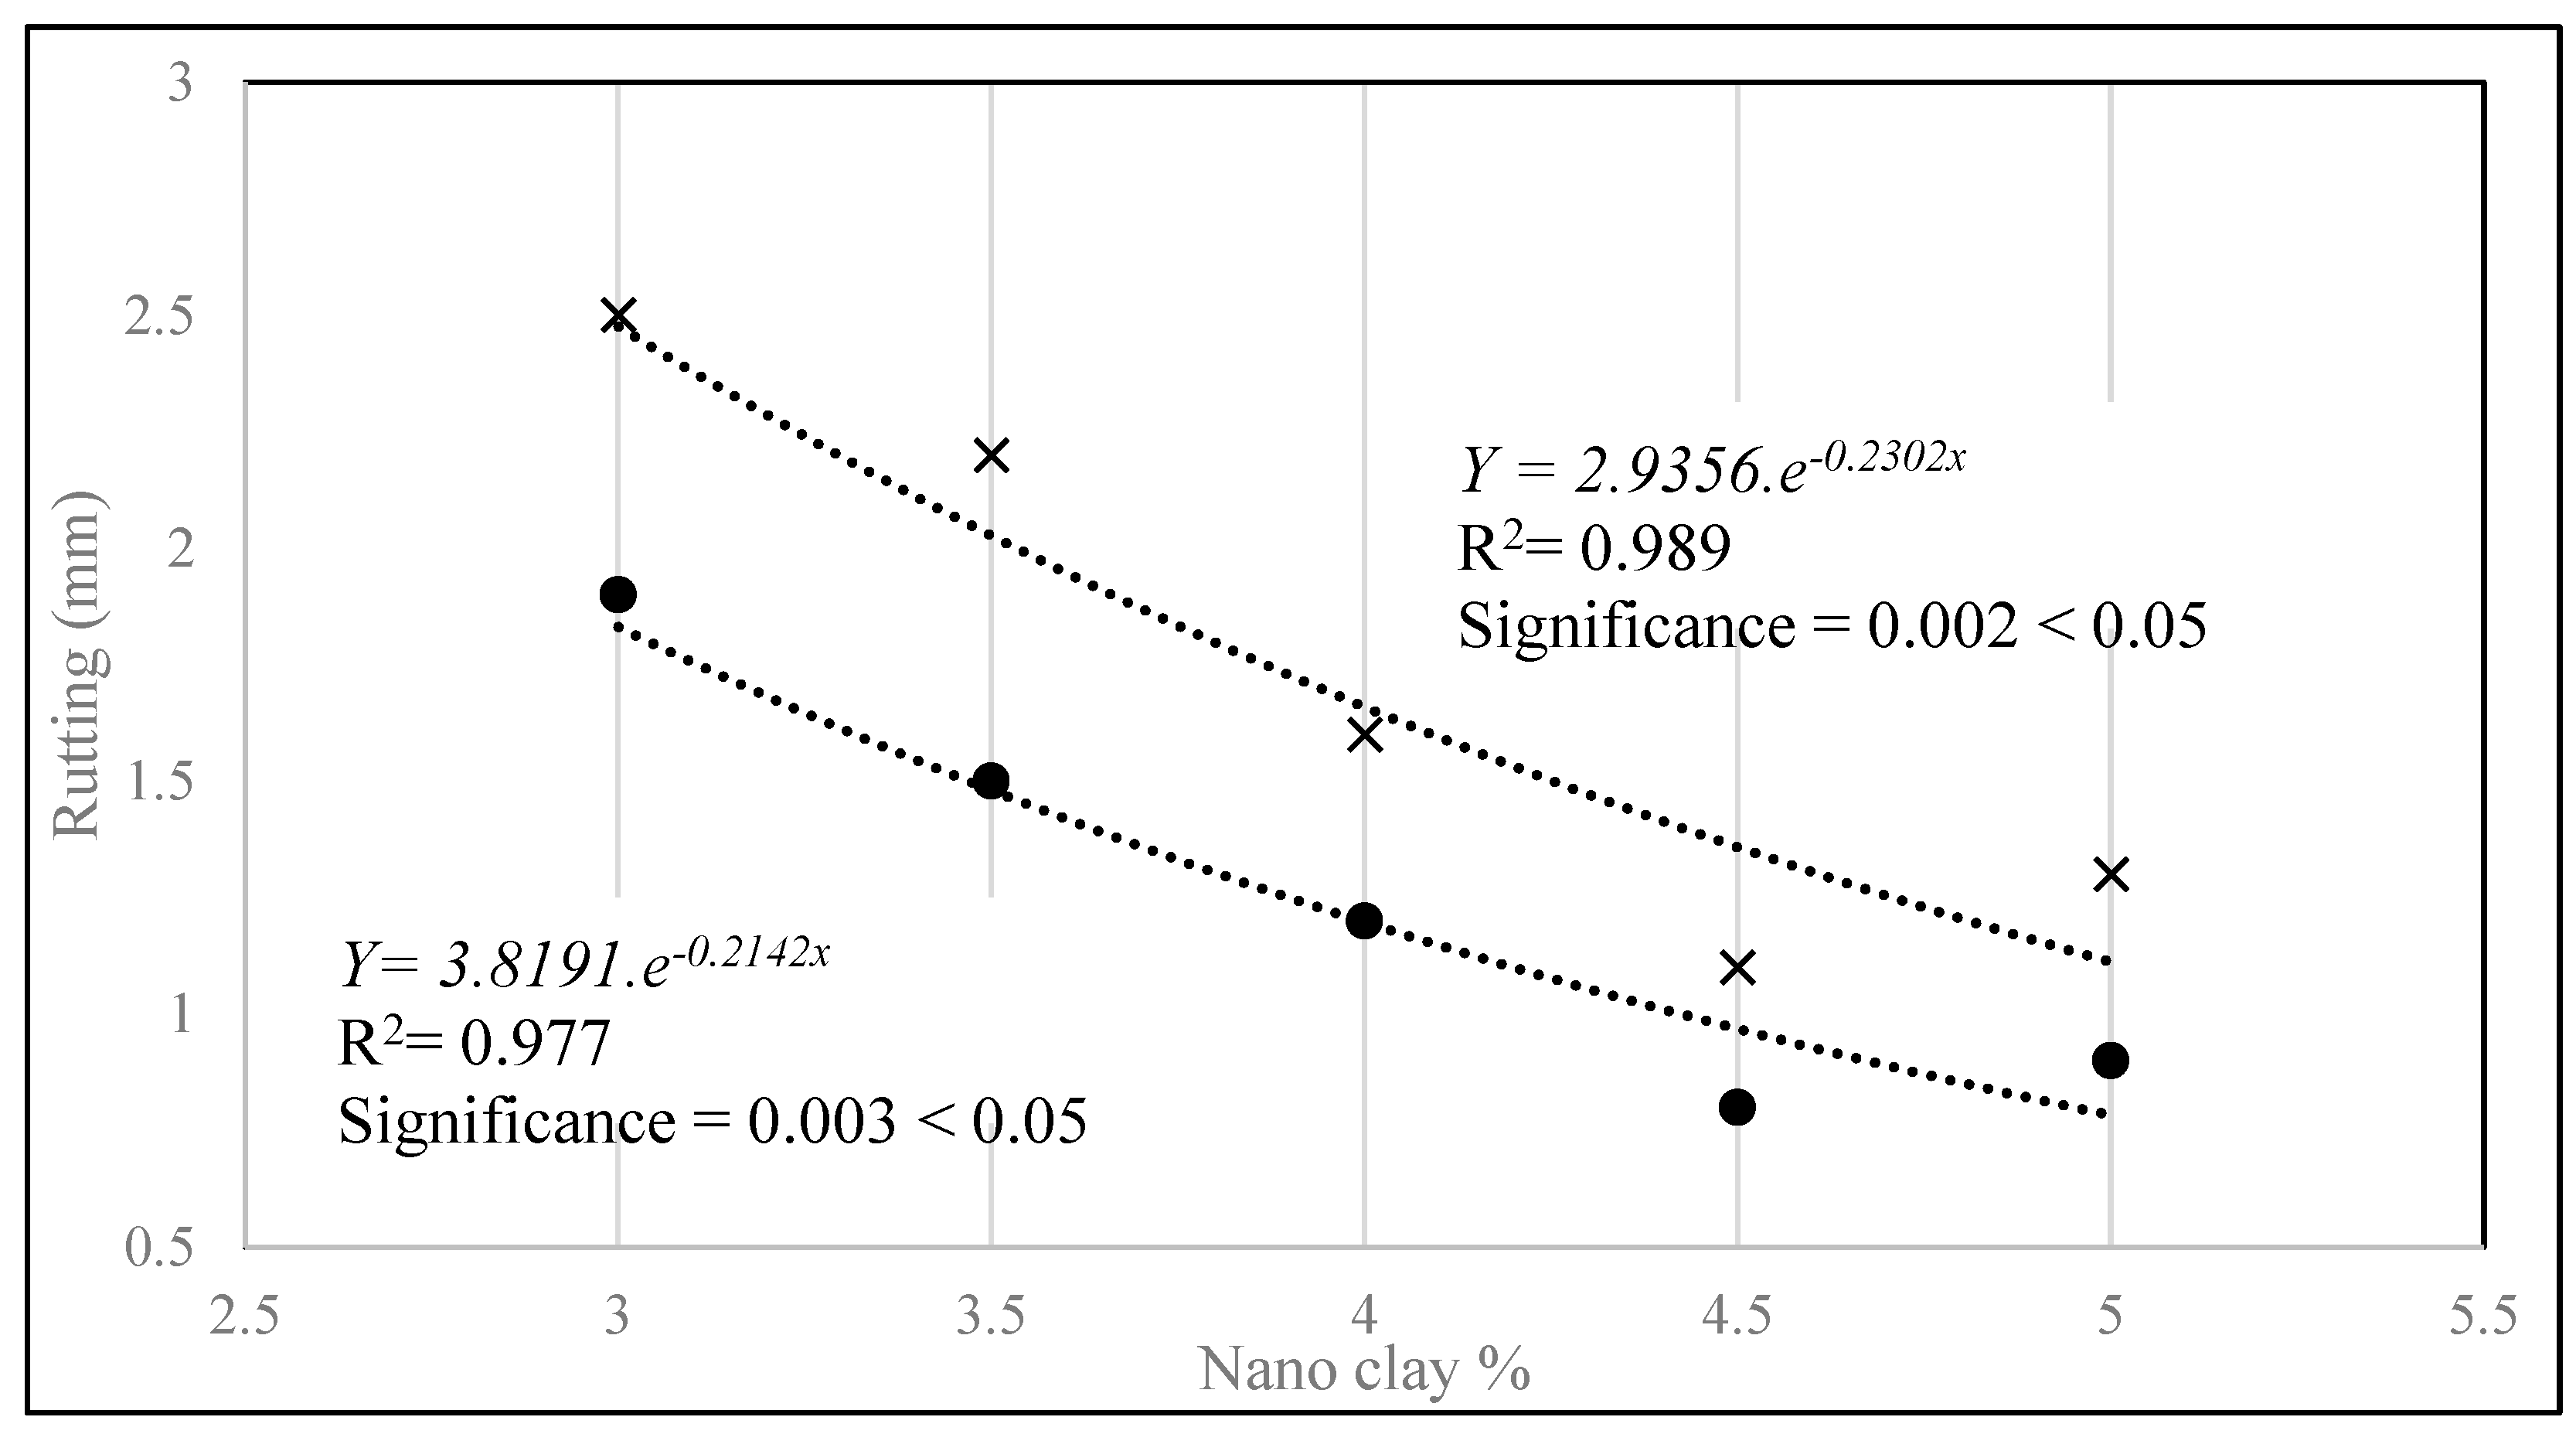
- The asphalt mixes used in this study were designed to assess the impact of high temperatures on the rut resistance of asphalt mixes. Laboratory tests were run according to high temperatures to replicate the mostly warm climates in Pakistan. The rut resistance properties of the P.G. binders were compared to virgin P.G. binders. In N.R.L 60/70 grade bitumen using 4.50% Nano clay, rutting was reduced to 0.8mm, a decrease of 69.23% compared to the virgin’s 2.6 mm. Similarly, for N.R.L 80/100, the maximum decrease in rutting was again noted at 4.50% Nano clay content, decreasing from virgin’s 3.4 mm to 1.1 mm, which decreased 67.64% in overall rutting. It can be concluded that organophilic nano clay positively affects raw bitumen and improves the rut resistance property of binders. The results in SPSS and running statistical analysis on them concluded that adding organophilic nano clay significantly impacted raw virgin bitumen, improving the conventional and rheological properties of bitumen.
- This study used the N.H.A. class B asphaltic wearing course of 50 mm thickness, and adding organophilic nano clay per bitumen weight modified the binder grades’ mix. For N.R.L 60/70, after conducting tests and analyzing the results, the optimum nano clay percentage was 4.50%. The mix had a bitumen content of 4.25% with Bulk Specific Gravity, Gsb = 2.651, Specific Gravity of bitumen, Gb = 1.029, and Maximum Theoretical Specific Gravity of Loose Mix, Gmm = 2.490. The optimum nano clay percentage for N.R.L 80/100 was 4.50%. The mix had a bitumen content of 4.29% with Bulk Specific Gravity, Gsb = 2.673, Specific Gravity of bitumen, Gb = 1.029, and Maximum Theoretical Specific Gravity of Loose Mix, Gmm = 2.490.
6. Recommendations
- As this research study was conducted using high temperatures, portraying the mostly warm climate of Pakistan, using organophilic nano clay modified binder is recommended as a viable alternative to using asphalt of raw virgin bitumen, considering its positive effect against rut resistance and increased viscosity.
- Based upon the future trend of the world shifting towards an environmentally friendly solution to the extraction of excessive crude oil and ultimately refining more bitumen, the use of organophilic nano clay in bitumen may be admired as not only does it decrease the overall bitumen content in an asphalt mix. Still, it would ultimately cut overall carbon emissions, contributing to a decrease in greenhouse gas emissions and global warming. Furthermore, more research needs to be done to explore the properties of nano clay at high and low temperatures with an increased percentage of nano clay in the asphaltic concrete mix.
Author Contributions
Funding
Institutional Review Board Statement
Informed Consent Statement
Data Availability Statement
Acknowledgments
References
- Jiang, W.; Yuan, D.; Shan, J.; Ye, W.; Lu, H.; Sha, A. Experimental study of the performance of porous ultra-thin asphalt overlay. International Journal of Pavement Engineering 2022, 23, 2049–2061. [Google Scholar] [CrossRef]
- Xing, C.; Li, M.; Liu, L.; Lu, R.; Liu, N.; Wu, W.; Yuan, D. A comprehensive review on the blending condition between virgin and RAP asphalt binders in hot recycled asphalt mixtures: Mechanisms, evaluation methods, and influencing factors. Journal of Cleaner Production 2023, 398, 136515. [Google Scholar] [CrossRef]
- Li, M.; Liu, L.; Xing, C.; Liu, L.; Wang, H. Influence of rejuvenator preheating temperature and recycled mixture’s curing time on performance of hot recycled mixtures. Construction and Building Materials 2021, 295, 123616. [Google Scholar] [CrossRef]
- Ma, Y.; Polaczyk, P.; Park, H.; Jiang, X.; Hu, W.; Huang, B. Performance evaluation of temperature effect on hot in-place recycling asphalt mixtures. Journal of Cleaner Production 2020, 277, 124093. [Google Scholar] [CrossRef]
- Ma, Y.; Polaczyk, P.; Hu, W.; Zhang, M.; Huang, B. Quantifying the effective mobilized RAP content during hot in-place recycling techniques. Journal of Cleaner Production 2021, 314, 127953. [Google Scholar] [CrossRef]
- Pouranian, M.R.; Haddock, J.E. A new framework for understanding aggregate structure in asphalt mixtures. International Journal of Pavement Engineering 2021, 22, 1090–1106. [Google Scholar] [CrossRef]
- Button, J.W.; Perdomo, D.; Lytton, R.L. Influence of aggregate on rutting in asphalt concrete pavements. Transportation Research Record 1990, m, 141–152. [Google Scholar]
- Brown, E.R.; Bassett, C.E. Effects of maximum aggregate size on rutting potential and other properties of asphalt-aggregate mixtures. Transportation Research Record 1990, 107–119. [Google Scholar]
- Dawley, C.B.; Hogewiede, B.L.; Anderson, K.O. Mitigation of instability rutting of asphalt concrete pavements in Lethbridge, Alberta, Canada.
- Irfan, M.; Ali, Y.; Ahmed, S.; Hafeez, I. Performance Evaluation of Crumb Rubber-Modified Asphalt Mixtures Based on Laboratory and Field Investigations. Arabian Journal for Science and Engineering 2018, 43, 1795–1806. [Google Scholar] [CrossRef]
- Hussan, S.; Kamal, M.A.; Hafeez, I.; Ahmad, N.; Khanzada, S.; Ahmed, S. Modelling asphalt pavement analyzer rut depth using different statistical techniques. Road Materials and Pavement Design 2020, 21, 117–142. [Google Scholar] [CrossRef]
- El-Shafie, M.; Ibrahim, I.M.; Abd El Rahman, A.M.M. The addition effects of macro and nano clay on the performance of asphalt binder. Egyptian Journal of Petroleum 2012, 21, 149–154. [Google Scholar] [CrossRef]
- Haq, M.; Ahmad, N.; Nasir, M.A.; Hafeez, M.; Rafi, J.; Zaidi, S.B.A.; Haroon, W.; ul Haq, M.F.; Ahmad, N.; et al. Carbon Nanotubes (CNTs) in Asphalt Binder: Homogeneous Dispersion and Performance Enhancement. Applied Sciences 2018, 8, 2651. [Google Scholar] [CrossRef]
- ul Haq, M.F.; Ahmad, N.; Jamal, *!!! REPLACE !!!*; Anwar, W.; Khitab, A.; Hussan, S. Carbon Nanotubes and Their Use for Asphalt Binder Modification: A Review. Emerging Materials Research 2020, 9, 1–16. [Google Scholar] [CrossRef]
- Wu, S.; Tahri, O. State-of-art carbon and graphene family nanomaterials for asphalt modification. Road Materials and Pavement Design 2021, 22, 735–756. [Google Scholar] [CrossRef]
- Haroon, W.; Ahmad, N.; Mashaan, N. Effect of Quartz Nano-Particles on the Performance Characteristics of Asphalt Mixture. Infrastructures 2022, 7, 60. [Google Scholar] [CrossRef]
- Rafi, J.; Kamal, M.; Ahmad, N.; Hafeez, M.; Faizan ul Haq, M.; Aamara Asif, S.; Shabbir, F.; Bilal Ahmed Zaidi, S. Performance Evaluation of Carbon Black Nano-Particle Reinforced Asphalt Mixture. Applied Sciences 2018, 8, 1114. [Google Scholar] [CrossRef]
- Hafeez, M.; Ahmad, N.; Kamal, M.; Rafi, J.; Haq, M.; Jamal, *!!! REPLACE !!!*; Zaidi, S.; Nasir, M. Experimental Investigation into the Structural and Functional Performance of Graphene Nano-Platelet (GNP)-Doped Asphalt. Applied Sciences 2019, 9, 686. [Google Scholar] [CrossRef]
- Li, X.; Wang, Y.; Wu, Y.; Wang, H.; Wang, Q.; Zhu, X.; Liu, X.; Sun, H.; Fan, L. Effect of graphene on modified asphalt microstructures based on atomic force microscopy. Materials 2021, 14, 1–12. [Google Scholar] [CrossRef] [PubMed]
- Li, R.; Xiao, F.; Amirkhanian, S.; You, Z.; Huang, J. Developments of nano materials and technologies on asphalt materials – A review. Construction and Building Materials 2017, 143, 633–648. [Google Scholar] [CrossRef]
- Kim, H.S.; Chen, G.X.; Jin, H.J.; Yoon, J.S. In situ copolymerization of butylene succinate with twice functionalized organoclay: Thermal stability. Colloids and Surfaces A: Physicochemical and Engineering Aspects 2008, 313–314, 56–59. [Google Scholar] [CrossRef]
- Han, S. Il; Lim, J.S.; Kim, D.K.; Kim, M.N.; Im, S.S. In situ polymerized poly(butylene succinate)/silica nanocomposites: Physical properties and biodegradation. Polymer Degradation and Stability 2008, 93, 889–895. [Google Scholar] [CrossRef]
- Liu, G.; Van De Ven, M.; Wu, S.; Yu, J.; Molenaar, A. Influence of organo-montmorillonites on fatigue properties of bitumen and mortar. International Journal of Fatigue 2011, 33, 1574–1582. [Google Scholar] [CrossRef]
- Hanyu, A.; Ueno, S.; Kasahara, A.; Saito, K. Effect of the morphology of SBS modified asphalt on mechanical properties of binder and mixture. Journal of the Eastern Asia Society for Transportation Studies 2005, 6, 1153–1167. [Google Scholar] [CrossRef]
- Fu, F.M.; Jin-gang, X.; Gang, J.; Gu-quan, S. Study and application of nano materials in concrete. Engineering Mechanics 2004, 21, 48–51. [Google Scholar]
- Yildirim, Y. Polymer modified asphalt binders. Construction and Building Materials 2007, 21, 66–72. [Google Scholar] [CrossRef]
- Chen, J.S.; Huang, C.C. Fundamental characterization of SBS-modified asphalt mixed with sulfur. Journal of Applied Polymer Science 2007, 103, 2817–2825. [Google Scholar] [CrossRef]
- Hafeez, I.; Hussain, J.; Riaz, K.; Khitab, A.; Hussain, S.; Zaidi, B.; Farooqi, U.; Hayat, A.; Ahmed, I.; Asif, A. Influence of time and temperature on asphalt binders rheological properties. Life Science Journal 2013, 10, 894–898. [Google Scholar]
- Hafeez, I.; Kamal, M.A. A rheological comparison of hard grade binders with polymer modified bitumen under aged and unaged conditions. WIT Transactions on Engineering Sciences 2009, 64, 105–114. [Google Scholar]
- Muzaffar Khan, K.; Hanifullah, *!!! REPLACE !!!*; Afzal, M.; Ali, F.; Ahmed, A.; Sultan, T.; Khan, K.M.; Hanifullah, *!!! REPLACE !!!*; Afzal, M.; Ali, F.; et al. Rutting performance of Polyethylene, Lime and Elvaloy modified Asphalt Mixes. Life Science Journal 2013, 10, 363–371. [Google Scholar]
- Hafeez, I.; Kamal, M.A.; Mirza, M.W. Evaluation of Rutting in HMA Mixtures Using Uniaxial Repeated Creep & Wheel Tracker Tests. Pakistan Journal of Engineering & Applied Sciences 2010, 7, 55–64. [Google Scholar]
- Fareed, A.; Zaidi, S.B.A.; Ahmad, N.; Hafeez, I.; Ali, A.; Ahmad, M.F. Use of agricultural waste ashes in asphalt binder and mixture: A sustainable solution to waste management. Construction and Building Materials 2020, 259, 120575. [Google Scholar] [CrossRef]
- Anwar, W.; Ahmad, N.; Khitab, A.; Faizan, M.; Tayyab, S.; Saeed, M.; Imran, M. Performance augmentation of asphalt binder with multi-walled carbon nanotubes. Proceedings of the Institution of Civil Engineers: Transport 2021, 174, 130–141. [Google Scholar] [CrossRef]
- Wang, Y.; Jiang, Y.; Pan, T.; Yin, K. The synergistic effect of ester-ether copolymerization thixo-tropic superplasticizer and Nano-Clay on the buildability of 3D printable cementitious materials. Materials 2021, 14. [Google Scholar] [CrossRef]
- Lin, Y.; Qin, H.; Guo, J.; Chen, J. Study on the rheological behavior of a model clay sediment. Journal of Marine Science and Engineering 2021, 9, 1–9. [Google Scholar] [CrossRef]
- de Melo, J.V.S.; Trichês, G. Effects of Organophilic Nanoclay on the Rheological Behavior and Performance Leading to Permanent Deformation of Asphalt Mixtures. Journal of Materials in Civil Engineering 2016, 28, 1–9. [Google Scholar] [CrossRef]
- Qarni, A.A.; Hafeez, I. Characterization of Nano Clay Modified Asphalt Cement. International Journal for Research in Applied Science and Engineering Technology 2022, 10, 2360–2367. [Google Scholar] [CrossRef]
- Merah, N.; Ashraf, F.; Shaukat, M.M. Mechanical and Moisture Barrier Properties of Epoxy–Nanoclay and Hybrid Epoxy–Nanoclay Glass Fibre Composites: A Review. Polymers 2022, 14, 1–21. [Google Scholar] [CrossRef]
- Guo, F.; Aryana, S.; Han, Y.; Jiao, Y. A review of the synthesis and applications of polymer-nanoclay composites. Applied Sciences (Switzerland) 2018, 8, 1–29. [Google Scholar] [CrossRef]
- Bergane, C.; Hammadi, L. Impact of organophilic clay on rheological properties of gasoil-based drilling muds. Journal of Petroleum Exploration and Production Technology 2020, 10, 3533–3540. [Google Scholar] [CrossRef]
- Colombo, M.A.S.; Díaz, F.R.V.; Kodali, D.; Rangari, V.; Güven, O.; Moura, E.A.B. Influence of Reinforcing Efficiency of Clay on the Mechanical Properties of Poly(butylene terephthalate) Nanocomposite. Ceramics 2023, 6, 58–73. [Google Scholar] [CrossRef]
- Rhim, J.W. Effect of clay contents on mechanical and water vapor barrier properties of agar-based nanocomposite films. Carbohydrate Polymers 2011, 86, 691–699. [Google Scholar] [CrossRef]
- Esposito Corcione, C.; Prinari, P.; Cannoletta, D.; Mensitieri, G.; Maffezzoli, A. Synthesis and characterization of clay-nanocomposite solvent-based polyurethane adhesives. International Journal of Adhesion and Adhesives 2008, 28, 91–100. [Google Scholar] [CrossRef]
- Omar, H.A.; Katman, H.Y.; Bilema, M.; Ahmed, M.K.A.; Milad, A.; Md Yusoff, N.I. The effect of ageing on chemical and strength characteristics of nanoclay-modified bitumen and asphalt mixture. Applied Sciences (Switzerland) 2021, 11, 3–5. [Google Scholar] [CrossRef]
- BS EN 12697-22 : 2003 Bituminous Mixtures : Test Methods for Hot Mix Asphalt. Part 22: Wheel Tracking. European Committee for Standardization 2004, 3.
- Yang, J.; Tighe, S. A Review of Advances of Nanotechnology in Asphalt Mixtures. Procedia - Social and Behavioral Sciences 2013, 96, 1269–1276. [Google Scholar] [CrossRef]
- Ghanoon, S.A.; Tanzadeh, J.; Mirsepahi, M. Laboratory evaluation of the composition of nano-clay, nano-lime and SBS modifiers on rutting resistance of asphalt binder. Construction and Building Materials 2020, 238, 117592. [Google Scholar] [CrossRef]
- Fini, E.H.; Hajikarimi, P.; Mohammad, R.; Nejad, F.M. Physiochemical,Rheological, and Oxidative Aging Characteristics of Asphalt Binder in the Presence of Mesoporous Silica Nanoparticles. Journal of Materials in Civil Engineering 2015, 28, 04015133. [Google Scholar] [CrossRef]
- Zahid, A.; Ahmed, S.; Irfan, M. Experimental investigation of nano materials applicability in Hot Mix Asphalt (HMA). Construction and Building Materials 2022, 350, 128882. [Google Scholar] [CrossRef]
- Iskender, E. Evaluation of mechanical properties of nano-clay modified asphalt mixtures. Measurement: Journal of the International Measurement Confederation 2016, 93, 359–371. [Google Scholar] [CrossRef]

| Test Name | Standard | Binder (N.R.L 60/70) |
Binder (N.R.L 80/100) |
Range |
|---|---|---|---|---|
| Softening point (°C) | ASTM D36 | 46 | 44 | 46-54 |
| Penetration Test (0.1mm) | ASTM D5 | 63 | 89 | 60/100 |
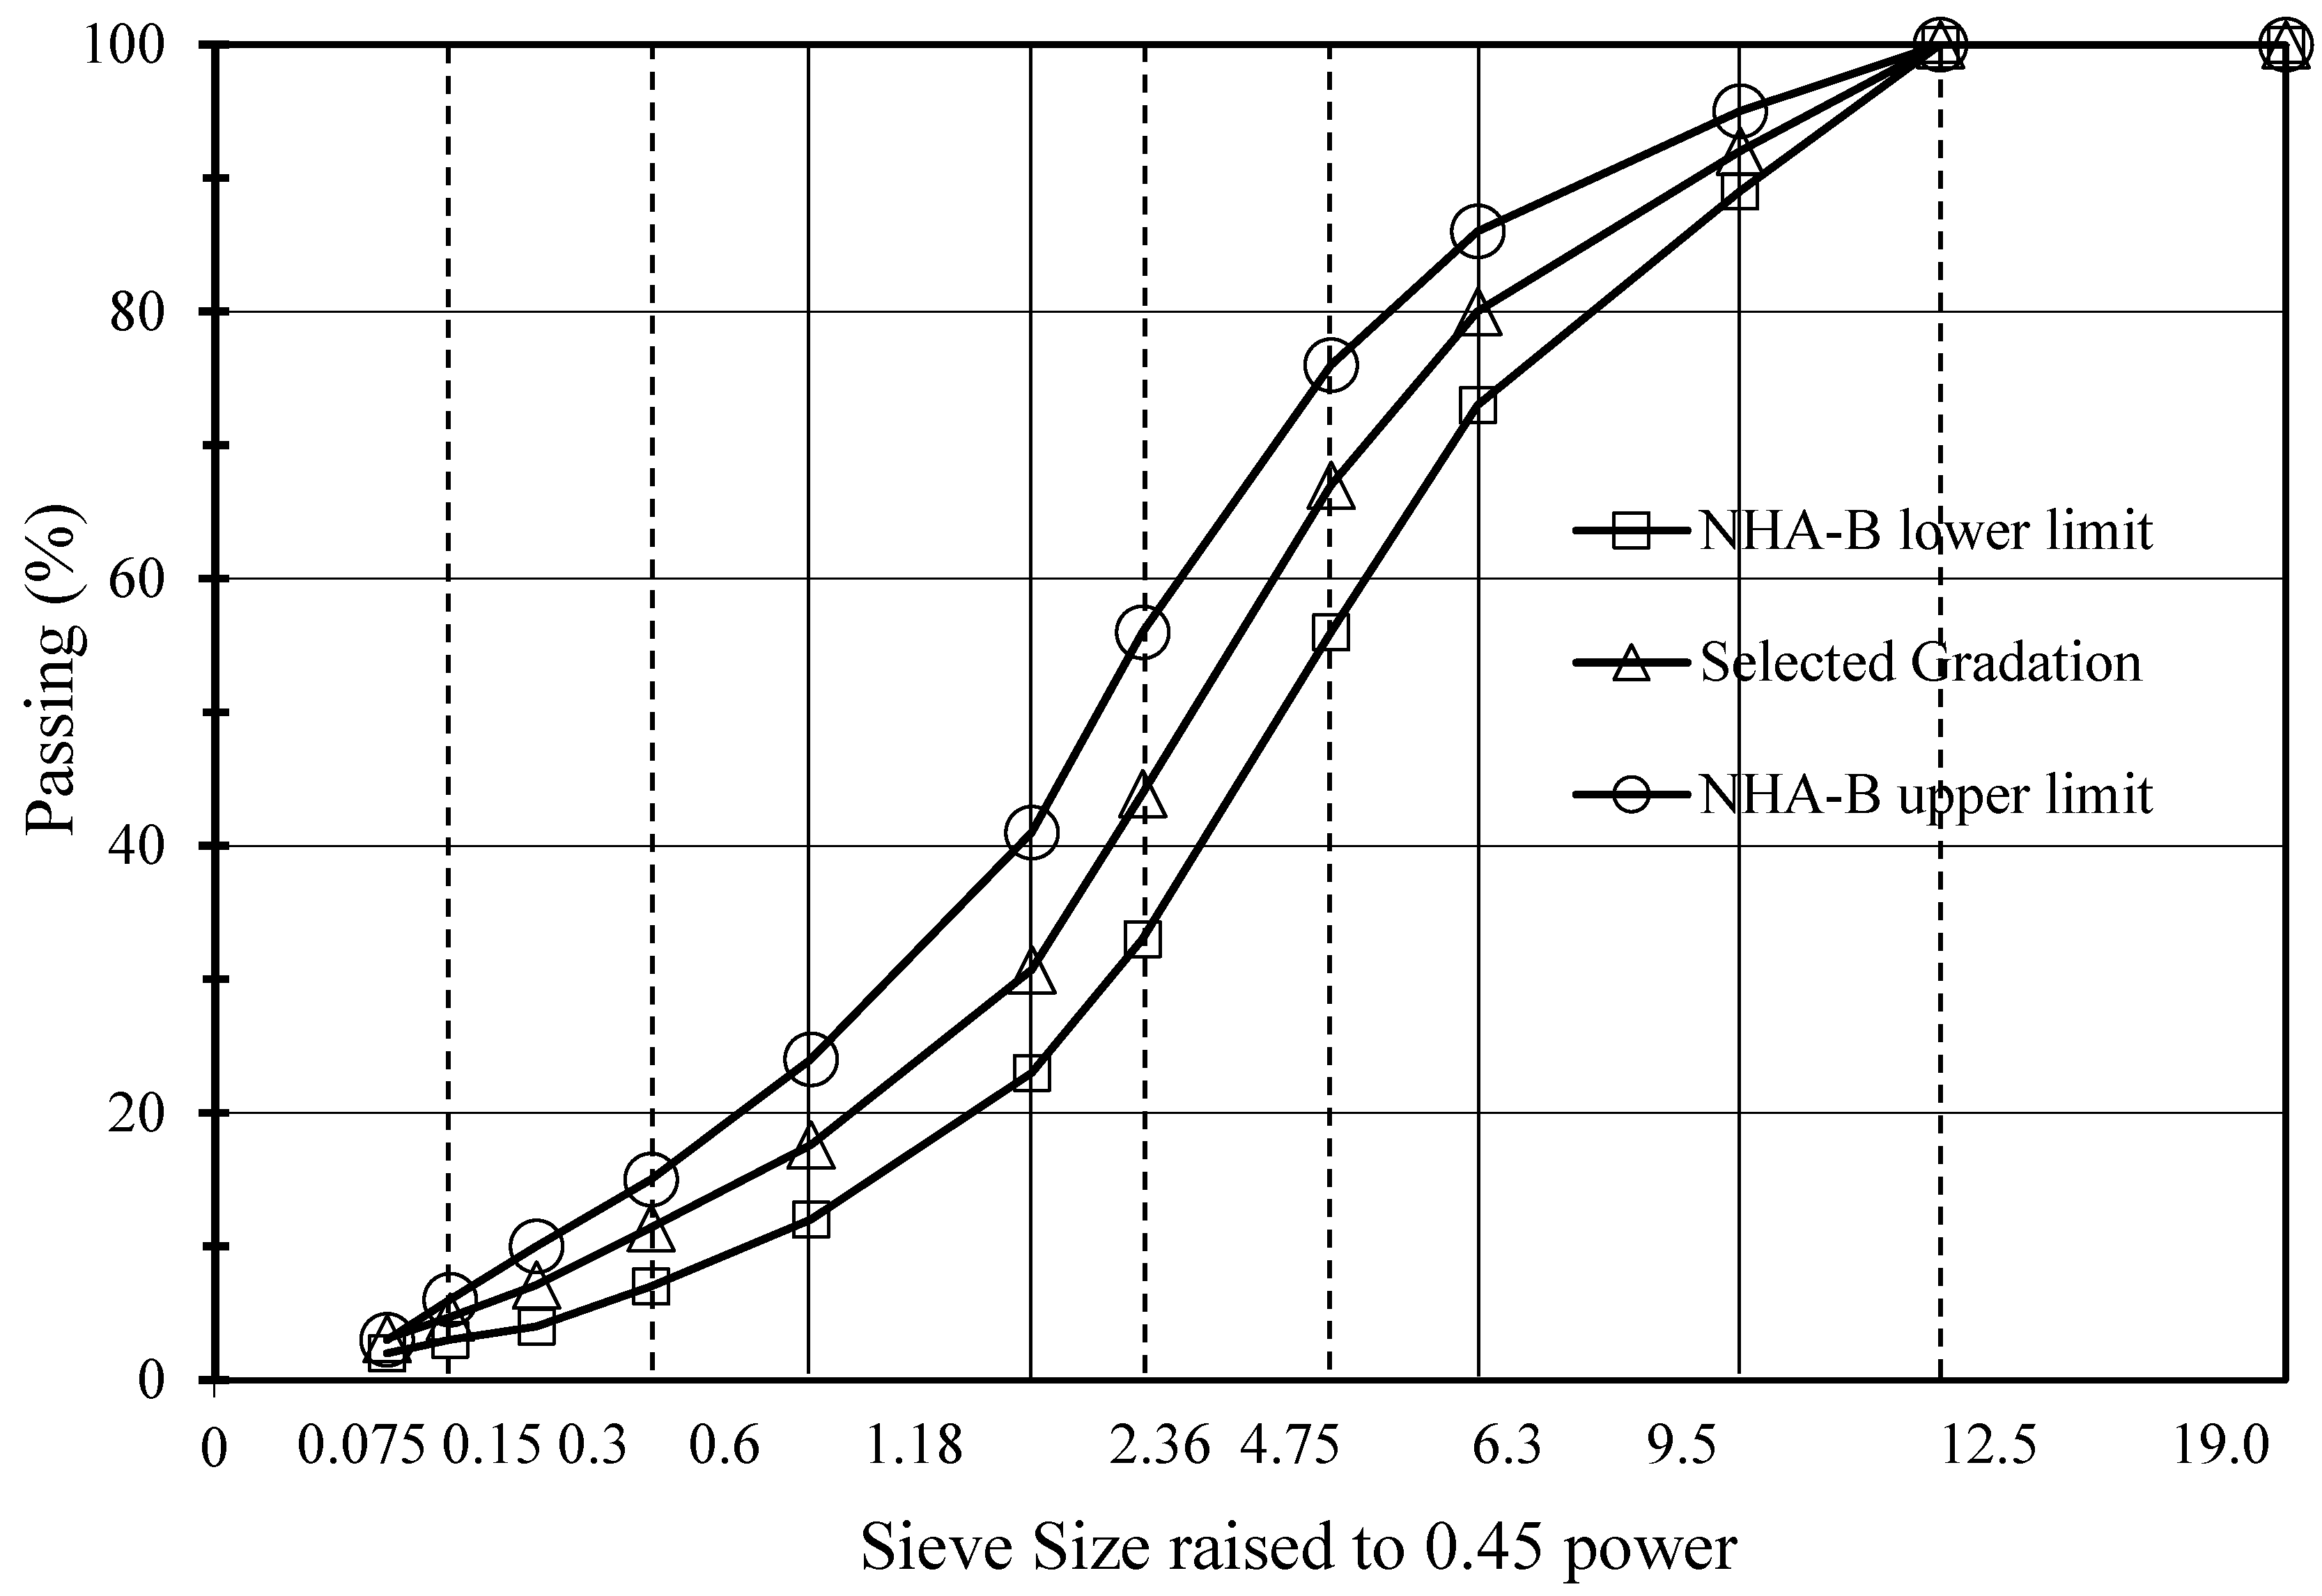
| Sieve Size | Passing % | Tolerance | N.H.A. Specifications |
|---|---|---|---|
| 19 mm | 100 | ± 7 | 100 |
| 12.50 mm | 76.9 | ± 7 | 75-90 |
| 9.50 mm | 62-76 | ± 7 | 60-80 |
| #4 | 43-51 | ± 4 | 40-60 |
| #8 | 31-39 | ± 4 | 20-40 |
| #50 | 7-15 | ± 4 | 5-15 |
| #200 | 4-6 | ± 1 | 3-8 |
| Name of element | Percentage % |
|---|---|
| Dark Grey Limestone | 31 |
| Light Grey Limestone | 13 |
| Dark Grey to Grey Veined Limestone | 8 |
| Cremish Brown limestone | 3 |
| Quartzwacke | 2 |
| Grey Limestone | 43 |
| Sr. # | Properties of aggregate | BS/ ASTM Standards | Results | Test Limits |
|---|---|---|---|---|
| 1 | Flakiness Index (%) | BS 812.108 | 5.25 | 10 (max) |
| 2 | Elongation index (%) | BS 812.109 | 5.8 | 10 (max) |
| 3 | Water Absorption (%) | ASTM C127 | 1.32 | 3 (max) |
| 4 | Specific Gravity | ASTM C128 | 2.83 | 3.0 (max) |
| 5 | Bulk Density (kg/m3) | ASTM D1895 | 1508.0 | 1750 (max) |
| 6 | Voids (%) | ASTM D3203 | 44.56 | 45 (max) |
| 7 | Impact Value (%) | ASTM C125 | 16.50 | 20 (max) |
| 8 | Crushing Value (%) | ASTM D5821 | 29.80 | 30 (max) |
| Properties | Unit | Virgin | Modified | Specification Limit (minimum) |
||
|---|---|---|---|---|---|---|
| N.R.L 60/70 | N.R.L 80/100 | N.R.L 60/70 | N.R.L 80/100 | |||
| Penetration 0.1 mm @ 25 ℃ | 61 | 82 | 69 | 89 | 60/80 | |
| Softening point (°C) | ℃ | 46 | 49 | 41 | 44 | 43 |
| Sampling Type | Respective ID |
|---|---|
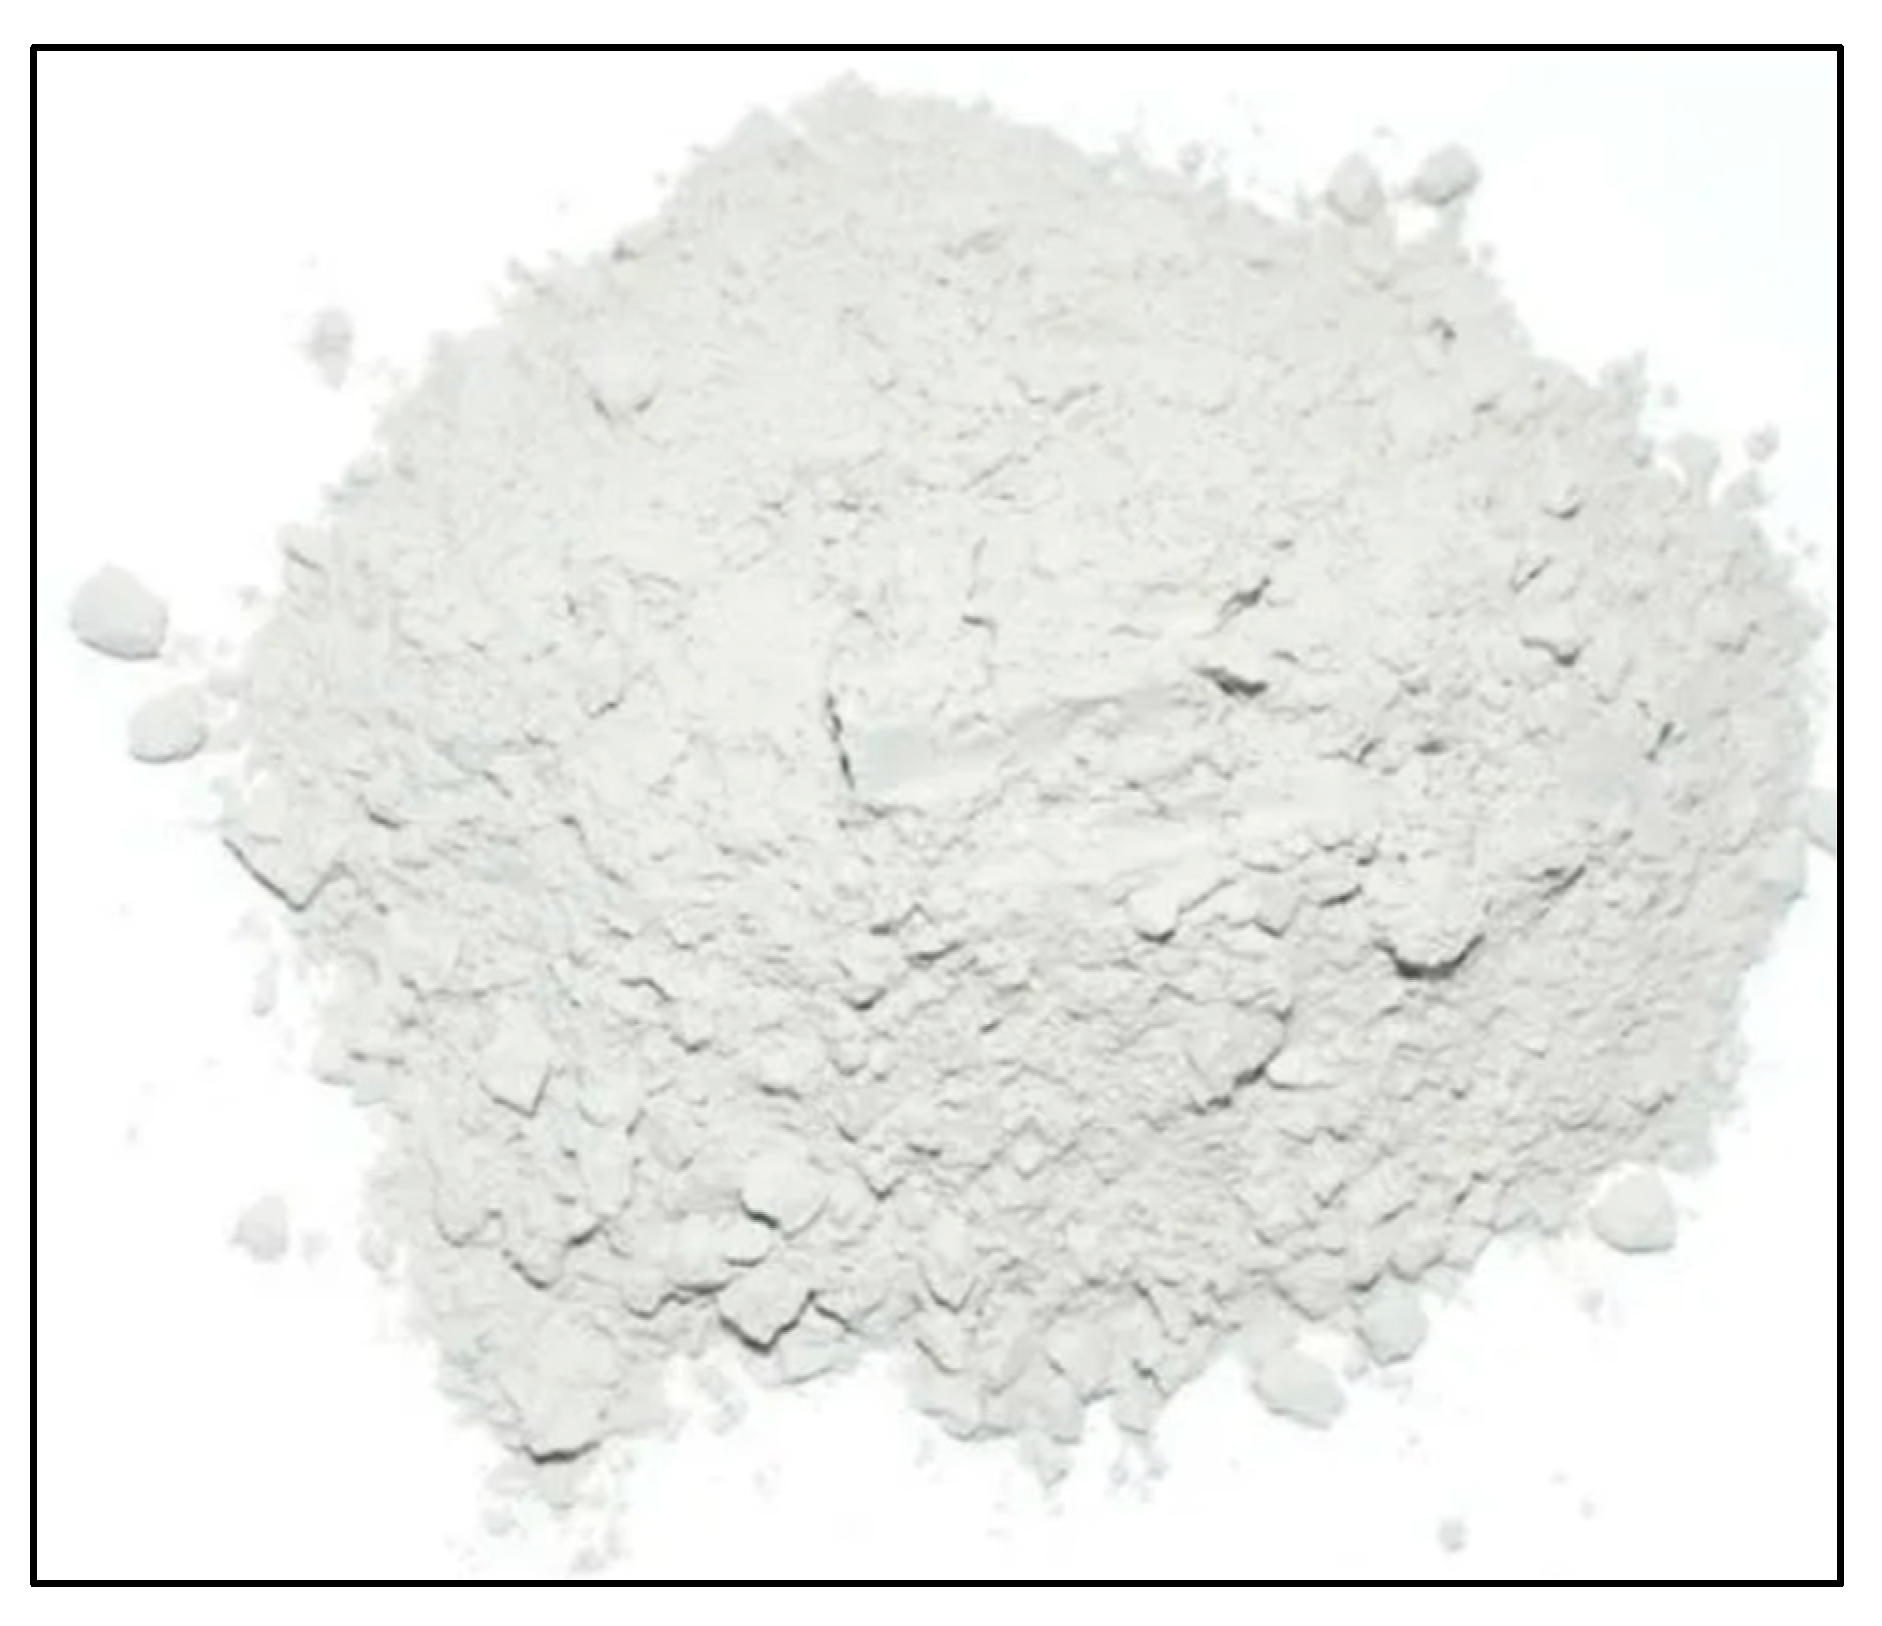
| Organophilic Nano clay Modified binder | ONMB |
| Penetration Grade 60/70 Bitumen | N.R.L 60/70 |
| Penetration Grade 80/100 Bitumen | N.R.L 80/100 |
| Asphalt Binder containing 3.0% nano clay | 3.0% N.C |
| Asphalt Binder containing 3.5% nano clay | 3.5% N.C |
| Asphalt Binder containing 4.0% nano clay | 4.0% N.C |
| Asphalt Binder containing 4.5% nano clay | 4.5% N.C |
| Asphalt Binder containing 5.0% nano clay | 5.0% N.C |
| Type of Mix | Aggregate Source | VA (%) |
VMA (%) |
VFA (%) |
Modifiers quantity by the weight of asphalt binder | Mixing Method |
|---|---|---|---|---|---|---|
| --- | --- | Limits 04 - 07 |
14 (Min.) |
Limits 65 - 75 |
--- | --- |
| O.N.C. modified Mix N.R.L 60/70 | Khanpur Crush | 5.22 | 14.76 | 64.63 | 3% - 5% | Marshal method |
| O.N.C. modified Mix N.R.L 80/100 | Khanpur Crush | 6.43 | 16.57 | 61.2 | 3% - 5% | Marshal method |
| Pen 60/70 | Pen 80/100 | |||||
|---|---|---|---|---|---|---|
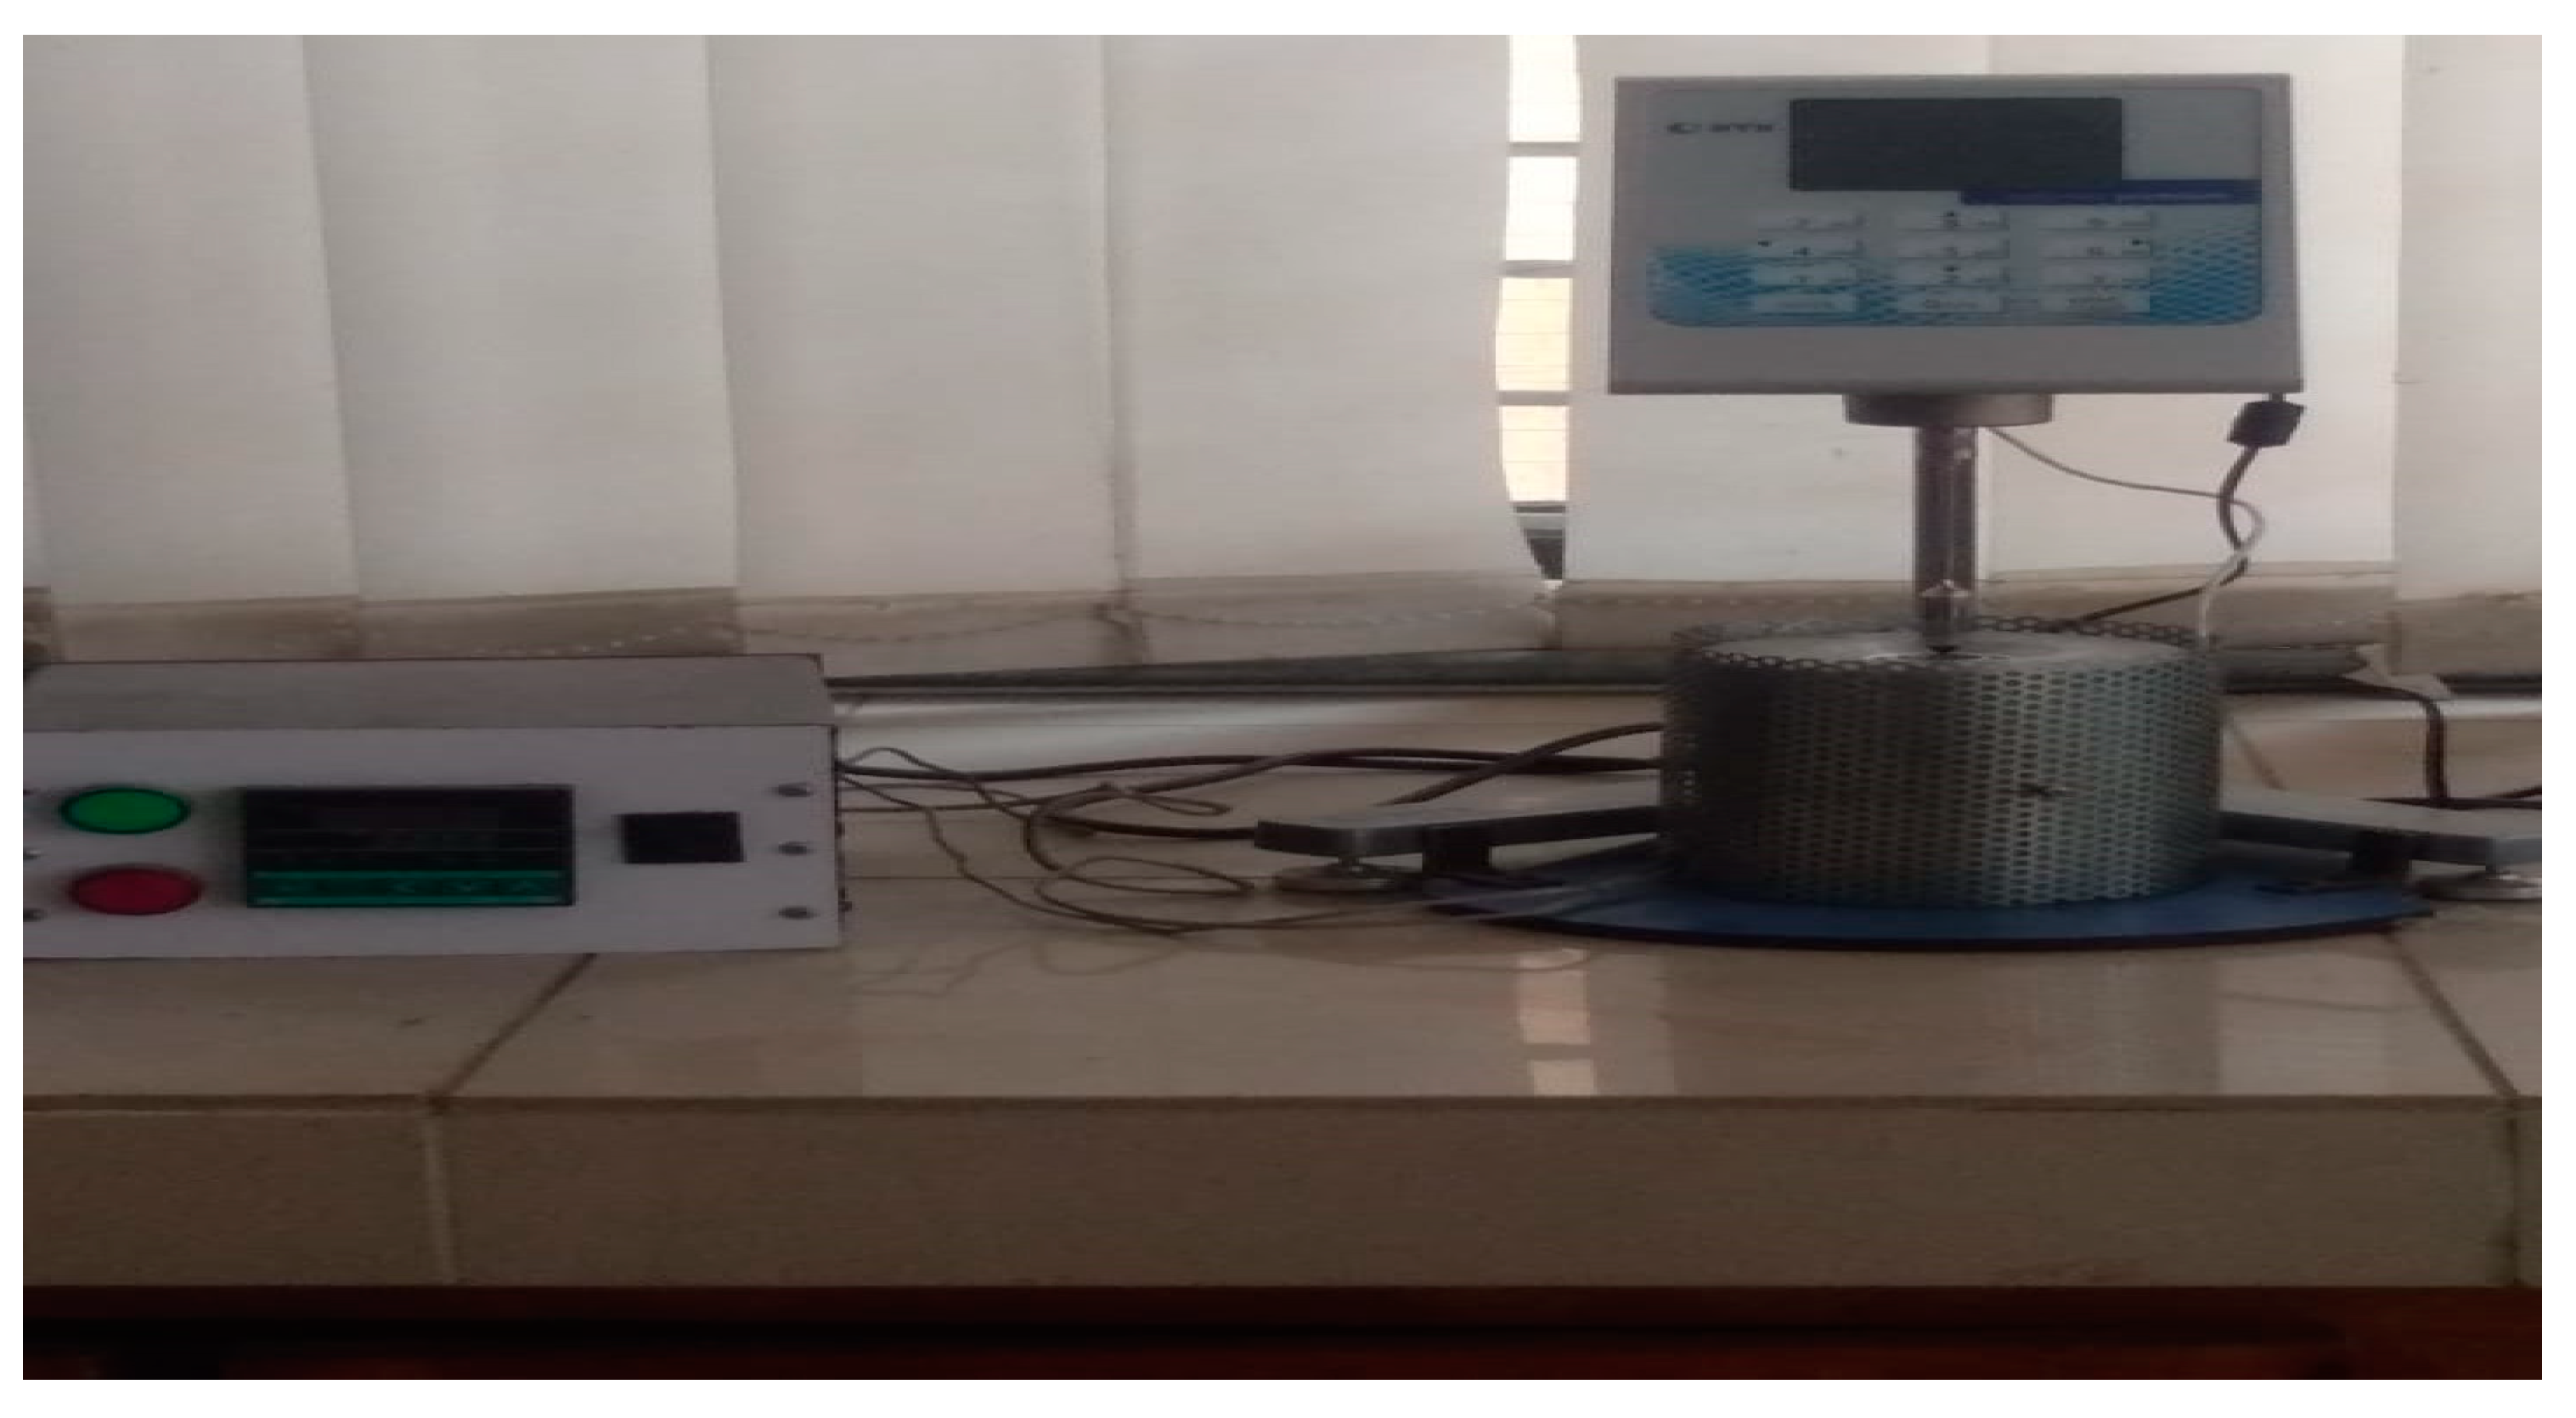
| Sr. No | Nano Clay % | Average Viscosity | Average torque (%) | Nano Clay % | Average Viscosity | Average torque (%) |
| 1 | 0 | 353.3 | 4.7 | 0 | 342.3 | 3.5 |
| 2 | 3 | 391.6 | 4.5 | 3 | 394.6 | 2.7 |
| 3 | 3.5 | 417.9 | 4.2 | 3.5 | 417.5 | 2.1 |
| 4 | 4 | 456.6 | 3.7 | 4 | 434.8 | 1.5 |
| 5 | 4.5 | 495.2 | 2.9 | 4.5 | 463.9 | 1.2 |
| 6 | 5 | 488.7 | 3.2 | 5 | 456.2 | 1.3 |
| N.R.L 60/70 with N.C | N.R.L 80/100 with N.C | |||||||||||
|---|---|---|---|---|---|---|---|---|---|---|---|---|
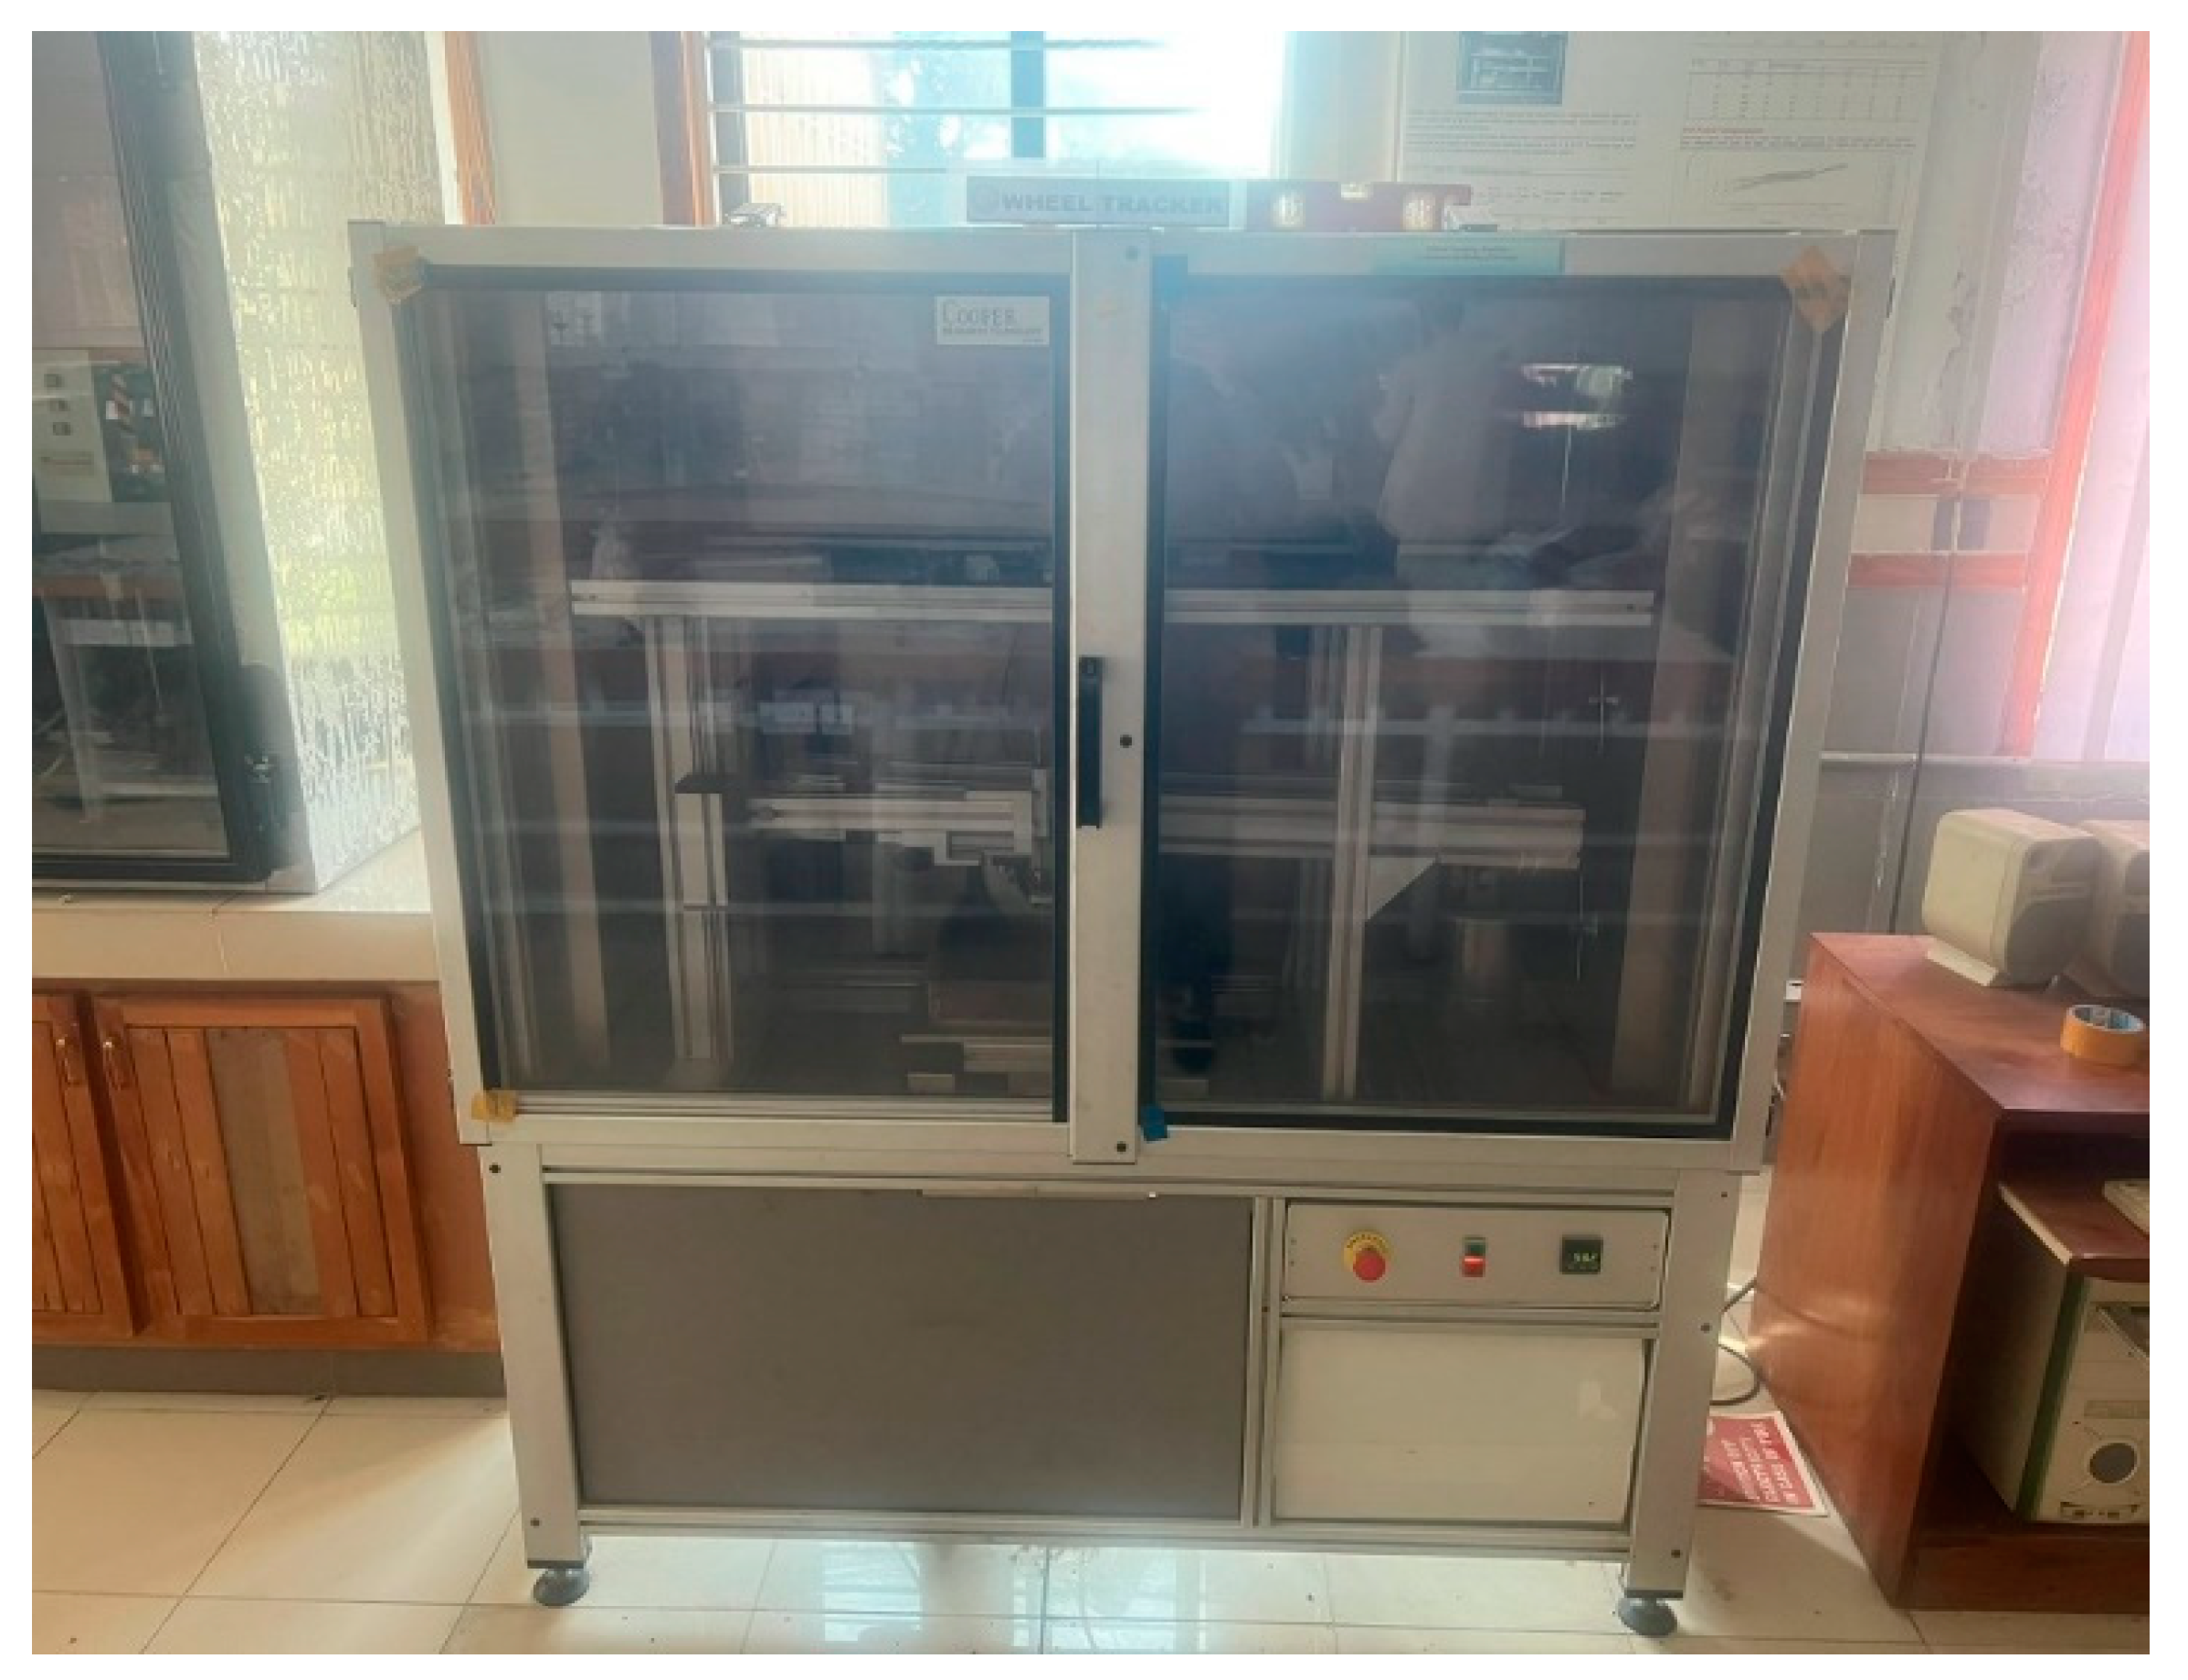
| No. of Passes | 3 | 3.5 | 4 | 4.5 | 5 | Virgin | 3 | 3.5 | 4 | 4.5 | 5 | Virgin |
| 0 | 0 | 0 | 0 | 0 | 0 | 0 | 0 | 0 | 0 | 0 | 0 | 0 |
| 500 | 0.31 | 0.28 | 0.27 | 0.2 | 0.11 | 0.5 | 0.39 | 0.35 | 0.27 | 0.2 | 0.11 | 0.49 |
| 1000 | 0.59 | 0.52 | 0.49 | 0.36 | 0.22 | 0.91 | 0.71 | 0.64 | 0.49 | 0.36 | 0.22 | 0.89 |
| 1500 | 0.8 | 0.7 | 0.6 | 0.41 | 0.29 | 1.13 | 0.88 | 0.78 | 0.6 | 0.41 | 0.29 | 1.09 |
| 2000 | 0.97 | 0.82 | 0.68 | 0.43 | 0.32 | 1.26 | 0.97 | 0.84 | 0.68 | 0.43 | 0.3 | 1.18 |
| 2500 | 1.09 | 0.91 | 0.75 | 0.47 | 0.38 | 1.37 | 1.09 | 0.91 | 0.75 | 0.47 | 0.31 | 1.29 |
| 3000 | 1.18 | 0.99 | 0.79 | 0.49 | 0.39 | 1.45 | 1.18 | 0.99 | 0.79 | 0.49 | 0.35 | 1.35 |
| 3500 | 1.27 | 1.05 | 0.81 | 0.51 | 0.41 | 1.52 | 1.28 | 1.05 | 0.81 | 0.5 | 0.38 | 1.4 |
| 4000 | 1.33 | 1.11 | 0.85 | 0.55 | 0.43 | 1.59 | 1.33 | 1.11 | 0.85 | 0.52 | 0.4 | 1.47 |
| 4500 | 1.39 | 1.15 | 0.89 | 0.59 | 0.45 | 1.68 | 1.4 | 1.14 | 0.89 | 0.55 | 0.44 | 1.55 |
| 5000 | 1.45 | 1.17 | 0.91 | 0.6 | 0.47 | 1.74 | 1.46 | 1.17 | 0.91 | 0.6 | 0.49 | 1.66 |
| 5500 | 2.02 | 1.21 | 0.95 | 0.64 | 0.51 | 1.81 | 1.51 | 1.21 | 0.95 | 0.62 | 0.51 | 1.72 |
| 6000 | 1.59 | 1.26 | 0.98 | 0.67 | 0.56 | 1.89 | 1.59 | 1.26 | 0.98 | 0.67 | 0.57 | 1.81 |
| 6500 | 1.65 | 1.29 | 1.1 | 0.7 | 0.6 | 1.97 | 1.62 | 1.29 | 1.1 | 0.7 | 0.61 | 1.9 |
| 7000 | 1.69 | 1.32 | 1.05 | 0.71 | 0.62 | 2.05 | 1.69 | 1.32 | 1.05 | 0.71 | 0.68 | 1.99 |
| 7500 | 1.71 | 1.35 | 1.09 | 0.74 | 0.65 | 2.15 | 1.71 | 1.35 | 1.09 | 0.74 | 0.78 | 2.1 |
| 8000 | 1.77 | 1.39 | 1.11 | 0.76 | 0.69 | 2.25 | 1.77 | 1.39 | 1.11 | 0.76 | 0.86 | 2.21 |
| 8500 | 1.8 | 1.42 | 1.15 | 0.79 | 0.7 | 2.35 | 1.85 | 1.48 | 1.12 | 0.79 | 0.92 | 2.36 |
| 9000 | 1.84 | 1.46 | 1.17 | 0.8 | 0.74 | 2.43 | 1.99 | 1.6 | 1.17 | 0.81 | 1.01 | 2.59 |
| 9500 | 1.89 | 1.49 | 1.19 | 0.8 | 0.82 | 2.51 | 2.21 | 1.89 | 1.38 | 0.94 | 1.14 | 2.95 |
| 10000 | 1.93 | 1.5 | 1.2 | 0.81 | 0.93 | 2.6 | 2.5 | 2.2 | 1.6 | 1.1 | 1.3 | 3.4 |
| ANOVA | |||||
|---|---|---|---|---|---|
| Rutting | |||||
| Sum of Squares | df | Mean Square | F | Sig. | |
| Between Groups | 5.920 | 5 | 1.184 | 7.478 | .015 |
| Within Groups | .950 | 6 | .158 | ||
| Total | 6.870 | 11 | |||
Disclaimer/Publisher’s Note: The statements, opinions and data contained in all publications are solely those of the individual author(s) and contributor(s) and not of MDPI and/or the editor(s). MDPI and/or the editor(s) disclaim responsibility for any injury to people or property resulting from any ideas, methods, instructions or products referred to in the content. |
© 2023 by the authors. Licensee MDPI, Basel, Switzerland. This article is an open access article distributed under the terms and conditions of the Creative Commons Attribution (CC BY) license (http://creativecommons.org/licenses/by/4.0/).


