Preprint
Article

Integrated Analysis of the Effects of Cecal Microbiota and Serum Metabolome on Market Weights of Chinese Native Chickens

Altmetrics

Downloads

130

Views

29

Comments

0

A peer-reviewed article of this preprint also exists.

Submitted:

08 August 2023

Posted:

09 August 2023

You are already at the latest version

Alerts
Abstract
The gut microbiota plays an important role in the physiological activities of the host and affects the formation of important economic traits in agricultural animals. We investigated the effects of cecal microbiota on chicken weights using the Guizhou yellow chicken as a model. We collected experimental cohorts from chickens with high (HC, n=16) and low body weights (LC, n=16) and integrated microbial 16S rRNA gene sequencing and non-targeted serum metabolome data to explore the effect and its metabolic mechanism of cecal microbiota on market weight. The genera Lachnoclostridium, Alistipes, Negativibacillus, Sellimonas and Ruminococcus torques group were enriched in the HC group while Phascolarctobacterium was enriched in the LC group (P<0.05). Metabolomic analysis determined that pantothenic acid, luvangetin (2H-1-benzopyran-6-acrylic acid) and menadione (vitamin K) were significantly higher in HC serum while beclomethasone dipropionate (a glucocorticoid) and chlorophene (2-benzyl-4-chlorophenol) were present at higher levels in the LC group. The microbes enriched in HC that were significantly positively correlated with metabolites including pantothenic acid and menadione and negatively correlated with beclomethasone dipropionate and chlorophene. These results indicated that specific cecal bacteria in Guizhou yellow chickens alter the host metabolism and growth performance. This study provides a reference for revealing the mechanism of cecal microbe actions that affect chicken body weight.
Keywords: 
Subject: Biology and Life Sciences  -   Animal Science, Veterinary Science and Zoology

Introduction

Chicken meat is a major protein source throughout the world [1] and the improvement of chicken production performance is necessary to meet increasing demand. Market weight is a key growth trait in chickens [2] that can be scientifically altered. High market weight can increase the turnover in the chicken production pen, reduce labor costs and bring direct economic benefits to farmers. In spite of numerous studies focused on unraveling the mechanisms for market weight increases, this complex economic trait has yet to be fully understood [3,4,5].
The gut microbiome influences host metabolism [6], immune responsiveness [7] as well as feeding behavior [8]. These processes are potential mechanisms through which the gut microbiome affects chicken growth traits. For example, the presence of Lachnospiraceae in the cecum was found to be related to high growth performance (body weight) for chickens while the presence of Escherichia had the opposite effect [9]. Cecal microbiome possessing Microbacterium and Sphingomonas in Turpan gamecock progeny×White Leghorn chickens were significantly correlated with high body weight while Slackia was enriched in the ceca of low-weight chickens [10]. In addition, high Lactobacilli abundance in the chicken jejunum was beneficial to growth while Comamonas enrichment produced a negative outcome on growth rates [11]. The addition of exogenous Bacillus subtilis and Bacillus licheniformis to chicken feed also promoted growth performance [12,13]. Together, studies such as these have indicated that gut microbes are an important factor affecting growth performance in chickens. However, the conclusions have not been completely consistent in determining which microbes produce the greatest effect on chicken growth performance.
Relationships between the gut microbiome and growth performance in chickens have been also linked to gender [14], induction of inflammatory factors [11,15]and regulation of fat metabolism [10]. Modern omics technologies and especially metabolomics have linked gut microbes to regulation of metabolite production that can profoundly alter host physiological functions and thereby affect host phenotype [6,16,17].These technologies have provided a new perspective for the analysis of the complex economic characteristics of livestock and poultry and is becoming an important means of analyzing complex traits of agricultural animals. Based on this, the mechanism of the formation and regulation of some complex traits in livestock and poultry has been revealed [18]. For example, Prevotella are a key bacterial genus that affect pig intramuscular fat deposition via production of lipopolysaccharide, branched-chain amino acids (BCAA) and arachidonic acids. This has clarified the mechanism of fat deposition in pigs [19]. Xue et al. combined rumen microbiome and metabolome methods to explore the formation mechanism of milk protein in cows and high Prevotella abundance in the rumen altered amino acid metabolism resulting in increased milk protein content. In contrast, enrichment of methanogens in the rumen was not conducive to increasing the milk protein content [20]. Therefore, the technology of integrating gut microbiome and metabolomics is helpful for the identification of key microbes related to growth traits and the analysis of their metabolic mechanisms in chickens [21,22].
The Guizhou yellow chicken is a breed of yellow-feathered broiler chicken with excellent meat quality and good flavor currently being cultivated in Guizhou Province, China. This important local breed was obtained by crossing Guizhou Weining ♀ and Golden Plymouth Rock ♂ [23] . However, this chicken does not have the high growth performance of commercial breeds. Therefore, in the current study we combined microbial 16S rDNA gene sequencing and untargeted metabolomics to explore the effect of gut microbiome on the growth performance of Guizhou yellow chickens to identify key microbes associated with market weight and preliminary explore the possible metabolic mechanisms for improved growth performance. Our results can provide new insights into the analysis of chicken growth performance and provide research references for the discovery of growth-promoting probiotics.

2. Materials and methods

2.1. Experimental animals and sample collection

Animal Care and Use Committee in Guizhou University approved this project (approval number: EAE-GZU-2022-T050). We utilized 49 Guizhou yellow chickens collected from local sources that were raised in the scientific research chicken farm of Guizhou University and provided clean water and a commercial diet ad libitum. The animals were vaccinated against Marek’s and Newcastle disease, infectious bronchitis and bursal virus according to routine immunization procedures. No antibiotics were used within one month prior to sacrifice at 18 weeks of age (general market age). At that time, the 8 roosters and 8 hens that possessed the highest body weights in the group constituted the high-weight group (HC, n=16) and a similar group was selected for the low-weight group (LC, n=16). Serum samples were collected immediately prior to sacrifice and quick-frozen in liquid nitrogen and ~2 g cecal content was collected at the same position in each chicken cecum and quick-frozen in liquid nitrogen. Serum and cecal samples for untargeted metabolomics and 16S rDNA gene sequencing were performed at Shanghai Applied Protein Technology and Shanghai Majorbio Biopharm Technology, respectively. The experimental flow chart see Figure S1.

2.2. Sequence splicing and ASV annotation

Amplicon sequencing was conducted using an Illumina MiSeq platform (Illumina, San Diego, CA, USA). The reads were first filtered and assembled into tags according to overlap relationships between the paired-end reads. Tags were then clustered into amplified sequence variants (ASV). Data was optimized using the DADA2 to obtain the representative ASV sequence and abundance information. Representative sequences of each ASV were annotated using the Silva database (https://www.arb-silva.de/) with a taxonomic confidence level of 0.7.

2.3. Extraction of serum samples

Serum samples were thawed at 4 °C and an appropriate amount was added to pre-cooled a methanol/acetonitrile/water solution (2:2:1, v/v) and vortexed and ultrasonicated at low temperature for 30 min and kept at -20 °C for 10 min. Samples were then centrifuged at 14 000 × g at 4 °C for 20 min. Supernatants were transferred into clean tubes and dried under vacuum and the residue was suspended in 100 μL 50 % acetonitrile for UPLC-QTOF/MS analysis.

2.4. Chromatography-mass spectrometry analysis

2.4.1. Chromatographic conditions

Sample compunds were separated using an Agilent (Santa Clara, CA, USA) 1290 Infinity LC ultra-high performance liquid chromatography system using a hydrophilic interaction (HILIC) column using the mobile phases as follows: A (25 mM ammonium acetate and 25 mM ammonia in H2O) and B (acetonitrile). The gradient elution procedure as follows: 0-0.5 min, 95% B; 0.5-7 min, B 95 to 65%; 7-8 min, B 65 to 40%; 8-9 min, B 40%; 9-9.1 min, B 40 to 95%; 9.1-12 min, B 95%. During this process, the proportion of mobile phase A changed accordingly. Samples were placed in an autosampler tray at 4℃. QC samples were inserted into the samples queues to monitor and evaluate the stability of the system and the reliability of experimental data.

2.5. Statistical analysis

2.5.1. Analysis of microbiota diversity and composition differences

Analysis for taxonomic clusters utilized the ASVs and quality control was carried out under with the conditions of relative abundance > 0.05% and detection of ASV in > 80% of the samples [24]. ASV α-diversity was identified using Shannon, Simpson, Chao1, Faith’s phylogenetic diversity (PD) and ACE indices that were calculated using Mothur software v 1.31.2 [25]. The Wilcoxon rank sum test was used to compare α-diversity differences between two groups. Principal coordinates analysis (PCoA) [26] was performed to evaluate the discrepancy of the phylogenetic compositions of cecal microbiota between HC and LC. Linear discriminant analysis with difference contribution analysis (LEfSe) was performed with LDA>2 and P<0.05 as thresholds to identify bacterial composition differences between two groups.

2.5.2. Construction of cecal microbial co-abundance groups

The quality-controlled ASVs were used to construct co-abundance groups (CAGs) of cecal microbiota. The correlation matrix between ASVs was calculated based on the SparCC algorithm [27] using the SpiecEasi package in the R. Paired ASVs with a correlation coefficient >0.5 were used for further analyses. The correlation coefficient values were converted into correlation distances (1-correlation coefficient) and ASVs were clustered into CAGs based on the Ward algorithm with the Vegan package in the R. Cytoscape v 3.9.1[28] was used for visualization of cecal microbiota CAGs.

2.5.3. Serum metabolomics analysis

The online analysis platform MetaboAnalyst 5.0 (https://www.metaboanalyst.ca/) was used to conduct partial least squares discriminant analysis (PLS-DA) and metabolite enrichment analysis on the serum metabolome. Correlations between differential microbiota and differential serum metabolites were analyzed using Spearman’s rank coefficient.

3. Results

3.1. Growth performance of the study chickens

The weight gain trends for the HC and LC groups of chickens was consistent from 0 to 18 weeks of age when the animals were provided with identical environments and feed and water access. We found no significant difference in body weights between the two groups from 0 to 6 weeks of age. In contrast, from week 8 onwards, body weight differences reached the level of statistical significance (P < 0.05) (Figure 1a). By 18 weeks of age, the body weights for HC (2187.81±232.58 g) were significantly (P<0.01) greater that the LC group (1817.69±199.30 g) (Figure 1b and Table S1).

3.2. Cecal microbial diversity in high versus low weight chickens

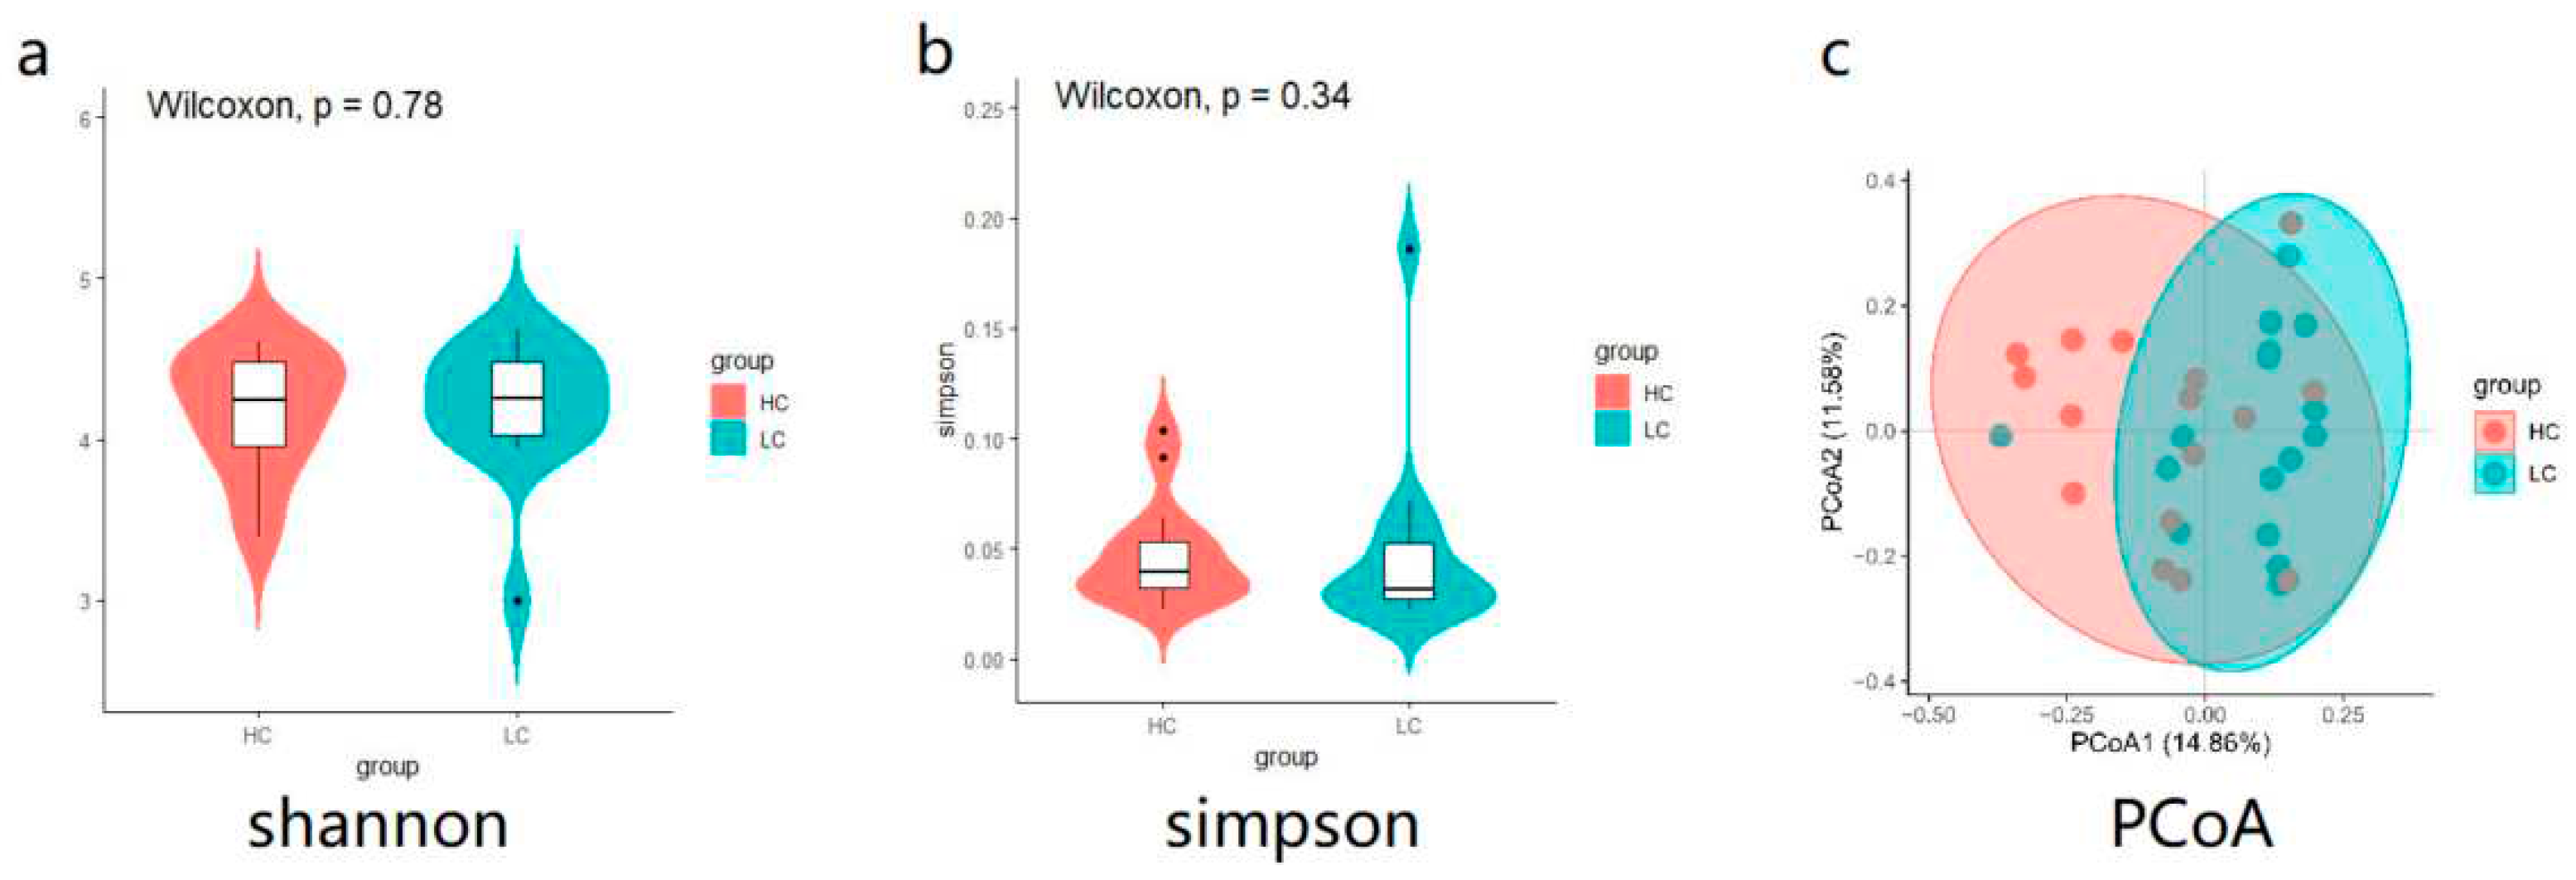
A total of 32 microbial DNA samples from HC and LC chickens were used for 16S rDNA gene sequencing and 1,535,941 clean reads were generated after QC and 1955 ASVs were identified for all samples (Table S2). We found no significant differences for the Shannon and Simpson of α-diversity indices between the two groups (Figure 2a,b). PCoA analysis showed a lack of significant differences in β-diversity of the HC and LC cecal microbiota although a certain aggregation effect was evident (Figure 2c).

3.3. Bacteria differentially abundant in HC versus LC

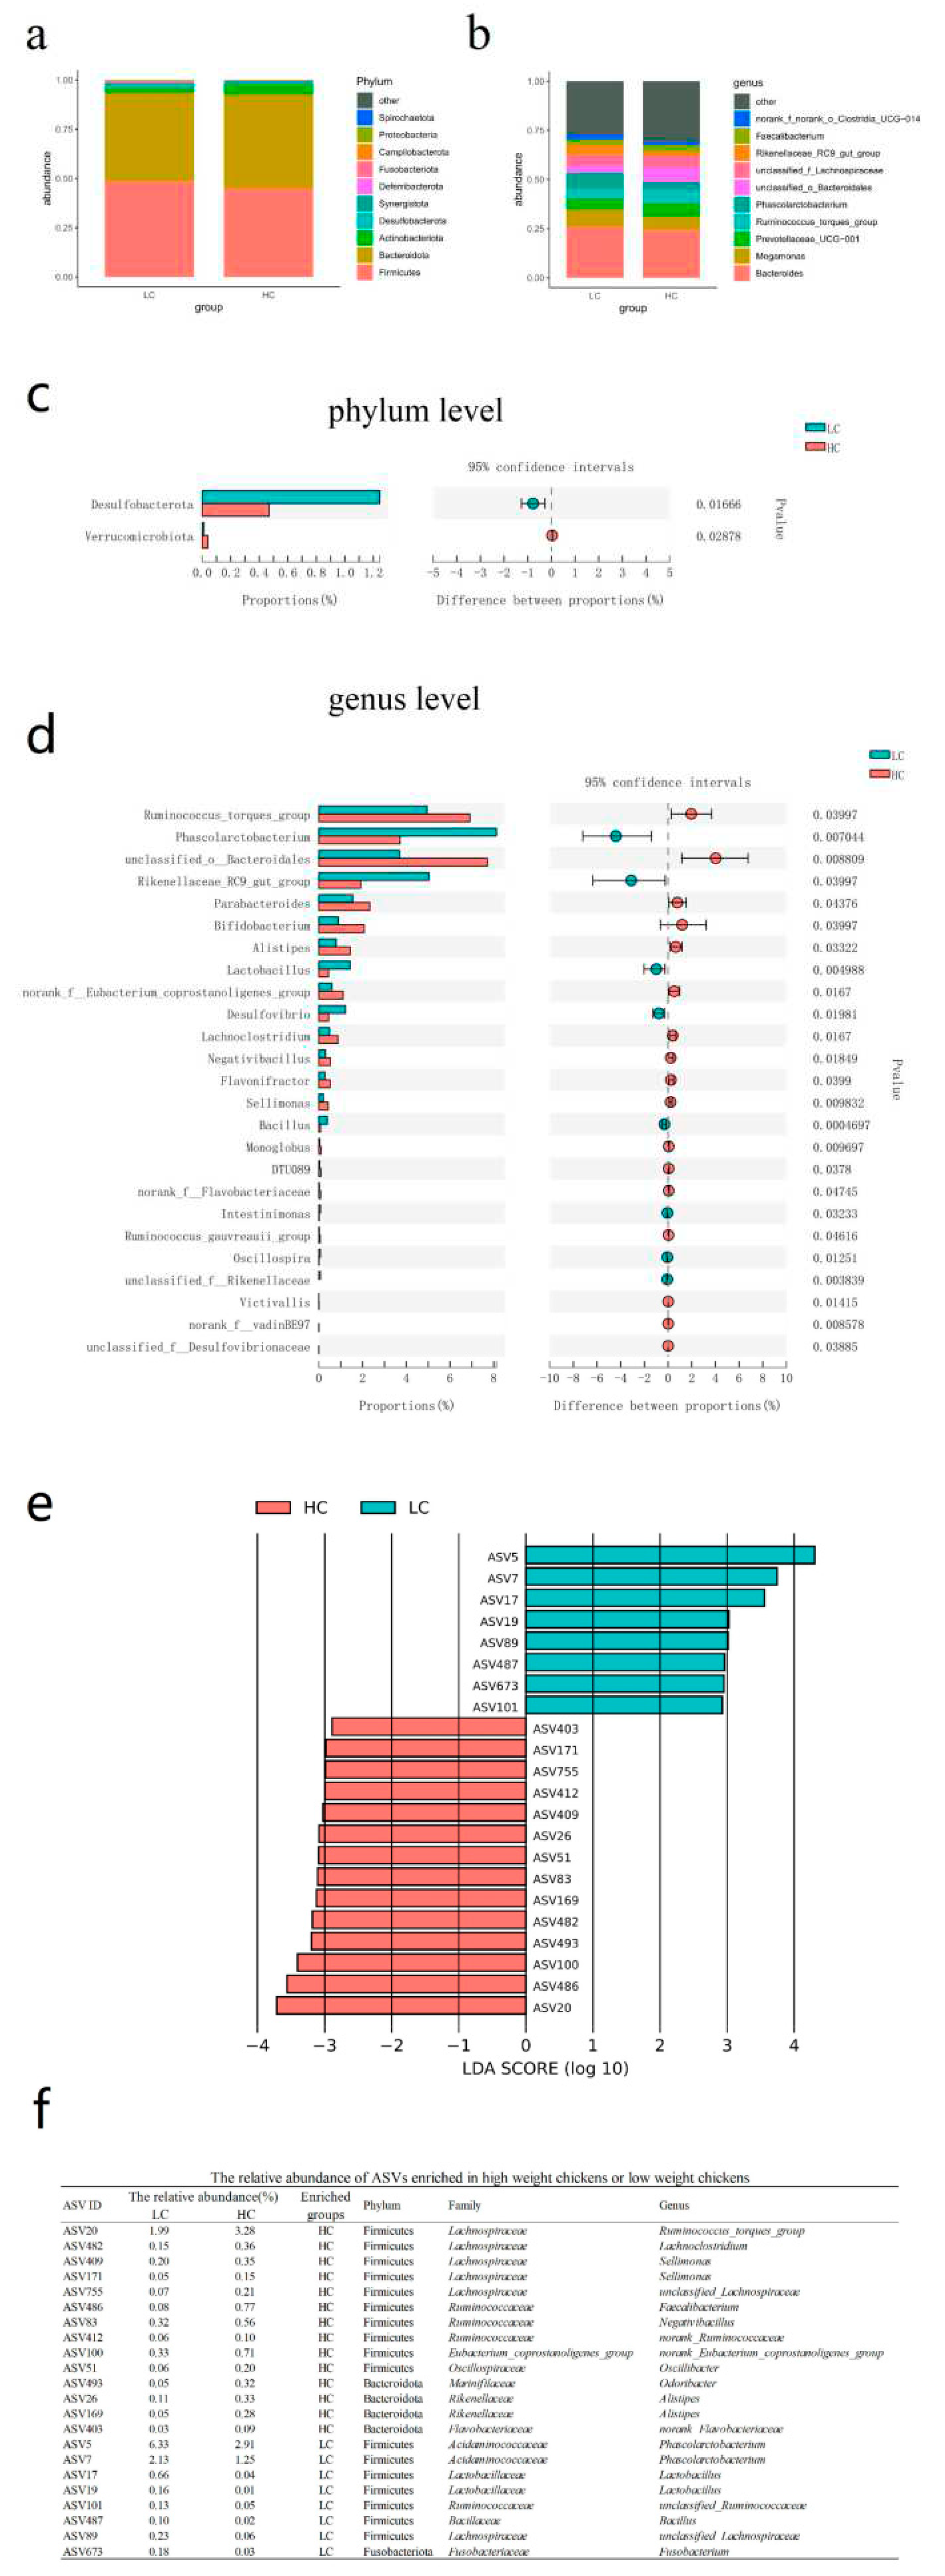
At the phylum level and based on relative abundance, the cecal microbiota of the Guizhou yellow chicken was primarily composed Firmicutes (46.88%), Bacteroidota (46.28%), Actinobacteriota (3.91%), Desulfobacterota (0.86%) and Synergistota (0.85%) (Figure 3a and Table S3). A comparison based on abundance for HC and LC indicated that Verrucomicrobiota were present at significantly higher levels in HC (Wilcoxon test, P = 0.017) while Desulfobacterota were significantly (P=0.029) higher in the LC group (Figure 3c and Table S4). At the genus level, the dominant bacteria were Bacteroides (25.15%), Megamonas (8.05%), Prevotellaceae UCG-001 (5.98%), Ruminococcus torques group (5.93%) and Phascolarctobacterium (5.92%) (Figure 3b). A comparision by abundance for HC and LC identified 17 genera. In the HC group, the most abundant were Ruminococcus torques group, unclassified Bacteroidales, Parabacteroides, Bifidobacterium and Alistipes. The LC group were enriched in 8 genera including Phascolarctobacterium, Rikenellaceae RC9 gut group, Lactobacillus, Desulfovibrio and Bacillus (Figure 3d).
We further explored the characteristics of the cecal microbiota for the LC and HC groups at the ASV level using LEfSe analysis. We confirmed that 22/223 ASVs displayed differential abundances and 8 ASVs were significantly enriched in LC and 14 were significantly enriched in HC (LDA>2, P <0.05). Again, Ruminococcus torques group (ASV20), Alistipes (ASV26, ASV169), Lachnoclostridium (ASV482) were enriched in HC and Phascolarctobacterium (ASV5, ASV7), Lactobacillus (ASV17, ASV19) and Bacillus (ASV487) were enriched in LC and also displayed significant differences at the genus level (Figure 3e,f).

3.4. Identification of co-abundance groups (CAG) associated with body weight

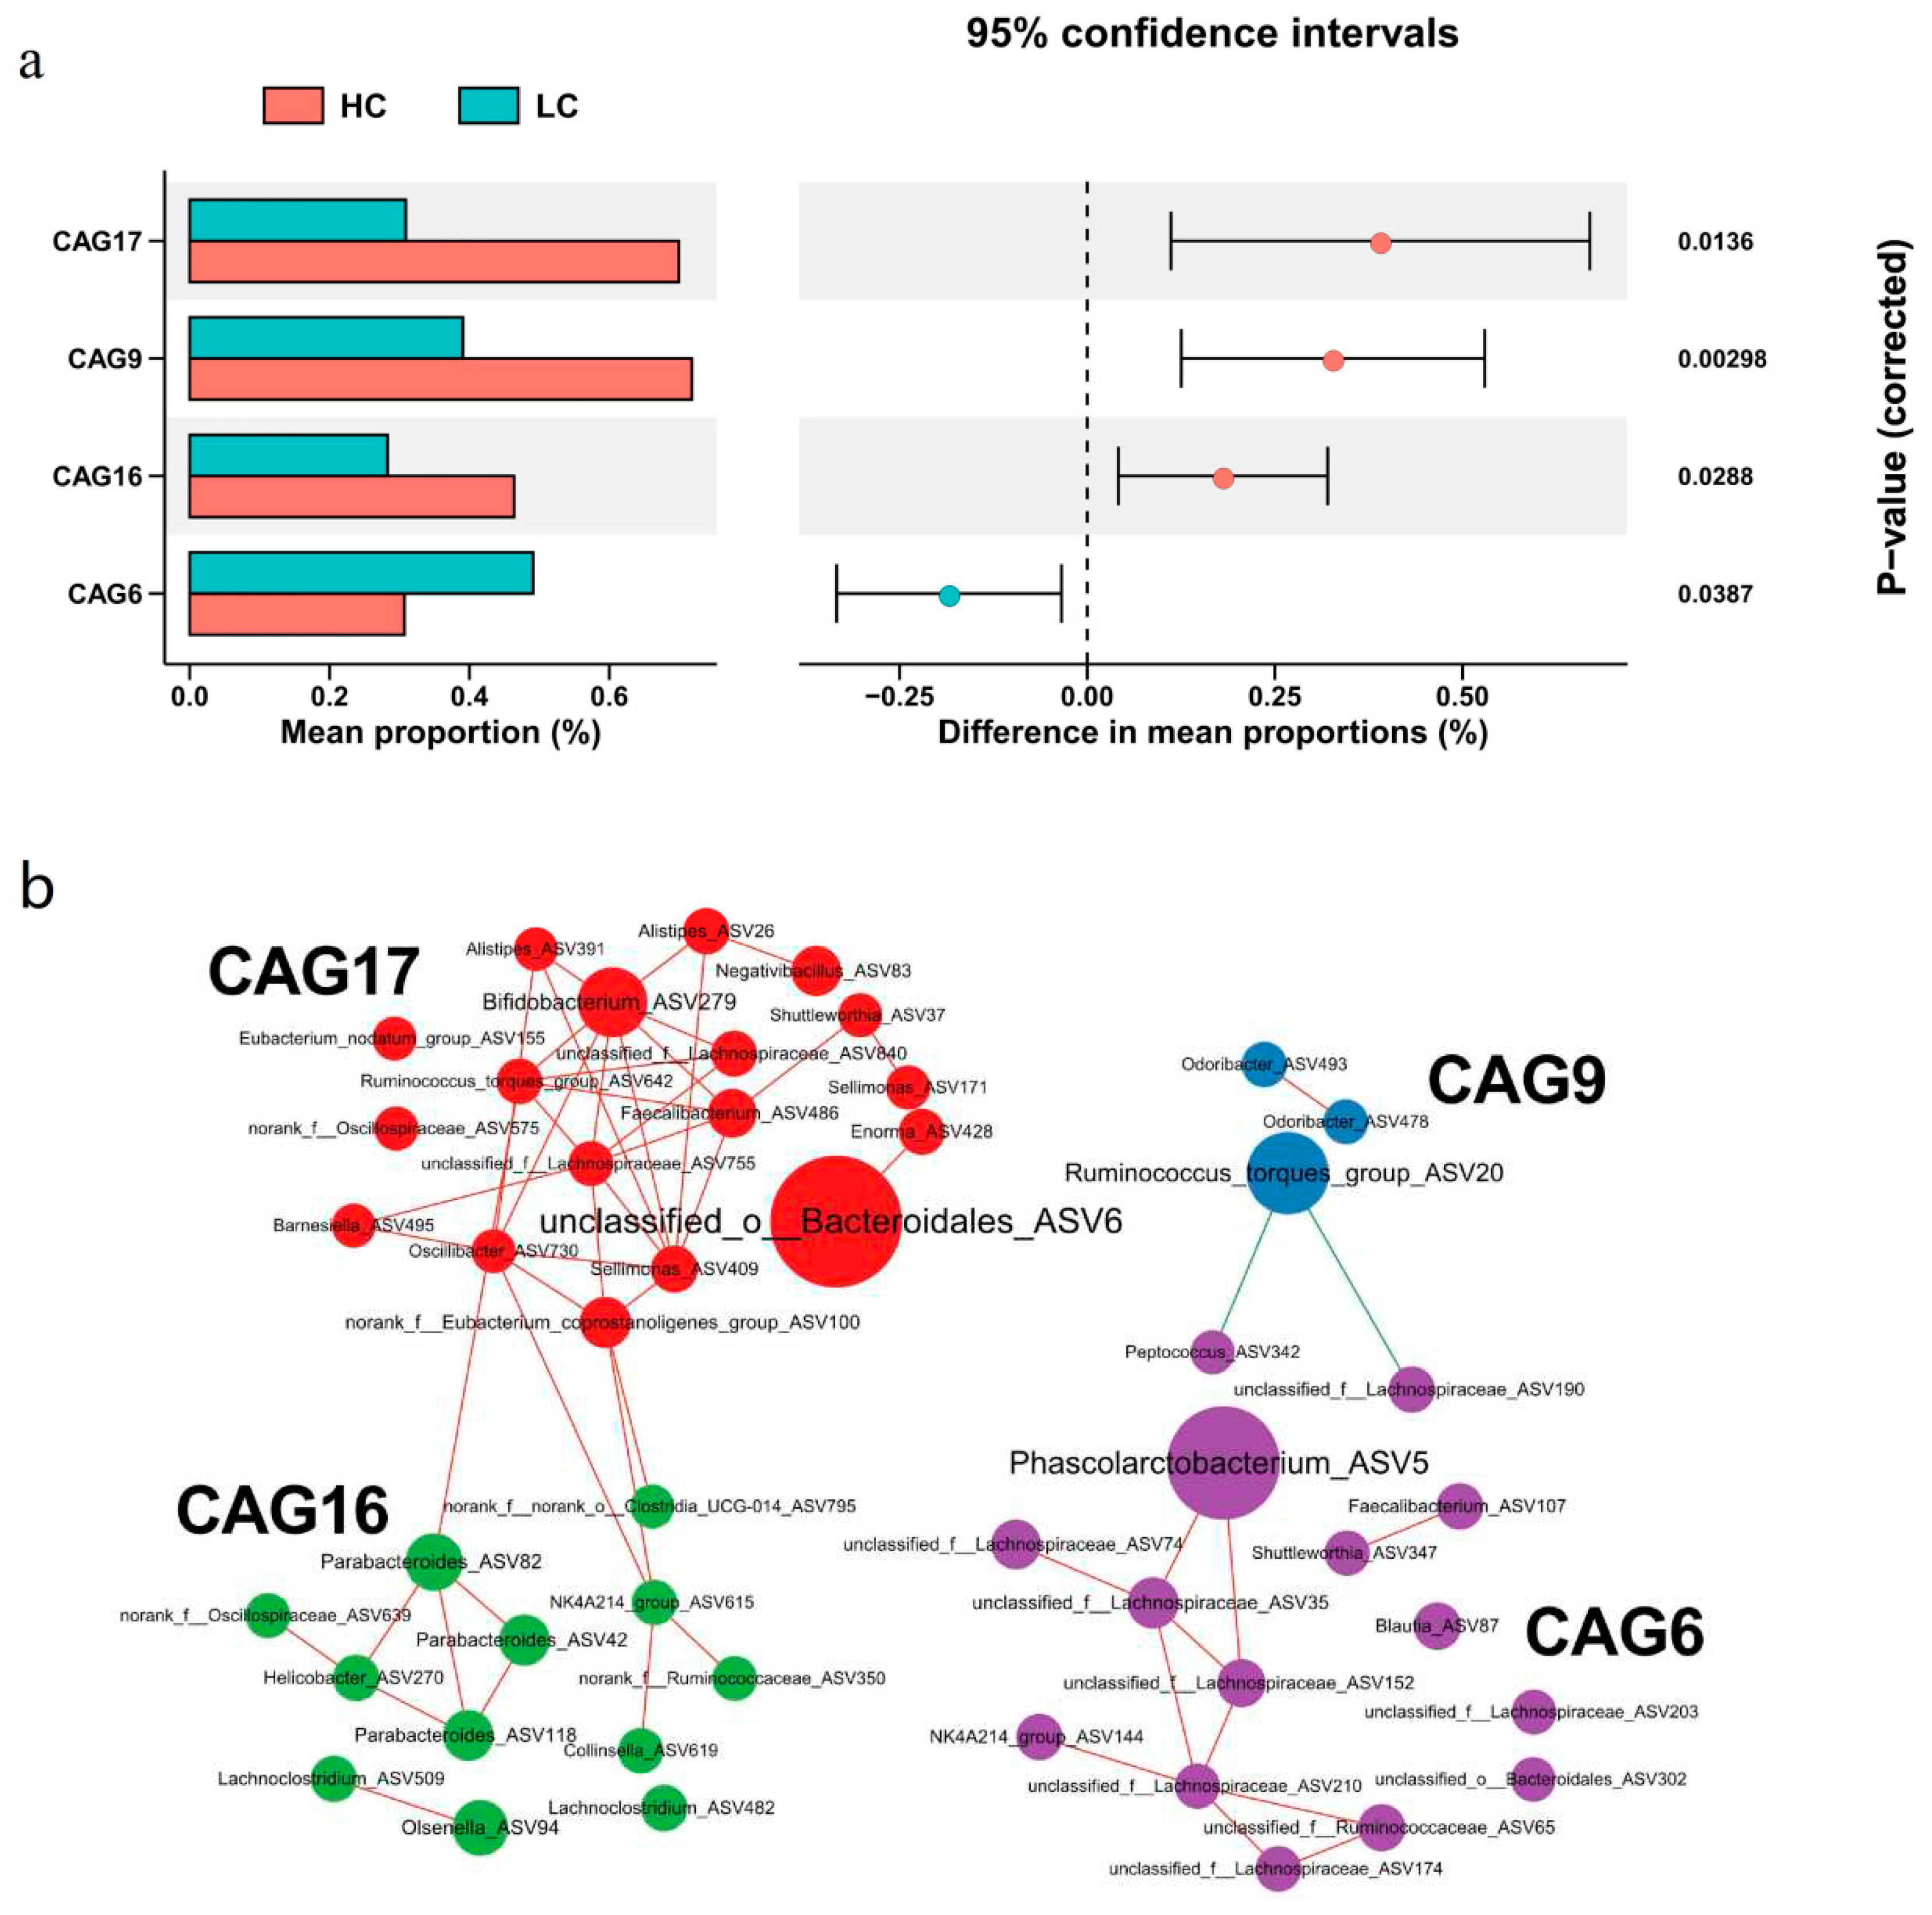
Another goal of this study was to explore the gut microbiota clusters associated with chicken body weight [29]. We therefore clustered the identified 223 ASVs into 20 CAGs and compared the average relative abundance of each CAG between groups using the Wilcoxon test. We found 4 CAGs that significantly differed between the two groups: CAG6, CAG9, CAG16 and CAG17 (Figure 4a). CAG6 was enriched in LC and contained 22 ASVs and Phascolarctobacterium ASV5 was the most enriched in LC. This suggested that CAG6 with Phascolarctobacterium as the core has a potential negative effect on growth performance. In contrast, CAG17 was enriched in HC and included Ruminococcus torques group ASV642, Bifidobacterium ASV279, Alistipes ASV26, Alistipes ASV239 and others. In addition, CAG9 was centered on Ruminococcus torques group ASV20 while CAG16 contained bacteria such as Parabacteroides that were enriched in HC at the genus level (Figure 4b and Table S5).

3.5. Differential serum metabolites between HC and LC

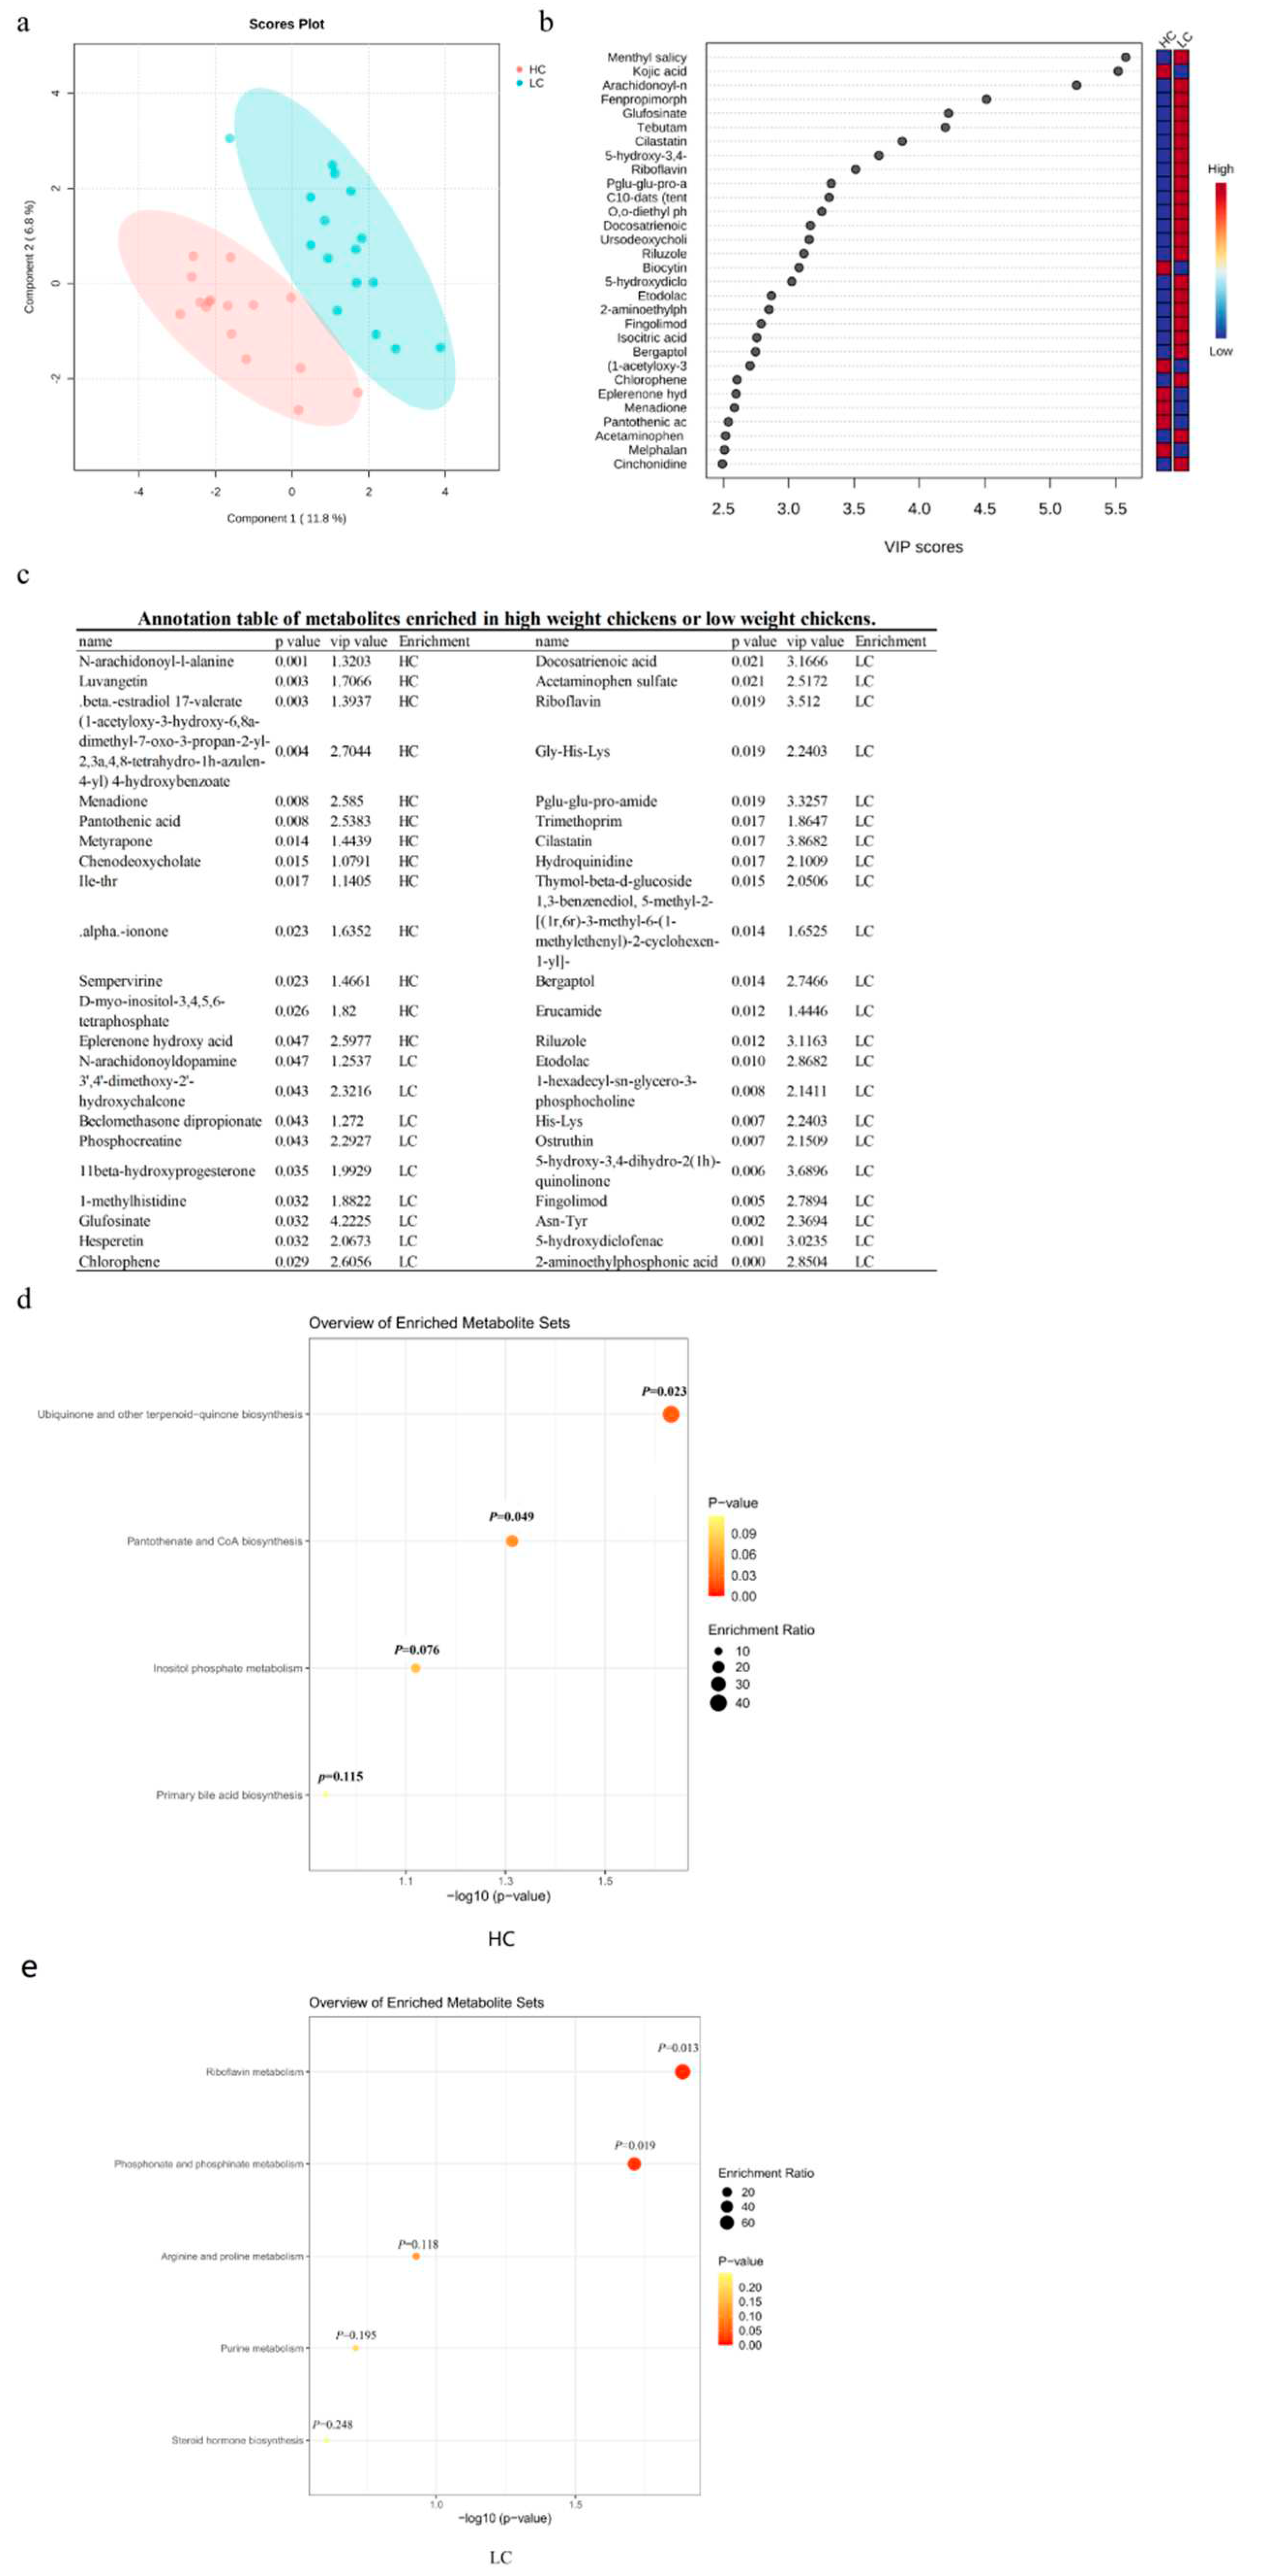
Untargeted metabolome assays were performed on serum samples from all 32 chickens and a total of 766 annotated serum metabolites were detected including 494 positive ion metabolites and 272 negative ion metabolites. Metabolomics data analysis was performed on the MetaboAnalyst 5.0 online platform and the PLS-DA results indicated that the metabolites of HC and LC were significantly separated (Figure 5a). The metabolites annotated by the positive and negative ion modes were combined and the differential metabolites were compared at a threshold of VIP>1, P<0.05. There were 44 metabolites showing significant differences between two groups and included 13 metabolites such as pantothenic acid, luvangetin (2H-1-benzopyran-6-acrylic acid), metyrapone (methyl-1,2-di-pyridyl-1-propanone) and sempervirine (16,17,18,19-tetrahydroyohimban) that were at higher levels in group HC. In LC, we identified 31 significant metabolites including phosphocreatine, glufosinate (2-amino-4-[hydroxy(methyl)phosphoryl] butanoic acid), hesperetin ((2S)-5,7-dihydroxy-2-(3-hydroxy-4-methoxyphenyl)-2,3-dihydrochromen-4-one and chlorophene (2-benzyl-4-chlorophenol) (Figure 5b,c). We then performed pathway enrichment analysis with these differential metabolites and in the HC group four metabolic pathways were enriched including ubiquinone and other terpenoid-quinone biosynthesis, pantothenate and CoA biosynthesis (Figure 5d). In group LC, 5 metabolic pathways were enriched including riboflavin metabolism, phosphonate and phosphinate metabolism (Figure 5e).

3.6. Correlation analysis reveals relationships between the cecal microbiota and serum metabolites

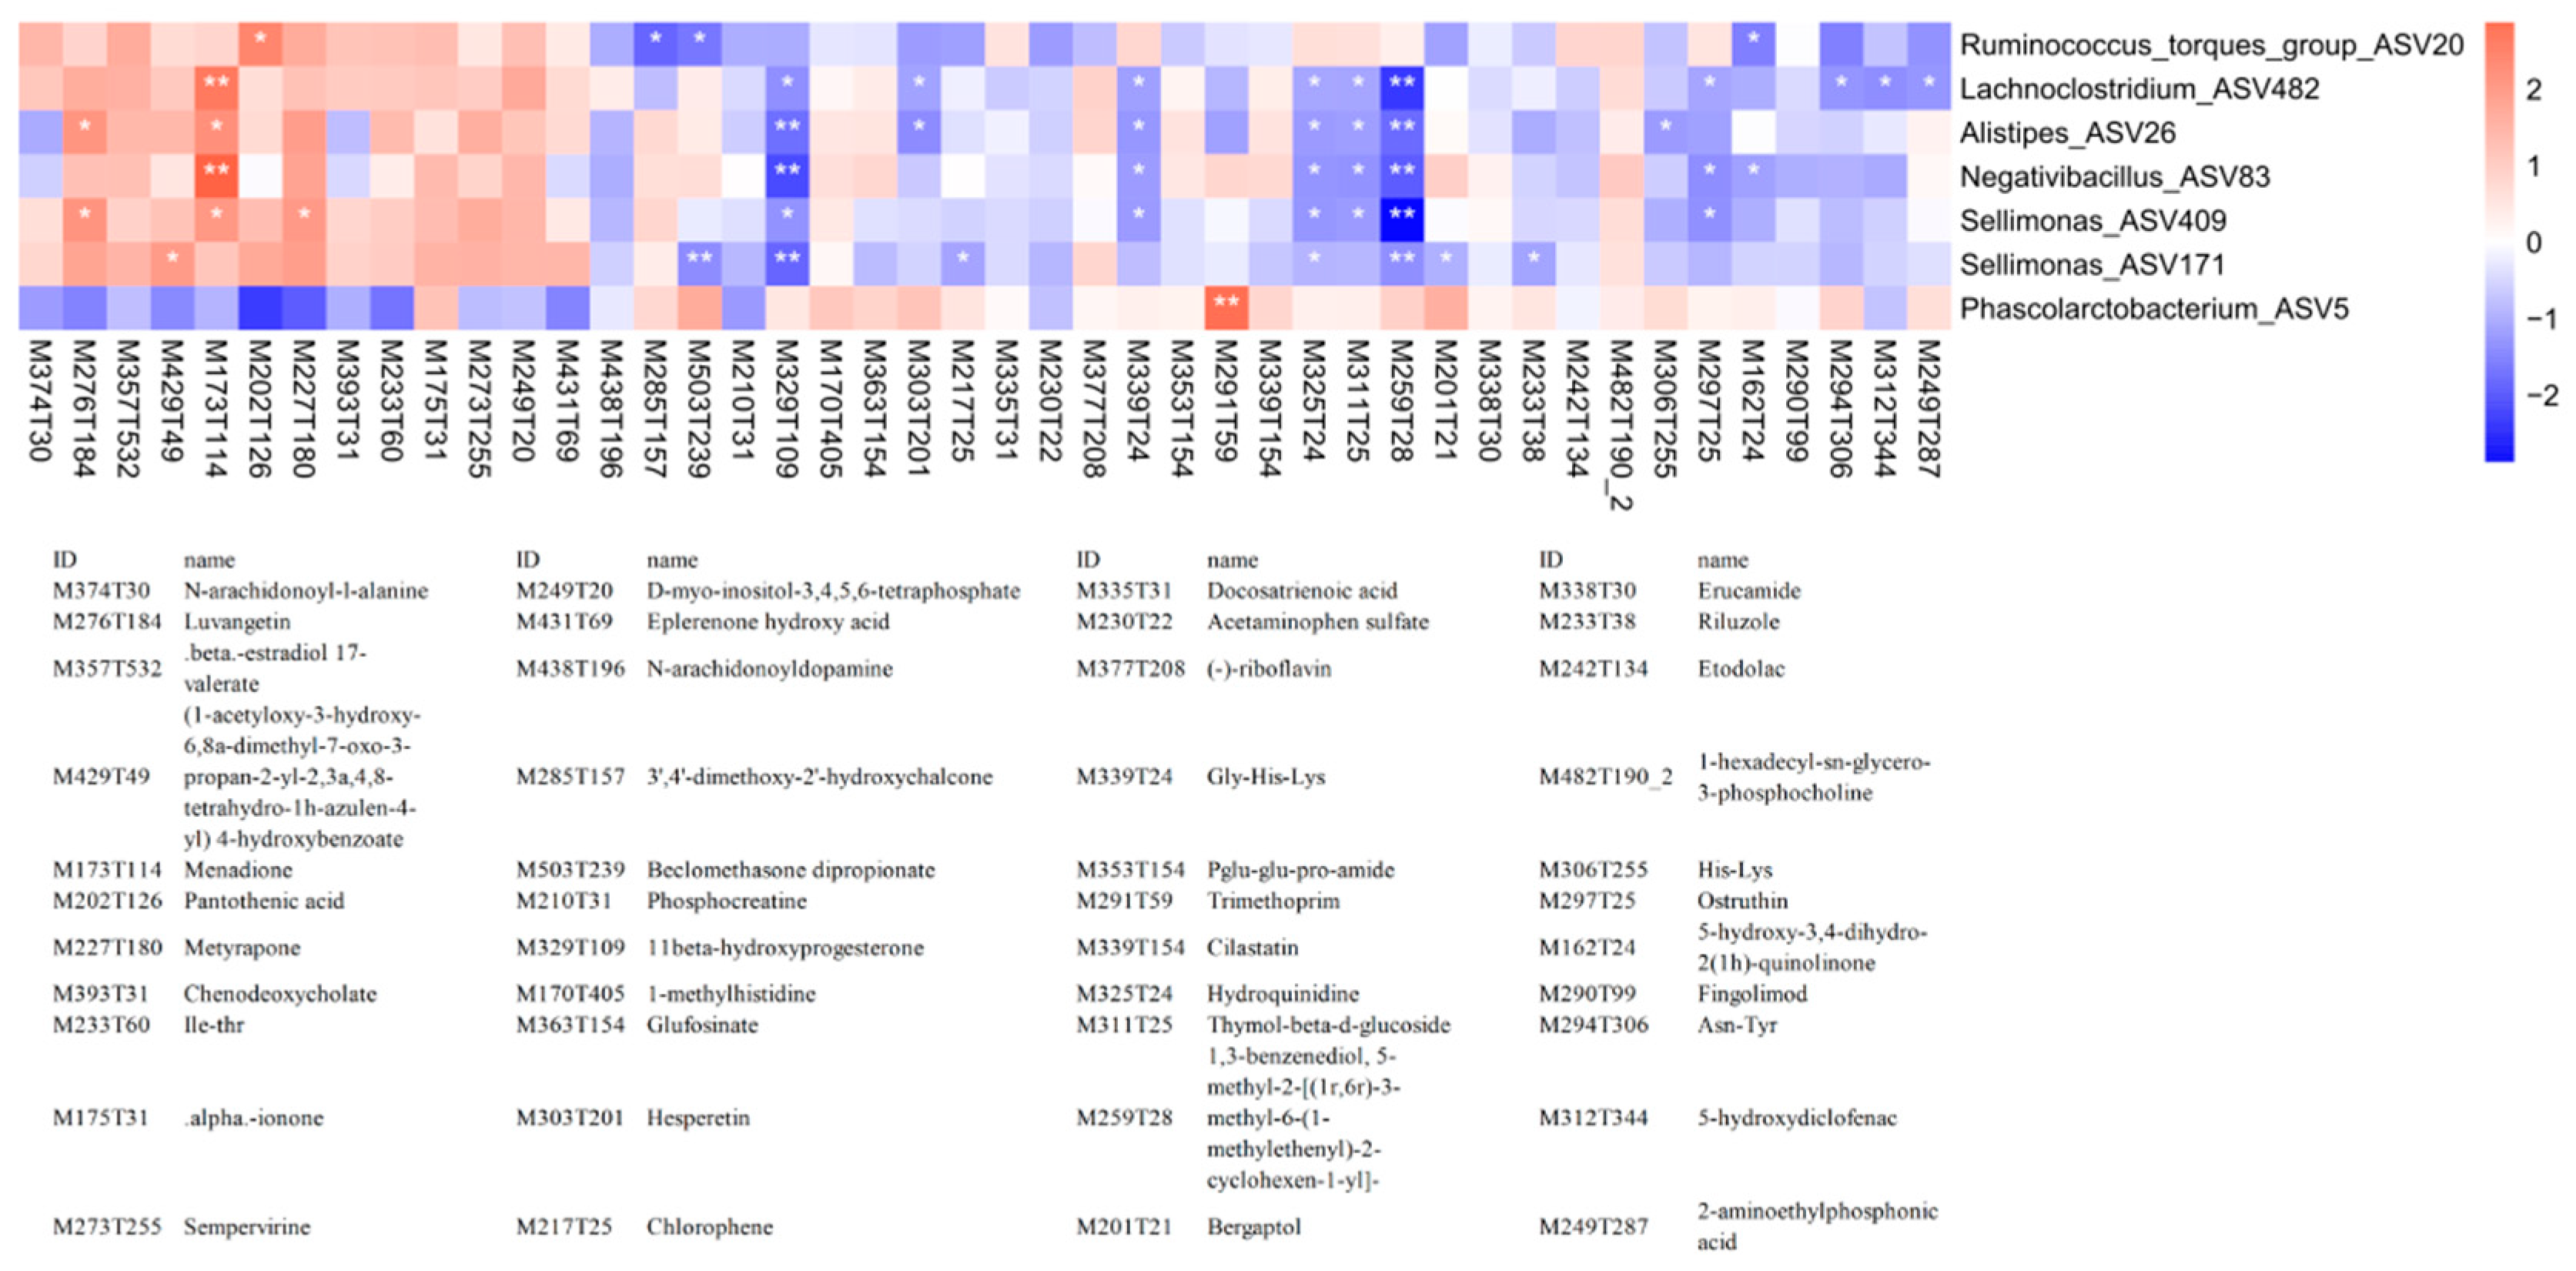
We next integrated the differential bacteria at the ASV, genus and CAG levels. The Ruminococcus torques group, Lachnoclostridium, Alistipes, Negativibacillus and Sellimonas were enriched in HC and Phascolarctobacterium was enriched in LC in all analyses at three levels (Table S6). Spearman’s rank correlation analysis was then performed between these bacteria and differential metabolites and Ruminococcus torques group enriched in HC was significantly positively correlated with pantothenic acid (P = 0.029, r = 0.386). In addition, menadione in Vk3 was positively correlated with numerous bacteria enriched in HC. These included Lachnoclostridium ASV482, Alistipes ASV26, Negativibacillus ASV83 and Sellimonas ASV409, suggesting these bacteria might promote the synthesis of menadione and have beneficial effects on the growth performance of the chickens. The detailed relationships between weight-related bacteria and differential metabolites is shown in Figure 6.

4. Discussion

Growth performance is an important economic trait for chickens and the gut microbiota have been proven to play an important role in the life activities of the host. However, clear correlations between the gut microbiome and chicken growth performance have not been fully revealed. Therefore, we employed 16S rDNA sequencing to characterize the cecal microbiota profile of Guizhou yellow chickens and explored the relationship between cecal microbiota and body weight. We found that high-growth chickens exhibited distinct cecal microbiota composition characteristics compared with low-growth chickens as did serum metabolites. These results suggested that cecal microbiota dysbiosis may be an underlying reason for poor growth performance in chickens.
The composition of the gut microbiota for individual animals also varies by location within the animal and the diversity and abundance of microbiota in the cecum is the highest. Therefore, our research used representative cecal microbiota from local chickens for further research [30,31,32]. By comparing the α-diversity of cecal microbiota with in high-weight and low-weight chickens, we found that there was no significant difference between the two groups and was consistent with another report [33]. The similarity of cecal microbiota in high-weight and low-weight chickens was analyzed using PCoA. The results of β-diversity analysis displayed an aggregation effect for each group indicating common cecal microbiota characteristics in the same weight group. At the phylum level, abundance of the Verrucomicrobiota was significantly higher in the cecum of HC while Desulfobacterota was significantly less while more abundant in the LC group. These results were inconsistent with a previous study using chickens in which the phyla Bacteroidetes was more abundant in low-weight chickens and Firmicutes was more abundant in low-weight chickens [33]. This difference points out important relationships between breed, rearing methods and feed for the particular animals.
At the genus level, we identified Lachnoclostridium, Alistipes, Negativibacillus, Sellimonas and Ruminococcus torques group as characteristic bacteria associated with high body weight in chickens while Phascolarctobacterium was the key cecal genus in the low body weight chickens. This indicates an important role of these bacteria in the formation of growth traits. In particular, Lachnoclostridium was a newly defined genus that can ferment polysaccharides to produce short-chain fatty acids including butyric and acetic acids. These have anti-inflammatory effects and can promote the growth of intestinal epithelial cells and the enhancement of intestinal barrier function. Lachnoclostridium is also linked to host nutrient absorption and its reduced abundance will lead to the downregulation of functional pathways such as protein processing and nutrient transport in the host [34,35,36]. In mice, a reduced Lachnoclostridium abundance was associated with decreased body weight [37]. These beneficial effects of Lachnoclostridium on the host might be the reason for its enrichment in the cecum of high-weight chickens. Alistipes is an obligate anaerobic Gram-negative bacterium (Bacteroidetes) that can produce acetic and propionic acids. A reduction in Alistipes abundance is linked to a reduction in the levels of short-chain fatty acids. In addition, Alistipes finegoldii was specifically proven to promote the growth of broiler chickens [38,39,40]. Negativibacillus is a Gram-negative Firmicute and its abundance in the mouse gut was positively correlated with body weight gain [41]. Sellimonas is an obligate anaerobic, non-motile Gram-positive first isolated from human feces in 2016 [42]. Ruminococcus torques is an important microbe in the gut of patients with inflammatory bowel disease [43]. It has a confirmed role in digesting resistant starch and stabilizing the intestinal barrier. Nevertheless, the functions of different species of the Ruminococcus genus differed widely between reports. We found that the Ruminococcus torques group was significantly positively correlated with pantothenic acid. A specific cause and effect relationship between growth performance and pantothenic acid metabolism by this group will be the subject of subsequent experiments.
Our serum metabolome analyses identified several vitamin metabolism-related pathways that may be related to body weight including pantothenate and CoA biosynthesis that were enriched in the serum of the high body weight group. In contrast, the riboflavin metabolism pathway enriched in the low body weight group which highlights the importance of vitamin metabolic pathways for the regulation of growth traits in chicken. In the differential metabolites, pantothenic acid (Vitamin B5) and menadione (Vitamin K3) were significantly higher in the serum of high-weight chickens. Pantothenic acid is involved in the metabolism of sugar, fat and protein in both humans and animals [44]. Lack of pantothenic acid will cause growth retardation in poultry [45]. Menadione is the fully reduced form of vitamin K that possesses had strong antioxidant effects in addition to its conventional function related to coagulation as a cofactor for glutamyl carboxylase that is also required for the function of the bone matrix protein osteocalcin required for bone remodeling and growth [46]. Oxidative damage adversely affects growth performance in animals [47] and menadione enrichment in high body weight group might be directly linked to this trait but also requires further experimentation.
Interestingly, we also established an association between gut microbiota and serum metabolites. In particular, pantothenic acid and menadione were enriched in high-weight chickens and were significantly associated with a variety of high-weight-associated bacteria. For example, pantothenic acid was significantly positively correlated with Ruminococcus torques group and menadione was significantly positively correlated with Lachnoclostridium, Alistipes, Negativibacillus and Sellimonas. Metabolites enriched in low-weight chickens were primarily negatively correlated with these bacteria. These results indicated that Lachnoclostridium and other characteristic bacteria of high-weight chickens may have beneficial effects on the body by promoting the secretion or absorption of metabolites. Phascolarctobacterium was an important bacteria that we found to be enriched in the cecum of low-weight chickens. Phascolarctobacterium is an obligate anaerobic originally isolated from koala feces [48]. Another study also found that Phascolarctobacterium abundance was higher in low feed conversion chickens and was related to a low nutrient absorption capacity of the host. However, the study did not elucidate a detailed mechanism [49]. An addition study found that the abundance of Phascolarctobacterium in the gut increases when chickens are exposed to high temperatures for extended periods and this exposure also results in elevated levels of heat shock proteins and related inflammatory gene expression [50]. Heat stress altered the structure and function of enzymes in the chicken body, reduced the pH of the blood and caused metabolic acidosis. These were negative influences on chicken growth [51,52] and intestinal inflammation also decreases nutrient absorption causing body weight to drop [53,54,55]. The presence of Phascolarctobacterium was correlated with the induction of inflammation under the action of heat stress and other harmful factors in chickens. These results are consistent with our results where Phascolarctobacterium was enriched in the cecum of low-weight chickens.
In our study, we identified the cecal microbes associated with body weight and preliminarily explored the metabolic mechanism of cecal microbiota affecting growth performance in chickens. However, our research also has some limitations that should be addressed or avoided in subsequent research. Firstly, our research was a small sample, single center, cross-sectional study. Secondly, we only analyzed the cecal microbiota and serum metabolites at time of sacrifice and did not collect the samples at different growth stages. Therefore, we need to further study the causal mechanism between gut microbiota and growth traits through larger sample sizes, use a multi-center design and apply the innovative research techniques of integrated omics technology to provide a research basis for revealing the mechanism of chicken growth traits as related to the cecal microbiome.

5. Conclusions

We successfully combined 16S rRNA gene sequencing with untargeted serum metabolomics to investigate the effect of cecal microbiota composition on chicken growth performance. The genera Lachnoclostridium, Alistipes, Negativibacillus, Sellimonas, Sellimonas and Ruminococcus torques group had beneficial effects on the growth performance of chickens while Phascolarctobacterium correlated with low growth performance. A correlation analysis revealed links between specific gut microbiota and serum metabolites. Our results provide new insights into the role of gut microbiota in growth performance of chickens and also lays the foundation for the subsequent development of chicken growth-promoting probiotics or prebiotic-related products.

Supplementary Materials

The following supporting information can be downloaded at the website of this paper posted on Preprints.org. Table S1 | Body weights of the Guizhou yellow chickens at 18 weeks old used in this study. Table S2 | Sequencing results of cecal microbiota from Guizhou yellow chickens. Table S3 | Relative abundance of cecal microbiota at the phylum level. Table S4 | The relative abundance of cecal microbiota at the genus level. Table S5 | Co-abundance groups (CAGs) enriched in the high weight chickens or low weight chickens. Table S6 | The common differential bacteria groups by ASV, genus and CAG levels. Figure S1 | Experimental flow chart. Experimental cohort comprises 49 healthy Guizhou yellow chickens. 8 roosters and 8 hens that possessed the highest body weights in the group constituted the high-weight group (HC, n=16) and a similar group was selected for the low-weight group (LC, n=16). Cecal samples were collected and subjected to 16S rRNA sequencing to infer microbial profiles. Concurrent blood samples were collected to perform untargeted metabolomics detection. Cecal and serum metabolites were identified by statistical analysis.

Author Contributions

Conceptualization, Zhong Wang; Data curation, Hui Li; Formal analysis, Yongxian Yang; Funding acquisition, Zhong Wang; Investigation, Shenghong Yang, Yongxian Yang, Xiaoxia Long and Zhong Wang; Methodology, Shenghong Yang; Resources, Fuping Zhang and Zhong Wang; Supervision, Hui Li; Visualization, Shenghong Yang; Writing – original draft, Shenghong Yang; Writing – review & editing, Zhong Wang

Funding

This work was supported by the National Natural Science Foundation of China (32260829), Guizhou Provincial Science and Technology Project (QKH-ZK2022-113), the Natural Science Research Project of Guizhou Provincial Department of Education (QJJ-ZK2022-061), and Guizhou Provincial Science and Technology Project (QKH-ZC2022-key34).

Informed Consent Statement

Not applicable.

Data Availability Statement

The datasets generated from this study have been submitted to CNGB Sequence Archive (CNSA) of China National GeneBank DataBase (CNGBdb) with accession code CNP0003145.

Conflicts of Interest

The authors declare no conflict of interest.

References

  1. Gilbert, M.; Conchedda, G.; Van Boeckel, T.P.; Cinardi, G.; Linard, C.; Nicolas, G.; Thanapongtharm, W.; D'Aietti, L.; Wint, W.; Newman, S.H.; et al. Income disparities and the global distribution of intensively farmed chicken and pigs. Plos One 2015, 10, e0133381. [Google Scholar] [CrossRef] [PubMed]
  2. Mahoro, J.; Muasya, T.K.; Mbuza, F.; Mbuthia, J.; Kahi, A.K. Farmers' breeding practices and traits of economic importance for indigenous chicken in RWANDA. Trop Anim Health Prod 2018, 50, 121–128. [Google Scholar] [CrossRef] [PubMed]
  3. Deng, S.; Xing, T.; Li, C.; Xu, X.; Zhou, G. The effect of breed and age on the growth performance, carcass traits and metabolic profile in breast muscle of Chinese indigenous chickens. Foods 2022, 11, 483. [Google Scholar] [CrossRef]
  4. Li, Y.; Luo, C.; Wang, J.; Guo, F. Effects of different raising systems on growth performance, carcass, and meat quality of medium-growing chickens. J Appl Anim Res 2017, 1, 326–330. [Google Scholar] [CrossRef]
  5. Zhang, Y.; Wang, Y.; Li, Y.; Wu, J.; Wang, X.; Bian, C.; Tian, Y.; Sun, G.; Han, R.; Liu, X.; et al. Genome-wide association study reveals the genetic determinism of growth traits in a Gushi-Anka F2 chicken population. Heredity (Edinb) 2021, 126, 293–307. [Google Scholar] [CrossRef]
  6. Fujisaka, S.; Watanabe, Y.; Tobe, K. The gut microbiome: a core regulator of metabolism. J Endocrinol 2023, 256. [Google Scholar] [CrossRef] [PubMed]
  7. Shi, N.; Li, N.; Duan, X.; Niu, H. Interaction between the gut microbiome and mucosal immune system. Mil Med Res 2017, 4. [Google Scholar] [CrossRef]
  8. Trevelline, B.K.; Kohl, K.D. The gut microbiome influences host diet selection behavior. Proc. Natl. Acad. Sci. U.S.a. 2022, 119. [Google Scholar] [CrossRef]
  9. Diaz Carrasco, J.M.; Casanova, N.A.; Fernández Miyakawa, M.E. Microbiota, gut health and chicken productivity: What is the connection? Microorganisms 2019, 7, 374. [Google Scholar] [CrossRef]
  10. Zhang, X.; Hu, Y.; Ansari, A.R.; Akhtar, M.; Chen, Y.; Cheng, R.; Cui, L.; Nafady, A.A.; Elokil, A.A.; Abdel-Kafy, E.M.; et al. Caecal microbiota could effectively increase chicken growth performance by regulating fat metabolism. Microb Biotechnol 2022, 15, 844–861. [Google Scholar] [CrossRef]
  11. Zhang, X.; Akhtar, M.; Chen, Y.; Ma, Z.; Liang, Y.; Shi, D.; Cheng, R.; Cui, L.; Hu, Y.; Nafady, A.A.; et al. Chicken jejunal microbiota improves growth performance by mitigating intestinal inflammation. Microbiome 2022, 10. [Google Scholar]
  12. Xu, Y.; Yu, Y.; Shen, Y.; Li, Q.; Lan, J.; Wu, Y.; Zhang, R.; Cao, G.; Yang, C. Effects of Bacillus subtilis and Bacillus licheniformis on growth performance, immunity, short chain fatty acid production, antioxidant capacity, and cecal microflora in broilers. Poult Sci 2021, 100, 101358. [Google Scholar] [CrossRef]
  13. Fathima, S.; Shanmugasundaram, R.; Adams, D.; Selvaraj, R.K. Gastrointestinal microbiota and their manipulation for improved growth and performance in chickens. Foods 2022, 11, 1401. [Google Scholar] [CrossRef] [PubMed]
  14. Cui, L.; Zhang, X.; Cheng, R.; Ansari, A.R.; Elokil, A.A.; Hu, Y.; Chen, Y.; Nafady, A.A.; Liu, H. Sex differences in growth performance are related to cecal microbiota in chicken. Microb Pathog 2021, 150, 104710. [Google Scholar] [CrossRef]
  15. Wang, L.; Zhang, F.; Li, H.; Yang, S.; Chen, X.; Long, S.; Yang, S.; Yang, Y.; Wang, Z. Metabolic and inflammatory linkage of the chicken cecal microbiome to growth performance. Front Microbiol 2023, 14. [Google Scholar] [CrossRef]
  16. Visconti, A.; Le Roy, C.I.; Rosa, F.; Rossi, N.; Martin, T.C.; Mohney, R.P.; Li, W.; de Rinaldis, E.; Bell, J.T.; Venter, J.C.; et al. Interplay between the human gut microbiome and host metabolism. Nat Commun 2019, 10. [Google Scholar] [CrossRef]
  17. Sonnenburg, J.L.; Bäckhed, F. Diet–microbiota interactions as moderators of human metabolism. Nature 2016, 535, 56–64. [Google Scholar] [CrossRef]
  18. Schrimpe-Rutledge, A.C.; Codreanu, S.G.; Sherrod, S.D.; McLean, J.A. Untargeted metabolomics strategies-Challenges and emerging directions. J Am Soc Mass Spectrom 2016, 27, 1897–1905. [Google Scholar] [CrossRef]
  19. Chen, C.; Fang, S.; Wei, H.; He, M.; Fu, H.; Xiong, X.; Zhou, Y.; Wu, J.; Gao, J.; Yang, H.; et al. Prevotella copri increases fat accumulation in pigs fed with formula diets. Microbiome 2021, 9. [Google Scholar] [CrossRef]
  20. Xue, M.Y.; Sun, H.Z.; Wu, X.H.; Liu, J.X.; Guan, L.L. Multi-omics reveals that the rumen microbiome and its metabolome together with the host metabolome contribute to individualized dairy cow performance. Microbiome 2020, 8, 64. [Google Scholar] [CrossRef]
  21. Wang, R.; Li, B.; Lam, S.M.; Shui, G. Integration of lipidomics and metabolomics for in-depth understanding of cellular mechanism and disease progression. J Genet Genomics 2020, 47, 69–83. [Google Scholar] [CrossRef] [PubMed]
  22. Yang, Y.; Misra, B.B.; Liang, L.; Bi, D.; Weng, W.; Wu, W.; Cai, S.; Qin, H.; Goel, A.; Li, X.; et al. Integrated microbiome and metabolome analysis reveals a novel interplay between commensal bacteria and metabolites in colorectal cancer. Theranostics 2019, 9, 4101–4114. [Google Scholar] [CrossRef] [PubMed]
  23. Li, W.; Mou, T.; Rao, Y.; Yang, D.; Long, G.; Lin, J.; Fu, Z.; Zhang, F. Determination and correlation analysis of body size, slaughter performance, meat quality of Guizhou yellow chicken (in Chinese). Jiangsu Agricultural Sciences 2021, 49, 163–166. [Google Scholar]
  24. Liu, H.; Chen, X.; Hu, X.; Niu, H.; Tian, R.; Wang, H.; Pang, H.; Jiang, L.; Qiu, B.; Chen, X.; et al. Alterations in the gut microbiome and metabolism with coronary artery disease severity. Microbiome 2019, 7, 68. [Google Scholar] [CrossRef]
  25. Cole, J.R.; Wang, Q.; Cardenas, E.; Fish, J.; Chai, B.; Farris, R.J.; Kulam-Syed-Mohideen, A.S.; McGarrell, D.M.; Marsh, T.; Garrity, G.M.; et al. The Ribosomal Database Project: improved alignments and new tools for rRNA analysis. Nucleic Acids Res 2009, 37, 141–145. [Google Scholar] [CrossRef]
  26. Lozupone, C.; Knight, R. UniFrac: a new phylogenetic method for comparing microbial communities. Appl Environ Microbiol 2005, 71, 8228–8235. [Google Scholar] [CrossRef]
  27. Reverter, A.; Chan, E.K.F. Combining partial correlation and an information theory approach to the reversed engineering of gene co-expression networks. Bioinformatics 2008, 24, 2491–2497. [Google Scholar] [CrossRef]
  28. Shannon, P.; Markiel, A.; Ozier, O.; Baliga, N.S.; Wang, J.T.; Ramage, D.; Amin, N.; Schwikowski, B.; Ideker, T. Cytoscape: a software environment for integrated models of biomolecular interaction networks. Genome Res 2003, 13, 2498–2504. [Google Scholar] [CrossRef]
  29. Ke, S.; Fang, S.; He, M.; Huang, X.; Yang, H.; Yang, B.; Chen, C.; Huang, L. Age-based dynamic changes of phylogenetic composition and interaction networks of health pig gut microbiome feeding in a uniformed condition. Bmc Vet Res 2019, 15. [Google Scholar] [CrossRef]
  30. Xiao, Y.; Xiang, Y.; Zhou, W.; Chen, J.; Li, K.; Yang, H. Microbial community mapping in intestinal tract of broiler chicken. Poult Sci 2017, 96, 1387–1393. [Google Scholar] [CrossRef]
  31. Lkhagva, E.; Chung, H.J.; Hong, J.; Tang, W.; Lee, S.I.; Hong, S.T.; Lee, S. The regional diversity of gut microbiome along the GI tract of male C57BL/6 mice. Bmc Microbiol 2021, 21, 44. [Google Scholar] [CrossRef]
  32. Yeoman, C.J.; Chia, N.; Jeraldo, P.; Sipos, M.; Goldenfeld, N.D.; White, B.A. The microbiome of the chicken gastrointestinal tract. Anim Health Res Rev 2012, 13, 89–99. [Google Scholar] [CrossRef]
  33. Zhang, X.; Hu, Y.; Ansari, A.R.; Akhtar, M.; Chen, Y.; Cheng, R.; Cui, L.; Nafady, A.A.; Elokil, A.A.; Abdel Kafy, E.S.M.; et al. Caecal microbiota could effectively increase chicken growth performance by regulating fat metabolism. Microb Biotechnol 2022, 15, 844–861. [Google Scholar] [CrossRef] [PubMed]
  34. Yutin, N.; Galperin, M.Y. A genomic update on clostridial phylogeny: Gram-negative spore formers and other misplaced clostridia. Environ Microbiol 2013, 15, 2631–2641. [Google Scholar] [CrossRef] [PubMed]
  35. Nogal, A.; Louca, P.; Zhang, X.; Wells, P.M.; Steves, C.J.; Spector, T.D.; Falchi, M.; Valdes, A.M.; Menni, C. Circulating levels of the short-chain fatty acid acetate mediate the effect of the gut microbiome on visceral fat. Front Microbiol 2021, 12. [Google Scholar] [CrossRef] [PubMed]
  36. Zhao, J.; Bai, Y.; Tao, S.; Zhang, G.; Wang, J.; Liu, L.; Zhang, S. Fiber-rich foods affected gut bacterial community and short-chain fatty acids production in pig model. J Funct Foods 2019, 57, 266–274. [Google Scholar] [CrossRef]
  37. Hernández-Calderón, P.; Wiedemann, L.; Benítez-Páez, A. The microbiota composition drives personalized nutrition: Gut microbes as predictive biomarkers for the success of weight loss diets. Front Nutr 2022, 9. [Google Scholar] [CrossRef]
  38. Parker, B.J.; Wearsch, P.A.; Veloo, A.C.M.; Rodriguez-Palacios, A. The Genus Alistipes: Gut Bacteria With Emerging Implications to Inflammation, Cancer, and Mental Health. Front Immunol 2020, 11. [Google Scholar] [CrossRef]
  39. Rau, M.; Rehman, A.; Dittrich, M.; Groen, A.K.; Hermanns, H.M.; Seyfried, F.; Beyersdorf, N.; Dandekar, T.; Rosenstiel, P.; Geier, A. Fecal SCFAs and SCFA-producing bacteria in gut microbiome of human NAFLD as a putative link to systemic T-cell activation and advanced disease. United European Gastroenterol J 2018, 6, 1496–1507. [Google Scholar] [CrossRef]
  40. Song, Y.; Kononen, E.; Rautio, M.; Liu, C.; Bryk, A.; Eerola, E.; Finegold, S.M. Alistipes onderdonkii sp. nov. and Alistipes shahii sp. nov., of human origin. Int J Syst Evol Microbiol 2006, 56, 1985–1990. [Google Scholar] [CrossRef]
  41. Yan, H.; Lu, J.; Wang, Y.; Gu, W.; Yang, X.; Yu, J. Intake of total saponins and polysaccharides from Polygonatum kingianum affects the gut microbiota in diabetic rats. Phytomedicine 2017, 26, 45–54. [Google Scholar] [CrossRef] [PubMed]
  42. Seo, B.; Yoo, J.E.; Lee, Y.M.; Ko, G. Sellimonas intestinalis gen. nov., sp. nov., isolated from human faeces. Int J Syst Evol Microbiol 2016, 66, 951–956. [Google Scholar] [CrossRef] [PubMed]
  43. Lloyd-Price, J.; Arze, C.; Ananthakrishnan, A.N.; Schirmer, M.; Avila-Pacheco, J.; Poon, T.W.; Andrews, E.; Ajami, N.J.; Bonham, K.S.; Brislawn, C.J.; et al. Multi-omics of the gut microbial ecosystem in inflammatory bowel diseases. Nature 2019, 569, 655–662. [Google Scholar] [CrossRef]
  44. Ebner, F.; Heller, A.; Rippke, F.; Tausch, I. Topical use of dexpanthenol in skin disorders. Am J Clin Dermatol 2002, 3, 427–433. [Google Scholar] [CrossRef] [PubMed]
  45. Tang, J.; Zhang, B.; Liang, S.; Wu, Y.; Feng, Y.; Guo, Z.; Xing, G.; Jiao, J.; Zhou, Z.; Xie, M.; et al. Effects of pantothenic acid on growth performance and antioxidant status of growing male white Pekin ducks. Poult Sci 2020, 99, 4436–4441. [Google Scholar] [CrossRef]
  46. Mishima, E.; Ito, J.; Wu, Z.; Nakamura, T.; Wahida, A.; Doll, S.; Tonnus, W.; Nepachalovich, P.; Eggenhofer, E.; Aldrovandi, M.; et al. A non-canonical vitamin K cycle is a potent ferroptosis suppressor. Nature 2022, 608, 778–783. [Google Scholar] [CrossRef]
  47. Nawaz, A.H.; Amoah, K.; Leng, Q.Y.; Zheng, J.H.; Zhang, W.L.; Zhang, L. Poultry response to heat stress: Its physiological, metabolic, and genetic implications on meat production and quality including strategies to improve broiler production in a warming world. Front Vet Sci 2021, 8. [Google Scholar] [CrossRef]
  48. Wu, F.; Guo, X.; Zhang, J.; Zhang, M.; Ou, Z.; Peng, Y. Phascolarctobacterium faecium abundant colonization in human gastrointestinal tract. Exp Ther Med 2017, 14, 3122–3126. [Google Scholar] [CrossRef]
  49. Singh, K.M.; Shah, T.; Deshpande, S.; Jakhesara, S.J.; Koringa, P.G.; Rank, D.N.; Joshi, C.G. High through put 16S rRNA gene-based pyrosequencing analysis of the fecal microbiota of high FCR and low FCR broiler growers. Mol Biol Rep 2012, 39, 10595–10602. [Google Scholar] [CrossRef]
  50. Yang, Y.; Li, X.; Cao, Z.; Qiao, Y.; Lin, Q.; Liu, J.; Zhao, Z.; An, Q.; Zhang, C.; Zhang, H.; et al. Effects of different ambient temperatures on caecal microbial composition in broilers. Pol J Microbiol 2021, 70, 33–43. [Google Scholar] [CrossRef]
  51. Zaboli, G.; Huang, X.; Feng, X.; Ahn, D.U. How can heat stress affect chicken meat quality? -a review. Poult Sci 2019, 98, 1551–1556. [Google Scholar] [CrossRef] [PubMed]
  52. Goel, A. Heat stress management in poultry. J Anim Physiol Anim Nutr (Berl) 2021, 105, 1136–1145. [Google Scholar] [CrossRef] [PubMed]
  53. Vich, V.A.; Imhann, F.; Collij, V.; Jankipersadsing, S.A.; Gurry, T.; Mujagic, Z.; Kurilshikov, A.; Bonder, M.J.; Jiang, X.; Tigchelaar, E.F.; et al. Gut microbiota composition and functional changes in inflammatory bowel disease and irritable bowel syndrome. Sci Transl Med 2018, 10. [Google Scholar] [CrossRef] [PubMed]
  54. Pittayanon, R.; Lau, J.T.; Leontiadis, G.I.; Tse, F.; Yuan, Y.; Surette, M.; Moayyedi, P. Differences in Gut Microbiota in Patients With vs Without Inflammatory Bowel Diseases: A Systematic Review. Gastroenterology 2020, 158, 930–946.e1. [Google Scholar] [CrossRef] [PubMed]
  55. Zhang, W.; Quan, K.; Feng, C.; Zhang, T.; He, Q.; Kwok, L.; Chen, Y. The Lactobacillus gasseri G098 strain mitigates symptoms of DSS-induced inflammatory bowel disease in mice. Nutrients 2022, 14, 3745. [Google Scholar] [CrossRef] [PubMed]
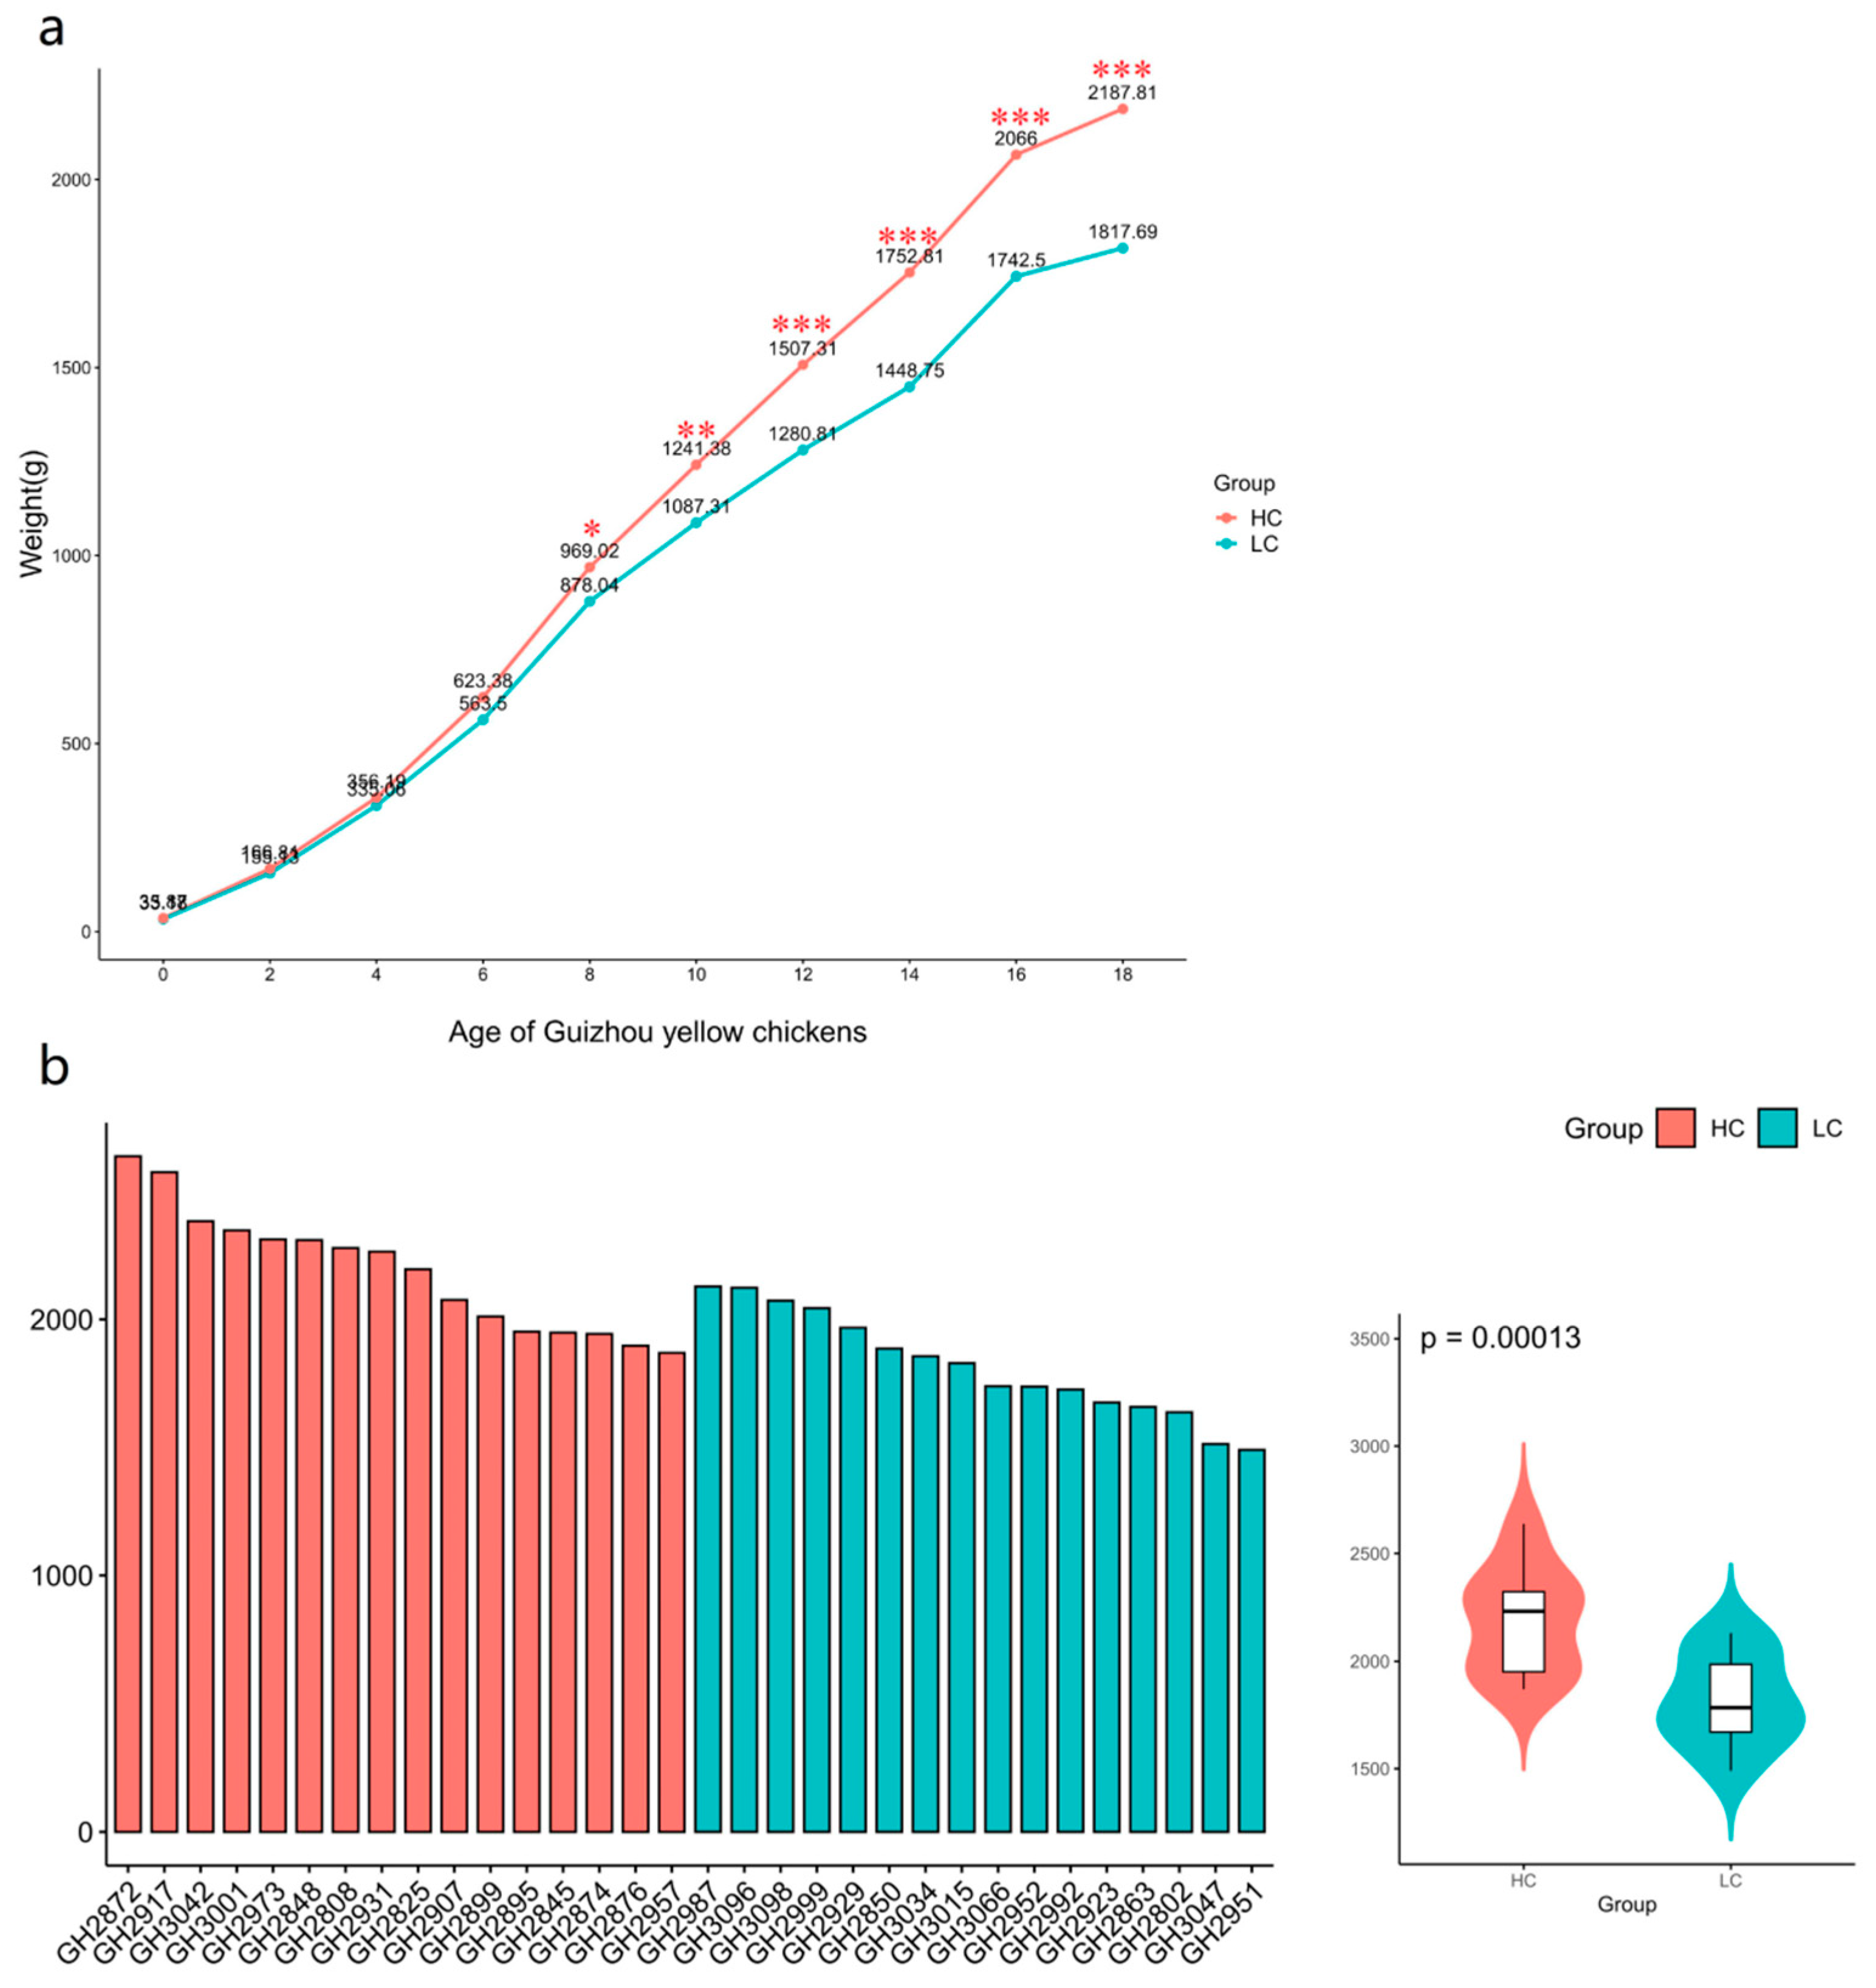
Figure 1. Body weight of experimental Guizhou yellow chickens. (a) Changes in body weight of ages 0 to 18 weeks. * P<0.05, **P<0.01, *** P<0.001. (b) Body weight distribution of experimental chickens at 18 weeks of age. HC, high-weight chicken group (n = 16). LC, low-weight chicken group (n = 16).
Preprints 81879 g001
Figure 2. Differences of cecal microbiota diversity between high-weight and low-weight chickens. Comparison of α-diversity in cecal microbiota between HC and LC using the (a) Shannon and (b) Simpson indices. (c) PCoA of cecal microbiota from HC and LC. See Figure 1 for abbreviations.
Preprints 81879 g002
Figure 3. Differences of cecal microbiota between high-weight and low-weight chickens. Comparison of cecal microbiota composition between HC/LC at the (a) phylum and (b) genus levels. Cecal microbiota showing different abundances at the (c) phylum and (d) genus levels between HC and LC. (e) Differential ASVs identified by LEfSe analysis between HC and LC. See Figure 1 for abbreviations.
Preprints 81879 g003
Figure 4. Co-abundance groups (CAG) of cecal microbiota associated with high-weight and low-weight chickens. (a) Association of CAGs with HC or LC. CAG6 was enriched in the cecal microbiota of LC and CAG9, CAG16, and CAG17 were enriched in the cecum of HC. (b) Comparison of relative mean abundance in four differential CAGs between HC or LC. See Figure 1 for abbreviations.
Preprints 81879 g004
Figure 5. Identification of the metabolic signatures between high-weight and low-weight chickens. (a) Partial least squares discriminant analysis (PLS-DA) of untargeted serum metabolome data from HC and LC. The pink and blue markers represent HC and LC, respectively. (b) Variable importance in projection (VIP>1) scores for the top serum metabolites contributing to variation in metabolic profiles of HC and LC (top 30). (c) Annotation table of differential metabolites enriched in HC or LC. Metabolic pathways enriched in (e) HC and (f) LC. See Figure 1 for abbreviations.
Preprints 81879 g005
Figure 6. Correlation between differential serum metabolites and weight-related cecal microbiota. Red indicates a positive correlation while blue indicates a negative correlation. See Figure 1 for abbreviations.
Preprints 81879 g006
Disclaimer/Publisher’s Note: The statements, opinions and data contained in all publications are solely those of the individual author(s) and contributor(s) and not of MDPI and/or the editor(s). MDPI and/or the editor(s) disclaim responsibility for any injury to people or property resulting from any ideas, methods, instructions or products referred to in the content.
Copyright: This open access article is published under a Creative Commons CC BY 4.0 license, which permit the free download, distribution, and reuse, provided that the author and preprint are cited in any reuse.
Prerpints.org logo

Preprints.org is a free preprint server supported by MDPI in Basel, Switzerland.

Subscribe

© 2024 MDPI (Basel, Switzerland) unless otherwise stated