Submitted:
09 August 2023
Posted:
09 August 2023
You are already at the latest version
Abstract
Keywords:
1. Introduction
2. Materials and Methods
2.1. Materials
2.2. Preparation of blended ionomer dispersion
2.3. Preparation of solution-cast membrane
2.4. Preparation of catalyst layers and MEAs
2.5. Characterization
Ion exchange capacity
Proton conductivity
Water uptake
Mercury intrusion porosimetry
Electrochemical characterization
3. Results and discussion
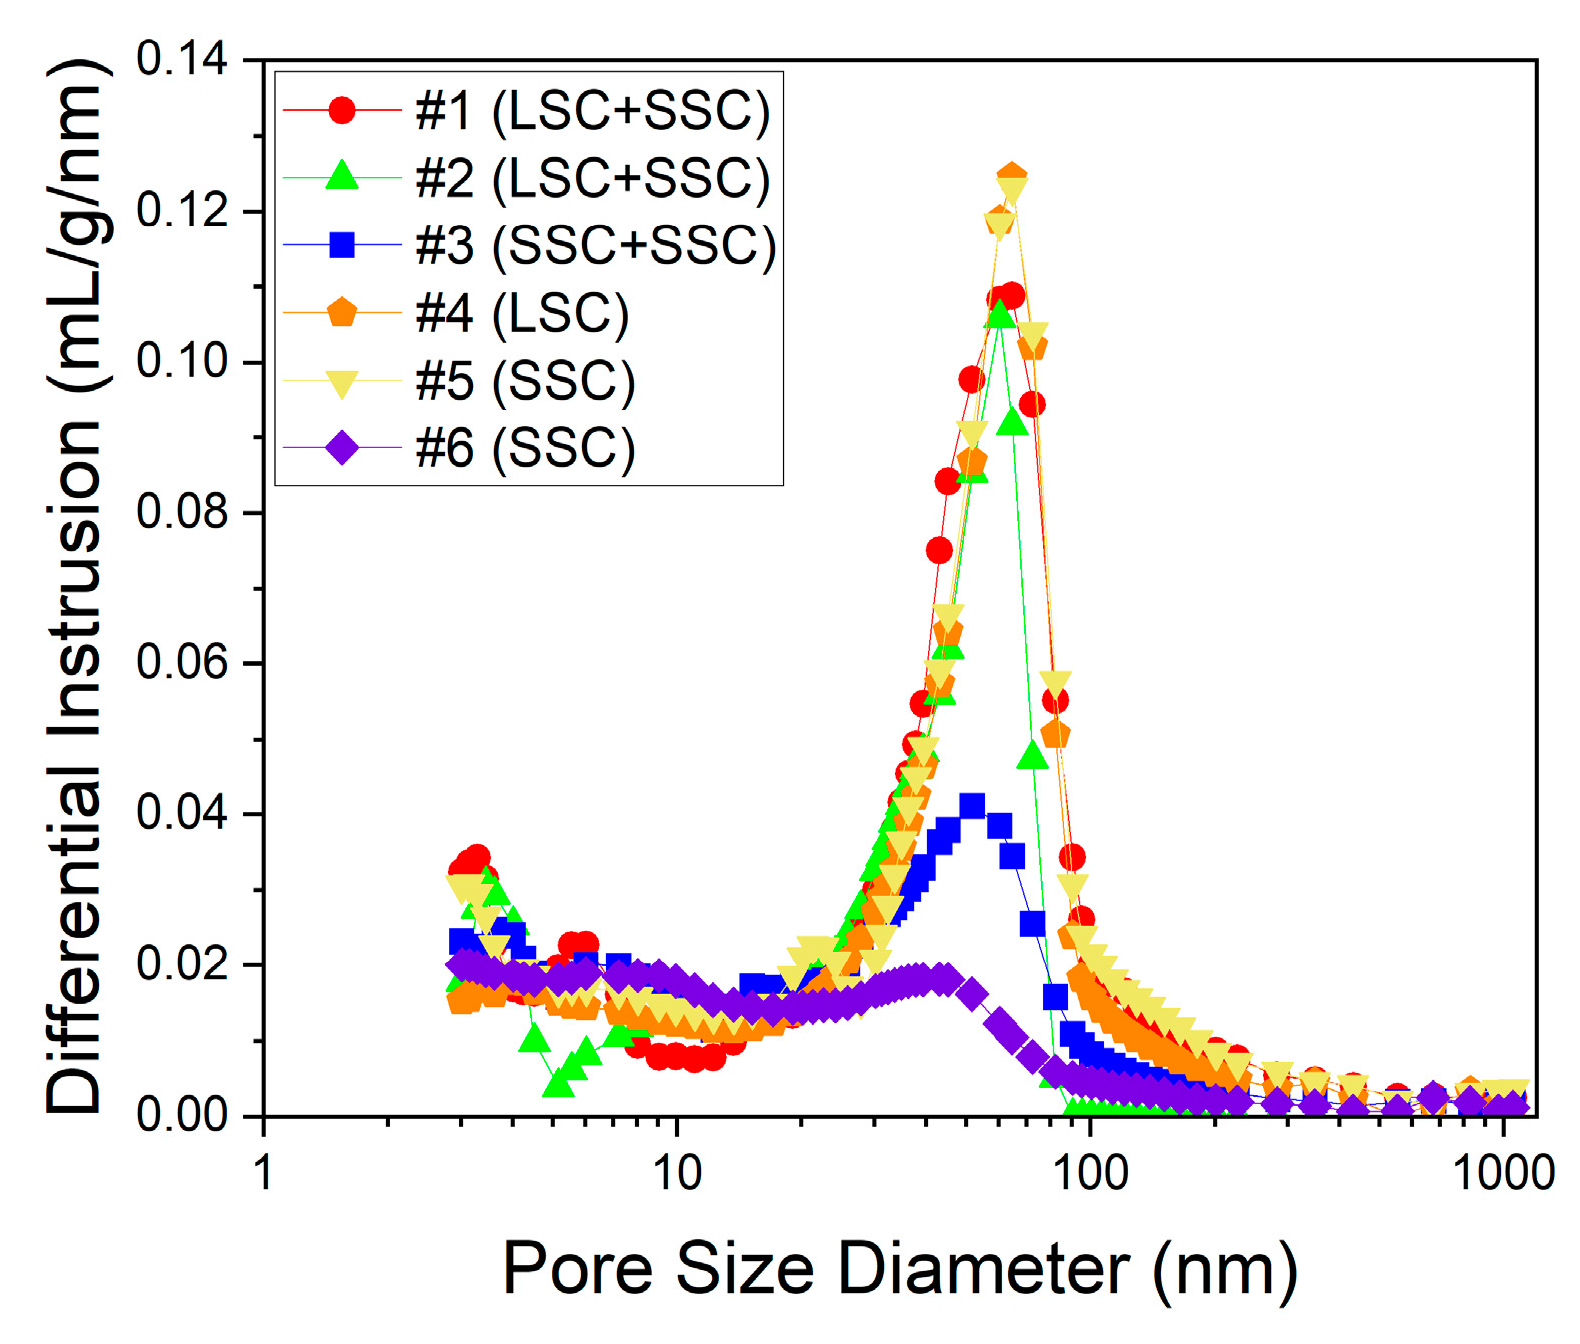
4. Conclusions
Author Contributions
Funding
Institutional Review Board Statement
Data Availability Statement
Acknowledgments
Conflicts of Interest
References
- Omer, A. M. Energy, environment and sustainable development. Renew. Sust. Energ. Rev., 2008, 12, 2265–2300. [Google Scholar] [CrossRef]
- Edwards, P. P.; Kuznetsov, V. L.; David, W. I Hydrogen energy. Philos. Trans. Royal Soc. A, Mathematical, Physical and Engineering Sciences, 2007, 365, 1043–1056. [Google Scholar] [CrossRef] [PubMed]
- Park, J.-H.; Kaur, P.; Park, J.-S.; Sekhon, S. S. Soil-templated synthesis of mesoporous carbons from biomass wastes for ORR catalysis. Catal. Today, 2022, 403, 2–10. [Google Scholar] [CrossRef]
- Perry, M. L.; Fuller, T. F. A historical perspective of fuel cell technology in the 20th century. J. Electrochem. Soc. 2022, 149, S59. [Google Scholar] [CrossRef]
- Dincer, I.; Rosen, M. A. Sustainability aspects of hydrogen and fuel cell systems. Energy Sustain. Dev., 2011, 15, 137–146. [Google Scholar] [CrossRef]
- Dincer, I. Environmental and sustainability aspects of hydrogen and fuel cell systems. Int. J. Energy Res., 2007, 31, 29–55. [Google Scholar] [CrossRef]
- Baker, D. R.; Wieser, C.; Neyerlin, K. C.; Murphy, M. W. The use of limiting current to determine transport resistance in PEM fuel cells. ECS Trans., 2006, 3, 989. [Google Scholar] [CrossRef]
- Suzuki, T.; Murata, H.; Hatanaka, T.; Morimoto, Y. Analysis of the catalyst layer of polymer electrolyte fuel cells. R&D Rev. Toyota CRDL, 2003, 39, 33–38. [Google Scholar]
- Suter, T.A.; Smith, K.; Hack, J.; Rasha, L.; Rana, Z.; Angel, G.M.A.; Shearing, P.R.; Miller, T.S.; Brett, D.J. Engineering Catalyst Layers for Next-Generation Polymer Electrolyte Fuel Cells: A Review of Design, Materials, and Methods. Adv. Energy Mater., 2021, 11, 2101025. [Google Scholar] [CrossRef]
- Park, J.-H.; Kim, B.-S.; Park, J.-S. Effect of ionomer dispersions on the performance of catalyst layers in proton exchange membrane fuel cells. Electrochim. Acta, 2022, 424, 140680. [Google Scholar] [CrossRef]
- Liu, C. Y.; Sung, C. C. A review of the performance and analysis of proton exchange membrane fuel cell membrane electrode assemblies. J. Power Sources, 2012, 220, 348–353. [Google Scholar] [CrossRef]
- Choudhary, T. V.; Goodman, D. W. CO-free fuel processing for fuel cell applications. Catal. Today, 2002, 77, 65–78. [Google Scholar] [CrossRef]
- Li, T.; Shen, J.; Chen, G.; Guo, S.; Xie, G. Performance comparison of proton exchange membrane fuel cells with nafion and aquivion perfluorosulfonic acids with different equivalent weights as the electrode binders. ACS omega, 2020, 5, 17628–17636. [Google Scholar] [CrossRef] [PubMed]
- Rosli, R. E.; Sulong, A. B.; Daud, W. R. W.; Zulkifley, M. A.; Husaini, T.; Rosli, M. I.; Majlan, E.H.; Haque, M.A. A review of high-temperature proton exchange membrane fuel cell (HT-PEMFC) system. Int. J. Hydrog., 2017, 42, 9293–9314. [Google Scholar] [CrossRef]
- Eikerling, M. Water management in cathode catalyst layers of PEM fuel cells: a structure-based model. J. Electrochem. Soc., 2006, 153, E58. [Google Scholar] [CrossRef]
- Choi, P.; Jalani, N. H.; Datta, R. Thermodynamics and proton transport in Nafion: II. Proton diffusion mechanisms and conductivity. J. Electrochem. Soc., 2005, 152, E123. [Google Scholar] [CrossRef]
- Paul, D. K.; Karan, K.; Docoslis, A.; Giorgi, J. B.; Pearce, J. Characteristics of self-assembled ultrathin Nafion films. Macromolecules, 2013, 46, 3461–3475. [Google Scholar] [CrossRef]
- Kusoglu, A.; Kushner, D.; Paul, D. K.; Karan, K.; Hickner, M. A.; Weber, A. Z. Impact of substrate and processing on confinement of Nafion thin films. Adv. Funct. Mater., 2014, 24, 4763–4774. [Google Scholar] [CrossRef]
- Wu, X.; Scott, K.; Puthiyapura, V. Polymer electrolyte membrane water electrolyser with Aquivion® short side chain perfluorosulfonic acid ionomer binder in catalyst layers. Int. J. Hydrog., 2012, 37, 13243–13248. [Google Scholar] [CrossRef]
- Clark, J. K.; Paddison, S. J. Side chain flexibility in perfluorosulfonic acid ionomers: an ab initio study. J. Phys. Chem. A, 2013, 117, 10534–10543. [Google Scholar] [CrossRef]
- Millington, B.; Du, S.; Pollet, B. G. The effect of materials on proton exchange membrane fuel cell electrode performance. J. Power Sources, 2011, 196, 9013–9017. [Google Scholar] [CrossRef]
- Lee, S. J.; Mukerjee, S.; McBreen, J.; Rho, Y. W.; Kho, Y. T.; Lee, T. H. Effects of Nafion impregnation on performances of PEMFC electrodes. Electrochim. Acta, 1998, 43, 3693–3701. [Google Scholar] [CrossRef]
- Balogun, E. O.; Hussain, N.; Chamier, J.; Barendse, P. Performance and durability studies of perfluorosulfonic acid ionomers as binders in PEMFC catalyst layers using Electrochemical Impedance Spectroscopy. Int. J. Hydrog., 2019, 44, 32219–32230. [Google Scholar] [CrossRef]
- Kongkanand, A.; Mathias, M. F. The priority and challenge of high-power performance of low-platinum proton-exchange membrane fuel cells. J. Phys. Chem. Lett., 2016, 7, 1127–1137. [Google Scholar] [CrossRef] [PubMed]
- Schuler, T.; Chowdhury, A.; Freiberg, A. T.; Sneed, B.; Spingler, F. B.; Tucker, M. C.; Tucker, M.C.; More, K.L.; Radke, C.J.; Weber, A.Z. Fuel-cell catalyst-layer resistance via hydrogen limiting-current measurements. J. Electrochem. Soc., 2019, 166, F3020–F3031. [Google Scholar] [CrossRef]
- Ren, H.; Meng, X.; Lin, Y.; Shao, Z. Structural stability of catalyst ink and its effects on the catalyst layer microstructure and fuel cell performance. J. Power Sources, 2022, 517, 230698. [Google Scholar] [CrossRef]
- Zhao, N.; Shi, Z.; Girard, F. Superior Proton Exchange Membrane Fuel Cell (PEMFC) Performance Using Short-Side-Chain Perfluorosulfonic Acid (PFSA) Membrane and Ionomer. Mater., 2021, 15, 78. [Google Scholar] [CrossRef]
- Ozden, A.; Shahgaldi, S.; Li, X.; Hamdullahpur, F. Degradations in the surface wettability and gas permeability characteristics of proton exchange membrane fuel cell electrodes under freeze-thaw cycles: Effects of ionomer type. Int. J. Hydrog., 2020, 45, 29892–29903. [Google Scholar] [CrossRef]
- Lei, C.; Bessarabov, D.; Ye, S.; Xie, Z.; Holdcroft, S.; Navessin, T. Low equivalent weight short-side-chain perfluorosulfonic acid ionomers in fuel cell cathode catalyst layers. J. Power Sources, 2011, 196, 6168–6176. [Google Scholar] [CrossRef]
- Talukdar, K.; Gazdzicki, P.; Friedrich, K. A. Comparative investigation into the performance and durability of long and short side chain ionomers in Polymer Electrolyte Membrane Fuel Cells. J. Power Sources, 2019, 439, 227078. [Google Scholar] [CrossRef]
- Lee, D.; Hwang, S. Effect of loading and distributions of Nafion ionomer in the catalyst layer for PEMFCs. Int. J. Hydrog., 2008, 33, 2790–2794. [Google Scholar] [CrossRef]
- Shin, S.-H.; Nur, P. J.; Kodir, A.; Kwak, D.-H.; Lee, H.; Shin, D.; Bae, B. Improving the mechanical durability of short-side-chain perfluorinated polymer electrolyte membranes by annealing and physical reinforcement. ACS Omega, 2019, 4, 19153–19163. [Google Scholar] [CrossRef] [PubMed]
- Guimet, A.; Chikh, L.; Morin, A.; Fichet, O. Effect of a neutral fluorinated network on the properties of a perfluorosulfonic acid ionomer as proton exchange membrane. Int. J. Hydrog., 2016, 41, 15562–15572. [Google Scholar] [CrossRef]
- Park, J.-H.; Park, J.-S. KOH-doped porous polybenzimidazole membranes for solid alkaline fuel cells. Energies, 2020, 13, 525. [Google Scholar] [CrossRef]
- Song, C.-H.; Park, J.-S. Effect of dispersion solvents in catalyst inks on the performance and durability of catalyst layers in proton exchange membrane fuel cells. Energies, 2019, 12, 549. [Google Scholar] [CrossRef]
- Xie, Z.; Zhao, X.; Adachi, M.; Shi, Z.; Mashio, T.; Ohma, A.; Shinohara, K.; Holdcroft, S.; Navessin, T. Fuel cell cathode catalyst layers from “green” catalyst inks. Energy Environ. Sci., 2008, 1, 184–193. [Google Scholar] [CrossRef]
- Park, J. E.; Karuppannan, M.; Kwon, O. J.; Cho, Y.-H.; Sung, Y.-E. Development of high-performance membrane-electrode assembly in unitized regenerative fuel cells. J. Ind. Eng. Chem., 2019, 80, 527–534. [Google Scholar] [CrossRef]
- Mashio, T.; Ohma, A.; Yamamoto, S.; Shinohara, K. Analysis of reactant gas transport in a catalyst layer. ECS Trans, 2007, 11, 529. [Google Scholar] [CrossRef]
- Tarokh, A.; Karan, K.; Ponnurangam, S. Atomistic MD study of nafion dispersions: Role of solvent and counterion in the aggregate structure, ionic clustering, and acid dissociation. Macromolecules, 2019, 53, 288–301. [Google Scholar] [CrossRef]
- Ion-Ebrasu, D.; Pollet, B.G.; Spinu-Zaulet, A.; Soare, A.; Carcadea, E.; Varlam, M; Caprarescu, S. Graphene modified fluorinated cation-exchange membranes for proton exchange membrane water electrolysis. Int. J. Hydrog., 2019, 44, 10190–10196. [Google Scholar] [CrossRef]
- Jiang, Z.; Zhao, X.; Fu, Y.; Manthiram, A. Composite membranes based on sulfonated poly (ether ether ketone) and SDBS-adsorbed graphene oxide for direct methanol fuel cells. J. Mater. Chem., 2012, 22, 24862–24869. [Google Scholar] [CrossRef]
- Ramaswamy, N.; Kumaraguru, S.; Koestner, R.; Fuller, T.; Gu, W.; Kariuki, N.; Myers, D.; Dudenas, P.J.; Kusoglu, A. Editors’ choice—ionomer side chain length and equivalent weight impact on high current density transport resistances in PEMFC cathodes. J. Electrochem. Soc., 2021, 168, 024518. [Google Scholar] [CrossRef]
- Liu, L.; Chen, W.; Li, Y. An overview of the proton conductivity of nafion membranes through a statistical analysis. J. Membr. Sci., 2016, 504, 1–9. [Google Scholar] [CrossRef]
- Zhang, C.; Davies, M.; Karan, K. Probing interfacial interactions of Nafion ionomer: Thermal expansion of Nafion thin films on substrates of different hydrophilicity/hydrophobicity. J. Polym. Sci. B: Polym. Phys., 2019, 57, 343–352. [Google Scholar] [CrossRef]
- Uchida, M. PEFC catalyst layers: Effect of support microstructure on both distributions of Pt and ionomer and cell performance and durability. Curr. Opin. Electrochem., 2020, 21, 209–218. [Google Scholar] [CrossRef]
- Kodama, K.; Motobayashi, K.; Shinohara, A.; Hasegawa, N.; Kudo, K.; Jinnouchi, R.; Osawa, M.; Morimoto, Y. Effect of the side-chain structure of perfluoro-sulfonic acid ionomers on the oxygen reduction reaction on the surface of Pt. ACS Catal., 2018, 8, 694–700. [Google Scholar] [CrossRef]
- Garsany, Y.; Atkinson, R. W.; Sassin, M. B.; Hjelm, R. M.; Gould, B. D.; Swider-Lyons, K. E. Improving PEMFC performance using short-side-chain low-equivalent-weight PFSA ionomer in the cathode catalyst layer. J. Electrochem. Soc., 2018, 165, F381–F391. [Google Scholar] [CrossRef]
- Liu, S.; Yuan, S.; Liang, Y.; Li, H.; Xu, Z.; Xu, Q.; Yin, J.; Shen, S.; Yan, X.; Zhang, J. Engineering the catalyst layers towards enhanced local oxygen transport of Low-Pt proton exchange membrane fuel cells: Materials, designs, and methods. Int. J. Hydrog., 2023, 48, 4389–4417. [Google Scholar] [CrossRef]
- Yan, Q.; Toghiani, H.; Causey, H. Steady state and dynamic performance of proton exchange membrane fuel cells (PEMFCs) under various operating conditions and load changes. J. Power Sources, 2006, 161, 492–502. [Google Scholar] [CrossRef]
- Wasterlain, S.; Candusso, D.; Hissel, D.; Harel, F.; Bergman, P.; Menard, P.; Anwar, M. Study of temperature, air dew point temperature and reactant flow effects on proton exchange membrane fuel cell performances using electrochemical spectroscopy and voltammetry techniques. J. Power Sources, 2010, 195, 984–993. [Google Scholar] [CrossRef]
- Sun, X.; Yu, H.; Zhou, L.; Gao, X.; Zeng, Y.; Yao, D.; He, L.; Shao, Z. Influence of platinum dispersity on oxygen transport resistance and performance in PEMFC. Electrochim. Acta, 2020, 332, 135474. [Google Scholar] [CrossRef]
- Reshetenko, T.; Polevaya, O. Determination of oxygen mass transport resistance in proton exchange membrane fuel cells with an open flow field architecture. Electrochim. Acta, 2021, 387, 138529. [Google Scholar] [CrossRef]
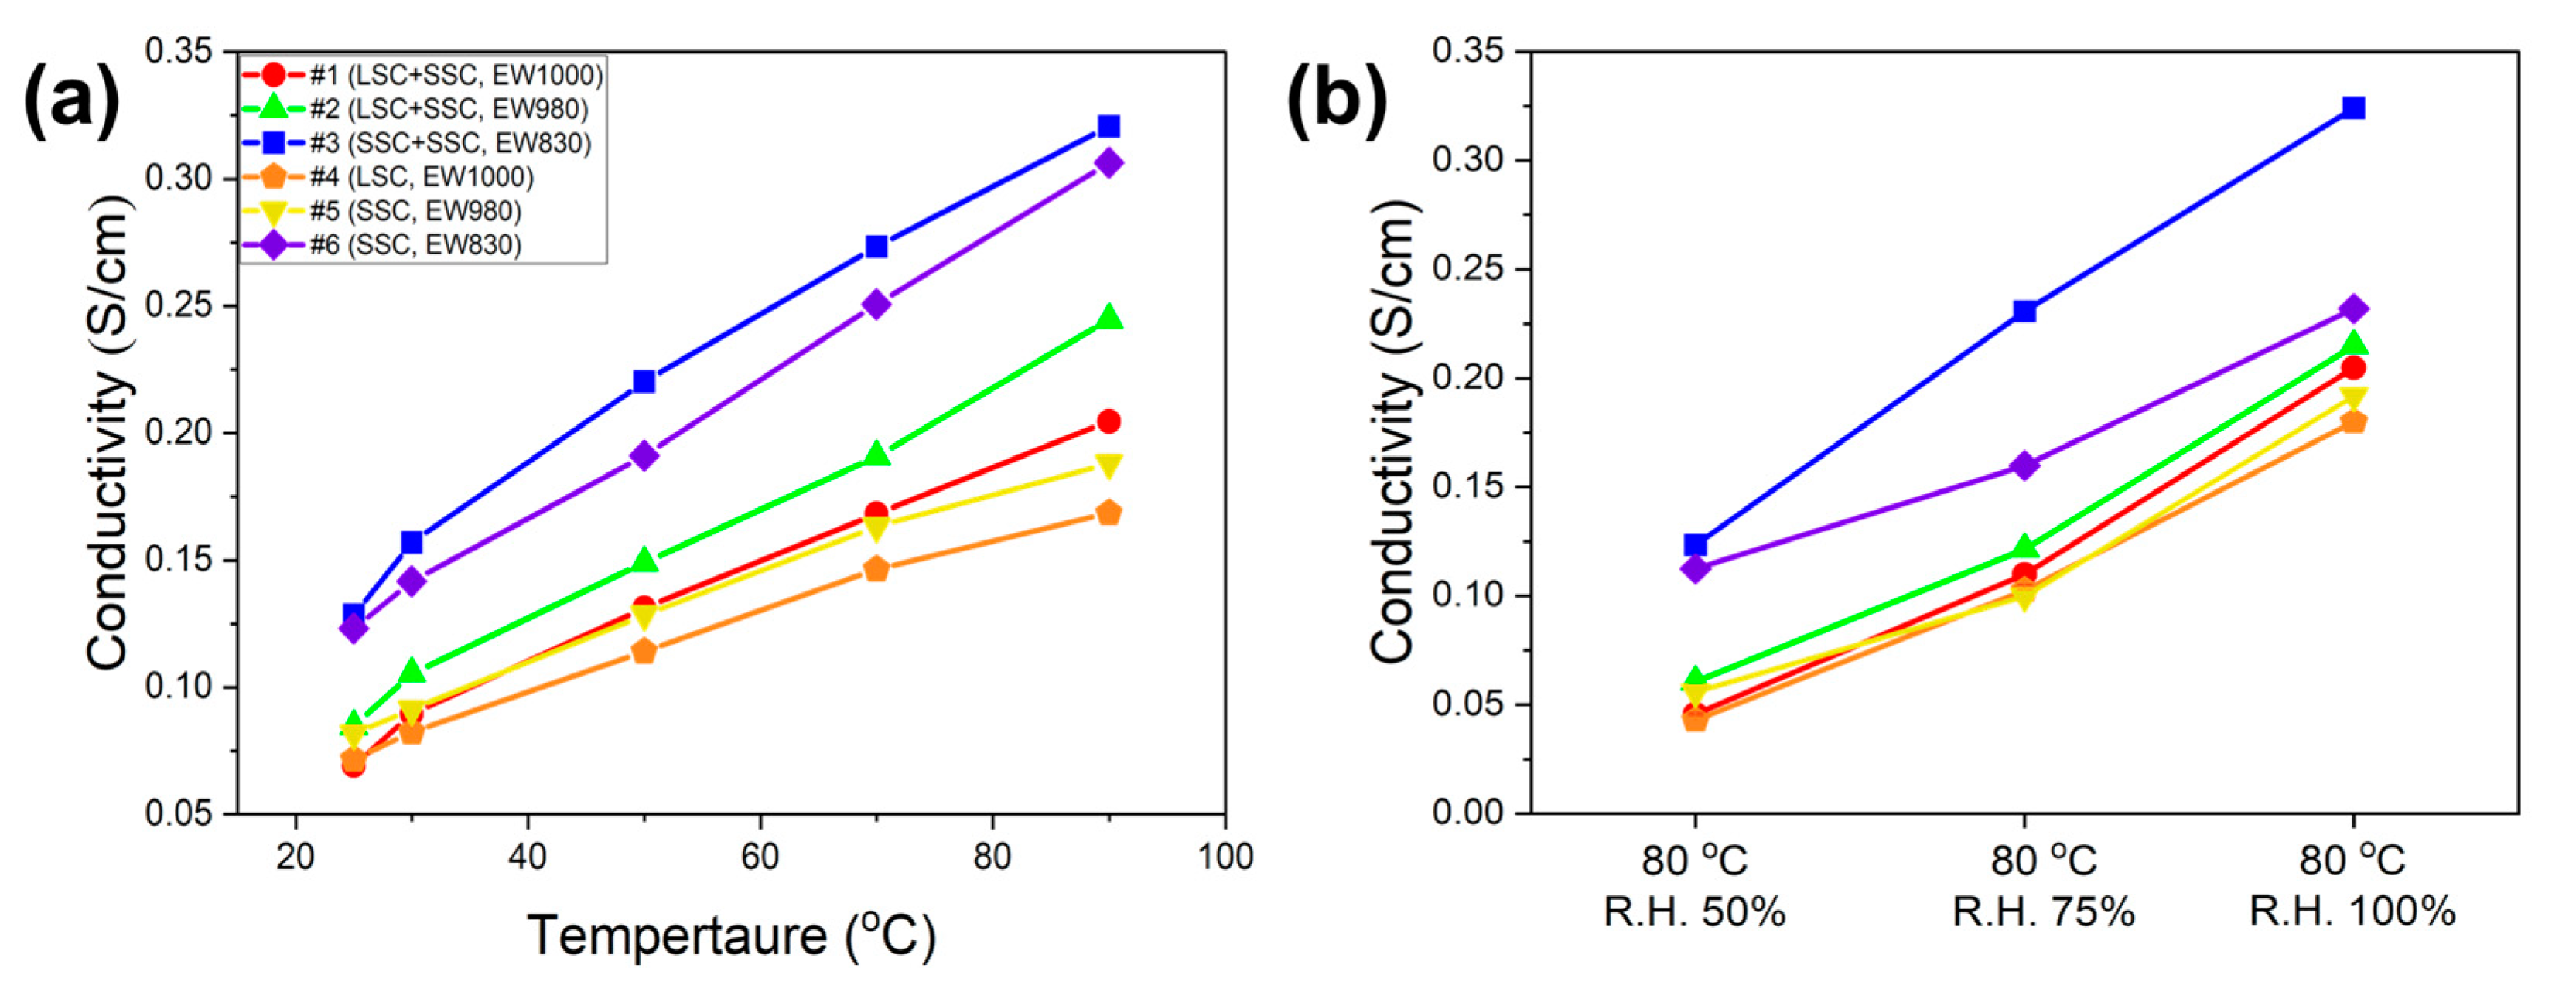
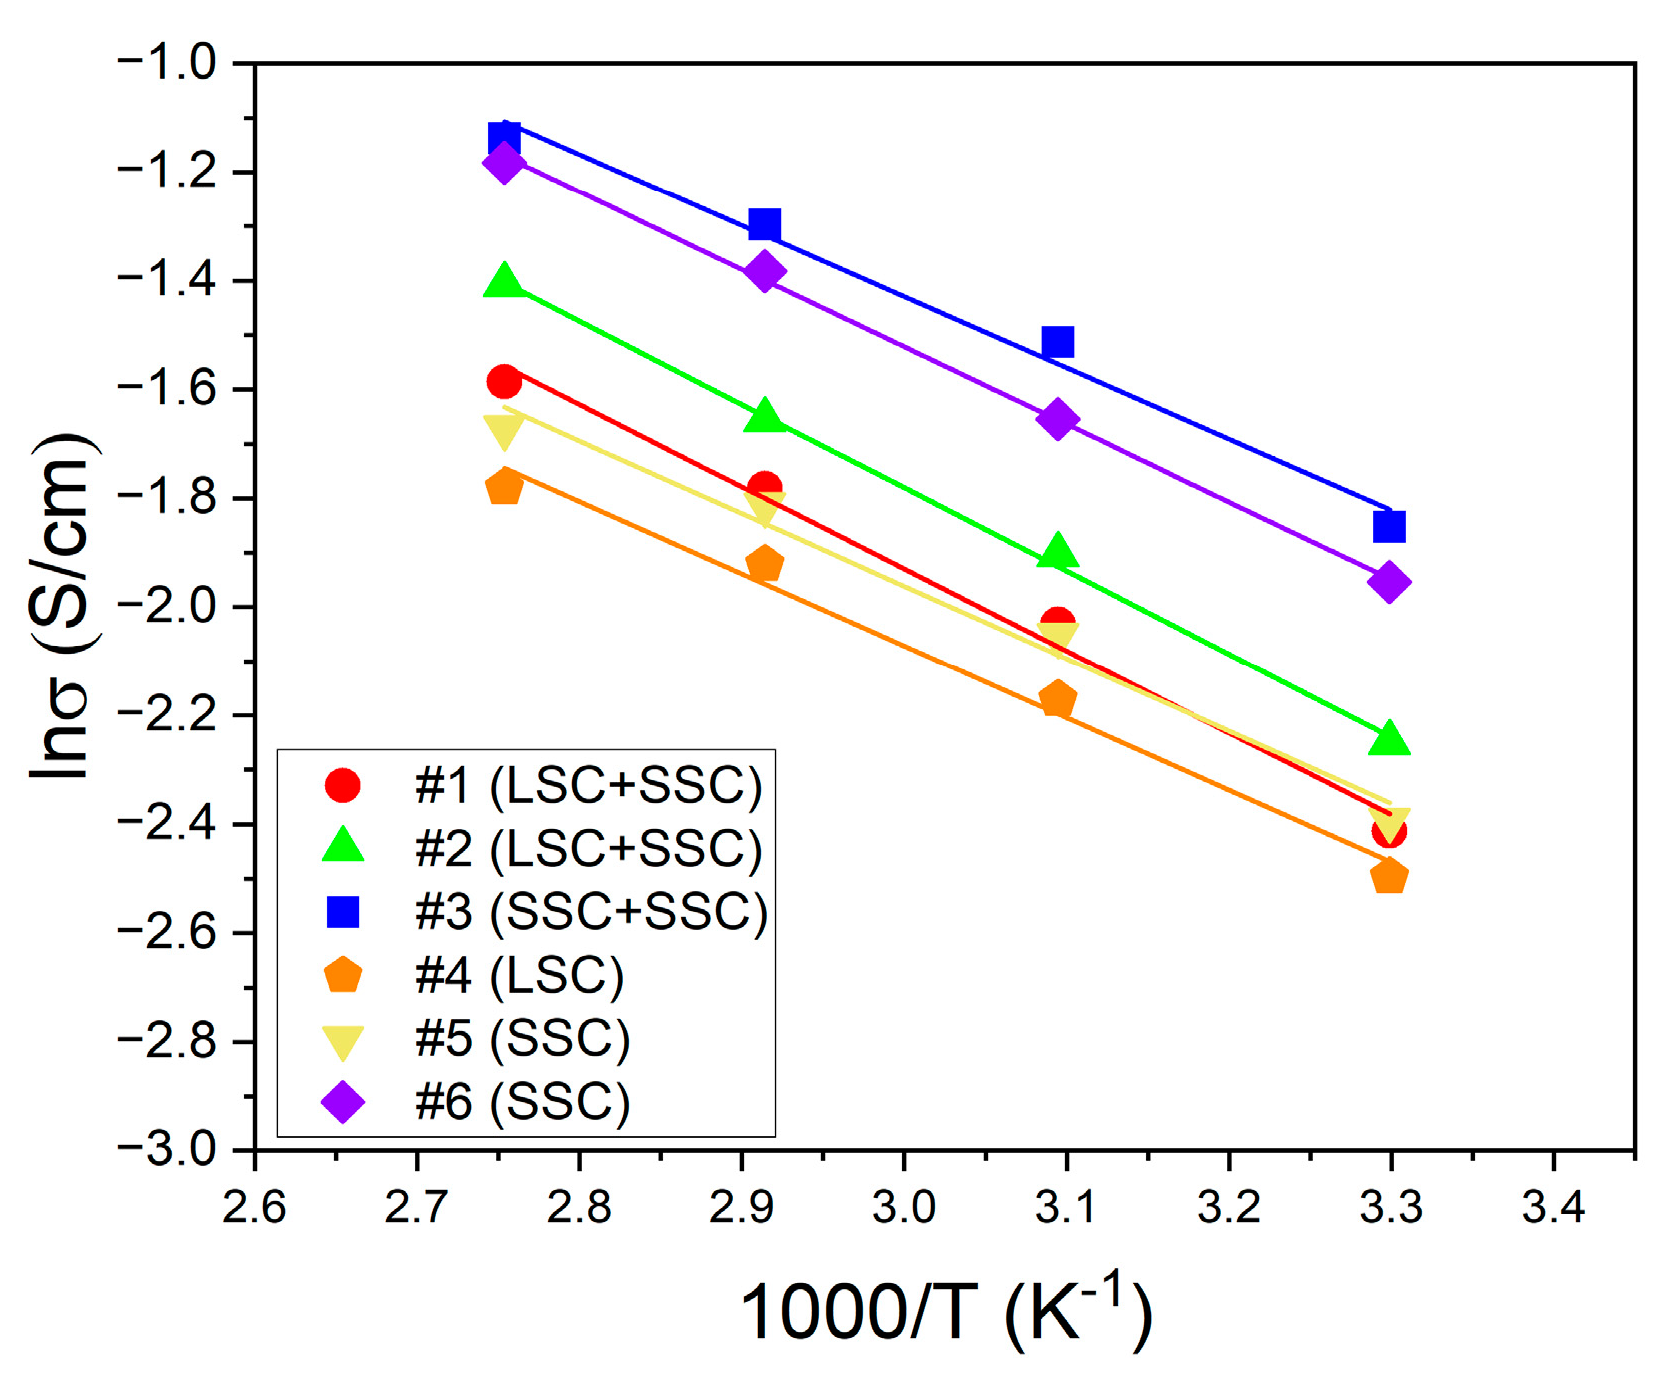
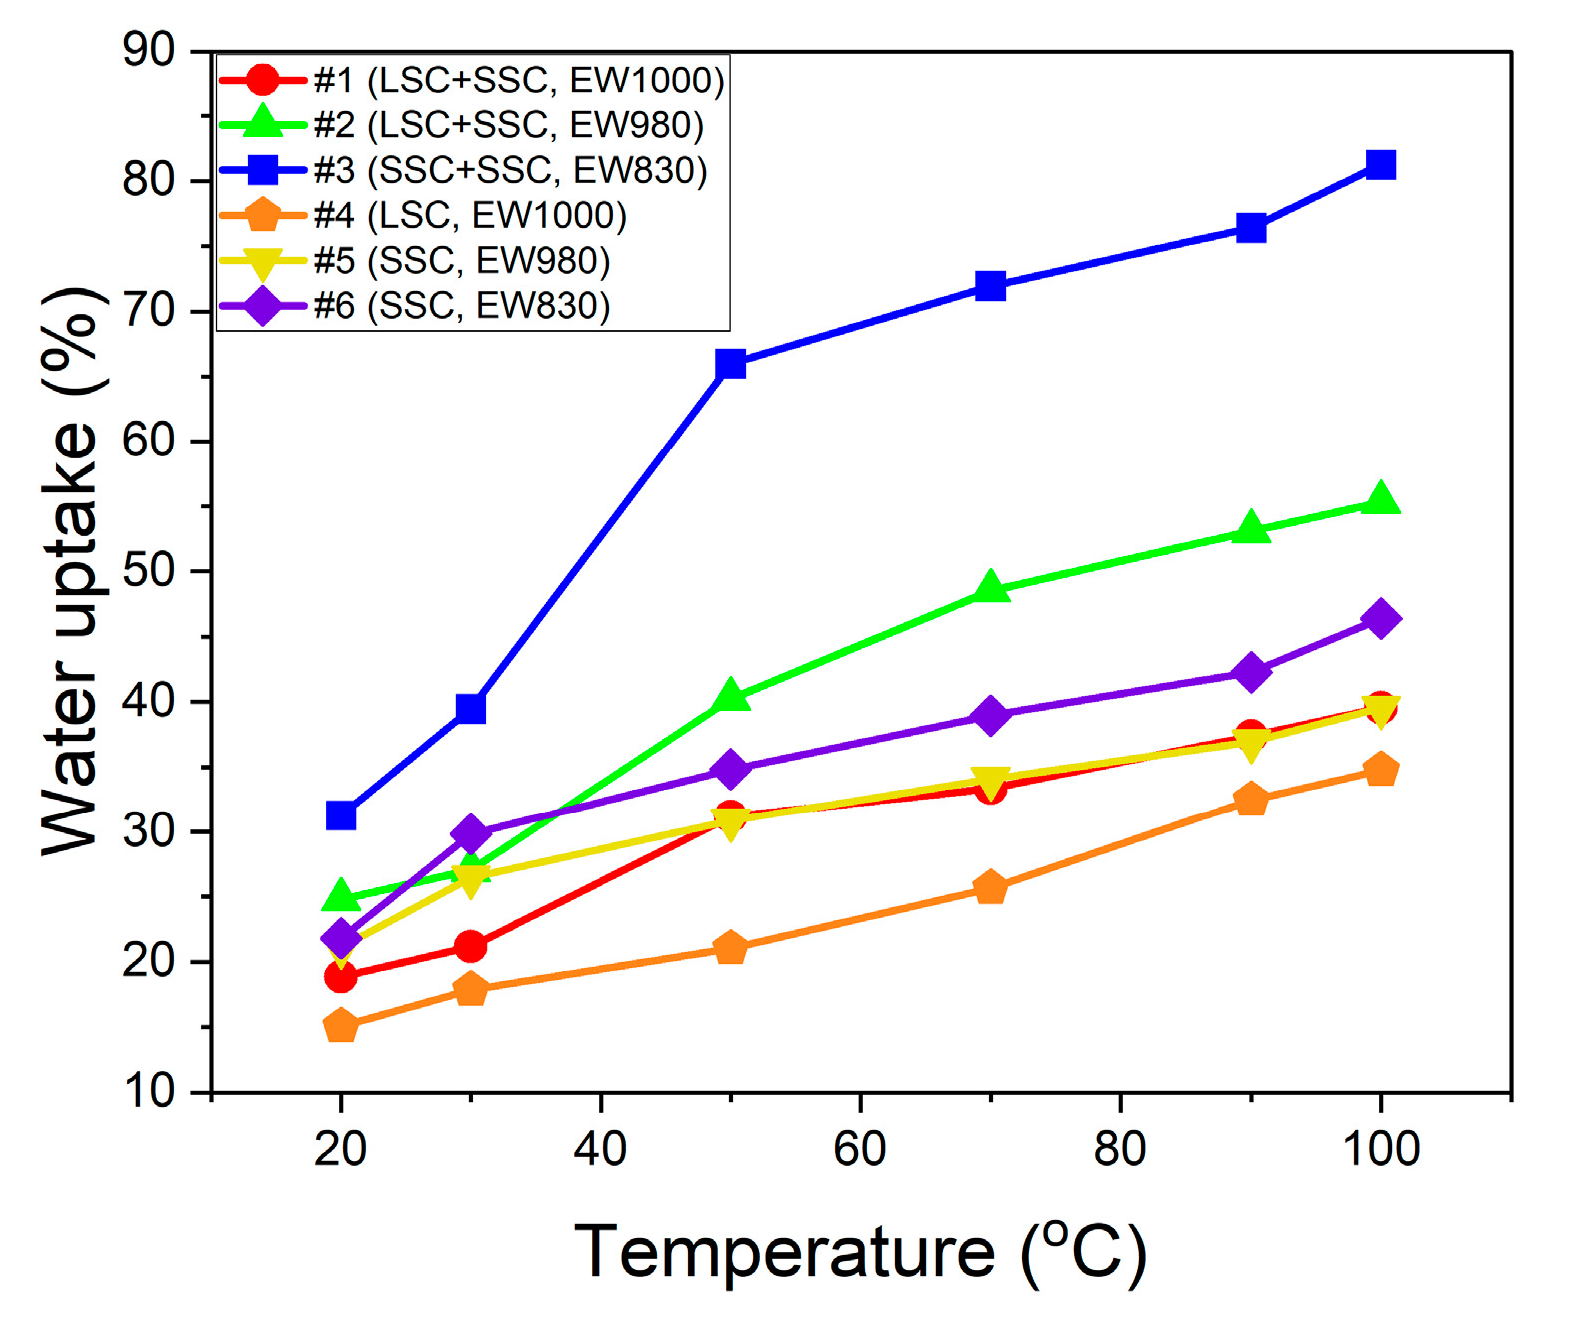
| Theoretical EW of ionomers | Measured EW | |
|---|---|---|
| Blended ionomer | Single ionomer | |
| 1000 | 1027 (#1) | 1015 (#4) |
| 980 | 937 (#2) | 998 (#5) |
| 830 | 832 (#3) | 866 (#6) |
| EW of ionomers | Activation energy (kJ/mol) | |
|---|---|---|
| Blended ionomer | Single ionomer | |
| 1000 | 12.55 (#1) | 11.04 (#4) |
| 980 | 12.72 (#2) | 11.09 (#5) |
| 830 | 10.86 (#3) | 11.84 (#6) |
| Operating condition | Current density (A/cm2) | ||||||
|---|---|---|---|---|---|---|---|
| Blended ionomer | Single ionomer | ||||||
| EW1000 (#1) LSC+SSC |
EW980 (#2) LSC+SSC |
EW830 (#3) SSC+SSC |
EW1000 (#4) LSC |
EW980 (#5) SSC |
EW830 (#6) SSC |
||
| 70 °C R.H. 100% |
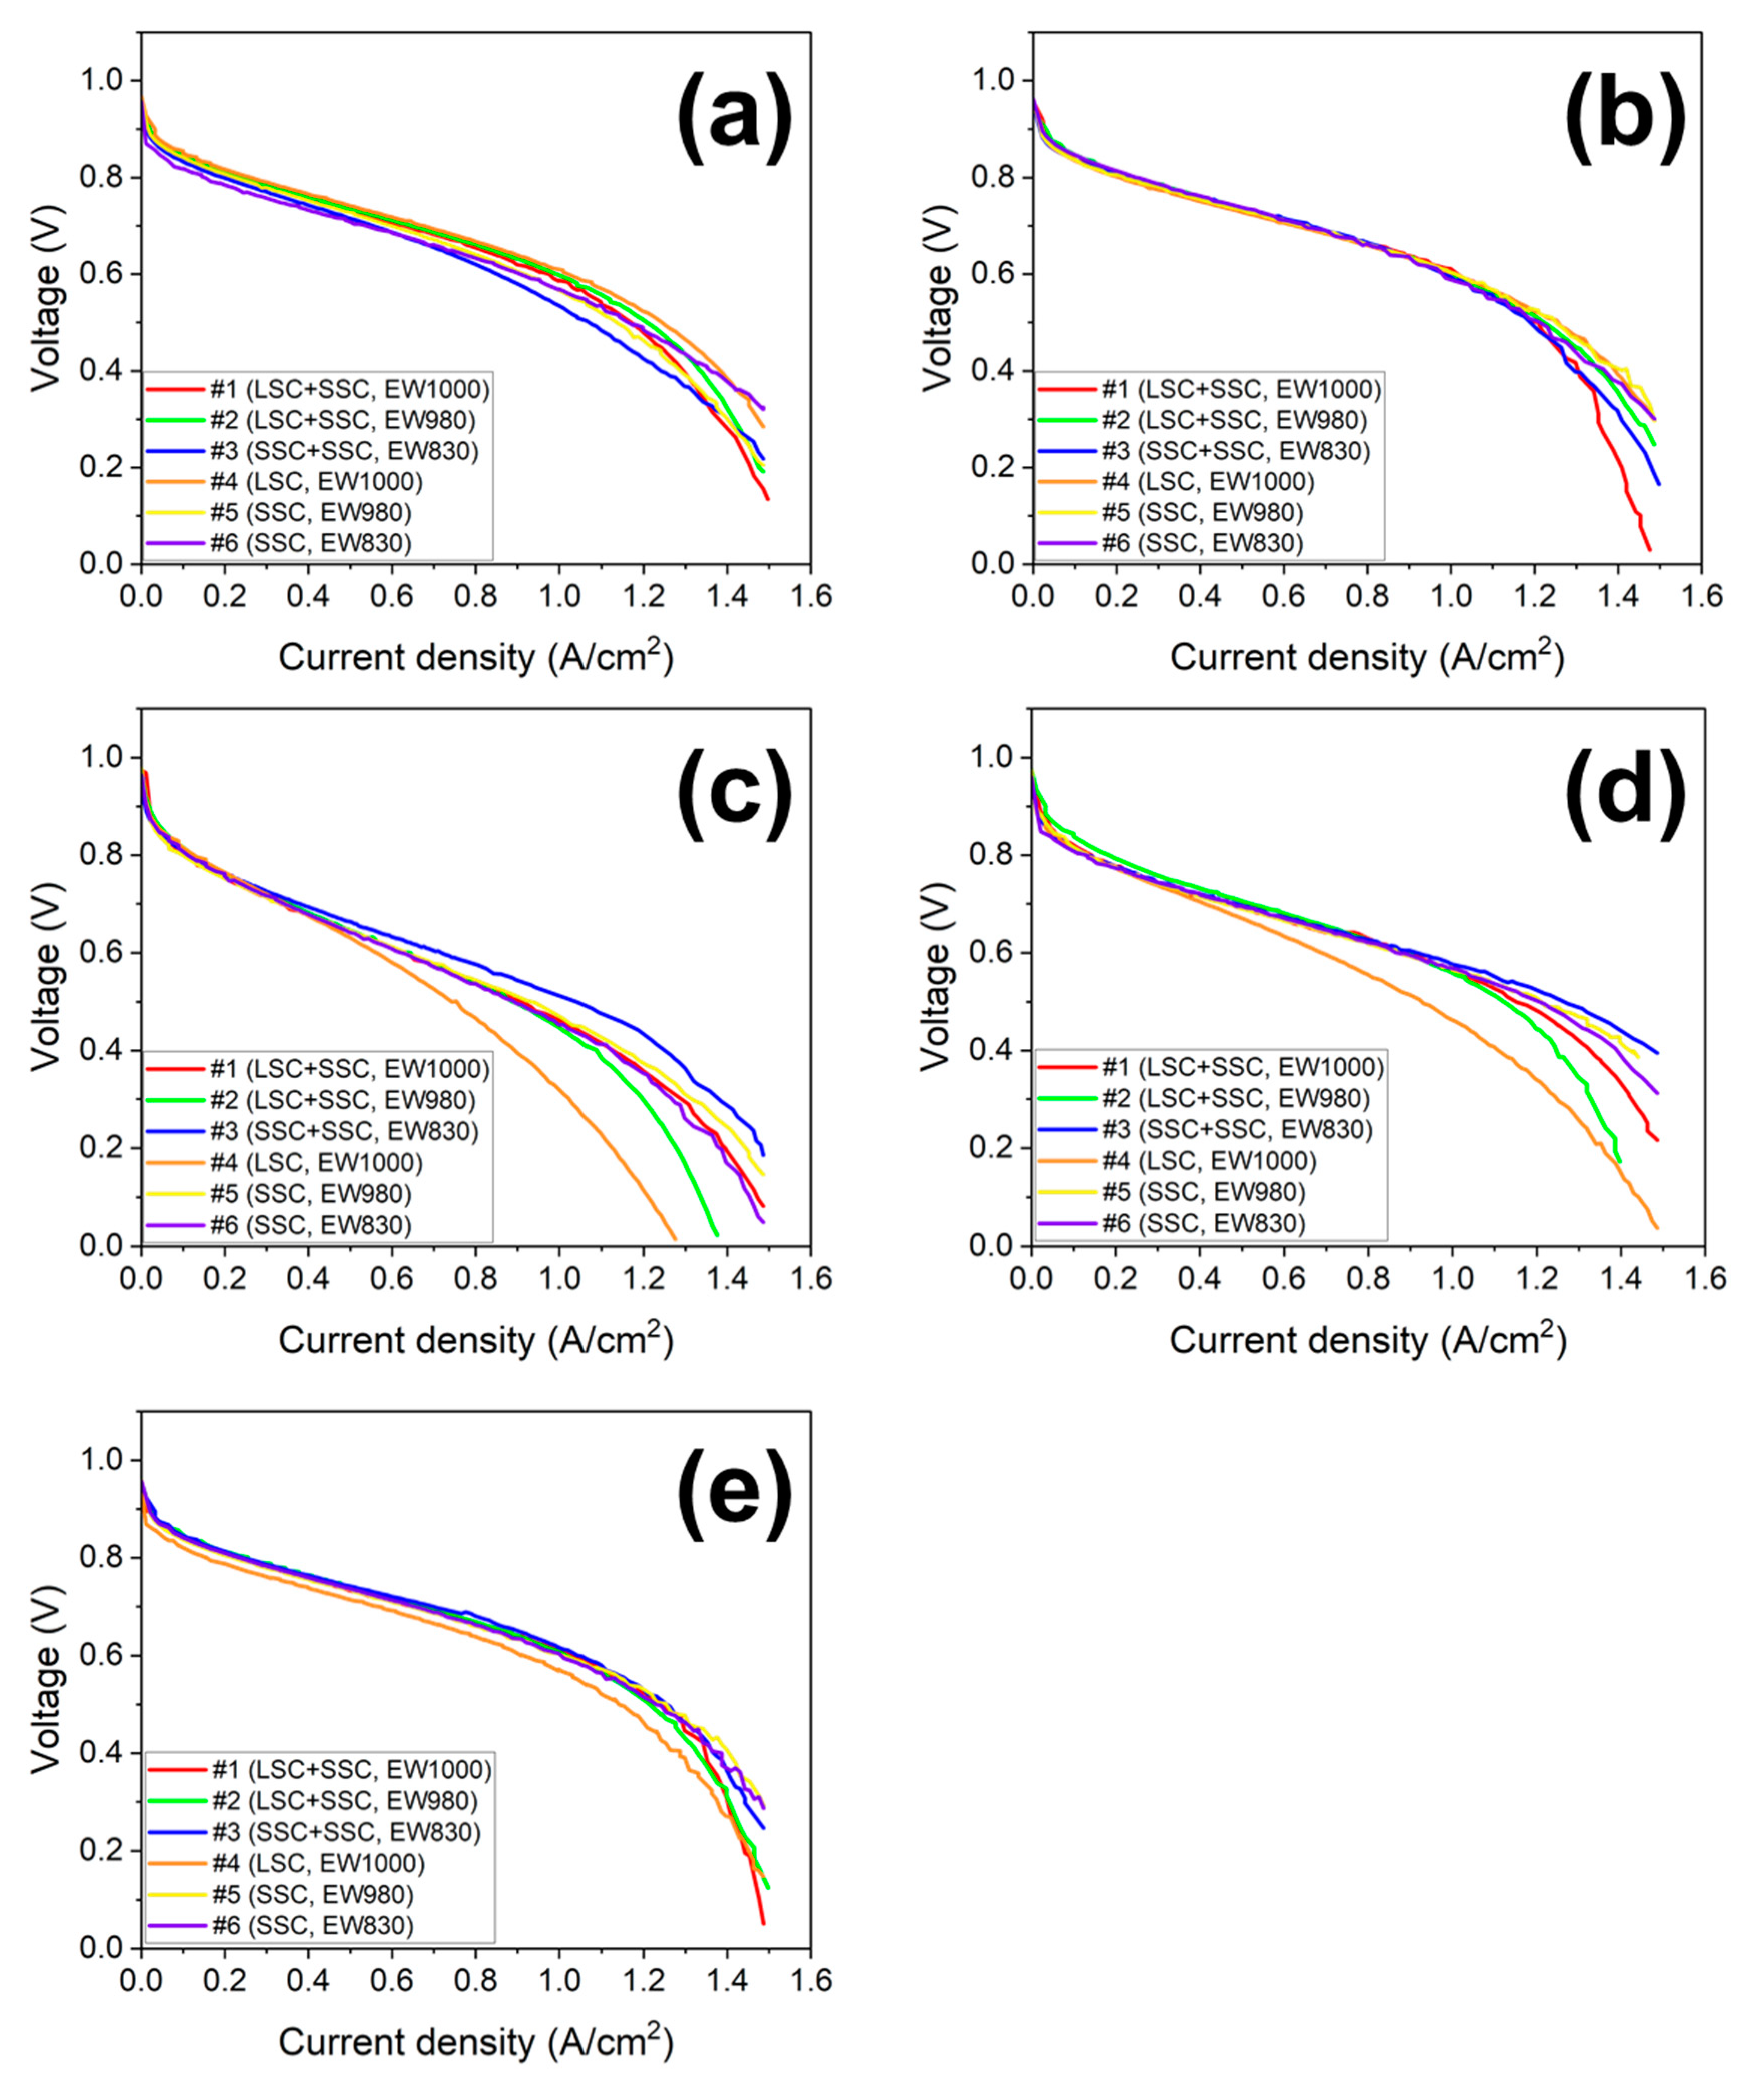
0.8 V | 0.244 | 0.244 | 0.199 | 0.266 | 0.233 | 0.155 |
| 0.6 V | 0.976 | 0.998 | 0.854 | 1.021 | 0.920 | 0.909 | |
| 0.4 V | 1.309 | 1.342 | 1.253 | 1.387 | 1.286 | 1.363 | |
| 75 °C R.H. 100% |
0.8 V | 0.222 | 0.244 | 0.222 | 0.211 | 0.222 | 0.244 |
| 0.6 V | 1.021 | 1.009 | 0.988 | 1.01 | 1.01 | 0.976 | |
| 0.4 V | 1.309 | 1.353 | 1.298 | 1.387 | 1.409 | 1.364 | |
| 80 °C R.H. 100% |
0.8 V | 0.244 | 0.255 | 0.244 | 0.155 | 0.222 | 0.244 |
| 0.6 V | 1.043 | 1.021 | 1.054 | 0.921 | 0.999 | 1.01 | |
| 0.4 V | 1.353 | 1.331 | 1.364 | 1.287 | 1.398 | 1.387 | |
| 80 °C R.H. 75% |
0.8 V | 0.144 | 0.177 | 0.144 | 0.133 | 0.133 | 0.133 |
| 0.6 V | 0.909 | 0.898 | 0.821 | 0.699 | 0.876 | 0.887 | |
| 0.4 V | 1.341 | 1.253 | 1.486 | 1.109 | 1.430 | 1.386 | |
| 80 °C R.H. 50% |
0.8 V | 0.122 | 0.122 | 0.116 | 0.122 | 0.100 | 0.111 |
| 0.6 V | 0.643 | 0.643 | 0.721 | 0.566 | 0.632 | 0.632 | |
| 0.4 V | 1.131 | 1.087 | 1.264 | 0.898 | 1.153 | 1.109 | |
| Operating condition | ECSA (m2/gpt) | |||||
|---|---|---|---|---|---|---|
| Blended ionomer | Single ionomer | |||||
| EW1000 (#1) LSC+SSC |
EW980 (#2) LSC+SSC |
EW830 (#3) SSC+SSC |
EW1000 (#4) LSC |
EW980 (#5) SSC |
EW830 (#6) SSC |
|
| 70 °C, R.H. 100% | 60.60 | 69.95 | 55.02 | 75.70 | 65.11 | 58.08 |
| 75 °C, R.H. 100% | 90.18 | 81.09 | 96.04 | 71.08 | 73.34 | 89.28 |
| 80 °C, R.H. 100% | 55.94 | 65.22 | 58.37 | 47.38 | 61.53 | 56.95 |
| 80 °C, R.H. 75% | 48.22 | 57.50 | 44.47 | 36.37 | 46.61 | 39.97 |
| 80 °C, R.H. 50% | 32.95 | 39.98 | 37.06 | 32.63 | 22.75 | 36.30 |
| Operating condition | Decrease rate of limiting current density (%) | |||||
|---|---|---|---|---|---|---|
| Blended ionomer | Single ionomer | |||||
| EW1000 (#1) LSC+SSC |
EW980 (#2) LSC+SSC |
EW830 (#3) SSC+SSC |
EW1000 (#4) LSC |
EW980 (#5) SSC |
EW830 (#6) SSC |
|
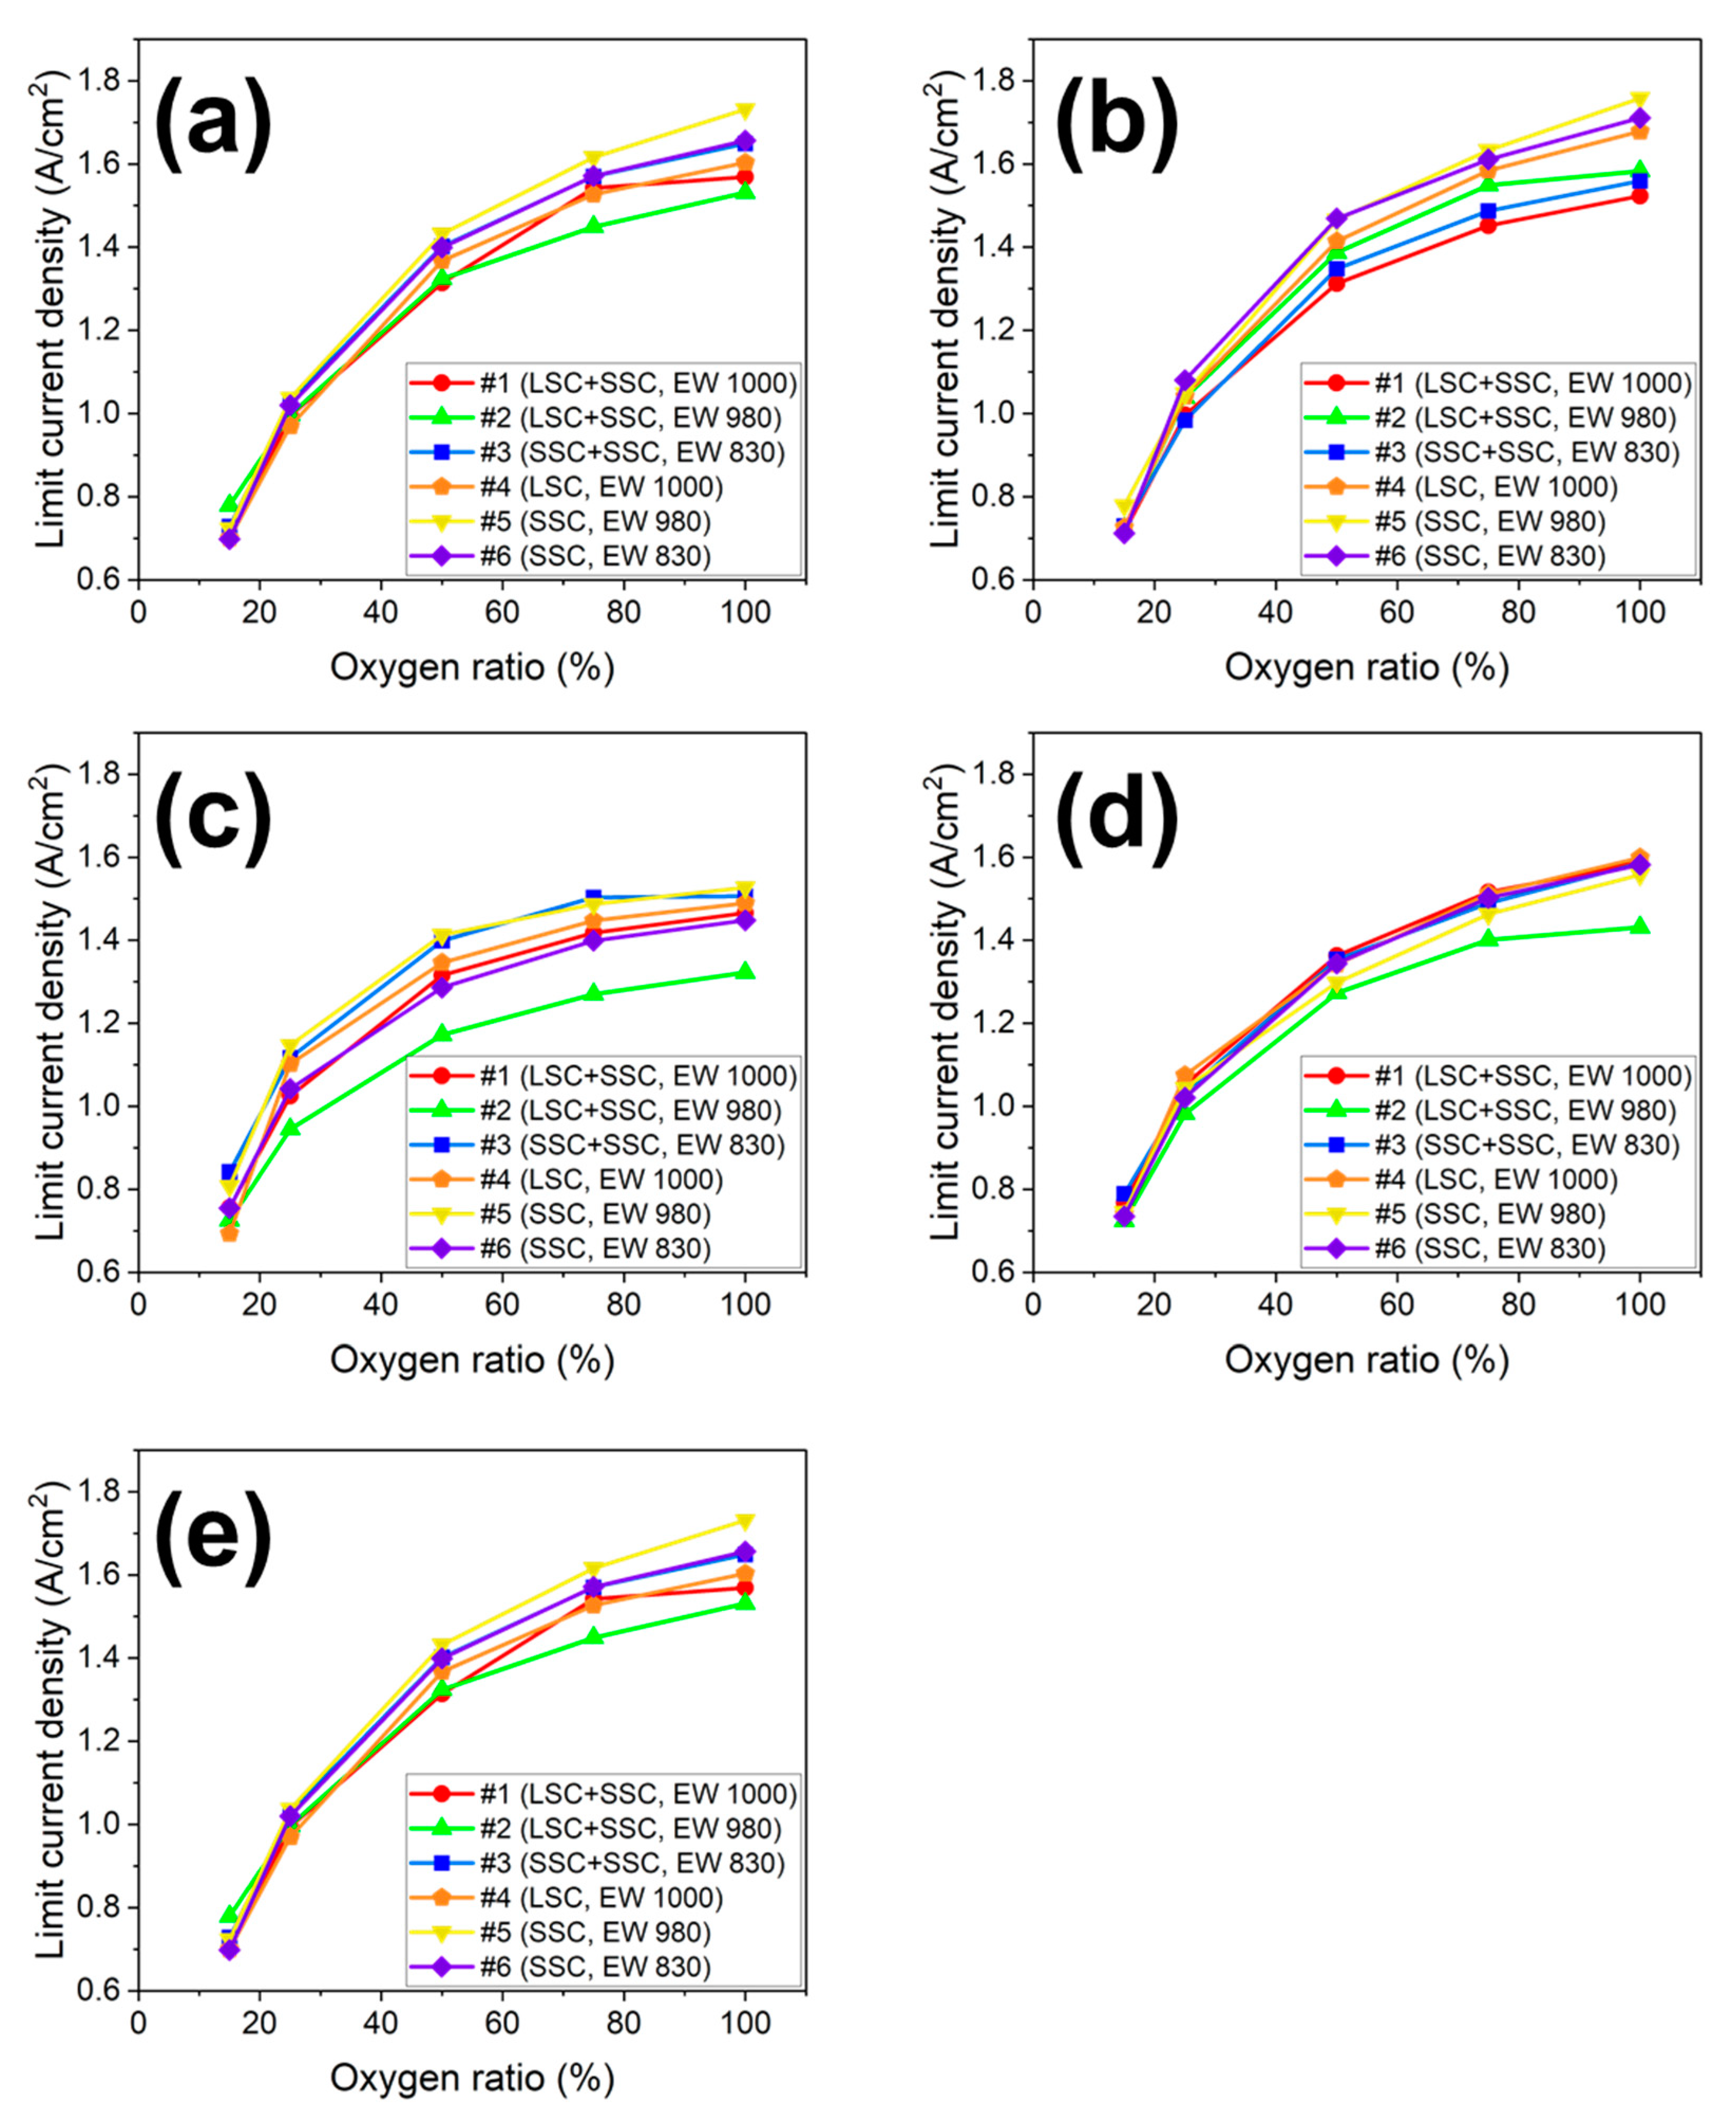
| 70 ℃, R.H. 100% | 55.2 | 49.1 | 55.8 | 56.3 | 58.2 | 57.8 |
| 75 ℃, R.H. 100% | 53.0 | 54.3 | 53.2 | 56.7 | 55.7 | 58.4 |
| 80 ℃, R.H. 100% | 52.6 | 49.4 | 50.2 | 53.7 | 52.2 | 53.5 |
| 80 ℃, R.H. 75% | 49.6 | 50.2 | 48.8 | 49.7 | 52.6 | 51.8 |
| 80 ℃, R.H. 50% | 48.4 | 45.2 | 44.1 | 53.4 | 47.1 | 47.8 |
Disclaimer/Publisher’s Note: The statements, opinions and data contained in all publications are solely those of the individual author(s) and contributor(s) and not of MDPI and/or the editor(s). MDPI and/or the editor(s) disclaim responsibility for any injury to people or property resulting from any ideas, methods, instructions or products referred to in the content. |
© 2023 by the authors. Licensee MDPI, Basel, Switzerland. This article is an open access article distributed under the terms and conditions of the Creative Commons Attribution (CC BY) license (http://creativecommons.org/licenses/by/4.0/).


