1. Introduction
The presence of H2S is an important issue due to its harmful effects on humans and the environment, but also to its corrosive character, the tending to poison catalysts, etc.; as a problem, it is of a particular interest is the presence of this H2S in biogases. Both, wastes or anaerobic digestion, are responsible for biogas production, and it is currently used for domestic purposes in less developed countries around the world. Due to its high methane content (50%-70%), biogas is a clear substitute to natural gas in a series or practical applications including heat and electricity generation and biofuels. Thus, biogas production has incremented in Europe and other countries, and it is now considered of the utmost importance by the European Industrial Biomass Initiative (EIBI), the European Energy Research Alliance (EERA) or the Strategic Energy Plan (SET) plan.
Also, serious concerns on climate change and the less facile availability of oil and gas reserves (heavy escalated from 2022 by the Russian-Ukraine war), increased the interest of using biogas as a renewable substitute for natural gas. In fact, it is mentioned [
1] about the possibility of scaling up renewable gas production between the beginning of 2020 decade and 2050 to more than 120 billion m3/year, this figure included both renewable hydrogen and biomethane. But this substitution presented problems, because some gases, as it is said above, including H
2S disturbed the usefulness of biogas, thus, its removal from biogas, and in general from gases streams, is of the utmost importance, being various the strategies proposed to reach this goal. Among them, H
2S adsorption on different materials is widely used, being some examples described in the very recent literature:
- i)
metal oxides adsorbents: pristine barium stannate and La
3+ surface modified barium salt, various V
2O
5-based materials, zinc oxide particles [
2,
3,
4],
- ii)
carbon derivatives (including biochars) adsorbents: MgFe2O4-loaded N-doped biochar (from cooked rice waste, activated carbon from petcoke, catalyst-loaded activated carbon, graphite slit nanopores, biochar supported Zn-Al-Fe layered double hydroxide, modified carbon nitride, Cu-impregnated activated carbon, dual chemical mixture or core–shell activated carbons [
5,
6,
7,
8,
9,
10,
11,
12],
- iii)
zeolites-based adsorbents: Cu, Zn, Co, Mn-modified 13X zeolite, polyethylene glycol composites of 4A and Y zeolites or ETS-4 and ETS-10 titanosilicates, NaX and NaY zeolites, metallic-doped zeolitic imidazolate framework-8 coupled with microbiological desorption [
13,
14,
15,
16],
- iv)
biological-based adsorbents: purple phototrophic bacteria, urea-modified copper-based adsorbent [
17,
18],
- v)
nanostructural-based and fibres adsorbents: Cr, Ni, Al, C, Si, O, or S doped boron nitride nanotubes, activated waste jute nanoadsorbent, MIL-101(Cr)@UiO-66(Zr) nanocrystals, PMo12-modified waste rice husk fibres, Aminated polyacrylonitrile fibres [
19,
20,
21,
22,
23],
- vi)
other adsorbent: titanium ilicalite-1/H
2O
2, [
24] and iron oxide [
25].
To contribute to these efforts to find suitable materials to remove H2S from gas streams, the present work presents an investigation about the use of a metal oxides mixture (ZnMn2O4+ZnO+Mn2O3) as adsorbent of H2S from a gas mixture of H2S and N2. The adsorbent is provided by the chemical treatment of an urban waste (spent alkaline and Zn/C batteries), and adsorption experiments are carried out in dynamic mode using a fixed bed column and under various experimental conditions: H2S concentration, gas mixture flow and adsorbent dosage. Column parameters are derived under the various experimental conditions, as well as, the time required for the formation of the exchange zone and the time necessary to establish this exchange zone are calculated. A derived model predicted the breakthrough curves generated under the various experimental conditions, and also an equation to predict the column efficiency is developed in the work. Results show that this adsorbent can be used to clean a gas stream contaminated with harmful H2S.
2. Materials and Methods
2.1Modelling the Adsorption Process
The Bohart-Adams model of fixed bed adsorption [
26] was used to model the H
2S adsorption onto the adsorbent. The model used two coupled first-order linear particle differential equations,
subjected to initial (c = c
0 at z = 0) and boundary (a= a
0 at t= 0) conditions.
In eq.(1), a (-) is the adsorption capacity of the bed (mass of H2S that can be adsorbed per unit mass of solid), c (mass unit) is the solute concentration in the gas flow, k (volume/mass·time units) is the adsorption rate constant, ρs (mass/volume units) is the bed bulk density (mass of solid per unit volume of column units), u(length/time units) is the gas flow velocity, z (length unit) is the axial coordinate along the column, and t (time unit) represented the elapsed time.
At the initial condition, the H
2S concentration in the inlet gas stream is given, whereas at the boundary conditions, the adsorption capacity before the loading of H
2S onto the bed is given. Both formulations represented in eq.(1) are resolved as:
Comparison of the above equations with the experimental breakthrough curve, are done at
z = H, being
H the height of the adsorbent packed in the column. Consideration of the gas flow rate,
q (mass/time units), and the bed mass, m
s (mass units), allowed to write the next expression, which represented the model breakthrough curves:
and k and a
0 values were determined, under the various experimental variables, by least square fitting of the experimental data to eq.(3). Fitting of the different operational conditions are represented in Figure 2, Figure 3 and Figure 4. The use of this model represented H
2S loading onto this ZnMn
2O
4+ZnO-based adsorbent in an adequate form.
2.2. Characterization Techniques
X-ray diffraction (XRD, D8 Advance, Bruker AXS GmbH, Germany) analyses were performed with copper anode (CuKα1 λ = 0.15418 nm) working at 40 kV and 40 mA. Determinations were done on samples rotating at 15 rpm in the interval 10–70° (2θ) and X-ray patterns were acquired with a step/size of 0.02° and time/step of 2s.
The chemical analysis was carried out by means of wavelength dispersion using a X-ray Fluorescence (XRF) technique in a PANalytical equipment (MagicX PW-2424, Philips, The Netherlands) with a Rh anode RX tube (SUPER SHARP) and generator. 2.4 KW.
The chemical composition and elemental spatial distribution were assessed by energy dispersive X-ray microanalysis (EDX, Bruker Quantax) in a Leica 440 Steroscan SEM.
3. Results
3.1. Synthesis of Adsorbent
The adsorbent synthesis was performed following the procedure described in the literature [
27]. The resulting material (black mass) from spent alkaline or Zn/C batteries was treated in several steps comprising electrolyte removal, oxidative leaching and selective two-step precipitation. The final product of these steps was a mixture of ZnMn
2O
4, ZnO and Mn
2O
3 This mixture was used as adsorbent for H
2S. The chemical composition of the oxides mixture is shown in
Table 1.
As it was expected, manganese and zinc formed the predominant species in the material. From the results of the XRD characterization of the oxides mixture (not shown in this article), the phases were quantified by Rietveld refinement. The results are shown in
Table 2. These spinel based compounds have crystal sizes in the range of 50-100nm [
28].
3.2. Dynamic Adsorption Tests
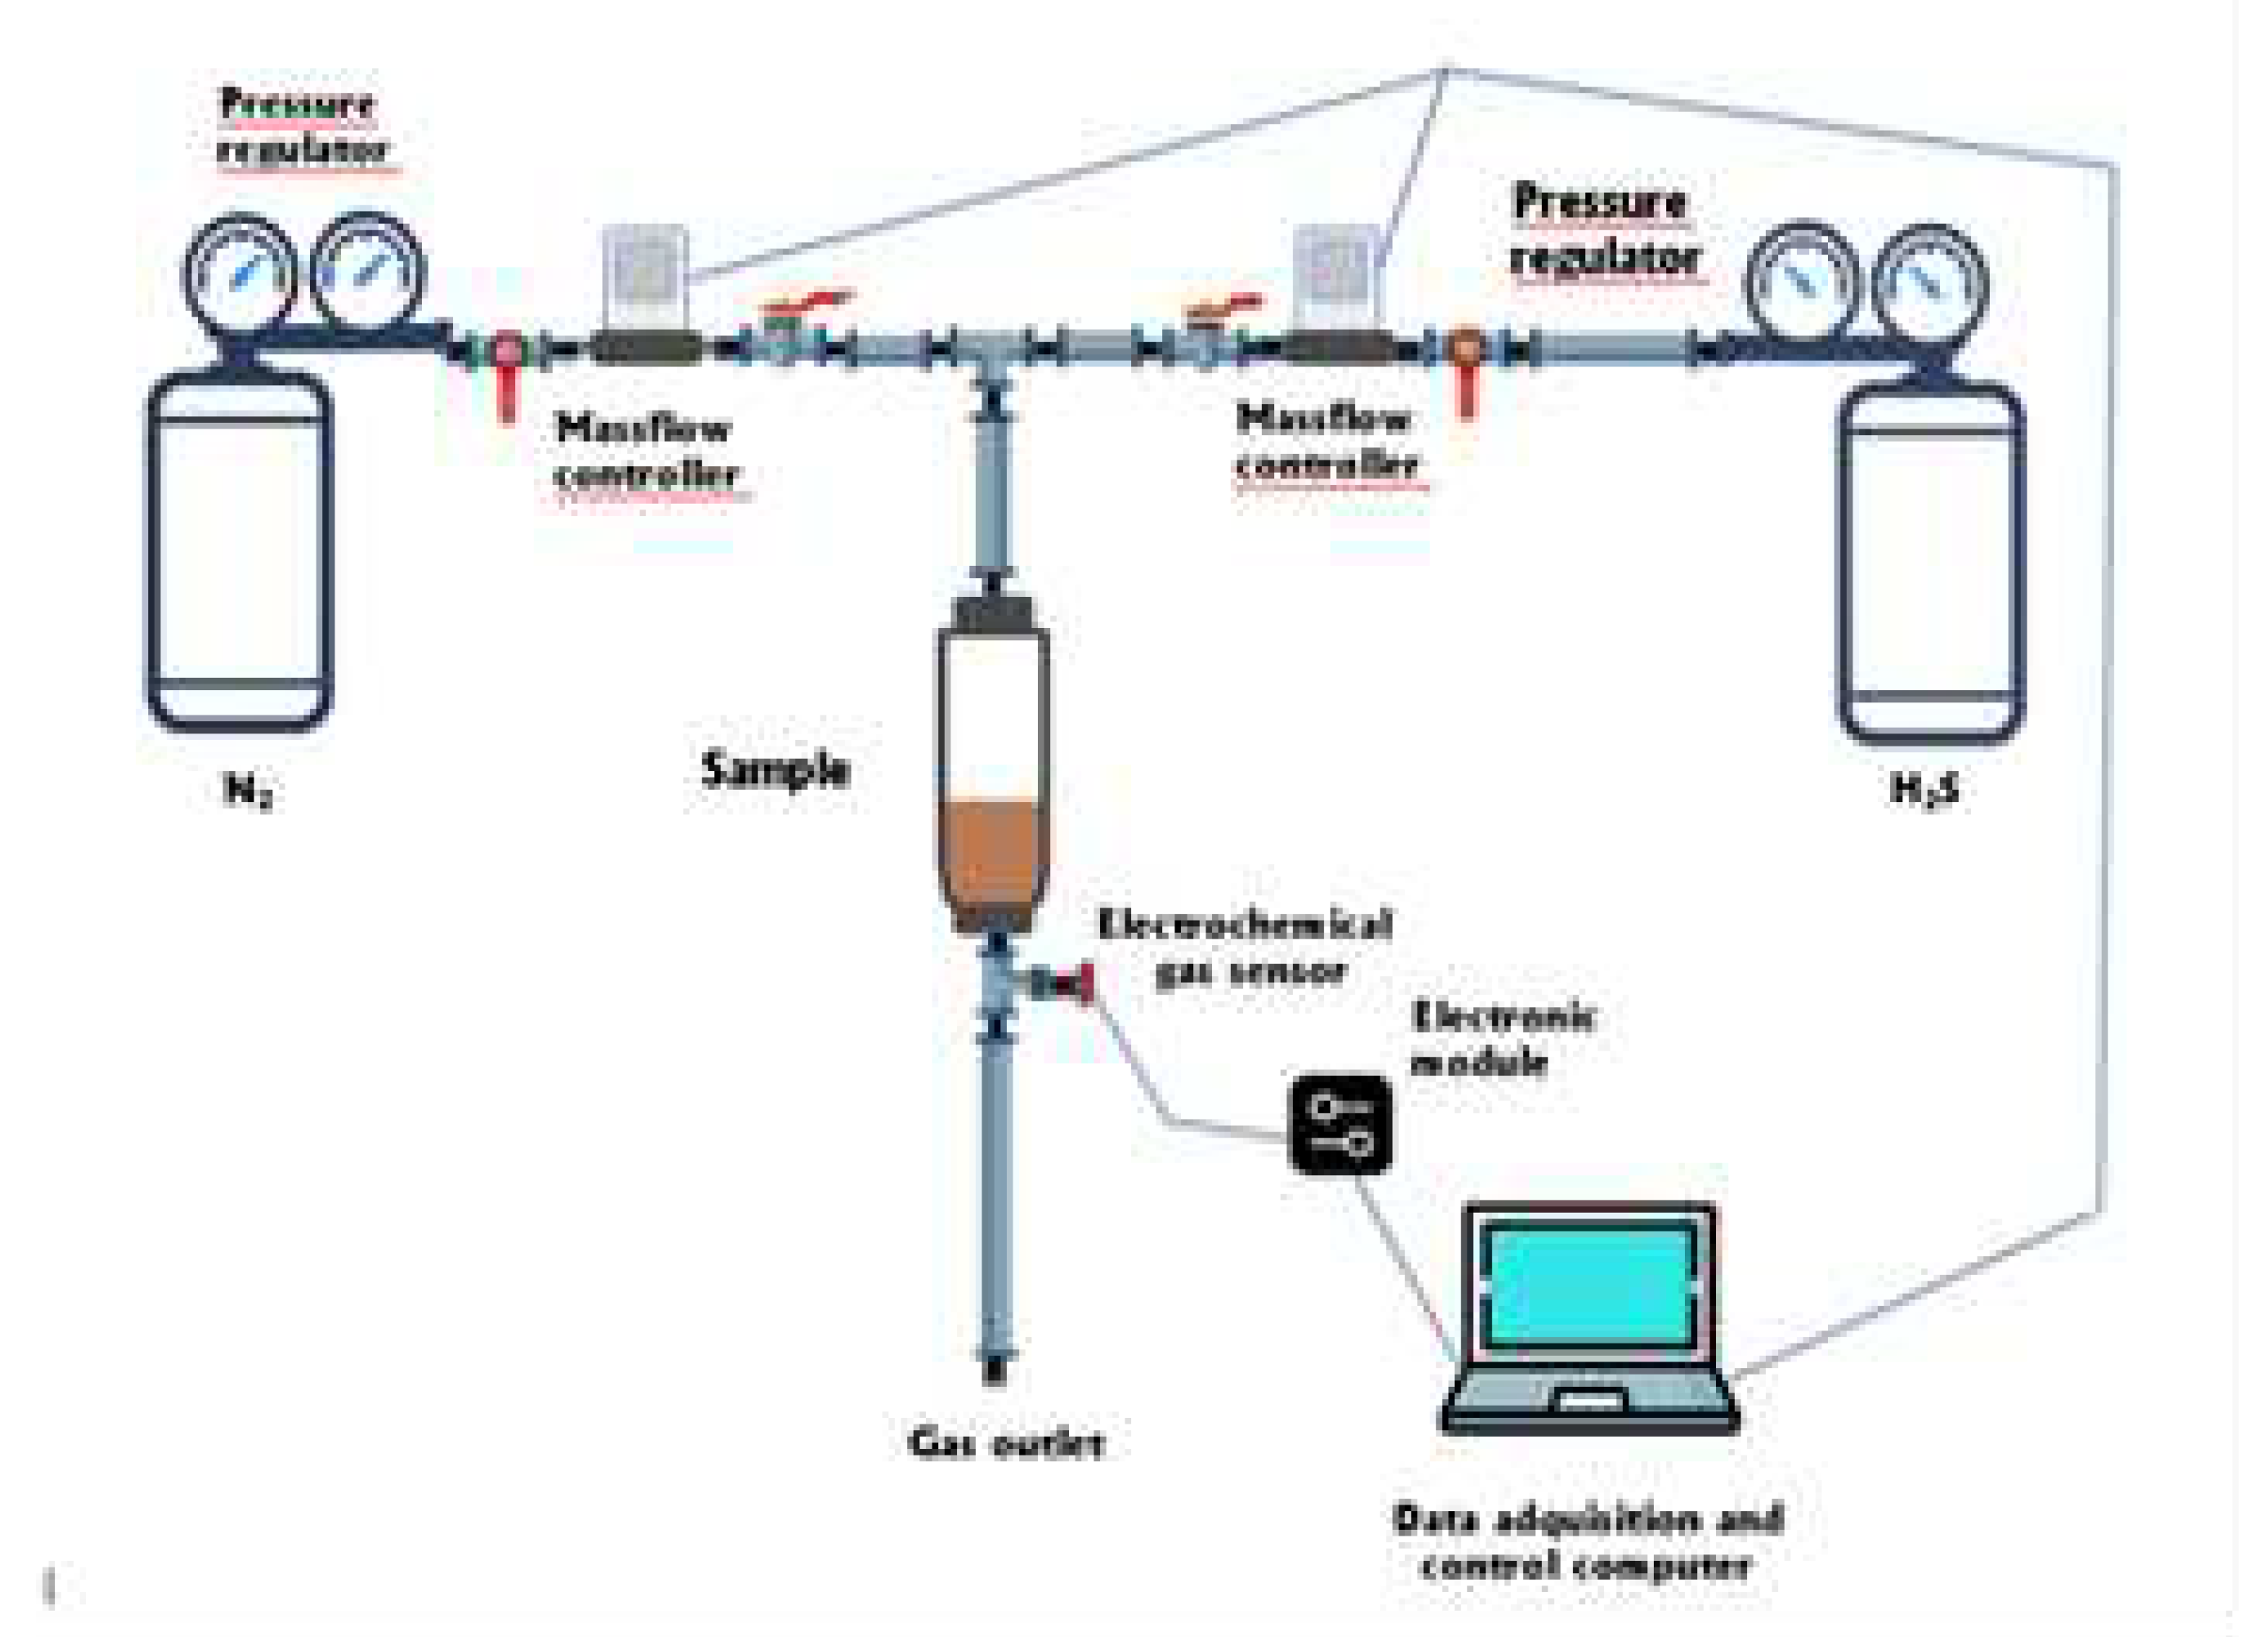
Figure 1 shows the experimental set up designed and installed for the H
2S adsorption determination on to the investigated material. The test was developed at room temperature (20º C). The weighed adsorbent sample is contained in a column. The gas test mixture flows upside down, and the relative proportions of H
2S and the carrier gas (N
2) (from separated bottles) was controlled by Bronk Horst HI-TEC F-201C-FA-22-V mass flow controller in the case of H
2S and by Alicat Scientific MC-500SCCM-D mass flow controller for N
2. The flow range varied between 0 and 200 mL/min in the case of the H
2S controller and between 0 and 500 mL/min in the case of the N
2 controller. An Amphenol SGX Sensortech 4 series electrochemical gas sensor was used for online determination of the H
2S concentration exiting the column. Data was stored using a data acquisition computer running specific software (SGX ECVQ-EK3 Gas Sensor Evaluation KIT V 2.1.0). With the same computer the mass-flow controller parameters are established.
In the present work, the breakthrough point or time is estimated at the time in which the next relation is equal to 0.051:
where [H
2S]
out and [H
2S]
in are the H
2S concentrations exiting and feeding the column, respectively.
3.3. Column Parameters
These parameters were calculated according to the next formulation [
29]:
where D
w was the weight distribution coefficient, V
0.5 was the volume of gas exiting the column at [H
2]
out/[H
2S]= 0.5, V
d was the dead column volume, V
p the intergranular volume and W
d the adsorbent mass packed in the column.
where D
b represented the bed distribution coefficient and d
a was the adsorbent density.
where C
ep was the capacity at the end point [H
2S]
out/[H
2S]
in= 0.95, V
ep was the gas volume exiting the column at this same point, and V
a was the volume of adsorbent in the column.
in the above equation, C
ep-bp was the capacity from the breakthrough point to the end point and V
bp was the exiting gas volume to the breakthrough point.
Equations (9) and (10) were used to calculate the time necessary for the formation of the adsorption zone (t
az) and the time at which the adsorption zone was established (t
ae), respectively:
where Q was the gas flow.
4. Results and Discussion
Prior to a practical application of a given adsorption system, it is of a necessity to investigate the H2S performance of the adsorptive material under various experimental operational conditions. Thus, in order to further investigate the potential of this oxides mixture, various experimental parameters were considered to investigate their influence on the performance of the present adsorbent.
4.1. Influence of the Inlet H2S Concentration
The removal of H
2S from the gas stream was investigated in a fixed-bed column at 20º C.
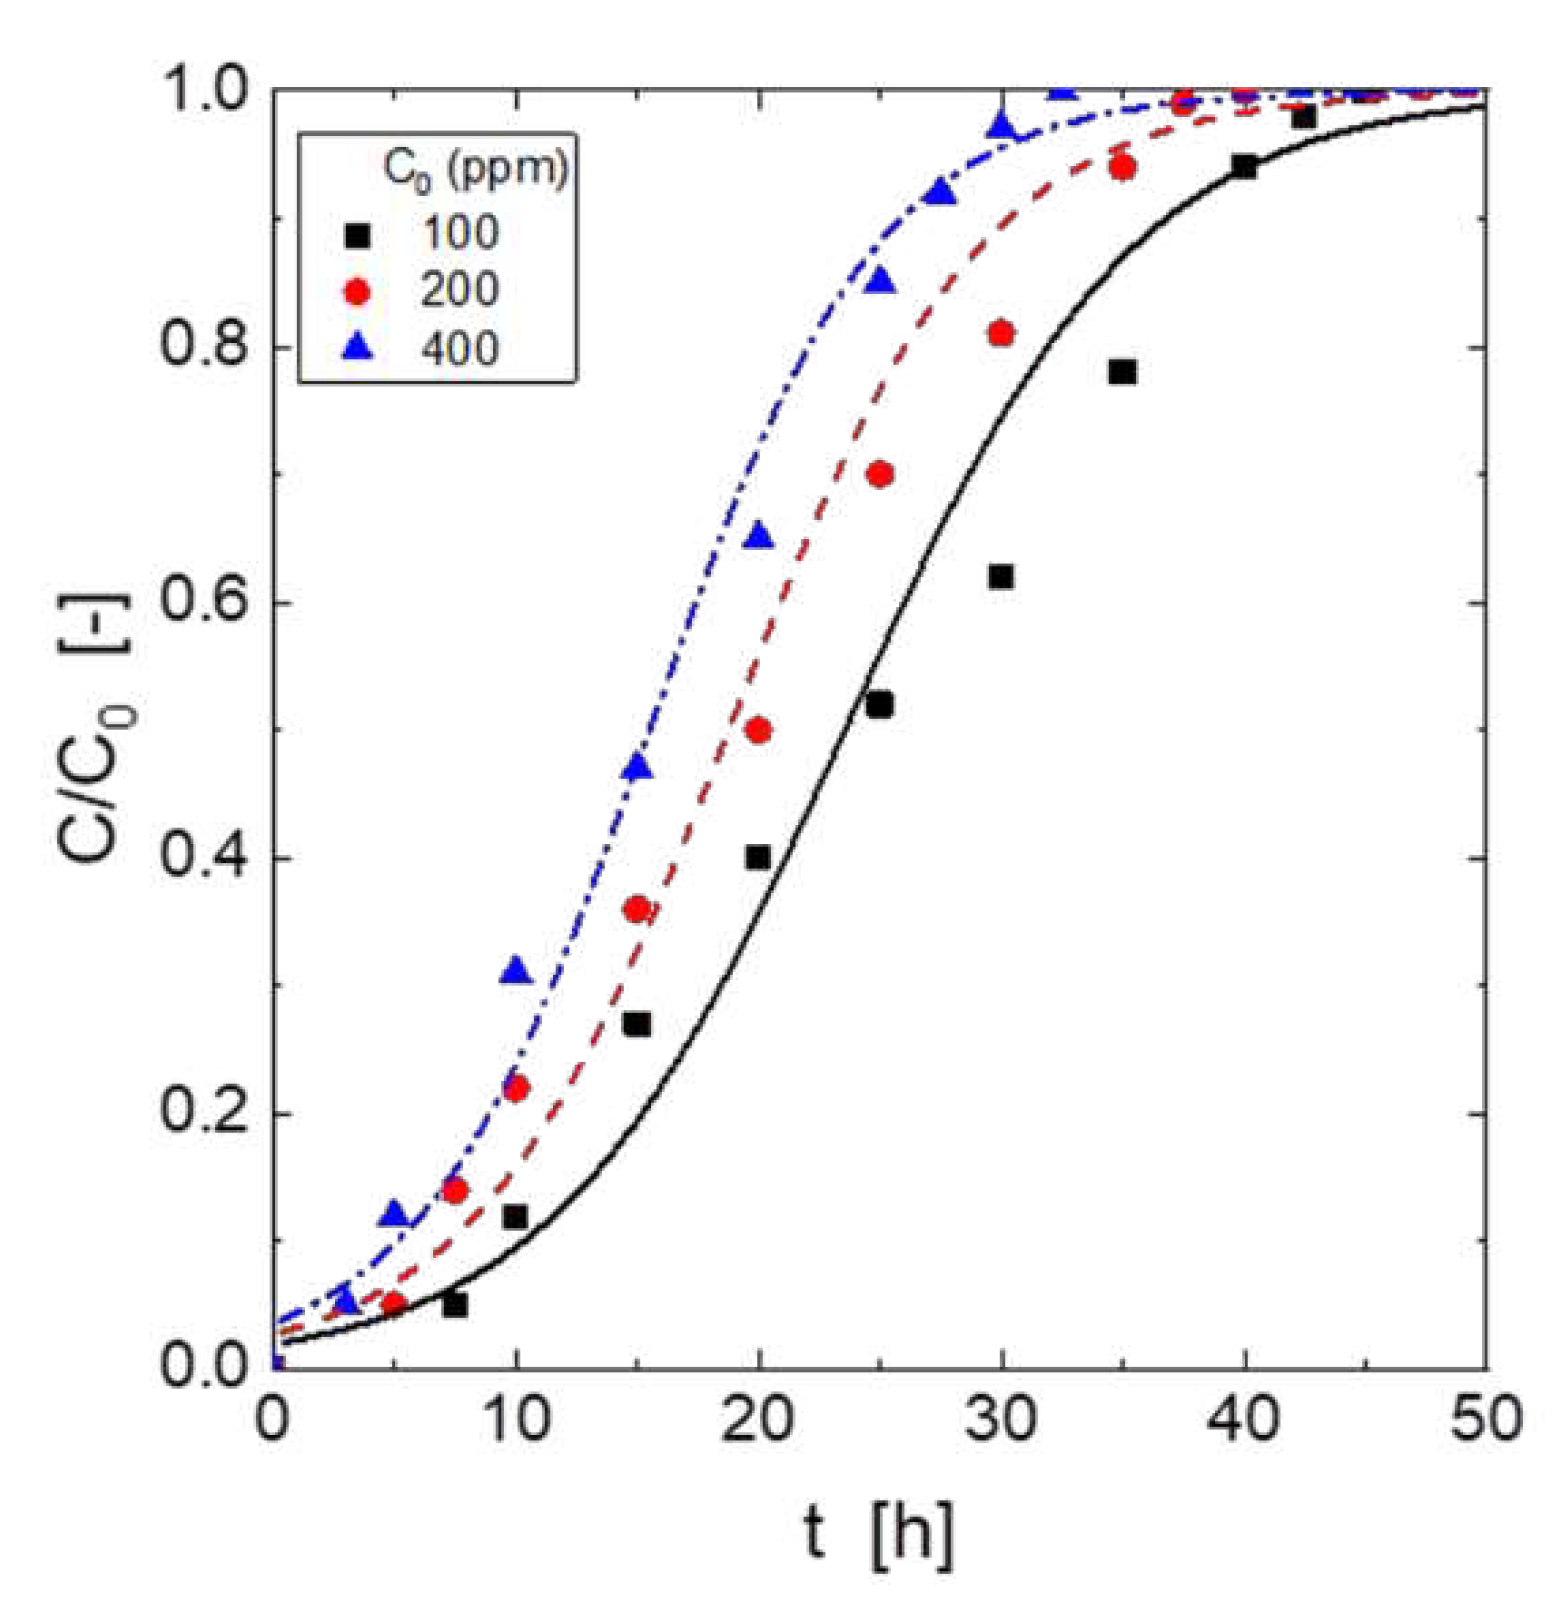
Figure 2 showed the influence of H
2S concentration entering the column on H
2S adsorption. The figure showed that the H
2S capture ability of the adsorbent material depended on the inlet H
2S concentration; it can be seen, that the greater the inlet concentration was, the shorter the breakthrough time. It was also shown in the Figure, that the slope of the curves became fairly similar, and the period time between the breakthrough time and the time in which the adsorbent was completely loaded by the gas increased due to increase in the inlet H
2S dosage. Apparently, the H
2S concentration entering the column and the H
2S concentration exiting the column at the breakthrough point presented any relationship.
These results were attributable to that the similarity in the slopes yielded using the different H2S concentrations entering the fixed bed, and to that an increase in this H2S concentration produced and increase in the period time comprised between the breakthrough point and the point in which the bed is considered to be loaded with the gas ([H2S]out/[H2S]in = 0.95).
The above results to that the increase of the H
2S concentration entering the column produced a longer mass transfer zone in the packed bed. For the greatest inlet concentration gas phase, the breakthrough time was 3 hours, whereas for the lowest concentration the breakthrough time was extended to 7.5 hours.
Table 3 showed typical breakthrough capacities, when the inlet H
2S concentration was 400 mg, the H
2S breakthrough capacity of the adsorbent material was 7.9 g/g. A H
2S capture of 5.0 g/g can be reached when the inlet gas concentration was 100 mg.
The gas stream volumes exiting the column to the breakthrough point were 99 L for 100 mg H
2S, 66 L for 200 mg H
2S and near 40 L for an initial H
2S concentration of 400 mg. Considering these exiting volumes and the order of occurrence of each plot in
Figure 3, it can be observed that lowest H
2S concentration produced the larger volume of clean gas.
When the concentration of the pollutant in the gas stream is the highest (400 mg), the quickest the column was saturated. The total volume to the exhaustion point was near 548 L and 383 L for inlet H2S concentrations of 100 and 400 mg, respectively.
Using eqs. (5-10), the column parameters at the various inlet H
2S concentrations were calculate and summarized in
Table 4. Also, times required for the formation and establishment of the adsorption zone were showed in this same Table. It can be observed, the increase of the toxic gas concentration feeding the column produced an increase of both types of capacities, whereas the times associated with this adsorption were longer with the lowest H
2S inlet concentration.
4.2. Influence of the Gas Mixture Flow
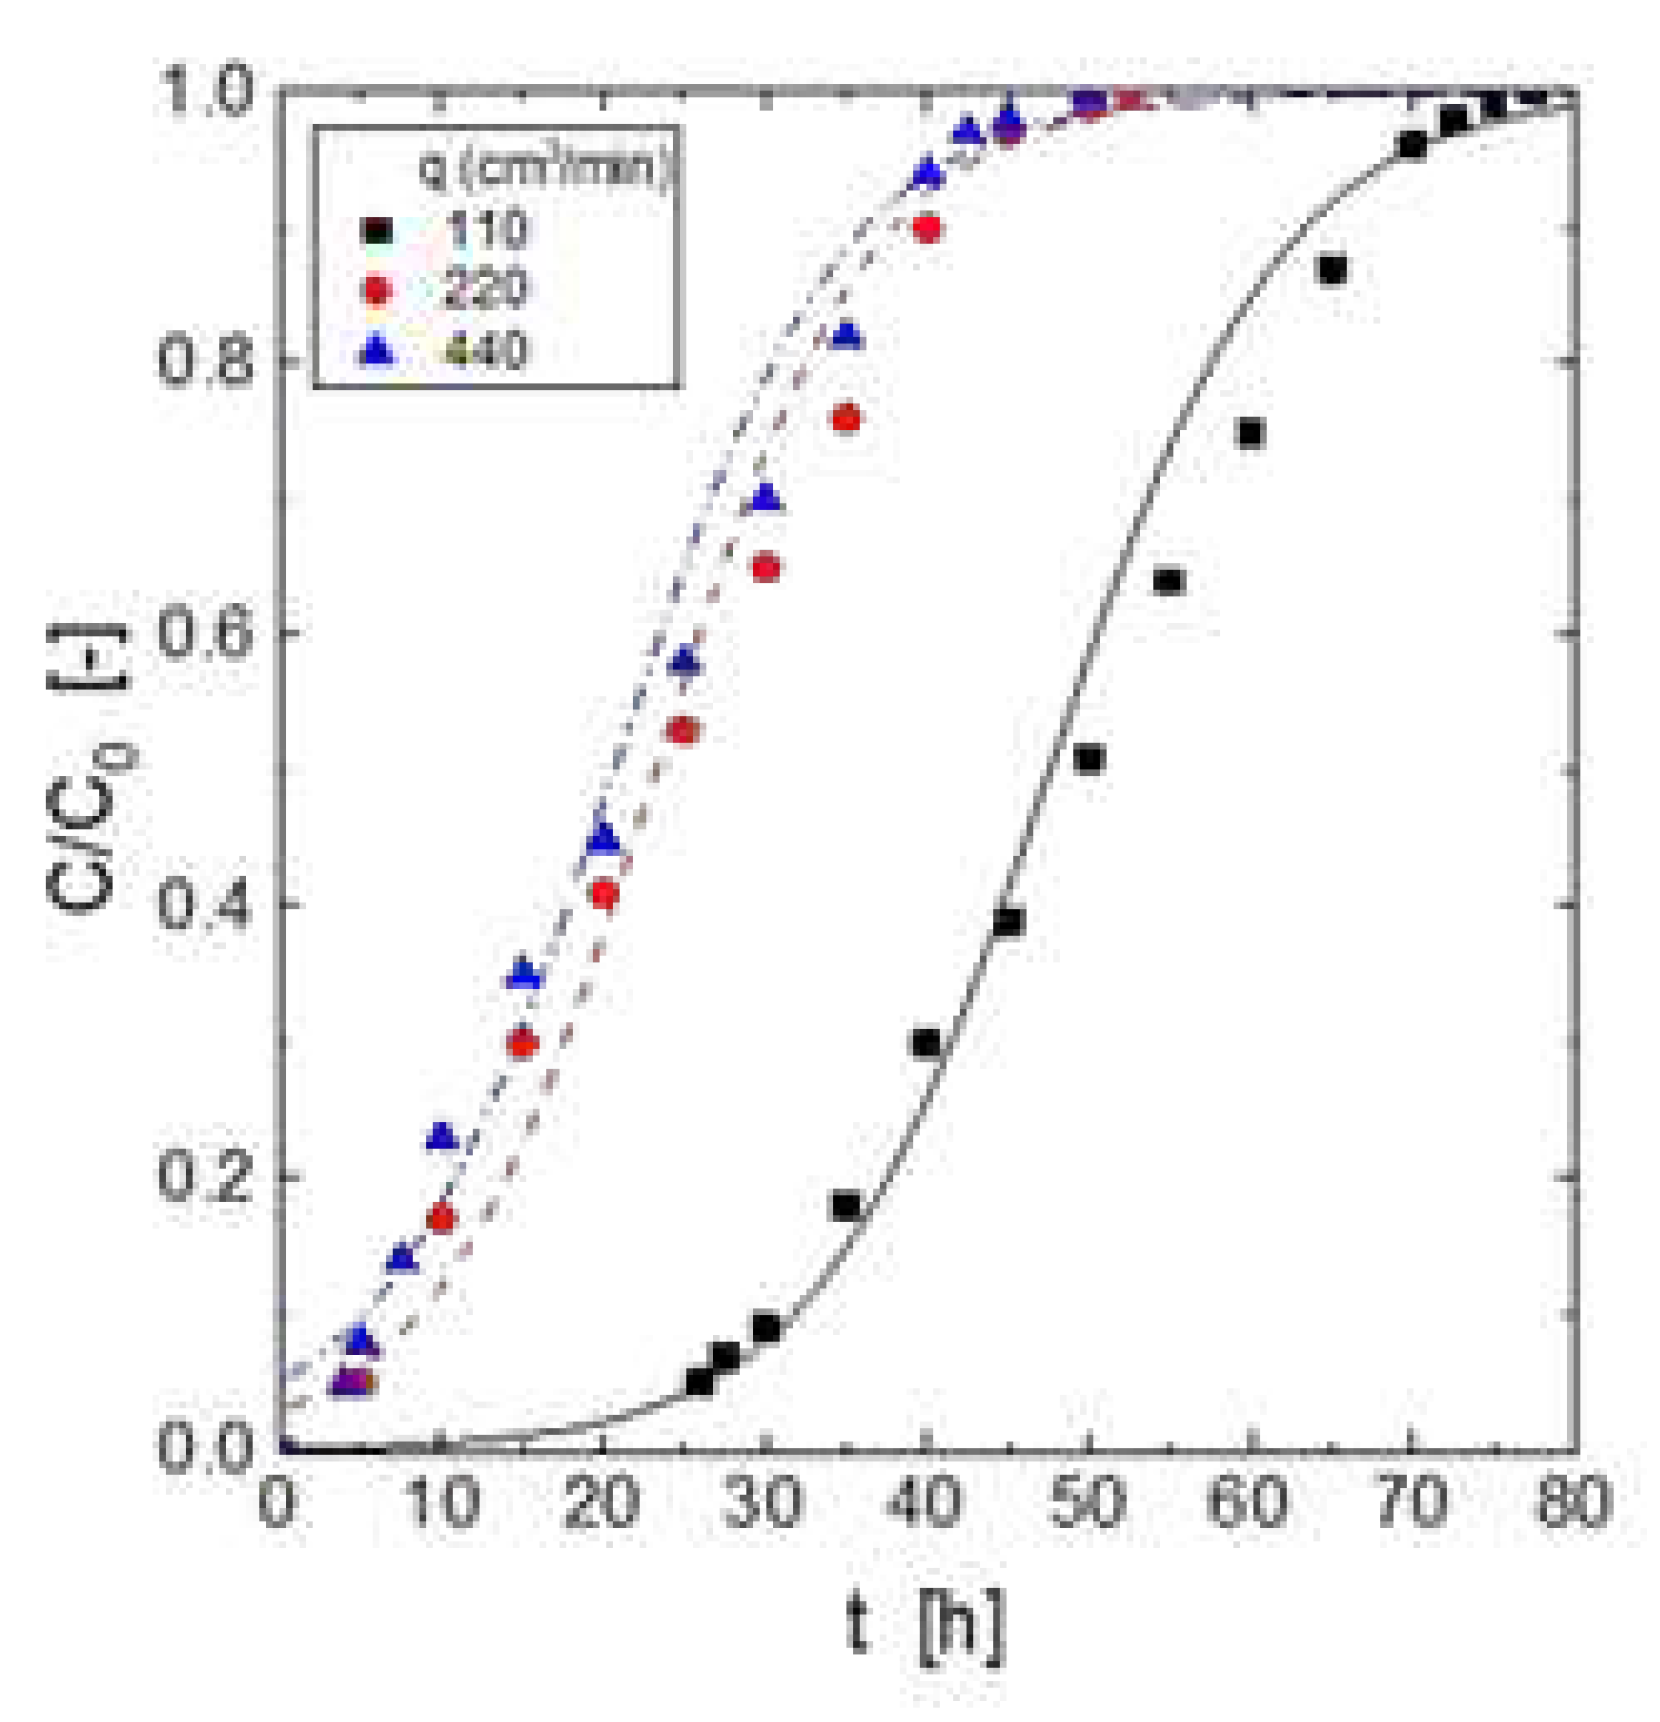
Figure 3 showed the breakthrough curves at various gas flow rates, whereas its corresponding breakthrough capacities was shown in
Table 5. From
Figure 3, it can be seen that the increase of the gas flow rate decreased the time to reach the breakthrough point. Lower gas flow resulted in longer times to reach the breakthrough point, and the loading curve presented a smoother shape; less pronounced breakthrough curves may be an indication of lower H
2S loading onto the adsorbent, however, these results indicated against the above. According with the literature [
30], the breakthrough curves were pictures of the phenomena occurring in the mass transfer zone of the bed. A non-reversal adsorption process, similarly to that of the present study using metal oxides mixture-based beds, and before the breakthrough point, there was always unused adsorbent to evolve a mass transfer zone ready to react with the gas stream entering the column. Thus, the gas exiting the bed remained undetected, being the rate at which the adsorption occurred, the overall rate corresponding to the mass transfer zone. The displacement of the mass transfer zone towards the bed bottom produced that there was not more available unused adsorbent to react with the gas entering the column, and unreacting H
2S exits the column. If one considered an infinite overall reaction rate, the mass transfer zone occurred in a thin layer of adsorbent, and the H
2S concentration exiting the column equalled the inlet value in a very short time. In this condition, the breakthrough curves adopted an ideal vertical shape when [H
2S]
out/[H
2S]
in was represented against time.
However, this situation was uncommon because in the mass transfer zone the corresponding reaction rate occurred to be finite, thus, the slower the overall reaction rate in the mass transfer zone the lesser the step shape of the curves.
Figure 4 showed that a greater reaction rate was accompanied by a greater flow rate, the above being attributable to that mass transfer regime controlled the process.
Table 5 resumed the quantitative results of the above series of experiments. At a flow rate of 110 cm
3/min, the H
2S removal capacity was 17.2 g/g. With an increase of the flow rate to 220 cm
3/min, H
2S uptake decreased to near 7 g/g. These results indicated that this Zn-Mn-oxides mixture was best suitable for H
2S removal from a gas stream using low flow rates, with the best capacity ability, under the present experimental conditions, of 17.2 g/g.
Table 6 showed the column parameters calculated for the various flow rates investigated in the present work. The increase of the flow rate produced an increase of both solute uptakes at the exhaustion point and from the breakthrough point to the exhaustion point. Also, the time necessary for the formation and the establishment of the adsorption zone increased with the decrease of the gas flow rate feeding the column
4.3. Influence of the Adsorbent Dosage
In order to investigate in-depth influence of the adsorbent dosage on the H
2S removal process, this work performed H
2S adsorption tests at adsorbent dosages of (2, 4 and 6 g).
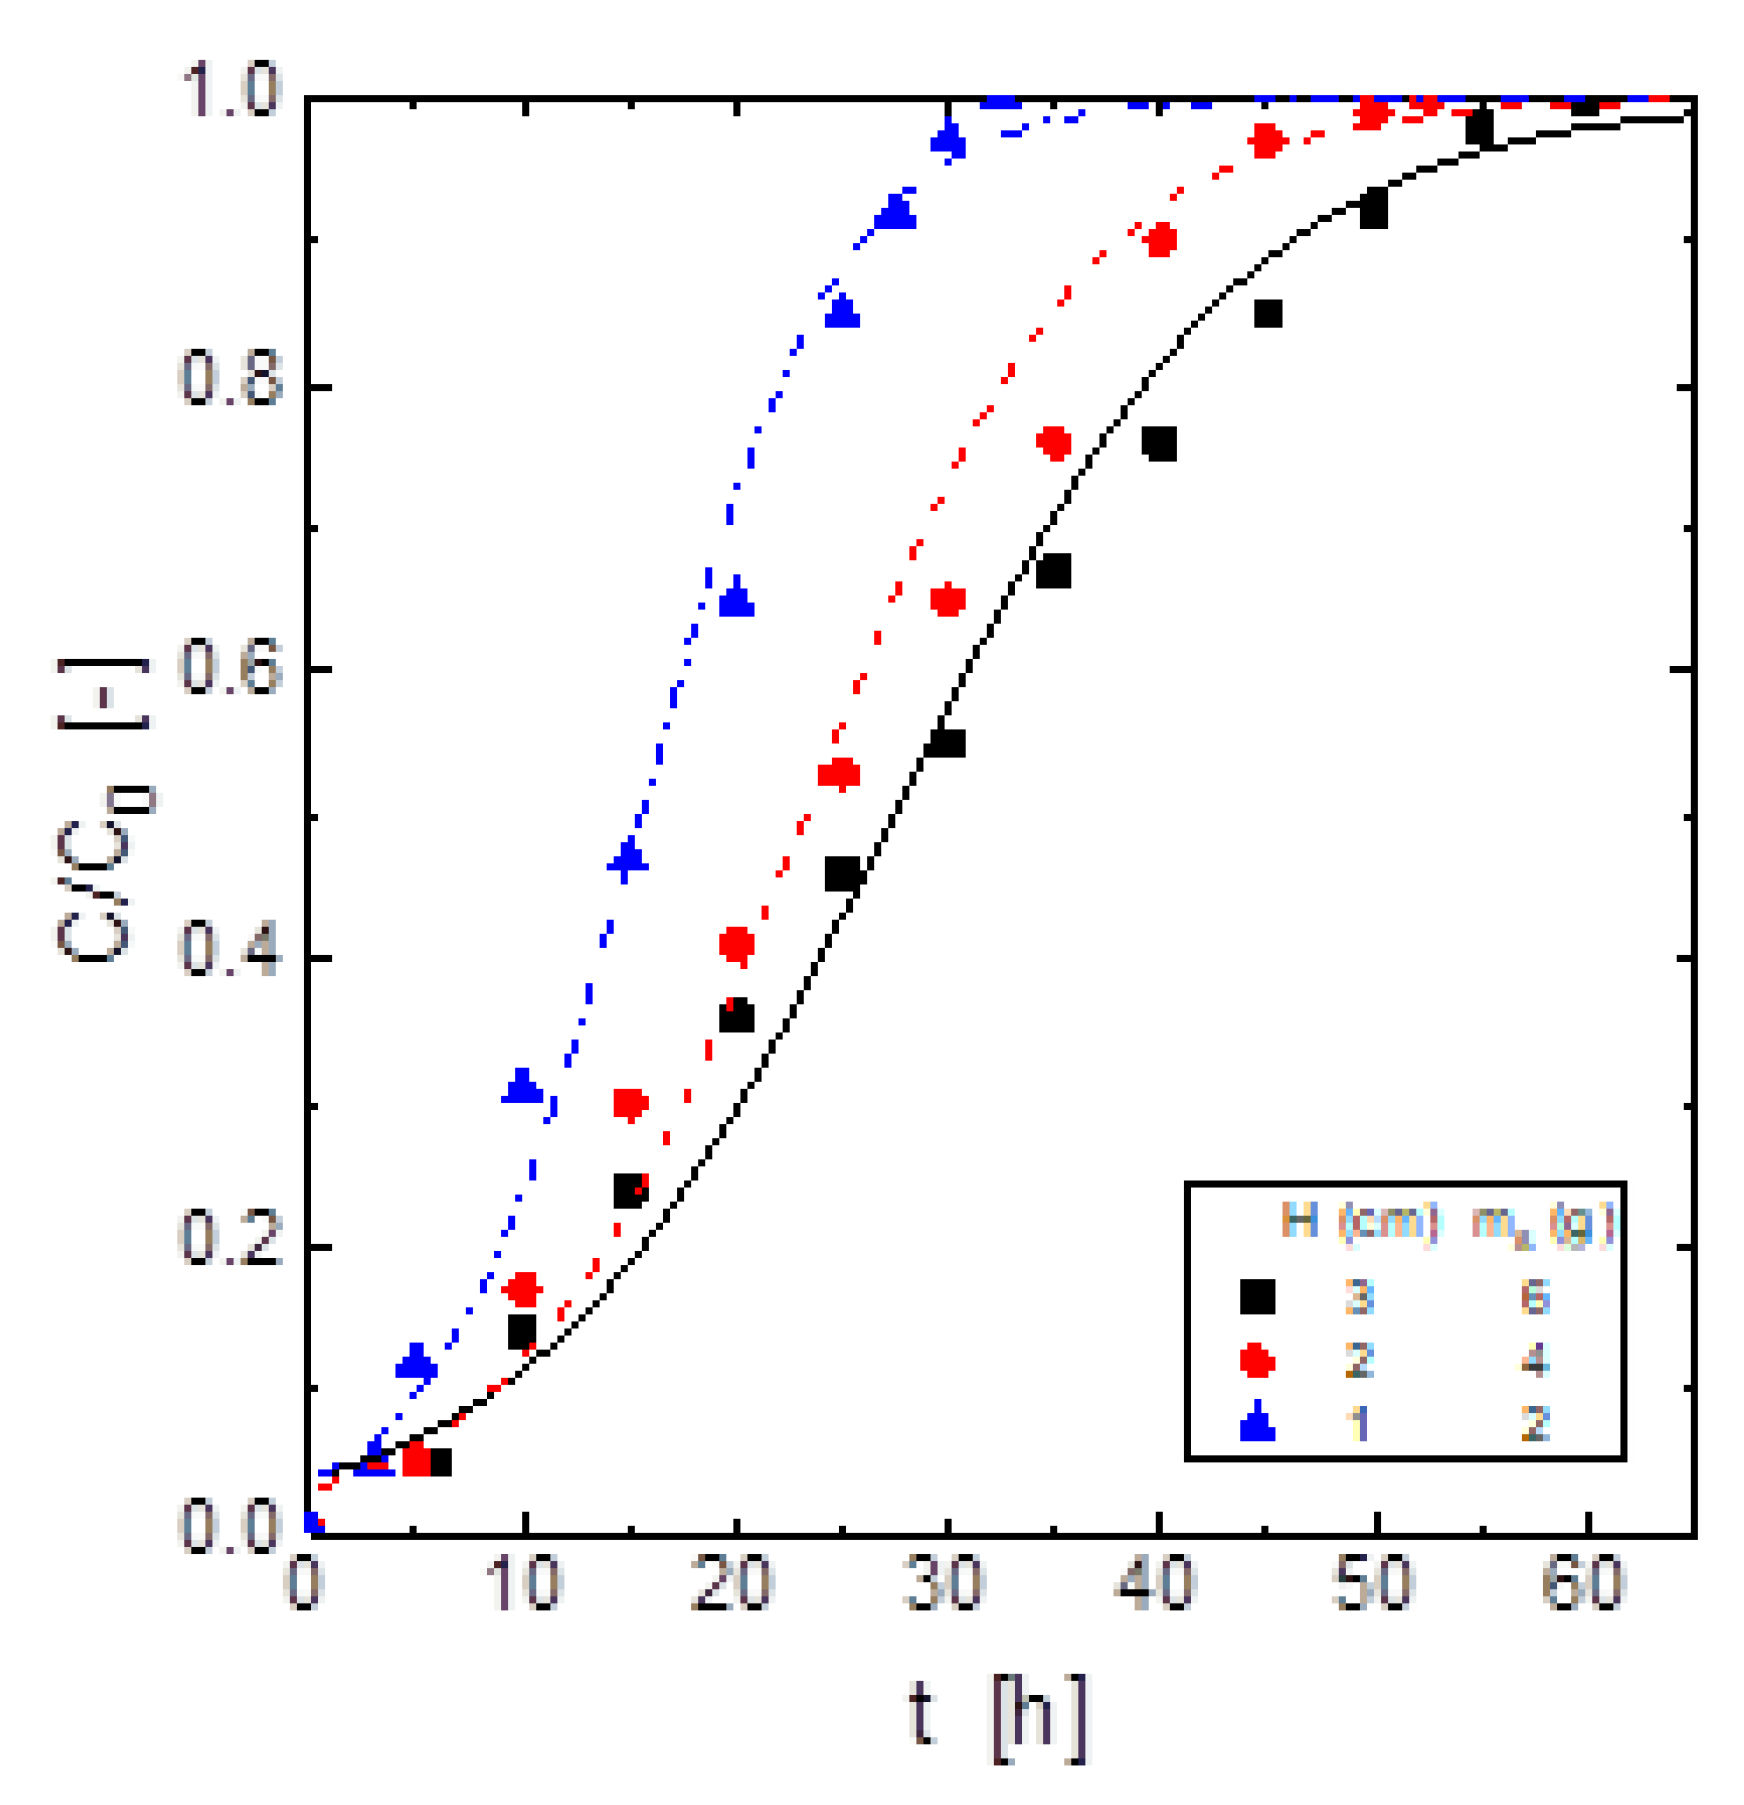
Figure 4 showed that when the adsorbent dosage was increased, the adsorbent material showed a greater H
2S adsorptive ability in terms of reaching the breakthrough point at more extended period time. However, the greatest adsorption capacity was yielded using the lowest adsorbent dosage (
Table 7). The load of H
2S on this material was connected to the moving boundary model, and the mass transfer across the adsorbent shell particle dominated, as a consequence, an increase in the thickness of the shell produced a decrease in the adsorption rate of the gas.
The variation of the adsorbent dosage packed into the column resulted in a variation of the volume of the gas exiting the column to the breakthrough point, thus, using 2 g of the adsorbent, this volume was of 40 L of clean gas, whereas with a dosage of 6 g, the corresponding volume was of 79 L. That is, the increase of the adsorbent dosage resulted in an increase of the volume of clean gas exiting the column.
As
Figure 2,
Figure 3 and
Figure 4 showed, the breakthrough curves followed the S-shape profile, which was common of most of the cases of adsorption processes by column operational methodology. Whereas in
Figure 3,
Figure 4 and
Figure 5 fitting of eq.(3) to the various experimental conditions were shown as continuous lines,
Table 2,
Table 4 and
Table 6 showed k and a
0 values resulting from these fitting. Within the model used in this work, H
2S loading onto this ZnMn
2O
4+ZnO+ Mn
2O
3-based adsorbent is well represented.
Under the various experimental conditions, the adsorbent material showed similar adsorption behaviour. It can initially adsorb H
2S efficiently in order to maintain H
2S concentration in the gas stream exiting the column to meet the purification level ([H
2S]
out/[H
2S]
in<0.051), and then breakthrough occurs in a very short time, which can be attributed to a fast reaction kinetics of gas adsorption by the adsorbent material [
7,
31].
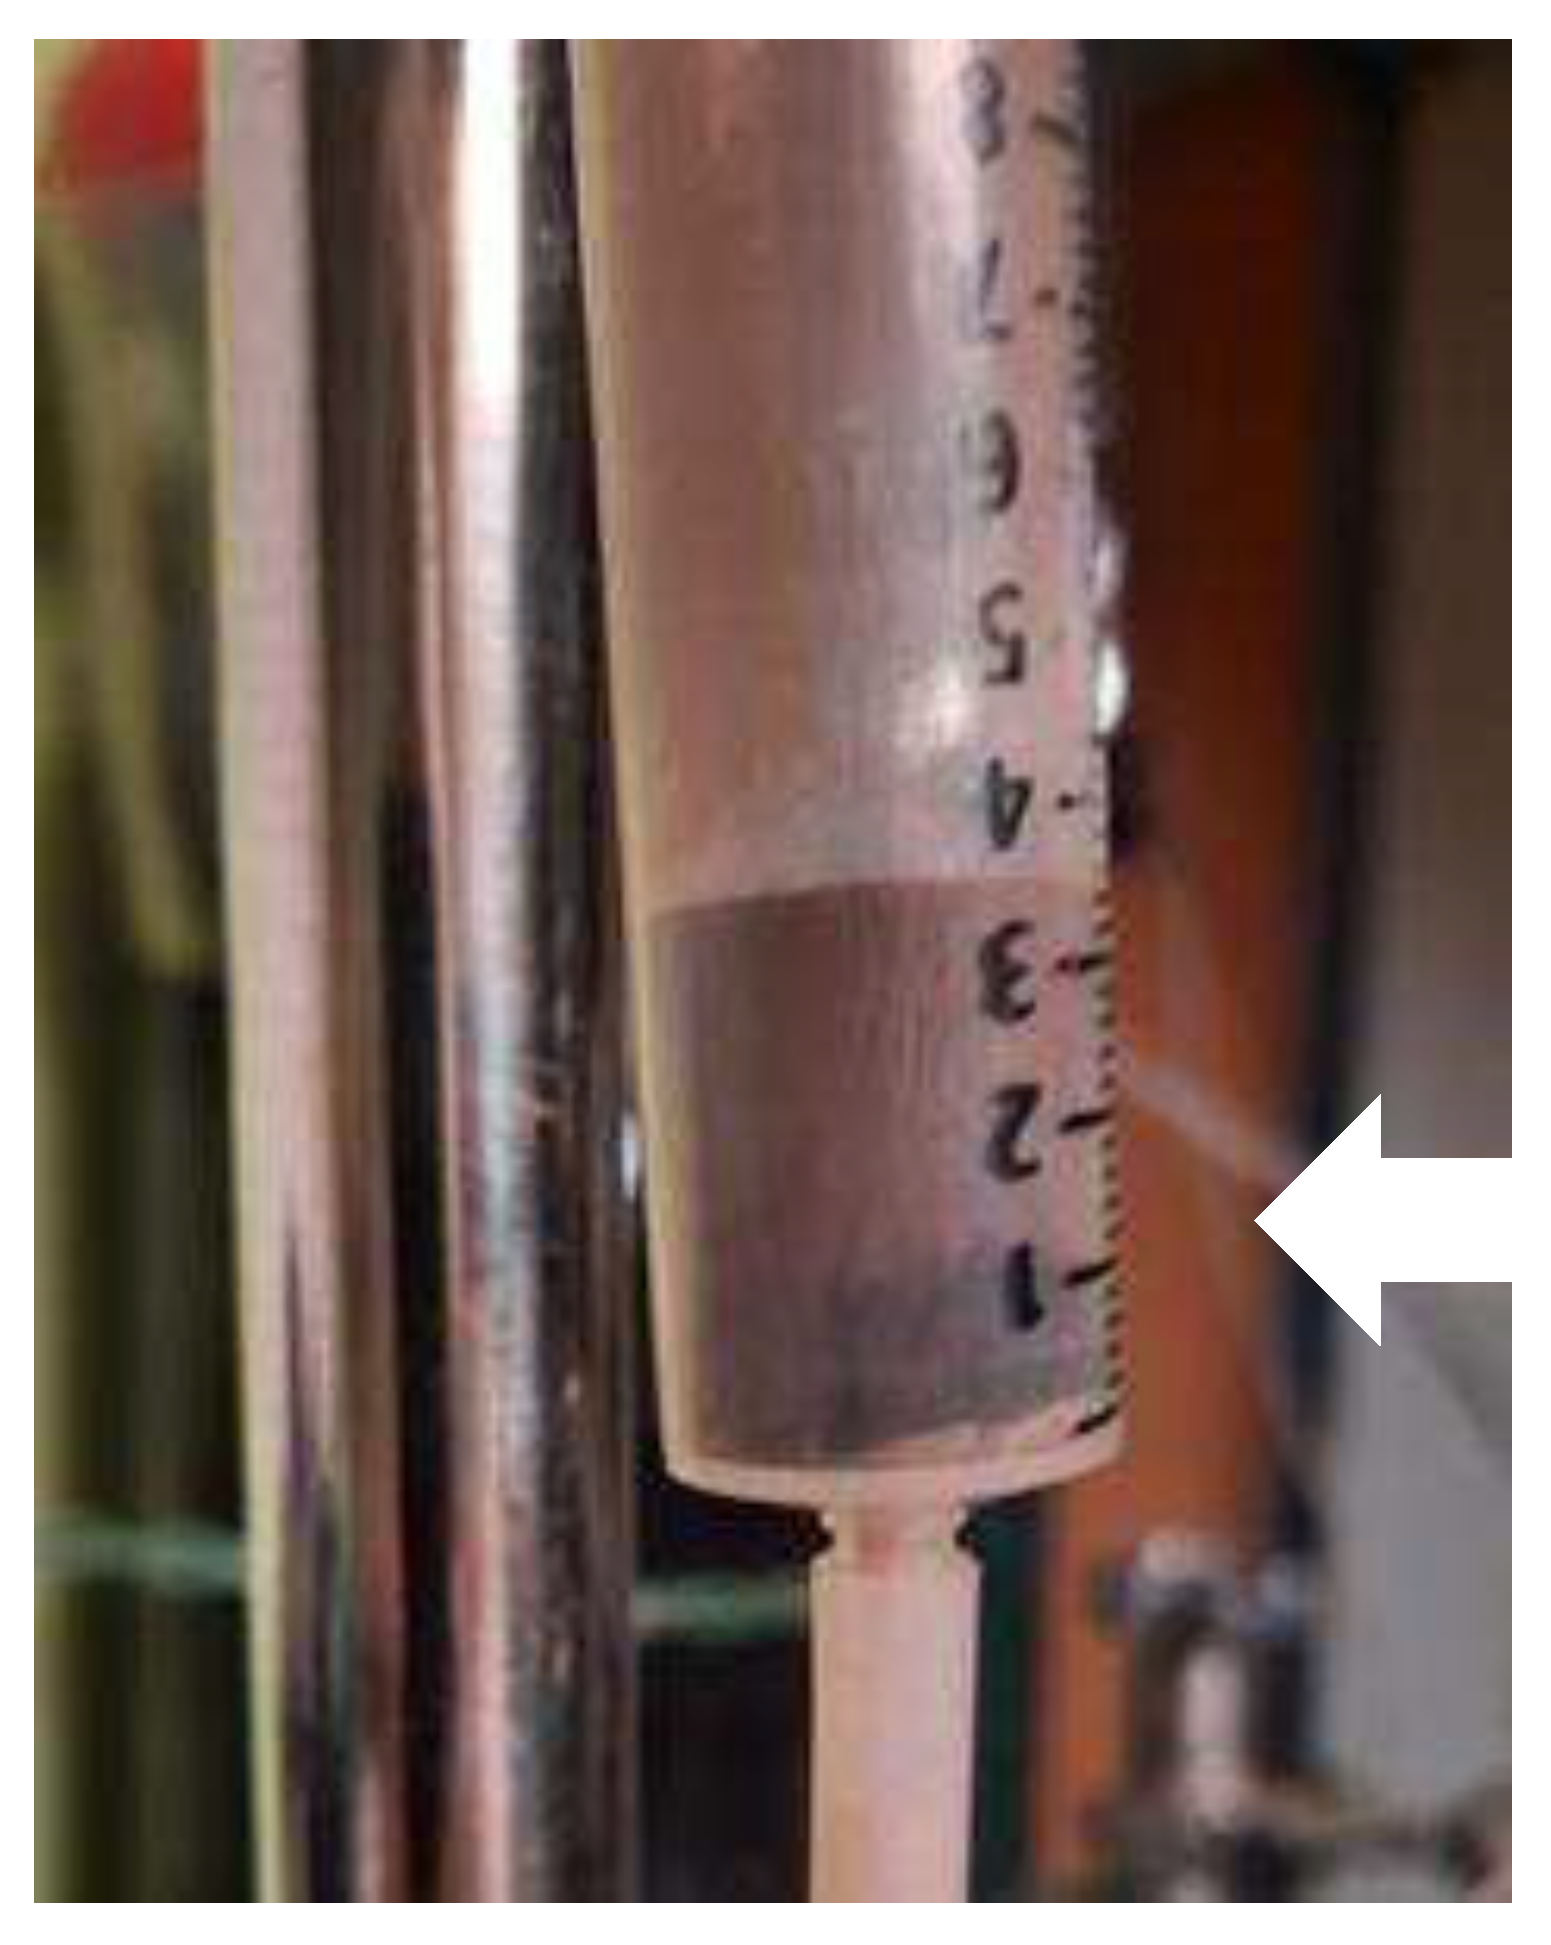
Adsorption of H
2S on the metal oxides mixture causes a colour change of the adsorbent from dark brown to light brown (
Figure 5), this change of colour is observed in the upper part of the adsorbent bed.
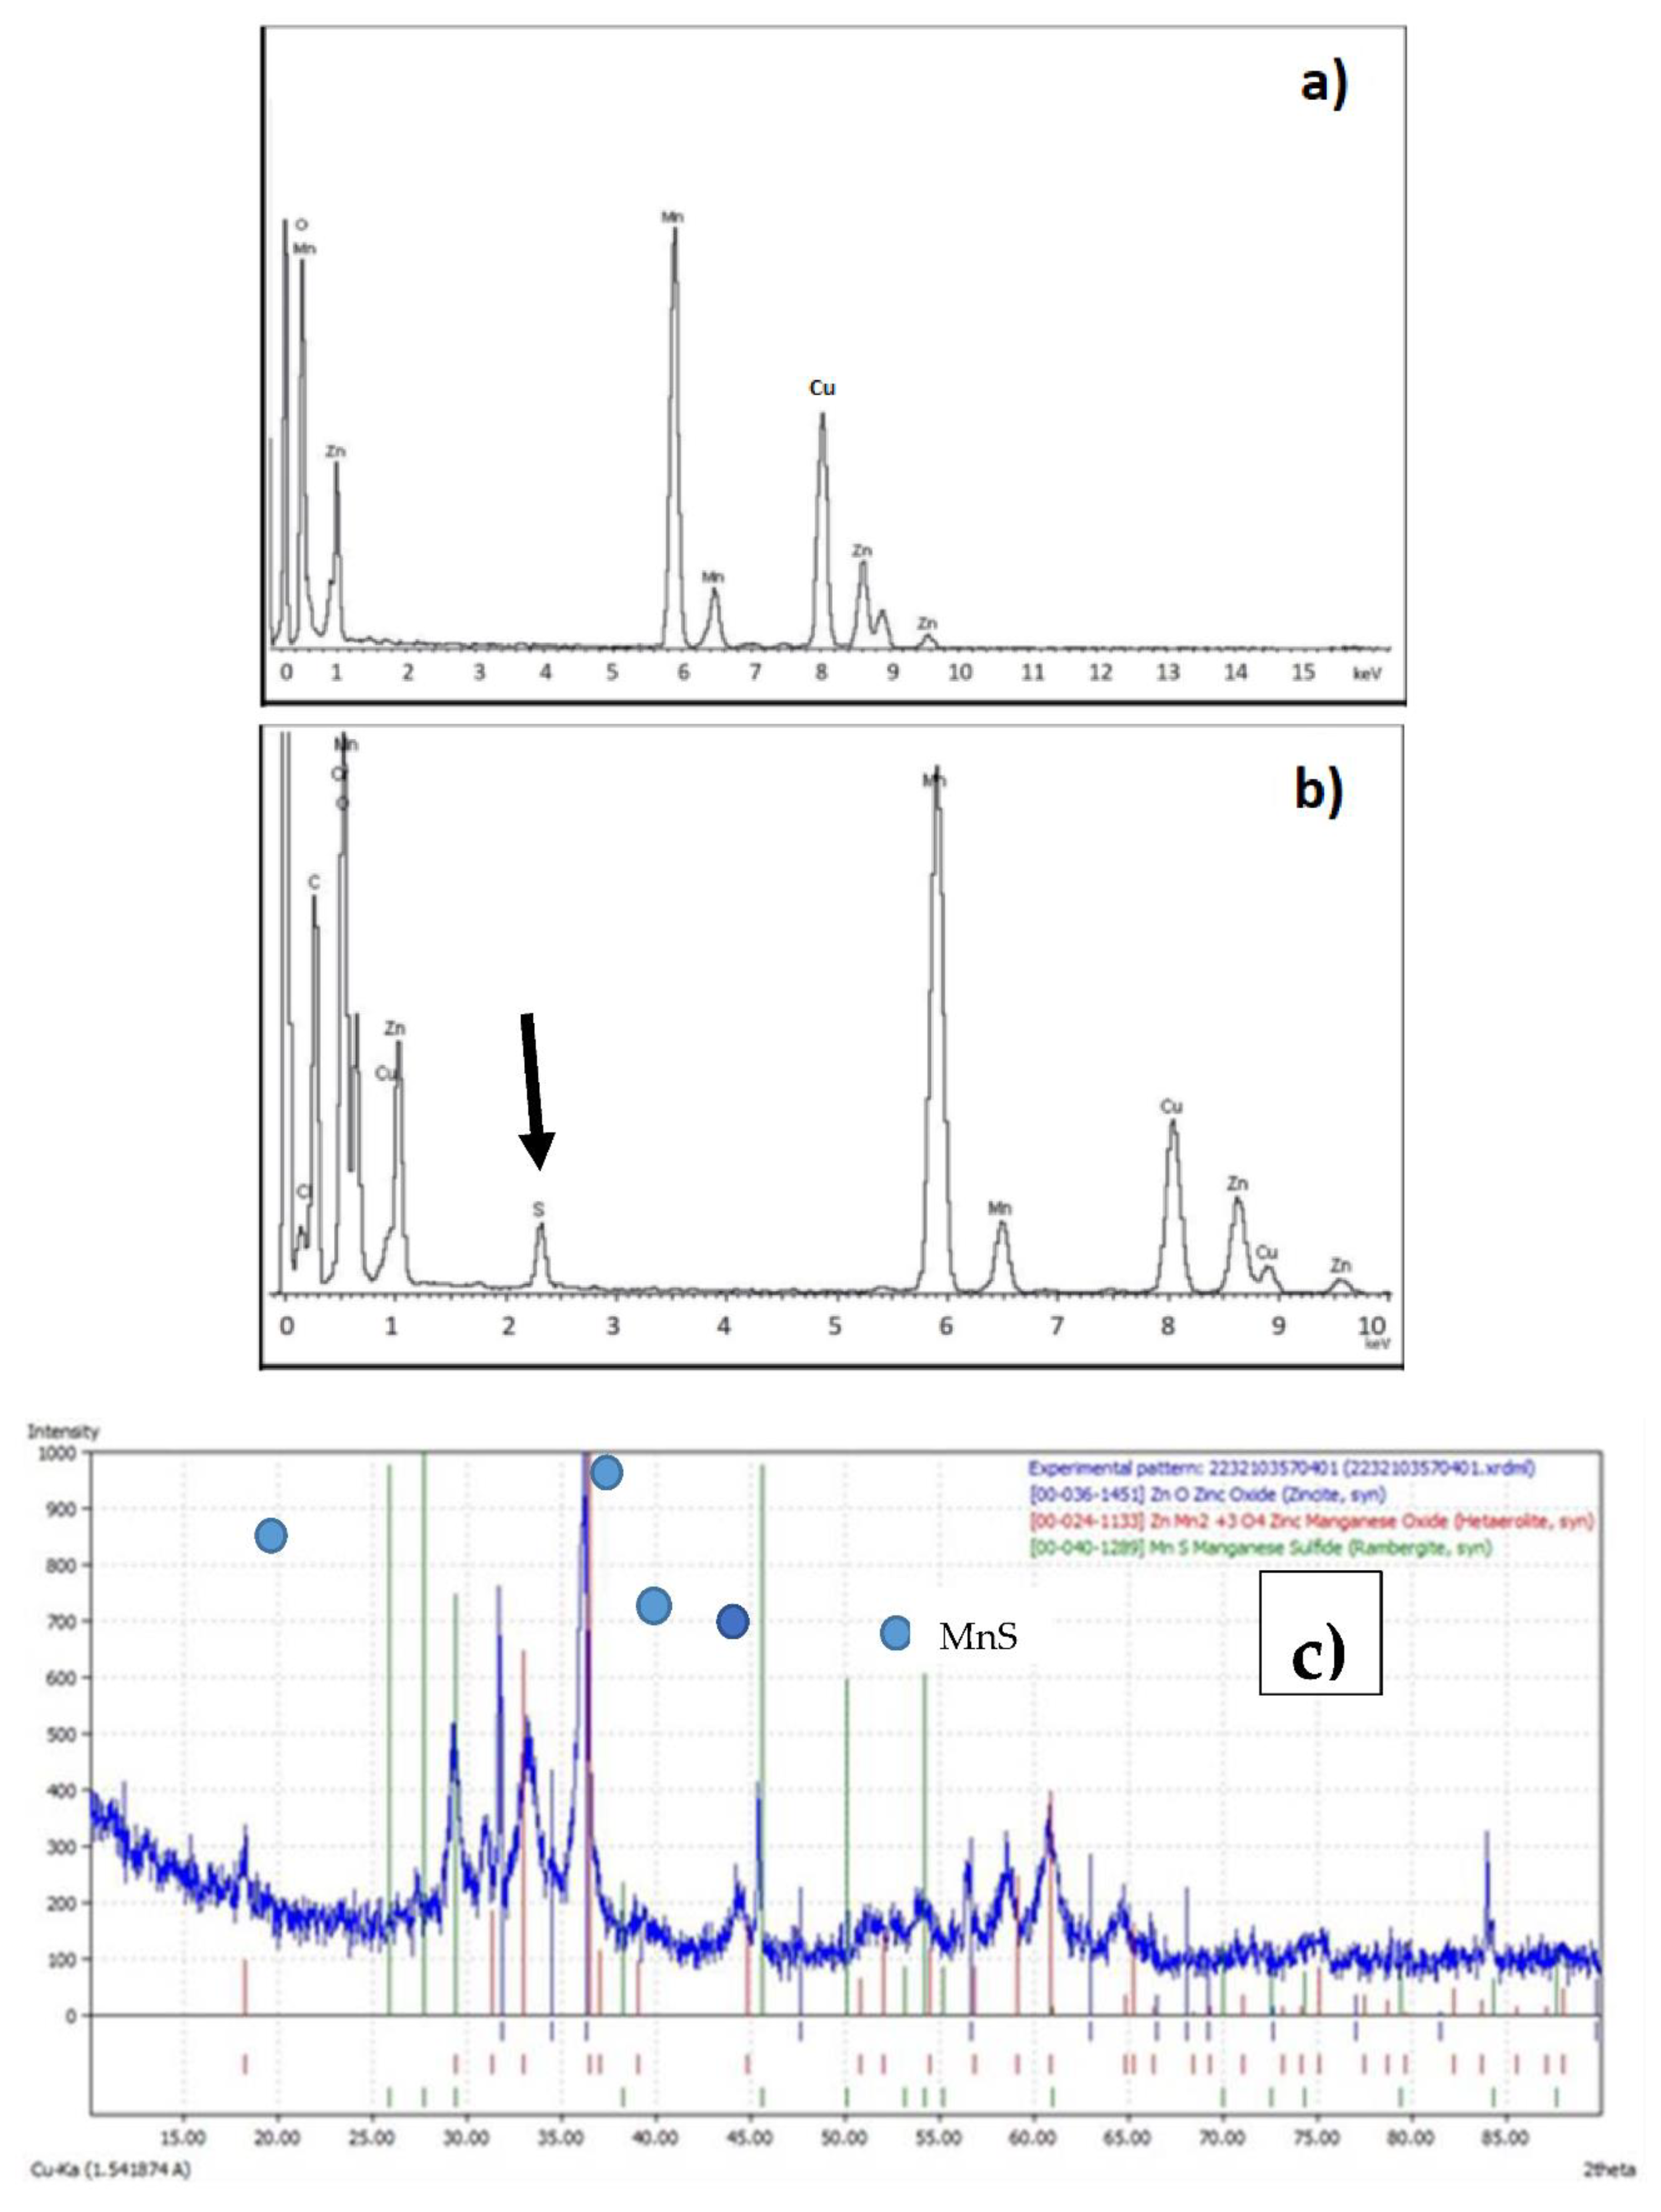
Figure 6a shows the EDX spectrum of the oxide mixture before the adsorption process.
Figure 6b shows the EDX spectrum of the product resulting from the adsorption process. A clear peak corresponding to S kα is observed, which can be attributed to MnS, as can be seen in
Figure 6c, which shows the RX diffraction pattern of the product obtained after adsorption. The presence of zinc sulphides was not observed (probably because it was also in amorphous form), in any case, the formation of metal-sulphide-species, as a result of the process of the loading of H
2S onto the adsorbent, was demonstrated.
4.4. Estimation of Fixed-Bed Efficiencies
The adsorption efficiency of the packed adsorbent can be calculated:
i) instantaneously with respect of time:
or ii) averagely over a time t:
Insertion of eq. (2a) in eq.(12), allowed to derive the next equation:
Fitting of experimental data to eq.(13) (
Figure 7), showed that this last expression predicted in a reasonable form the column efficiencies at the different experimental conditions used in this investigation.
5. Conclusions
The use of ZnMn2O4+ZnO+Mn2O3 mixture, coming from urban wastes, to clean mimic biogas (H2S+N2) is demonstrated. The adsorption of harmful H2S onto the adsorbent is dependent on different experimental variables, such as H2S concentration in the gas mixture, gas mixture flow, and adsorbent dosage. The breakthrough point increases as the H2S dosage decreased from 400 mg to 100 mg, the gas mixture flow decreased from 440 cm3/min to 110 cm3/min, and when the adsorbent dosage increased from 2g to 6 g.
Column parameters varies according with the results mentioned above, i.e. capacity to the exhausted point increased with the increase of the H2S concentration in the gas, the increase of the gas flow and the decrease of the adsorbent dosage packed in the column.
There is a reasonable certainty that upon H2S uptake onto the adsorbent, metal oxides species present in the solid material evolved to metal sulphides species.
The model used, with the corresponding model parameters properly identified, allowed to a good prediction of the experimentally determined breakthrough curves. Also, column efficiencies can be estimated by means of an equation, which used the experimental results obtained under the different experimental variables considered in this work.
Author Contributions
F.J.A.: conceived and designed the experiment, wrote the manuscript, and supervised the work. M.Á.A.: derived the models from the experimental data and wrote the manuscript. F.A.L.: synthesis and characterized the adsorbent and wrote the manuscript. J.I.R.: conceived and designed the experiment and wrote the manuscript. All authors have read and agreed to the published version of the manuscript.
Funding
This work was supported by the GONDOLA project from the Agencia Española de Investigación (AEI), agreement No. PDC2021-120-799-I00.
Data Availability Statement
Not applicable.
Acknowledgments
The authors belong to the CSIC Interdisciplinary Thematic Platform PTI-TRANSENER+.
Conflicts of Interest
The authors declare no conflict of interest.
References
- S.Alberici , G.Toop, W.G. Biomethane production potentials in the EU. Available online: https://gasforclimate2050.eu/wp-content/uploads/2022/10/Guidehouse_GfC_report_design_final_v3.pdf (accessed on 8 August 2023).
- Marikutsa, A.; Dobrovolskii, A.A.; Rumyantseva, M.N.; Mikhaylov, A.A.; Medvedev, A.G.; Lev, O.; Prikhodchenko, P. V Improved H2S sensitivity of nanosized BaSnO3 obtained by hydrogen peroxide assisted sol-gel processing. J. Alloys Compd. 2023, 944, 169141. [Google Scholar] [CrossRef]
- Chen, L.; Ma, J.; Peng, J.; Song, T.; Liu, K. Effect of CuO addition on the performance of V2O5-based oxygen carriers for chemical-looping oxidation of H2S for efficient sulfur recovery from natural gas. Fuel 2023, 337, 126898. [Google Scholar] [CrossRef]
- Ciro, E.; Dell’Era, A.; Hatunoglu, A.; Bocci, E.; Del Zotto, L. Kinetic and Thermodynamic Study of the Wet Desulfurization Reaction of ZnO Sorbents at High Temperatures. Energies 2023, 16. [Google Scholar] [CrossRef]
- Yuan, Y.; Huang, L.; Yılmaz, M.; Zhang, T.C.; Wang, Y.; Yuan, S. MgFe2O4-loaded N-doped biochar derived from waste cooked rice for efficient low-temperature desulfurization of H2S. Fuel 2023, 339, 127385. [Google Scholar] [CrossRef]
- Jacobs, J.H.; Chou, N.; McKelvie, K.H.; Commodore, J.A.; Sui, R.; Lesage, K.L.; Wynnyk, K.G.; Xiao, Y.; Biesinger, M.C.; Hill, J.M.; et al. Screening activated carbons produced from recycled petroleum coke for acid gas separation. Carbon Trends 2023, 10, 100243. [Google Scholar] [CrossRef]
- Liu, B.; Zuo, S. Effect of Catalytic Factors of Activated Carbon and Gas Stream Properties on H2S Catalytic Conversion. Water, Air, Soil Pollut. 2023, 234, 118. [Google Scholar] [CrossRef]
- Kuo, J.-K.; Tsai, Y.-T.; Huang, P.-H.; Lee, C.-H.; Lin, C.-H. Adsorption and purification of biogas inside graphitic nanopores: molecular dynamics simulation approach. J. Mol. Model. 2023, 29, 40. [Google Scholar] [CrossRef] [PubMed]
- Kong, F.; Xie, Y.; Xia, C.; Huang, H.; Liang, D.; Qiu, Y.; Zhang, Q.; Liu, X.; Shao, H.; Meng, Z. Removal of hydrogen sulfide by layered double hydroxide loaded biochar in dynamic adsorption experiment. Surfaces and Interfaces 2023, 36, 102487. [Google Scholar] [CrossRef]
- Tabarkhoon, F.; Abolghasemi, H.; Rashidi, A.; Bazmi, M.; Alivand, M.S.; Tabarkhoon, F.; Farahani, M.V.; Esrafili, M.D. Synthesis of novel and tunable Micro-Mesoporous carbon nitrides for Ultra-High CO2 and H2S capture. Chem. Eng. J. 2023, 456, 140973. [Google Scholar] [CrossRef]
- Ko, K.-J.; Kim, H.; Cho, Y.-H.; Kim, K.-M.; Lee, C.-H. Desulfurization of ultra-low-concentration H2S in natural gas on Cu-impregnated activated carbon: Characteristics and mechanisms. Sep. Purif. Technol. 2023, 305, 122539. [Google Scholar] [CrossRef]
- Zulkefli, N.N.; Noor Azam, A.M.I.; Masdar, M.S.; Isahak, W.N.R.W. Adsorption–Desorption Behavior of Hydrogen Sulfide Capture on a Modified Activated Carbon Surface. Materials (Basel). 2023, 16, 462. [Google Scholar] [CrossRef] [PubMed]
- Guo, Y.; Xiang, B.; Zhao, B.; Wang, W.; Xiang, Y.; Liao, J.; Chang, L.; Ma, J.; Bao, W. Removal of H2S from simulated blast furnace gas by adsorption over metal-modified 13X zeolite. Fuel 2023, 338, 127261. [Google Scholar] [CrossRef]
- Carvalho, S.; Pinto, R. V.; Pires, J.; Rocha, J.; Antunes, F.; Pinto, M.L. Evaluation of the H2S and NO adsorption and release capacity of PEG-zeolites and PEG-titanosilicates composites. Microporous Mesoporous Mater. 2023, 350, 112432. [Google Scholar] [CrossRef]
- Pereira, M. V.; de Oliveira, L.H.; do Nascimento, J.F.; Arroyo, P.A. Simulation of high-pressure sour natural gas adsorption equilibrium on NaX and NaY zeolites using the multicomponent potential theory of adsorption. Adsorption 2023, 29, 65–72. [Google Scholar] [CrossRef]
- Ahmad, M.; Yousaf, M.; Cai, W.; Zhao, Z.-P. Enhanced H2S removal from diverse fuels by a coupled absorption and biological process uses CO2 as carbon resource for microbial ecosystem. Sep. Purif. Technol. 2023, 310, 123182. [Google Scholar] [CrossRef]
- Egger, F.; Hülsen, T.; Batstone, D.J. Continuous H2S removal from biogas using purple phototrophic bacteria. Chem. Eng. J. 2023, 454, 140449. [Google Scholar] [CrossRef]
- Feng, J.; Jia, L.; Wang, F.; Sun, X.; Ning, P.; Wang, C.; Li, Y.; Li, K. Urea-modified Cu-based materials: Highly efficient and support-free adsorbents for removal of H2S in an anaerobic and dry environment. Chem. Eng. J. 2023, 451, 138815. [Google Scholar] [CrossRef]
- Yadav, A. Insights on the enhanced hydrogen sulfide adsorption on X (X = Cr, Ni, Al, C, Si, O, S) doped boron nitride nanotubes. Comput. Theor. Chem. 2023, 1220, 114005. [Google Scholar] [CrossRef]
- Liu, Z.; Qiu, K.; Sun, G.; Ma, Y.; Wang, Y.; Peng, J.; Chen, S.; Song, X. Aminated polyacrylonitrile fibers for the removal of hydrogen sulfide from natural gas at room temperature. Res. Chem. Intermed. 2023, 49, 701–716. [Google Scholar] [CrossRef]
- Huang, Y.; Wang, J.; Ma, S.; Wang, R.; Wang, Y. Enhanced adsorption-oxidation performance of PMo12 immobilized onto porous MCM-41 derived from rice husk for H2S at room temperature. Fuel 2023, 333, 126448. [Google Scholar] [CrossRef]
- Ahmadi, R.; Ardjmand, M.; Rashidi, A.; Rafizadeh, M. Enhanced gas adsorption using an effective nanoadsorbent with high surface area based on waste jute as cellulose fiber. Biomass Convers. Biorefinery 2023, 13, 3071–3086. [Google Scholar] [CrossRef]
- Fakhraie, S.; Rajabi, H.R.; Rashidi, A. Fabrication and application of novel core–shell MIL-101(Cr)@UiO-66(Zr) nanocrystals for highly selective separation of H2S and CO2. Chem. Eng. J. 2023, 452, 139001. [Google Scholar] [CrossRef]
- Wang, Q.; Chen, Y.; Chen, Y.; Chen, D.; Tian, X.; Zhou, J.; Li, X.; Wang, Y. Removal of Gaseous H 2 S by the Titanium Silicalite-1/H 2 O 2 Wet Oxidation System. Energy & Fuels 2023, 37, 1169–1179. [Google Scholar] [CrossRef]
- Alguacil, F.J.; Alonso, M.Á.; López, F.A.; Robla, J.I. Dynamic Adsorption of H2S onto a Goethite-Based Material. Molecules 2022, 27, 7983. [Google Scholar] [CrossRef] [PubMed]
- Bohart, G.S.; Adams, E.Q. Some aspects of the behaviour of charcola with respect to chlorine. J. Am. Chem. Soc. 1920, 42, 523–544. [Google Scholar] [CrossRef]
- Romo, L.A.; López-Fernández, A.; García-Díaz, I.; Fernández, P.; Urbieta, A.; López, F.A. From spent alkaline batteries to Zn x Mn 3−x O 4 by a hydrometallurgical route: synthesis and characterization. RSC Adv. 2018, 8, 33496–33505. [Google Scholar] [CrossRef] [PubMed]
- Maroño, M.; Ortiz, I.; Sánchez, J.M.; Alcaraz, L.; Alguacil, F.J.; López, F.A. Effective removal of hydrogen sulfide using Mn-based recovered oxides from recycled batteries. Chem. Eng. J. 2021, 419, 129669. [Google Scholar] [CrossRef]
- Wołowicz, A.; Staszak, K.; Hubicki, Z. Removal of Copper(II) in the Presence of Sodium Dodecylobenzene Sulfonate from Acidic Effluents Using Adsorption on Ion Exchangers and Micellar-Enhanced Ultrafiltration Methods. Molecules 2022, 27, 2430. [Google Scholar] [CrossRef] [PubMed]
- Adanez, J.; Abad, A.; García-Labiano, F.; De Diego, L.; Gayán, P. HS retention with Ca-based sorbents in a pressurized fixed-bed reactor: application to moving-bed design. Fuel 2005, 84, 533–542. [Google Scholar] [CrossRef]
- Yang, C.; Florent, M.; de Falco, G.; Fan, H.; Bandosz, T.J. ZnFe2O4/activated carbon as a regenerable adsorbent for catalytic removal of H2S from air at room temperature. Chem. Eng. J. 2020, 394, 124906. [Google Scholar] [CrossRef]
|
Disclaimer/Publisher’s Note: The statements, opinions and data contained in all publications are solely those of the individual author(s) and contributor(s) and not of MDPI and/or the editor(s). MDPI and/or the editor(s) disclaim responsibility for any injury to people or property resulting from any ideas, methods, instructions or products referred to in the content. |
© 2023 by the authors. Licensee MDPI, Basel, Switzerland. This article is an open access article distributed under the terms and conditions of the Creative Commons Attribution (CC BY) license (http://creativecommons.org/licenses/by/4.0/).
