Submitted:
09 August 2023
Posted:
10 August 2023
You are already at the latest version
Abstract
Keywords:
1. Introduction
2. Materials and Methods
2.1. Study site and animals
2.2. Body temperature, heart rate, and locomotor activity recordings
2.3. Surgical procedures
2.4. Experimental design
2.5. Behavioural data collection
2.6. Faecal sample collection and consistency scoring
2.7. Faecal steroid extraction and quantification
2.8. Data preparation
2.8.1. Body temperature, heart rate, and locomotor activity recordings
2.8.2. Behavioural observations
2.8.3. Faecal consistency scores and glucocorticoid metabolite concentrations
2.9. Statistical analysis
3. Results
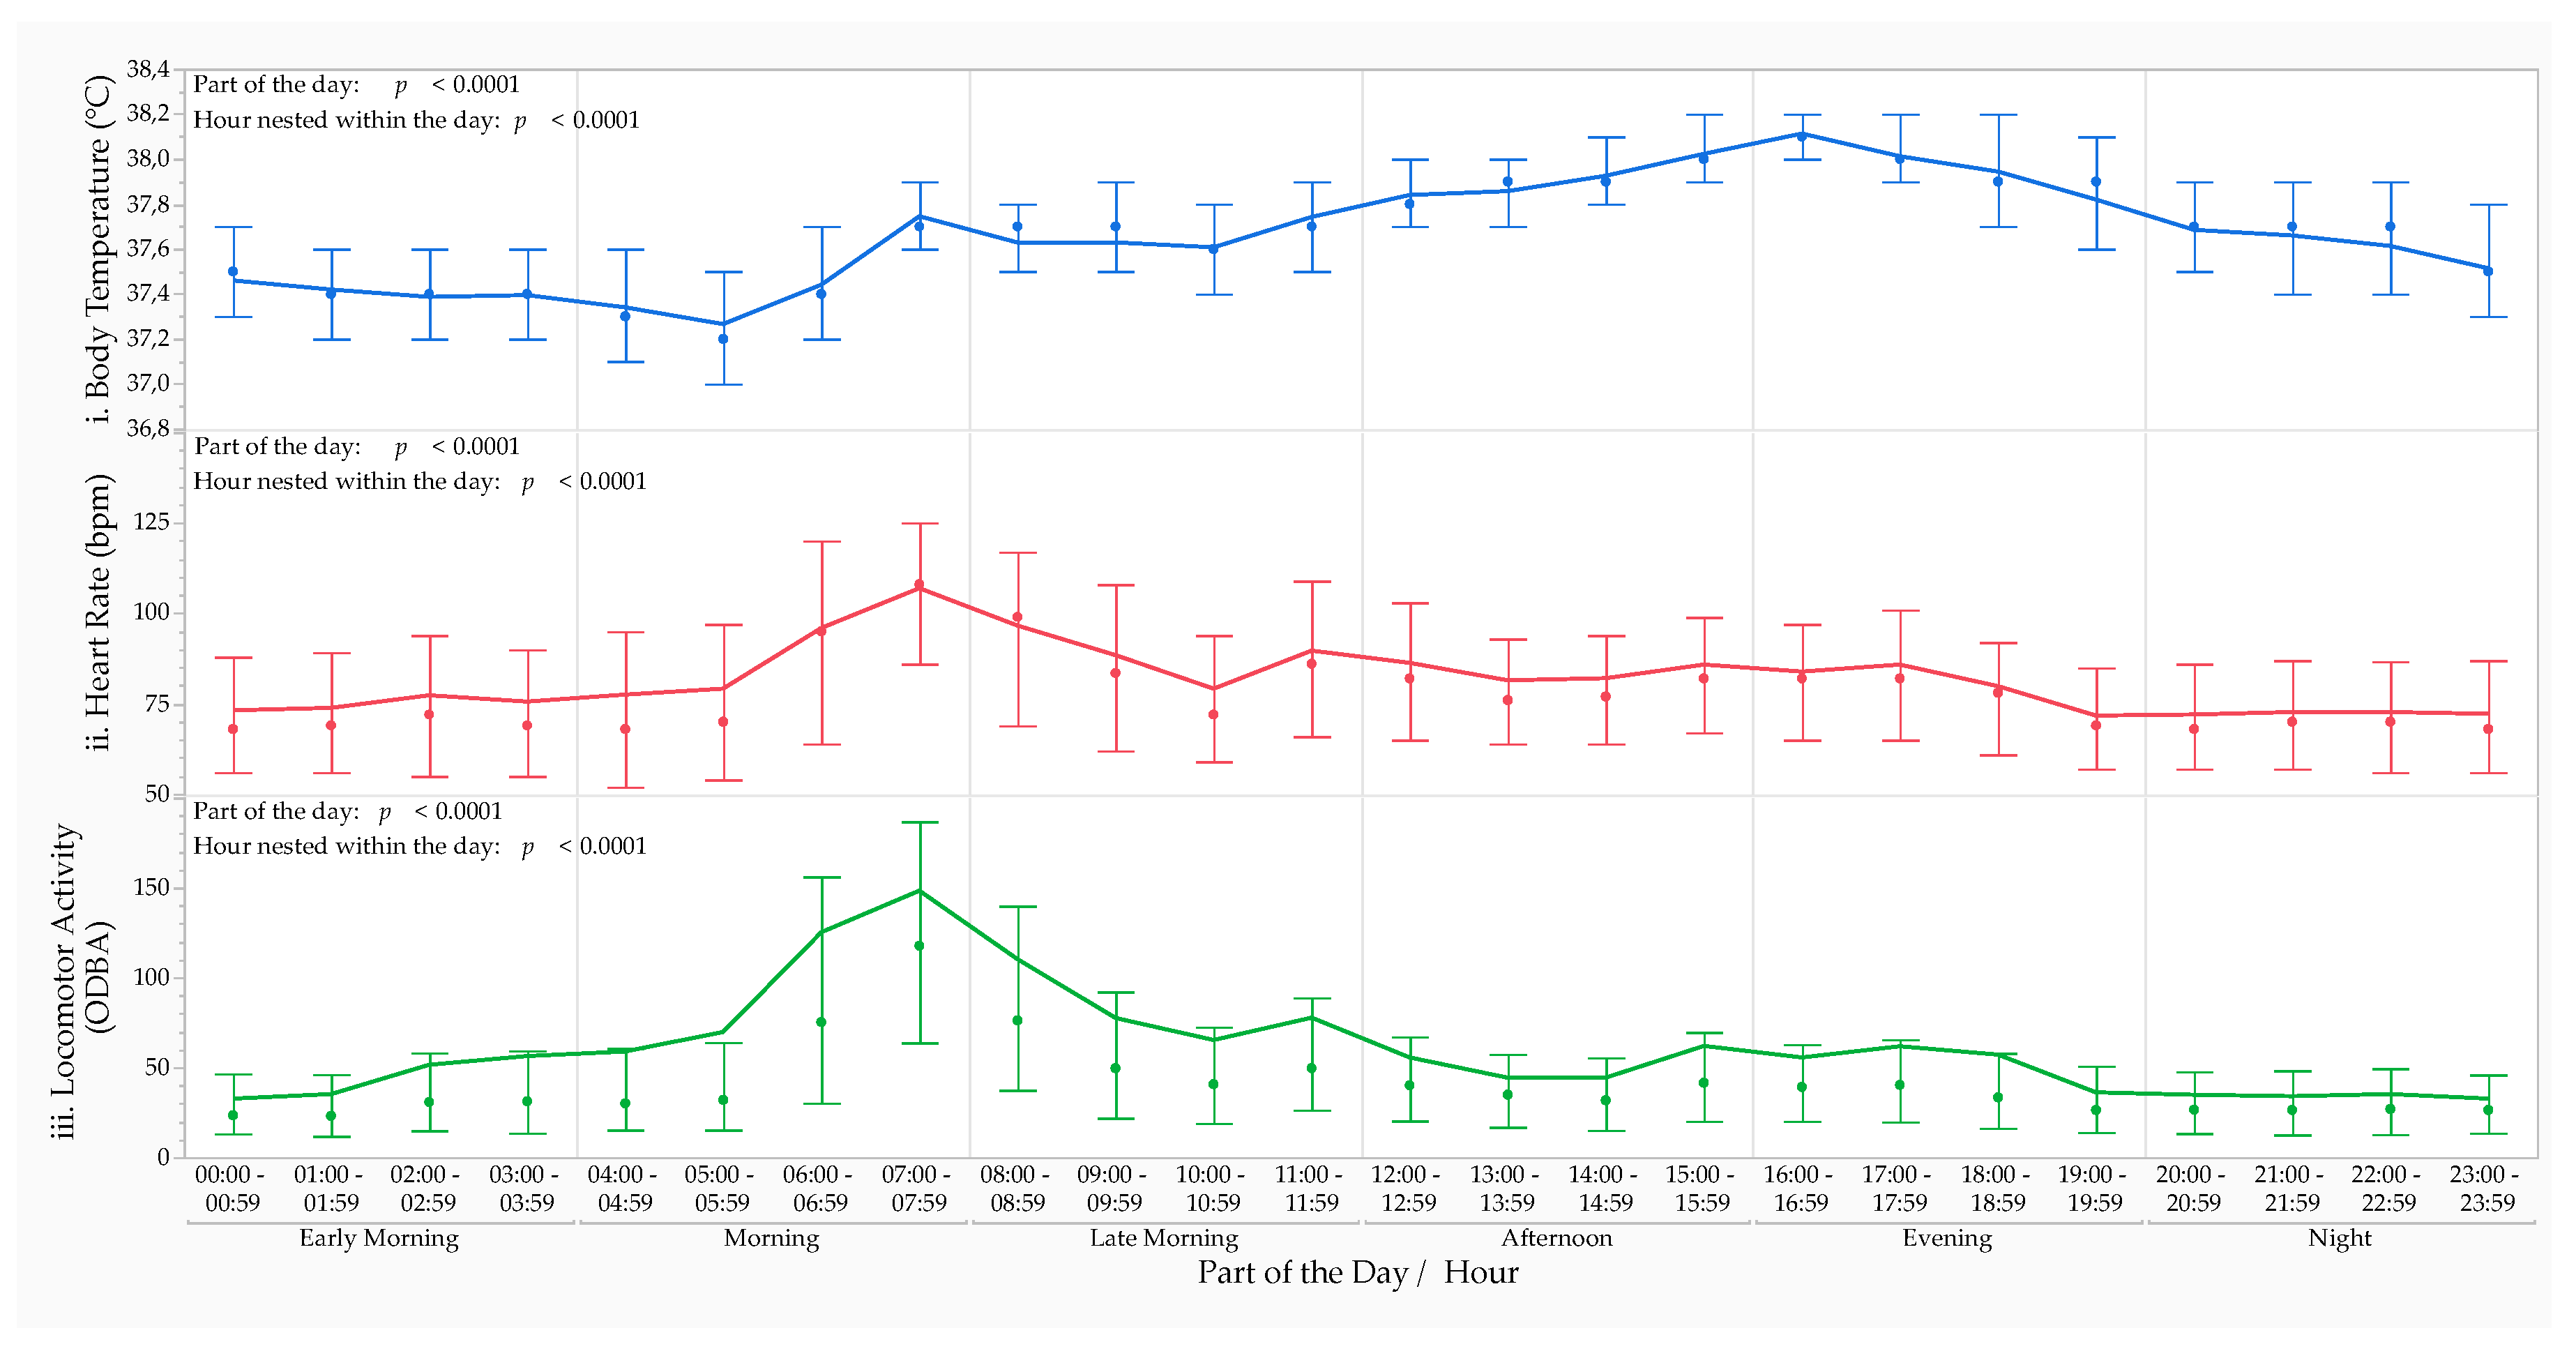
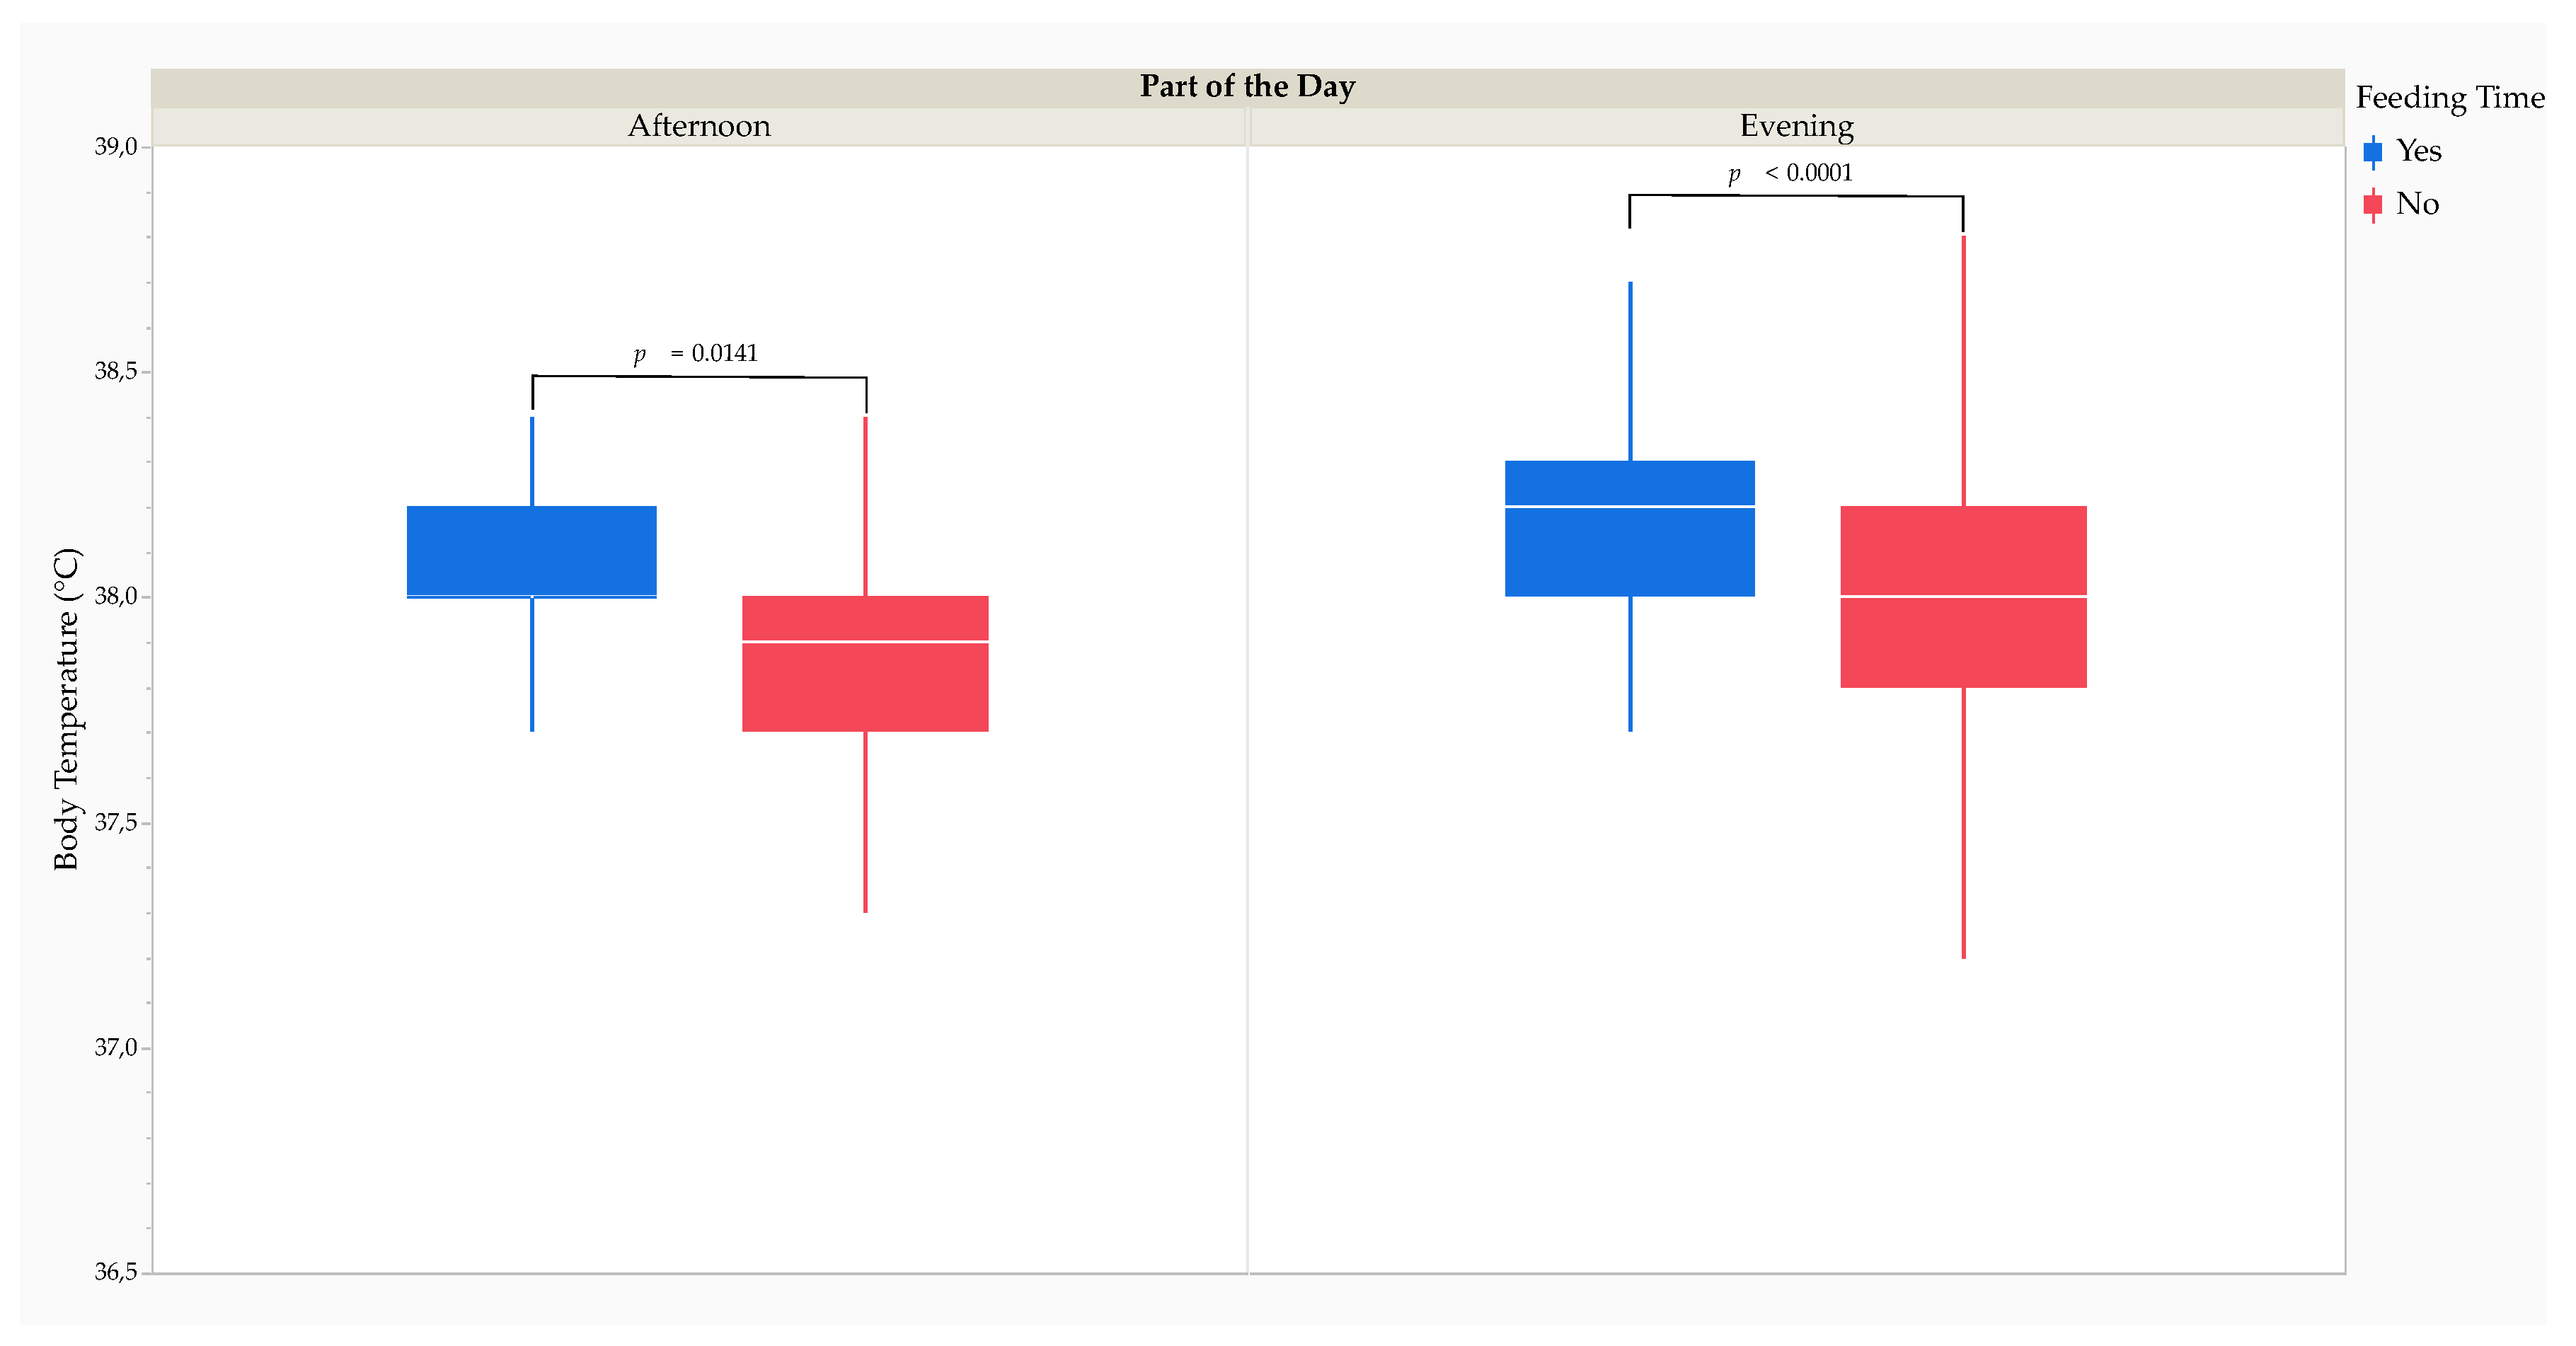
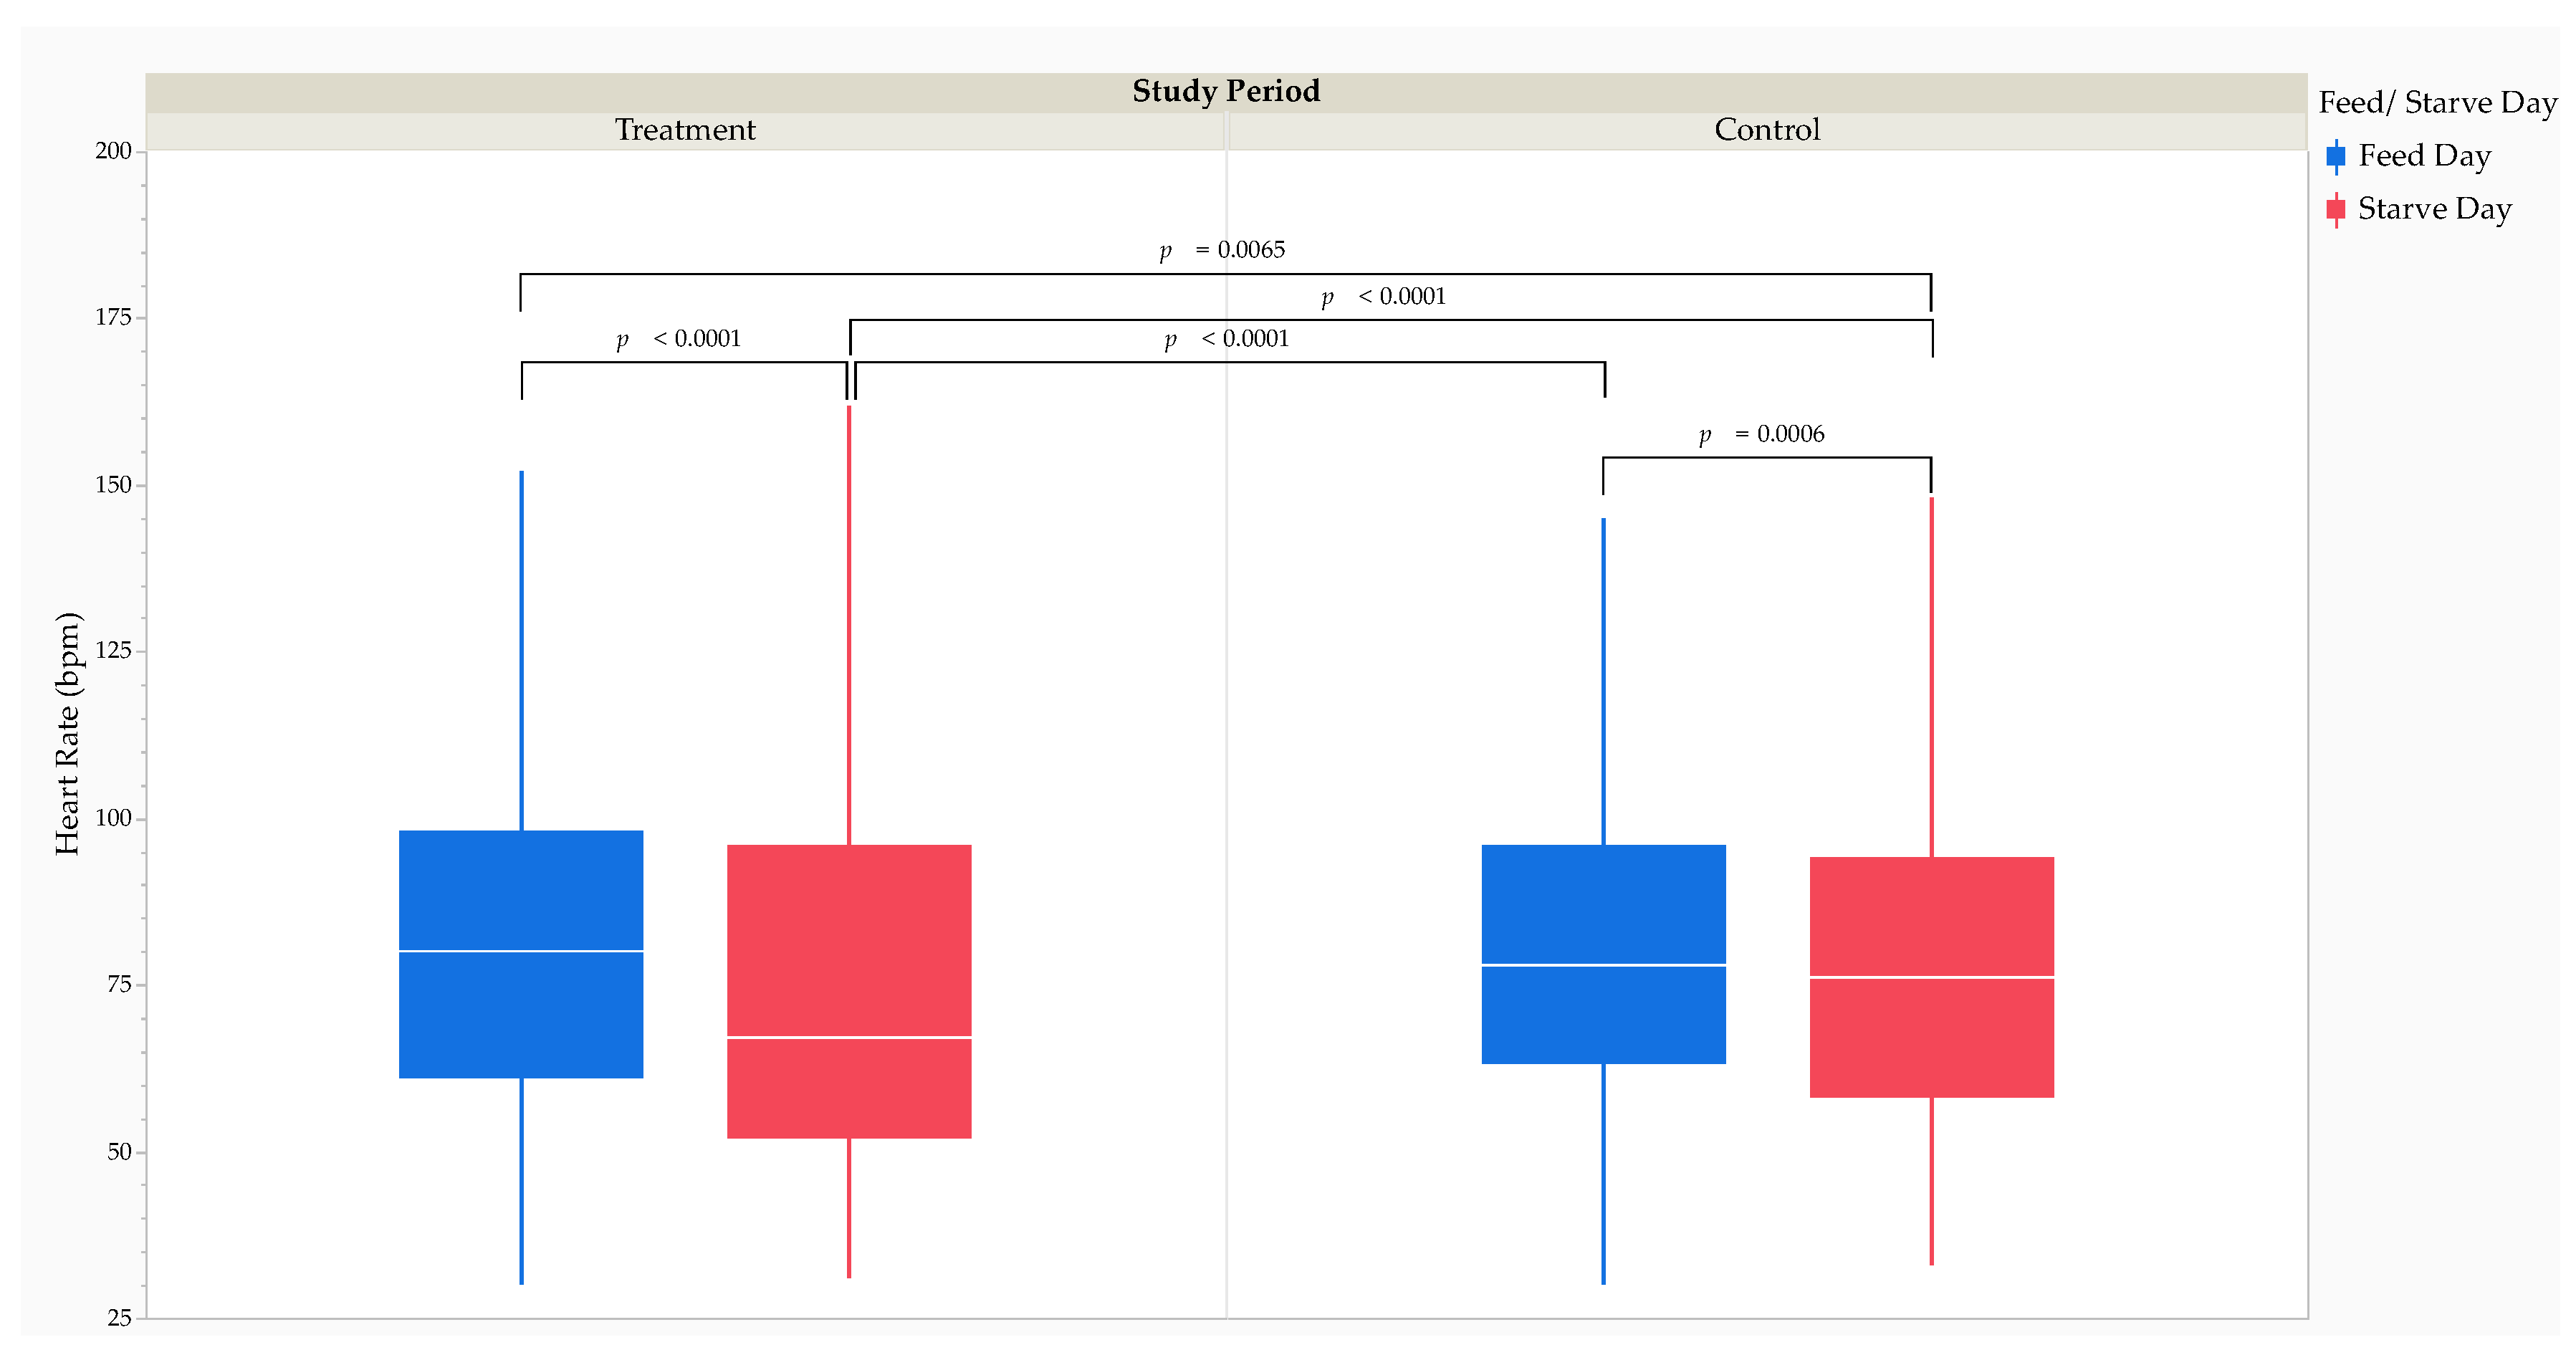
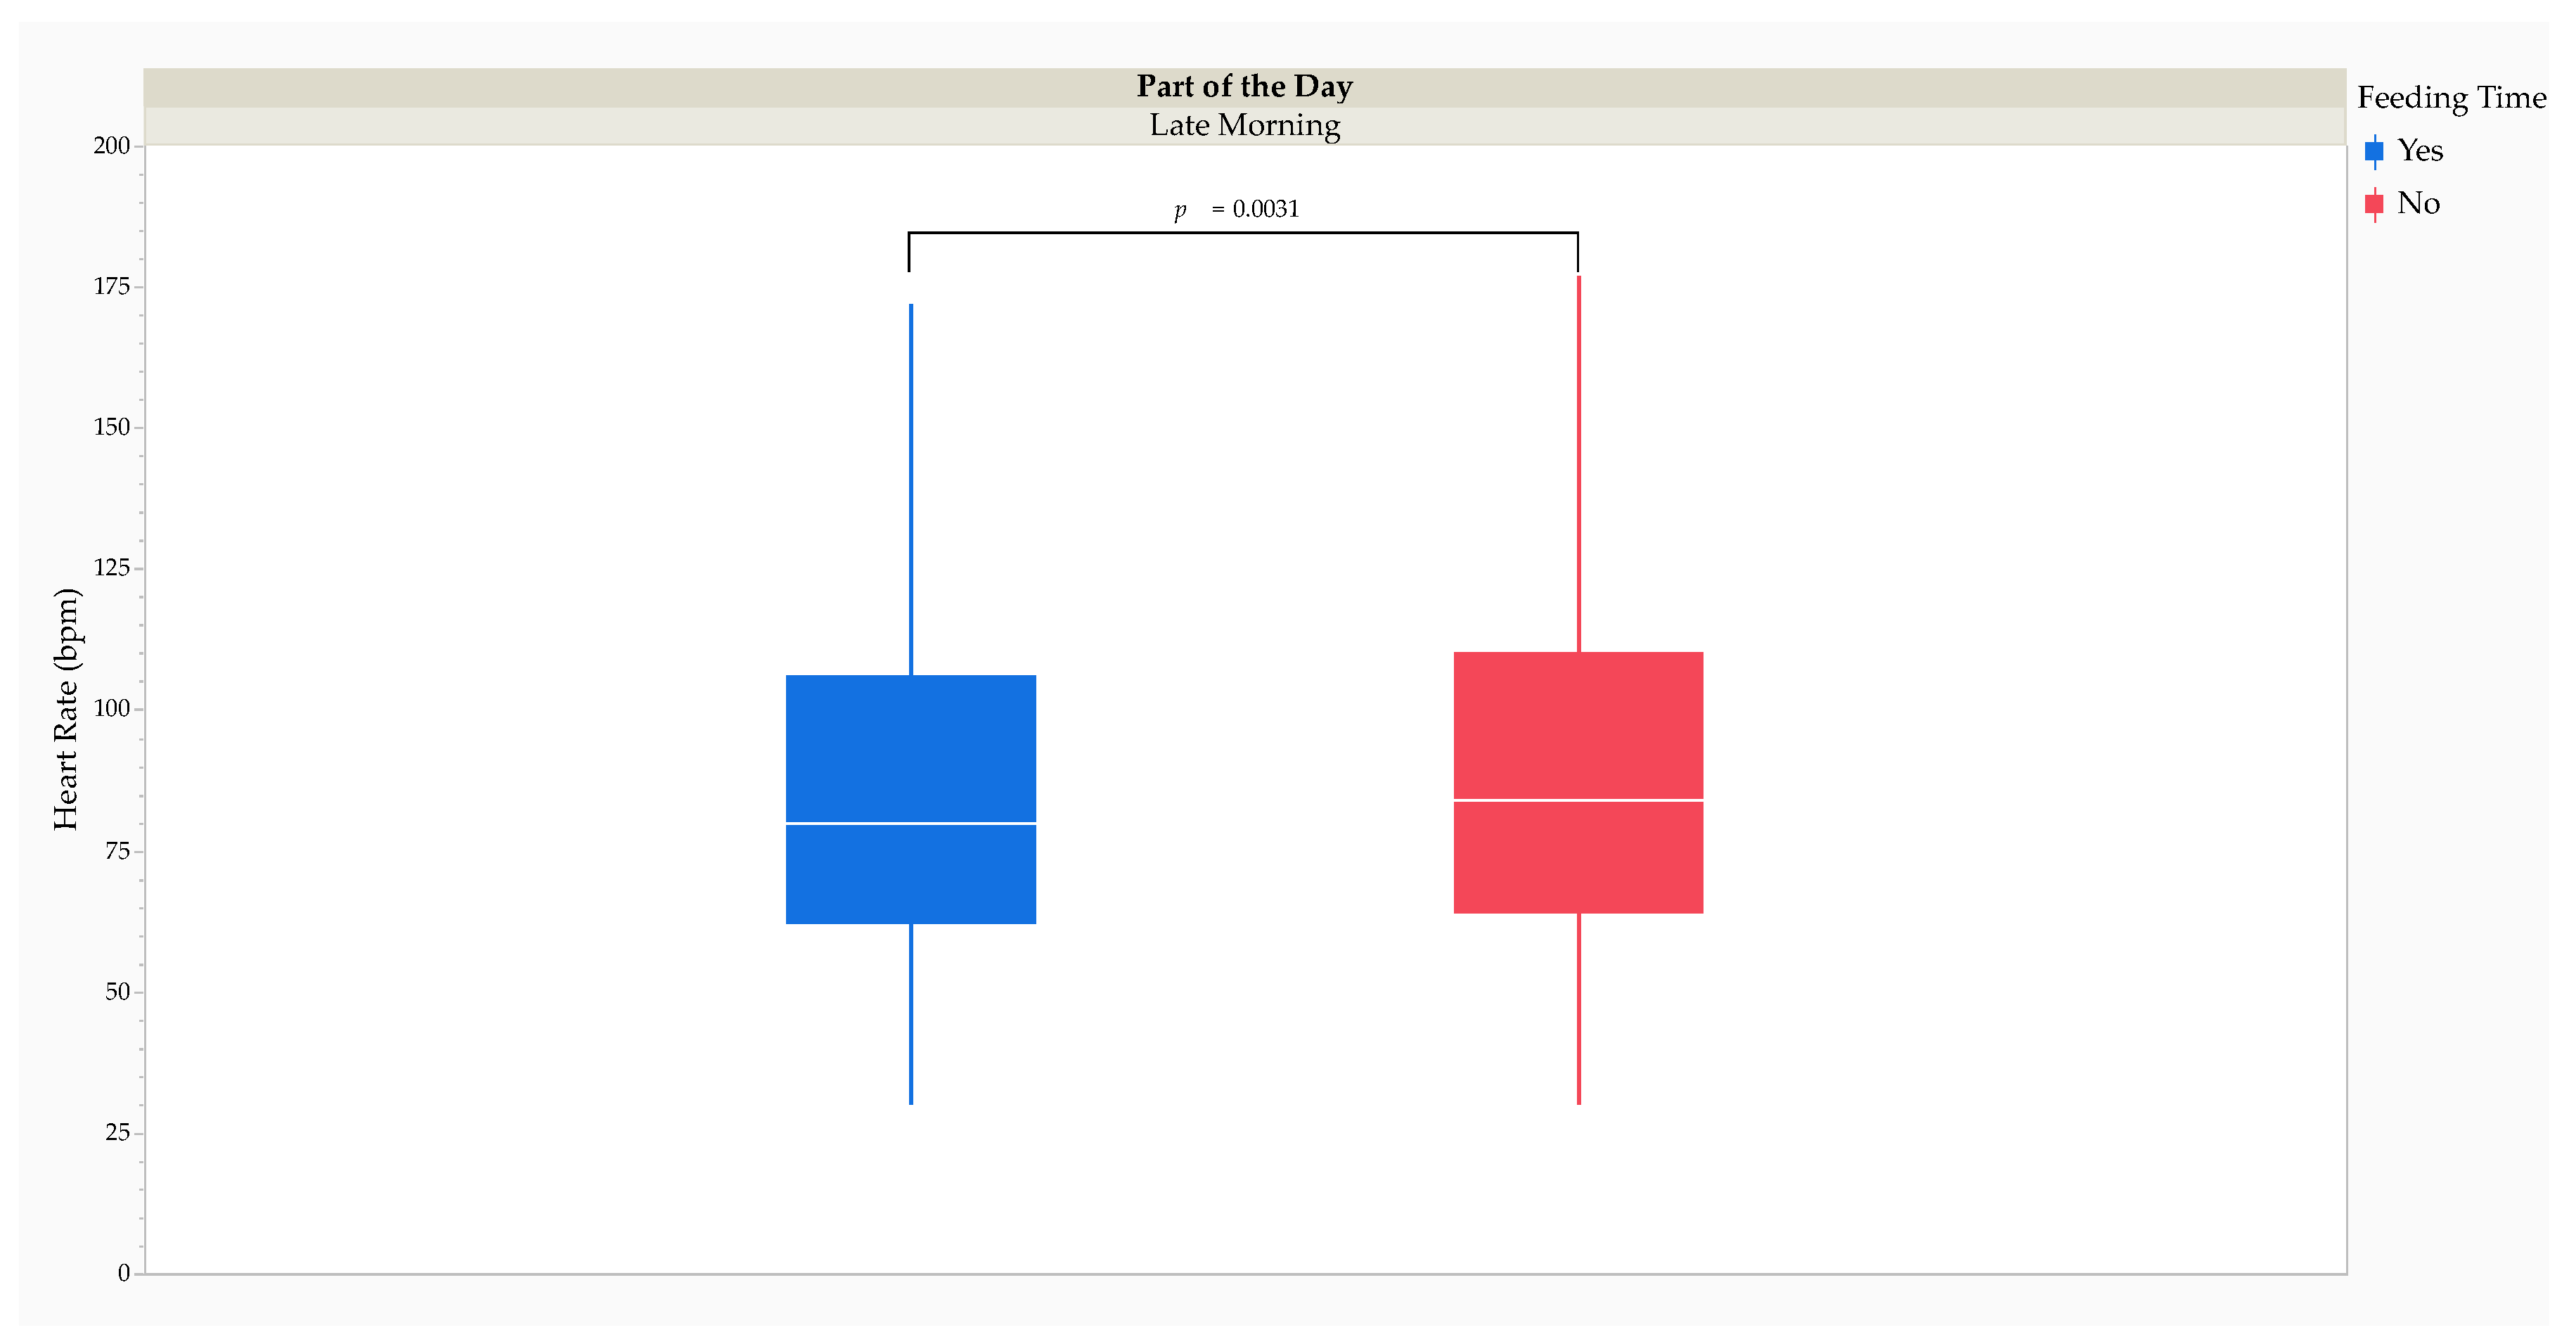
3.1. Body temperature, heart rate, and locomotor activity recordings
3.2. Behavioural observations
3.3. Faecal consistency scores
3.4. Faecal glucocorticoid metabolite concentrations
4. Discussion
5. Conclusions
Supplementary Materials
Author Contributions
Funding
Institutional Review Board Statement
Data Availability Statement
Acknowledgments
Conflicts of Interest
References
- Hayward, M.W., Hofmeyr, M., O’Brien, J., Kerley, G.I.H. Prey preferences of the cheetah Acinonyx jubatus: morphological limitations or the need to captive rapidly consumable prey before kleptoparasites arrive? J. Zool. 2006, 270(4), 615-27. https://doi.org/10.1111/j.1469-7998.2006.00184.x. [CrossRef]
- Phillips, J.A. Bone Consumption by Cheetahs at Undisturbed Kills: Evidence for a Lack of Focal-Palatine Erosion. J. Mammal. 1993, 74(2), 487-92. https://doi.org/10.2307/1382408. [CrossRef]
- Mills, M.G.L., Harvey, M. African predators. Struik Publishers: Cape Town, South Africa, 2001.
- Tordiffe, A.S., Wachter, B., Heinrich, S.K., Reyers, F., Mienie, L.J. Comparative Serum Fatty Acid Profiles of Captive and Free-Ranging Cheetahs (Acinonyx jubatus) in Namibia. PLoS One 2016, 11(12), e0167608. https://doi.org/10.1371/journal.pone.0167608. Pubmed PMID: 27992457; Pubmed Central PMCID: PMC5167222. [CrossRef]
- Whitehouse-Tedd, K.M., Lefebvre, S.L., Janssens, G.P. Dietary factors associated with faecal consistency and other indicators of gastrointestinal health in the captive cheetah (Acinonyx jubatus). PLoS One 2015, 10(4), e0120903. https://doi.org/10.1371/journal.pone.0120903. Pubmed PMID: 25830636; Pubmed Central PMCID: PMC4382097. [CrossRef]
- Young, R.J. The importance of food presentation for animal welfare and conservation. Proc. Nutr. Soc. 1997, 56(3), 1095-104. https://doi.org/10.1079/pns19970113. PMID: 9483674. [CrossRef] [PubMed]
- Tordiffe, A.S.W. (University of Pretoria, Pretoria, Gauteng, South Africa). Personal communication, 2023a.
- Lane, E.P., Miller, S., Lobetti, R., Caldwell, P., Bertschinger, H.J., Burroughs, R., Kotze, A., van Dyk, A. Effect of diet on the incidence of and mortality owing to gastritis and renal disease in captive cheetahs (Acinonyx jubatus) in South Africa. Zoo Biol. 2012, 31(6), 669-82. https://doi.org/10.1002/zoo.20431. Epub 2011 Nov 14. Pubmed PMID: 22083933. [CrossRef] [PubMed]
- Kotsch, V., Kübber-Heiss, A., Url, A., Walzer, C., Schmidt, P. Diseases of captive cheetahs (Acinonyx jubatus) within the European endangered species program (EEP)—A 22-year retrospective histopathological study. Wien. Tierarztl. Monatsschr. 2002, 89(12), 341-50.
- Munson, L., Terio, K.A., Worley, M., Jago, M., Bagot-Smith, A., Marker, L. Extrinsic factors significantly affect patterns of disease in free-ranging and captive cheetah (Acinonyx jubatus) populations. J. Wildl. Dis. 2005, 41(3), 542-8. https://doi.org/10.7589/0090-3558-41.3.542. PMID: 16244064. [CrossRef] [PubMed]
- Une, Y., Uchida, C., Konishi, M., Ui, T., Kawakami, S., Ito, S., Nomura, Y. Pathological study of cheetahs (Acinonyx jubatus) dying in captivity in Japan. Vet. Pathol. 2001, 38, 585.
- Terio, K.A., Mitchell, E., Walzer, C., Schmidt-Küntzel, A., Marker, L., Citino, S. Diseases Impacting Captive and Free-Ranging Cheetahs. In: Biodiversity of the World—Cheetahs: Biology and Conservation, 1st ed.; Marker, L., Boast, L.K., Schmidt-Küntzel, A., Eds.; Elsevier: San Diego, California, 2018; pp. 349-60. https://doi.org/10.1016/B978-0-12-804088-1.00028-9. [CrossRef]
- Eaton, K.A., Radin, M.J., Kramer, L., Wack, R., Sherding, R., Krakowka, S., Fox, J.G., Morgan, D.R. Epizootic gastritis associated with gastric spiral bacilli in cheetahs (Acinonyx jubatus). Vet. Pathol. 1993, 30(1), 55-63. https://doi.org/10.1177/030098589303000107. Pubmed PMID: 8442328. [CrossRef] [PubMed]
- Terio, K.A., Munson, L., Moore, P.F. Characterization of the gastric immune response in cheetahs (Acinonyx jubatus) with Helicobacter-associated gastritis. Vet. Pathol. 2012, 49(5), 824-33. https://doi.org/10.1177/0300985811412620. Epub 2011 Jul 5. PMID: 21730348. [CrossRef] [PubMed]
- Terio, K.A., Munson, L., Marker, L., Aldridge, B.M., Solnick, J.V. Comparison of Helicobacter spp. in Cheetahs (Acinonyx jubatus) with and without gastritis. J. Clin. Microbiol. 2005, 43(1), 229-34. https://doi.org/10.1128/JCM.43.1.229-234.2005. Pubmed PMID: 15634976; Pubmed Central PMCID: PMC540127. [CrossRef]
- Vester, B.M., Beloshapka, A.N., Middelbos, I.S., Burke, S.L., Dikeman, C.L., Simmons, L.G., Swanson, K.S. Evaluation of nutrient digestibility and fecal characteristics of exotic felids fed horse- or beef-based diets: use of the domestic cat as a model for exotic felids. Zoo Biol. 2010, 29(4), 432-48. https://doi.org/10.1002/zoo.20275. Pubmed PMID: 19830746. [CrossRef] [PubMed]
- Becker, A.A.M.J., Hesta, M., Hollants, J., Janssens, G.P.J., Huys, G. Phylogenetic analysis of faecal microbiota from captive cheetahs reveals underrepresentation of Bacteroidetes and Bifidobacteriaceae. BMC Microbiol. 2014, 14(1), 43. https://doi.org/10.1186/1471-2180-14-43. [CrossRef]
- Wasimuddin, Menke, S., Melzheimer, J., Thalwitzer, S., Heinrich, S., Wachter, B., Sommer, S. Gut microbiomes of free-ranging and captive Namibian cheetahs: Diversity, putative functions and occurrence of potential pathogens. Mol. Ecol. 2017, 26(20), 5515-27. https://doi.org/10.1111/mec.14278. Epub 2017 Sep 08. Pubmed PMID: 28782134. [CrossRef] [PubMed]
- Depauw, S., Bosch, G., Hesta, M., Whitehouse-Tedd, K., Hendriks, W.H., Kaandorp, J., Janssens, G.P.J. Fermentation of animal components in strict carnivores: a comparative study with cheetah fecal inoculum. J. Anim. Sci. 2012a, 90(8), 2540-8. https://doi.org/10.2527/jas.2011-4377. Epub 2012 Jan 27. Pubmed PMID: 22287677. [CrossRef] [PubMed]
- Depauw, S., Hesta, M., Whitehouse-Tedd, K., Vanhaecke, L., Verbrugghe, A., Janssens, G.P.J. Animal fibre: the forgotten nutrient in strict carnivores? First insights in the cheetah. J. Anim. Physiol. Anim. Nutr. (Berl.). 2013, 97(1), 146-54. https://doi.org/10.1111/j.1439-0396.2011.01252.x. Epub 2011 Nov 10. Pubmed PMID: 22074361. [CrossRef] [PubMed]
- Rochus, K., Bosch, G., Vanhaecke, L., van de Velde, H., Depauw, S., Xu, J., Fievez, V., van de Wiele, T., Hendriks, W.H., Janssens, G.P.J., et al. Incubation of selected fermentable fibres with feline faecal inoculum: correlations between in vitro fermentation characteristics and end products. Arch. Anim. Nutr. 2013, 67(5), 416-31. https://doi.org/10.1080/1745039X.2013.830519. Epub 2013 Aug 19. Pubmed PMID: 23952674. [CrossRef] [PubMed]
- Depauw, S., Hesta, M., Whitehouse-Tedd, K., Stagegaard, J., Buyse, J., Janssens, G.P.J. Blood values of adult captive cheetahs (Acinonyx jubatus) fed either supplemented beef or whole rabbit carcasses. Zoo Biol. 2012b, 31(6), 629-41. https://doi.org/10.1002/zoo.20427. Epub 2011 Nov 03. Pubmed PMID: 22052742. [CrossRef] [PubMed]
- Depauw, S., Heilmann, R.M., Whitehouse-Tedd, K., Hesta, M., Steiner, J.M., Suchodolski, J.S., Janssens, G.P.J. Effect of diet type on serum and faecal concentration of S100/calgranulins in the captive cheetah. J. Zoo Aquar. Res. 2014, 2(2), 33-8. https://doi.org/10.19227/jzar.v2i2.81. [CrossRef]
- Niwa, T. Uremic toxicity of indoxyl sulfate. Nagoya J. Med. Sci. 2010, 72(1-2), 1-11. Pubmed PMID: 20229698. [PubMed]
- Bolton, L.A., Munson, L. Glomerulosclerosis in captive cheetahs (Acinonyx jubatus). Vet. Pathol. 1999, 36(1), 14-22. https://doi.org/10.1354/vp.36-1-14. Pubmed PMID: 9921751. [CrossRef] [PubMed]
- Munson, L. Diseases of captive cheetahs (Acinonyx jubatus): Results of the cheetah research council pathology survey, 1989-1992. Zoo Biol. 1993, 12(1), 105-24. https://doi.org/10.1002/zoo.1430120110. [CrossRef]
- Munson, L., Nesbit, J.W., Meltzer, D.G., Colly, L.P., Bolton, L., Kriek, N.P. Diseases of captive cheetahs (Acinonyx jubatus jubatus) in South Africa: a 20-year retrospective survey. J. Zoo Wildl. Med. 1999, 30(3), 342-7. Pubmed PMID: 10572855. [PubMed]
- Papendick, R.E., Munson, L., O'Brien, T.D., Johnson, K.H. Systemic AA amyloidosis in captive cheetahs (Acinonyx jubatus). Vet. Pathol. 1997, 34(6), 549-56. https://doi.org/10.1177/030098589703400602. Pubmed PMID: 9396135. [CrossRef] [PubMed]
- Bertani, T., Zoja, C., Abbate, M., Rossini, M., Remuzzi, G. Age-related nephropathy and proteinuria in rats with intact kidneys exposed to diets with different protein content. Lab. Invest. 1989, 60(2), 196-204. Pubmed PMID: 2915514. [PubMed]
- Brenner, B.M., Meyer, T.W., Hostetter, T.H. Dietary protein intake and the progressive nature of kidney disease: the role of hemodynamically mediated glomerular injury in the pathogenesis of progressive glomerular sclerosis in aging, renal ablation, and intrinsic renal disease. N. Engl. J. Med. 1982, 307(11), 652-9. https://doi.org/10.1056/NEJM198209093071104. Pubmed PMID: 7050706. [CrossRef] [PubMed]
- Olson, J.L., Heptinstall, R.H. Nonimmunologic mechanisms of glomerular injury. Lab. Invest. 1988, 59(5), 564-78. Pubmed PMID: 3054312. [PubMed]
- Li, L., Su, Y., Li, F., Wang, Y., Ma, Z., Li, Z., Su, J. The effects of daily fasting hours on shaping gut microbiota in mice. BMC Microbiol. 2020, 20(1), 65. https://doi.org/10.1186/s12866-020-01754-2. Pubmed PMID: 32209070; Pubmed Central PMCID: PMC7092480. [CrossRef]
- Li, G., Xie, C., Lu, S., Nichols, R.G., Tian, Y., Li, L., Patel, D., Ma, Y., Brocker, C.N., Yan, T., et al. Intermittent Fasting Promotes White Adipose Browning and Decreases Obesity by Shaping the Gut Microbiota. Cell. Metab. 2017, 26(4), 672-85.e4. https://doi.org/10.1016/j.cmet.2017.08.019. Epub 2017 Sep 14. Erratum in: Cell Metab. 2017 Nov 07;26(5):801. Pubmed PMID: 28918936; Pubmed Central PMCID: PMC5668683. [CrossRef]
- Maifeld, A., Bartolomaeus, H., Löber, U., Avery, E.G., Steckhan, N., Markó, L., Wilck, N., Hamad, I., Šušnjar, U., Mähler, A., et al. Fasting alters the gut microbiome reducing blood pressure and body weight in metabolic syndrome patients. Nat. Commun. 2021, 12(1):1970. https://doi.org/10.1038/s41467-021-22097-0. Pubmed PMID: 33785752; Pubmed Central PMCID: PMC8010079. [CrossRef]
- Patterson, R.E., Sears, D.D. Metabolic Effects of Intermittent Fasting. Annu. Rev. Nutr. 2017, 37, 371-93. https://doi.org/10.1146/annurev-nutr-071816-064634. Epub 2017 Jul 17. Pubmed PMID: 28715993. [CrossRef] [PubMed]
- Zhang, X., Zou, Q., Zhao, B., Zhang, J., Zhao, W., Li, Y., Liu, R., Liu, X., Liu, Z. Effects of alternate-day fasting, time-restricted fasting and intermittent energy restriction DSS-induced on colitis and behavioral disorders. Redox Biol. 2020, 32, 101535. https://doi.org/10.1016/j.redox.2020.101535. Epub 2020 Apr 10. Erratum in: Redox Biol. 2021 Aug;44:101955. Pubmed PMID: 32305005; Pubmed Central PMCID: PMC7162980. [CrossRef]
- Altman, J.D., Gross, K.L., Lowry, S.R. Nutritional and behavioral effects of gorge and fast feeding in captive lions. J. Appl. Anim. Welf. Sci. 2005, 8(1), 47-57. https://doi.org/10.1207/s15327604jaws0801_4. Pubmed PMID: 16004544. [CrossRef] [PubMed]
- Vester, B.M., Burke, S.L., Dikeman, C.L., Simmons, L.G., Swanson, K.S. Nutrient digestibility and fecal characteristics are different among captive exotic felids fed a beef-based raw diet. Zoo Biol. 2008, 27(2), 126-36. https://doi.org/10.1002/zoo.20172. PMID: 19360610. [CrossRef] [PubMed]
- 39. Nery, J., Biourge, V., Tournier, C., Leray, V., Martin, L., Dumon, H, Nguyen, P. Influence of dietary protein content and source on fecal quality, electrolyte concentrations, and osmolarity, and digestibility in dogs differing in body size. J. Anim. Sci. 2010, 88(1), 159-69. https://doi.org/10.2527/jas.2008-1666. Epub 2009 Oct 23. PMID: 19854997. [CrossRef] [PubMed]
- 40. Nery, J., Goudez, R., Biourge, V., Tournier, C., Leray, V., Martin, L., Thorin, C., Nguyen, P., Dumon, H. Influence of dietary protein content and source on colonic fermentative activity in dogs differing in body size and digestive tolerance. J. Anim. Sci. 2012, 90(8), 2570-80. https://doi.org/10.2527/jas.2011-4112. Epub 2012 Feb 10. PMID: 22328724. [CrossRef] [PubMed]
- Quirke, T., O’Riordan, R.M., Zuur, A. Factors influencing the prevalence of stereotypical behaviour in captive cheetahs (Acinonyx jubatus). Appl. Anim. Behav. Sci. 2012, 142(3-4), 189-97. https://doi.org/10.1016/j.applanim.2012.09.007. [CrossRef]
- Terio, K.A., Citino, S.B., Brown, J.L. Fecal cortisol metabolite analysis for noninvasive monitoring of adrenocortical function in the cheetah (Acinonyx jubatus). J. Zoo Wildl. Med. 1999, 30(4), 484-91. Pubmed PMID: 10749432. [PubMed]
- Wilson, R.P., Börger, L., Holton, M.D., Scantlebury, D.M., Gómez-Laich, A., Quintana, F., Rosell, F., Graf, P.M., Williams, H., Gunner, R., et al. Estimates for energy expenditure in free-living animals using acceleration proxies: A reappraisal. J. Anim. Ecol. 2020, 89(1), 161-72. https://doi.org/10.1111/1365-2656.13040. Epub 2019 Jun 27. Pubmed PMID: 31173339; Pubmed Central PMCID: PMC7030956. [CrossRef]
- Brown, K.L. Responses to potential captivity-induced stressors in captive-born cheetah (Acinonyx jubatus): implications for behavioural and physiological stress and gastrointestinal health. Doctoral thesis, University of Pretoria, Pretoria, January 2023.
- Mistlberger, R.E. Circadian food-anticipatory activity: formal models and physiological mechanisms. Neurosci. Biobehav. Rev. 1994, 18(2), 171-95. https://doi.org/10.1016/0149-7634(94)90023-x. PMID: 8058212. [CrossRef] [PubMed]
- Altmann, J. Observational study of behavior: sampling methods. Behaviour 1974, 49(3), 227-67. https://doi.org/10.1163/156853974x00534. Pubmed PMID: 4597405. [CrossRef] [PubMed]
- Quirke, T., O’Riordan, R.M. The effect of different types of enrichment on the behaviour of cheetahs (Acinonyx jubatus) in captivity. Appl. Anim. Behav. Sci. 2011a, 133(1), 87-94. https://doi.org/10.1016/j.applanim.2011.05.004. [CrossRef]
- Quirke, T., O’Riordan, R.M. The effect of a randomised enrichment treatment schedule on the behaviour of cheetahs (Acinonyx jubatus). Appl. Anim. Behav. Sci. 2011b, 135(1-2), 103-9. https://doi.org/10.1016/j.applanim.2011.10.006. [CrossRef]
- Regaiolli, B., Rizzo, A., Ottolini, G., Miletto Petrazzini, M.E., Spiezio, C., Agrillo, C. Motion Illusions as Environmental Enrichment for Zoo Animals: A Preliminary Investigation on Lions (Panthera leo). Front. Psychol. 2019, 10, 2220. https://doi.org/10.3389/fpsyg.2019.02220. Pubmed PMID: 31636583; Pubmed Central PMCID: PMC6788361. [CrossRef]
- Carlstead, K., Brown, J.L., Strawn, W. Behavioral and physiological correlates of stress in laboratory cats. Appl. Anim. Behav. Sci. 1993, 38(2), 143-58. https://doi.org/10.1016/0168-1591(93)90062-T. [CrossRef]
- Davey, G. Relationships between exhibit naturalism, animal visibility and visitor interest in a Chinese Zoo. Appl. Anim. Behav. Sci. 2006, 96(1), 93-102. https://doi.org/10.1016/j.applanim.2005.04.018. [CrossRef]
- Hosey, G. Hediger revisited: how do zoo animals see us? J. Appl. Anim. Welf. Sci. 2013, 16(4), 338-59. https://doi.org/10.1080/10888705.2013.827916. Pubmed PMID: 24079488. [CrossRef] [PubMed]
- Morgan, K.N., Tromborg, C.T. Sources of stress in captivity. Appl. Anim. Behav. Sci. 2007, 102(3-4), 262-302. https://doi.org/10.1016/j.applanim.2006.05.032. [CrossRef]
- Sellinger, R.L., Ha, J.C. The effects of visitor density and intensity on the behavior of two captive jaguars (Panthera onca). J. Appl. Anim. Welf. Sci. 2005, 8(4), 233-44. https://doi.org/10.1207/s15327604jaws0804_1. Pubmed PMID: 16436028. [CrossRef] [PubMed]
- Ludwig, C., Wachter, B., Silinski-Mehr, S., Ganswindt, A., Bertschinger, H., Hofer, H., Dehnhard, M. Characterisation and validation of an enzyme-immunoassay for the non-invasive assessment of faecal glucocorticoid metabolites in cheetahs (Acinonyx jubatus). Gen. Comp. Endocrinol. 2013, 180, 15-23. https://doi.org/10.1016/j.ygcen.2012.10.005. Epub 2012 Oct 26. Pubmed PMID: 23108105. [CrossRef] [PubMed]
- Tordiffe, A.S.W. (University of Pretoria, Pretoria, Gauteng, South Africa). Personal communication, 2023b.
- Fieß, M., Heistermann, M., Hodges, J.K. Patterns of urinary and fecal steroid excretion during the ovarian cycle and pregnancy in the African elephant (Loxodonta africana). Gen. Comp. Endocrinol. 1999, 115(1), 76-89. https://doi.org/10.1006/gcen.1999.7287. Pubmed PMID: 10375466. [CrossRef] [PubMed]
- Ganswindt, A., Muenscher, S., Henley, M., Henley, S., Heistermann, M., Palme, R., Thompson, P., Bertschinger, H. Endocrine correlates of musth and the impact of ecological and social factors in free-ranging African elephants (Loxodonta africana). Horm. Behav. 2010, 57(4-5), 506-14. https://doi.org/10.1016/j.yhbeh.2010.02.009. Epub 2010 Feb 24. Pubmed PMID: 20188104. [CrossRef] [PubMed]
- Palme, R., Möstl, E. Measurement of cortisol metabolites in faeces of sheep as a parameter of cortisol concentration in blood. Int. J. Mammal Biol. 1997, 62 Suppl II, 192-7.
- Ganswindt, A., Heistermann, M., Borragan, S., Hodges, J.K. Assessment of testicular endocrine function in captive African elephants by measurement of urinary and fecal androgens. Zoo Biol. 2002, 21, 27-36. https://doi.org/10.1002/zoo.10034. [CrossRef]
- Button, C., Meltzer, D.G., Mülders, M.S. The electrocardiogram of the cheetah (Acinonyx jubatus). J. S. Afr. Vet. Assoc. 1981, 52(3), 233-5. Pubmed PMID: 7310794. [PubMed]
- Schumacher, J., Snyder, P., Citino, S.B., Bennett, R.A., Dvorak, L.D. Radiographic and electrocardiographic evaluation of cardiac morphology and function in captive cheetahs (Acinonyx jubatus). J. Zoo Wildl. Med. 2003, 34(4), 357-63. https://doi.org/10.1638/01-008. Pubmed PMID: 15077711. [CrossRef] [PubMed]
- Keay, J.M., Singh, J., Gaunt, M.C., Kaur, T. Fecal glucocorticoids and their metabolites as indicators of stress in various mammalian species: a literature review. J. Zoo Wildl. Med. 2006, 37(3), 234-44. https://doi.org/10.1638/05-050.1. Pubmed PMID: 17319120. [CrossRef] [PubMed]
- Palme, R. Measuring fecal steroids: guidelines for practical application. Ann. N. Y. Acad. Sci. 2005, 1046, 75-80. https://doi.org/10.1196/annals.1343.007. Pubmed PMID: 16055844. [CrossRef] [PubMed]
- Graham, L.H., Brown, J.L. Cortisol metabolism in the domestic cat and implications for non-invasive monitoring of adrenocortical function in endangered felids. Zoo Biol. 1996, 15(1), 71-82. https://doi.org/10.1002/(SICI)1098-2361(1996)15:1<71::AID-ZOO7>3.0.CO;2-9. [CrossRef]
- Maclure, M. The case-crossover design: a method for studying transient effects on the risk of acute events. Am. J. Epidemiol. 1991, 133(2), 144-53. https://doi.org/10.1093/oxfordjournals.aje.a115853. Pubmed PMID: 1985444. [CrossRef] [PubMed]
- Anderson, T.W., Darling, D.A. Asymptotic theory of certain “goodness-of-fit” criteria based on stochastic processes. Ann. Math. Stat. 1952, 23(2), 193-212. https://doi.org/10.1214/aoms/1177729437. [CrossRef]
- Levene, H. Robust Tests for Equality of Variances. In: Contributions to Probability and Statistics; Olkin, I., Ed.; Stanford University Press: Palo Alto, California, 1960; pp. 278-92.
- Box, G.E.P., Cox, D.R. An Analysis of Transformations. J. R. Stat. Soc. Ser. B Methodol. 1964, 26(2), 211-52. https://doi.org/10.111/j.2517-6161.1964.tb00553.x. [CrossRef]
- Fisher, R.A. The correlation between relatives on the supposition of Mendelian inheritance. Trans. R. Soc. Edinb. 1918, 53, 399-433.
- Tukey, J.W. Comparing individual means in the analysis of variance. Biometrics 1949, 5(2), 99-114. https://doi.org/10.2307/3001913. [CrossRef]
- Cohen, J. In: Statistical Power Analysis for the Behavioral Sciences, 2nd ed.; Lawrence Erlbaum Associates: Hillsdale, New Jersey, 1988. https://doi.org/10.4324/9780203771587. [CrossRef]
- Shreiner, A.B., Kao, J.Y., Young, V.B. The gut microbiome in health and in disease. Curr. Opin. Gastroenterol. 2015, 31(1), 69-75. https://doi.org/10.1097/MOG.0000000000000139. PMID: 25394236; PMCID: PMC4290017. [CrossRef]
- Tigchelaar, E.F., Bonder, M.J., Jankipersadsing, S.A., Fu, J., Wijmenga, C., Zhernakova, A. Gut microbiota composition associated with stool consistency. Gut 2016, 65(3), 540-2. https://doi.org/10.1136/gutjnl-2015-310328. Epub 2015 Aug 14. Pubmed PMID: 26276682. [CrossRef] [PubMed]
- Vandeputte, D., Falony, G., Vieira-Silva, S., Tito, R.Y., Joossens, M., Raes, J. Stool consistency is strongly associated with gut microbiota richness and composition, enterotypes and bacterial growth rates. Gut 2016, 65(1), 57-62. https://doi.org/10.1136/gutjnl-2015-309618. Epub 2015 Jun 11. Pubmed PMID: 26069274; Pubmed Central PMCID: PMC4717365. [CrossRef]
- Accarie, A., Vanuytsel, T. Animal Models for Functional Gastrointestinal Disorders. Front. Psychiatry 2020, 11, 11:509681. https://doi.org/10.3389/fpsyt.2020.509681. Pubmed PMID: 33262709; Pubmed Central PMCID: PMC7685985. [CrossRef]
- Farzi, A., Fröhlich, E.E., Holzer, P. Gut Microbiota and the Neuroendocrine System. Neurotherapeutics 2018, 15(1), 5-22. https://doi.org/10.1007/s13311-017-0600-5. Pubmed PMID: 29380303; Pubmed Central PMCID: PMC5794709. [CrossRef]
- Carlstead, K., Shepherdson, D. Alleviating stress in zoo animals with environmental enrichment. In: The Biology of Animal Stress - Basic Principles and Implications for Animal Welfare; Moberg, G.P., Mench, J.A., Eds.; CAB International: New York, 2000; pp. 337-54.
- Swaisgood, R.R., Shepherdson, D.J. Scientific approaches to enrichment and stereotypies in zoo animals: what’s been done and where should we go next? Zoo Biol. 2005, 24(6), 499-518. https://doi.org/10.1002/zoo.20066. [CrossRef]
- Bond, J.C., Lindburg, D.G. Carcass feeding of captive cheetahs (Acinonyx jubatus): the effects of a naturalistic feeding program on oral health and psychological well-being. Appl. Anim. Behav. Sci. 1990, 26(4), 373-82. https://doi.org/10.1016/0168-1591(90)90036-D. [CrossRef]
- Skibiel, A.L., Trevino, H.S., Naugher, K. Comparison of several types of enrichment for captive felids. Zoo Biol. 2007, 26(5), 371-81. https://doi.org/10.1002/zoo.20147. Pubmed PMID: 19360587. [CrossRef] [PubMed]
- Acaralp-Rehnberg, L.K., Coleman, G.J., Magrath, M.J.L., Melfi, V., Fanson, K.V., Bland, I.M. The Effect of Behind-The-Scenes Encounters and Interactive Presentations on the Welfare of Captive Servals (Leptailurus serval). Animals (Basel) 2020, 10(4), 743. https://doi.org/10.3390/ani10040743. Pubmed PMID: 32344609; Pubmed Central PMCID: PMC7222754. [CrossRef]
- Bashaw, M.J., Kelling, A.S., Bloomsmith, M.A., Maple, T.L. Environmental effects on the behavior of zoo-housed lions and tigers, with a case study of the effects of a visual barrier on pacing. J. Appl. Anim. Welf. Sci. 2007, 10(2), 95-109. https://doi.org/10.1080/10888700701313116. Pubmed PMID: 17559318. [CrossRef] [PubMed]
- De Souza Resende, L., Lima e Neto, G., Gonçalves Duarte Carvalho, P., Landau-Remy, G., de Almeida Ramos-Júnior, V., Andriolo, A., Genaro, G. Time budget and activity patterns of oncilla cats (Leopardus tigrinus) in captivity. J. Appl. Anim. Welf. Sci. 2014, 17(1), 73-81. https://doi.org/10.1080/10888705.2014.856253. Pubmed PMID: 24484312. [CrossRef] [PubMed]
- Macri, A.M., Patterson-Kane, E. Behavioural analysis of solitary versus socially housed snow leopards (Panthera uncia), with the provision of simulated social contact. Appl. Anim. Behav. Sci. 2011, 130(3-4), 115-23. https://doi.org/10.1016/j.applanim.2010.12.005. [CrossRef]
- Moreira, N., Brown, J.L., Moraes, W., Swanson, W.F., Monteiro-Filho, E.L. Effect of housing and environmental enrichment on adrenocortical activity, behavior and reproductive cyclicity in the female tigrina (Leopardus tigrinus) and margay (Leopardus wiedii). Zoo Biol. 2007, 26(6), 441-60. https://doi.org/10.1002/zoo.20139. Pubmed PMID: 19360593. [CrossRef] [PubMed]
- Shepherdson, D.J., Carlstead, K., Mellen, J.D., Seiden-sticker, J. The influence of food presentation on the behavior of small cats in confined environments. Zoo Biol. 1993, 12(2), 203-16. https://doi.org/10.1002/zoo.1430120206. [CrossRef]
- Weller, S.H., Bennett, C.L. Twenty-four hour activity budgets and patterns of behavior in captive ocelots (Leopardus pardalis). Appl. Anim. Behav. Sci. 2001, 71(1), 67-79. https://doi.org/10.1016/s0168-1591(00)00169-6. Pubmed PMID: 11179560. [CrossRef] [PubMed]
- Siegel, J.M. Clues to the functions of mammalian sleep. Nature 2005, 437(7063), 1264-71. https://doi.org/10.1038/nature04285. Pubmed PMID: 16251951; Pubmed Central PMCID: PMC8760626. [CrossRef]
- Coffman, J. Chronic stress, physiological adaptation and developmental programming of the neuroendocrine stress system. Future Neurol. 2020, 15(8), FNL39. https://doi.org/10.2217/fnl-2019-0014. [CrossRef]
- Romero, L.M., Wingfield, J.C. Mediators of Stress. In: Tempests, Poxes, Predators, and People: Stress in Wild Animals and How They Cope, 1st edn; Oxford University Press: New York, 2015; pp. 23-68.
- Sapolsky, R.M., Romero, L.M., Munck, A.U. How do glucocorticoids influence stress responses? Integrating permissive, suppressive, stimulatory, and preparative actions. Endocr. Rev. 2000, 21(1), 55-89. https://doi.org/10.1210/edrv.21.1.0389. Pubmed PMID: 10696570. [CrossRef] [PubMed]
- Moncek, F., Duncko, R., Johansson, B.B., Jezova, D. Effect of environmental enrichment on stress related systems in rats. J. Neuroendocrinol. 2004, 16(5), 423-31. https://doi.org/10.1111/j.1365-2826.2004.01173.x. Pubmed PMID: 15117335. [CrossRef] [PubMed]
- Azar, T.A., Sharp, J.L., Lawson, D.M. Effects of cage enrichment on heart rate, blood pressure, and activity of female Sprague-Dawley and spontaneously hypertensive rats at rest and after acute challenges. J. Am. Assoc. Lab. Anim. Sci. 2012, 51(3), 339-44. Pubmed PMID: 22776192; Pubmed Central PMCID: PMC3358983.
- Marashi, V., Barnekow, A., Ossendorf, E., Sachser, N. Effects of different forms of environmental enrichment on behavioral, endocrinological, and immunological parameters in male mice. Horm. Behav. 2003, 43(2), 281-92. https://doi.org/10.1016/s0018-506x(03)00002-3. Pubmed PMID: 12694638. [CrossRef] [PubMed]
- Ravenelle, R., Santolucito, H.B., Byrnes, E.M., Byrnes, J.J., Donaldson, S.T. Housing environment modulates physiological and behavioral responses to anxiogenic stimuli in trait anxiety male rats. Neuroscience 2014, 270, 76-87. https://doi.org/10.1016/j.neuroscience.2014.03.060. Epub 2014 Apr 05. Pubmed PMID: 24713371; Pubmed Central PMCID: PMC4047719. [CrossRef]
- Sharp, J., Azar, T., Lawson, D. Effects of a complex housing environment on heart rate and blood pressure of rats at rest and after stressful challenges. J. Am. Assoc. Lab. Anim. Sci. 2014, 53(1), 52-60. Pubmed PMID: 24411780; Pubmed Central PMCID: PMC3894648.
- Sharp, J.L., Zammit, T.G., Azar, T.A., Lawson, D.M. Stress-like responses to common procedures in male rats housed alone or with other rats. Contemp. Top. Lab. Anim. Sci. 2002, 41(4), 8-14. Pubmed PMID: 12109891. [PubMed]
- Wascher, C.A.F. Heart rate as a measure of emotional arousal in evolutionary biology. Phil. Trans. R. Soc. 2021, B376, 20200479. https://doi.org/10.1098/rstb.2020.0479. [CrossRef]
- Burton, D.A., Stokes, K.A., Hall, G.M. Physiological effects of exercise. CEACCP 2004, 4(6), 185-8. https://doi.org/10.1093/bjaceaccp/mkh050. [CrossRef]
- Smail, M.A., Smith, B.L., Nawreen, N., Herman, J.P. Differential impact of stress and environmental enrichment on corticolimbic circuits. Pharmacol. Biochem. Behav. 2020, 197, 172993. https://doi.org/10.1016/j.pbb.2020.172993. Epub 2020 Jul 11. Pubmed PMID: 32659243; Pubmed Central PMCID: PMC7484282. [CrossRef]
- Meehan, C.L., Mench, J.A. The challenge of challenge: Can problem solving opportunities enhance animal welfare? Appl. Anim. Behav. Sci. 2007, 102(3-4), 246-61. https://doi.org/10.1016/j.applanim.2006.05.031. [CrossRef]
- Ashokan, A., Sivasubramanian, M., Mitra, R. Seeding Stress Resilience through Inoculation. Neural. Plast. 2016, 2016, 4928081. https://doi.org/10.1155/2016/4928081. Epub 2016 Jan 05. Pubmed PMID: 26881112; Pubmed Central PMCID: PMC4736400. [CrossRef]
- Liu, H., Zhang, C., Ji, Y., Yang, L. Biological and Psychological Perspectives of Resilience: Is It Possible to Improve Stress Resistance? Front. Hum. Neurosci. 2018, 12, 326. https://doi.org/10.3389/fnhum.2018.00326. Pubmed PMID: 30186127; Pubmed Central PMCID: PMC6110926. [CrossRef]
- Crofton, E.J., Zhang, Y., Green, T.A. Inoculation stress hypothesis of environmental enrichment. Neurosci. Biobehav. Rev. 2015, 49, 19-31. https://doi.org/10.1016/j.neubiorev.2014.11.017. Epub 2014 Nov 29. Pubmed PMID: 25449533; Pubmed Central PMCID: PMC4305384. [CrossRef]
- Lyons, D.M., Parker, K.J., Katz, M., Schatzberg, A.F. Developmental cascades linking stress inoculation, arousal regulation, and resilience. Front. Behav. Neurosci. 2009, 3, 32. https://doi.org/10.3389/neuro.08.032.2009. Pubmed PMID: 19826626; Pubmed Central PMCID: PMC2759374. [CrossRef]
- Parker, K.J., Maestripieri, D. Identifying key features of early stressful experiences that produce stress vulnerability and resilience in primates. Neurosci. Biobehav. Rev. 2011, 35(7), 1466-83. https://doi.org/10.1016/j.neubiorev.2010.09.003. Epub 2010 Sep 17. Pubmed PMID: 20851145; Pubmed Central PMCID: PMC3023826. [CrossRef]
- Hetem, R.S., Mitchell, D., De Witt, B.A., Fick, L.G., Maloney, S.K., Meyer, L.C.R., Fuller, A. Body temperature, activity patterns and hunting in free-living cheetah: biologging reveals new insights. Integr. Zool. 2019, 14(1), 30-47. https://doi.org/10.1111/1749-4877.12341. Pubmed PMID: 29851240. [CrossRef] [PubMed]
- Hetem, R.S., Mitchell, D., De Witt, B.A., Fick, L.G., Meyer, L.C.R., Maloney, S.K., Fuller, A. Cheetahs do not abandon hunts because they overheat. Biol. Lett. 2013, 9(5), 20130472. https://doi.org/10.1098/rsbl.2013.0472. [CrossRef]
- Sprockett, D., Fukami, T., Relman, D.A. Role of priority effects in the early-life assembly of the gut microbiota. Nat. Rev. Gastroenterol. Hepatol. 2018, 15(4):197-205. https://doi.org/10.1038/nrgastro.2017.173. Epub 2018 Jan 24. PMID:29362469; PMCID: PMC6813786. [CrossRef]
- Li, X., Bi, R., Xiao, K., Roy, A., Zhang, Z., Chen, X., Peng, J., Wang, R., Yang, R., Shen, X., et al. Hen raising helps chicks establish gut microbiota in their early life and improve microbiota stability after H9N2 challenge. Microbiome 2022, 10(1), 14. https://doi.org/10.1186/s40168-021-01200-z. PMID: 35074015; PMCID: PMC8785444. [CrossRef]
- Chen, C.Y., Chen, C.K., Chen, Y.Y. et al. Maternal gut microbes shape the early-life assembly of gut microbiota in passerine chicks via nests. Microbiome 2020, 8, 129. https://doi.org/10.1186/s40168-020-00896-9. [CrossRef]
- Yoshikawa, K., Kurihara, C., Furuhashi, H., Takajo, T., Maruta, K., Yasutake, Y., Sato, H., Narimatsu, K., Okada, Y., Higashiyama, M., et al. Psychological stress exacerbates NSAID-induced small bowel injury by inducing changes in intestinal microbiota and permeability via glucocorticoid receptor signaling. J. Gastroenterol. 2017, 52(1), 61-71. https://doi.org/10.1007/s00535-016-1205-1. Epub 2016 Apr 13. Pubmed PMID: 27075753. [CrossRef] [PubMed]
- Zhang, J., Song, L., Wang, Y., Liu, C., Zhang, L., Zhu, S., Liu, S., Duan, L. Beneficial effect of butyrate-producing Lachnospiraceae on stress-induced visceral hypersensitivity in rats. J. Gastroenterol. Hepatol. 2019, 34(8), 1368-76. https://doi.org/10.1111/jgh.14536. Epub 2018 Dec 16. Pubmed PMID: 30402954; Pubmed Central PMCID: PMC7379616. [CrossRef]
- Palme, R. Non-invasive measurement of glucocorticoids: Advances and problems. Physiol. Behav. 2019, 199, 229-243. https://doi.org/10.1016/j.physbeh.2018.11.021. Epub 2018 Nov 20. PMID: 30468744. [CrossRef] [PubMed]
- Palme, R., Rettenbacher, S., Touma, C., El-Bahr, S.M., Möstl, E. Stress hormones in mammals and birds: comparative aspects regarding metabolism, excretion, and noninvasive measurement in fecal samples. Ann. N. Y. Acad. Sci. 2005, 1040, 162-71. https://doi.org/10.1196/annals.1327.021. PMID: 15891021. [CrossRef] [PubMed]
- Shepherdson, D., Lewis, K.D., Carlstead, K., Bauman, J., Perrin, N. Individual and environmental factors associated with stereotypic behavior and fecal glucocorticoid metabolite levels in zoo housed polar bears. Appl. Anim. Behav. Sci. 2013, 147(3-4), 268-77. https://doi.org/10.1016/j.applanim.2013.01.001. [CrossRef]
- Sheriff, M.J., Dantzer, B., Delehanty, B., Palme, R., Boonstra, R. Measuring stress in wildlife: techniques for quantifying glucocorticoids. Oecologia 2011, 166(4), 869-87. https://doi.org/10.1007/s00442-011-1943-y. Epub 2011 Feb 23. PMID: 21344254. [CrossRef] [PubMed]
- von der Ohe, C.G., Servheen, C. Measuring Stress in Mammals Using Fecal Glucocorticoids: Opportunities and Challenges. Wildl. Soc. Bull. 2002, 30(4), 1215-25. https://doi.org/10.2307/3784291. [CrossRef]
- Palme, R., Fischer, P., Schildorfer, H., Ismail, M.N. Excretion of infused 14C-steroid hormones via faeces and urine in domestic livestock. Anim. Reprod. Sci. 1996, 43(1), 43-63. https://doi.org/10.1016/0378-4320(95)01458-6. [CrossRef]
| Group | Identification Number | Origin | Housing | DOB 1 (YY-MM-DD) | BM1 2 (kg) | BM2 3 (kg) | Sex |
|---|---|---|---|---|---|---|---|
| 1 | CH-2205 | Captive-born (hand-reared) | Paired (with CH-2206) | 2016-06-09 | 45.0 | 45.0 | M |
| CH-2206 | Captive-born (hand-reared) | Paired (with CH-2205) | 2016-06-09 | 47.15 | 47.65 | M | |
| CH-2207 | Captive-born (hand-reared) | Single | 2016-06-09 | 36.6 | 37.1 | F | |
| 2 | CH-2271 | Captive-born (hand-reared) | Single | 2017-08-28 | 37.65 | 41.75 | M |
| CH-2276 | Captive-born (hand-reared) | Paired (with CH-2277) | 2017-09-16 | 39.9 | 39.35 | F | |
| CH-2277 | Captive-born (hand-reared) | Paired (with CH-2276) | 2017-09-16 | 43.05 | 43.55 | F |
| Inactive | |
|---|---|
| Inactive | Laying/asleep, laying/awake, sitting (stationary in a bipedal position) |
| Active | |
| Individual behaviour | |
| Appetitive behaviour | Feeding, food anticipatory activity, stalking |
| Attention | Staring at one area or paying attention to any visual or auditory stimulus |
| Auto-grooming | Licking or scratching of the own body |
| Environmental enrichment | Interacting with an enrichment device by biting, dragging, scratching, or carrying it in the mouth |
| Locomotion | Jumping, running, solitary play, walking |
| Maintenance | Drinking, defecating/urinating, yawning |
| Olfactory exploration | Sniffing the air, an object, or the substrate; performing flehmen |
| Scent marking | Marking substrates or objects in the enclosure by urine-spraying (releasing urine backwards against a vertical surface or object while standing with tail raised vertically), rolling and rubbing (leaving scents on the substrate or on any object, respectively) |
| Standing | Stationary in a quadrupedal position |
| Stereotypical | Pacing (repetitive, apparently functionless locomotory movement along a given route uninterrupted by other behaviours) |
| Vocalisation | Chirping, growling, purring, stutter-barking, or yowling |
| Social behaviour | |
| Affiliative behaviour * | Social play (play-fight, chasing, or playing together with an enrichment item), pawing, or rubbing on a conspecific, social grooming (licking a conspecific or being licked), paying attention to conspecifics by observing them with interest, and interacting with human caretakers |
| Agnostic behaviour * | Aggression, dominance mount, threat display |
| Interspecific behaviour | Paying attention to another species’ presence |
| Not observed | |
| Out of sight | Focal animal is not visible from the point of observation/behaviour unknown |
| Variable | Effect | Level | - Level | t | p | df 1 | Cohen’s d | 95 % CI 2 for Cohen’s d | |
|---|---|---|---|---|---|---|---|---|---|
| Lower | Upper | ||||||||
| Body temperature (°C) | Feeding time | Yes | No | 9.46 | < 0.0001 | 16698 | 0.41 | 0.32 | 0.49 |
| Feeding time*Part of the day | Yes, evening | No, evening | 7.24 | < 0.0001 | 16698 | 0.65 | 0.48 | 0.83 | |
| Feeding time*Part of the day | Yes, afternoon | No, afternoon | 6.22 | < 0.0001 | 16698 | 0.54 | 0.37 | 0.71 | |
| Heart rate (bpm) | Study period | Control | Treatment | 7.11 | < 0.0001 | 30221 | 0.11 | 0.08 | 0.14 |
| Feed/starve day | Feed day | Starve day | 13.26 | < 0.0001 | 30221 | 0.20 | 0.17 | 0.23 | |
| Study period*FD 3/SD 4 | CFD 5 | TSD 6 | 18.97 | < 0.0001 | 30221 | 0.31 | 0.27 | 0.34 | |
| Study period*FD 3/SD 4 | TFD 7 | TSD 6 | 18.05 | < 0.0001 | 30221 | 0.30 | 0.26 | 0.33 | |
| Study period*FD 3/SD 4 | CSD 8 | TSD 6 | 7.59 | < 0.0001 | 30221 | 0.20 | 0.15 | 0.26 | |
| Study period*FD 3/SD 4 | CFD 5 | CSD 8 | 4.03 | < 0.0001 | 30221 | 0.10 | 0.05 | 0.15 | |
| Study period*FD 3/SD 4 | TFD 7 | CSD 8 | 3.64 | 0.0003 | 30221 | 0.09 | 0.04 | 0.14 | |
| Feeding Time | Yes | No | 1.97 | 0.0484 | 14834 | 0.09 | 0.00 | 0.18 | |
| Feeding time*Part of the day | No, late morning | Yes, late morning | 3.69 | 0.0002 | 14834 | 0.14 | 0.07 | 0.21 | |
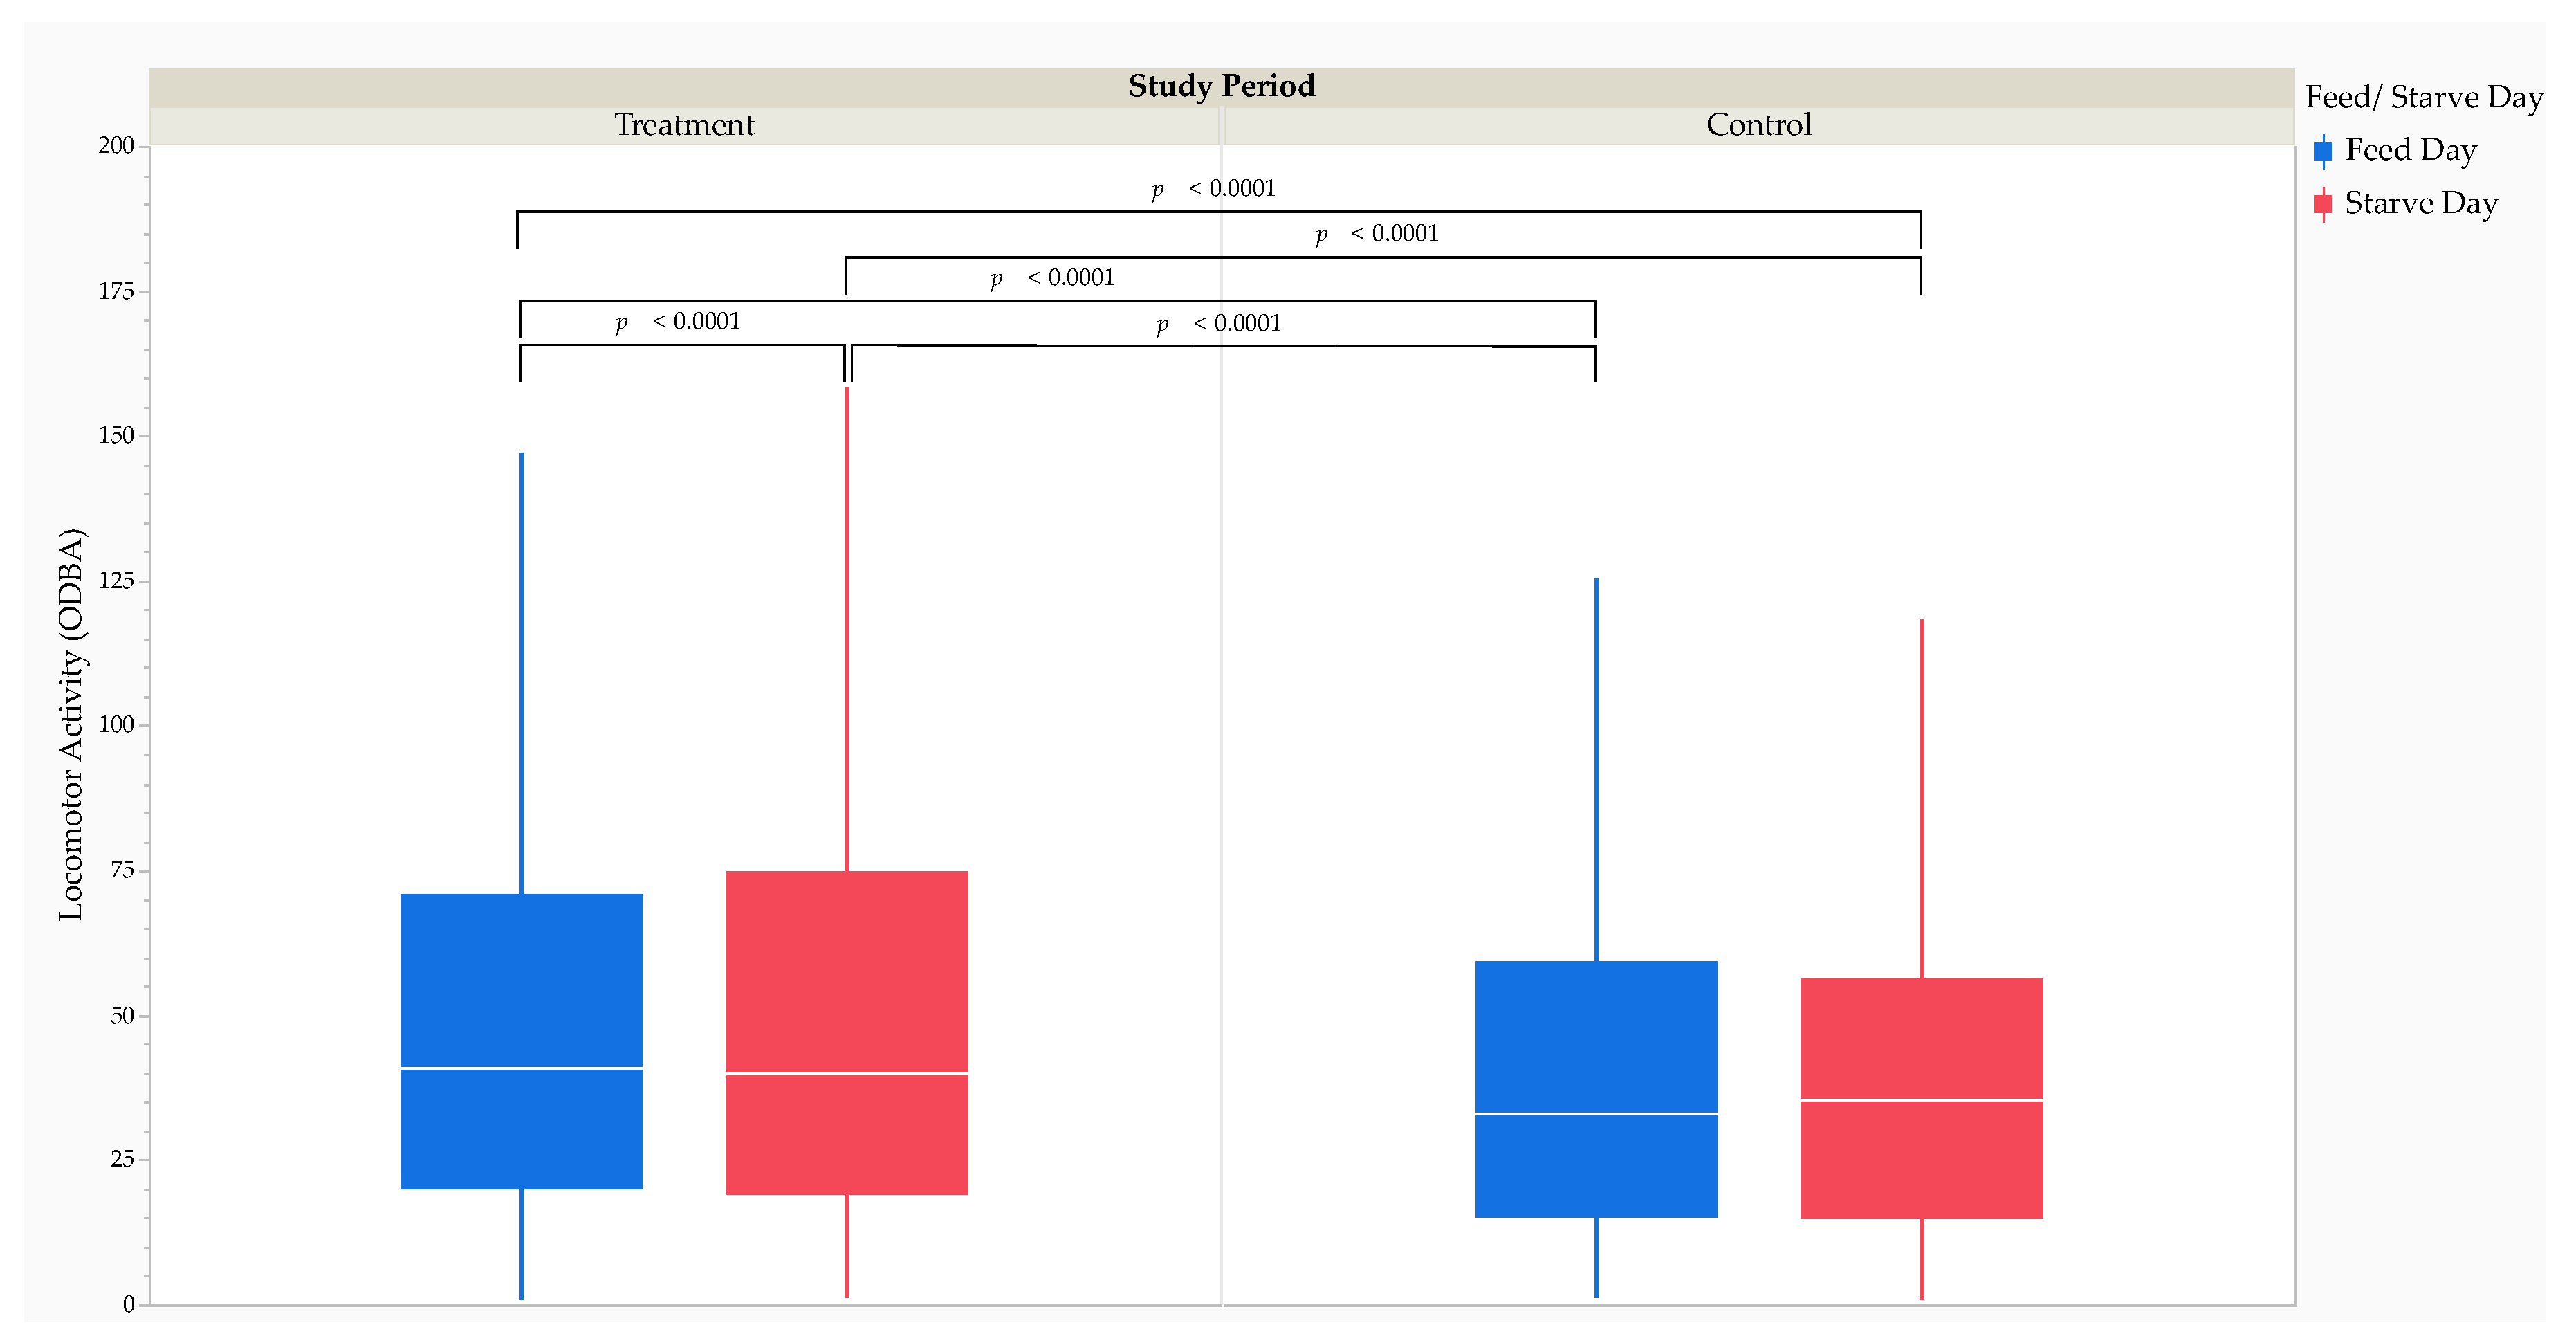
| Locomotor activity (ODBA) | Study period | Treatment | Control | 15.48 | < 0.0001 | 33399 | 0.22 | 0.19 | 0.25 |
| Feed/starve day | Feed day | Starve day | 0.38 | 0.7070 | 33399 | 0.01 | -0.02 | 0.03 | |
| Study period*FD 3/SD 4 | TSD 6 | CSD 8 | 10.13 | < 0.0001 | 33399 | 0.26 | 0.21 | 0.31 | |
| Study period*FD 3/SD 4 | TFD 7 | CSD 8 | 9.39 | < 0.0001 | 33399 | 0.23 | 0.18 | 0.27 | |
| Study period*FD 3/SD 4 | TSD 6 | CFD 5 | 14.11 | < 0.0001 | 33399 | 0.22 | 0.19 | 0.25 | |
| Study period*FD 3/SD 4 | TFD 7 | CFD 5 | 14.44 | < 0.0001 | 33399 | 0.18 | 0.16 | 0.21 | |
| Study period*FD 3/SD 4 | TSD 6 | TFD 7 | 2.11 | 0.0347 | 33399 | 0.03 | 0.00 | 0.06 | |
| Feeding time | Yes | No | 7.74 | < 0.0001 | 16686 | 0.33 | 0.25 | 0.42 | |
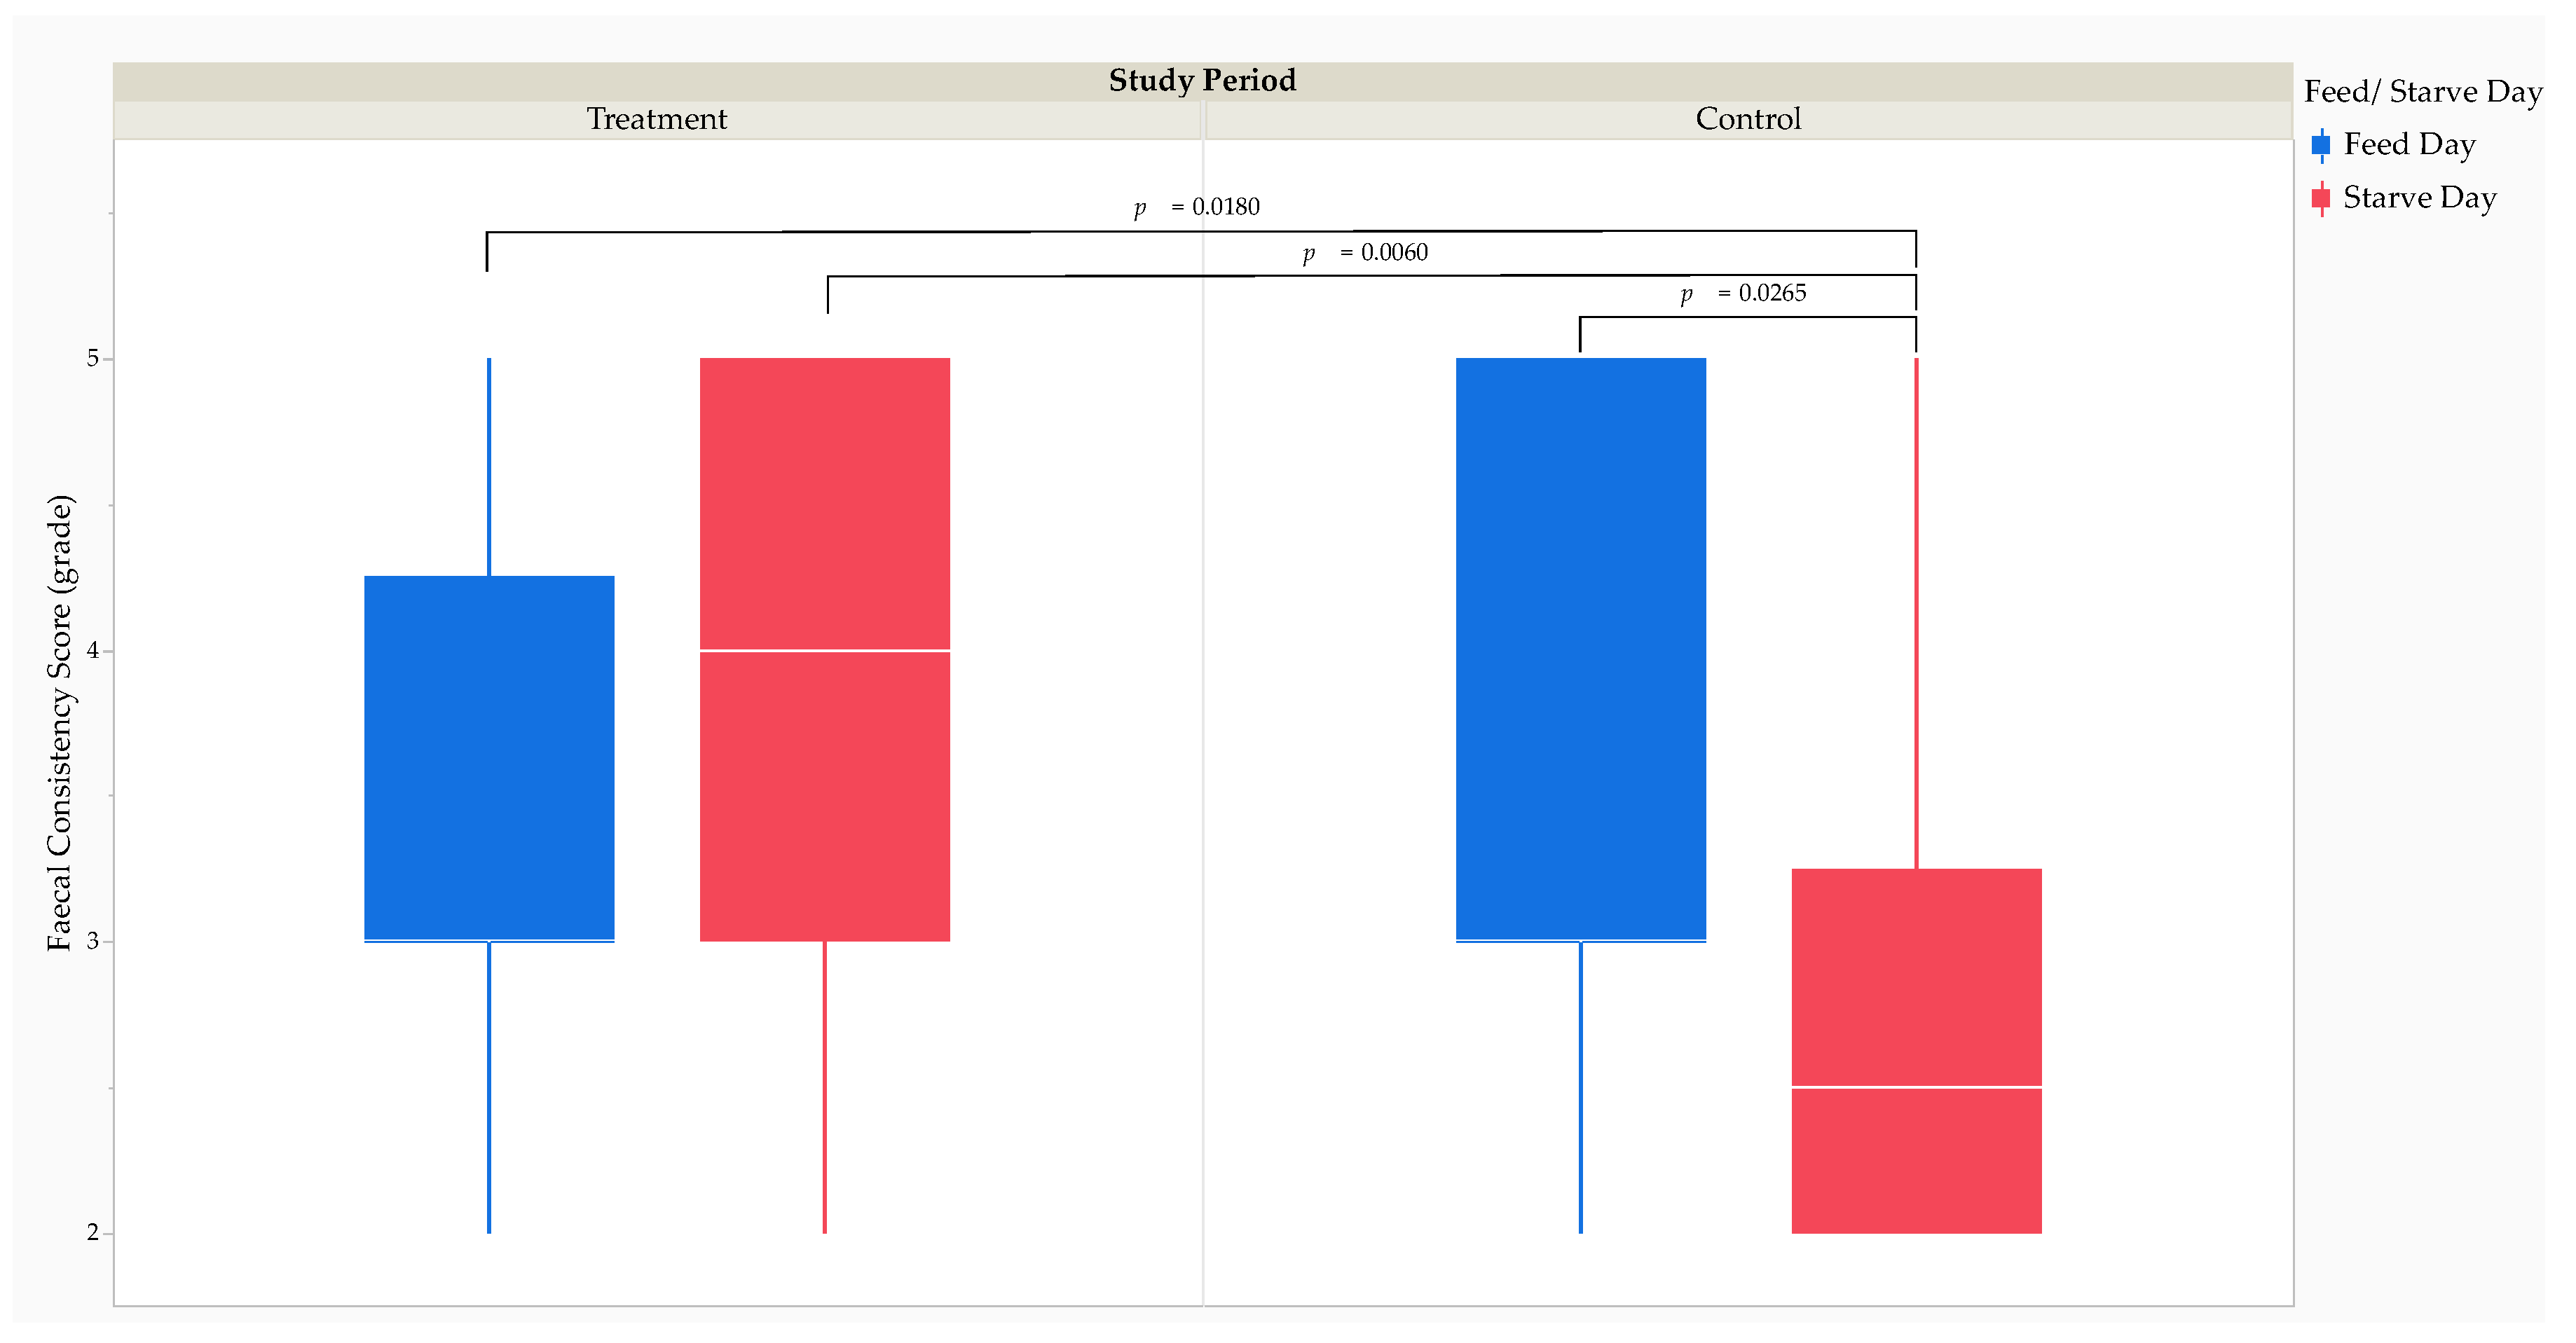
| Faecal consistency score (grade) | Study Period | Treatment | Control | 3.31 | 0.0011 | 209 | 0.65 | 0.26 | 1.03 |
| Study period*FD 3/SD 4 | TSD 6 | CSD 8 | 3.43 | 0.0007 | 209 | 1.23 | 0.51 | 1.94 | |
| Study period*FD 3/SD 4 | TFD 7 | CSD 8 | 3.17 | 0.0017 | 209 | 1.07 | 0.40 | 1.74 | |
| Study period*FD 3/SD 4 | CFD 5 | CSD 8 | 3.04 | 0.0027 | 209 | 1.01 | 0.35 | 1.66 | |
Disclaimer/Publisher’s Note: The statements, opinions and data contained in all publications are solely those of the individual author(s) and contributor(s) and not of MDPI and/or the editor(s). MDPI and/or the editor(s) disclaim responsibility for any injury to people or property resulting from any ideas, methods, instructions, or products referred to in the content. |
© 2023 by the authors. Licensee MDPI, Basel, Switzerland. This article is an open access article distributed under the terms and conditions of the Creative Commons Attribution (CC BY) license (http://creativecommons.org/licenses/by/4.0/).


