Preprint
Article

Nonlinear Internal Tides in a Realistically Forced Global Ocean Simulation

Altmetrics

Downloads

222

Views

180

Comments

0

A peer-reviewed article of this preprint also exists.

Submitted:

09 August 2023

Posted:

11 August 2023

You are already at the latest version

Alerts
Abstract
The decay of the low-mode internal tide due to the superharmonic energy cascade is investigated in a realistically forced global Hybrid Coordinate Ocean Model (HYCOM) simulation with 1/25 degrees (4 km) horizontal grid spacing. Time-mean and depth-integrated supertidal kinetic energy is found to be largest near low-latitude internal tide generation sites, such as the Bay of Bengal, Amazon Shelf, and Mascarene Ridge. The supertidal kinetic energy can make up to 50% of the total internal tide kinetic energy several hundred kilometers from the generation sites. As opposed to the tidal flux divergence, the supertidal flux divergence does not correlate with the barotropic to baroclinic energy conversion. Instead, the time-mean and depth-integrated supertidal flux divergence correlates with the nonlinear kinetic energy transfers from (sub)tidal to supertidal frequency bands as estimated with a novel coarse-graining approach. The regular spaced banding patterns of the surface-intensified nonlinear energy transfers are attributed to semidiurnal mode 1 and mode 2 internal waves that interfere constructively at the surface. This causes patches where both surface tidal KE and nonlinear energy transfers are elevated. The simulated internal tide off the Amazon shelf steepens significantly near these patches, generating solitary-like waves in good agreement with Synthetic Aperture Radar (SAR) imagery. Globally, we find that regions of high supertidal energy flux also show a high correlation with observed instances of solitary nonlinear internal waves.
Keywords: 
Subject: Physical Sciences  -   Fluids and Plasmas Physics
  • Supertidal energy as a fraction of the tidal energy is elevated at low latitudes, making up to 50% of total tidal energy in some regions
  • Supertidal flux divergence and surface tidal energy reveal banding pattern due to interaction of mode 1 and mode 2 internal tides
  • Supertidal flux divergence is due to energy transfer from internal tides to higher-harmonic frequencies as computed with coarse-graining

Plain Language Summary

Planetary motions result in surface tides around the global ocean, which in turn generate internal waves (also called internal tides) when propagating over continental shelves and ridges. These internal motions are an important source of mixing for the deep ocean, affecting surface temperatures and redistribution of heat. Over the last decade the concurrent modeling of tides and currents have led to "realistically forced" global ocean models that are more accurate than their standalone models. This study investigates the process of "internal tide steepening", based on the realistically forced US Navy’s global ocean model called HYCOM using 4 km horizontal grid resolution. We find internal tides of different wavelengths, which travel at different speeds, interact when the larger (faster) internal tides overtake the smaller (slower) waves, steepening due to constructive interference. At these locations, energy is transferred to higher frequencies and sharp-crested solitary-like waves emerge in good agreement with other models and satellite observations. Although these steep (nonlinear) internal tides are observed in global ocean models, higher resolutions are needed to better resolve smaller waves.

1. Introduction

Internal tides are formed when barotropic tides propagate along steep slopes where barotropic energy is transferred to baroclinic (internal) tides at a rate of about 1 TW globally (Egbert and Ray 2000; Egbert and Ray 2001). The baroclinic motions induced by the tides play an important role in the vertical mixing of the deep ocean, affecting the thermohaline overturning circulation (Wunsch and Ferrari 2004; Melet et al. 2013; Waterhouse et al. 2014). While globally about half of the energy converted to internal tides is dissipated locally as high vertical modes (Vic et al. 2019), the remaining low modes radiate away. In both satellite altimetry (Zhao et al. 2016) and realistically forced global ocean models (Shriver et al. 2012; Muller et al. 2012; Buijsman et al. 2020) low-mode internal tides are observed to propagate across ocean basins. The dissipation of these low-mode internal tides is attributed to several mechanisms: 1) scattering at topography (Johnston and Merrifield 2003; Lamb 2004; Mathur et al. 2014), 2) scattering by mesoscale eddies (Kelly et al. 2016; Dunphy et al. 2017; Savage et al. 2020), 3) breaking at topography and shelves (Legg 2014; Klymak et al. 2016) and 4) wave-wave (triad) interactions (Olbers 1976; Varma and Mathur 2017; Eden et al. 2019; Baker and Sutherland 2020; Sutherland and Dhaliwal 2022).
In this paper we consider the decay of low-mode internal tides, generated at tall ridges or shelves, due to wave-wave interactions that drive a forward energy cascade to higher frequencies and wavenumbers. Linear internal tides manifest in the ocean as plane propagating wave modes that form horizontal wave beams. These modes can either self interact (Baker and Sutherland 2020; Sutherland and Dhaliwal 2022) or interact with other modes (Varma and Mathur 2017) in resonant triad interactions, generating modes at higher frequencies and wavenumbers. A commonly studied triad interaction, in which an internal tide interacts with an inertial mode of half the tidal frequency, referred to as Parametric Subharmonic Instability (PSI; e.g., Mackinnon et al. 2013; Ansong et al. 2018), is not considered in this study.
When the background rotation is weak and the stratification is surface intensified, a low-mode internal tide with significant energy may undergo a “superharmonic cascade" (Sutherland and Dhaliwal 2022), in which the mode disperses into a train of nonlinear internal waves (NLIWs) (Helfrich and Grimshaw 2008; Helfrich and Grimshaw 2008), also referred to as solitons or solitary waves. These waves have higher wavenumbers and frequencies than the mother wave they evolved from. This process, in which a long sinusoidal internal tide transforms into a short wavelength solitary wave of O ( 1 ) km, is also referred to as “nonlinear steepening". Analytical solutions for these NLIW result from the modified Korteweg-de Vries (KdV) equations (Ostrovsky and Stepanyants 1989), in which the advective term balances nonhydrostatic and Coriolis dispersion. Due to its higher frequency, the semidiurnal internal tide is more affected by nonlinear steepening than the diurnal internal tide. Equatorward of the diurnal turning latitude, Coriolis dispersion inhibits the steepening of the diurnal internal tide because its frequency is closer to the local Coriolis frequency than the frequency of the semidiurnal internal tide (Helfrich and Grimshaw 2008; Farmer et al. 2009).
NLIW may also result from other mechanisms than the steepening of the low-mode internal tide. These mechanisms include lee waves (Maxworthy 1979), tidal beams impinging on a pycnocline (New and Pingree 1990; New and Pingree 1992; Gerkema 2001; Grisouard et al. 2011; Mercier et al. 2012) and topographic scattering (Lamb 2004; Gerkema et al. 2006). Lee waves are generated over a ridge or bank when the tidal barotropic flow arrests upstream propagating internal wave modes. As the tidal flow relaxes the lee-wave may evolve into an internal solitary wave train. Solitary wave trains are also formed when a tidal beam, generated at a ridge or shelf, impinges on a moderately stratified pycnocline. Laboratory experiments confirm the generation of higher-harmonics at multiples of the primary frequency and solitary waves at even higher frequencies by tidal beams impinging on a pycnocline (Mercier et al. 2012). In topographic scattering, the internal tide interacts with supercritical topography to generate higher-harmonics.
Low-mode nonlinear internal waves with large enough amplitudes in the interior are easily detectable with Synthetic Aperture Radar (SAR) and optical sunglint imagery from satellite (Alpers 2018; Jackson et al. 2012; Jackson et al. 2013) because the waves’ surface currents affect ocean surface roughness. Using optical sunglint imagery, Jackson (2007) compiled a global map of NLIWs that shows they are ubiquitous globally in coastal shelf areas and in the (sub)tropics in the open ocean, e.g., in the South China Sea (Simmons et al. 2011; Alford et al. 2015), near the Mascarene Ridge (Konyaev et al. 1995; da Silva et al. 2015), in the Bay of Bengal and Andaman Sea (Osborne and Burch 1980; Jensen et al. 2020; Magalhaes et al. 2020), and offshore of the Amazon Shelf (Ivanov et al. 1990; Magalhaes et al. 2016). The higher harmonic frequencies associated with these nonlinear internal waves have also been observed with moorings, e.g., in the Bay of Biscay (van Aken et al. 2007) and globally with surface drifters (Yu et al. 2019).
Regardless of the generation mechanism, the presence of NLIW represents a potential energy sink for low-mode internal tides and a pathway to dissipation. Strong vertical mixing associated with large amplitude low-mode NLIW has been observed in areas such as the Oregon shelf (Moum et al. 2003), the Monterey Bay shelf (Carter et al. 2005), the New Jersey shelf (Shroyer et al. 2010), and the South China Sea (Alford et al. 2015; Zhang et al. 2023).
High-frequency nonlinear (solitary) internal waves have generally been studied in high-resolution process and regional nonhydrostatic model simulations with horizontal resolutions of O ( 100 ) m (e.g., Simmons et al. 2011; da Silva et al. 2015; Magalhaes et al. 2020; Buijsman et al. 2010). It is not yet clear how well they are simulated in realistically forced hydrostatic global ocean model simulations with horizontal resolutions of O ( 1 ) km. The appearance of solitary-like waves in hydrostatic models (Jensen et al. 2020) has been attributed to numerical dispersion that mimics the nonhydrostatic dispersion (Vitousek and Fringer 2011). Global ocean models do simulate internal waves at supertidal frequencies (e.g., Müller et al. 2015; Savage et al. 2017; Luecke et al. 2020; Arbic et al. 2022). However, these latter analyses have not specifically focused on tidally generated low-mode nonlinear internal waves, which are the target of this paper. While the depth-integrated energy budget of the semidiurnal internal tide has been well investigated in realistically forced global ocean simulations (Buijsman et al. 2020; Müller 2013; Buijsman et al. 2016; Li and von Storch 2020), such energy budget is lacking for low-mode nonlinear internal waves that have evolved from the primary frequency internal tides.
The overarching goal of this paper is to understand the decay of low-mode internal tides due to wave-wave interactions that drive a forward energy cascade to supertidal frequencies in a global Hybrid Coordinate Ocean Model (HYCOM) simulation with a 4-km horizontal resolution (Raja et al. 2022). Specific goals of this study are to 1) quantify the kinetic energy in the supertidal band, 2) quantify the energy transfer rate from the tidal to supertidal frequencies, 3) identify the mechanisms responsible for these energy transfers, and 4) compare simulated hotspots of supertidal internal wave energy with observations of NLIW.
The paper layout is as follows: the ocean model and methods used for this study are briefly described in section 2. Global internal tide energetics are presented in section 3, and discussed in more detail for the main internal tide beam radiating from the Amazon Shelf. In section 4 we correlate the occurrence of simulated supertidal energy flux with satellite imagery of solitary internal waves globally. We then estimate the nonlinear energy transfer rate from primary to higher-harmonic frequencies based on the coarse-grained kinetic energy transfer, and attribute the spatial patterns of the energy transfers to constructive interference between modes. Finally, we summarize our findings and make suggestions for future work in section 5.

2. Model and Methods

2.1. Model

HYCOM is a primitive equation ocean general circulation model (Bleck 2002) and the operational global ocean forecast model of the United States Navy (Metzger et al. 2014). The model uses a hybrid vertical coordinate that is isopycnal in the open ocean and transitions to terrain-following in shallow water, with z-coordinates used to resolve the surface mixed layer. The simulation presented in this paper is run in a forward (non-assimilative) mode on a tripolar grid at 1/25 (4 km) nominal horizontal resolution with 41 nonuniform layers in the vertical. In the mixed layer, vertical grid points are located at fixed depths most of which are 8 m apart, while in the deep ocean they move vertically with their assigned isopycnals. This grid resolution allows HYCOM to resolve at least four semidiurnal internal waves modes in deep water (Buijsman et al. 2020).
The model is forced with realistic atmospheric fields from the Navy Global Environmental Model (Hogan et al. 2014) and tidal forcing for the M 2 , S 2 , K 1 , O 1 , and N 2 tidal constituents. To account for numerical errors in the tidal solution due to imperfect topography and damping terms, an Augmented State Ensemble Kalman Filter is applied to optimize the spatially varying Self Attraction and Loading term used in the simulations (Ngodock et al. 2016). The sea surface height root mean squared error with TPXO8-atlas, an altimetry constrained model, is 2.6 cm. The surface tidal error is minimized by tuning the strength of the linear wave drag (Jayne and St. Laurent 2001), which is a parameterization of the surface-tide energy conversion to the unresolved baroclinic wave modes.
Model output from global HYCOM simulations has been validated extensively against moorings (Luecke et al. 2020), altimetry (Shriver et al. 2012; Buijsman et al. 2020; Buijsman et al. 2016), drifters (Arbic et al. 2022) and other models (Savage et al. 2017; Arbic et al. 2022). Subtidal kinetic energy is lower in HYCOM compared to surface drifters, especially near the equator. Near inertial kinetic energy shows good agreement with drifters, where the high (3-hr) wind forcing frequency plays an important role. Compared to altimetry, HYCOM is more energetic in the semidiurnal band, about 23% in hot-spot regions and 9% in global-mean variance (Buijsman et al. 2020). Diurnal and semidiurnal frequency band integrated steric sea surface height (SSSH) variances in HYCOM match reasonably well with tide gauges, although the model is clearly deficient at supertidal frequencies (Savage et al. 2017). Comparison with higher horizontal grid resolution models suggests that the variance in the supertidal band in HYCOM has not yet converged, and is significantly lower than observations.
In this paper we demonstrate that our HYCOM simulation can resolve the initial stages of the superharmonic cascade associated with the low-mode internal tide. We demonstrate in Appendix A) that the simulation does not resolve NLIW modes with wavelengths < 8 km that can result from this cascade. In Appendix A), we compare the generation of NLIW in the hydrostatic HYCOM simulation with a high-resolution nonhydrostatic MITgcm simulation at the Mascarene Ridge (da Silva et al. 2015). We find that HYCOM underestimates the supertidal energy by about 50% at this location.

2.2. Filtering

We compute the energy terms for the filtered 3D fields from our global HYCOM simulation. We use hourly output from global HYCOM for a 30-day period, starting May 20 and ending June 20, 2019. We use a 4th order Butterworth band-pass filter with 2-30 hr (green), 9-15 hr (blue) and 2-9 hr (red) cutoff periods to evaluate total internal tide energy (D1+D2+HH), semidiurnal (D2) and higher-harmonic (HH) frequency bands. We remove the first and last days to avoid ringing effects such that fields are time-averaged over a 28-day period. Figure 1 shows the horizontal energy frequency spectra of baroclinic surface velocities offshore of the Amazon Shelf, where tidal peaks (D1, D2) and higher-harmonic (HH) peaks can be observed. The HH (supertidal) peaks occur at multiples of the primary tidal frequencies (e.g., at 3, 4, 5, 6, etc., cycles per day (cpd)).
Because internal tide energy is found at narrow-band peaks, energy estimates are not very sensitive to the choice of the cutoff frequencies, although some small errors may be observed, for example around 3 cpd (Figure 1). The 30-day simulation period with hourly output frequency restricts our analysis to motions with a minimum fundamental frequency of 1/30 cpd and a maximum Nyquist frequency of 12 cpd, which captures our lowest frequency of interest (D1) and at least the first few supertidal peaks (D3-D6). The simulation period also allows for two spring-neap cycles, which is important for the generation cycle of nonlinear internal tides.

2.3. Internal Wave Energetics

The depth-integrated internal tide energy balance provides insight into energy sources and sinks in the ocean, and can be written as (Buijsman et al. 2016; Kang and Fringer 2012)
E ¯ t + H · F ¯ = C ¯ R ¯ ,
where the overbars indicate depth-integration, E ¯ t is the tendency term, H · F ¯ is the horizontal divergence ( H = x , y ) of the depth integrated baroclinic energy flux F ¯ , C ¯ is the barotropic to baroclinic energy conversion, and R ¯ is the residual. In the absence of wave-mean flow and wave-wave energy exchange energy terms (Kelly 2016; Pan et al. 2021; Barkan et al. 2021), the residual term is interpreted as baroclinic energy dissipation.
The total baroclinic wave energy ( E ¯ ) in equation (1) is the sum of the horizontal wave kinetic energy ( K E ¯ ) and available potential energy ( A P E ¯ ). For a water column height h the horizontal wave kinetic energy is computed as
K E ¯ = 1 2 ρ 0 h 0 | u H | 2 d z ,
where ρ 0 is the reference density and u H = u , v the baroclinic horizontal velocity vector along the x and y coordinates. The linear form of available potential energy is computed as (Kang and Fringer 2010)
A P E ¯ = 1 2 ρ 0 h 0 N ( z ) 2 ξ ( z ) 2 d z ,
where ξ is the vertical isopycnal displacement and N ( z ) is the buoyancy frequency. Although maps of time-mean A P E ¯ feature similar patterns as time-mean K E ¯ , we only present maps of time-mean K E ¯ because maps of time-mean A P E ¯ are noisy.
The depth-integrated hydrostatic baroclinic energy flux F ¯ is a measure of the horizontal internal wave energy transport. It can be written as
F ¯ = u H E ¯ + u H p ¯ ,
where F a = u H E ¯ represents nonlinear self-advection, F p = u H p ¯ represents hydrostatic pressure work, and p the perturbation pressure. The perturbation velocities and pressure have depth-integrals that are equal to zero, and are computed as described in Nash et al. (2005). Although advective energy fluxes can be as large as pressure fluxes in strongly nonlinear waves in high resolution Large Eddy Simulations (Venayagamoorthy and Fringer 2005), we will show that the contribution from energy advection is small in our HYCOM simulation.
The barotropic to baroclinic conversion is a source term in equation (1), and in the absence of nonhydrostatic effects can be computed as
C ¯ = p z = h u H ¯ · H h ,
where H h is the horizontal gradient of the ocean seafloor depth.
Finally, after time averaging eq. (1), the internal wave energy budget for both the tidal and supertidal bands is
C ¯ = H · F ¯ + R ¯ .

3. Results

In this section we discuss the geographical distribution of internal tide energy in the abyssal ocean, neglecting areas shallower than 250 m, and then explore energy sources and sinks. We limit our analysis to low-latitudes, between 25 S and 25 N, to provide more detail where higher-harmonic energy is important and to avoid aliasing of high frequency motions due to mesoscale eddies and near-inertial waves.

3.1. Global internal tide energetics

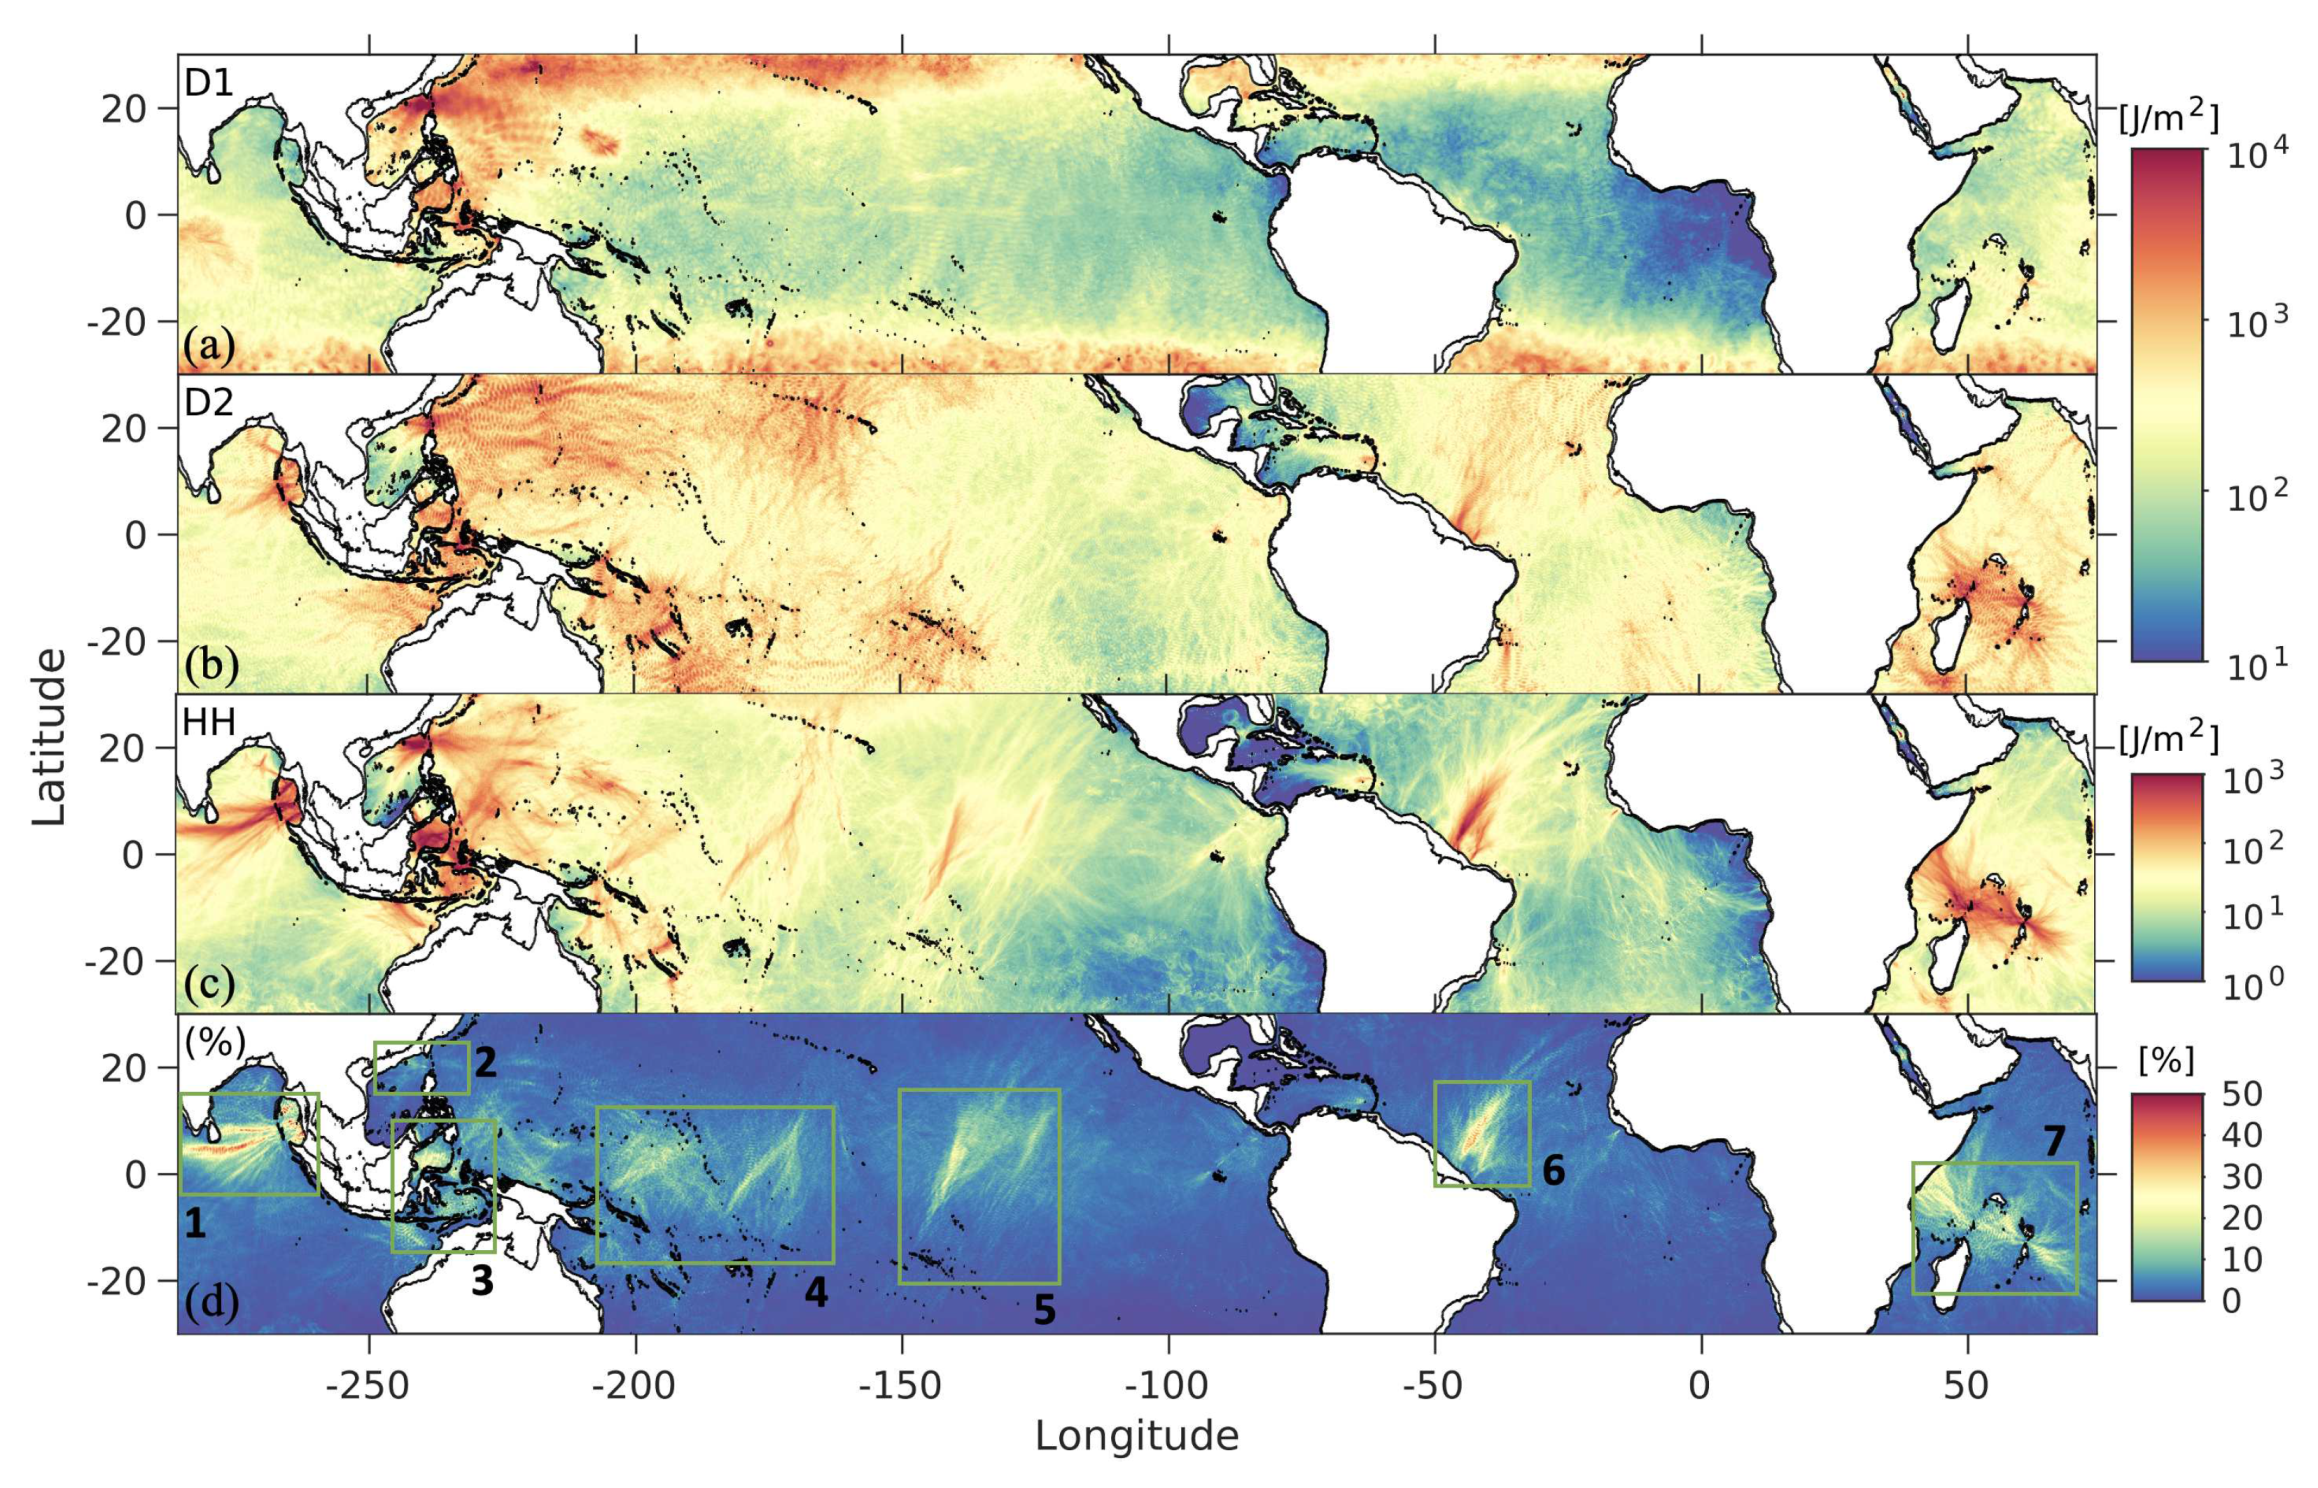
The time mean of the depth-integrated baroclinic kinetic energy (eq. 2) is shown in Figure 2 for the (a) diurnal, (b) semidiurnal and (c) higher-harmonic (supertidal) frequency bands. To highlight regions where supertidal waves are important, the ratio of higher-harmonic to total tidal energy (D1+D2+HH) is plotted in Figure 2d. The kinetic energy in the diurnal band contains energy from both diurnal internal tides and equatorward propagating near-inertial waves generated at the critical latitudes ( ± 30 ). Diurnal internal tides are most prominent at the Luzon Strait and Indonesian Archipelago (rectangles 2 and 3 in Figure 2d), while semidiurnal energy is more ubiquitous in the global ocean. In the HYCOM simulation analyzed here, supertidal kinetic energy is 1-2 orders of magnitude lower than tidal energy almost everywhere, except along strong internal tide beams at low-latitudes, most notably at the Bay of Bengal and Amazon Shelf (rectangles 1 and 6 in Figure 2d), where supertidal energy makes up 30-50% of the total energy.
The spatial distribution of internal tide energy yields some insights into their generation. Kinetic energy at diurnal and semidiurnal frequencies is highest near shallow and steep ridges, where energy is transferred from barotropic to baroclinic modes, and then decays rapidly with distance from the source. Conversely, supertidal kinetic energy can peak away from the generation sites of the internal tides, suggesting that the source of supertidal kinetic energy is the propagating internal tide. For example, equatorward of Hawaii (rectangle 4 in Figure 2d) and equatorward of the French Polynesian Islands (FPI; rectangle 5 in Figure 2d), supertidal kinetic energy emerges several hundred kilometers away from the generation sites along the path of the primary internal tide. The supertidal K E fraction is much smaller for beams radiation poleward from Hawaii and the FPI (Figure 2d). The asymmetry between equatorward and poleward radiating supertidal beams from Hawaii and FPI suggests that the Coriolis and buoyancy frequencies play an important role in the generation of superharmonics (Sutherland and Dhaliwal 2022).
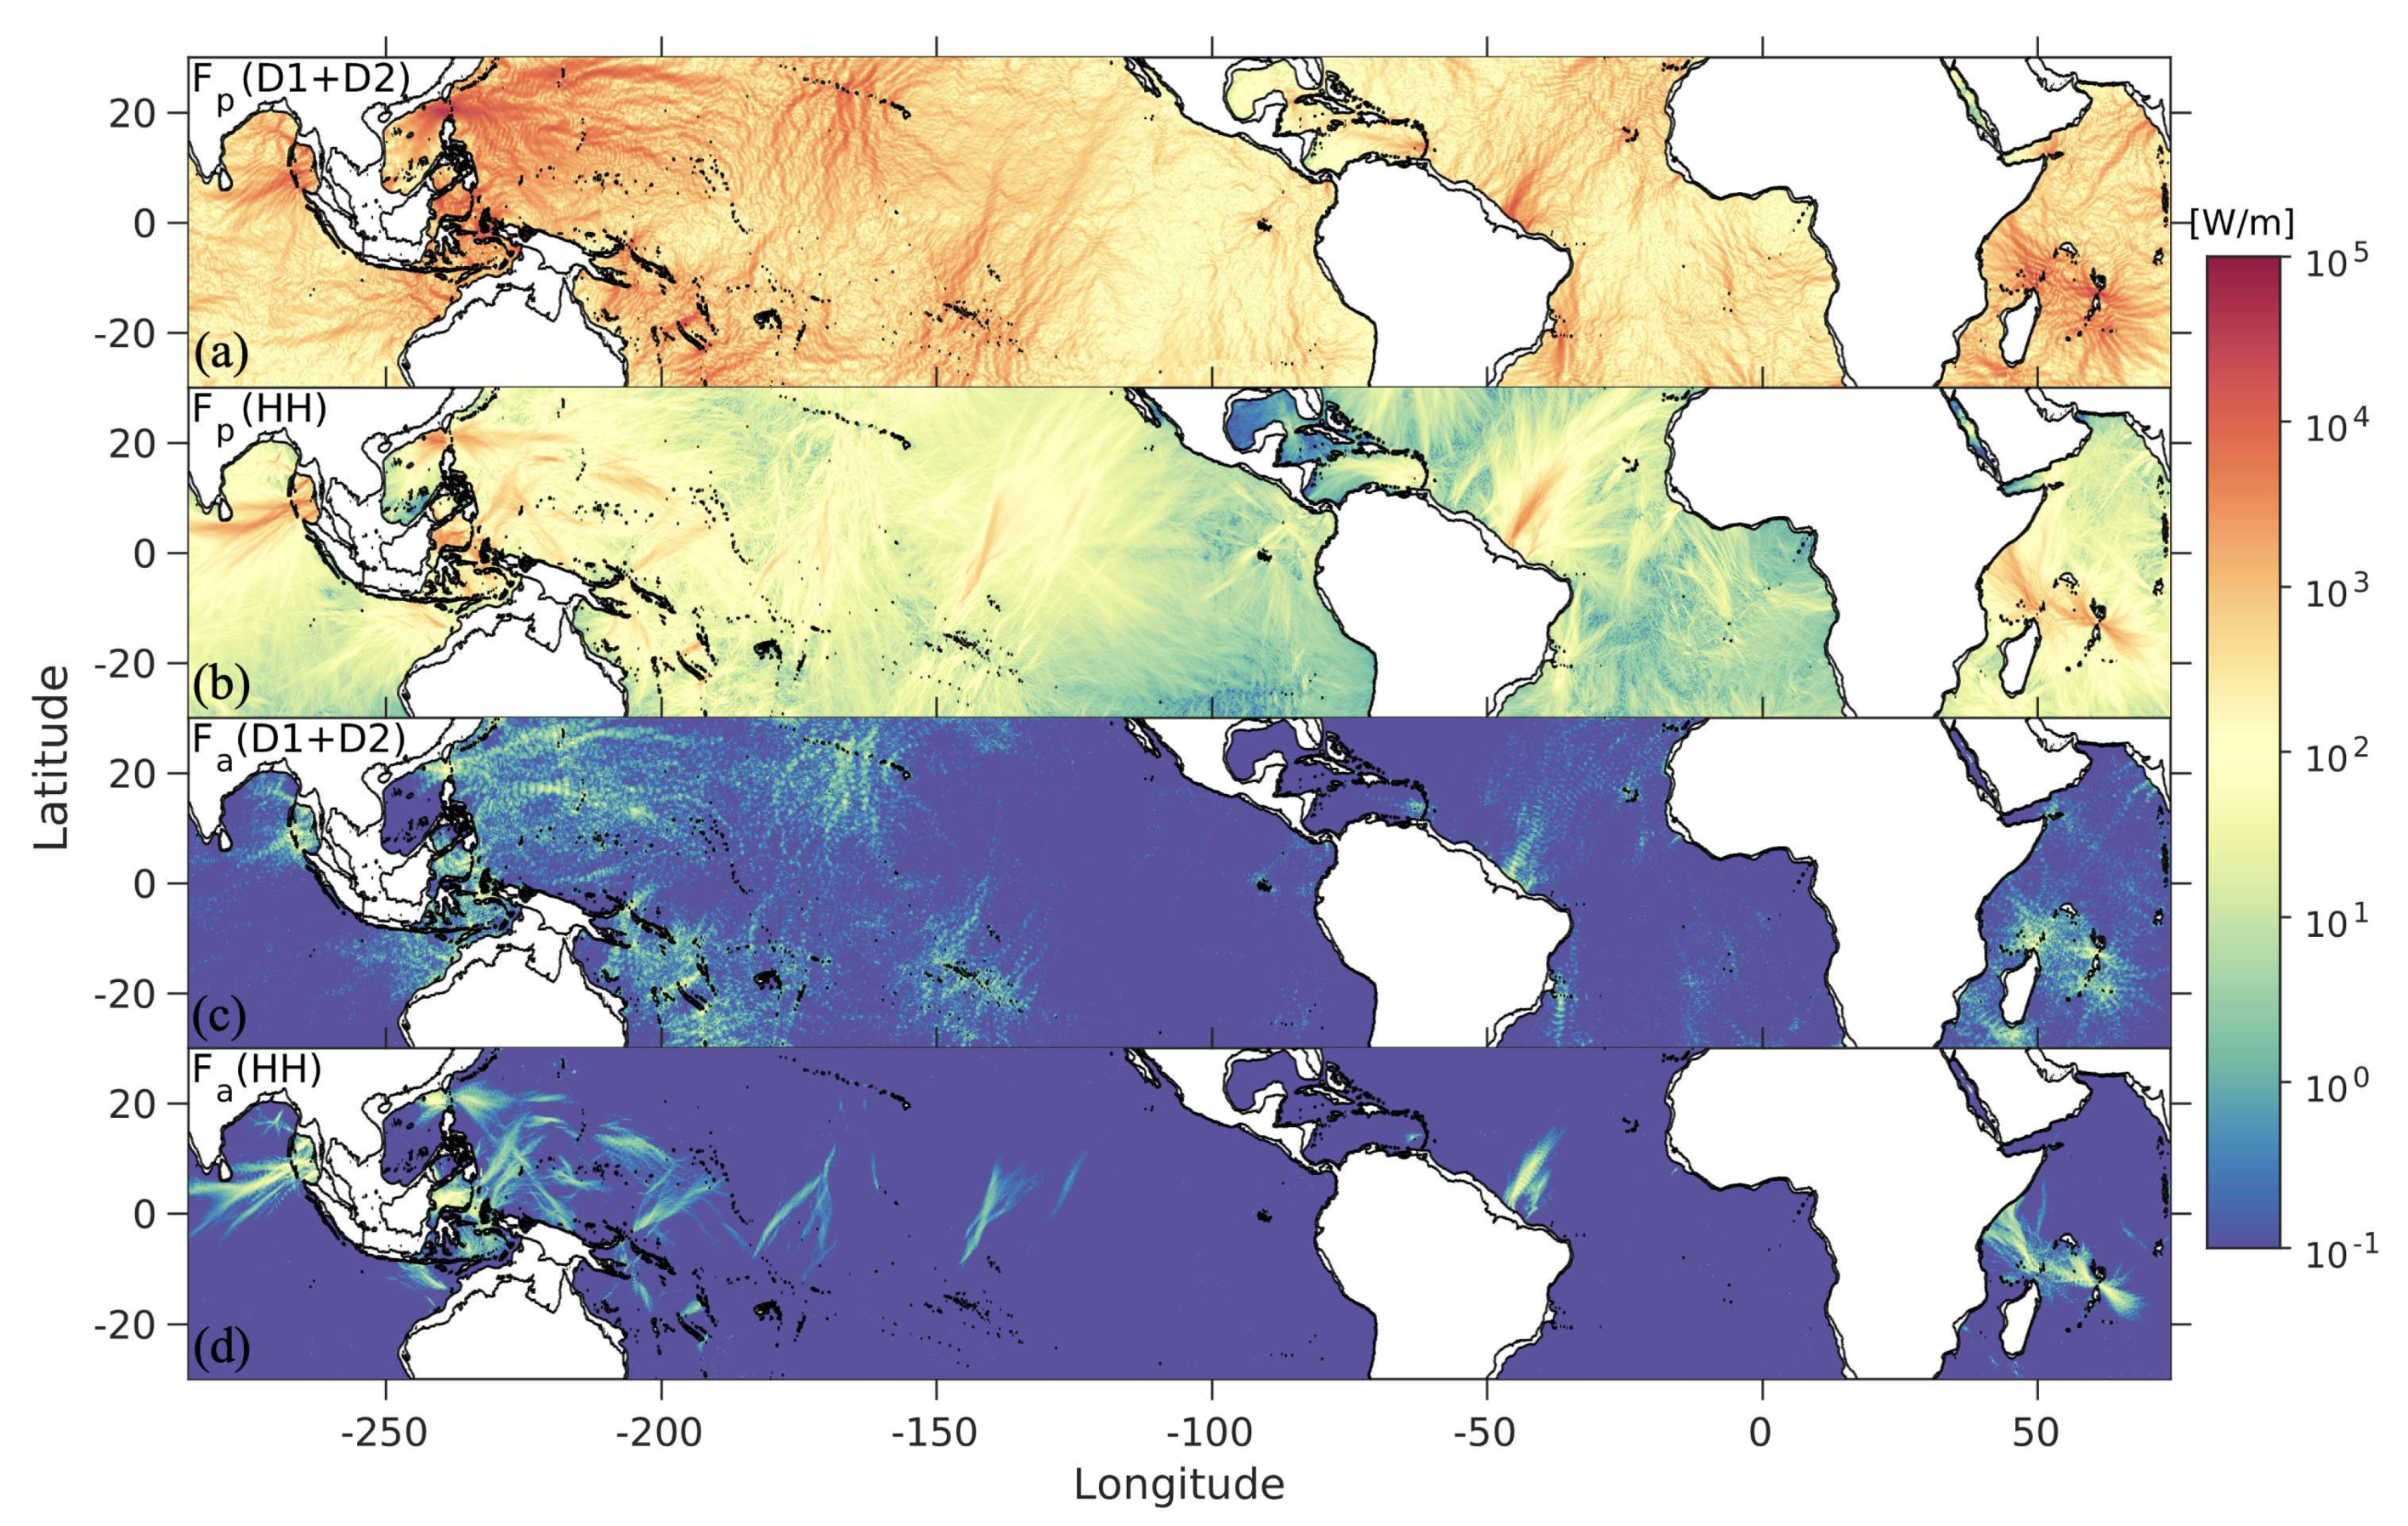
The magnitudes of the depth-integrated and time-averaged horizontal tidal and HH pressure and advective fluxes are presented in Figure 3. The energy flux is dominated by pressure work and resembles the distribution of K E in both frequency bands (Figure 3a,b). Higher-harmonic fluxes in Figure 3b feature beams of O ( 1 ) kWm 1 appearing some distance away from the generation sites and remaining steady for several hundred kilometers. The tidal band advective flux in Figure 3c is O ( 10 ) Wm 1 , which is negligible compared to the tidal pressure flux. In contrast, the advective flux in the supertidal band in Figure 3d is larger and correlates well with the supertidal pressure flux and kinetic energy beams in the equatorial region. In these regions, internal tides have transferred a significant portion of their energy to waves at higher wavenumbers and frequencies, which contribute more to the nonlinear advective fluxes.
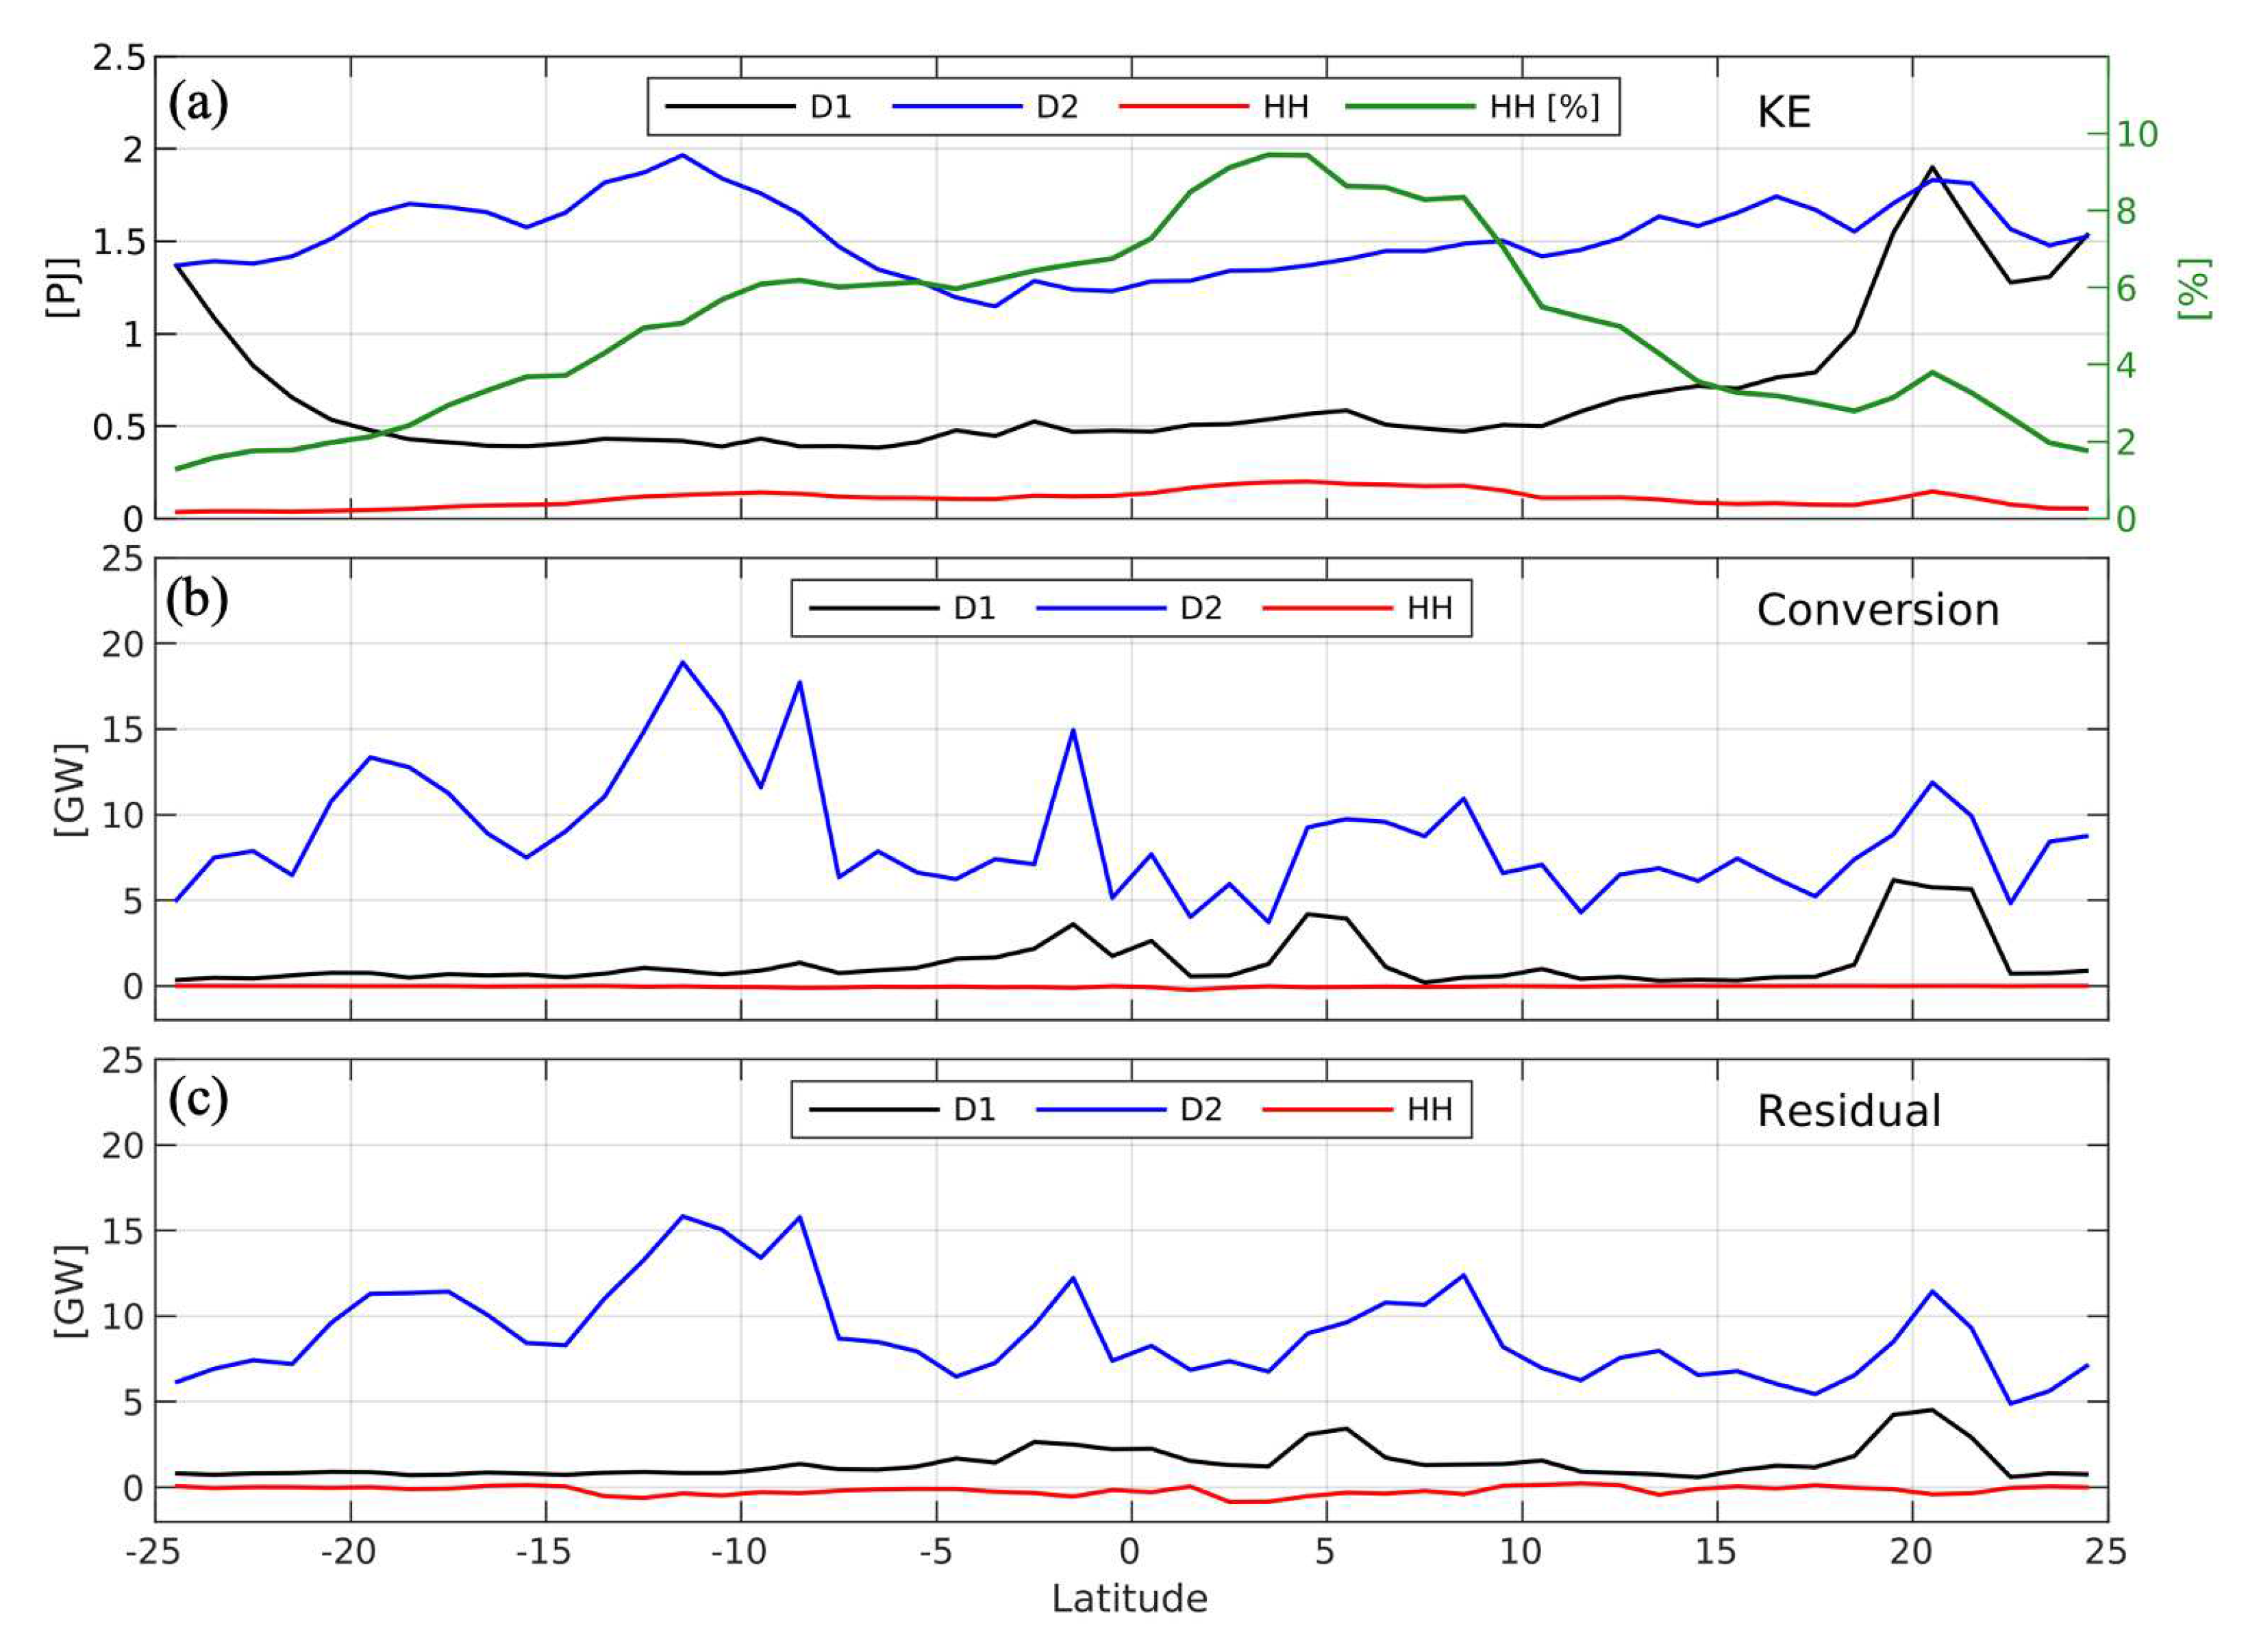
To better understand the latitudinal dependence, we zonally integrate various energy terms for 1 bins from 25 S to 25 N (Figure 4). On average, supertidal K E accounts for 5% of the total internal tide energy at low-latitudes. It gradually increases from the mid to low latitudes reaching the largest value of about 10% at 4 N (Figure 4a), likely due to contributions from the Bay of Bengal and the Amazon shelf (Figure 2d). The peak in diurnal K E near 20 N is attributed to the internal tide generation in Luzon Strait (rectangle 2 in Figure 2d). Diurnal K E increases poleward towards the diurnal turning latitudes due to adulteration by near-inertial waves. Globally integrating between these latitudes, we estimate that K E t o t = 113.23 PJ, where K E D 1 = 31.67 PJ, K E D 2 = 76.14 PJ and K E H H = 5.42 PJ. Figure 4b shows that most of the energy converted from the surface to the baroclinic tide is input at semidiurnal frequencies (440 GW) as opposed to diurnal frequencies (60 GW), with a negligible amount converted to supertidal frequencies. The residuals of the tidal and supertidal energy budgets (eq. 6) in Figure 4c are positive for the tidal band, mostly due to dissipation, and negative for the supertidal band, suggesting a source term is missing. To better understand how internal tide energy at the primary frequencies is transferred to supertidal frequencies, we analyze the energetics along the main internal tide beam generated at the Amazon Shelf in the next section.

3.2. Nonlinear internal tides at the Amazon shelf

The Amazon Shelf region (rectangle 6 in Figure 2d) features an energetic internal tide beam, in which up to half of the internal tide energy is in the supertidal band. In this beam, nonlinear internal solitary waves appear about 500 km from the coastline, coinciding with the rapid decay of the primary tide energy fluxes (Magalhaes et al. 2016). The direction of the main wave beam is modulated by the boundary currents along the shelf, namely the North Brazil Current (NBC) and North Equatorial Counter Current (NECC) (Magalhaes et al. 2016; Tchilibou et al. 2022). In this section we analyze the energy budget terms along the main internal tide beam generated at the Amazon Shelf to indicate potential sources of supertidal energy.
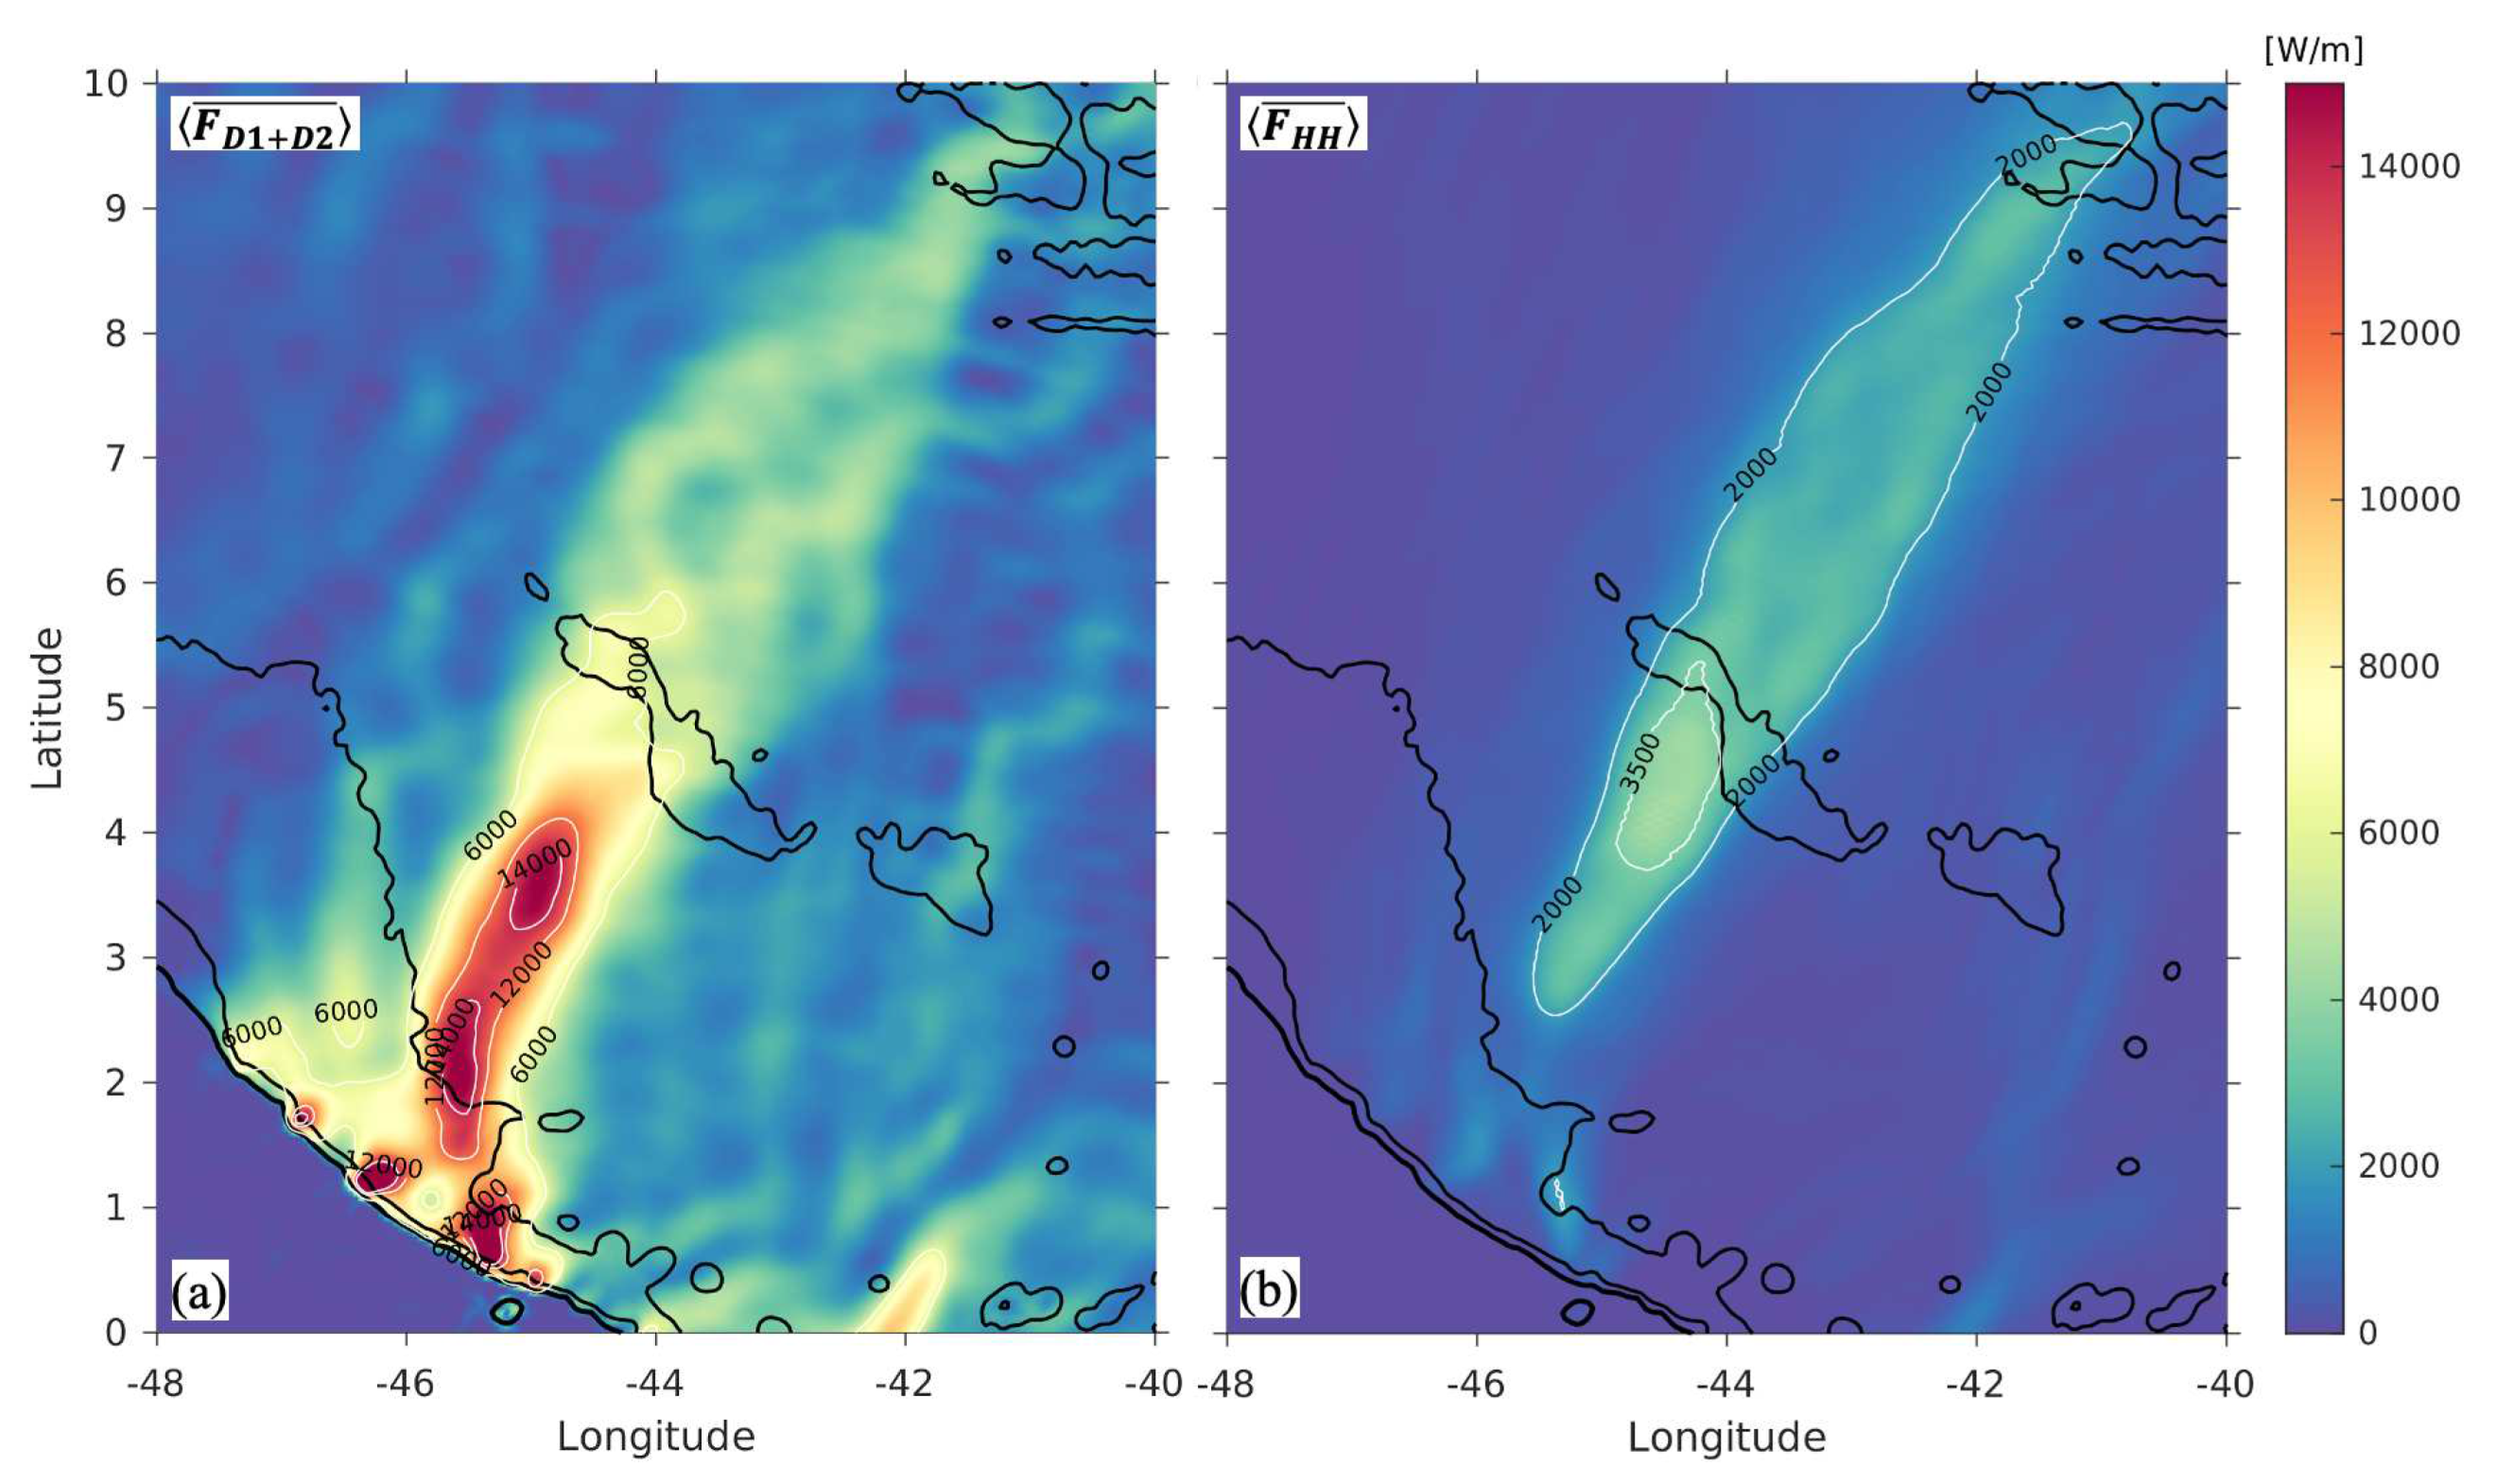
The main internal tide beam is generated in at least 3 hot spots along the steep Amazon Shelf (Figure 5a), in agreement with previous studies (Magalhaes et al. 2016; Tchilibou et al. 2022). Energy flux at tidal frequencies is high close to the generation sites and along the propagation path of the internal tide and reaches values of over 14 kWm 1 . The supertidal energy flux in Figure 5b is much lower at the generation site but increases significantly between 200 and 500 km from the shelf break and then remains relatively steady at ∼2 kWm 1 until the Mid-Atlantic Ridge (top right contours in Figure 5b).
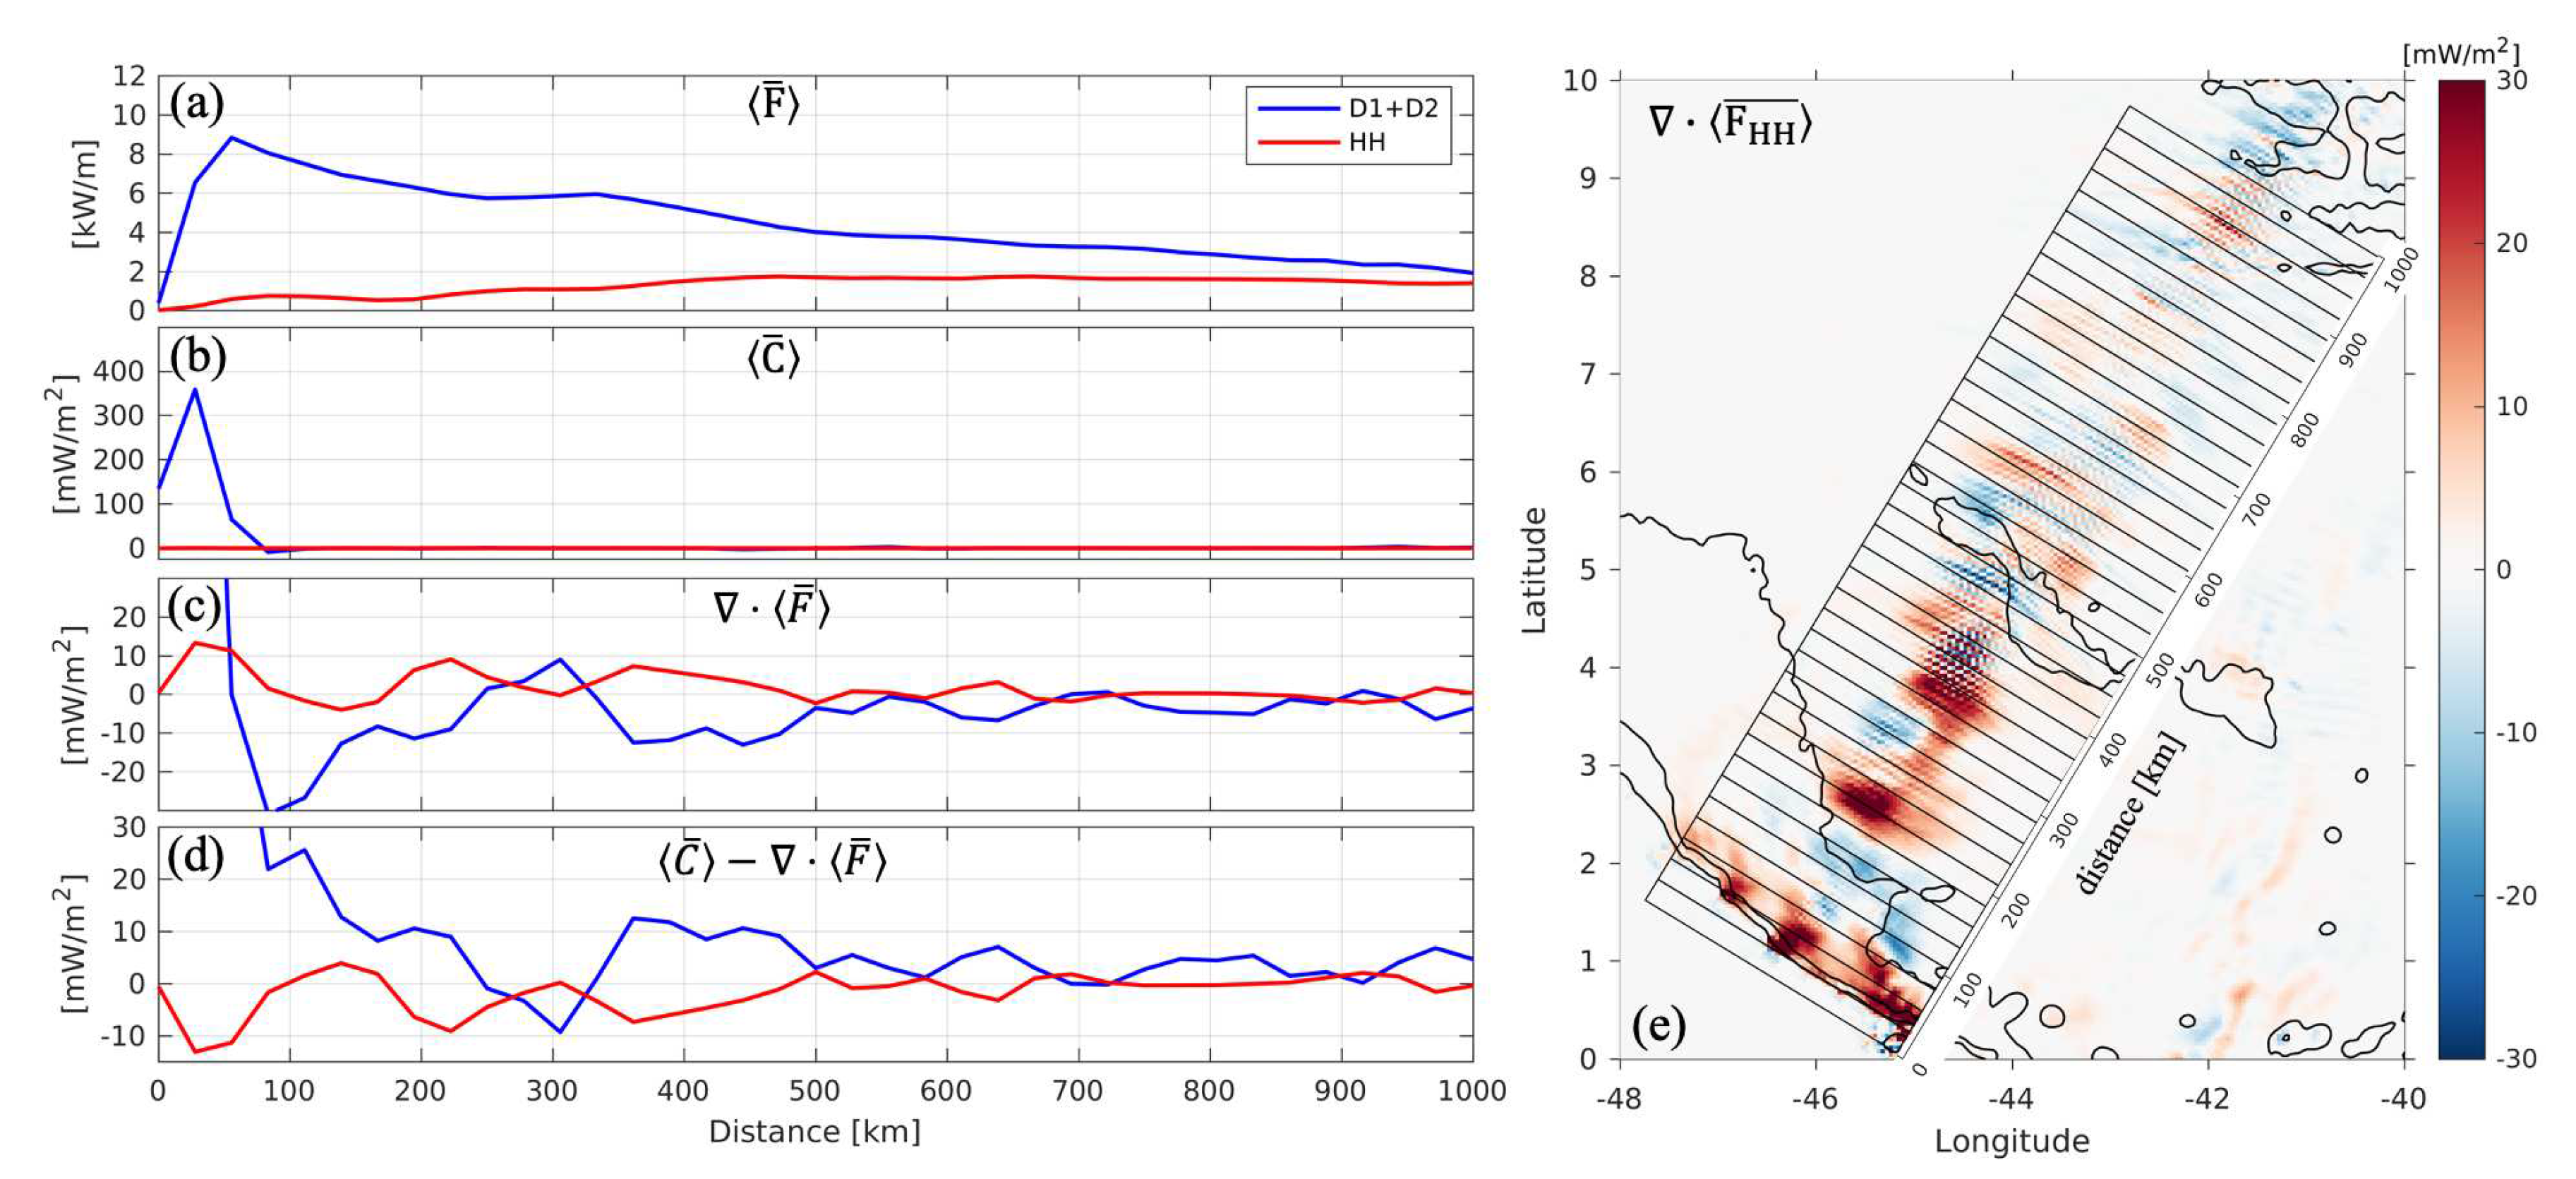
To understand the spatial distribution of energy sources and sinks, we analyze the baroclinic energy budget (eq. 6) averaged over rectangular bins of 0.5o by 1.5o (55.5 km by 166.5 km) along the propagation direction of the main internal tide. The bins are shown in Figure 6e superimposed over supertidal flux divergence, where sources (sinks) are represented by the red (blue) colors. The bin-averaged energy flux in Figure 6a is mainly in the tidal frequency band. It reaches a maximum value of ∼9 kWm 1 at the shelf slope, which can be attributed to the barotropic to baroclinic energy conversion in the tidal band in Figure 6b. On the contrary, the supertidal energy flux is initially low (0 Wm 1 ) and increases offshore until it peaks at ∼2 kWm 1 about 500 km from the source. This increase does not coincide with the supertidal conversion, which is negligible in Figure 6b.
The decay of the tidal energy flux and the growth of supertidal flux is more easily distinguished with the bin-averaged horizontal flux divergence in Figure 6c. Along the propagation path, the energy flux divergence at the primary and higher-harmonic frequencies appears to be anti-correlated, suggesting that energy is transferred from tidal to supertidal frequencies (and vice versa) at intervals spaced roughly 150 km apart, e.g., near 220 and 370 km (near 130 and 300 km).
The residual R ¯ (eq. 1) of the energy balance for the tidal band is generally positive in Figure 6d, in agreement with the overall decay of the flux in Figure 6a. The tidal residual is negative near 300 km, suggesting that terms may be missing, e.g., due to wave-mean flow advection (Kelly et al. 2016) or energy exchanges between different frequency bands (Kelly et al. 2016; Barkan et al. 2021). Although wave-mean flow interactions are not the focus of this study, they may be a source or sink of energy for internal tides in the presence of mesoscale currents, such as the NECC and NBC. As in Figure 4, the supertidal residual is mostly negative, implying that an important source term is not accounted for. The mostly negative supertidal residual term and the spatial correlation between the tidal and supertidal flux divergence and residual terms suggest a net energy flux from the tidal to the supertidal band. This energy exchange will be investigated in more detail in the discussion section.

3.3. Solitary-like waves in HYCOM

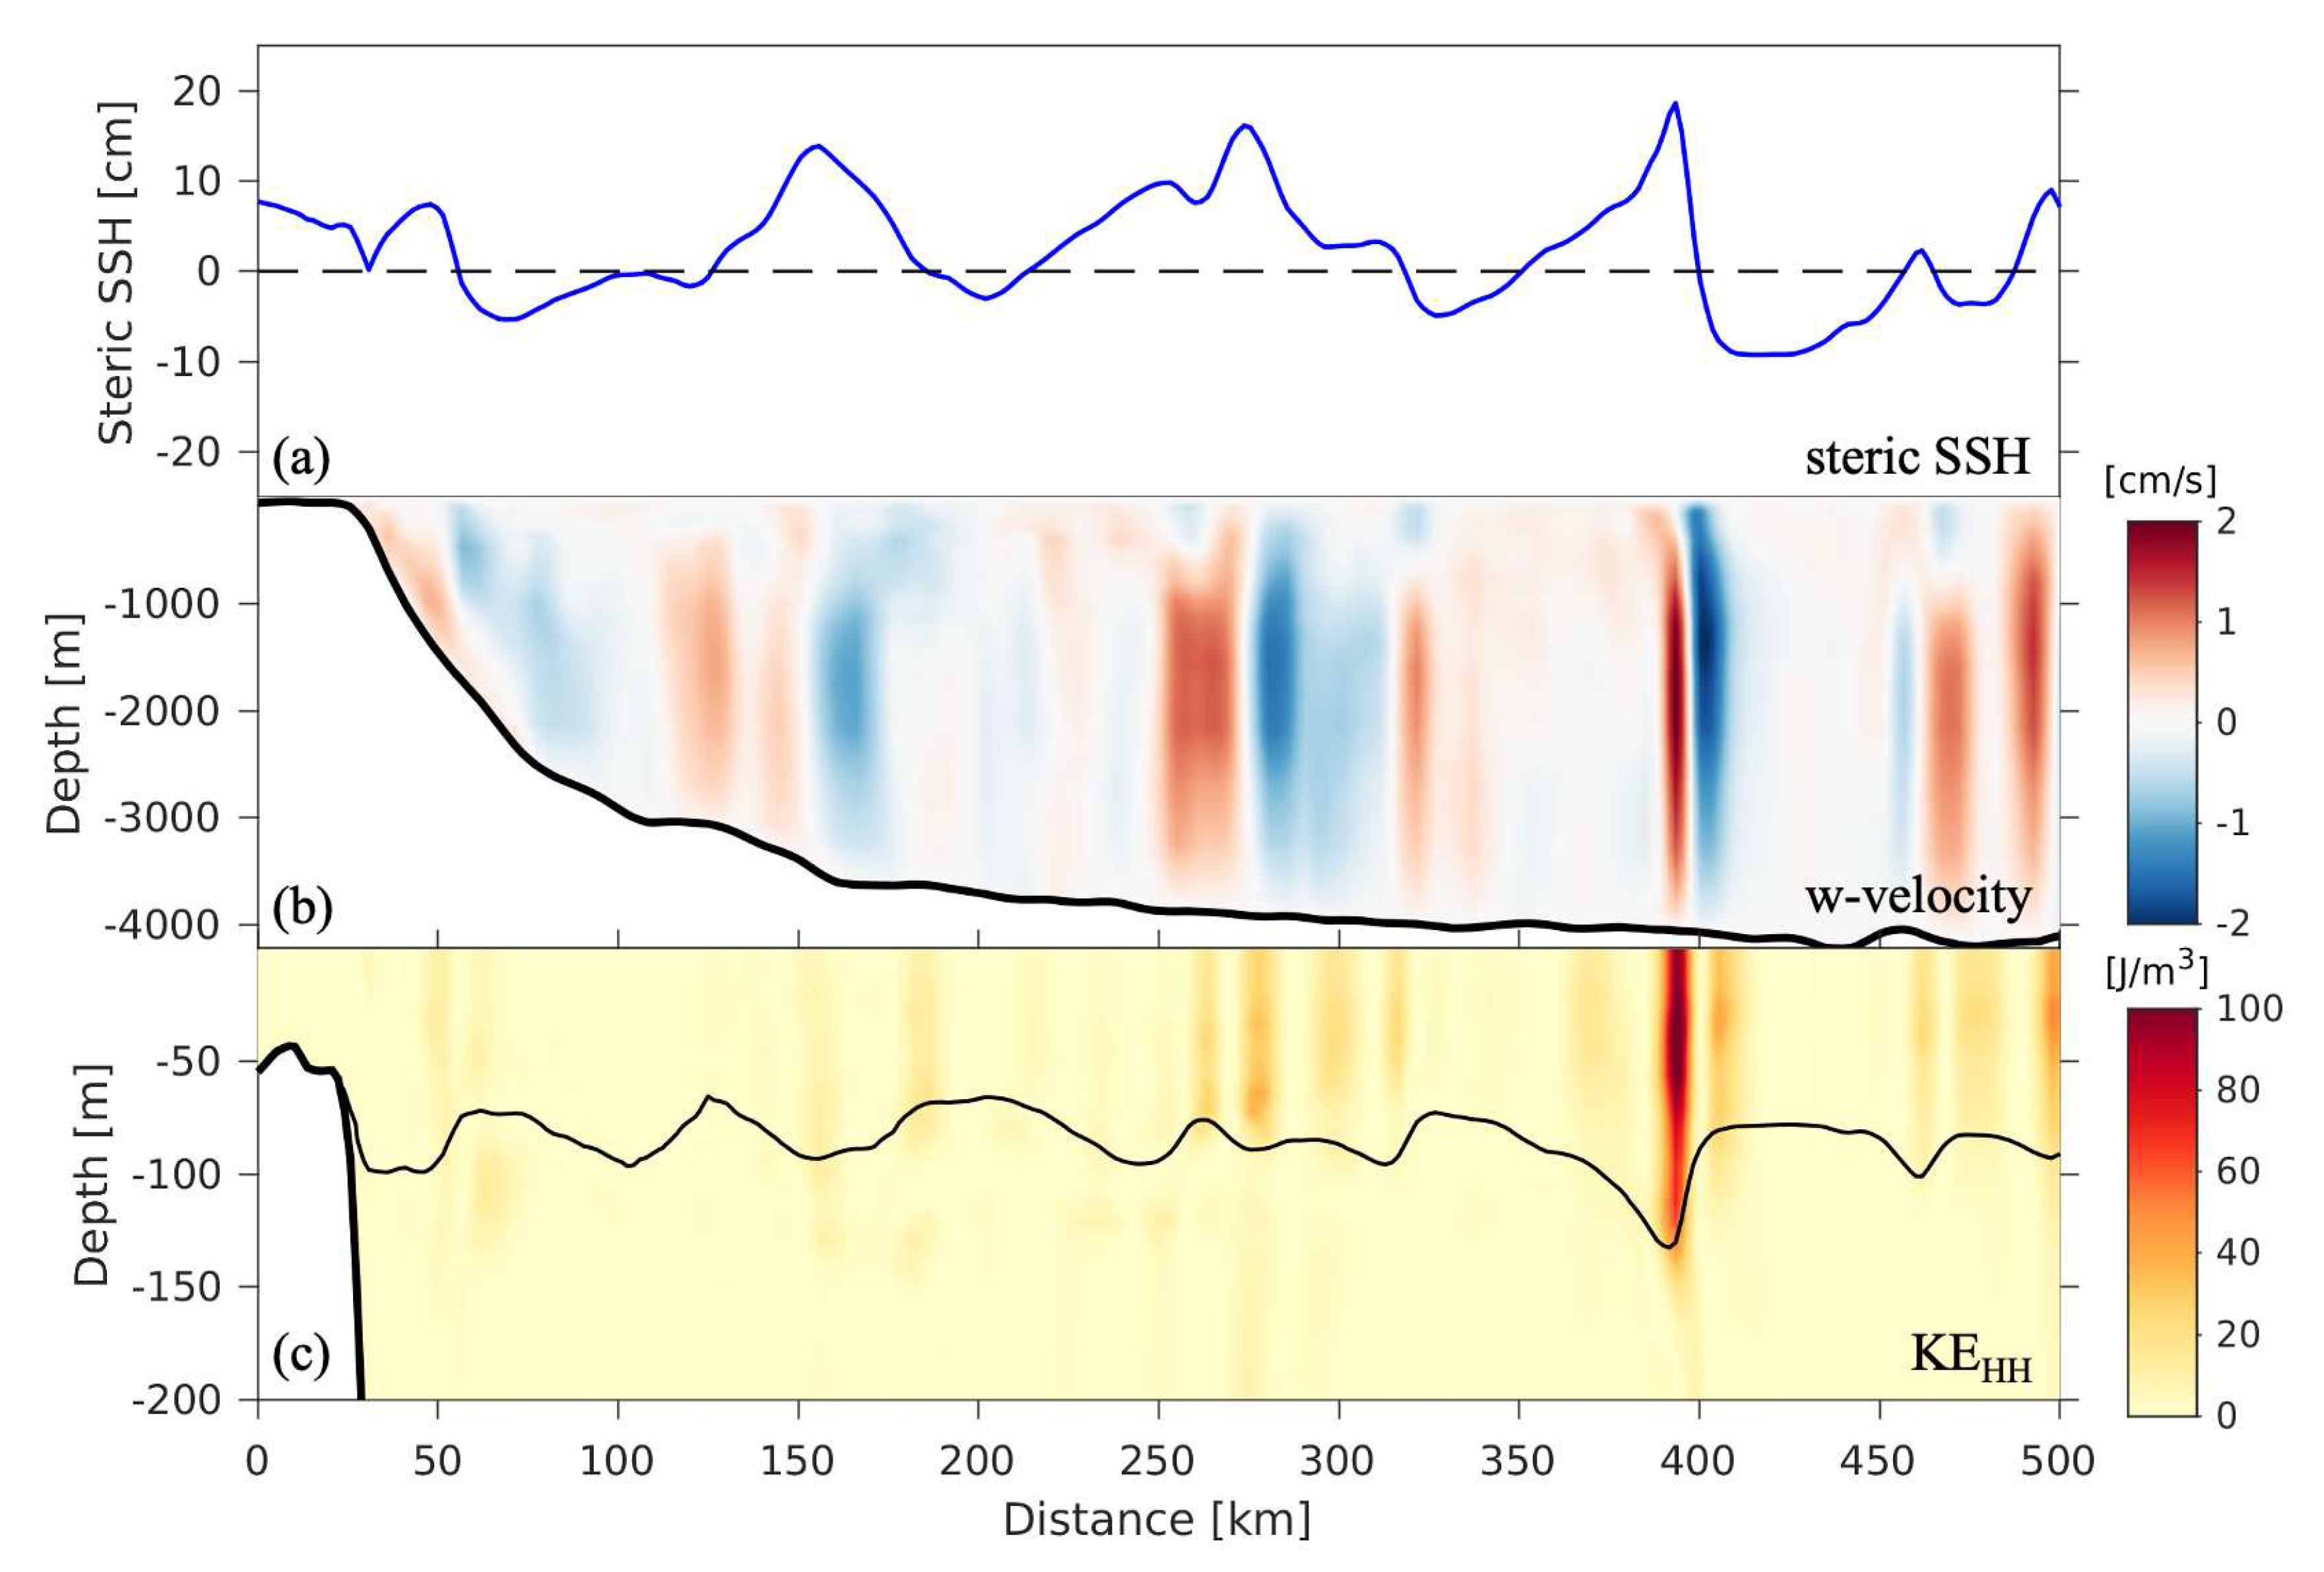
In HYCOM, the internal tide at the Amazon Shelf steepens into solitary-like waves near 400 km (Figure 7), coinciding with the second patch of positive supertidal flux divergence (Figure 6e). At this location, the steric sea surface height (SSSH) in Figure 7a and the thermocline displacement in Figure 7c feature the largest amplitudes and steepest slopes. Simultaneously, the vertical velocities at depth in Figure 7b and the supertidal kinetic energy at the surface in Figure 7b are enhanced. The separation between the peaks of SSSH is about 110 km, which is the mode 1 wavelength at this location, implying that it is the mode 1 wave that steepens.
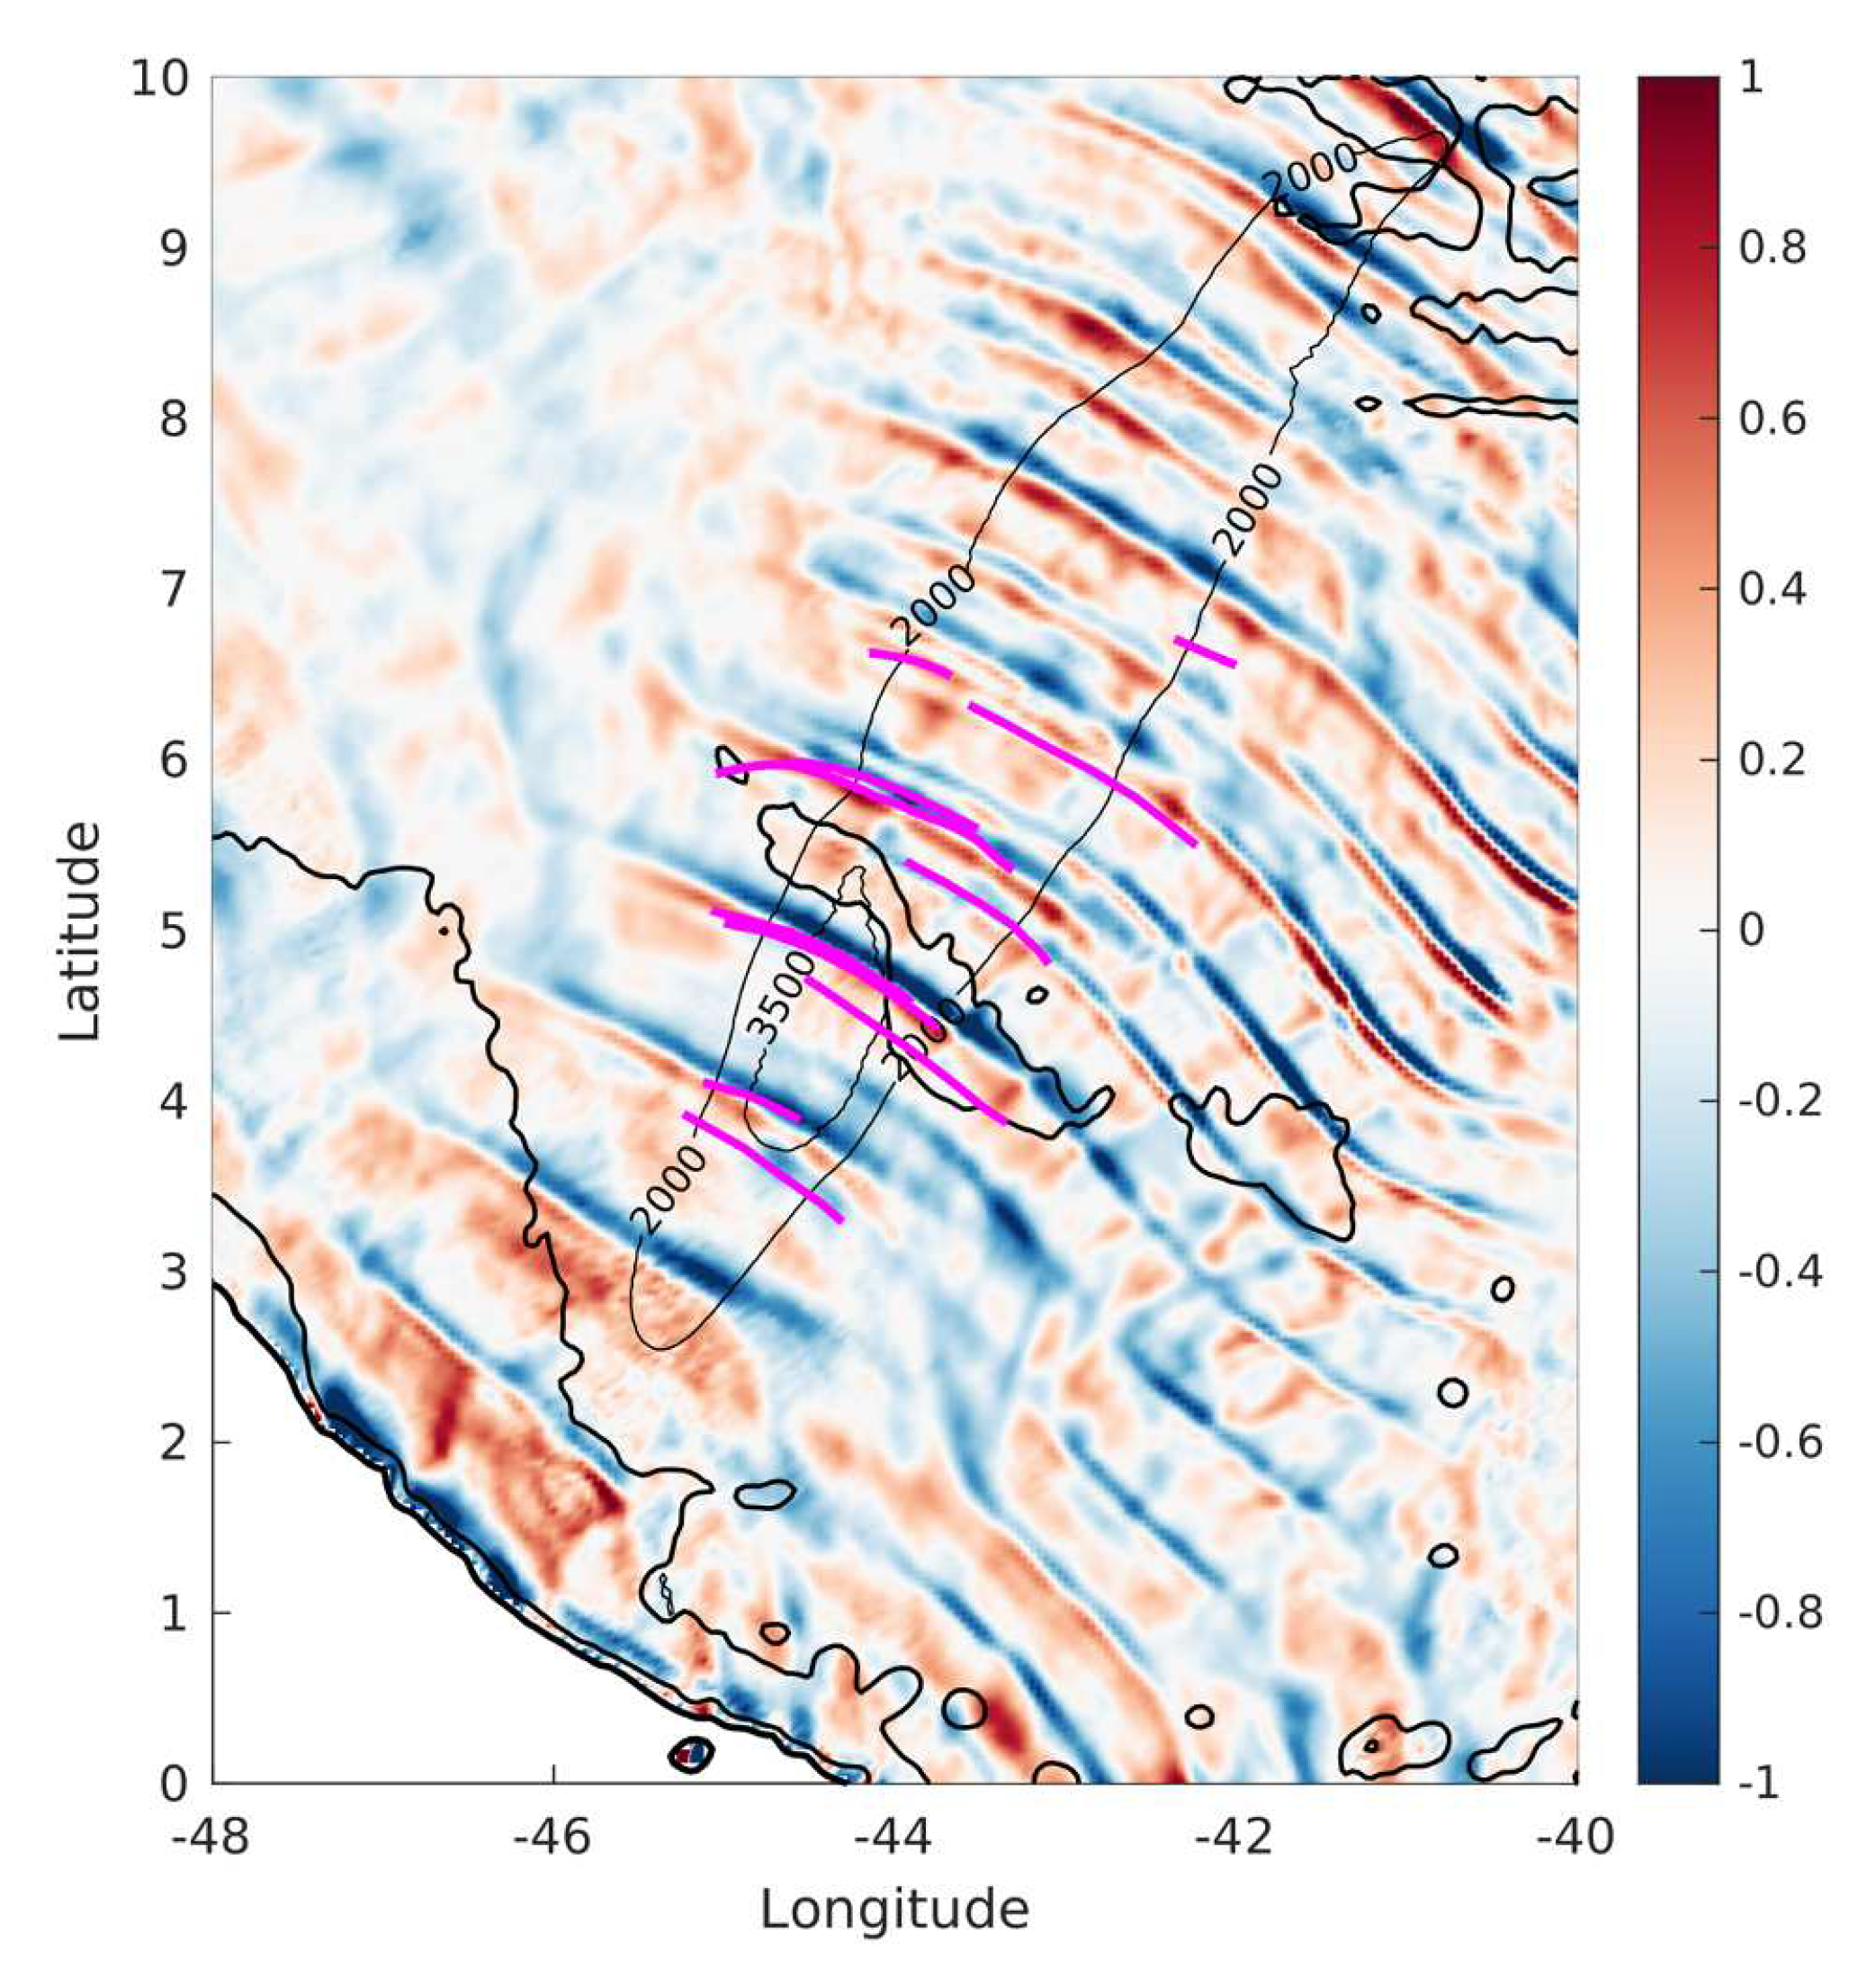
To validate the accuracy of the simulated solitary-like waves near the Amazon Shelf, we compare SSSH fields from HYCOM with crests extracted from SAR imagery (magenta lines) in Figure 8 during the same time-period (May-June). The internal wave crests in HYCOM steepen in regions where the solitary NLIW are observed. The satellite derived solitary waves emerge around 4 N and 44 . 5 W, roughly 400 km from the shelf break (see also Figure 7). These figures show that in HYCOM, large amplitude internal tides steepen into solitary-like waves as they propagate offshore in regions where supertidal energy is relatively large, in good agreement with satellite observations.

4. Discussion

In this section we further discuss the correlation between supertidal energy in the global HYCOM simulation and the observations of solitary waves in the global ocean, we estimate the nonlinear energy transfers to supertidal frequencies using a coarse-graining approach, and we attribute the spatio-temporal modulation of the nonlinear energy transfers to constructive interference between modes.

4.1. Solitary NLIW in global HYCOM

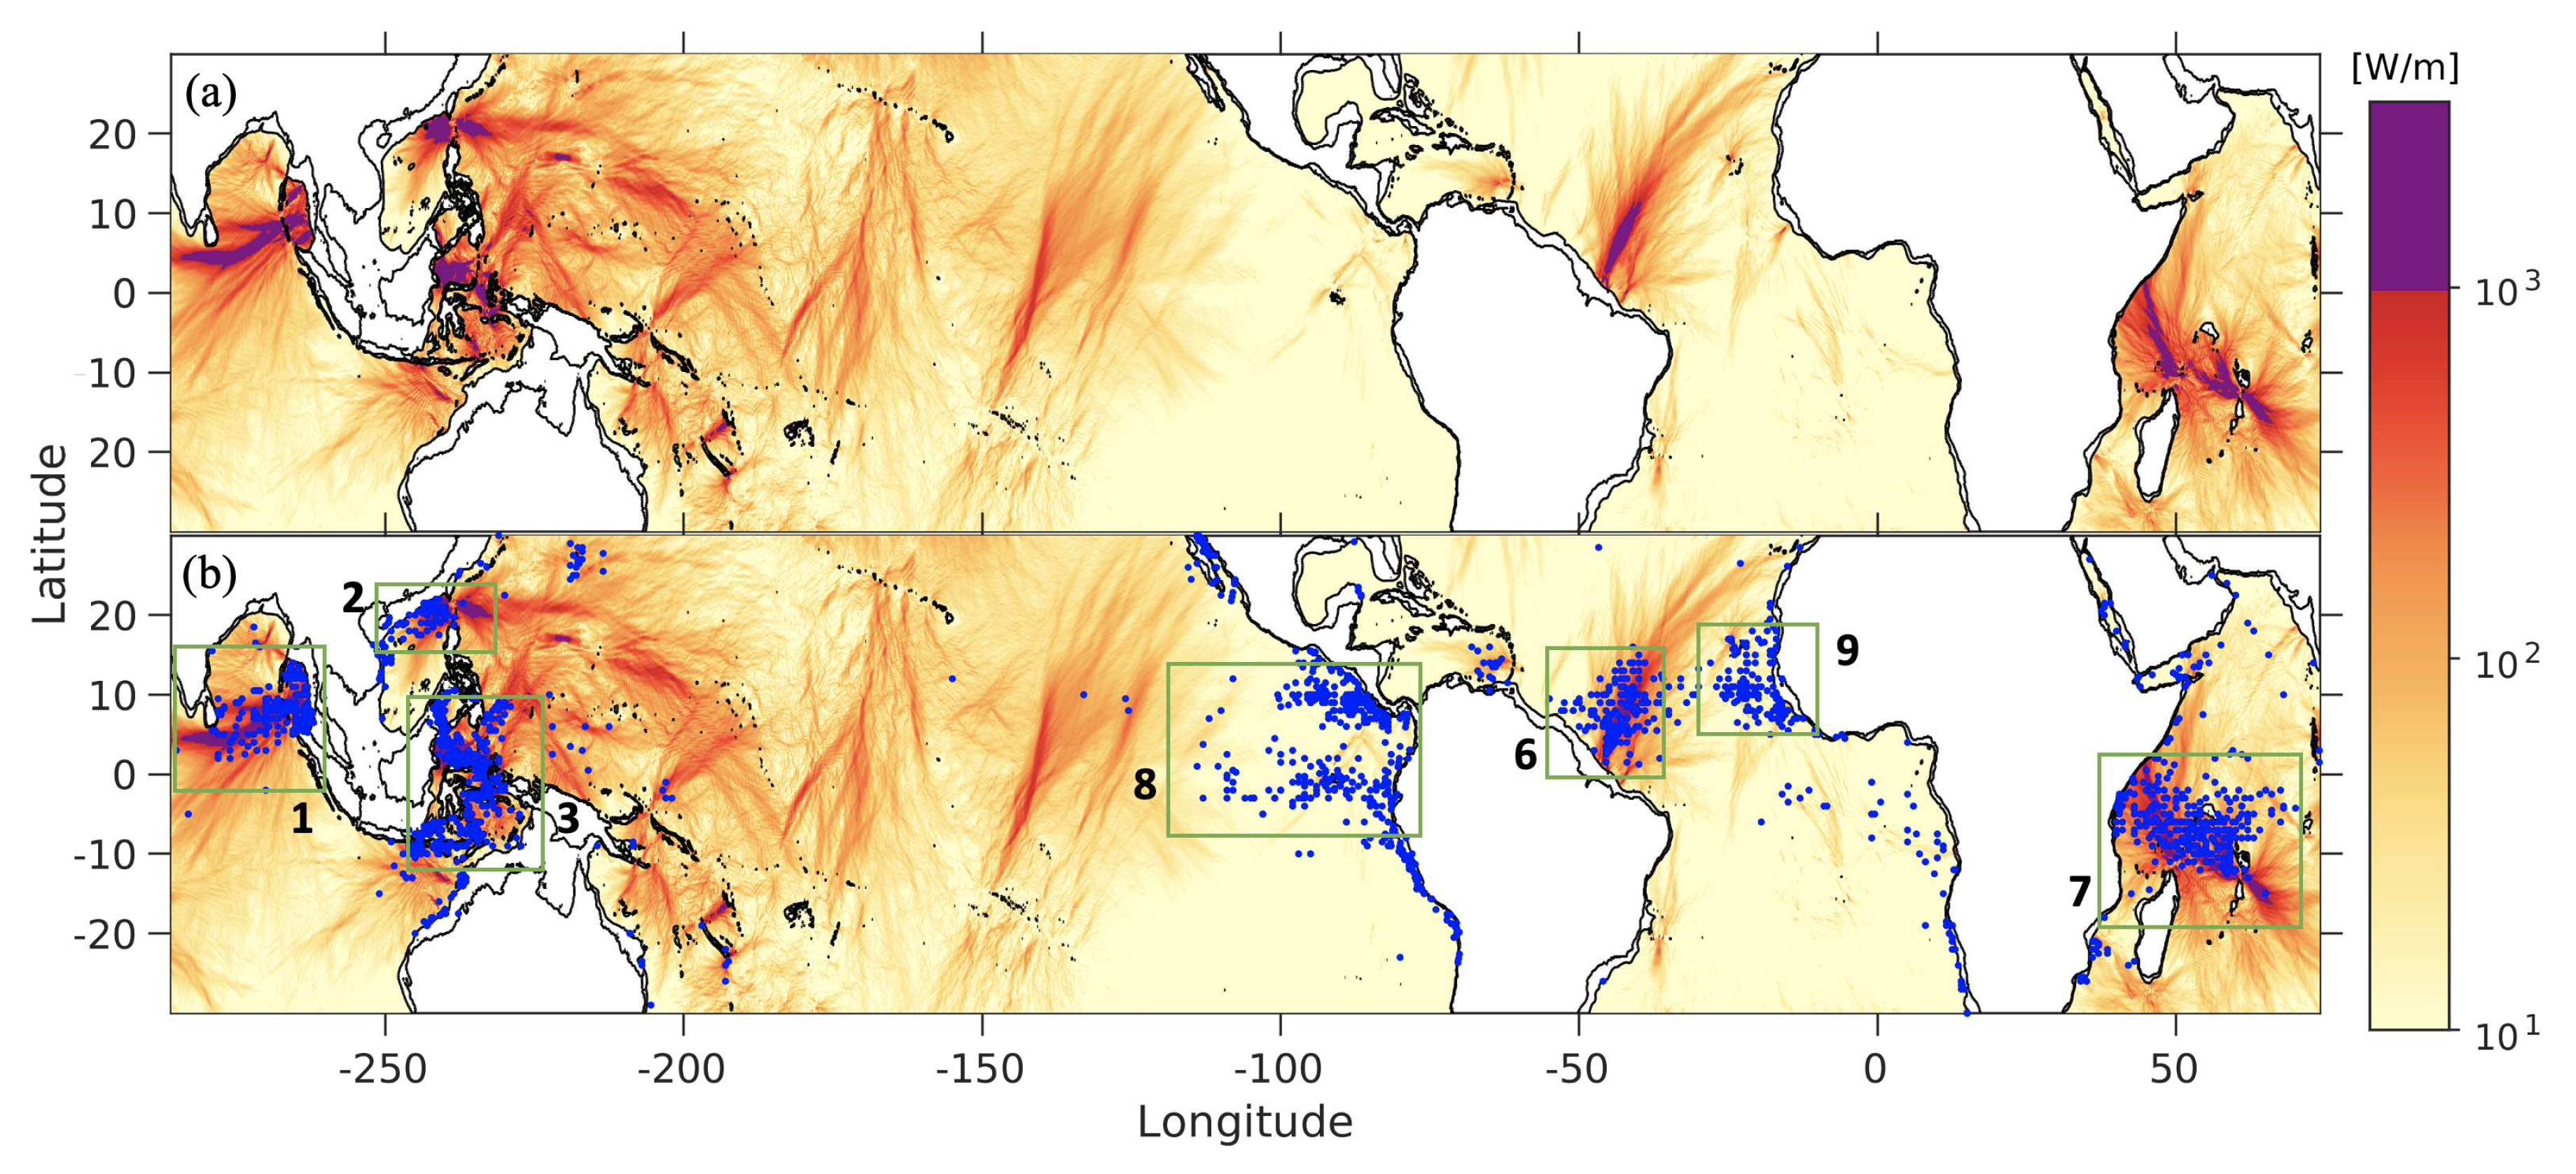
For the Amazon region we have shown that a strong supertidal energy flux of O ( 1 ) kWm 1 coincides with NLIW that are both simulated in HYCOM and observed in SAR images. To confirm this correlation globally, we compare the supertidal energy flux with the locations of NLIW observed by the 250 m Moderate-Resolution Imaging Spectrometer (MODIS) satellite over a four-year period (Jackson 2007) in Figure 9. Most regions in the abyssal ocean with supertidal energy fluxes > 1 kWm-1 (purple shading in Figure 9), such as the Bay of Bengal, Andaman Sea, South China Sea, Indonesian Archipelago, Amazon Shelf, and Mascarene Ridge, agree well with the locations of the observed solitary waves. However, solitary waves are also detected in regions with relatively low supertidal energy flux, such as over large areas in the eastern Atlantic and Pacific Oceans (rectangles 8 and 9 in Figure 9b) and on the continental shelves. A recent study (da Silva et al., in review) demonstrates that the solitary waves in the eastern Pacific are caused by non-tidal sources, possibly explaining the discrepancies in the eastern Pacific and Atlantic Oceans. The discrepancy between HYCOM and MODIS in rectangles 8 and 9 in Figure 9b may also be explained by weaker surface tides and/or unresolved bathymetric features in the HYCOM simulation, which may cause weaker primary and higher-harmonic internal wave flux beams. NLIW on shelves generally feature smaller wavelengths and energy fluxes ( < 1 kWm-1) than in the open ocean. Hence, these waves are not well resolved in our HYCOM simulations, as opposed to the satellite images, which horizontal resolution is about eight times finer.

4.2. Nonlinear energy cross-scale transfer

The negative residuals of supertidal energy at the Amazon Shelf in Figure 4c and Figure 6d-e, point to a missing source term in the higher-harmonic energy budget. Therefore, we diagnose the nonlinear energy wave transfers as a function of time and space in HYCOM with a coarse-graining approach (Eyink and Aluie 2009). The coarse-graining method has been used in physical oceanography to map the energy cascade in the North Atlantic (Aluie et al. 2018) and to quantify the energy transfer between mesoscale eddies and internal waves (Barkan et al. 2021). To our knowledge, the coarse-graining method has not yet been used to study the energy pathways of internal tides in the global ocean. Our use of the coarse-graining method here is therefore novel.
Coarse-graining can be used to quantify energy transfers across an arbitrary length or time scale τ . The coarse-grained kinetic energy transfer (Wm-3) can be written in index notation as:
Π τ ( x , t ) = ρ 0 ( u i u j ˜ u i ˜ u j ˜ ) u i ˜ x j
where i = 1 , 2 , 3 and j = 1 , 2 are indices indicating directions ( x , y , z ) and ( · ) ˜ denotes the low-pass filter of quantity ( · ) with cutoff period τ . We use τ = 9 hr (2.67 cpd) as our cutoff period (frequency), such that Π τ represents the energy transfer rate between (sub)tidal and supertidal frequencies. However, we conclude from our results that the majority of this energy transfer likely comes from the semidiurnal internal tide.
In the absence of topographic conversion we now can approximate the HH energy balance as
Π τ ¯ = h · F H H ¯ + R ¯
where the residual R ¯ includes terms such as the dissipation and wave-mean flow interaction terms.
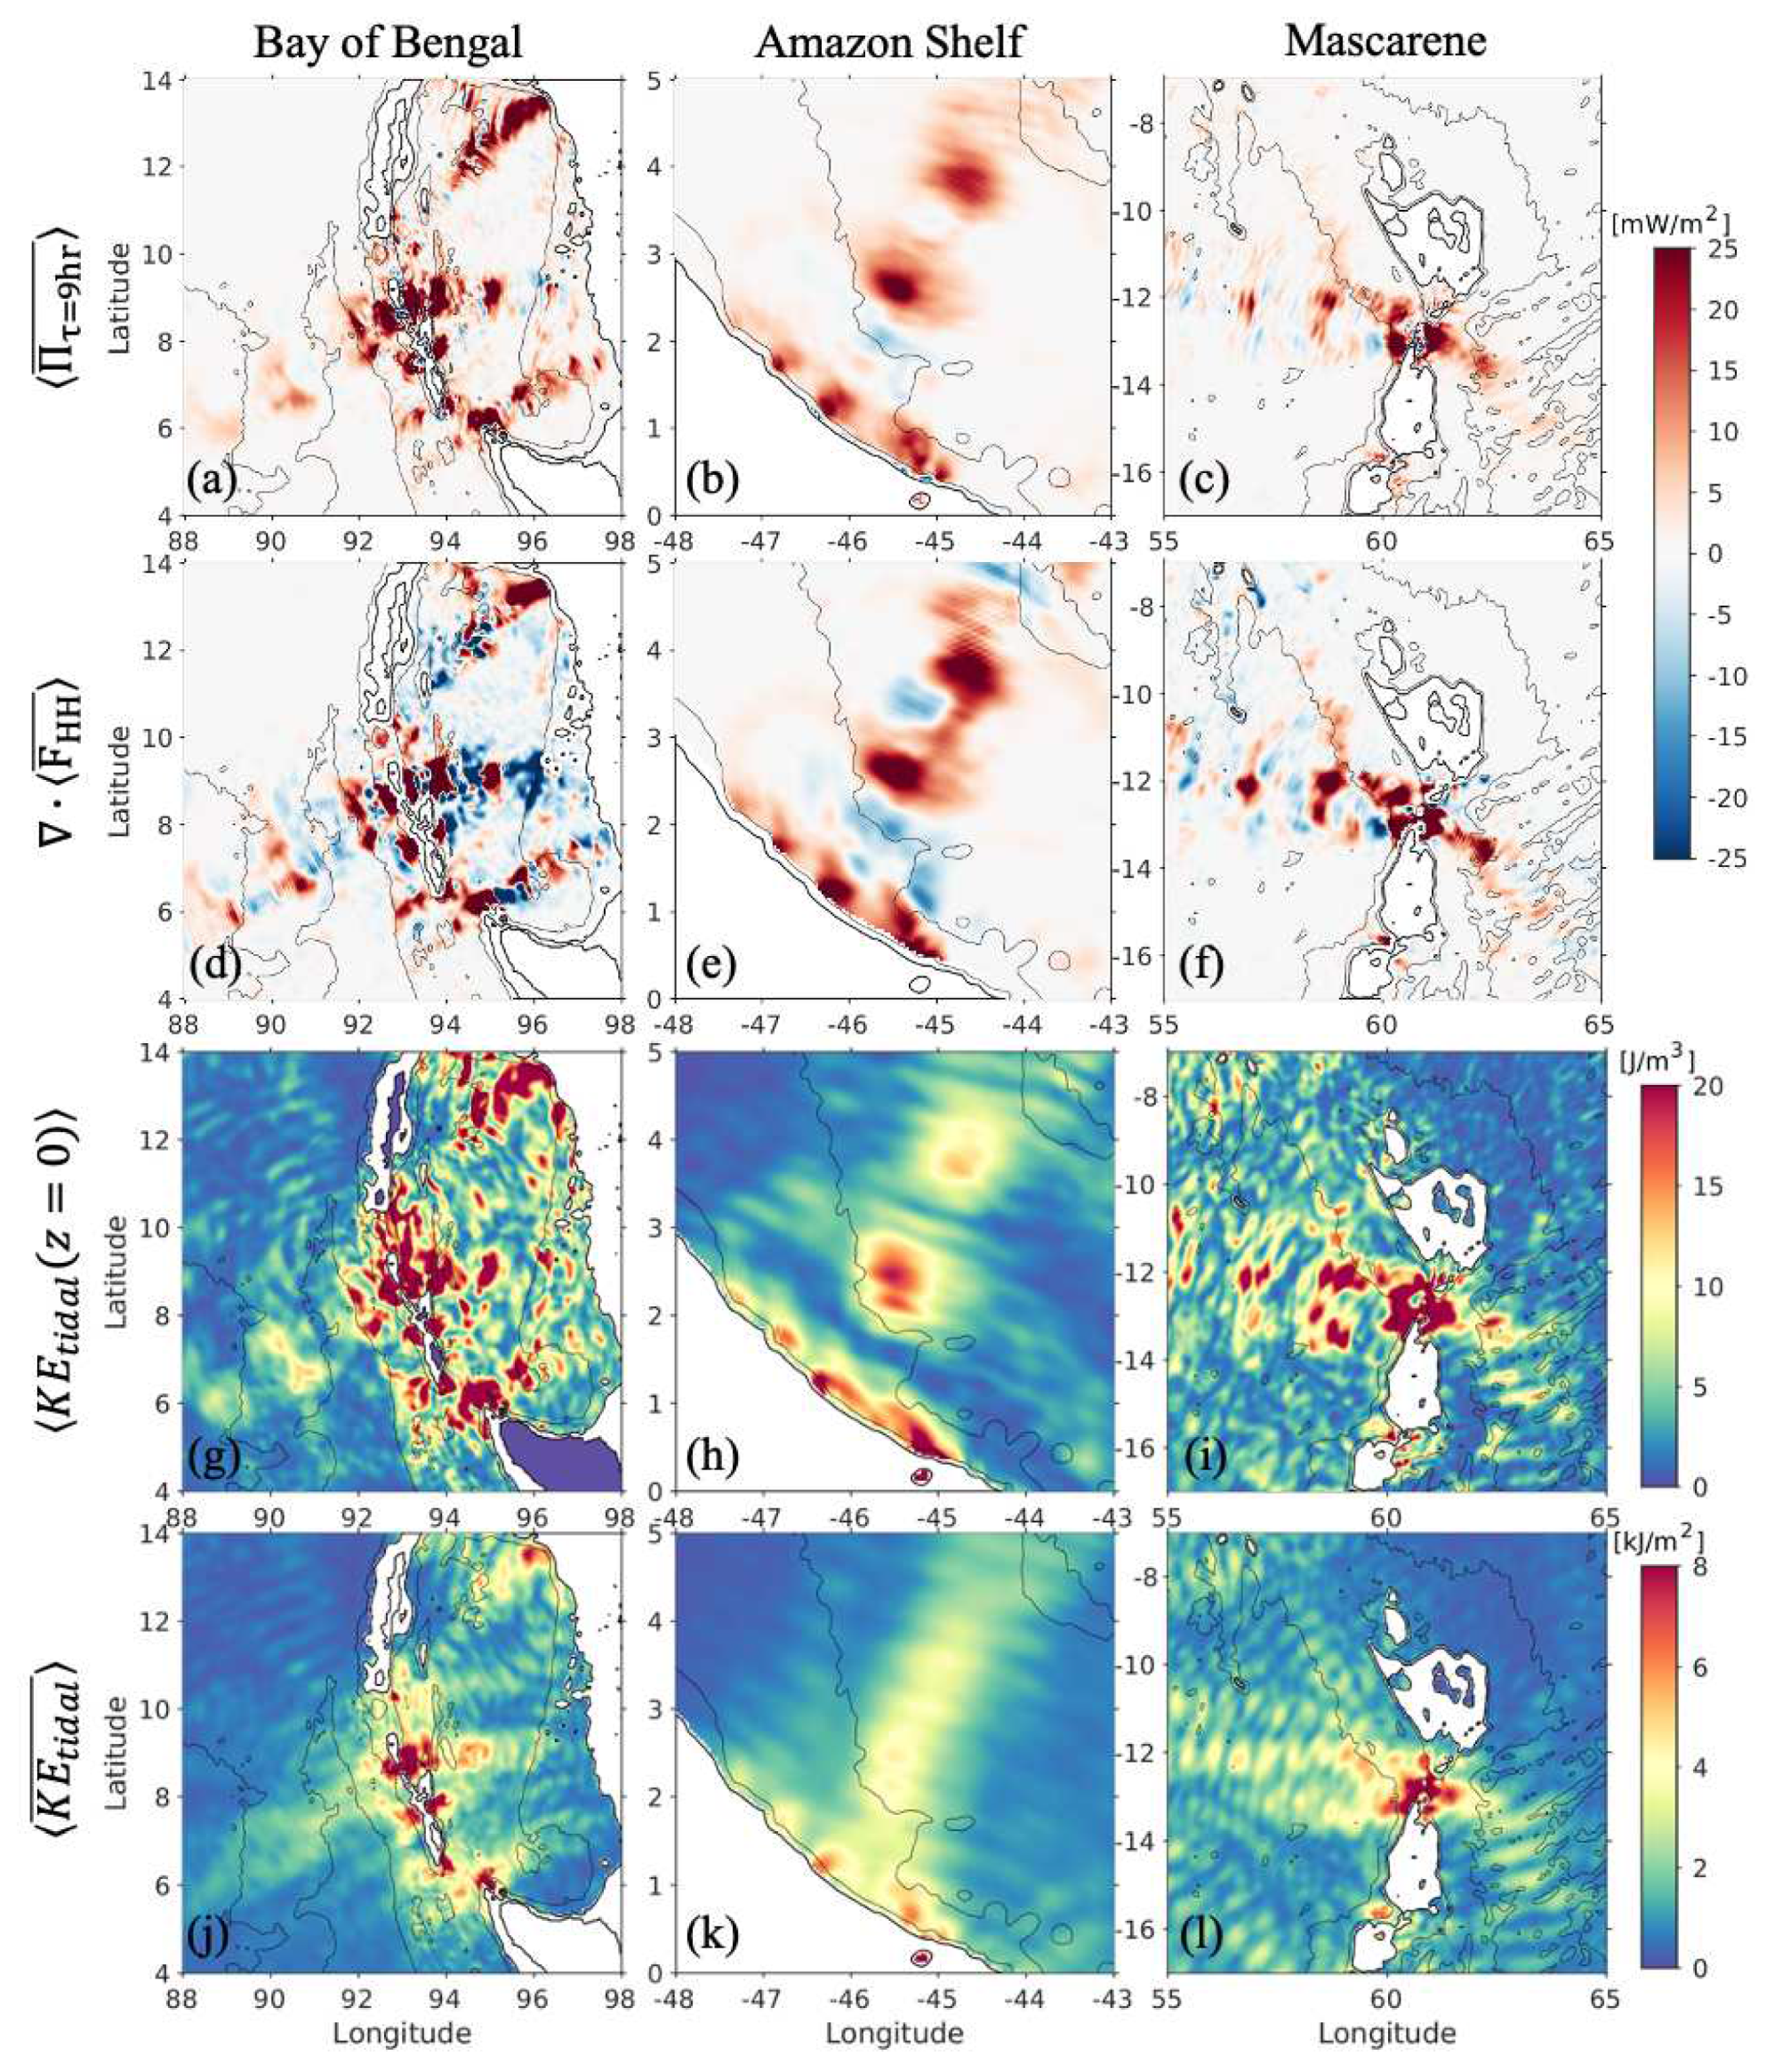
We compare the nonlinear cross-scale energy transfer to the divergence of the supertidal flux in three areas with strong HH energy fluxes in Figure 10a-f: the Bay of Bengal, the Amazon Shelf and Mascarene Ridge. To reduce noise due to aliasing of high frequency motions, we average the supertidal flux divergence over a nine grid point stencil in Figure 10d, which yields a smoother appearance than the flux divergence in Figure 6e. The positive regions of cross-scale energy transfer indicate a forward cascade from tidal to supertidal frequencies, and they coincide with estimates of supertidal energy flux divergence. The energy transfer at all 3 regions in Figure 10a-c is mostly forward and form a banding pattern along the propagation path of the internal tides at regularly spaced intervals separated by a distance longer than the mode 1 internal wavelength. Note that while in some areas internal tides transfer significant energy to higher-harmonics close to the generation sites (e.g., on the east side of the Mascarene Ridge), in other areas, such as the Amazon Shelf, most of their energy is transferred away from topography.
One goal of this paper is to estimate the energy scale transfer rate from tidal to supertidal frequencies. The time-mean and area integrated coarse-grained K E between ± 25 is 44.5 GW forward and 7.5 GW inverse transfer from (sub)tidal to higher-harmonic frequencies. This implies that about 7% of the energy converted from barotropic to baroclinic tides ( 500 GW) between ± 25 cascades to higher-harmonics in the deep ocean, assuming that most of these energy transfers come from the primary tides.

4.3. Spatial modulation of nonlinear energy transfer

In this section, we investigate the mechanisms that cause the regularly spaced banding patterns in the supertidal flux divergence and the nonlinear cross-scale energy transfers. A similar banding pattern is also visible in tidally band-passed surface kinetic energy (Figure 10g-i), while it is not present in the depth-integrated tidal K E (Figure 10j-l). Although we compute K E for the tidal (D1+D2) band in Figure 10g-l, the banding patterns of time-mean K E are mostly due to the semidiurnal tides (not shown), which are the most dominant at these internal tide hotspots (Figure 2a,b). In this banding pattern, the patches of large tidal surface K E also coincide with large nonlinear energy transfers. This is analogous to internal-wave dissipation scaling with energy density (e.g., Pollmann et al. 2017) because shear-driven turbulent internal wave dissipation is the end result of a forward energy cascade due to wave-wave interactions. The spatial patchiness of K E ( x , y , z ) is attributed to the horizontal and vertical shear in the tidal baroclinic velocities, which drive the nonlinear energy transfers in eq. (7). The difference in banding patterns between surface K E and depth-integrated K E suggests that the banding patterns are caused by constructive and destructive interference between semidiurnal mode 1 and mode 2 waves, which are generally the most energetic waves generated at tall ridges and shelves in 4-km HYCOM simulations see Figure 8f-g of (Buijsman et al. 2020).
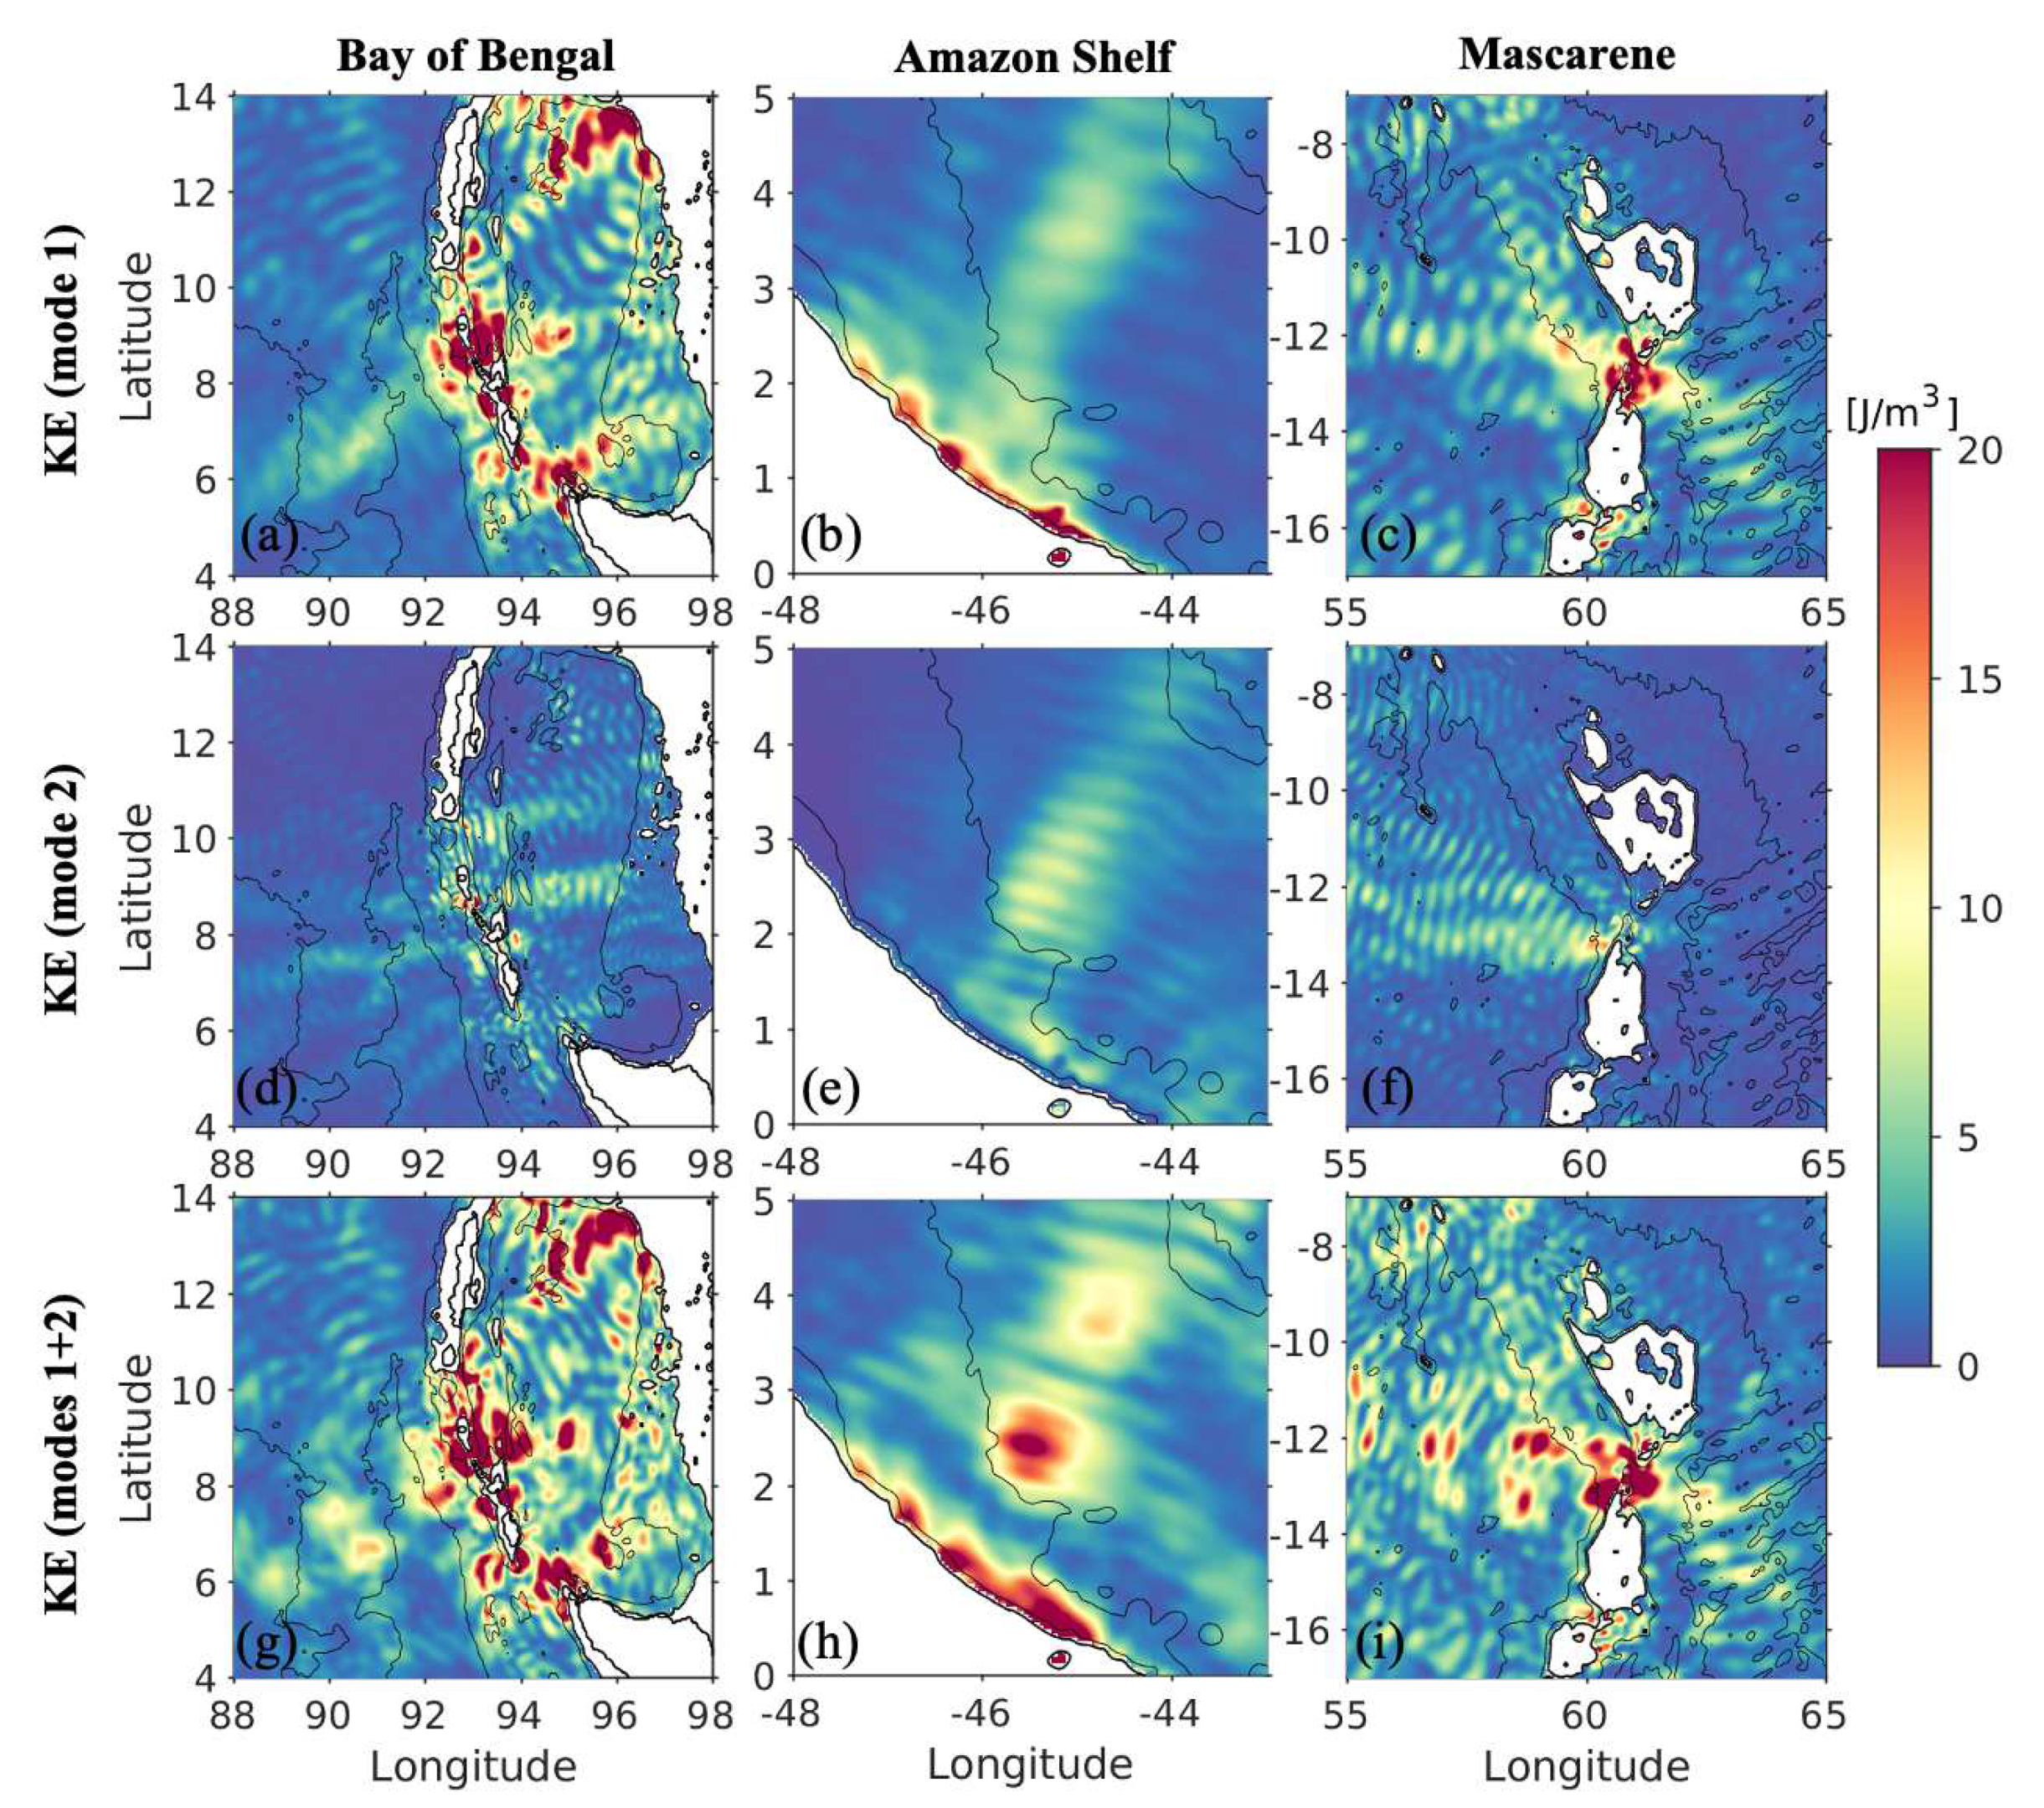
We decompose the baroclinic fields into vertical modes to demonstrate that the banding pattern in Figure 10 can be attributed to the interference patterns between semidiurnal mode 1 and mode 2 waves. We adopt the modal amplitude time series for baroclinic velocity u ^ n ( x , y , t ) and pressure p ^ n ( x , y , t ) , the normalized horizontal velocity eigenfunctions U n ( x , y , z ) , and eigenspeeds c n as computed by Raja et al. (2022) for the same HYCOM simulation used in this study.
The kinetic energy density for any frequency band at a given depth and time for the sum of the mode 1 and 2 velocities reads (omitting z and t on the left-hand side and x and y everywhere)
K E ( z , t ) = 1 2 ρ 0 ( u ^ 1 U 1 + u ^ 2 U 2 ) 2 + ( v ^ 1 U 1 + v ^ 2 U 2 ) 2 = 1 2 ρ 0 u ^ 1 2 U 1 2 + u ^ 2 2 U 2 2 + v ^ 1 2 U 1 2 + v ^ 2 2 U 2 2 + 2 u ^ 1 u ^ 2 U 1 U 2 + 2 v ^ 1 v ^ 2 U 1 U 2 ,
where the last 2 terms are the cross terms, which disappear when depth integrating because of the orthogonality condition. If the mode 1 and 2 velocities are in phase at the surface the cross-terms are positive, enhancing K E . At the same time, the mode 1 and 2 bottom velocities are out of phase near the bottom causing negative cross terms at depth, decreasing K E . In the resulting horizontal K E interference pattern, the amplified kinetic energy will always be largest near the surface because the U n eigenfunctions have the largest values near the surface. In the following we will show that the phase relation between the semidiurnal mode 1 and 2 waves (and thus the sign of the cross terms) cause the banding patterns in surface energy and energy transfers.
The time-mean semidiurnal surface K E computed for the mode 1 velocities, the mode 2 velocities, and the sum of the mode 1 and mode 2 velocities (eq. 9) at the Bay of Bengal, Amazon Shelf, and Mascarene Ridge is shown in Figure 11. Both mode 1 and mode 2 surface K E is high along the path of the internal tides in Figure 11a-f, but the beams lack the banding patters. However, the constructive interference between mode 1 and 2 results in a banding pattern, which patches occur at the same locations as the undecomposed surface tidal K E in Figure 10g-i (and the the nonlinear cross-scale energy transfer and supertidal flux divergence in Figure 10a-f).
As the semidiurnal mode 1 and 2 waves propagate away from their generation sites, the faster mode 1 waves overtake the slower mode 2 waves. This causes alternating patterns of enhanced and reduced surface K E due to positive and negative cross-term values in eq. (9). If we assume that the semidiurnal mode 1 and mode 2 waves are generated at the same time every tidal cycle with period T, the first patch occurs at the generation site and the second patch at an separation distance Δ S = c 1 c 2 T c 1 c 2 , where c 1 and c 2 are the M 2 mode 1 and 2 phase speeds. It follows from Table 1 that the predicted separation distance agrees well with the “observed" separation distance Δ S o for the Bay of Bengal, the Amazon Shelf and the Mascarene Ridge.
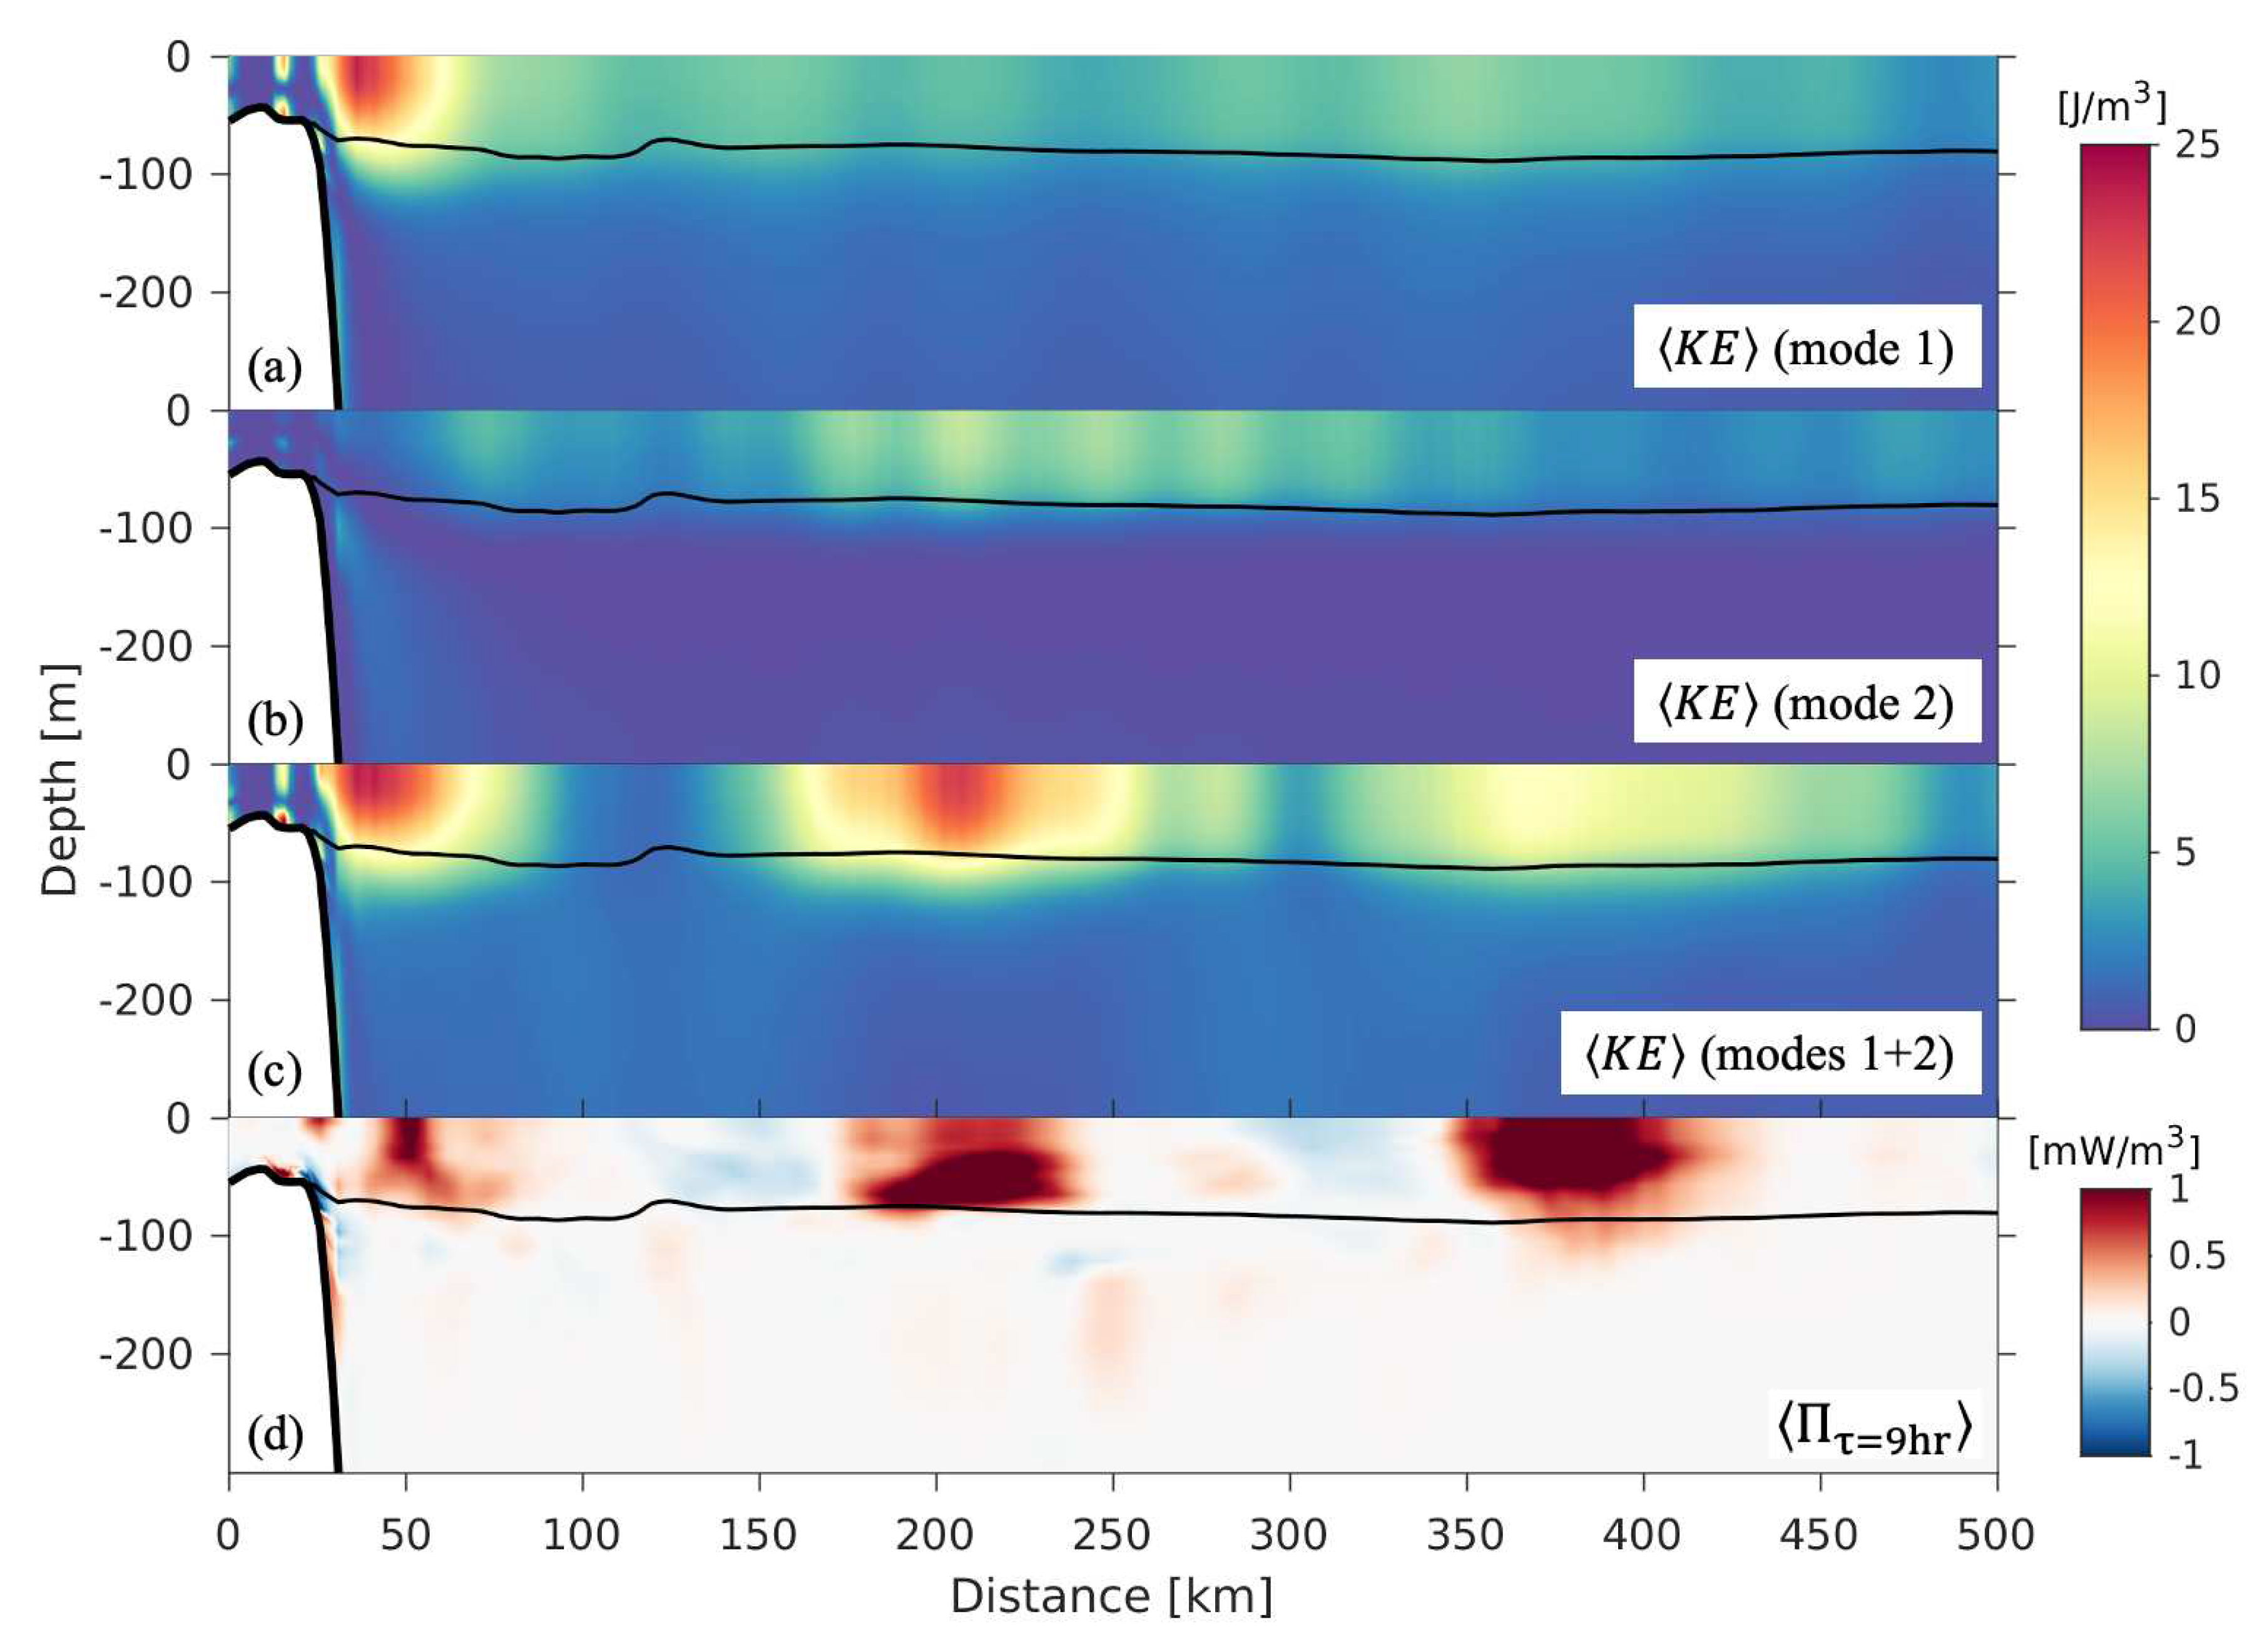
To confirm this interference pattern is surface intensified, we present the time-mean semidiurnal K E ( x , z ) for the modes and the time-mean nonlinear energy transfer along the main internal tide beam at the Amazon Shelf in Figure 12. The patches of surface intensified nonlinear energy transfer near 50, 200, and 380 km in Figure 12d occur above the thermocline and coincide with enhanced surface tidal kinetic energy, computed from the superposed mode 1 and 2 velocities in Figure 12c. In contrast, the mode 1 and mode 2 K E in Figure 12a and Figure 12b do not show these banding patterns.

4.4. Temporal modulation of nonlinear energy transfer

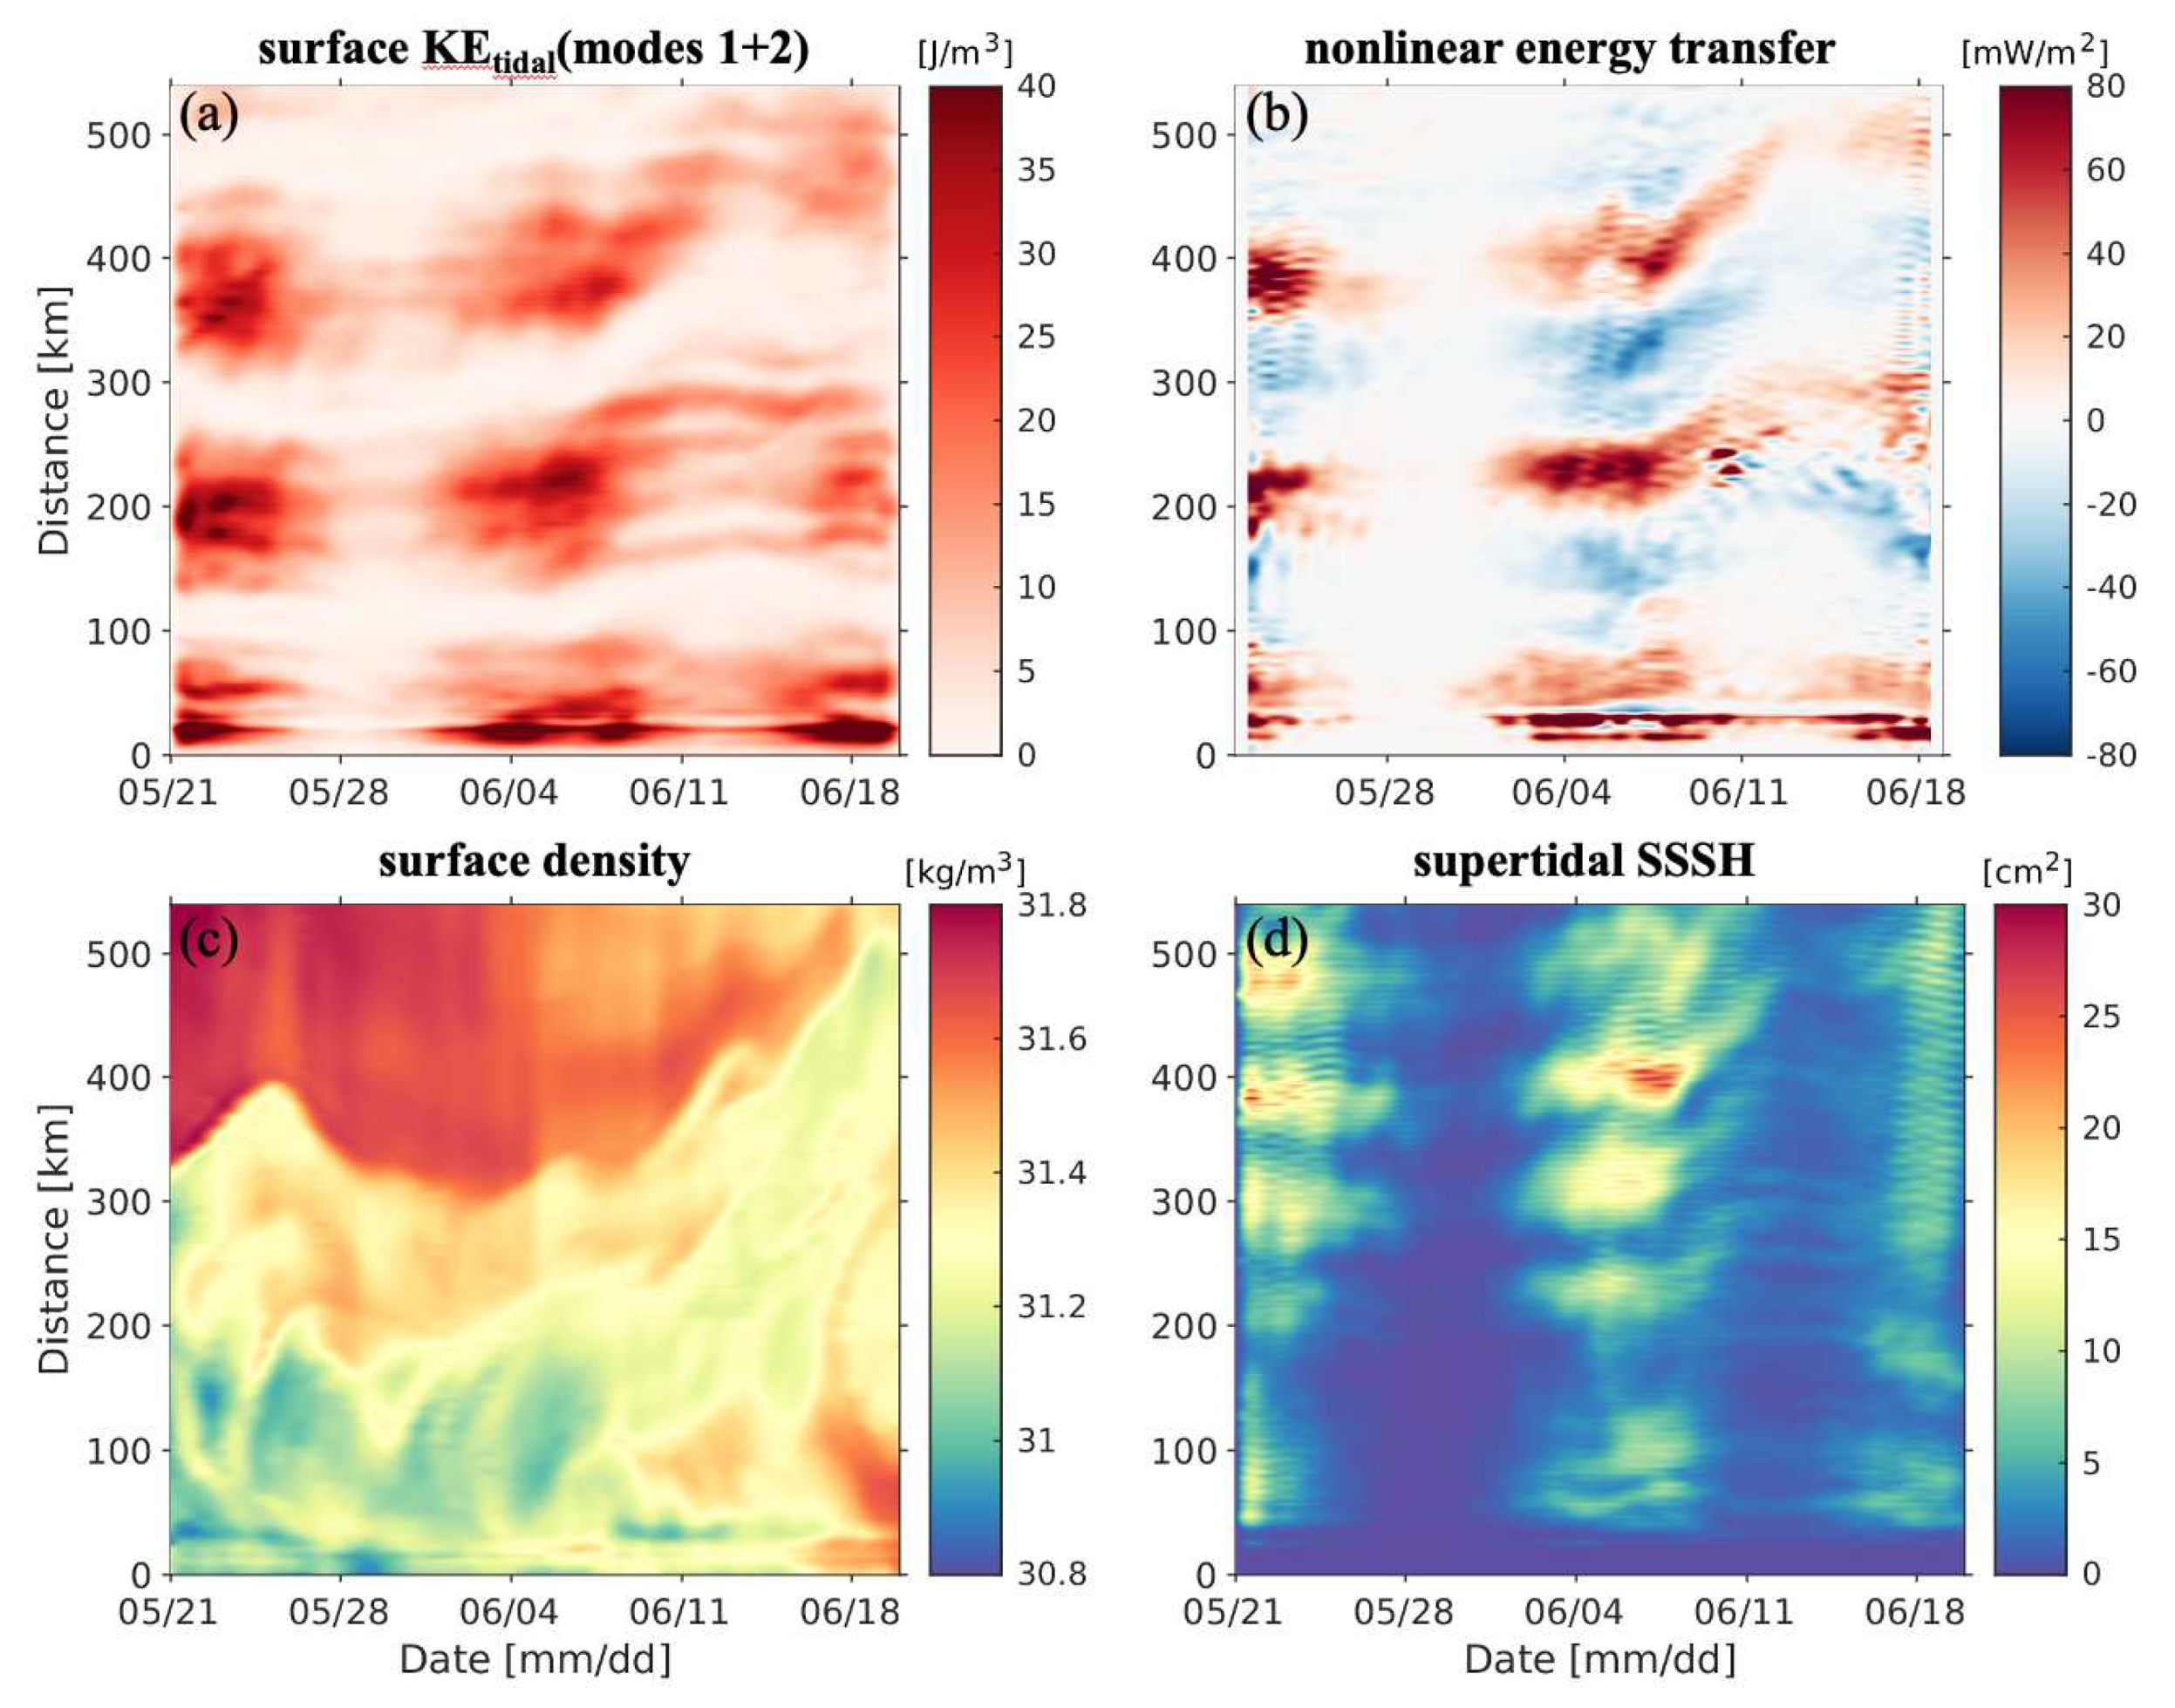
Finally, we correlate the spatial-temporal variability of the 30-hr low-pass filtered nonlinear energy transfers to the 30-hr low-pass filtered semidiurnal modal surface K E , surface density, and supertidal steric sea surface height variance in Figure 13 along the main internal tide beam at the Amazon Shelf. The regions of enhanced nonlinear forward energy transfer in Figure 13a near 50, 200, and 380 km coincide with enhanced surface K E for modes 1+2 in Figure 13b with a clear modulation by the spring-neap cycle.
Moreover, the regions of nonlinear energy transfer are also modulated by the slowly varying background flow and stratification. For example the offshore migration of the density front associated with the Equatorial Currents at 300-350 km in Figure 13c coincides with an increase of the separation distance between the patches after June 10th. At the same time, the nonlinear energy transfers and the generation of nonlinear internal waves in Figure 13d are reduced. Thus, the time varying background flow impacts the generation and propagation of tidal modes, which in turn affect the nonlinear energy transfers. The regular spaced banding patterns in SSSH are attributed to constructive supertidal mode 1 and 2 interference, which is dominated by the M 4 frequency (Figure 1).

4.5. Synthesis

The regularly spaced banding patterns, e.g., in semidiurnal surface K E , are not unique to our simulation. Similar patterns in semidiurnal SSSH variance at the same locations and with the same separation distances have been detected in satellite altimetry and regional model simulations of the Amazon Shelf region as shown in Figure 2c,d of Tchilibou et al. (2022). As in our simulations, the patches shown in Tchilibou et al. (2022) occur near 2 . 5 N and 4 N along the main beam. We note that the banding patterns in semidiurnal SSSH variance in our HYCOM simulation occur at the same locations as the patterns in K E (result not shown).
These regularly spaced patches in surface intensified semidiurnal energy and SSSH variance are the locations of nonlinear energy transfers to higher harmonics. In our simulations these patches are due to constructive interference between semidiurnal mode 1 and 2 waves, which are generally the dominant modes radiating from tall ridges (Buijsman et al. 2020). Hence, maps of mode 1+2 interference could be used as a proxy to identify locations of such nonlinear energy transfers, which are cumbersome to compute. Similarly, maps of constructive interference between semidiurnal and diurnal modes and/or higher modes may also provide insight in the locations of these energy transfers.
These energy transfers enhance the supertidal energy density in the equatorial region (Figure 2d), where f / N is small. These findings are in agreement with the theories of Baker and Sutherland (2020) and Sutherland and Dhaliwal (2022) that predict the evolution of supertidal wave modes from mode-1 internal tides as they propagate equatorward where f is small and N is large. According to Sutherland and Dhaliwal (2022), the first step in this superharmonic energy cascade is a triad-interaction of the primary frequency internal tide with itself, generating a mode-1 wave with a frequency that is moderately different from twice the internal tide frequency. The coincidence between the energy transfers and the constructive interference between semidiurnal mode 1 and 2 internal tides at the strongest generation sites (Figure 10 and Figure 11) suggest that a triad wave interaction between semidiurnal mode 1 and 2 may be important. This interaction generates a mode 1 at nearly twice the primary frequency (Varma and Mathur 2017). It is shown in (), that of the supertidal modes, mode 1 and mode 2 are only resolved due to the horizontal grid resolution in the 4-km HYCOM simulations and that generally the quarterdiurnal (e.g., M 4 ) higher harmonic frequency is most dominant. However, it is beyond the scope of this paper to determine what kind of superharmonic triad interaction is important here. We plan to address that in a future study.
Internal tide dissipation due to wave-wave interactions is generally attributed to PSI (e.g., Pollmann et al. 2017; Eden and Olbers 2014; de Lavergne et al. 2019). Ansong et al. (2018) diagnosed PSI in 4-km and 8-km HYCOM simulations forced with either semidiurnal or diurnal tides. For the 4-km HYCOM simulation with semidiurnal tides, Ansong et al. (2018) estimated an energy transfer of 40 GW due to PSI out of the semidiurnal internal tide. The energy transfer due to PSI in an 8-km simulation with diurnal tides was only 10 GW. The 40 GW is comparable to the 45 GW of energy transfer from tidal to supertidal frequencies that we find in our study equatorward of ± 25 . This suggests that energy transfers out of low-mode internal tides due to nonlinear steepening cannot be ignored. We note that both subharmonic and superharmonic energy transfers increase significantly with finer horizontal grid resolutions (Egbert and Ray 2000; Ansong et al. 2018; Nelson et al. 2020), pointing to the importance of small scale internal tides in resolving wave-wave interactions.
Finally, we note that the decay of the semidiurnal phase-locked (also referred to as stationary or coherent) internal tide in the equatorial Pacific as observed in satellite altimetry (Zhao et al. 2016; Zaron 2017; Buijsman et al. 2017) may not be only attributed to the time variability of the equatorial currents and tropical instability waves, which scatters energy to the non-phase locked internal tide (Buijsman et al. 2017), but also to the energy transfer to higher harmonics (rectangle 4 and 5 in Figure 2d. For example, for the equatorward beam from the French Polynesian Islands (rectangle 5 in Figure 2d, the fraction of energy scattered to the non-phase locked tide Figure 2b of (Buijsman et al. 2017) is comparable to the energy scattered to the supertidal band ( 20 40 % ).

5. Summary and Conclusions

In this study we have for the first time diagnosed the depth-integrated and time-averaged supertidal energy budget in a realistically forced global HYCOM simulation. We have band-passed hourly 3D velocity and density fields over a 30-day period into diurnal (D1), semidiurnal (D2), and higher-harmonic (HH; supertidal) frequency bands and computed various energy terms. Depth-integrated kinetic energy and fluxes reveal horizontal internal tide beams at both tidal and supertidal frequencies. Tidal energy and fluxes are highest at internal tide generation sites and decay with distance from the source. However, supertidal energy and fluxes can peak a few hundred kilometers from the generation sites. The fluxes are dominated by the pressure flux, with the flux due to self advection being several orders of magnitude smaller for both the tidal and supertidal bands. At the strongest generation sites of super tidal energy, such as the Bay of Bengal, Amazon Shelf, and Mascarene Ridge, supertidal K E constitutes about 25-50% of the K E summed over the tidal and supertidal bands. The zonally integrated supertidal kinetic energy is highest near the equator, where it accounts for about 10% of the total internal tide energy, and decreases towards higher latitudes. We estimate that on average, in the deep ocean ( > 250 m) and equatorward of ± 25 , supertidal K E accounts for about 5.4 PJ ( 5 % ) of the total internal tide energy.
As opposed to the tidal flux divergence, the supertidal flux divergence does not correlate with the barotropic to baroclinic energy conversion, which is elevated at topography in the tidal band and near zero in the supertidal band. Instead, the time-mean and depth-integrated supertidal flux divergence correlates well with the nonlinear kinetic energy transfers from (sub)tidal to supertidal frequency bands as estimated with a novel coarse-graining approach. At the largest supertidal energy generation sites, both supertidal flux divergence and nonlinear energy transfers are organized in regularly spaced banding patterns with separation distances larger than a semidiurnal mode-1 wavelength. These banding patterns are due to the constructive interference between semidiurnal mode 1 and 2 internal waves. The faster mode 1 wave overtakes the slower mode 2 wave, causing alternating patterns of reduced and elevated surface kinetic energy. Similar banding patterns have been observed in model simulations and satellite altimetry of the Amazon Shelf region by Tchilibou et al. (2022). These banding patterns are not present in K E after depth-integration. We estimate that equatorward of ± 25 about 45 GW, or about 7% of the tidal barotropic to baroclinic energy conversion, is transferred to higher-harmonics. This number is comparable to the net energy transfer out of the semidiurnal internal tide due to PSI (Ansong et al. 2018).
Areas in the open ocean with simulated supertidal energy fluxes >1 kWm-1 correlate well with observations of nonlinear solitary waves extracted from sunglint images (Jackson 2007). We demonstrate for the Amazon shelf, that as the tidal energy flux decays, the supertidal energy flux increases offshore. At the same time, the internal tide steepens into solitary waves, which surface expression agrees with SAR observations (Magalhaes et al. 2016). These simulated and observed solitary waves begin to appear near the second band of elevated nonlinear energy transfers at about 400 km from the shelf.
We acknowledge that our 4-km hydrostatic HYCOM simulation is only able to show the onset of the superharmonic energy cascade that affects the low-mode internal tide. Higher resolution simulations are needed to properly simulate the spectral slopes at higher frequency and wavenumbers (Nelson et al. 2020). Furthermore, these simulations need to be nonhydrostatic to accurately simulate the nonhydrostatic solitary waves (Vitousek and Fringer 2011), which is currently not yet feasible at global scales.

Acknowledgments

M. Solano and M. Buijsman are funded by the Office of Naval Research (ONR) USA grant N00014-19-1-2704. M. Buijsman is also funded by National Aeronautic Space Administration (NASA) grants 80NSSC18K0771 and NNX17AH55G. J. Shriver acknowledges support from Office of Naval Research grant N0001423WX01413. J. Magalhaes is supported by FCT – Portuguese Foundation for Science and Technology under contracts UIDB/04423/2020 and UIDP/04423/2020 and FCT/MCT national funds under project MIWAVES 2022.01215.PTDC. J.C.B. da Silva thanks the Portuguese Fundação para a Ciência e Tecnologia (FCT) under project UIDB/04683/2020. B. Arbic acknowledges support from Office of Naval Research grant N00014-19-1-2712 and National Science Foundation grant OCE-1851164. R. Barkan is supported by NSF grant OCE-1851397 and Israeli Science Foundation grant 1736/18.
Open Research. The global time-mean and depth-integrated kinetic energy and horizontal energy fluxes for EXPT 19.0 are published online (https://zenodo.org/badge/DOI/10.5281/zenodo.7814552.svg).

Appendix A. Effect of horizontal grid resolution
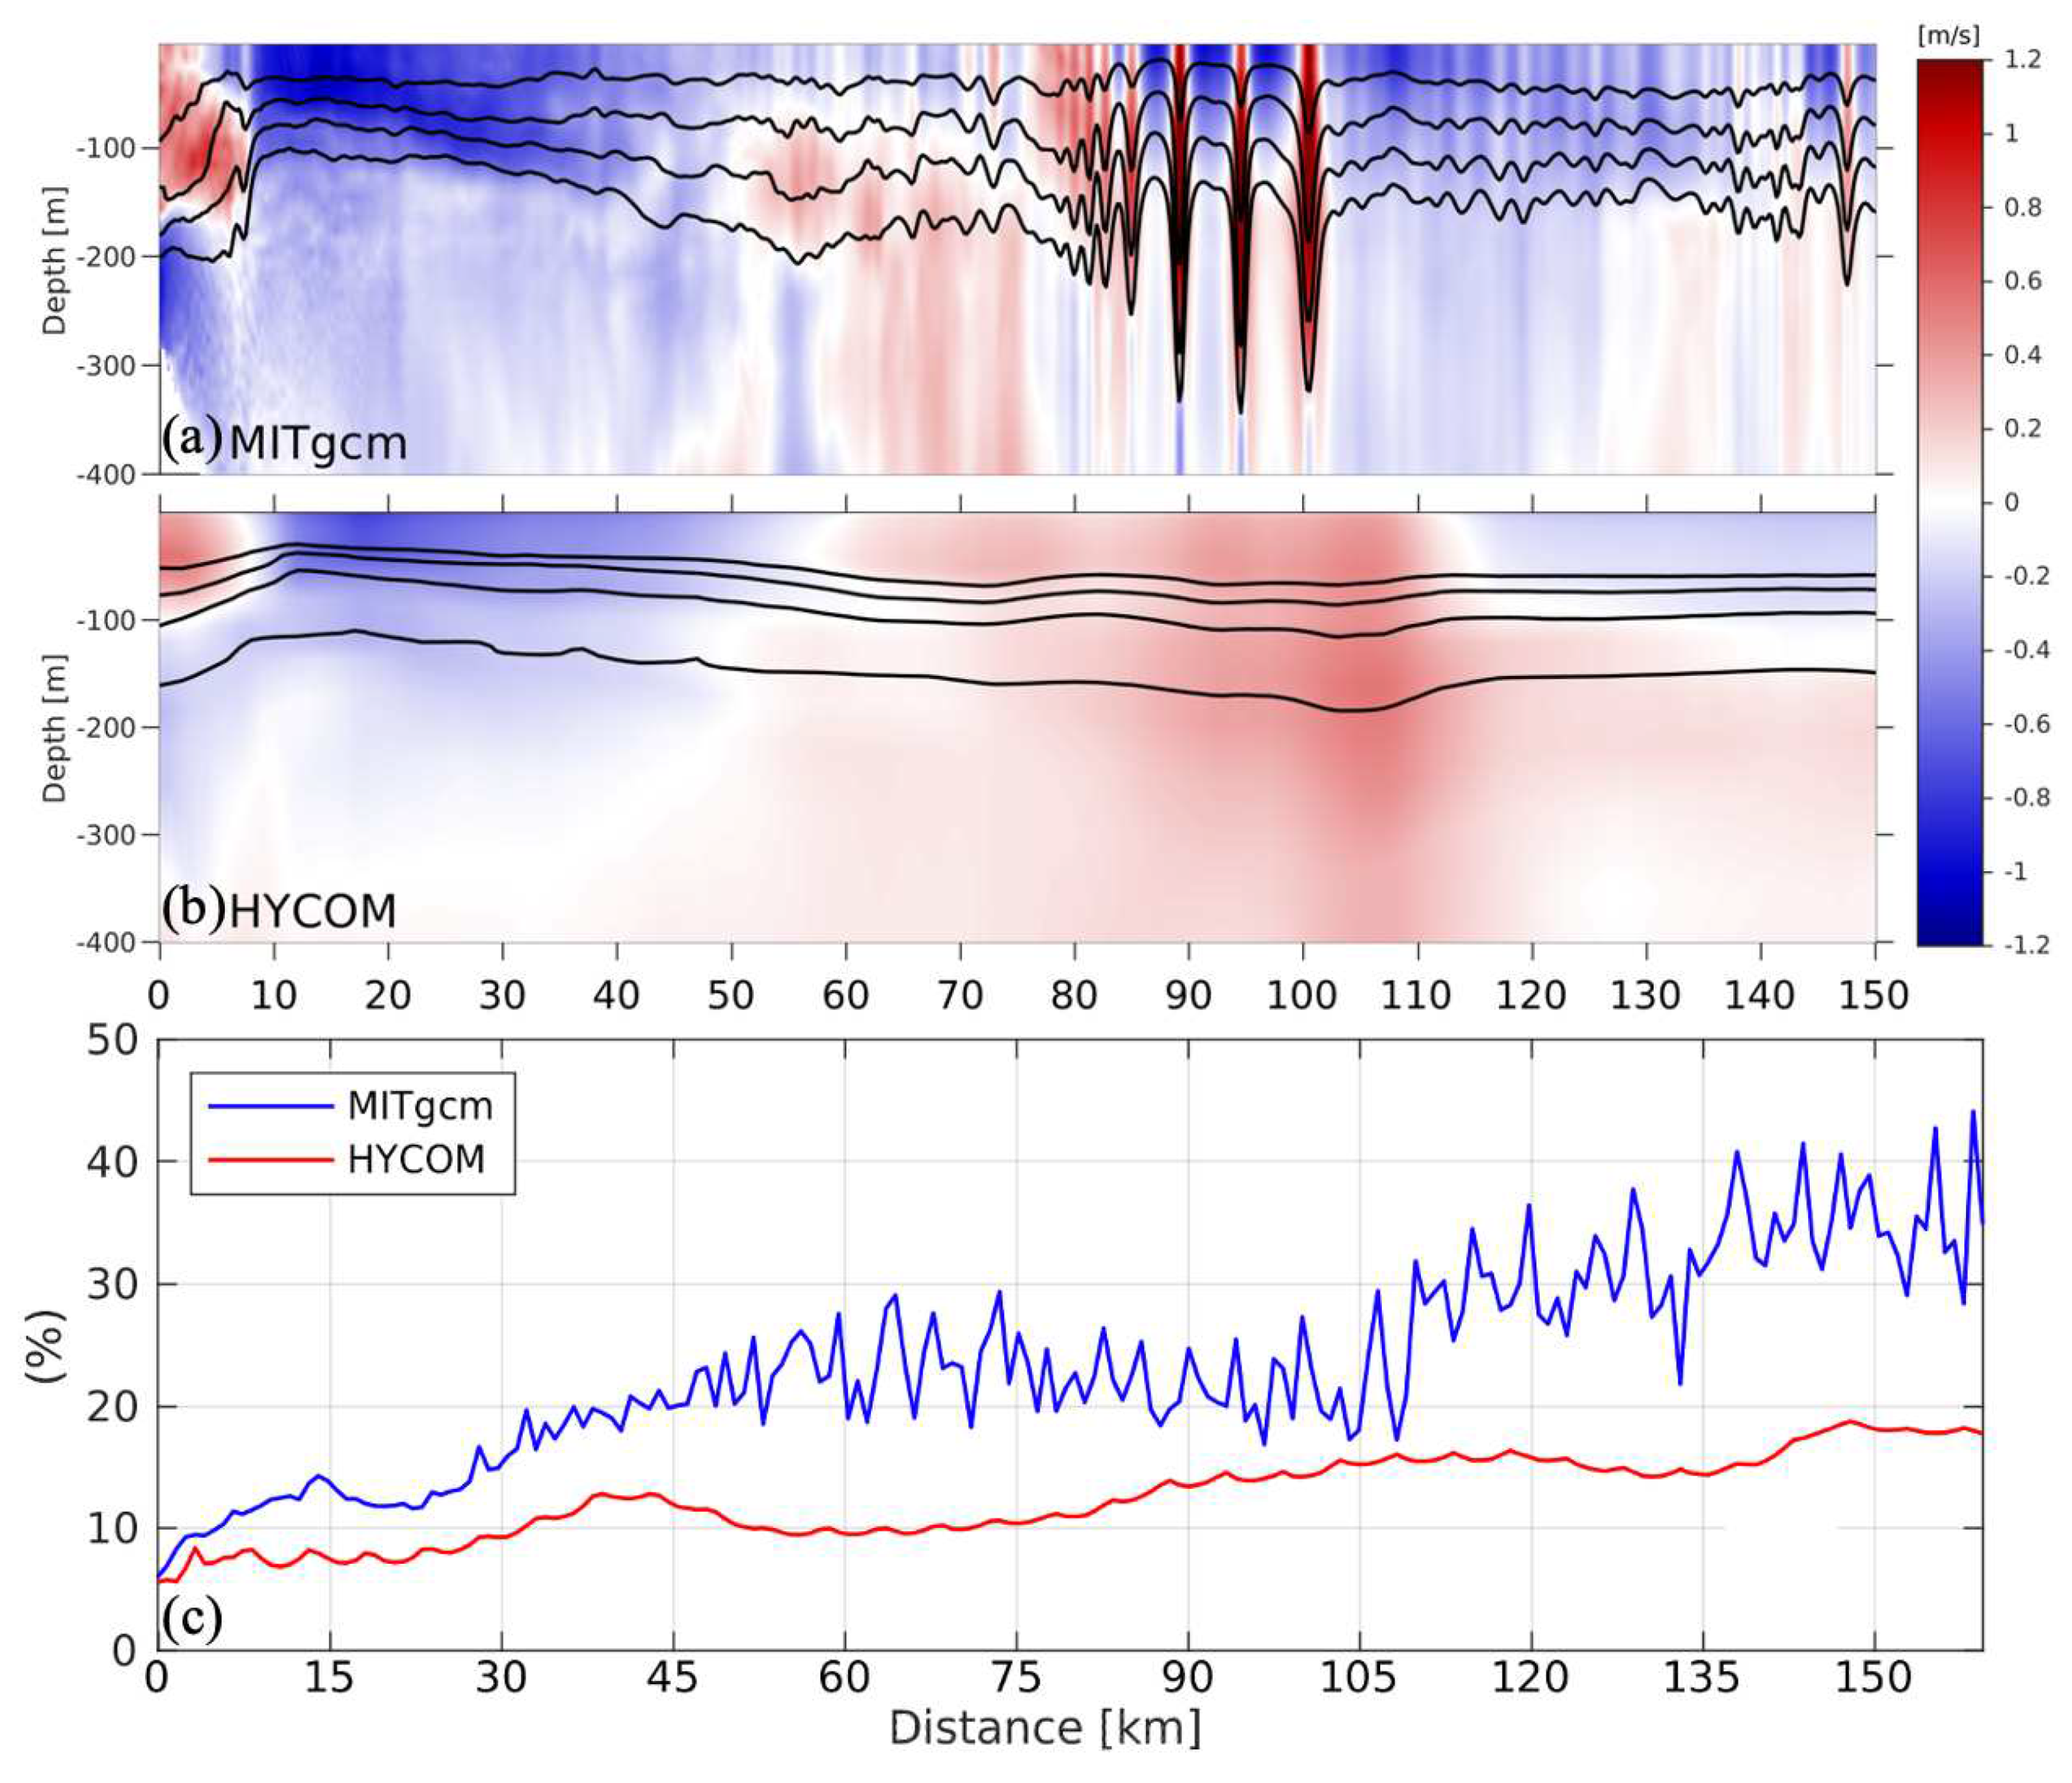
Solitary waves in the ocean have characteristic widths from a few hundred meters to several kilometers, and it is unclear how the horizontal grid resolution and hydrostatic approximation impact the steepening of the internal tide and energy transfer to higher-harmonics in global HYCOM simulations. To discuss this effect, we compare the internal tides in our HYCOM simulation with a nonhydrostatic ocean model at much higher resolution.
Internal solitary waves have been detected to the east of the Mascarene Plateau in the Indian Ocean using SAR imagery and modeled using nonhydrostatic MITgcm simulations (da Silva et al. 2015), which show large amplitude solitary waves appearing 50 km to the east of the sill after an internal tide beam steepens into NLIW. Leading solitons are observed to have widths of 800-4200 m travelling at 1.9-2.8 ms-1, with amplitudes of 70-200 m in the interior. Accurately simulating these NLIW in numerical models requires solving for nonhydrostatic pressure and horizontal grid resolutions close to the depth of the main interface (i.e. the seasonal pycnocline) to avoid numerical dispersion present in 2nd order hydrostatic pressure gradient schemes (Vitousek and Fringer 2011).
The 2-dimensional ( x z plane) nonhydrostatic MITgcm simulation from da Silva et al. (2015) has a 100 m horizontal resolution and 200 layers in the vertical direction and was run over a 4-day period during a spring tide. The nonhydrostatic simulation displays a train of solitary waves with surface intensified velocities propagating along a transect in Figure A1a. In contrast, the HYCOM simulation along the same transect does not show these steep nonlinear waves. Clearly the individual solitons have wavelengths of 1-2 km that are unresolved in our 4-km HYCOM simulation, although the large scale features of the internal tide agree well.
To provide a quantitative comparison of the relative importance of supertidal energy at this location we plot the percentage of supertidal energy along the transect. In both simulations about 5% of the energy is found in the supertidal band at the reference (0 km), increasing to about 40% and 20% at 150 km in MITgcm and HYCOM, respectively. In agreement with other studies Nelson et al. (2020) the higher resolution simulation allows for more efficient energy scale transfer to smaller scales unresolved in the global HYCOM simulation, resulting in the underestimation of supertidal energy by about 50% at this location.
Figure A1. Vertical section at the east side of the Mascarene Ridge showing colormaps of instantaneous velocity from (a) the nonhydrostatic MITgcm simulation ( Δ x = 100 m) (da Silva et al. 2015) and (b) global HYCOM ( Δ x = 4 km). The black curves in the top two panels denote the isopycnals at 1031, 1032, 1033, and 1034 kgm-3. (c) Supertidal K E (2.67-12 cpd) as a fraction of the sum of the tidal and supertidal K E .
Preprints 81996 g0a1

References

  1. Egbert.; Ray. Significant dissipation of tidal energy in the deep ocean inferred from satellite altimeter data. Nature 2000, 405, 775–778. [CrossRef] [PubMed]
  2. Egbert.; Ray. Estimates of M2 tidal energy dissipation from TOPEX/Poseidon altimeter data. Journal of Geophysical Research 2001, 106, 475–497. [CrossRef]
  3. Wunsch, C.; Ferrari, R. Vertical mixing, energy and the general circulation of the oceans. Annual Review of Fluid Mechanics 2004, 36, 281–314. [CrossRef]
  4. Melet, A.; Hallberg, R.; Legg, S.; Polzin, K. Sensitivity of the Ocean State to the Vertical Distribution of Internal-Tide-Driven Mixing. Journal of Physical Oceanography 2013, 43, 602 – 615. [CrossRef]
  5. Waterhouse, A.F.; Mackinnon, J.A.; Nash, J.D.; Alford, M.H.; Kunze, E.; Simmons, H.L.; Polzin, K.L.; Laurent, L.C.; Sun, O.M.; Pinkel, R.; Talley, L.D.; Whalen, C.B.; Huussen, T.N.; Carter, G.S.; Fer, I.; Waterman, S.; Garabato, A.C.N.; Sanford, T.B.; Lee, C.M. Global patterns of diapycnal mixing from measurements of the turbulent dissipation rate. Journal of Physical Oceanography 2014, 44, 1854–1872. [CrossRef]
  6. Vic, C.; Garabato, A.C.N.; Green, J.A.; Waterhouse, A.F.; Zhao, Z.; Melet, A.; de Lavergne, C.; Buijsman, M.C.; Stephenson, G.R. Deep-ocean mixing driven by small-scale internal tides. Nature Communications 2019, 10. [CrossRef]
  7. Zhao, Z., M. Alford, J. Girton, L. Rainville, and H. Simmons. 2016. Global observations of open-ocean mode-1 M2 internal tides. Journal of Physical Oceanography 46: 1657–1684. [Google Scholar] [CrossRef]
  8. Shriver, J.F.; Arbic, B.K.; Richman, J.G.; Ray, R.D.; Metzger, E.J.; Wallcraft, A.J.; Timko, P.G. An evaluation of the barotropic and internal tides in a high-resolution global ocean circulation model. Journal of Geophysical Research: Oceans 2012, 117. [CrossRef]
  9. Muller, M., J. Cherniawsky, M. Foreman, and J. von Storch. 2012. Global M2 internal tide and its seasonal variability from high resolution ocean circulation and tide modeling. Geophysical Research Letters 39: L19607. [Google Scholar] [CrossRef]
  10. Buijsman, M.C.; Stephenson, G.R.; Ansong, J.K.; Arbic, B.K.; Green, J.A.; Richman, J.G.; Shriver, J.F.; Vic, C.; Wallcraft, A.J.; Zhao, Z. On the interplay between horizontal resolution and wave drag and their effect on tidal baroclinic mode waves in realistic global ocean simulations. Ocean Modelling 2020, 152. [CrossRef]
  11. Johnston, T.M.S.; Merrifield, M.A. Internal tide scattering at seamounts, ridges, and islands. Journal of Geophysical Research: Oceans 2003, 108, 1–17. [CrossRef]
  12. Lamb, K.G. Nonlinear interaction among internal wave beams generated by tidal flow over supercritical topography. Geophysical Research Letters 2004, 31. [CrossRef]
  13. Mathur, M.; Carter, G.S.; Peacock, T. Topographic scattering of the low-mode internal tide in the deep ocean. Journal of Geophysical Research: Oceans 2014, 119, 2165–2182. [CrossRef]
  14. Kelly, S.M.; Lermusiaux, P.F.; Duda, T.F.; Haley, P.J. A coupled-mode shallow-water model for tidal analysis: Internal tide reflection and refraction by the gulf stream. Journal of Physical Oceanography 2016, 46, 3661–3679. [CrossRef]
  15. Dunphy, M.; Ponte, A.L.; Klein, P.; Gentil, S.L. Low-Mode Internal Tide Propagation in a Turbulent Eddy Field. Journal of Physical Oceanography 2017, 47, 649 – 665. [CrossRef]
  16. Savage, A.C.; Waterhouse, A.F.; Kelly, S.M. Internal Tide Nonstationarity and Wave–Mesoscale Interactions in the Tasman Sea. Journal of Physical Oceanography 2020, 50, 2931–2951. [CrossRef]
  17. Legg, S. Scattering of Low-Mode Internal Waves at Finite Isolated Topography. Journal of Physical Oceanography 2014, 44, 359 – 383. [CrossRef]
  18. Klymak, J.M.; Simmons, H.L.; Braznikov, D.; Kelly, S.; MacKinnon, J.A.; Alford, M.H.; Pinkel, R.; Nash, J.D. Reflection of Linear Internal Tides from Realistic Topography: The Tasman Continental Slope. Journal of Physical Oceanography 2016, 46, 3321–3337. [CrossRef]
  19. Olbers, D.J. Nonlinear energy transfer and the energy balance of the internal wave field in the deep ocean. Journal of Fluid Mechanics 1976, 74, 375–399. [CrossRef]
  20. Varma, D.; Mathur, M. Internal wave resonant triads in finite-depth non-uniform stratifications. Journal of Fluid Mechanics 2017, 824, 286–311. [CrossRef]
  21. Eden, C.; Pollmann, F.; Olbers, D. Numerical evaluation of energy transfers in internal gravity wave spectra of the ocean. Journal of Physical Oceanography 2019, 49, 737–749. [CrossRef]
  22. Baker, L.E.; Sutherland, B.R. The evolution of superharmonics excited by internal tides in non-uniform stratification. Journal of Fluid Mechanics 2020, 891, R1. [CrossRef]
  23. Sutherland, B.R.; Dhaliwal, M.S. The nonlinear evolution of internal tides. Part 1: the superharmonic cascade. Journal of Fluid Mechanics 2022, 948, A21. [CrossRef]
  24. Mackinnon, J.A.; Alford, M.H.; Sun, O.; Pinkel, R.; Zhao, Z.; Klymak, J. Parametric subharmonic instability of the internal tide at 29°N. Journal of Physical Oceanography 2013, 43, 17–28. [CrossRef]
  25. Ansong, J.K.; Arbic, B.K.; Simmons, H.L.; Alford, M.H.; Buijsman, M.C.; Timko, P.G.; Richman, J.G.; Shriver, J.F.; Wallcraft, A.J. Geographical distribution of diurnal and semidiurnal parametric subharmonic instability in a global ocean circulation model. Journal of Physical Oceanography 2018, 48, 1409–1431. [CrossRef]
  26. Helfrich, K.R.; Grimshaw, R.H.J. Nonlinear Disintegration of the Internal Tide. Journal of Physical Oceanography 2008, 38, 686 – 701. [CrossRef]
  27. Ostrovsky, L., and Y.A. Stepanyants. 1989. Do internal solitons exist in the ocean? Review of Geophysics 27: 293–310. [Google Scholar] [CrossRef]
  28. Farmer, D.; Li, Q.; Park, J. Internal wave observations in the South China Sea: The role of rotation and non-linearity. Atmosphere-Ocean 2009, 47, 267–280. [CrossRef]
  29. Maxworthy, T. A note on the internal solitary waves produced by tidal flow over a three-dimensional ridge. Journal of Geophysical Research: Oceans 1979, 84, 338–346. [CrossRef]
  30. New, A.L.; Pingree, R.D. Large-amplitude internal soliton packets in the central Bay of Biscay. Deep Sea Research Part A. Oceanographic Research Papers 1990, 37, 513–524. [CrossRef]
  31. New, A.L.; Pingree, R.D. Local generation of internal soliton packets in the central bay of Biscay. Deep Sea Research Part A. Oceanographic Research Papers 1992, 39, 1521–1534. [CrossRef]
  32. Gerkema, T. Internal and interfacial tides: Beam scattering and local generation of solitary waves.
  33. Grisouard, N.; Staquet, C.; Gerkema, T. Generation of internal solitary waves in a pycnocline by an internal wave beam: a numerical study. Journal of Fluid Mechanics 2011, 676, 491–513. [CrossRef]
  34. Mercier, M.J.; Mathur, M.; Gostiaux, L.; Gerkema, T.; MagalhÃes, J.M.; Silva, J.C.D.; Dauxois, T. Soliton generation by internal tidal beams impinging on a pycnocline: Laboratory experiments. Journal of Fluid Mechanics 2012, 704, 37–60. [CrossRef]
  35. Gerkema, T.; Staquet, C.; Bouruet-Aubertot, P. Non-linear effects in internal-tide beams, and mixing. Ocean Modelling 2006, 12, 302–318. [CrossRef]
  36. Alpers, W. Theory of radar imaging of internal waves. Nature 2018, 314, 245–247. [CrossRef]
  37. Jackson, C.R.; da Silva, J.C.; Jeans, G. The generation of nonlinear internal waves. Oceanography 2012, 25, 108–123. [CrossRef]
  38. Jackson, C.R.; da Silva, J.; Jeans, G.; Alpers, W.; Caruso, M. Nonlinear Internal Waves in Synthetic Aperture Radar Imagery. Oceanography 2013, 26, 68–79. [CrossRef]
  39. Jackson, C. Internal wave detection using the Moderate Resolution Imaging Spectroradiometer (MODIS). Journal of Geophysical Research: Oceans 2007, 112. [CrossRef]
  40. Simmons, H., M.H. Chang, Y.T. Chang, S.Y. Chao, O. Fringer, C.R. Jackson, and D.S. Ko. 2011. Modeling and Prediction of Internal Waves in the South China Sea. Oceanography 24: 88–99. [Google Scholar] [CrossRef]
  41. Alford, M.H.; Peacock, T.; Mackinnon, J.A.; Nash, J.D.; Buijsman, M.C.; Centuroni, L.R.; Chao, S.Y.; Chang, M.H.; Farmer, D.M.; Fringer, O.B.; Fu, K.H.; Gallacher, P.C.; Graber, H.C.; Helfrich, K.R.; Jachec, S.M.; Jackson, C.R.; Klymak, J.M.; Ko, D.S.; Jan, S.; Johnston, T.M.; Legg, S.; Lee, I.H.; Lien, R.C.; Mercier, M.J.; Moum, J.N.; Musgrave, R.; Park, J.H.; Pickering, A.I.; Pinkel, R.; Rainville, L.; Ramp, S.R.; Rudnick, D.L.; Sarkar, S.; Scotti, A.; Simmons, H.L.; Laurent, L.C.S.; Venayagamoorthy, S.K.; Wang, Y.H.; Wang, J.; Yang, Y.J.; Paluszkiewicz, T.; Tang, T.Y. The formation and fate of internal waves in the South China Sea. Nature 2015, 521, 65–69. [CrossRef]
  42. Konyaev, K.; Sabinin, K.; Serebryany, A. Large-amplitude internal waves at the Mascarene Ridge in the Indian Ocean. Deep Sea Research Part I: Oceanographic Research Papers 1995, 42, 2075–2091. [CrossRef]
  43. da Silva, J.C.; Buijsman, M.C.; Magalhaes, J.M. Internal waves on the upstream side of a large sill of the Mascarene Ridge: A comprehensive view of their generation mechanisms and evolution. Deep-Sea Research Part I: Oceanographic Research Papers 2015, 99, 87–104. [CrossRef]
  44. Osborne, A.R.; Burch, T.L. Internal Solitons in the Andaman Sea. Science 1980, 208, 451–460. [CrossRef]
  45. Jensen, T.G.; Magalhães, J.; Wijesekera, H.W.; Buijsman, M.; Helber, R.; Richman, J. Numerical modelling of tidally generated internal wave radiation from the Andaman Sea into the Bay of Bengal. Deep-Sea Research Part II: Topical Studies in Oceanography 2020, 172. [CrossRef]
  46. Magalhaes, J.M.; da Silva, J.C.; Buijsman, M.C. Long lived second mode internal solitary waves in the Andaman Sea. Scientific Reports 2020, 10. [CrossRef]
  47. Ivanov, V.; Ivanov, L.; Lisichenok, A. Redistribution of energy of the internal tidal wave in the North Equatorial Countercurrent region. Soviet Journal of Physical Oceanography 1990, 1, 383–386. [CrossRef]
  48. Magalhaes, J.M.; Silva, J.C.D.; Buijsman, M.C.; Garcia, C.A. Effect of the North Equatorial Counter Current on the generation and propagation of internal solitary waves off the Amazon shelf (SAR observations). Ocean Science 2016, 12, 243–255. [CrossRef]
  49. van Aken, H.M.; van Haren, H.; Maas, L.R.M. The high-resolution vertical structure of internal tides and near-inertial waves measured with an ADCP over the continental slope in the Bay of Biscay. Deep-Sea Research Part I: Oceanographic Research Papers 2007, 54, 533–556. [CrossRef]
  50. Yu, X.; Ponte, A.L.; Elipot, S.; Menemenlis, D.; Zaron, E.D.; Abernathey, R. Surface Kinetic Energy Distributions in the Global Oceans From a High-Resolution Numerical Model and Surface Drifter Observations. Geophysical Research Letters 2019, 46, 9757–9766. [CrossRef]
  51. Moum, J.N.; Farmer, D.M.; Smyth, W.D.; Armi, L.; Vagle, S. Structure and Generation of Turbulence at Interfaces Strained by Internal Solitary Waves Propagating Shoreward over the Continental Shelf. Journal of Physical Oceanography 2003, 33, 2093–2112. [CrossRef]
  52. Carter, G.S.; Gregg, M.C.; Lien, R.C. Internal waves, solitary-like waves, and mixing on the Monterey Bay shelf. Continental Shelf Research 2005, 25, 1499–1520. [CrossRef]
  53. Shroyer, E.L.; Moum, J.N.; Nash, J.D. Energy transformations and dissipation of nonlinear internal waves over New Jersey’s continental shelf. Nonlinear Processes in Geophysics 2010, 17, 345–360. [CrossRef]
  54. Zhang, X.; Huang, X.; Yang, Y.; Zhao, W.; Wang, H.; Yuan, C.; Tian, J. Energy cascade from internal solitary waves to turbulence via near N-waves in the northern South China Sea. Journal of Physical Oceanography 2023. [CrossRef]
  55. Buijsman, M.C.; Kanarska, Y.; McWilliams, J.C. On the generation and evolution of nonlinear internal waves in the South China Sea. Journal of Geophysical Research: Oceans 2010, 115. [CrossRef]
  56. Vitousek, S.; Fringer, O.B. Physical vs. numerical dispersion in nonhydrostatic ocean modeling. Ocean Modelling 2011, 40, 72–86. [CrossRef]
  57. Müller, M.; Arbic, B.K.; Richman, J.G.; Shriver, J.F.; Kunze, E.L.; Scott, R.B.; Wallcraft, A.J.; Zamudio, L. Toward an internal gravity wave spectrum in global ocean models. Geophysical Research Letters 2015, 42, 3474–3481. [CrossRef]
  58. Savage, A.C.; Arbic, B.K.; Richman, J.G.; Shriver, J.F.; Alford, M.H.; Buijsman, M.C.; Farrar, J.T.; Sharma, H.; Voet, G.; Wallcraft, A.J.; Zamudio, L. Frequency content of sea surface height variability from internal gravity waves to mesoscale eddies. Journal of Geophysical Research: Oceans 2017, 122, 2519–2538. [CrossRef]
  59. Luecke, C.A.; Arbic, B.K.; Richman, J.G.; Shriver, J.F.; Alford, M.H.; Ansong, J.K.; Bassette, S.L.; Buijsman, M.C.; Menemenlis, D.; Scott, R.B.; Timko, P.G.; Voet, G.; Wallcraft, A.J.; Zamudio, L. Statistical Comparisons of Temperature Variance and Kinetic Energy in Global Ocean Models and Observations: Results From Mesoscale to Internal Wave Frequencies. Journal of Geophysical Research: Oceans 2020, 125, e2019JC015306. [CrossRef]
  60. Arbic, B.; Elipot, S.; Brasch, J.M.; Menemenlis, D.; Ponte, A.L.; Shriver, J.F.; Yu, X.; Zaron, E.D.; Alford, M.H.; Buijsman, M.C.; Abernathey, R.; Garcia, D.; Guan, L.; Martin, P.E.; Nelson, A.D. Near-Surface Oceanic Kinetic Energy Distributions From Drifter Observations and Numerical Models. Journal of Geophysical Research: Oceans 2022, 127, e2022JC018551. [CrossRef]
  61. Müller, M. On the space- and time-dependence of barotropic-to-baroclinic tidal energy conversion. Ocean Modelling 2013, 72, 242–252. [CrossRef]
  62. Buijsman, M.C.; Ansong, J.K.; Arbic, B.K.; Richman, J.G.; Shriver, J.F.; Timko, P.G.; Wallcraft, A.J.; Whalen, C.B.; Zhao, Z. Impact of parameterized internal wave drag on the semidiurnal energy balance in a global ocean circulation model. Journal of Physical Oceanography 2016, 46, 1399–1419. [CrossRef]
  63. Li, Z.; von Storch, J.S. M2 Internal-Tide Generation in STORMTIDE2. Journal of Geophysical Research: Oceans 2020, 125, e2019JC015453. [CrossRef]
  64. Raja, K.J.; Buijsman, M.C.; Shriver, J.F.; Arbic, B.K.; Siyanbola, O. Near-Inertial Wave Energetics Modulated by Background Flows in a Global Model Simulation. Journal of Physical Oceanography 2022, 52, 823 – 840. [CrossRef]
  65. Bleck, R. An oceanic general circulation model framed in hybrid isopycnic-Cartesian coordinates. Ocean Modelling 2002, 4, 55–88. [CrossRef]
  66. Metzger, E.J., O.M. Smedstad, P.G. Thoppil, H.E. Hurlburt, J.A. Cummings, A.J. Wallcraft, L. Zamudio, D.S. Franklin, P.G. Posey, M.W. Phelps, P.J. Hogan, F.L. Bub, and C.J. Dehaan. 2014. US Navy Operational Global Ocean and Arctic Ice Prediction Systems. Oceanography 27: 32–43. [Google Scholar] [CrossRef]
  67. Hogan, T.F., M. Liu, J.A. Ridout, M.S. Peng, T.R. Whitcomb, B.C. Ruston, C.A. Reynolds, S.D. Eckermann, J.R. Moskatiis, N.L. Baker, J.P. McCormack, K.C. Viner, J.G. McLay, M.K. Flatau, L. Xu, C. Chen, and S.W. Chang. 2014. The Navy Global Environmental Model. Oceanography 27: 116–125. [Google Scholar] [CrossRef]
  68. Ngodock, H.E.; Souopgui, I.; Wallcraft, A.J.; Richman, J.G.; Shriver, J.F.; Arbic, B.K. On improving the accuracy of the M2 barotropic tides embedded in a high-resolution global ocean circulation model. Ocean Modelling 2016, 97, 16–26. [CrossRef]
  69. Jayne, S.R.; St. Laurent, L.C. Parameterizing tidal dissipation over rough topography. Geophysical Research Letters 2001, 28, 811–814. [CrossRef]
  70. Kang, D.; Fringer, O. Energetics of barotropic and baroclinic tides in the Monterey Bay area. Journal of Physical Oceanography 2012, 42, 272–290. [CrossRef]
  71. Kelly, S.M. The vertical mode decomposition of surface and internal tides in the presence of a free surface and arbitrary topography. Journal of Physical Oceanography 2016, 46, 3777–3788. [CrossRef]
  72. Pan, Y.; Haley, P.J.; Lermusiaux, P.F. Interactions of internal tides with a heterogeneous and rotational ocean. Journal of Fluid Mechanics 2021, 920, A18. [CrossRef]
  73. Barkan, R.; Srinivasan, K.; Yang, L.; McWilliams, J.C.; Gula, J.; Vic, C. Oceanic Mesoscale Eddy Depletion Catalyzed by Internal Waves. Geophysical Research Letters 2021, 48, e2021GL094376. [CrossRef]
  74. Kang, D.; Fringer, O. On the calculation of available potential energy in internal wave fields. Journal of Physical Oceanography 2010, 40, 2539–2545. [CrossRef]
  75. Nash.; Alford, M.H.; Kunze, E. Estimating Internal Wave Energy Fluxes in the Ocean. Journal of Atmospheric and Oceanic Technology 2005, 22, 1551–1570. [CrossRef]
  76. Venayagamoorthy, S.K.; Fringer, O.B. Nonhydrostatic and nonlinear contributions to the energy flux budget in nonlinear internal waves. Geophysical Research Letters 2005, 32. [CrossRef]
  77. Tchilibou, M.; Koch-Larrouy, A.; Barbot, S.; Lyard, F.; Morel, Y.; Jouanno, J.; Morrow, R. Internal tides off the Amazon shelf during two contrasted seasons: Interactions with background circulation and SSH imprints. Ocean Science Discussions 2022, 2022, 1–38. [CrossRef]
  78. Eyink, G.L.; Aluie, H. Localness of energy cascade in hydrodynamic turbulence. I. Smooth coarse graining. Physics of Fluids 2009, 21, 115107. [CrossRef]
  79. Aluie, H.; Hecht, M.; Vallis, G.K. Mapping the Energy Cascade in the North Atlantic Ocean: The Coarse-Graining Approach. Journal of Physical Oceanography 2018, 48, 225–244. [CrossRef]
  80. Pollmann, F.; Eden, C.; Olbers, D. Evaluating the Global internal wave model IDEMIX using finestructure methods. Journal of Physical Oceanography 2017, 47, 2267–2289. [CrossRef]
  81. Buijsman, M.C.; Solano, M.; Shriver, J.F. Variance in vertical modes across frequency bands in a global ocean simulation. Ocean Modelling in preparation.
  82. Eden, C.; Olbers, D. An Energy Compartment Model for Propagation, Nonlinear Interaction, and Dissipation of Internal Gravity Waves. Journal of Physical Oceanography 2014, 44, 2093 – 2106. [CrossRef]
  83. de Lavergne, C.; Falahat, S.; Madec, G.; Roquet, F.; Nycander, J.; Vic, C. Toward global maps of internal tide energy sinks. Ocean Modelling 2019, 137, 52–75. [CrossRef]
  84. Nelson, A.D.; Arbic, B.K.; Menemenlis, D.; Peltier, W.R.; Alford, M.H.; Grisouard, N.; Klymak, J.M. Improved Internal Wave Spectral Continuum in a Regional Ocean Model. Journal of Geophysical Research: Oceans 2020, 125, e2019JC015974. [CrossRef]
  85. Zaron, E.D. Mapping the nonstationary internal tide with satellite altimetry. Journal of Geophysical Research: Oceans 2017, 122, 539–554. [CrossRef]
  86. Buijsman, M.C.; Arbic, B.K.; Richman, J.G.; Shriver, J.F.; Wallcraft, A.J.; Zamudio, L. Semidiurnal internal tide incoherence in the equatorial Pacific. Journal of Geophysical Research 2017, 122, 5286–5305. [CrossRef]
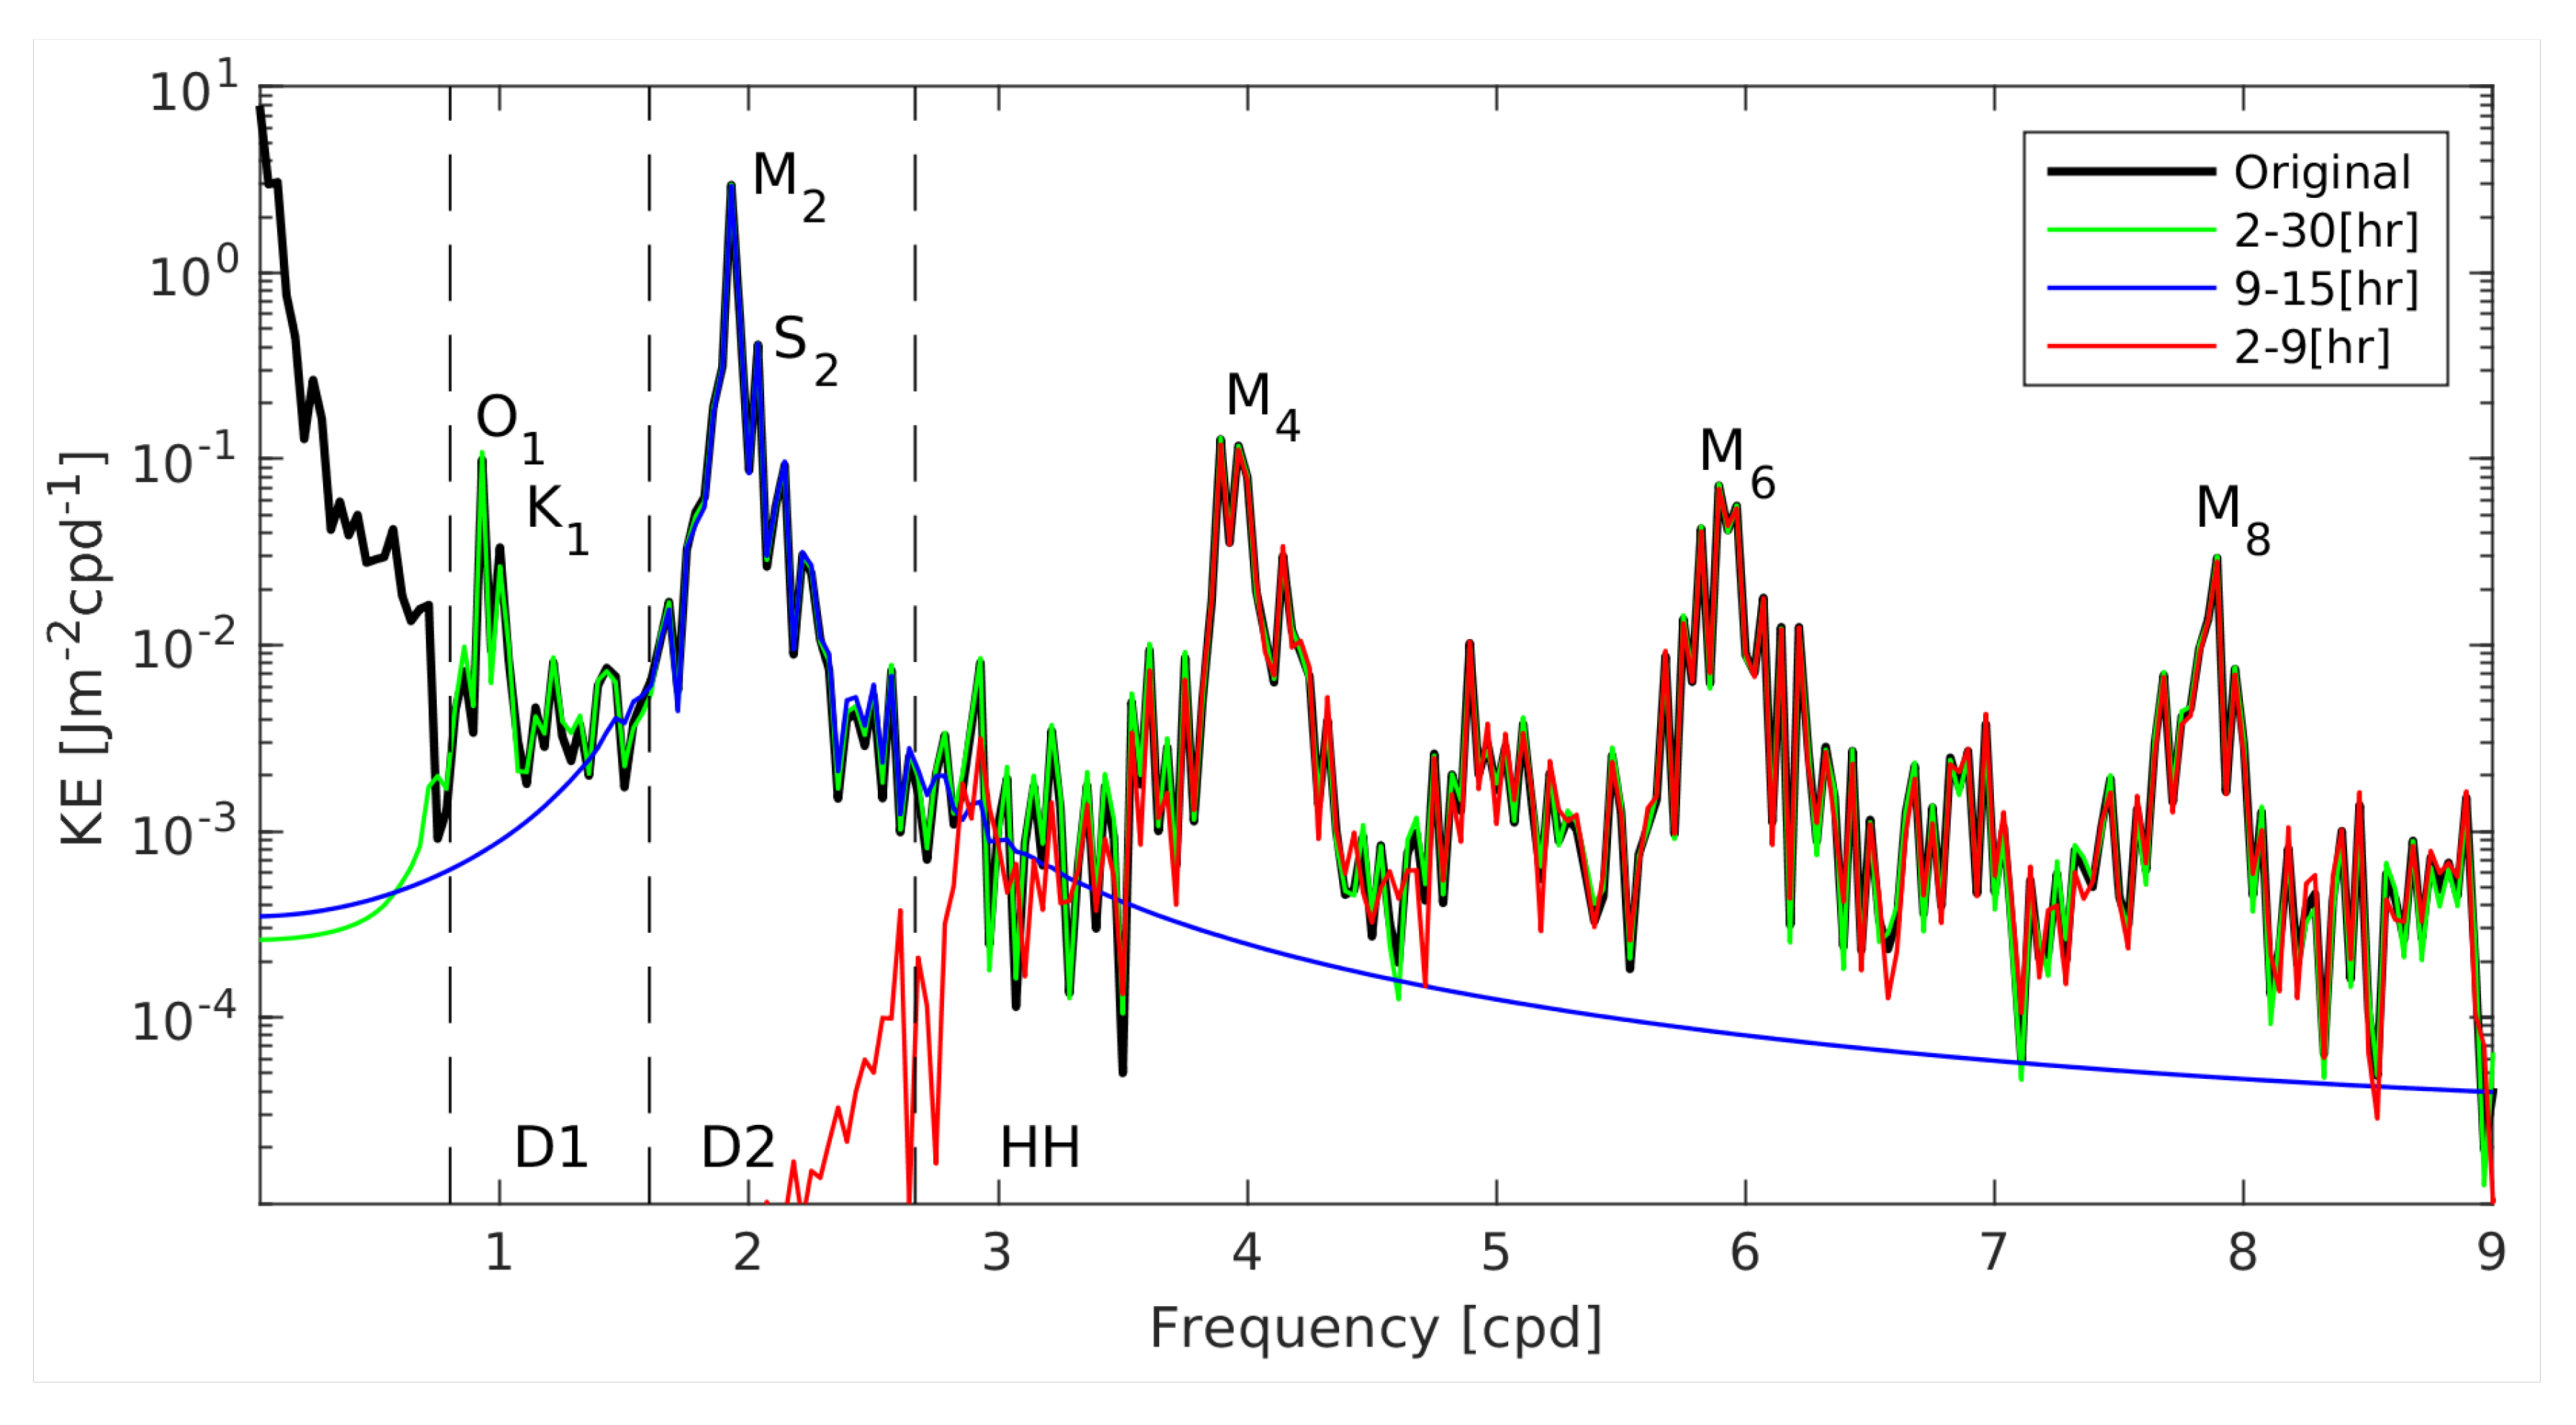
Figure 1. Kinetic energy spectra computed from HYCOM baroclinic velocity at the surface (black), and band-passed filtered with 2-30 hr (green), 9-15 hr (blue) and 2-9 hr (red) cutoff periods. The spectra is computed for the Amazon Shelf region at 45 W and 3 . 5 N.
Preprints 81996 g001
Figure 2. Time-mean and depth-integrated internal wave kinetic energy (Jm-2) at (a) diurnal (D1), (b) semidiurnal (D2) and (c) supertidal (HH) frequency bands. (d) The ratio of supertidal ( K E H H ) to total ( K E t o t ) energy as a percentage. Regions of interest are indicated by the green rectangles: (1) Bay of Bengal, (2) Luzon Strait, (3) Indonesian Archipelago, (4) West Pacific Islands, (5) French Polynesian Islands, (6) Amazon Shelf, and (7) Seychelles and Mascarene Ridge. The black contours mark seafloor depths at 0 and 250 m.
Preprints 81996 g002
Figure 3. Time-mean and depth-integrated horizontal energy flux magnitude (Wm-1) of the (a) tidal (9-30 hr band-pass) pressure flux, (b) supertidal (9 hr high-pass) pressure flux, (c) tidal (9-30 hr band-pass) advective flux, and (d) supertidal (9 hr high-pass) advective flux. The black contours mark seafloor depths at 0 and 250 m.
Preprints 81996 g003
Figure 4. Zonally integrated band-passed energetics for 1 bins, from 25 S to 25 N. (a) Kinetic energy (left axis) and the percentage of supertidal K E (right axis). (b) Barotropic to baroclinic energy conversion. (c) The residual, computed as the difference between conversion and flux divergence.
Preprints 81996 g004
Figure 5. Time-averaged and depth-integrated horizontal energy fluxes band-passed over (a) tidal and (b) supertidal frequencies at the Amazon Shelf. Thin white contour lines are plotted at 6, 12 and 14 kWm 1 for the tidal energy fluxes, and 2.5 and 3.5 kWm 1 for the supertidal energy fluxes. Black contour lines mark the 250, 1000, and 3500 m seafloor depths.
Preprints 81996 g005
Figure 6. Depth-integrated, time-mean, and bin-averaged tidal and supertidal energy budget terms along the main internal tide beam at the Amazon Shelf: (a) energy flux, (b) conversion, (c) flux divergence, and (d) residual. (e) The time-mean and depth-integrated supertidal energy flux divergence. The back rectangles indicate the bins over which the energy terms are averaged. The black curves are the 250, 1000, and 3500 m seafloor-depth contours.
Preprints 81996 g006
Figure 7. Snapshot of (a) 30-hr high-pass filtered steric sea surface height, (b) 30-hr high-pass filtered vertical velocity, and (c) higher-harmonic (9-hr high-passed) kinetic energy during an instance of internal tide steepening and solitary-like wave generation. The thick black line in (b) and (c) indicates the bottom bathymetry and the thin line in (c) indicates the pycnocline. The vertical scale used in (b) is different than in (c) to highlight the vertical velocity at depth and the kinetic energy near the surface, respectively.
Preprints 81996 g007
Figure 8. Snapshot of the normalized steric sea-surface height gradient along the northeast direction from HYCOM and superposed crests of solitary waves derived from SAR imagery as magenta lines. The thin black contours show the time-mean and depth-integrated supertidal energy flux at 2000 and 3500 Wm 1 . The thicker black contours mark the seafloor depths at 250 m, 1000 m, and 3500 m.
Preprints 81996 g008
Figure 9. (a, b) Colormaps of time-mean and depth-integrated supertidal energy fluxes in global HYCOM on a logarithmic scale compared with (b) observations of NLIW (blue dots) captured by 250-m resolution MODIS imagery. The green rectangles indicate regions of significant NLIW activity due to tides: (1) Bay of Bengal and Andaman Sea, (2) Luzon Strait, (3) the Indonesian Archipelago, (6) Amazon Shelf, and (7) Seychelles and Mascarene Ridge, and due to non-tidal sources: (8) the eastern Pacific and (9) the eastern Atlantic.
Preprints 81996 g009
Figure 10. Time-mean and depth-integrated nonlinear energy transfer at (a) the Bay of Bengal and Andaman Sea, (b) the Amazon Shelf, and (c) the Mascarene Ridge. The time-mean and (d,e,f) depth-integrated supertidal energy flux divergence, (g,h,i) surface tidal (D1+D2) kinetic energy, and (j,k,l) depth-integrated tidal (D1+D2) kinetic energy for the same three areas. The contour lines mark the 0, 250, 1000 and 3500 m sea-floor depths.
Preprints 81996 g010
Figure 11. Time-mean surface kinetic energy (Jm 3 ) for mode 1 at (a) the Bay of Bengal and Andaman Sea, (b) the Amazon Shelf, and (c) the Mascarene Ridge, (d,e,f) for mode 2 and (g,h,i) the sum of modes 1 and 2 for the same three areas. The contour lines mark the 0 m, 250 m, 1000 m and 3500 m sea-floor depths.
Preprints 81996 g011
Figure 12. The time-mean semidiurnal kinetic energy (Jm 3 ) along a vertical transect aligned with the Amazon Shelf beam computed for (a) mode 1, (b) mode 2 and (c) the superposition of mode 1 and 2 velocities. (d) The time-mean coarse-grained kinetic energy transfer. The thick and thin black lines mark the sea-floor and pycnocline depth, respectively.
Preprints 81996 g012
Figure 13. Hövmuller diagrams along the main internal tide beam at the Amazon Shelf of (a) nonlinear energy transfer to higher-harmonics, (b) semidiurnal surface kinetic energy computed from the sum of the mode 1 and 2 velocities, (c) surface density ( σ 1000 ), and (d) the variance of supertidal steric sea surface height. All variables are 30-hr low-pass filtered to highlight subtidal modulations over the 30-day period.
Preprints 81996 g013
Table 1. The comparison between the observed separation distance Δ S o as measured from the maps and the predicted separation distance Δ S = c 1 c 2 T c 1 c 2 . Δ S o is the mean over several successive patch separation distances in deep water. The M 2 mode 1 and 2 phase speeds and wavelengths are area averaged in deep water. The M 2 tidal period T = 12.417 hours.
area Δ S o [km] Δ S [km] c 1 [ms 1 ] c 2 [ms 1 ] L 1 [km] L 2 [km]
Bay of Bengal 216 210 2.79 1.75 125 78
Amazon Shelf 180 177 2.42 1.50 108 67
Mascarene Ridge 190 185 2.95 1.72 132 77
Disclaimer/Publisher’s Note: The statements, opinions and data contained in all publications are solely those of the individual author(s) and contributor(s) and not of MDPI and/or the editor(s). MDPI and/or the editor(s) disclaim responsibility for any injury to people or property resulting from any ideas, methods, instructions or products referred to in the content.
Copyright: This open access article is published under a Creative Commons CC BY 4.0 license, which permit the free download, distribution, and reuse, provided that the author and preprint are cited in any reuse.
Prerpints.org logo

Preprints.org is a free preprint server supported by MDPI in Basel, Switzerland.

Subscribe

© 2024 MDPI (Basel, Switzerland) unless otherwise stated