Preprint
Article

Application of Artificial Intelligence Technique and Multi-Objective Grasshopper Optimization Algorithm for Mine-to-Crusher Optimization in Surface Mines

Altmetrics

Downloads

192

Views

104

Comments

0

This version is not peer-reviewed

Submitted:

09 August 2023

Posted:

11 August 2023

You are already at the latest version

Alerts
Abstract
Blasting pattern optimization is an attempt to optimize blast design parameters aiming to achieve optimum fragmentation, reduce mining operating costs as well as environmental side consequences. The present study aims to propose a multi-objective optimization model, employing artificial intelligence and metaheuristics, to simultaneously minimize the mine-to-crusher operating costs and the impact of blasting consequences including fly-rock and back-break. To achieve the purpose of the study, a multi-variable regression model was developed to model total costs from drilling to crushing. In addition to the costs, multilayer perception neural networks were implemented to predict the blast-induced back-break and fly-rock as a function of collected variables such as number of holes, hole length, burden, spacing, hole slope, stemming, blasted rock per hole, powder factor, and charge per delay. High-precise estimations for both back-break and fly-rock were achieved with the average of 99% coefficient of determination for train, test and validation data sets. Then, the developed regression model and the neural networks were used in an optimization framework, employing Grasshopper algorithm, to find the optimum blast design satisfying practical constraints. The proposed model was tested on a lead-zinc open-pit mine, where 1032 blasting patterns were recorded and analyzed. The results of the optimization model provide a Pareto set of solutions, such that any of these solutions can be implemented according to the strategy of the mining operation management team. The blast pattern with the lowest cost, result in a relatively high fly-rock and back-break, while the pattern with low fly-rock and back-break raises the cost by 20.13 % compared the minimum cost blast design.
Keywords: 
Subject: Engineering  -   Mining and Mineral Processing

1. Introduction

The four primary operations in open-pit mining are drilling, blasting, loading, and hauling. The drilling and blasting operations initially fragment waste and ore rocks in production benches. Blast holes are drilled according to a pre-designed pattern, then charged with explosives and finally detonated. Shovels load the blasting fragments into trucks to be hauled to the waste dumps or crushers. If the blasting fragments are oversized (boulders), they must be re-broken into desired particles for loading and hauling [1].
Drilling and blasting are the principal stages, as the short-term production quality practically relies on the blasting pattern designed to obtain a suitable rock fragmentation. The distribution of blasted fragments is of particular importance because it highly affects downstream operations' efficiency and can significantly change the cost of comminution operations including crushers and milling. Therefore, optimizing the size distribution of the fragmented rocks in the blasting phase both contributes to the efficiency of downstream operations and improves the overall mine’s economy [2]. In addition, if the size of fragments is not commensurate with the equipment's bearing capacity, it reduces productivity and increases equipment maintenance and secondary blasting costs [3]. Muck pile shape and looseness also have a significant effect on diggability and loading operations. The improper shape of muck pile increases digging time and reduces the equipment efficiency [4]. On the other hand, having fine particles can cause overloading trucks and increase the cost associated with hauling fleet [3].
Crushing and grinding are the main comminution steps employed to crush the run of mine (ROM) ore to a pre-planned size. Various studies have proved that such comminution processes' efficiency and capacity are strongly influenced by the ROM fragmentation distribution, which is affected by the efficiency of the blasting operations [5]–[7]. Therefore, monitoring of fragmentation from blasting stage to milling is crucial and it has been known as Mine-to-Mill.
For more than two decades, researchers and mining companies have focused on fragmentation optimization regarding mine-to-mill considerations. Nielsen [8] was the first to study the relationship between mining operations and processing. He investigated the Sydvaranger taconite mine in Norway to analyze mining and processing works in mine and presented a technical and economic model for these operations. Nielsen [8] showed that operating efficiency and related costs could be optimized by integrating of mining and processing. This concept was first implemented by the Julius Kruttschnitt Mineral Research Centre (JKMRC), Australian Research Institute [9]. Kanchibotla et al. [10] studied and modeled fine particles and their effect on crushing and milling efficiency at the Cadia Hill gold mine in Australia. They presented an appropriate model for predicting fragmentation due to blasting and its effects on other stages of rock breakage (crushing and milling). In another research, Kanchibotla et al. [10] investigated the blast-induced rock fragmentation and its impact on the crushers and mills of the Porgera gold mine in Papua New Guinea (PNG). After implementing various blasting patterns, they concluded that increasing the specific charge in the blast phase and shrinking the crusher opening would increase the mill throughput by 15 – 20%. VanDelinder et al. [11] studied the effect of fragmentation due to blasting on crusher and autogenous milling performance at the Hibbing Taconite iron mine in northern Minnesota. Their research indicated that increasing the specific charge of blasting in practice increases the crusher's energy consumption. They resulted that with an increasing specific charge, fine particles increased, and energy consumption has decreased, which has a significant effect on mill productivity. Burger et al. [12] increased the capacity of semi-autogenous grinding (SAG) mill throughput by 10% using a mine-to-mill approach at Batu Hijau copper and gold porphyry deposit located in southwest Sumbawa in the province of Nusa Tenggara Barat, Indonesia. Their results showed that characteristics of the blast pattern and the explosives, as well as mechanical rock properties, have an important effect in determining the fragmentation resulting from the blasting. Workman [13] investigated the effect of blasting on optimal crushing and grinding, emphasizing energy reduction. They studied the effect of crushing and grinding feed particle size on its energy consumption. Their results indicated that the rock fragmentation due to mine blasting has a significant impact on the downstream operations, which can be analyzed through conventional methods. Herbst and Blust [14] studied fragmentation using video sampling to reach the "mine-to-mill" optimization and believe that video samples prepared from loads of mining trucks provide valuable insights into the performance of the mining-milling relationship. Jansen et al. [15] studied the mine-to-mill with an emphasis on radio-frequency identification (RFID) tracer technology to monitor the crushed material. Erkayaoglu and Dessureault [16] studied the mining-to-mill optimization using data mining approach. They stated that the analysis of data recorded in the long run through various mining operations such as blasting could improve the downstream processes.
It is been reported that only about 20% of the total energy of the charged explosives and detonation is used effectively, and the rest is wasted and appeared in forms of adverse consequences such as ground vibration, air overpressure, fly-rock, and back-break damages which produce severe problems in most cases [17], [18]. Besides the fragmentation described above, blasting has several adverse consequences. Having too much attention on fragmentation may yield costly and unpleasant outcomes. Although drilling and blasting are cheap compared to crushing and grinding, back-break and fly-rock can appear as results of dense drilling and blasting patterns. Therefore, any optimization that targets fragmentation, from the mine-to-mill point of view, must consider the other blasting consequences. Saghatforoush et al. [19] studied the Delkan iron mine to the prediction of to predict back-break and fly-rock due to bench blasting using integrated an evolutionary algorithm with an artificial neural network (ANN) and concluded that this approach is capable of predicting the blast-induced consequences. Monjezi et al. [20] predicted back-break and fly-rock by applying a multilayer perception neural network (MLPNN) and Genetic Algorithm in a copper mine and proved that the developed model has higher efficiency than the statistical methods.
Table 1 summarizes some of the blast-induced impact studies with their application. As it can be found, the impact of the blasting work in mine-to-mill optimization has been highlighted as a critical factor in most studies.
Table 1. Selected studies on prediction of environmental side effects.
Output References Year Technique R2
Back-break [21] 2008 ANN –
[22] 2009 ANN 0.9
[23] 2010 FIS 0.95
[20] 2012 GA-ANN 0.96
[24] 2013 SVM 0.92
[25] 2013 ANN 0.87
[26] 2013 ANN 0.86
[27]
[28]
2014 ANN, ANFIS ANN = 0.92
ANFIS=0.96
[29] 2015 GP 0.98
[29] 2016 ANN 0.77
[30] 2016 ANN-ABC 0.77
Fly-rock [20] 2011 ANN-GA ANN-GA=0.933
[31] 2012 GA-ANN 0.98
[32]
[33]
2012 ANN, SVM ANN = 0.85
SVM = 0.94
[34] 2012 MCs 0.834
[35] 2013 SVM 0.95
[36] 2014 ANN-PSO 0.93
[37] 2014 ANN 0.98
[38]
[19]
2014 ANN, FIS ANN=0.935
FIS=0.955
[39]
[40]
2015 ANN, ANFIS ANN=0.83
ANFIS=0.96
[41] 2016 ANN 0.97
[42] 2016 ANN-ACO 0.99
[2] 2016 MCs 0.855
[25] 2018 ANN-FA 0.93
[43] 2019 LMR 0.843
Rock fragmentation [44] 2009 FIS 0.96
[29] 2010 ANN 0.98
[45] 2011 ANN 0.97
[41] 2013 ANN 0.85
[21] 2013 ANFIS 0.83
[22]
[23]
2015 FIS, LMR FIS=0.922
LMR=0.738
[20] 2016 ANN-ABC 0.78
[24]
[25]
2016 RES, NLMR RES=0.866
NLMR=0.777
[26] 2018 ANN-FA 0.94
ANN: artificial neural network, FIS: fuzzy inference system, GA: genetic algorithm, SVM: support vector machine, ANFIS: adaptive neuro-fuzzy inference system, GP: genetic programming, ABC: artificial bee colony algorithm, MCs: Monte Carlo simulation, PSO: particle swarm optimization, ACO: ant colony optimization, GEP: gene expression programming, FA: firefly algorithm, LMR: linear multiple regression, NLMR: non-linear multiple regression, RES: rock engineering system.
In the current research, a cost model was developed to calculate the operating costs from drilling to crushing in a large-scale open-pit mine. This model includes the effect of fragmentation, loading, hauling, secondary blasting, and crushing. Then, multi-layer artificial neural network-based models were designed to predict fly-rock and back-break. Finally, a multi-objective optimization model was developed to simultaneously optimize total mine-to-crusher cost, back and fly rock. To solve the model, a Grasshopper Optimization Algorithm (GOA) was coded and used. This algorithm has salient advantages that make it a more successful algorithm compared to others [46]. This algorithm takes the advantages of a stable balance and transmission between exploitation and exploration (in solution space) as an appropriate adaptive process. The exploration ability indicates examining the various regions in the solution space for searching the global optimum. The exploitation ability indicates improving the intensity of the search in promising areas. Moreover, owing to the mentioned advantages, this algorithm can tackle the multi-objective search space's problems. A few number of studies have investigated the application of evolutionary techniques to solve the multi-objective optimization problems (MOP) in mining engineering [47]–[49].
The rest of this research is designed as follows: Section 2 explains the methodology of the research based on designed MLPNN and GOA. In Section 3, a lead-zinc surface mine is briefly investigated. Section 4 provides the results achieved based on the collected data sets, and the results are then interpreted, which is addressed by a conclusion in Section 5.

2. Research Methodology

In the current research, a multi-objective optimization model was applied to obtain the optimized blasting patterns considering mine-to-crusher costs, fly rock and back break. The developed model was applied on a data set from a real lead-zinc open-pit mine. As shown, the objective function of the model consists of a linear-regression model to calculate operating costs, and two ANN-based prediction models to predict fly-rock and back-break.

2.1. Multilayer Perception Neural Network (MLPNN)
ANNs as computational structures to solve difficult problems, are employed for different applications in various fields [1]. Simulated by the human brain's learning strength, ANN is included in the category of artificial intelligence methods. Structurally, ANN can implicate hidden layer(s) between the input and output layer [50], [51]. Among the different structures for ANNs, MLPNN has been commonly utilized [52].
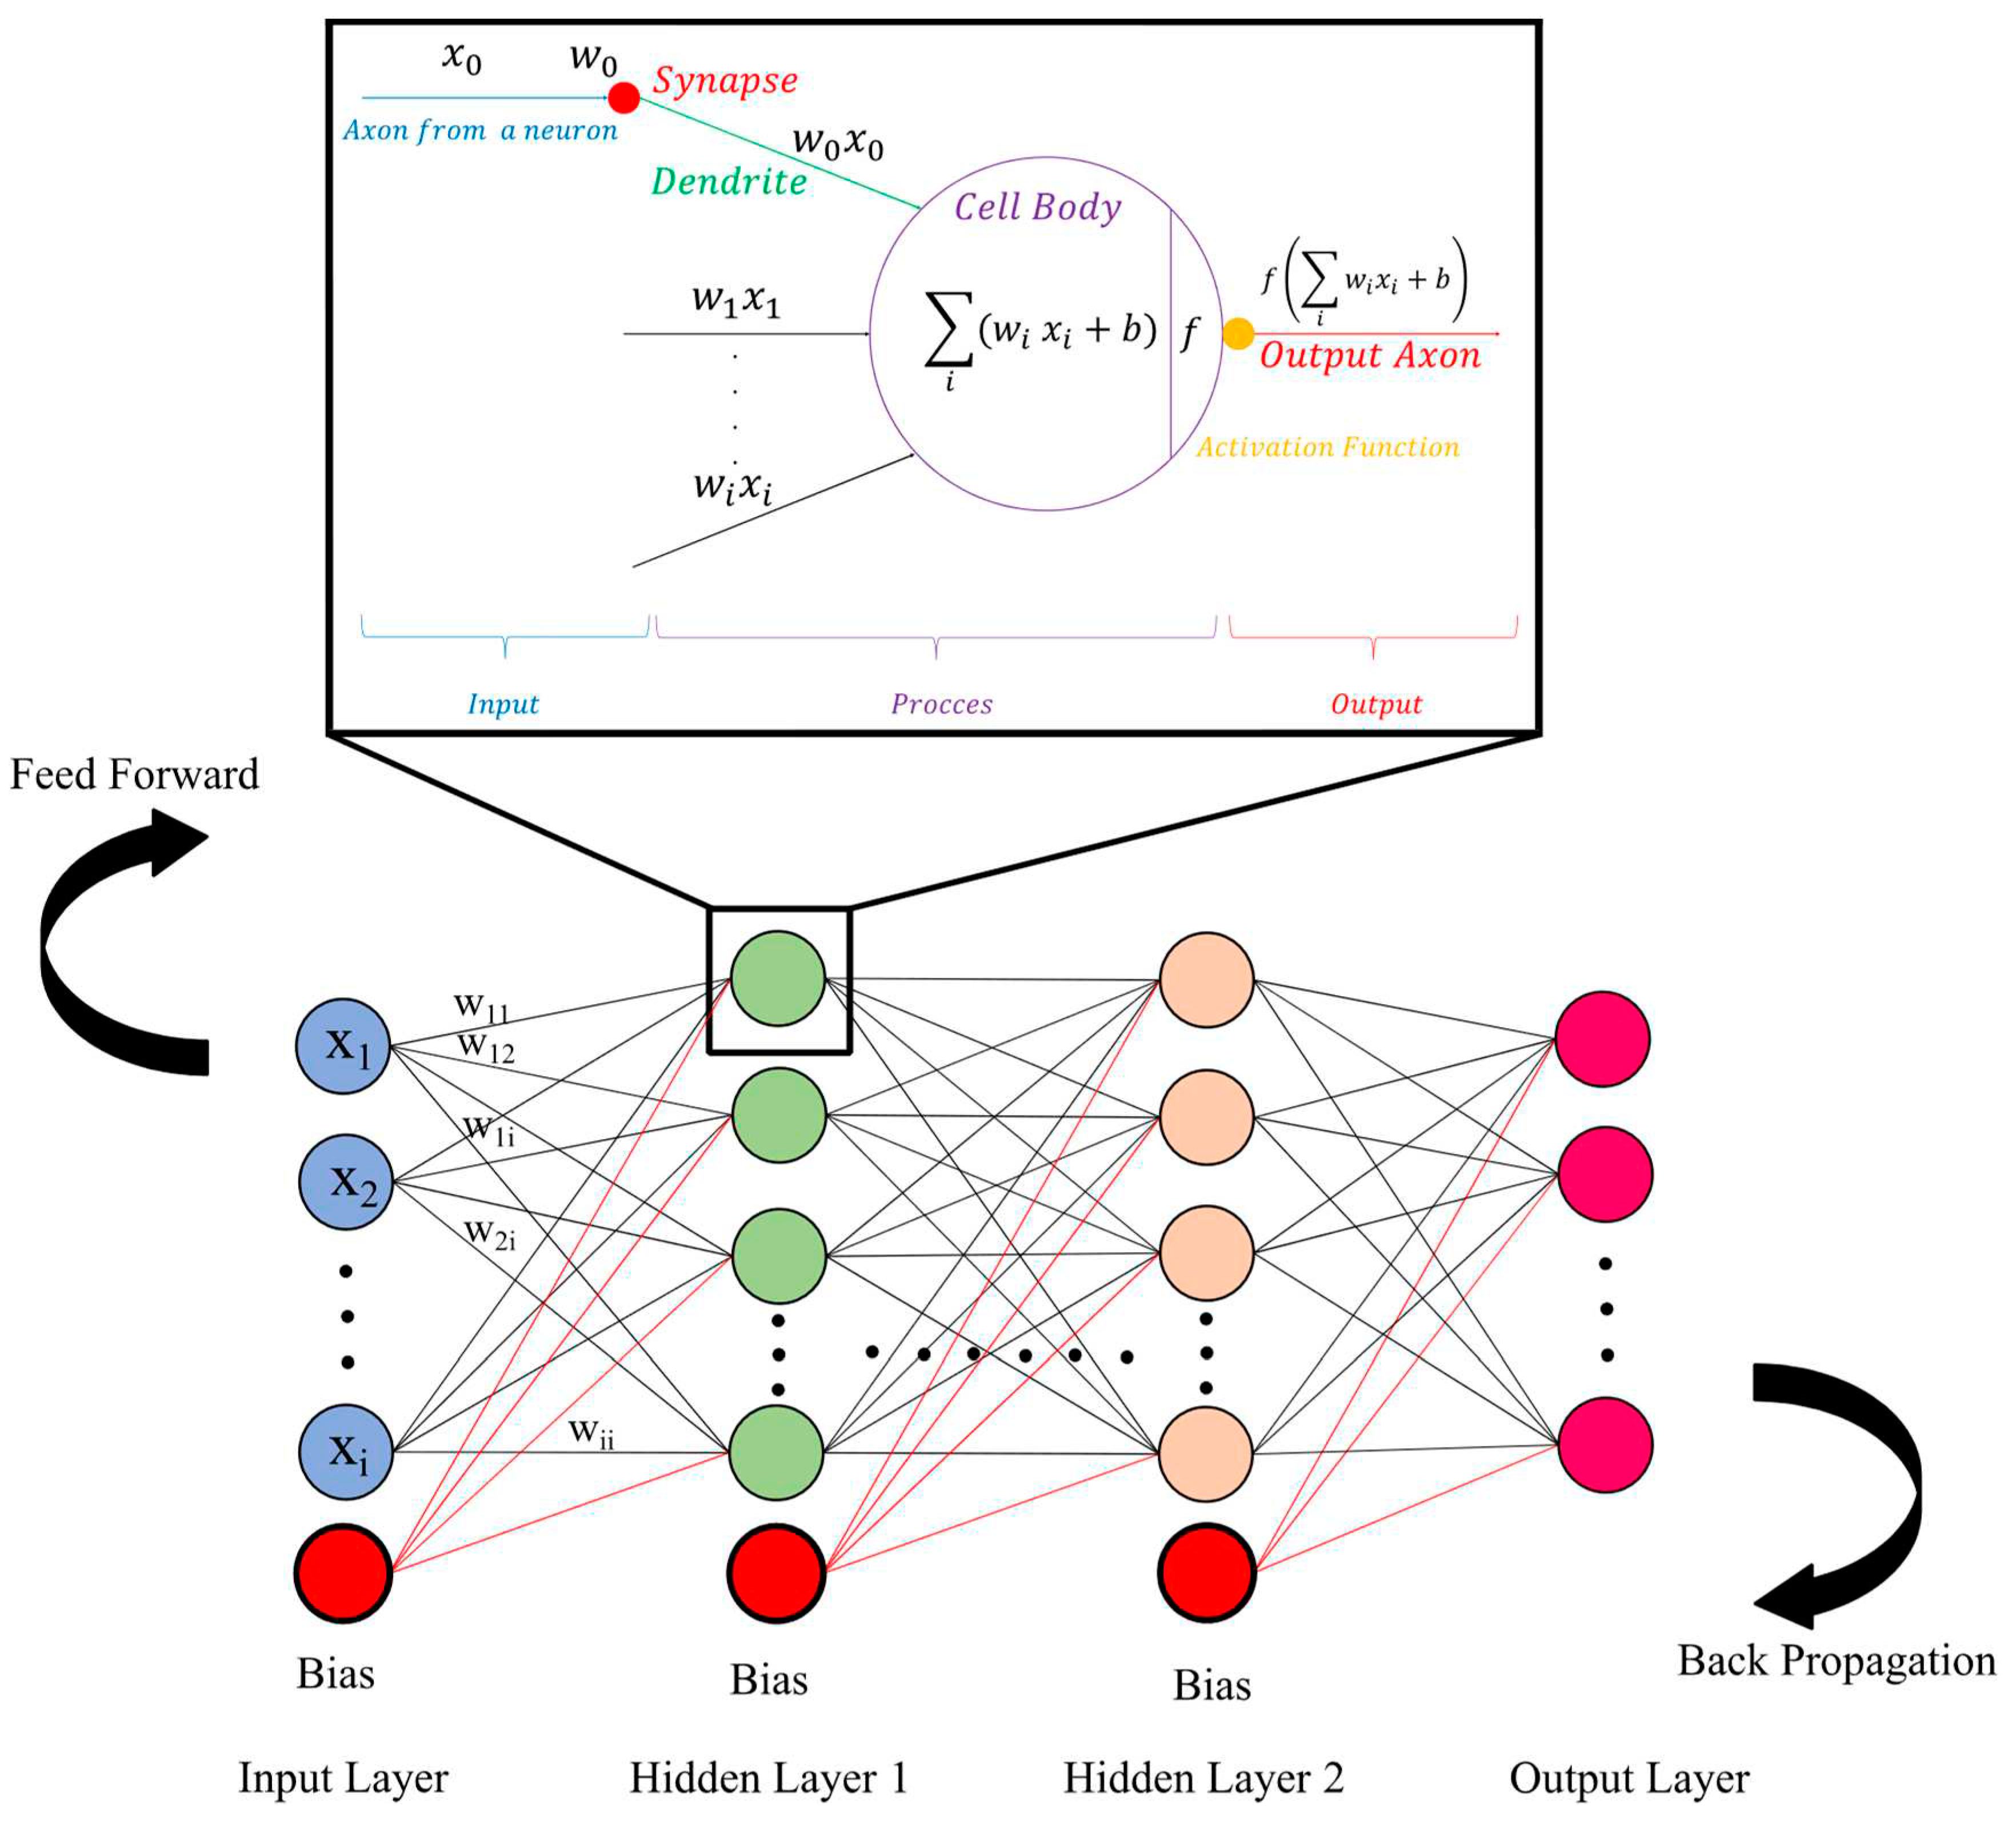
The fundamental elements of ANN are the artificial neurons (nodes) and their neural connections [53], which are mathematically simulated based on artificial neurons of the human brain. Figure 1 presents the general architecture of the neural networks and its operation. The MLPNN computation can be formulated as follows [1]:
Y i = f ( θ i + ∑ j = 1 n w i j ⋅ X j )
where Yi is the output variable, f is the transfer function, θi is the bias at the hidden layer, wij the connection weight between the input variable and the hidden layer, n is the number of neurons in the hidden layer, and Xj is the input variable.
Figure 1. Typical structure of the MLPNN.
Preprints 82054 g001
ANN should be trained to predict target(s). Firstly, the input neurons (independent variables) as neural signals are imported into the input layer. Then, ANN processes the information received from the input neurons and transmits them into the next computational steps (hidden layers). In the next step, the weights of the connections are processed to be applied in the hidden layer. Input neuron weights are calculated using transfer functions. The hidden neurons transmit signals to output layer nodes and actualize the prediction of the targeted output(s). An ANN model with an architecture of two hidden layers is capable to solve complex problems. Various algorithms may be employed in the process of ANN learning. Nevertheless, the feedforward backpropagation algorithm as the most efficient learning procedure is considered for this research.

2.2. Grasshopper Optimization Algorithm (GOA)
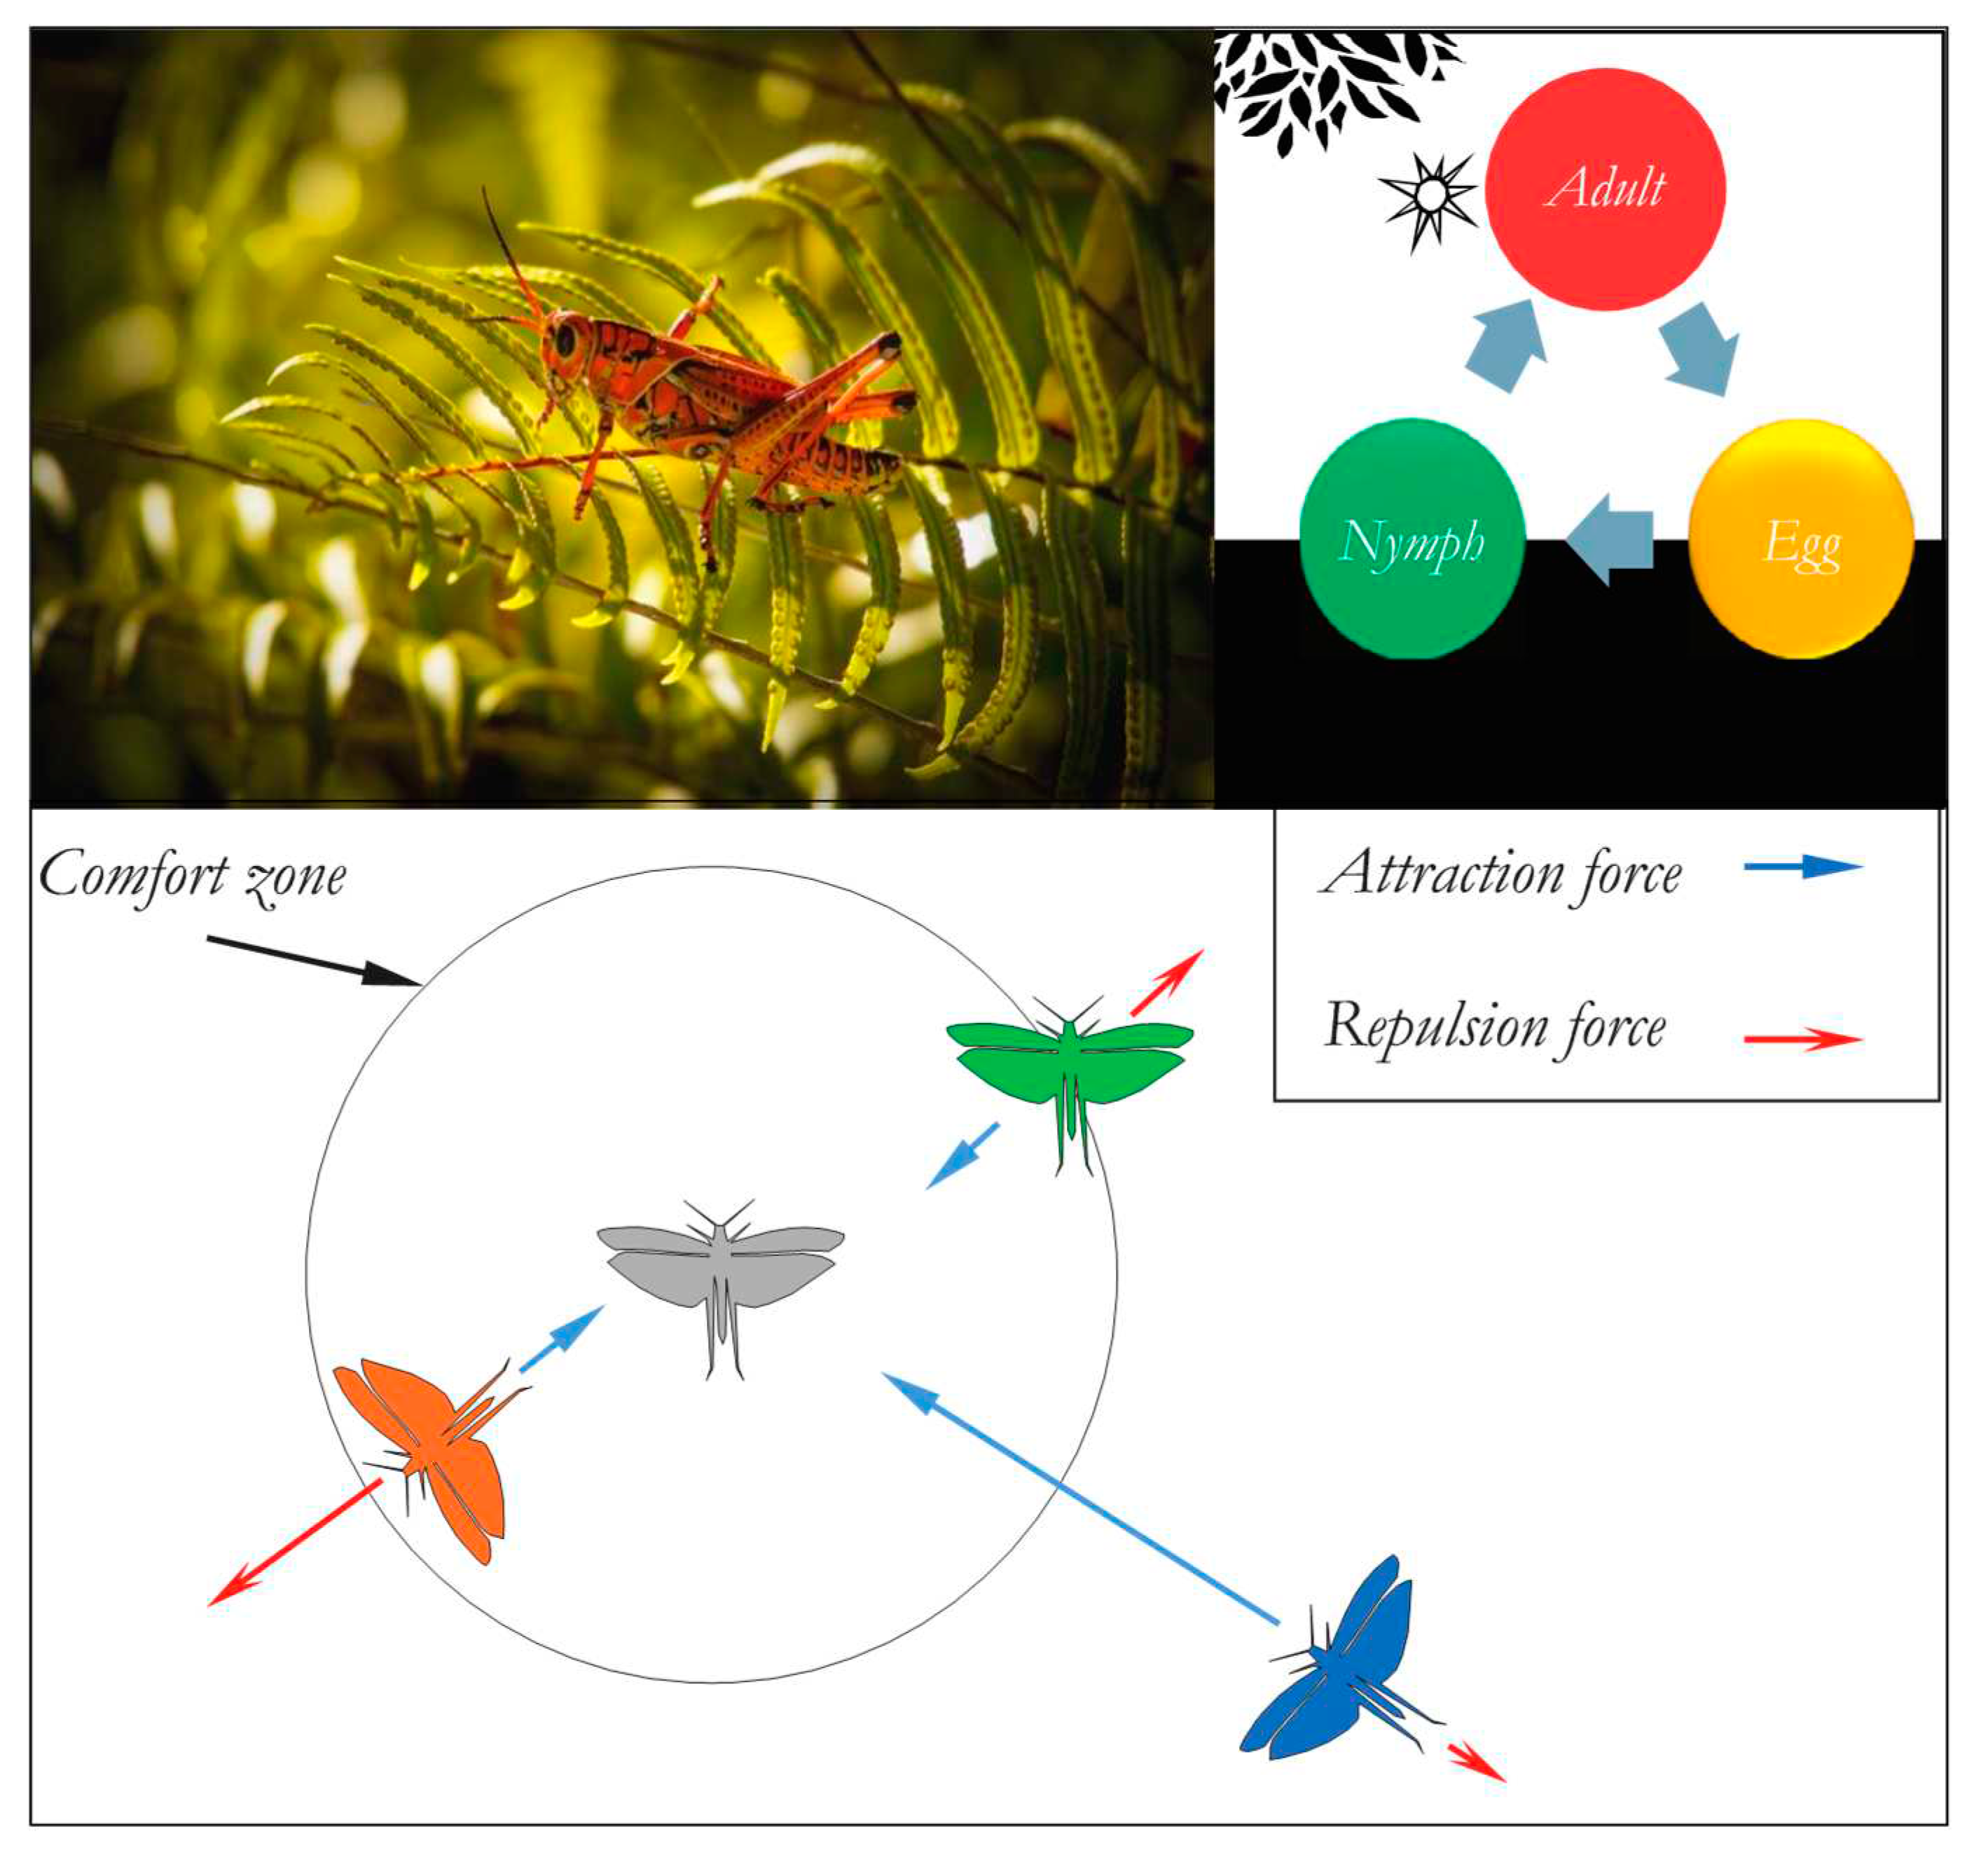
The GOA, as an evolutionary computation method, is a nature-inspired algorithm developed by imitating grasshoppers' swarming behavior while exploring food sources [54]. The algorithm's salient advantages include fast convergence capabilities, deep exploration, and the precision results. The principal feature of the grasshoppers' swarm is its behavior organized in adult and nymph. Swarms of larvae jump and treat similar to a tumbling cylinder. In this evolutionary algorithm, two-phase of exploration and exploitation are implemented similarly to other optimization algorithms. In the exploration phase, the search agents are employed to search the various areas in the solution space. Whereas, in the exploitation phase, the agents are encouraged to move nearby to improve the current obtained solutions.
Mathematically, the GOA simulates the motion of the grasshopper in the search space as follows [54]:
X i = S i + G i + A i
where Xi, Si, Gi, and Ai are swarming behavior in the search space (position of the ith grasshopper), the advantage of social interaction gained by the ith grasshopper, gravity force on ith grasshopper, and wind advection effects on the ith grasshopper, respectively.
The social interaction has principally operated as the main portion of grasshopper behavior approach, which can be computed by:
S i = ∑ j = 1 j ≠ i N s ( d i j )   d ^ i j
where, N indicates the total number of population (grasshopper), dij is the distance between ith and jth grasshoppers which can be calculated by d i j = x j − x i , d ^ i j indicates a unit vector from the ith grasshopper to the jth grasshopper calculated by d ^ i j = x j − x i d i j , and the strength of social forces (s) is determined by the following equation [54]:
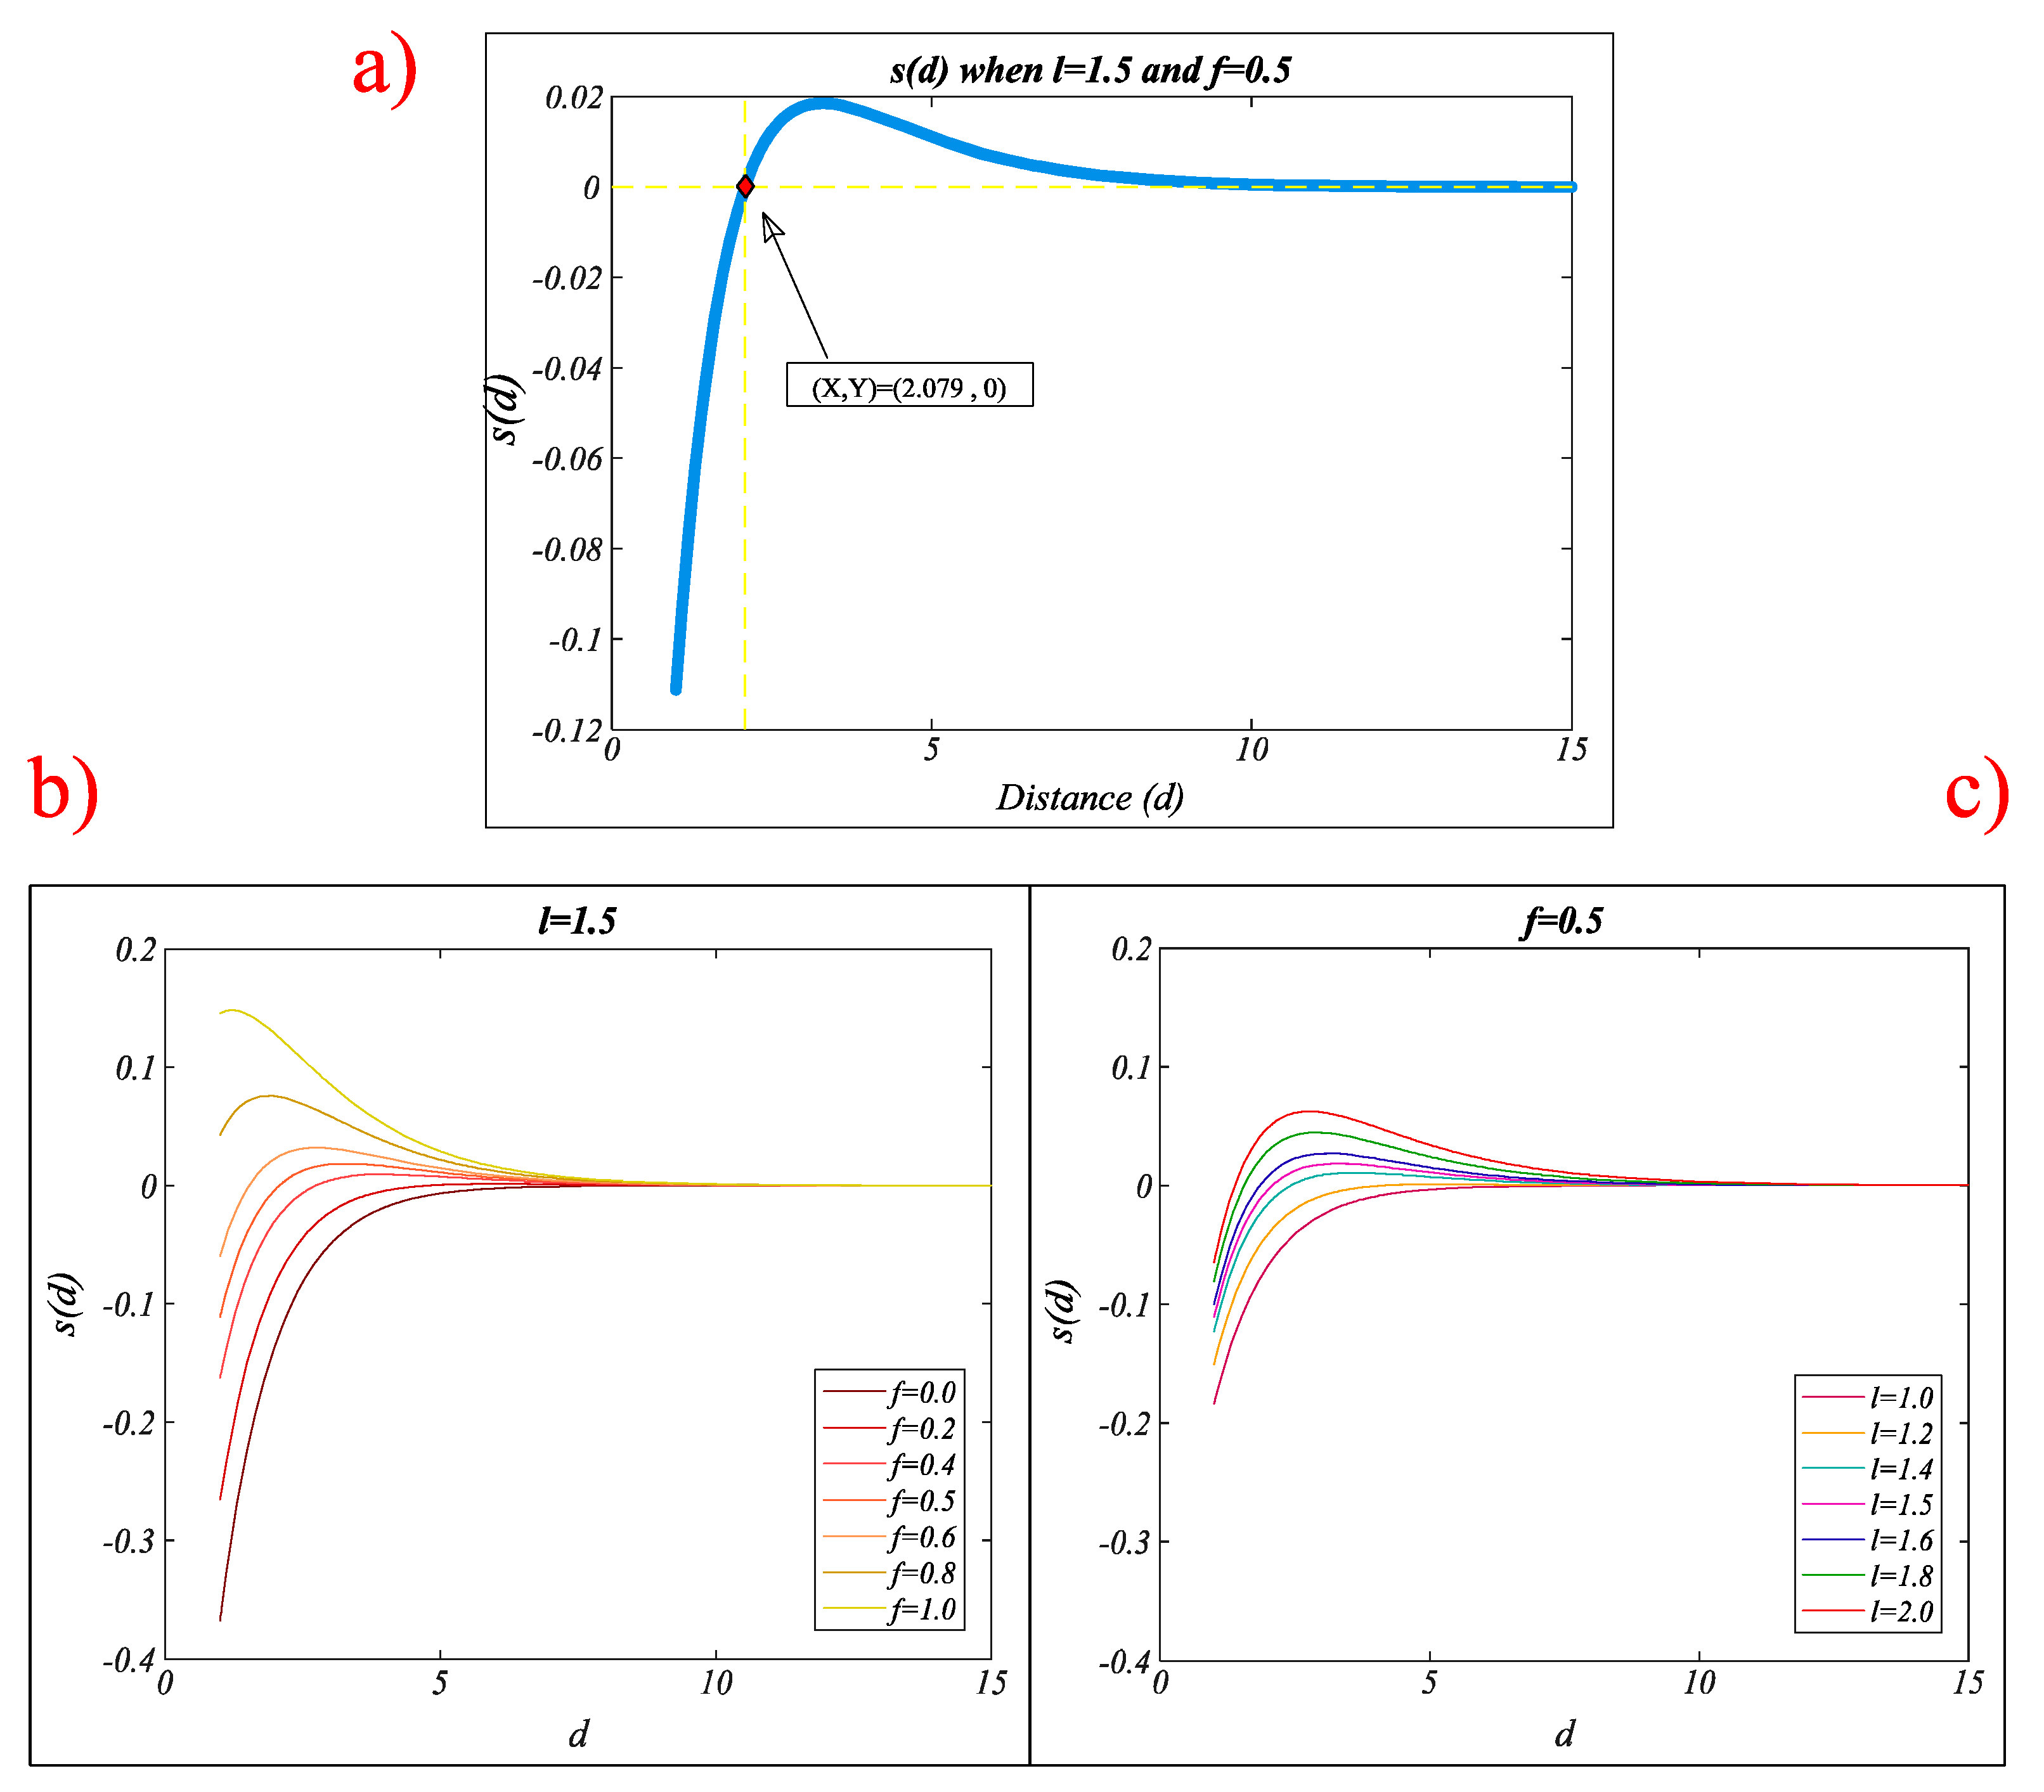
s ( r ) = f e − r l − e − r
where, f is the attraction intension and l is the attraction length scale. GOA includes three various regions, namely, comfort, repulsion, and attraction zones. Attraction intension and the attraction length affect the comfortable distance or comfort zone, which occurs in various social interactions in grasshopper’s social communication (see Figs. 2b and 2c). In this research, we have considered f = 0.5 and l = 1.5 as was proposed by Saremi et al. [54]. Notably, the function s separates the area between grasshoppers into the comfort zone, attraction, and repulsion regions. The interaction among grasshoppers regarding soothe region is schematically shown in Figure 3.
Figure 2. Function s for, a) l = 1.5 and f = 0.5, b) l = 1.5 and different f, c) f = 0.5 and different l [54].
Preprints 82054 g002
Figure 3. Individual’s adaptive communication in grasshoppers artificial [54].
Preprints 82054 g003
The second component in Eq. (2), (Gi) is computed as follows:
G i = − g e ^ g
where e ^ g is a unit vector toward the center of earth and g represents the gravitational constant.
Ai component in Eq. (2) is calculated as follows:
A i = u e ^ w
where e ^ w is the unity vector in the wind direction and u is wander coefficient.
Substituting the triple components in Eq. (2):
X i = ∑ j = 1 j ≠ i N s ( | x j − x i | ) x j − x i d i j − g e ^ g + u e ^ w
It should be noted, the Xi is not applied in grasshopper’s optimization and simulation. This is because swarm immediately attain their comfort region; Therefore, the individuals do not experience converge to the optimal solution, and exploration and extraction are not carried out to achieve a precise estimation of global optimum. Particular modifications were added to the abovementioned equation to solve this problem [54].
X i = c ( ∑ j = 1 j ≠ i N c u b d − l b d 2 s ( | x j d − x i d | ) x j − x i d i j ) + T ^ d
where ubd and lbd indicates the upper and lower bounds, respectively, in the dth dimension. Also, T ^ d represents target value of dth dimension. c represents decreasing factor to shrink the soothe region, repulsion and attraction zones.
The aim of utilizing parameter c   is to decline the exploration and intensify the exploitation and is defined by:
c = c m a x − t c m a x − c m i n t m a x
where cmax and cmin represent the maximum and minimum values of c ; t, and tmax, are the current iteration, and the maximum number of iterations, respectively. In this research, the values of cmax and cmin were set as 0.95 and 2e-6, respectively.

3. Case Study: Anguran Lead-Zinc Mine
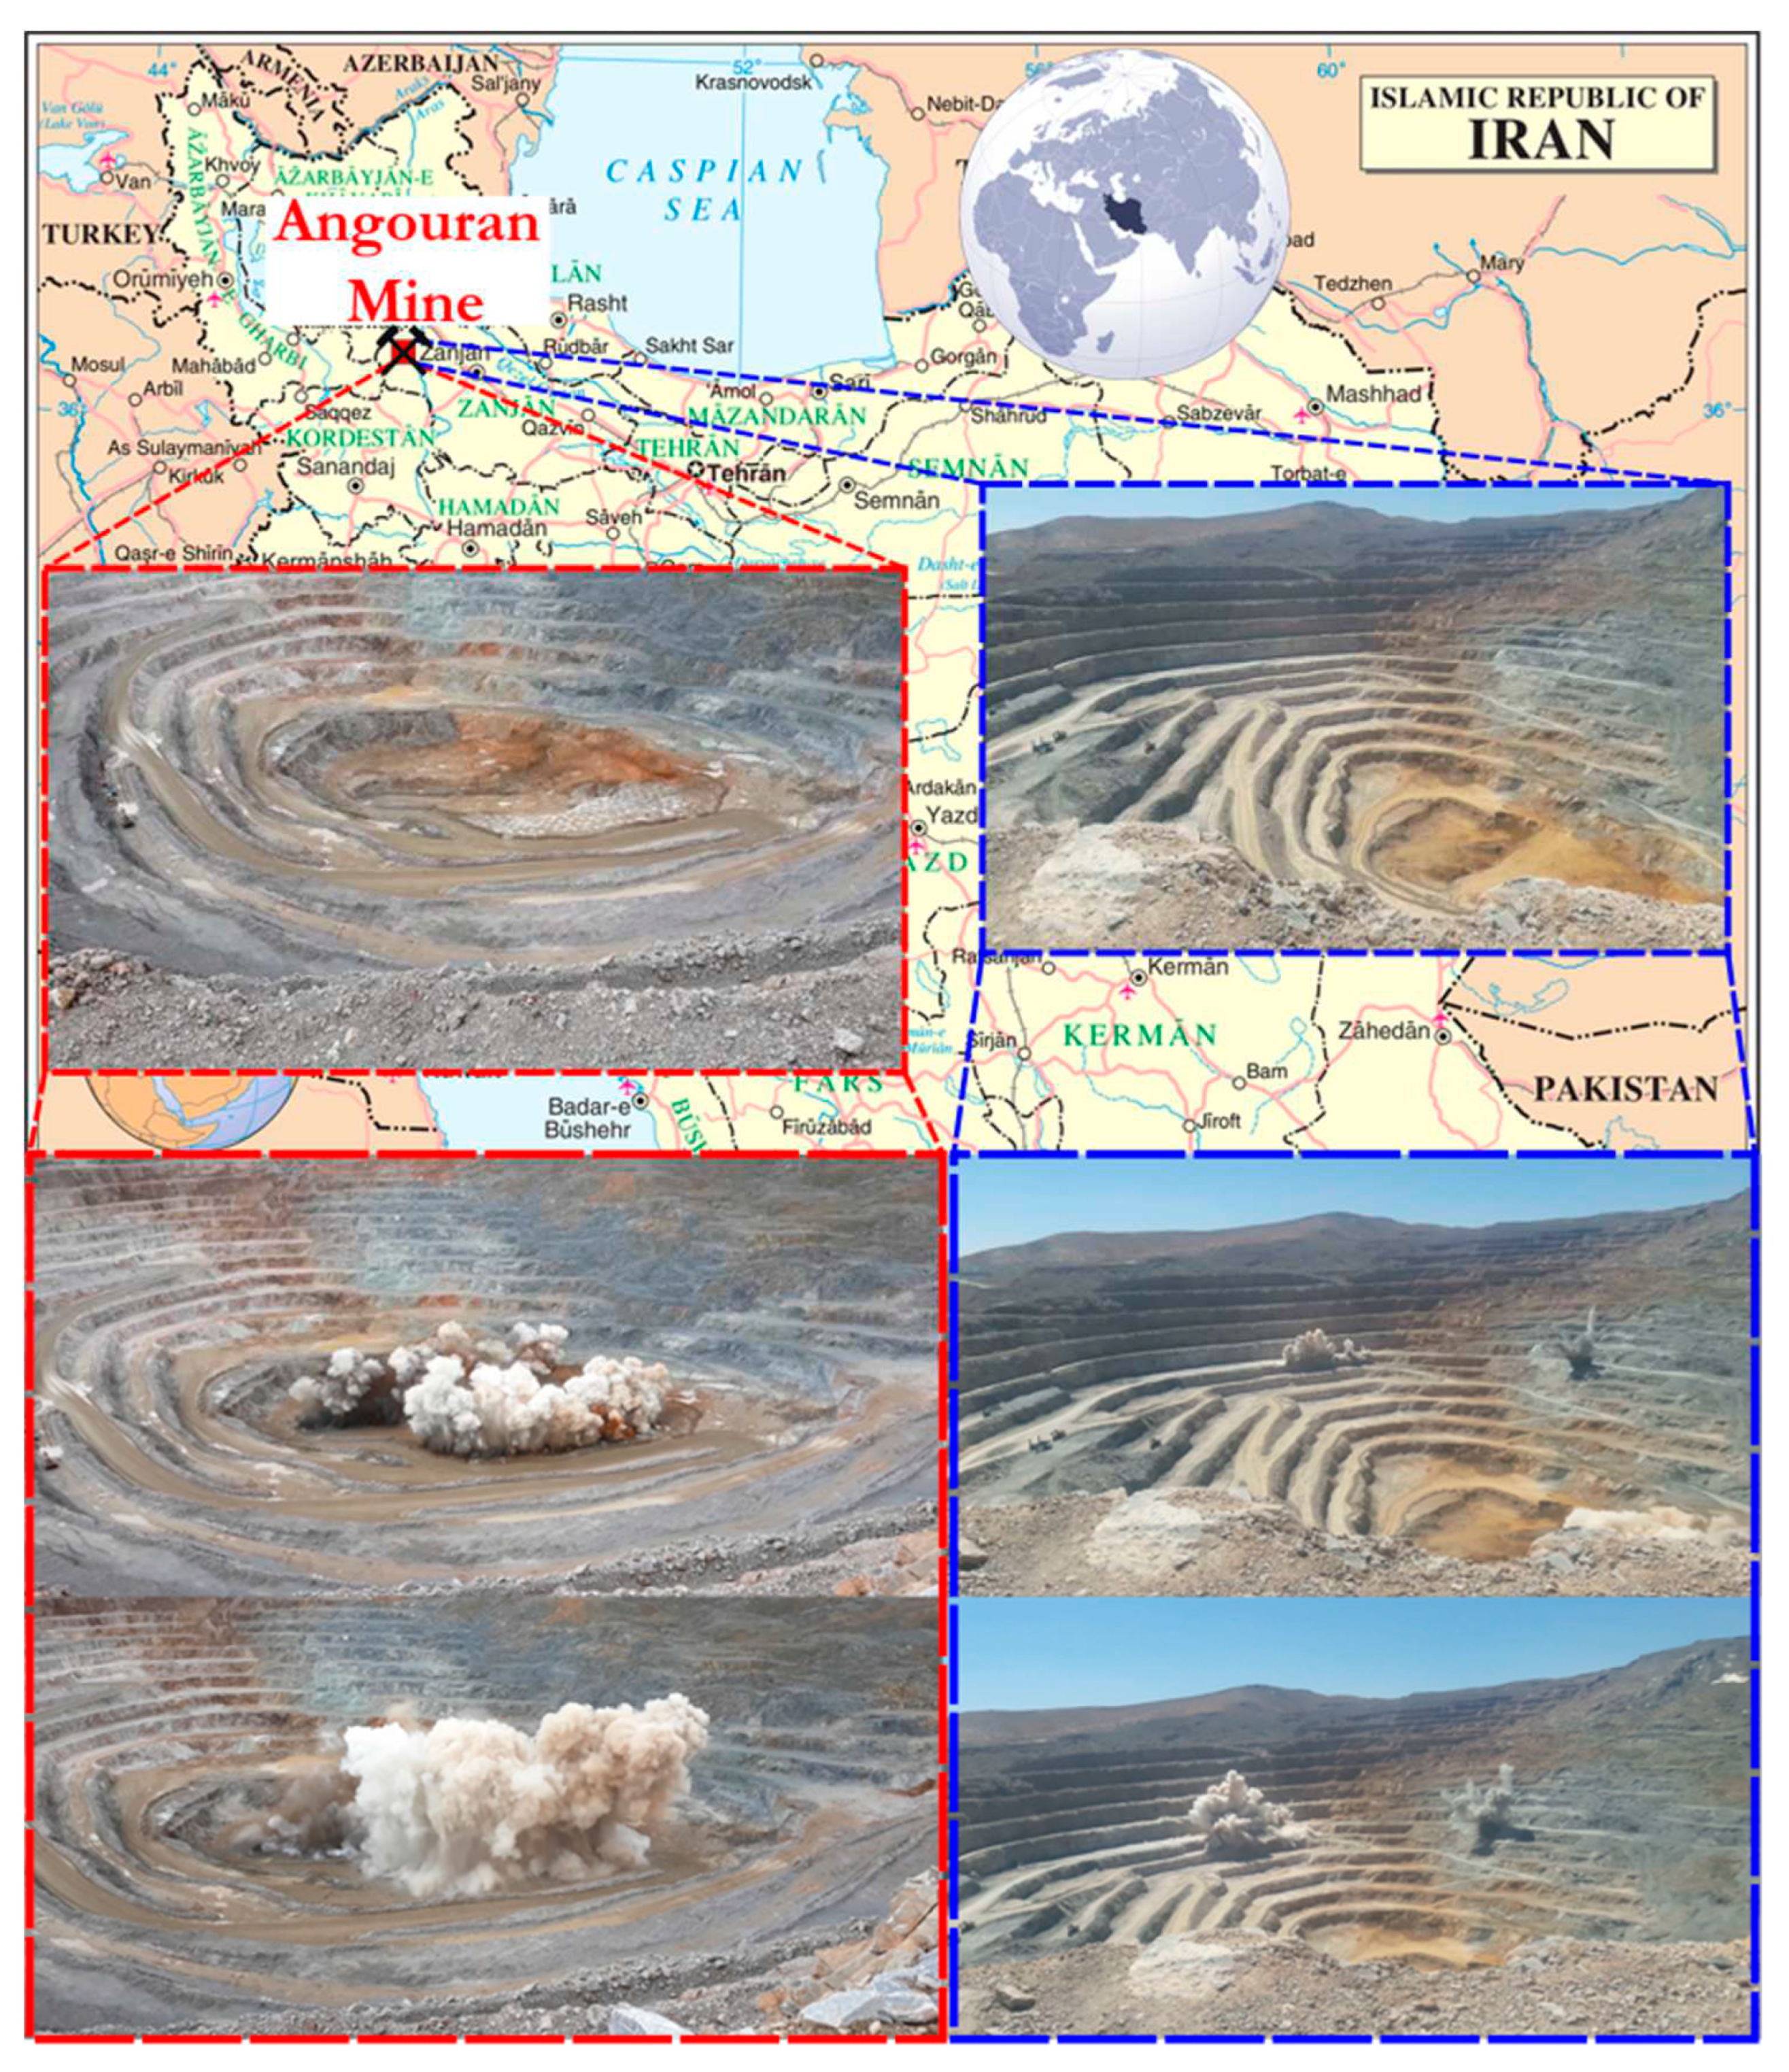
In this study, required data was collected from Anguran mine, a large-scale lead-zinc mine. This mine is located 135 km southwest of Zanjan province, Iran, at 47°82'00''E longitude and 36°84'00''N latitude, at an altitude of 2,950 m above sea level (Figure 4). The Anguran open-pit mine is one of the largest and oldest Pb-Zn mines in the Middle East with an annual extraction rate of one million tons, and has been exploited since 1940. This mine is located in the Oroumieh-Poldokhtar zone and continues to the central Iranian district [29].
Figure 4. Location map of Anguran mine and two snapshots of blasting rounds.
Preprints 82054 g004
Blasting rounds are performed through blast holes of 76, 114 and 127 mm diameters, explosive material of ANFO (combine fuel oil and ammonium nitrate with a specific gravity of 0.85–0.95 gr/cm3), inclined blast holes, and a delay timing of five milliseconds. The blast-induced large fragmented rocks (boulders) are the most common problems affecting other downstream blasting operations at the Anguran mine. The secondary blasting is carried out to crush boulders and turn them into smaller and more portable pieces. Moreover, fly-rock and back-break, as two main blasting consequences, occur mainly in the mine, disrupting other operations. Therefore, fly-rock and back-break were considered as adverse consequences of the blasting, where the damages are influenced by rock properties and the design of blasting pattern. The influential parameters on these consequences were picked from internationally published studies available in the literature. These parameters are tabulated in Table 1.
Table 1. Most influential parameters affecting fly-rock and back-break.
Target Effective Parameters
Back-break Hole length, Burden, Spacing, Stemming, Charge per delay
Fly-rock Hole length, Burden, Spacing, Stemming, Charge per delay, Hole slope
To measure the back-break, a tape measure was used, and after each blasting round, the distance between the last crack and the crest of the bench was determined. The fly-rock is more challenging to measure; therefore, part of the bench was painted before carrying out the blasting operation, and a video was taken of the blasting. The exact location of the fragment rocks was determined using video and the distance from the face was measured.
Table 2 represents descriptive statistics of the effective parameters (input variables) and targets (output variables) and their ranges. To achieve acceptable results, a dataset of 1032 blasting rounds recorded over four years, was used.

4. Results and Discussions

The proposed optimization framework was tested using the data set of the Anguran mine. The results are discussed below.

4.1. Regression-Based Mine-to-Crusher Cost Model

Minimizing the operating cost from blasting to the crusher is the most important objective, compare to fly-rock and back-break, because all industrial activities seek to reduce operating costs. For the sake of this goal, the cost of any feasible pattern in the Anguran mine should be calculated. Thus, a multi-variable linear regression analysis was developed to develop a model for the total operating costs.
In this paper, the total cost (TC) includes the costs of drilling, blasting, bench cleaning, loading, hauling, crushing, loader working, hydraulic hammer, secondary blasting, additional secondary crushing and the cost of compensating adverse consequences. Descriptive statistics of costs are summarized in Table 3.
The input variables for modeling the costs are L, B, S, HA, St, BRH, Pf, CD, described in Table 2. The regression model is presented in Table 4, which shows that all input variables are significant. None of the variance inflation factors (VIF) is more than five to be removed from the model. The results show that about 95% of the variation in operating cost (from blasting to crushing) can be explained by the proposed regression model. The obtained regression model is formulated as Eq. (10).
Preprints 82054 i002

4.2. ANN-Based Model for Predicting the Back-Break and Fly-Rock

Since the two phenomena of fly-rock and back-break are common problems in Anguran mine, ANN-based prediction functions were developed to be used in the objective function of the optimization model. To obtain the best MLPNN model with high performance and estimate fly-rock and back-break accurately, various structures have been constructed and trained with the different training algorithms (including Levenberg-Marquardt, One-Step Secant, Scaled Conjugate Gradient, and Gradient Descent with Momentum and Adaptive Learning Rate), transfer functions such as TANSIG, PURELIN, LOGSIG, and a different number of hidden neurons.
R2 and RMSE indices were calculated for training, testing, and validation and the best structure was selected out of all networks using a method presented by Zorlu et al. [55]. A summary of networks run for back-break and fly-rock is tabulated in Table 5 and Table 6. Among 30 trained networks, structure #18 and structure #20 with the top score of 175 and 174 (out of 180) were selected as the optimal network for back-break and fly-rock, respectively. Network #18 as the optimal back-break model consists of two hidden layers containing six and 11 neurons in the first and second hidden layers. The activation functions of all three layers are Tansig. Whereas network #20 as the optimal fly-rock model has two hidden layers with five and seven neurons in the first and second hidden layers, and the activation functions of layers are Tansig.
The best-designed architectures by Matlab software are shown in Figures 5 and 6. As seen, R2 of the optimal model of back-break and fly-rock is equal to (0.999, 0.996, and 0.998) and (0.993, 0.989, and 0.986) for training, testing, and validating categories, respectively, which confirms the high accuracy of prediction.

4.3. Optimization of the Blasting Pattern
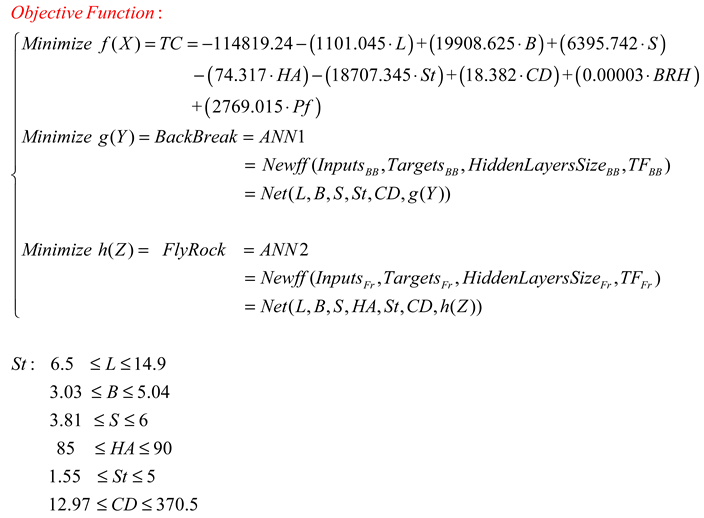
The developed multi-objective optimization problem (MOP) was implemented to minimize operating costs, fly-rock, and back-break simultaneously considering triple objective functions developed accurately. In this study, the high-speed evolutionary method named the multi-objective grasshopper optimization algorithm (MOGOA), was used for solving the proposed model at an agreeable time using MATLAB software. The conceptual model of multi-objective optimization is as follows:
Preprints 82054 i001
As seen, there are three objective functions; f(X) is the objective function related to the mine-to-crusher costs, g(Y) and h(Z) are the objective functions related to the back-break and fly-rock, respectively. The main GOA parameters are: population size = 85; cmin = 0.95; and cmax = 2e-6 and the initial population was generated randomly.
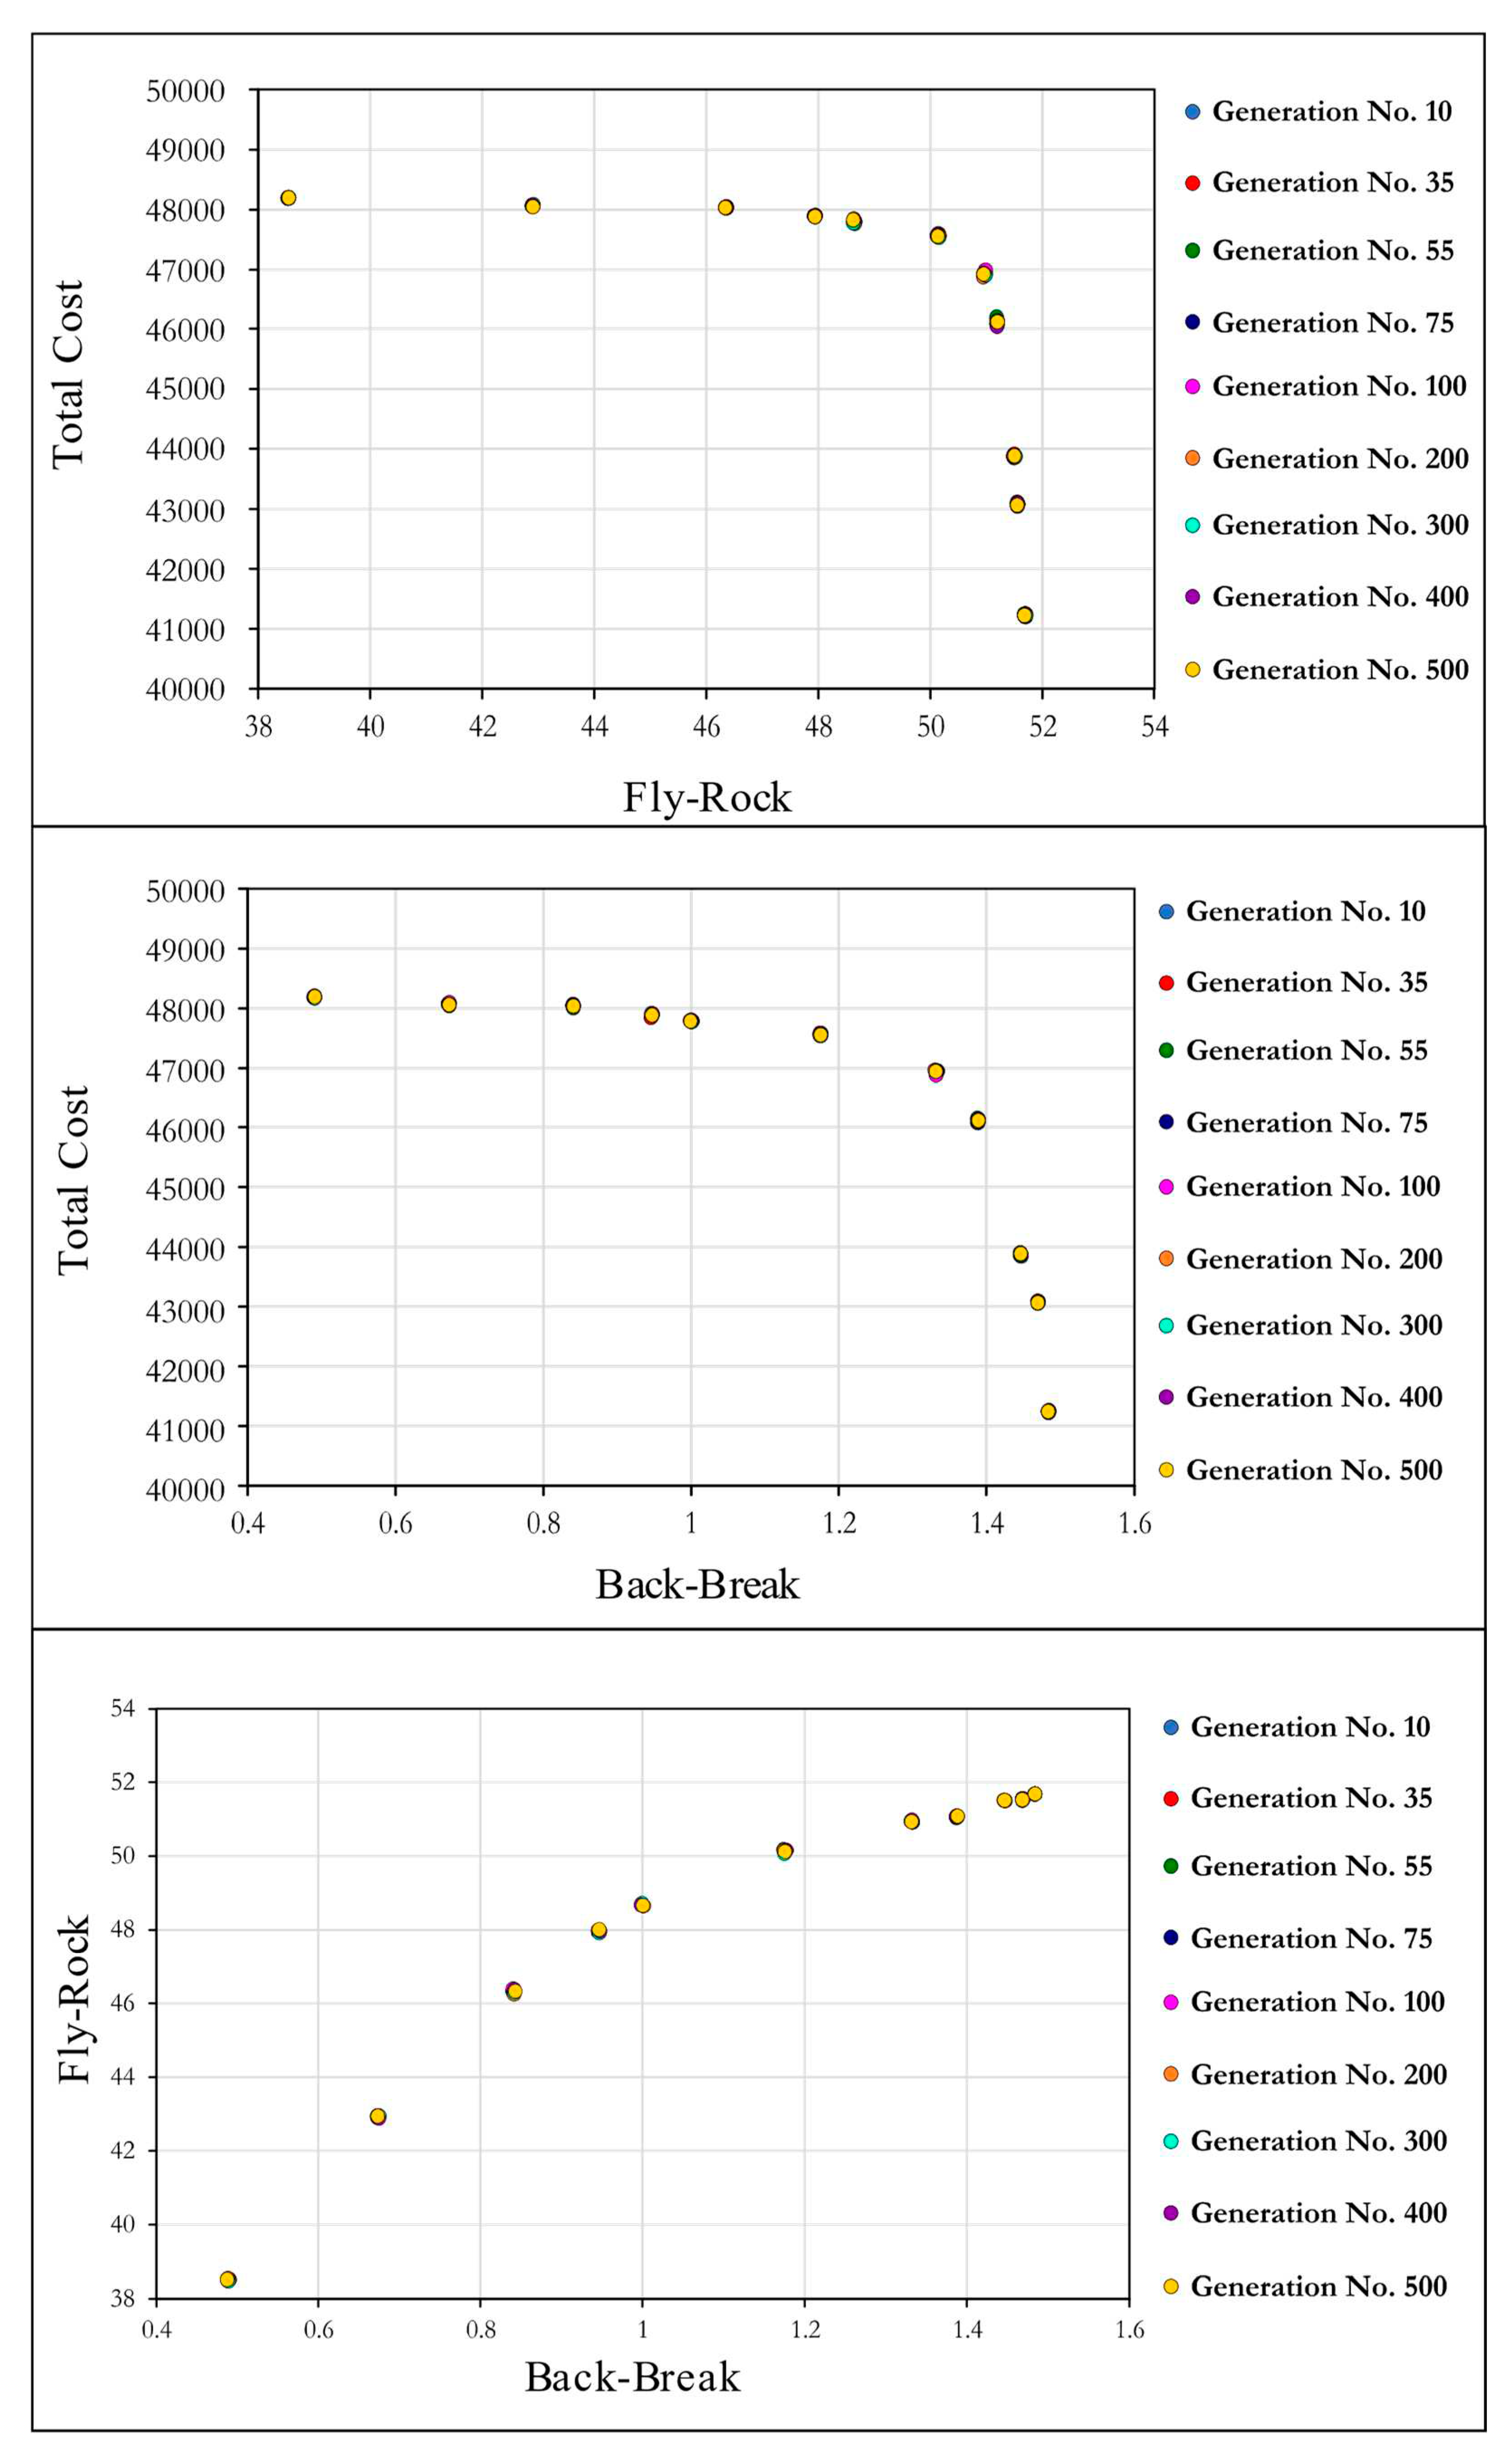
The algorithm was implemented with different initial generations from 10 to 500. The Pareto fronts (PF) resulting from the various generations in MOGOA are illustrated in Figure 7. In multi-objective optimization, there may not be one global optimum solution. Instead, a set of non-dominant solutions can be found, such that any of these solutions can be the best solution according to the decision maker’s opinion. A non-dominant solution is a solution that is not worse than other solutions in all objectives and it is better than other solutions in at least one objective. The Pareto set of non-dominant solutions for the case study of this research is presented in Table 7.
Figure 7. The Optimal Front resulted from the various generations in MOGOA.
Preprints 82054 g005
According to the obtained results, 11 non-dominant blasting patterns for Anguran mine were presented (Table 8), where any of those can be one solution to the problem, and the mine engineers select and perform one according to mine’s need and purpose. For example, the mine may consider implementing a pattern with the minimum costs, then model #1 is the best pattern, while still back break and fly-rock are satisfactory.
Optimizing the blasting pattern in order to reduce mining costs, especially in Anguran mine, which has a significant extraction tonnage, has a considerable role in the economic cycle of the country. Therefore, the most effective and efficient solution should be adopted to reduce the mining costs by spending less money. In this regard, we obtained 11 non-dominant blasting patterns that simultaneously reduce the mining costs and environmental side effects due to mine blasting. As can be seen in Table 7, blasting pattern #11 created the minimum value of fly-rock and back-break by 38.53 m (reduction of 67%) and 0.49 m (reduction of 25%), respectively. This pattern is an environmentally friendly policy due to the significant reduction of undesirable environmental effects induced by mine blasting. However, this model is unprofitable for the project because it requires an investment of 49,442.78 $ per blast to reach a usable product. In fact, pattern #11 increase mine to crusher costs by approximately 20%, which is a considerable money. Reciprocally, blasting pattern #1 is the most economical policy for the mining operation with the cost of 41157.28 $ per blast. In constant, the maximum values of fly-rock and back-break are generated by pattern #1. Hence, this pattern is not in accordance with environment-friendly policies. Noteworthy, the maximum value of BRH is related to pattern #11 as shown in Table 8. This means that this pattern can be used to increase the crushing feed and the supply processing plant feed and supply cycle can be established when faced with the reduction of fragmented materials.

5. Conclusions

This research focuses on minimizing mine-to-crusher costs as well as consequences induced by blasting operations. To this aim, Anguran lead-zinc mine in Iran was studied and blasting data of 1032 rounds were collected. Besides, two main and problematic blasting consequences, fly-rock and back-break, were measured for each blasted pattern. Regarding the literature review and also collected data from the mine, burden, hole length, spacing, stemming, hole slope, and charge per delay were selected as input parameters to predict back-break and fly-rock by employing MLPNN. A network architecture with two hidden layers was the best MLPNN structure in estimating back-break with R2 of 0.9989, 0.9936 and 0.9979 for training, validating and testing data sets. For the fly-rock network, R2 of 0.9868, 0.9788 and 0.9728 were achieved for back-break data sets on the selected data sets for training, validating and testing, respectively. In addition, an MLR model resulted in accurate performance in predicting the mine-to-crusher costs with R2 of 0.9535. Afterward, blasting pattern parameters were optimized by implementing MOGOA algorithm. Eventually, a Pareto set of solutions including 11 non-dominant patterns was obtained. It should be noted that the explosive patterns will be affected by the geomechanical properties of the rocks. Therefore, it is suggested that in future work, parameters such as rock quality index, uniaxial compressive and tensile strength, joints, and blastability index includes in the model, and extend the proposed model to include milling operation.

Author Contributions

Conceptualization, S.H., M.M., methodology, S.H., software, S.H., validation, S.H., formal analysis, S.H., M.M., data curation S.H., writing—original draft preparation, S.H., writing—review and editing, S.H., M.M., supervision, M.M. All authors have read and agreed to the published version of the manuscript.

Funding

This research received no external funding.

Data Availability Statement

Data is available upon resendable request.

Conflicts of Interest

The authors declare no conflict of interest.

References

  1. Lundborg, N.; Persson, A.; Ladegaard-Pedersen, A.; Holmberg, R. Keeping the Lid on Flyrock in Open-Pit Blasting. Eng Min J 1975, 176, 95–100. [Google Scholar]
  2. Lundborg, N. The Probability of Flyrock; SveDeFo, 1981;
  3. Gupta, R.N.; Bagchi, A.; Singh, B. Optimising Drilling and Blasting Parameters to Improve Blasting Efficiency. New Delhi CBIP. Rock Mech. India, Status Rep. 1988; 185–206. [Google Scholar]
  4. Richard, A.B.; Moore, A.J. Golden Pike Cut Back Fly Rock Control and Calibration of a Predictive Model. Terrock Consult. Eng. Report, Kalgoorlie Consol. Gold Mines 2005, 37. [Google Scholar]
  5. McKenzie, C.K. Flyrock Range and Fragment Size Prediction. In Proceedings of the Proceedings of the 35th annual conference on explosives and blasting technique; International Society of Explosives Engineers, 2009; Vol. 2.
  6. Monjezi, M.; Bahrami, A.; Yazdian Varjani, A. Simultaneous Prediction of Fragmentation and Flyrock in Blasting Operation Using Artificial Neural Networks. Int. J. Rock Mech. Min. Sci. 2010. [Google Scholar] [CrossRef]
  7. Rezaei, M.; Monjezi, M.; Yazdian Varjani, A. Development of a Fuzzy Model to Predict Flyrock in Surface Mining. Saf. Sci. 2011. [Google Scholar] [CrossRef]
  8. Bahrami, A.; Monjezi, M.; Goshtasbi, K.; Ghazvinian, A. Prediction of Rock Fragmentation Due to Blasting Using Artificial Neural Network. Eng. Comput. 2011, 27, 177–181. [Google Scholar] [CrossRef]
  9. Monjezi, M.; Bahrami, A.; Varjani, A.Y.; Sayadi, A.R. Prediction and Controlling of Flyrock in Blasting Operation Using Artificial Neural Network. Arab. J. Geosci. 2011, 4, 421–425. [Google Scholar] [CrossRef]
  10. Monjezi, M.; Khoshalan, H.A.; Varjani, A.Y. Prediction of Flyrock and Backbreak in Open Pit Blasting Operation: A Neuro-Genetic Approach. Arab. J. Geosci. 2012, 5, 441–448. [Google Scholar] [CrossRef]
  11. Amini, H.; Gholami, R.; Monjezi, M.; Torabi, S.R.; Zadhesh, J. Evaluation of Flyrock Phenomenon Due to Blasting Operation by Support Vector Machine. Neural Comput. Appl. 2012. [Google Scholar] [CrossRef]
  12. Ghasemi, E.; Sari, M.; Ataei, M. Development of an Empirical Model for Predicting the Effects of Controllable Blasting Parameters on Flyrock Distance in Surface Mines. Int. J. Rock Mech. Min. Sci. 2012, 52, 163–170. [Google Scholar] [CrossRef]
  13. Monjezi, M.; Mehrdanesh, A.; Malek, A.; Khandelwal, M. Evaluation of Effect of Blast Design Parameters on Flyrock Using Artificial Neural Networks. Neural Comput. Appl. 2013. [Google Scholar] [CrossRef]
  14. Khandelwal, M.; Monjezi, M. Prediction of Backbreak in Open-Pit Blasting Operations Using the Machine Learning Method. Rock Mech. Rock Eng. 2013. [Google Scholar] [CrossRef]
  15. Mohamad, E.T.; Armaghani, D.J.; Hajihassani, M.; Faizi, K.; Marto, A. A Simulation Approach to Predict Blasting-Induced Flyrock and Size of Thrown Rocks. Electron. J. Geotech. Eng. 2013. [Google Scholar]
  16. Armaghani, D.J.; Hajihassani, M.; Mohamad, E.T.; Marto, A.; Noorani, S.A. Blasting-Induced Flyrock and Ground Vibration Prediction through an Expert Artificial Neural Network Based on Particle Swarm Optimization. Arab. J. Geosci. 2014, 7, 5383–5396. [Google Scholar] [CrossRef]
  17. Marto, A.; Hajihassani, M.; Jahed Armaghani, D.; Tonnizam Mohamad, E.; Makhtar, A.M. A Novel Approach for Blast-Induced Flyrock Prediction Based on Imperialist Competitive Algorithm and Artificial Neural Network. Sci. World J. 2014, 2014. [Google Scholar] [CrossRef]
  18. Trivedi, R.; Singh, T.N.; Raina, A.K. Prediction of Blast-Induced Flyrock in Indian Limestone Mines Using Neural Networks. J. Rock Mech. Geotech. Eng. 2014, 6, 447–454. [Google Scholar] [CrossRef]
  19. Ghasemi, E.; Amini, H.; Ataei, M.; Khalokakaei, R. Application of Artificial Intelligence Techniques for Predicting the Flyrock Distance Caused by Blasting Operation. Arab. J. Geosci. 2014, 7, 193–202. [Google Scholar] [CrossRef]
  20. Trivedi, R.; Singh, T.N.; Gupta, N. Prediction of Blast-Induced Flyrock in Opencast Mines Using ANN and ANFIS. Geotech. Geol. Eng. 2015, 33, 875–891. [Google Scholar] [CrossRef]
  21. Armaghani, D.J.; Mahdiyar, A.; Hasanipanah, M.; Faradonbeh, R.S.; Khandelwal, M.; Amnieh, H.B. Risk Assessment and Prediction of Flyrock Distance by Combined Multiple Regression Analysis and Monte Carlo Simulation of Quarry Blasting. Rock Mech. rock Eng. 2016, 49, 3631–3641. [Google Scholar] [CrossRef]
  22. Faradonbeh, R.S.; Armaghani, D.J.; Monjezi, M.; Mohamad, E.T. Genetic Programming and Gene Expression Programming for Flyrock Assessment Due to Mine Blasting. Int. J. Rock Mech. Min. Sci. 2016, 88, 254–264. [Google Scholar] [CrossRef]
  23. Raina, A.K.; Murthy, V.M.S.R. Prediction of Flyrock Distance in Open Pit Blasting Using Surface Response Analysis. Geotech. Geol. Eng. 2016. [Google Scholar] [CrossRef]
  24. Trivedi, R.; Singh, T.N.; Raina, A.K. Simultaneous Prediction of Blast-Induced Flyrock and Fragmentation in Opencast Limestone Mines Using Back Propagation Neural Network. Int. J. Min. Miner. Eng. 2016. [Google Scholar] [CrossRef]
  25. Hasanipanah, M.; Jahed Armaghani, D.; Bakhshandeh Amnieh, H.; Majid, M.Z.A.; Tahir, M.M.D. Application of PSO to Develop a Powerful Equation for Prediction of Flyrock Due to Blasting. Neural Comput. Appl. 2017. [Google Scholar] [CrossRef]
  26. Asl, P.F.; Monjezi, M.; Hamidi, J.K.; Armaghani, D.J. Optimization of Flyrock and Rock Fragmentation in the Tajareh Limestone Mine Using Metaheuristics Method of Firefly Algorithm. Eng. Comput. 2018. [Google Scholar] [CrossRef]
  27. Hasanipanah, M.; Jahed Armaghani, D.; Bakhshandeh Amnieh, H.; Koopialipoor, M.; Arab, H. A Risk-Based Technique to Analyze Flyrock Results Through Rock Engineering System. Geotech. Geol. Eng. 2018, 36, 2247–2260. [Google Scholar] [CrossRef]
  28. Rad, H.N.; Hasanipanah, M.; Rezaei, M.; Eghlim, A.L. Developing a Least Squares Support Vector Machine for Estimating the Blast-Induced Flyrock. Eng. Comput. 2018, 34, 709–717. [Google Scholar] [CrossRef]
  29. Koopialipoor, M.; Fallah, A.; Armaghani, D.J.; Azizi, A.; Mohamad, E.T. Three Hybrid Intelligent Models in Estimating Flyrock Distance Resulting from Blasting. Eng. Comput. 2019, 35, 243–256. [Google Scholar] [CrossRef]
  30. Hudaverdi, T.; Akyildiz, O. A New Classification Approach for Prediction of Flyrock Throw in Surface Mines. Bull. Eng. Geol. Environ. 2019. [Google Scholar] [CrossRef]
  31. Lu, X.; Hasanipanah, M.; Brindhadevi, K.; Bakhshandeh Amnieh, H.; Khalafi, S. ORELM: A Novel Machine Learning Approach for Prediction of Flyrock in Mine Blasting. Nat. Resour. Res. 2020. [Google Scholar] [CrossRef]
  32. Hasanipanah, M.; Bakhshandeh Amnieh, H.; Amnieh, H.B. A Fuzzy Rule-Based Approach to Address Uncertainty in Risk Assessment and Prediction of Blast-Induced Flyrock in a Quarry. Nat. Resour. Res. 2020, 29, 1–21. [Google Scholar] [CrossRef]
  33. Armaghani, D.J.; Koopialipoor, M.; Bahri, M.; Hasanipanah, M.; Tahir, M.M. A SVR-GWO Technique to Minimize Flyrock Distance Resulting from Blasting. Bull. Eng. Geol. Environ. 2020, 79, 4369–4385. [Google Scholar] [CrossRef]
  34. Murlidhar, B.R.; Nguyen, H.; Rostami, J.; Bui, X.N.; Armaghani, D.J.; Ragam, P.; Mohamad, E.T. Prediction of Flyrock Distance Induced by Mine Blasting Using a Novel Harris Hawks Optimization-Based Multi-Layer Perceptron Neural Network. J. Rock Mech. Geotech. Eng. 2021. [Google Scholar] [CrossRef]
  35. Hosseini, S.; Poormirzaee, R.; Hajihassani, M.; Kalatehjari, R. An ANN-Fuzzy Cognitive Map-Based Z-Number Theory to Predict Flyrock Induced by Blasting in Open-Pit Mines. Rock Mech. Rock Eng. 2022, 1–18. [Google Scholar] [CrossRef]
  36. Hosseini, S.; Mousavi, A.; Monjezi, M.; Khandelwal, M. Mine-to-Crusher Policy: Planning of Mine Blasting Patterns for Environmentally Friendly and Optimum Fragmentation Using Monte Carlo Simulation-Based Multi-Objective Grey Wolf Optimization Approach. Resour. Policy 2022, 79, 103087. [Google Scholar] [CrossRef]
  37. Lawal, A.I.; Ojo, O.J.; Kim, M.; Kwon, S. Determination of Blast-Induced Flyrock Using a Drone Technology: A Bibliometric Overview with Practical Soft Computing Implementation. Arab. J. Geosci. 2022, 15, 1–18. [Google Scholar] [CrossRef]
  38. Ye, J.; He, X. A Novel Hybrid of ANFIS-Based Models Using Optimisation Approaches to Predict Mine Blast-Induced Flyrock. Int. J. Environ. Sci. Technol. 2023, 20, 3673–3686. [Google Scholar] [CrossRef]
  39. Barkhordari, M.S.; Armaghani, D.J.; Fakharian, P. Ensemble Machine Learning Models for Prediction of Flyrock Due to Quarry Blasting. Int. J. Environ. Sci. Technol. 2022, 19, 8661–8676. [Google Scholar] [CrossRef]
  40. Bhatawdekar, R.M.; Kumar, R.; Sabri Sabri, M.M.; Roy, B.; Mohamad, E.T.; Kumar, D.; Kwon, S. Estimating Flyrock Distance Induced Due to Mine Blasting by Extreme Learning Machine Coupled with an Equilibrium Optimizer. Sustainability 2023, 15, 3265. [Google Scholar] [CrossRef]
  41. Yari, M.; Armaghani, D.J.; Maraveas, C.; Ejlali, A.N.; Mohamad, E.T.; Asteris, P.G. Several Tree-Based Solutions for Predicting Flyrock Distance Due to Mine Blasting. Appl. Sci. 2023, 13, 1345. [Google Scholar] [CrossRef]
  42. Chou, J.-S.; Truong, D.-N. A Novel Metaheuristic Optimizer Inspired by Behavior of Jellyfish in Ocean. Appl. Math. Comput. 2021, 389, 125535. [Google Scholar] [CrossRef]
Table 2. Descriptive statistics of the measured effective parameters and targets.
Parameters Notation Unit Minimum Maximum Mean Std. Deviation
Inputs Number of holes n - 10.00 180.00 73.96 35.79
Hole length L m 6.50 12.50 10.65 0.87
Burden B m 3.80 4.20 4.13 0.11
Spacing S m 4.80 5.00 4.95 0.08
Hole slope HA degree 80.00 90.00 85.19 3.20
Stemming St m 2.00 4.90 3.44 0.63
Blasted rock per hole BRH ton 41.87 788.42 392.37 163.65
Powder factor Pf Kg/m3 0.11 0.56 0.33 0.09
Charge per delay CD Kg 55.36 274.61 165.42 41.25
Back-break BB m 2.5 9.5 5.84 0.86
Fly-rock Fr m 59 329 114.5 17.71
Table 3. Descriptive statistics of costs ($ per blast).
Operations Cost Notation Min Max Ave Std
Drilling DC 181.89 6062.41 1991.90 963.65
Blasting BC 95.36 10913.46 2419.22 1360.03
Loading LC 932.55 31703.24 10201.58 4950.74
Hauling HC 2613.54 88850.47 28590.62 13874.78
Crushing CC 0.09 176496 31308.46 37822.67
Secondary Blasting SBC 0 63.97 24.97 6.69
Hydraulic Hammer HHC 0 219.05 84.24 31.28
Bulldozing and Grading BC 22.87 2087.57 105.48 103.44
Loader LC 58.75 1031.13 222.24 90.60
Secondary Crushing SCC 0 44123.99 8543.94 9614.75
Additional Loading ALC 0 466.76 28.51 28.30
Additional Hauling AHC 0 223.81 66.87 32.78
Compensation CC 0 6774.27 346.62 415.46
Total TC 5887.58 351784.60 83934.65 53208.73
Table 4. Summary of regression analysis to prediction the total costs.
ANOVA
Sum of Squares df Mean Square F Sig.
Regression 2.14×10¹³ 9 2.38×10¹² 129555.928 0.000
Residual 9.13×10¹¹ 49787 1.84×10⁷
Total 2.23×10¹³ 49796
Coefficients
Unstandardized Coefficients Standardized Coefficients t Sig. Collinearity Statistics
B Std. Error Beta Tolerance VIF
(Constant) -114819.236 2005.136 - -57.263 0.000 - -
L -1101.045 35.276 -0.038 -31.212 0.000 0.558 1.793
B 19908.625 258.902 0.093 76.896 0.000 0.562 1.779
S 6395.742 332.387 0.017 19.242 0.000 0.995 1.005
HA -74.317 7.946 -0.010 -9.352 0.000 0.697 1.435
St -18707.345 44.512 -0.591 -420.277 0.000 0.416 2.406
BRH 0.00003 0.146 0.000 -0.002 0.998 0.613 1.630
Pf 2769.01 278.989 0.011 9.925 0.000 0.646 1.547
CD 18.38 0.513 0.036 35.826 0.000 0.830 1.205
Table 5. A summary of the Zorlu system for selecting the best models for the back-break prediction.
Model Training Algorithm Structure Transfer Function Train Test Validation Train Rating Test Rating Validation Rating Total Rank
R2 RMSE R2 RMSE R2 RMSE R2 RMSE R2 RMSE R2 RMSE
ANN 1 LM 6-3-1 T-T-T 0.907 2.560 0.822 3.405 0.855 2.377 8 5 3 23 14 23 76
ANN 2 LM 6-5-1 T-T-T 0.847 1.908 0.964 1.774 0.935 2.061 3 19 24 24 17 13 100
ANN 3 OSS 6-3-1 T-T-T 0.841 3.415 0.751 5.086 0.833 2.218 11 8 1 16 27 2 65
ANN 4 OSS 6-5-5-1 T-T-T 0.800 0.092 0.880 8.648 0.841 4.281 22 14 26 2 24 10 98
ANN 5 OSS 6-7-5-1 T-T-T 0.900 0.106 0.899 0.256 0.899 0.269 6 17 13 13 6 6 61
ANN 6 SCG 6-3-1 T-T-T 0.924 2.317 0.552 5.100 0.749 3.896 12 29 14 29 13 29 126
ANN 7 SCG 6-7-5-1 T-T-T 0.848 3.153 0.578 5.624 0.693 4.174 23 11 4 27 29 16 110
ANN 8 GDX 6-3-1 T-T-T 0.910 1.136 0.937 2.370 0.778 3.735 25 25 15 11 7 11 94
ANN 9 GDX 6-5-1 T-T-T 0.554 5.846 0.584 4.401 0.639 5.157 28 23 11 20 22 3 107
ANN 10 LM 6-6-1 T-T-T 0.852 3.100 0.791 3.645 0.813 4.038 14 21 12 25 2 26 100
ANN 11 LM 6-10-1 T-T-T 0.937 2.074 0.931 2.597 0.923 1.761 24 9 28 4 11 20 96
ANN 12 LM 6-5-5-1 T-T-P-T 0.947 1.920 0.777 4.265 0.866 2.922 7 6 8 15 20 15 71
ANN 13 LM 6-5-6-1 T-T-P-T 0.947 1.884 0.905 2.945 0.528 5.167 2 12 2 17 16 17 66
ANN 14 LM 6-5-7-1 T-P-T-T 0.848 3.075 0.738 4.907 0.705 5.213 29 16 25 22 23 27 142
ANN 15 LM 6-5-8-1 T-T-T-P 0.839 3.577 0.745 4.008 0.734 3.452 9 20 18 14 12 14 87
ANN 16 LM 6-6-8-1 T-T-T-P 0.892 0.021 0.810 3.463 0.914 3.063 17 27 10 21 28 9 112
ANN 17 LM 6-6-10-1 T-T-T-P 0.946 0.035 0.563 5.899 0.565 7.028 16 4 16 9 19 24 88
ANN 18 LM 6-6-11-1 T-T-T-T 0.999 0.049 0.994 0.477 0.998 0.666 1 3 22 12 30 22 90
ANN 19 LM 6-5-7-1 T-T-T-T 0.864 3.216 0.578 4.178 0.777 4.095 15 2 9 18 5 25 74
ANN 20 LM 6-5-7-1 T-T-T-T 0.856 3.231 0.577 4.527 0.769 4.472 30 30 29 30 25 30 174
ANN 21 LM 6-6-10-1 T-T-T-T 0.826 3.205 0.669 4.764 0.854 4.205 21 26 21 10 9 4 91
ANN 22 LM 6-6-12-1 T-T-T-T 0.863 3.192 0.520 4.273 0.824 3.884 5 1 30 19 15 5 75
ANN 23 LM 6-8-5-1 T-T-P-T 0.910 0.099 0.903 0.643 0.906 0.536 27 28 7 1 8 1 72
ANN 24 LM 6-8-9-1 T-T-T-T 0.908 0.364 0.814 2.427 0.920 3.121 10 10 17 3 4 21 65
ANN 25 LM 6-8-10-1 T-L-T-T 0.855 3.271 0.638 4.582 0.766 3.461 18 15 6 5 10 7 61
ANN 26 LM 6-9-11-1 T-T-T-T 0.846 3.471 0.673 4.343 0.788 3.122 26 22 19 28 21 28 144
ANN 27 LM 6-10-5-1 T-T-T-L 0.832 3.434 0.828 3.184 0.787 3.726 20 7 27 7 26 12 99
ANN 28 LM 6-10-7-1 T-T-T-T 0.829 3.533 0.803 4.420 0.687 3.204 4 24 20 6 18 19 91
ANN 29 LM 6-12-8-1 T-L-T-T 0.838 3.443 0.690 4.079 0.743 4.419 19 13 23 26 3 8 92
ANN 30 LM 6-12-9-1 T-T-T-T 0.842 3.056 0.677 5.314 0.529 6.791 13 18 5 8 1 18 63
Table 6. A summary of the Zorlu system for selecting the best model for the fly-rock prediction.
Model Training Algorithm Structure Transfer Function Train Test Validation Train Rating Test Rating Validation Rating Total Rank
R2 RMSE R2 RMSE R2 RMSE R2 RMSE R2 RMSE R2 RMSE
ANN 1 LM 6-3-1 T-T-T 0.783 3.955 0.730 1.571 0.865 2.472 8 5 3 23 14 23 76
ANN 2 LM 6-5-1 T-T-T 0.723 2.000 0.920 1.496 0.881 3.496 3 19 24 24 17 13 100
ANN 3 OSS 6-3-1 T-T-T 0.791 3.565 0.709 2.706 0.996 4.755 11 8 1 16 27 2 65
ANN 4 OSS 6-5-5-1 T-T-T 0.903 2.623 0.926 4.685 0.971 3.833 22 14 26 2 24 10 98
ANN 5 OSS 6-7-5-1 T-T-T 0.759 2.350 0.850 2.996 0.785 4.462 6 17 13 13 6 6 61
ANN 6 SCG 6-3-1 T-T-T 0.816 0.729 0.858 0.925 0.841 0.763 12 29 14 29 13 29 126
ANN 7 SCG 6-7-5-1 T-T-T 0.918 3.387 0.741 1.330 0.999 3.019 23 11 4 27 29 16 110
ANN 8 GDX 6-3-1 T-T-T 0.923 1.253 0.859 3.222 0.796 3.785 25 25 15 11 7 11 94
ANN 9 GDX 6-5-1 T-T-T 0.960 1.562 0.835 2.214 0.937 4.668 28 23 11 20 22 3 107
ANN 10 LM 6-6-1 T-T-T 0.837 1.645 0.836 1.391 0.762 1.249 14 21 12 25 2 26 100
ANN 11 LM 6-10-1 T-T-T 0.922 3.514 0.968 4.446 0.820 2.615 24 9 28 4 11 20 96
ANN 12 LM 6-5-5-1 T-T-P-T 0.771 3.903 0.805 2.911 0.929 3.197 7 6 8 15 20 15 71
ANN 13 LM 6-5-6-1 T-T-P-T 0.715 3.081 0.723 2.423 0.880 2.881 2 12 2 17 16 17 66
ANN 14 LM 6-5-7-1 T-P-T-T 0.962 2.561 0.923 2.044 0.938 1.236 29 16 25 22 23 27 142
ANN 15 LM 6-5-8-1 T-T-T-P 0.787 1.980 0.867 2.975 0.831 3.274 9 20 18 14 12 14 87
ANN 16 LM 6-6-8-1 T-T-T-P 0.845 1.174 0.814 2.115 0.998 4.253 17 27 10 21 28 9 112
ANN 17 LM 6-6-10-1 T-T-T-P 0.841 4.279 0.862 3.355 0.909 1.889 16 4 16 9 19 24 88
ANN 18 LM 6-6-11-1 T-T-T-T 0.705 4.304 0.913 3.124 1.000 2.584 1 3 22 12 30 22 90
ANN 19 LM 6-5-7-1 T-T-T-T 0.840 4.486 0.813 2.371 0.782 1.396 15 2 9 18 5 25 74
ANN 20 LM 6-5-7-1 T-T-T-T 0.987 0.231 0.979 0.527 0.973 0.472 30 30 29 30 25 30 174
ANN 21 LM 6-6-10-1 T-T-T-T 0.897 1.199 0.889 3.243 0.811 4.639 21 26 21 10 9 4 91
ANN 22 LM 6-6-12-1 T-T-T-T 0.752 4.670 0.989 2.326 0.872 4.567 5 1 30 19 15 5 75
ANN 23 LM 6-8-5-1 T-T-P-T 0.951 1.055 0.801 4.903 0.809 4.942 27 28 7 1 8 1 72
ANN 24 LM 6-8-9-1 T-T-T-T 0.789 3.463 0.864 4.607 0.768 2.592 10 10 17 3 4 21 65
ANN 25 LM 6-8-10-1 T-L-T-T 0.854 2.619 0.782 4.319 0.813 4.279 18 15 6 5 10 7 61
ANN 26 LM 6-9-11-1 T-T-T-T 0.945 1.582 0.869 1.268 0.930 1.107 26 22 19 28 21 28 144
ANN 27 LM 6-10-5-1 T-T-T-L 0.893 3.683 0.946 4.106 0.978 3.696 20 7 27 7 26 12 99
ANN 28 LM 6-10-7-1 T-T-T-T 0.749 1.369 0.888 4.282 0.888 2.629 4 24 20 6 18 19 91
ANN 29 LM 6-12-8-1 T-L-T-T 0.866 2.713 0.918 1.354 0.767 4.257 19 13 23 26 3 8 92
ANN 30 LM 6-12-9-1 T-T-T-T 0.829 2.220 0.770 3.378 0.757 2.748 13 18 5 8 1 18 63
Table 7. Pareto solution resulted from MOGOA.
Pareto Solution Costs ($ per Blast) Fly-Rock (m) Back-Break (m) Costs Increase (%) Fly-Rock Reduction (%) Back-Break Reduction (%)
1 41157.28 51.69 1.48 0 0 0
2 43348.23 51.56 1.47 5.32 1.01 0.27
3 44306.00 51.51 1.45 7.65 2.57 0.36
4 46965.96 51.2 1.39 14.11 6.52 0.96
5 47937.19 50.96 1.33 16.47 10.28 1.42
6 48685.52 50.15 1.17 18.29 20.83 3.00
7 48964.96 48.65 1.00 18.97 32.61 5.89
8 49060.83 47.96 0.95 19.20 36.23 7.23
9 49246.71 46.35 0.84 19.65 43.33 10.34
10 49286.71 42.91 0.67 19.75 54.65 16.99
11 49442.78 38.53 0.49 20.13 66.95 25.47
Table 8. Patterns related to the Pareto solution resulted from MOGOA.
Blasting Pattern L B S HA St BRH Pf CD
1 11.30 3.13 3.81 85.5 1.27 336.89 0.040 121.28
2 12.20 3.14 3.75 85.0 1.73 359.14 0.044 50.45
3 11.88 3.11 3.81 85.2 2.17 351.92 0.043 135.14
4 10.23 3.13 3.77 85.2 3.50 301.79 0.037 122.35
5 11.21 3.23 3.95 85.6 1.39 357.56 0.037 125.36
6 12.25 3.13 3.76 85.3 2.90 360.42 0.044 71.24
7 11.95 3.10 3.81 85.7 1.50 352.85 0.043 178.87
8 10.80 3.23 3.80 85.9 2.15 331.4 0.037 220.29
9 10.30 3.14 3.92 90.0 1.67 316.95 0.036 99.58
10 11.40 3.42 4.20 85.3 2.87 409.37 0.034 202.75
11 11.60 3.46 4.15 85.2 1.55 416.41 0.034 25.34
Disclaimer/Publisher’s Note: The statements, opinions and data contained in all publications are solely those of the individual author(s) and contributor(s) and not of MDPI and/or the editor(s). MDPI and/or the editor(s) disclaim responsibility for any injury to people or property resulting from any ideas, methods, instructions or products referred to in the content.
Copyright: This open access article is published under a Creative Commons CC BY 4.0 license, which permit the free download, distribution, and reuse, provided that the author and preprint are cited in any reuse.
Prerpints.org logo

Preprints.org is a free preprint server supported by MDPI in Basel, Switzerland.

Subscribe

© 2024 MDPI (Basel, Switzerland) unless otherwise stated