1. Introduction
Type 2 diabetes mellitus (T2DM) is a disease commonly attributed to pancreatic insufficiency, inadequate insulin secretion, or increased insulin resistance, and accounts for the vast of all diabetes cases worldwide [
1]. The number of people with T2DM has dramatically increased over the past decade and is expected to reach 592 million by 2035 [
2]. This growing prevalence combined with an increasingly young onset of the disease have established T2DM as a global health concern and garnered significant attention in the literature over the past decade [
3]. T2DM patients are shown to carry a higher risk of numerous complications including cardiovascular diseases [
4], as T2DM compromises the cardiac tissue, causing cell damage, impaired calcium homeostasis, mitochondrial dysfunction, changes in muscle fibers, oxidative stress, and inflammation [
5,
6]. All of these cellular changes have been shown to cause heart failure and ischemic heart disease [
7].
The UPS plays a central role in the regulation of many cellular processes in the body, such as cell cycle [
8], cellular signaling [
9] and programmed cell death [
10]; Consequently, deviations in UPS activity underlie the pathogenesis of various diseases [
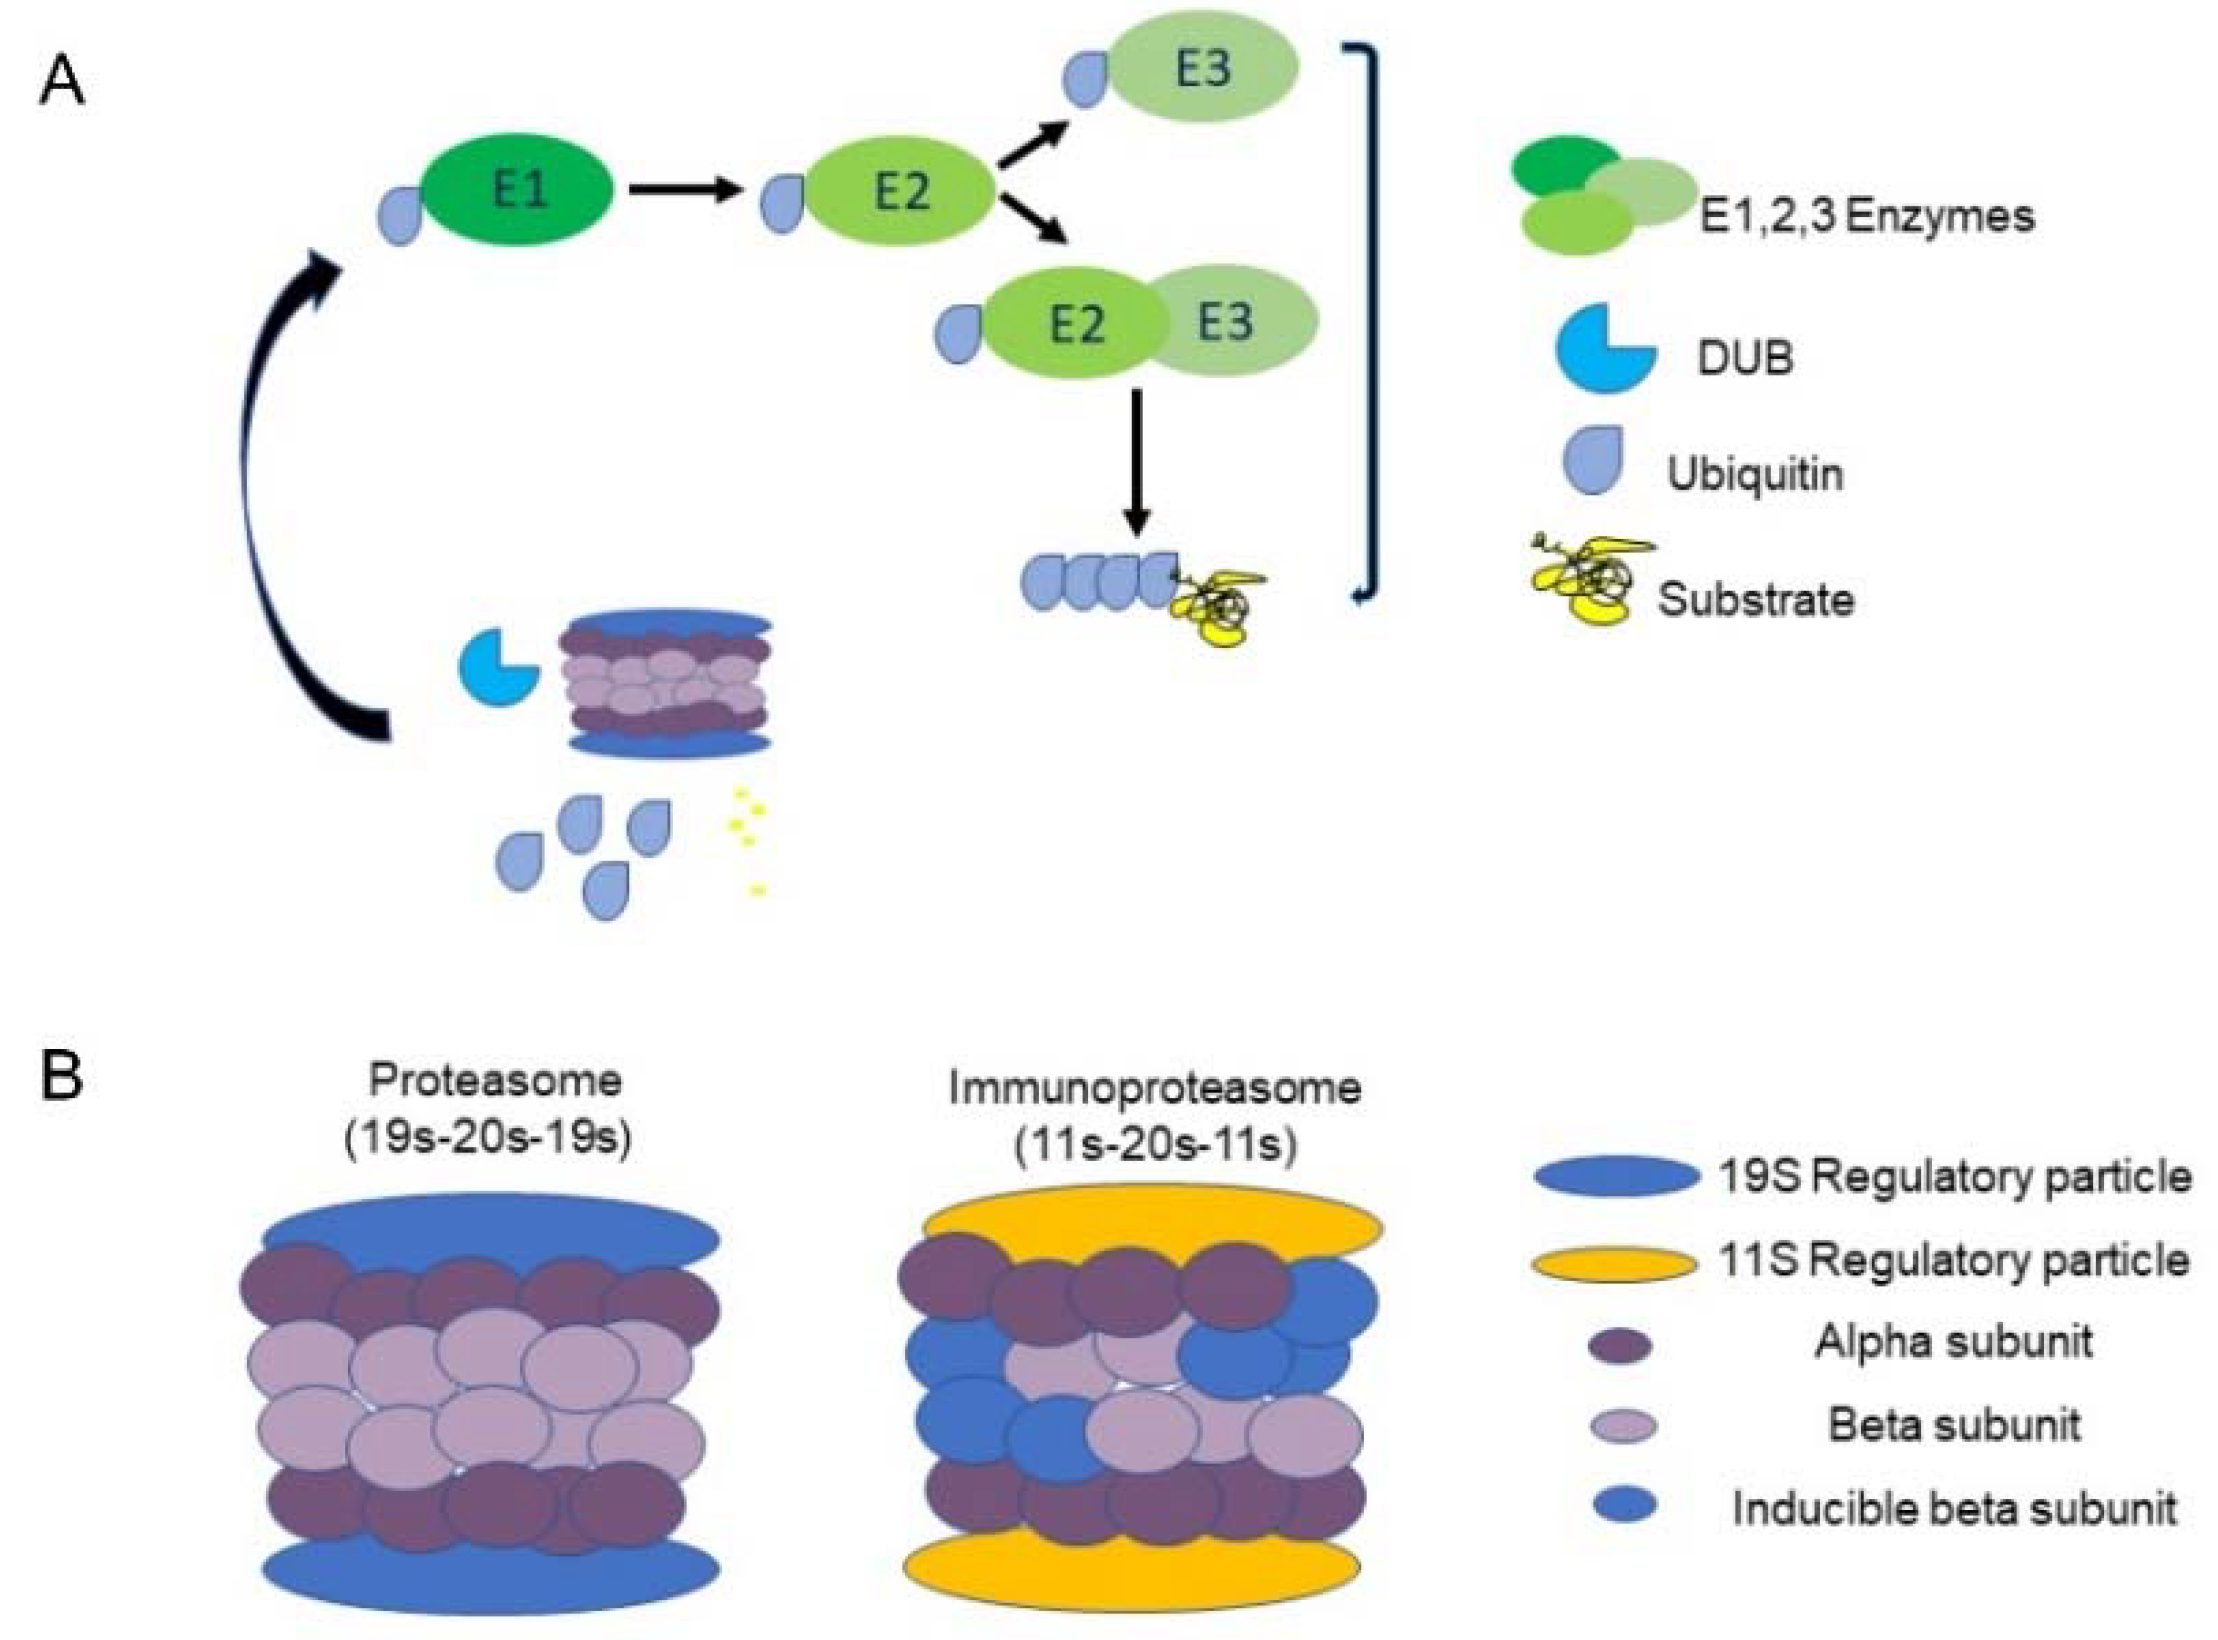
11]. Specifically, UPS oversees cellular protein quality control by driving degradation of misfolded and/or damaged proteins via poly-ubiquitination of target proteins. There are three types of enzymes that promote this process: ubiquitin-activating enzymes (E1), ubiquitin-conjugating enzymes (E2), and ubiquitin-ligating enzymes (E3). Initially, E1 binds a ubiquitin molecule forming an ATP-dependent thioester linkage. The ubiquitin relocates to an E2 enzyme, which either transfers the ubiquitin to E3 directly or binds to E3 as an adaptor protein. Together E2 and E3 attach ubiquitin to a lysine residue on the target protein [
12,
13], (
Figure 1A). E3 ubiquitin ligases are known to define the substrate- and tissue-specificity of the UPS and are considered to play a significant role in maintaining protein quality control. This role is especially vital in maintaining cardiac tissue function due to its poor regenerative capacity [
14].
After a cellular protein is tagged with a chain of at least four ubiquitin molecules, it is recognized and degraded by the 26S proteasome complex [
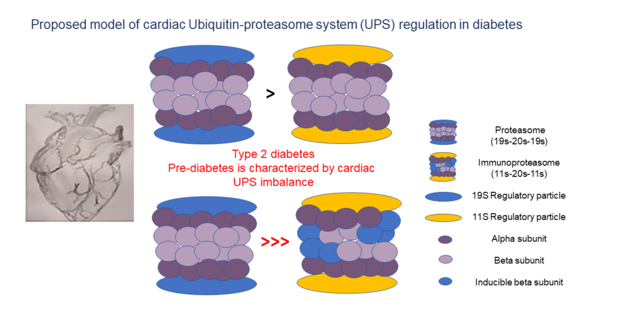
13]. The barrel-shaped proteasome contains a 20S core particle and a 19S regulatory particle (RP) that binds 20S bilaterally, forming a 19S-20S-19S (30S) complex. 20S is responsible for the complex’s ATP-dependent catalytic activity and is composed of two external α rings and two internal β rings [
15], with each ring comprising seven distinct subunits (α 1-7, β 1-7). In some cases, an 11S (PA28) RP, replaces the 19S, forming either the 11S-20S-11S or the 19S-20S-11S hybrid (
Figure 1B). These forms enable ubiquitin-independent degradation [
16]. Some 11S-20S-11S complexes contain replacements of the 1, 2 and 5 β subunits with inducible counterparts, such as β1i (LMP2, encoded by
PSMB9), β2i (MECL-1, encoded by
PSMB10) and β5i (LMP7 encoded by
PSMB8), respectively [
17]. This transformation is triggered by IFN-γ and is referred to as the ‘immunoproteasome’.
Considering the cardiac changes that occur in the diabetic heart, we hypothesized that UPS malfunction might play a central role in early diabetes, leading to cardiac pathology. These changes may set the stage for future diabetes induced heart failure and deterioration. Our aim was to identify such early events that might provide a better understanding of the mechanisms leading to diabetes-induced heart failure and inform future treatment of these patients.
2. Results
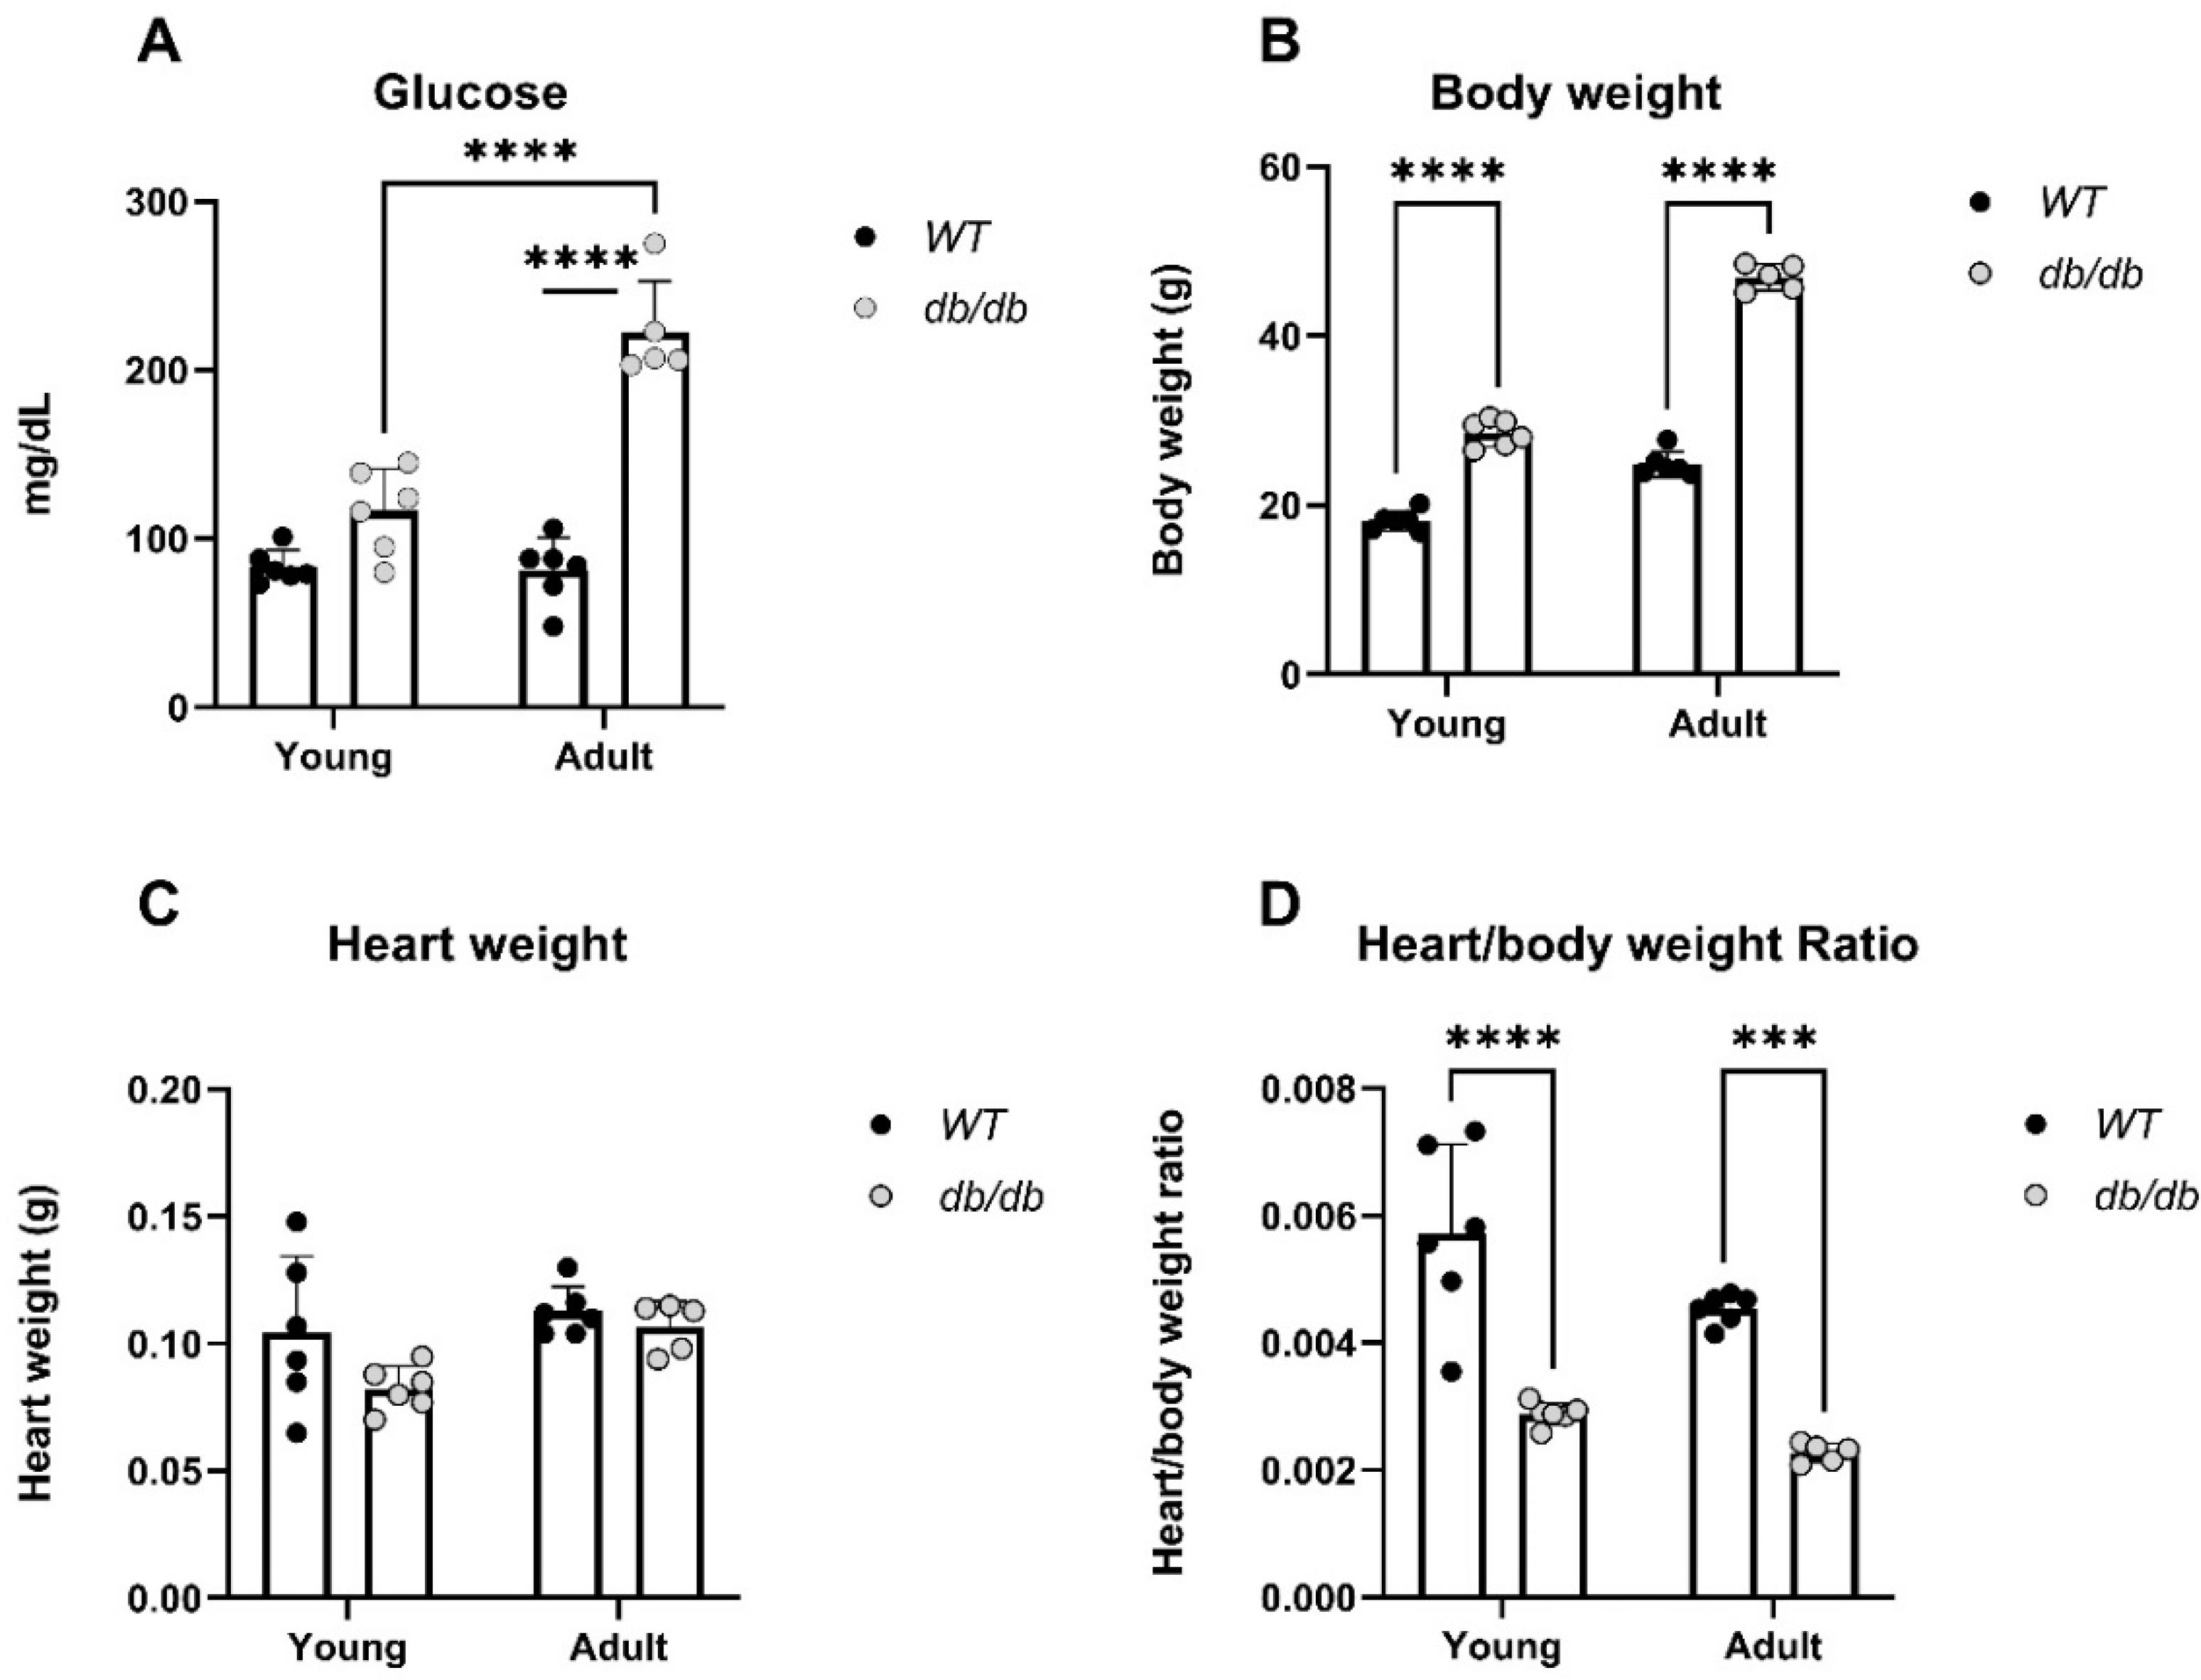
db/db mice were used to explore the effects of the UPS in diabetic induced cardiomyopathy [18-20]. Blood glucose levels, body weight, heart weight, and heart/body weight ratio were measured in
Young and
Adult db/db and
WT mice (
Figure 2). Glucose levels were higher in
Adult db/db mice compared to
Adult WT mice, (p<0.0001), (
Figure 2A). Furthermore, the body weight of both
Young and
Adult db/db mice was significantly higher than that of age-matched
WT mice (
Figure 2B). Heart/body weight ratio was significantly lower in
db/db as compared to
WT mice, in both
Adult and
Young groups (
Figure 2D).
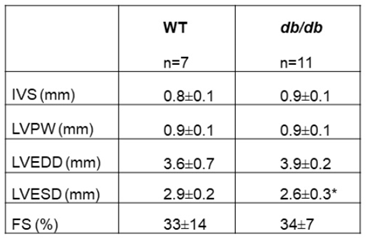
Echocardiographic (ECHO) recordings of 16-week-old
db/db and
WT mice were taken (
Table 1). The results identified a smaller left ventricular end systolic diameter (LVESD) in
db/db mice, compared to
WT (p<0.05) and a tendency to a higher end diastolic dimension. No other echocardiographic parameters, including the fractional shortening (FS), were significantly different between the groups.
Proteasome activity is different in db/db mice. Proteins extracted from the hearts of
Young and
Adult db/db mice and their age-matched
WT mice were subjected to a proteasome activity assay.
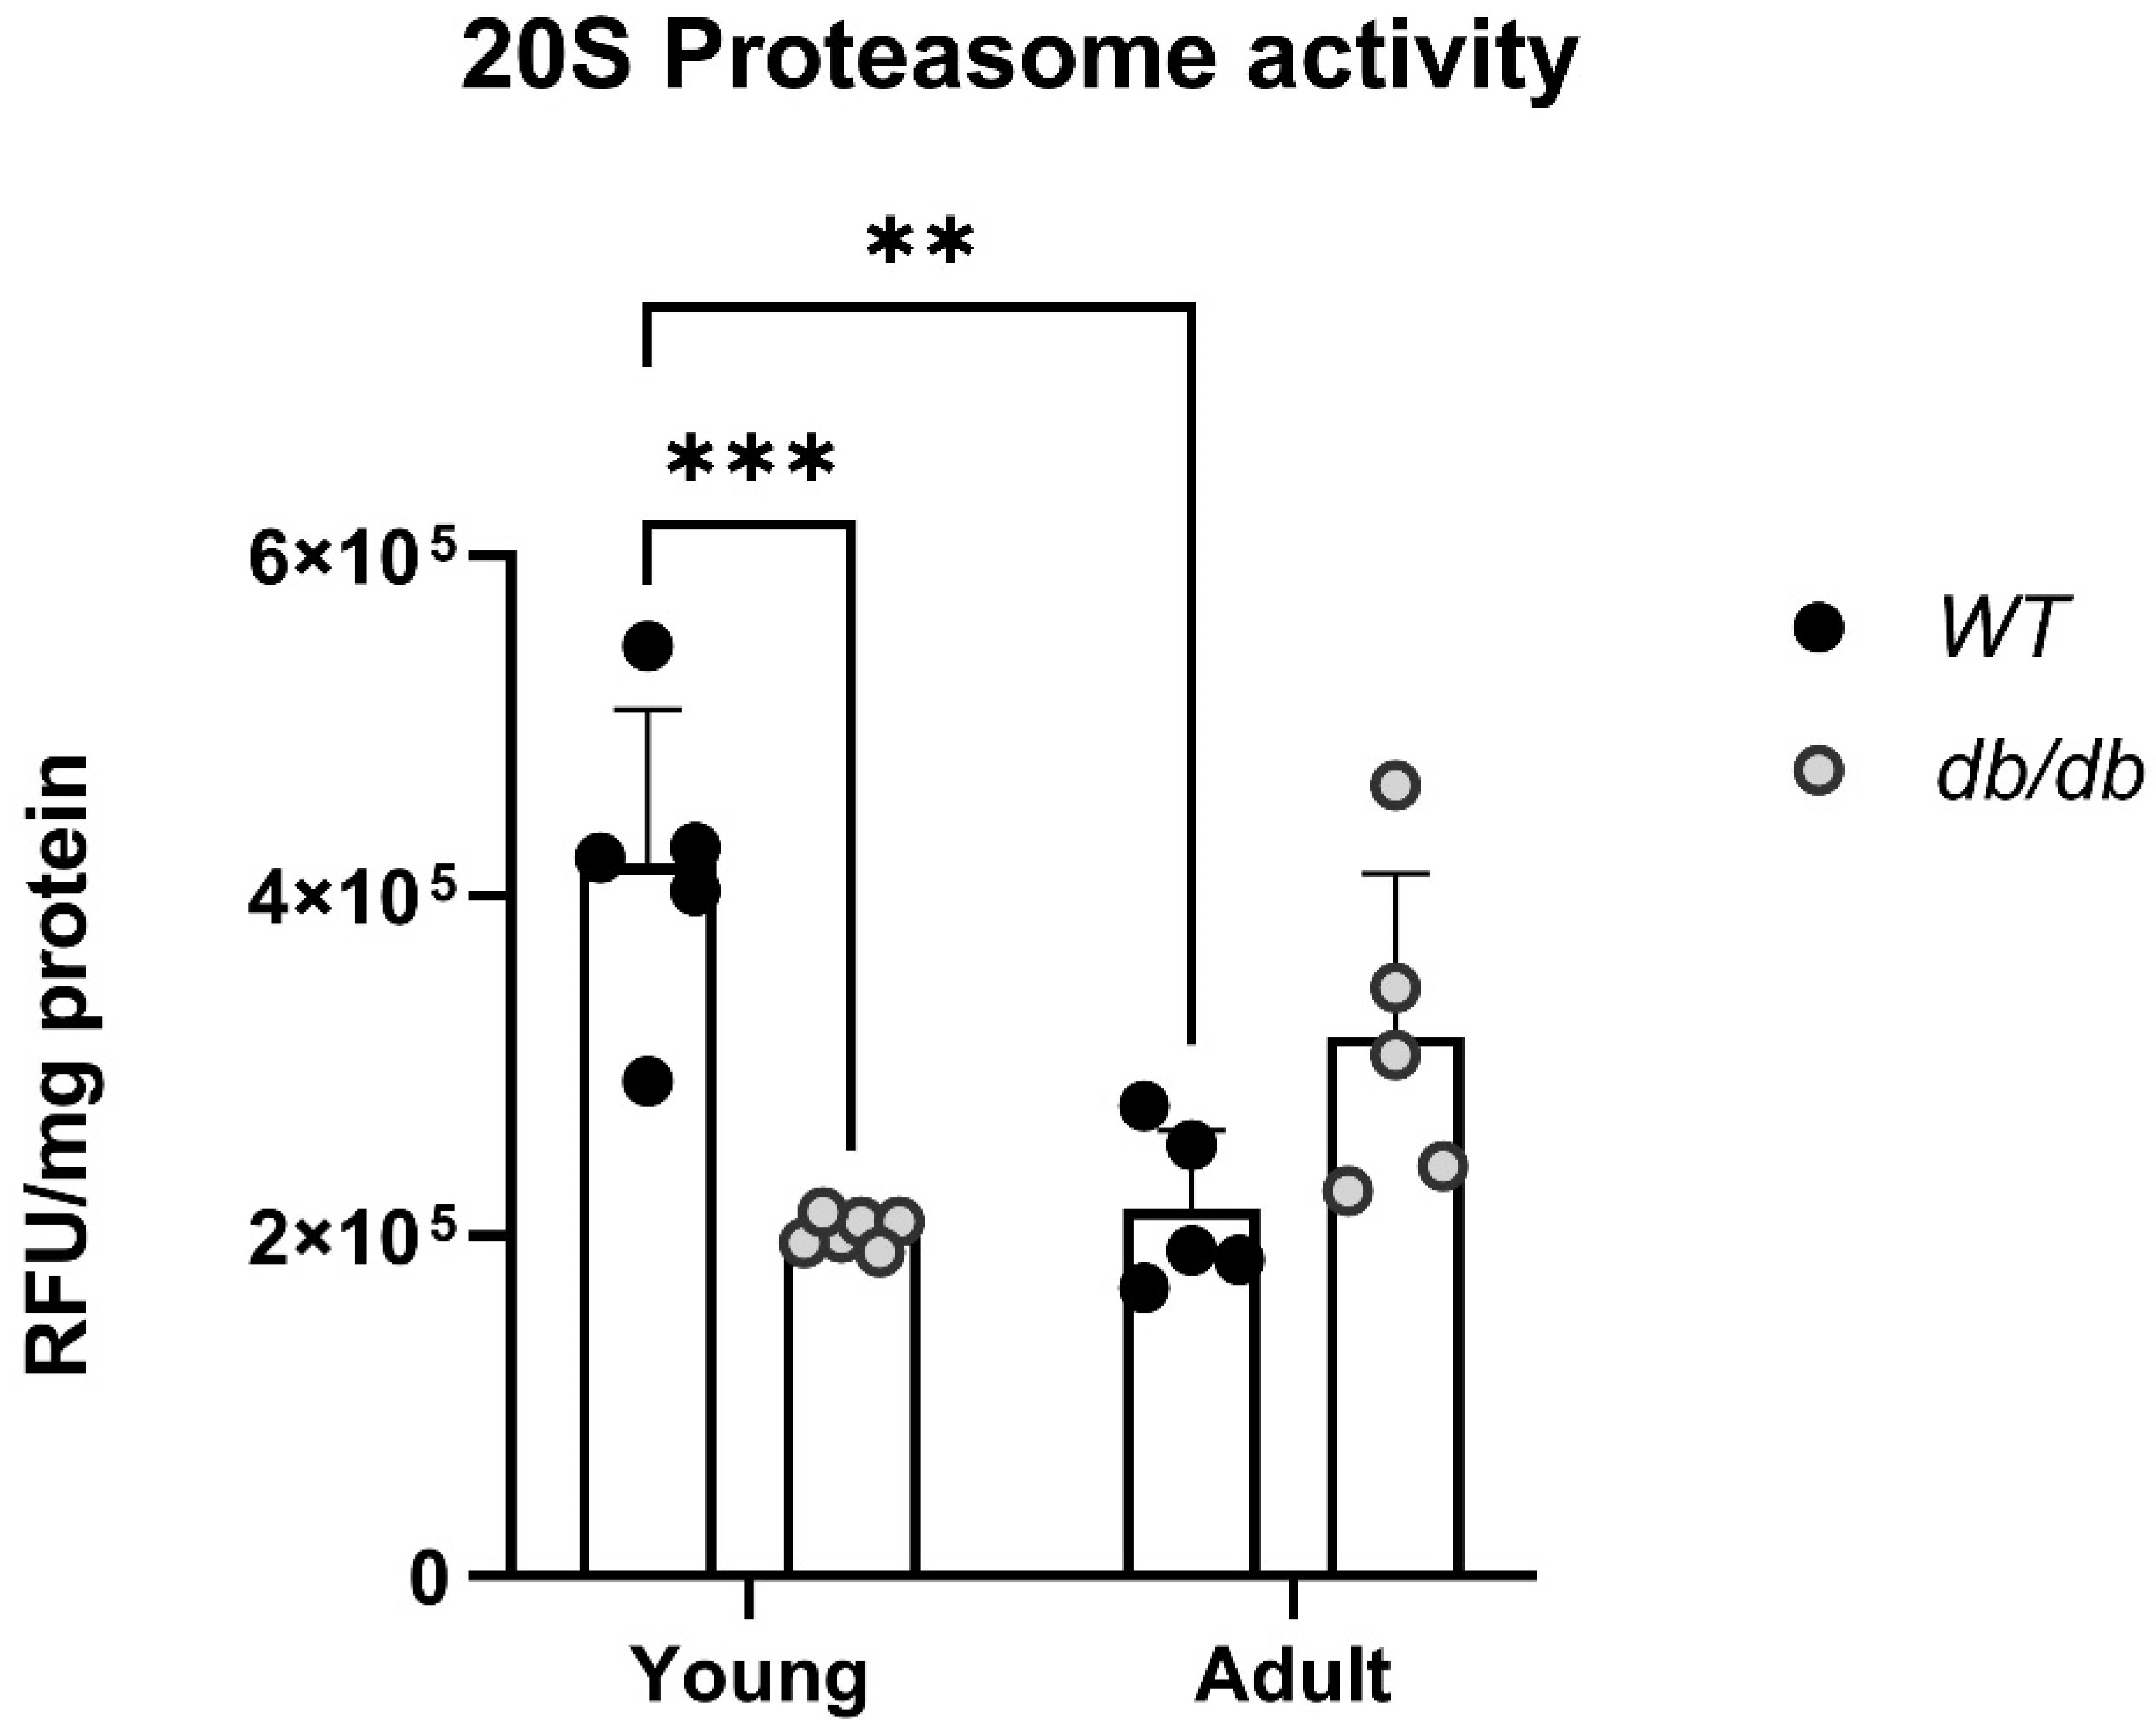
Young db/db mice exhibited reduced 20S proteasome activity compared with
Young WT mice (
Figure 3). Furthermore, while the
WT mice exhibited progressively less activity with age, the
db/db mice exhibited an opposite trend, with an increase in 20S activity (
Figure 3).
2.1. RNA sequencing emphasizes the differences between db/db and WT mice
RNA sequencing was performed on RNA samples extracted from cardiac tissues and compared with that of
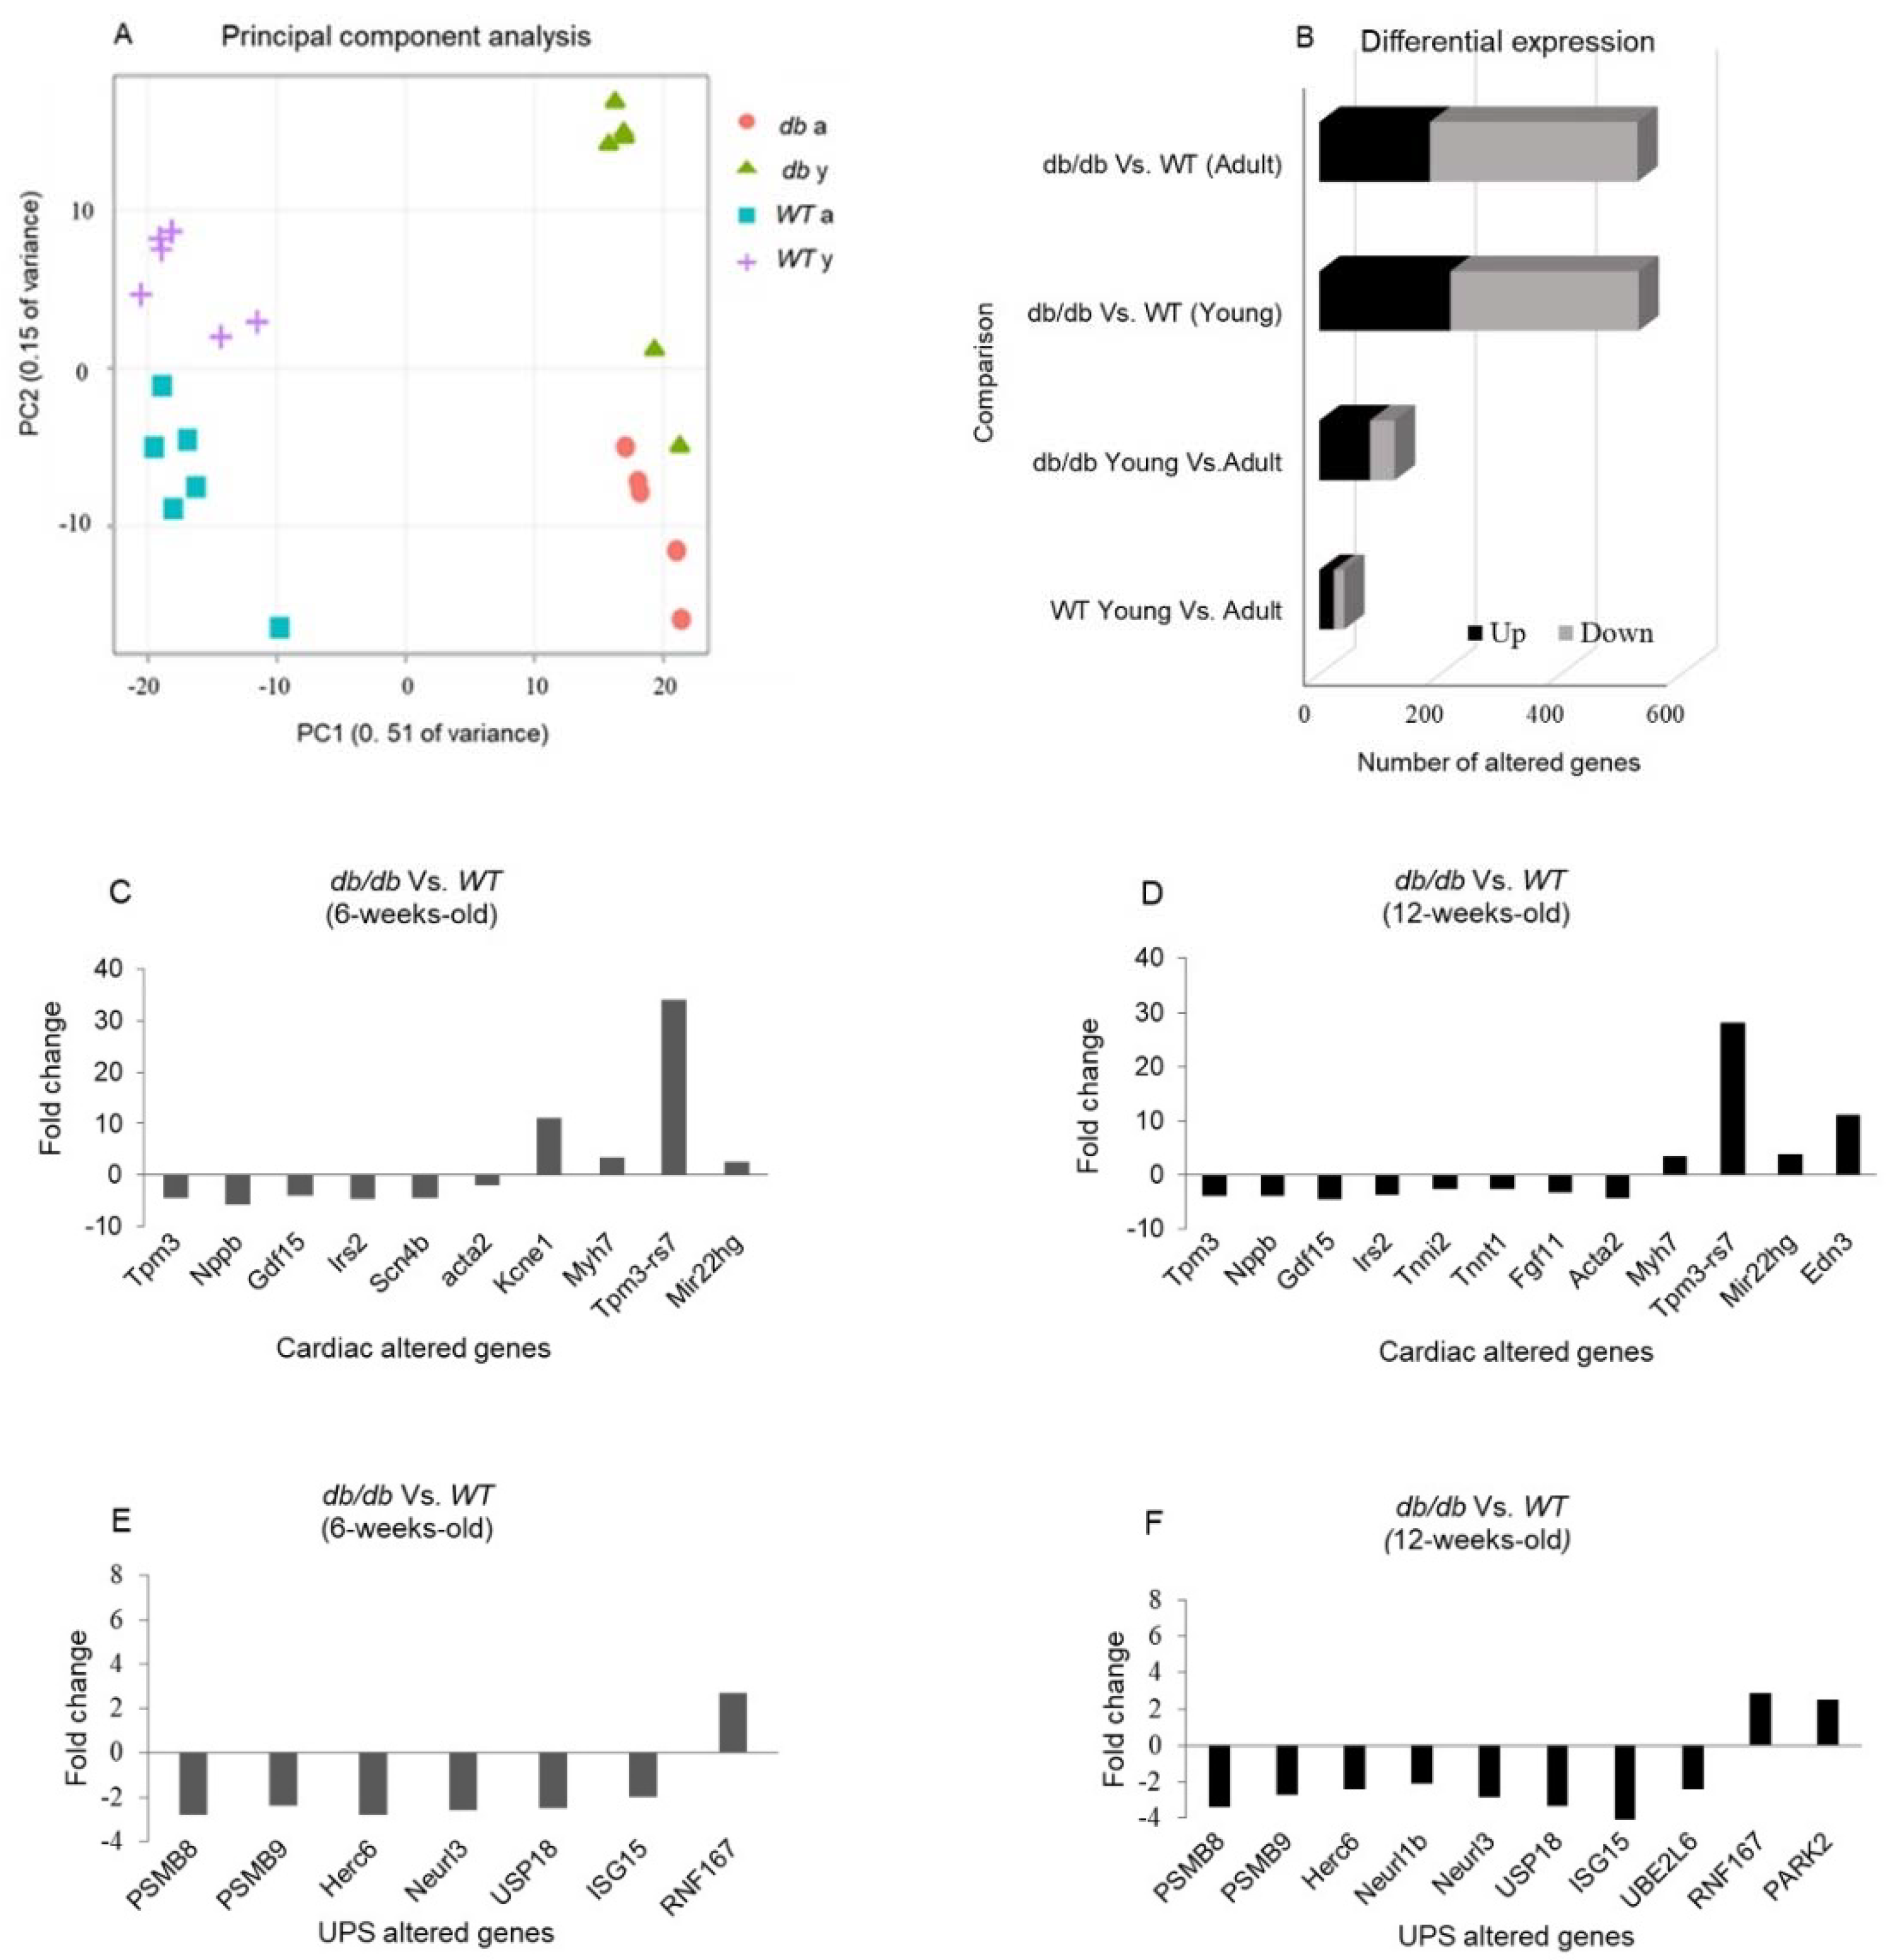
WT mice. A principal component analysis (PCA) plot representing the experiment variance was based on the gradual change in expression of approximately 5000 genes. PCA determined four homogenous groups as expected (
Figure 4A). The variation in gene expression observed between
Young and
Adult db/db mice points to a greater change in gene expression when the
db/db mice transition from the pre-diabetic to the diabetic state. Differential expression (DE) analysis found vast differences in gene expression (> 500 genes) between
Young db/db and
Young WT mice and between
Adult db/db and
Adult WT mice. The exact number of modified genes, including the directional change in their expression (up- or downregulation), is summarized in
Figure 4.
2.2. Cardiomyopathy-and UPS related genes are differently expressed in db/db compared with WT mice
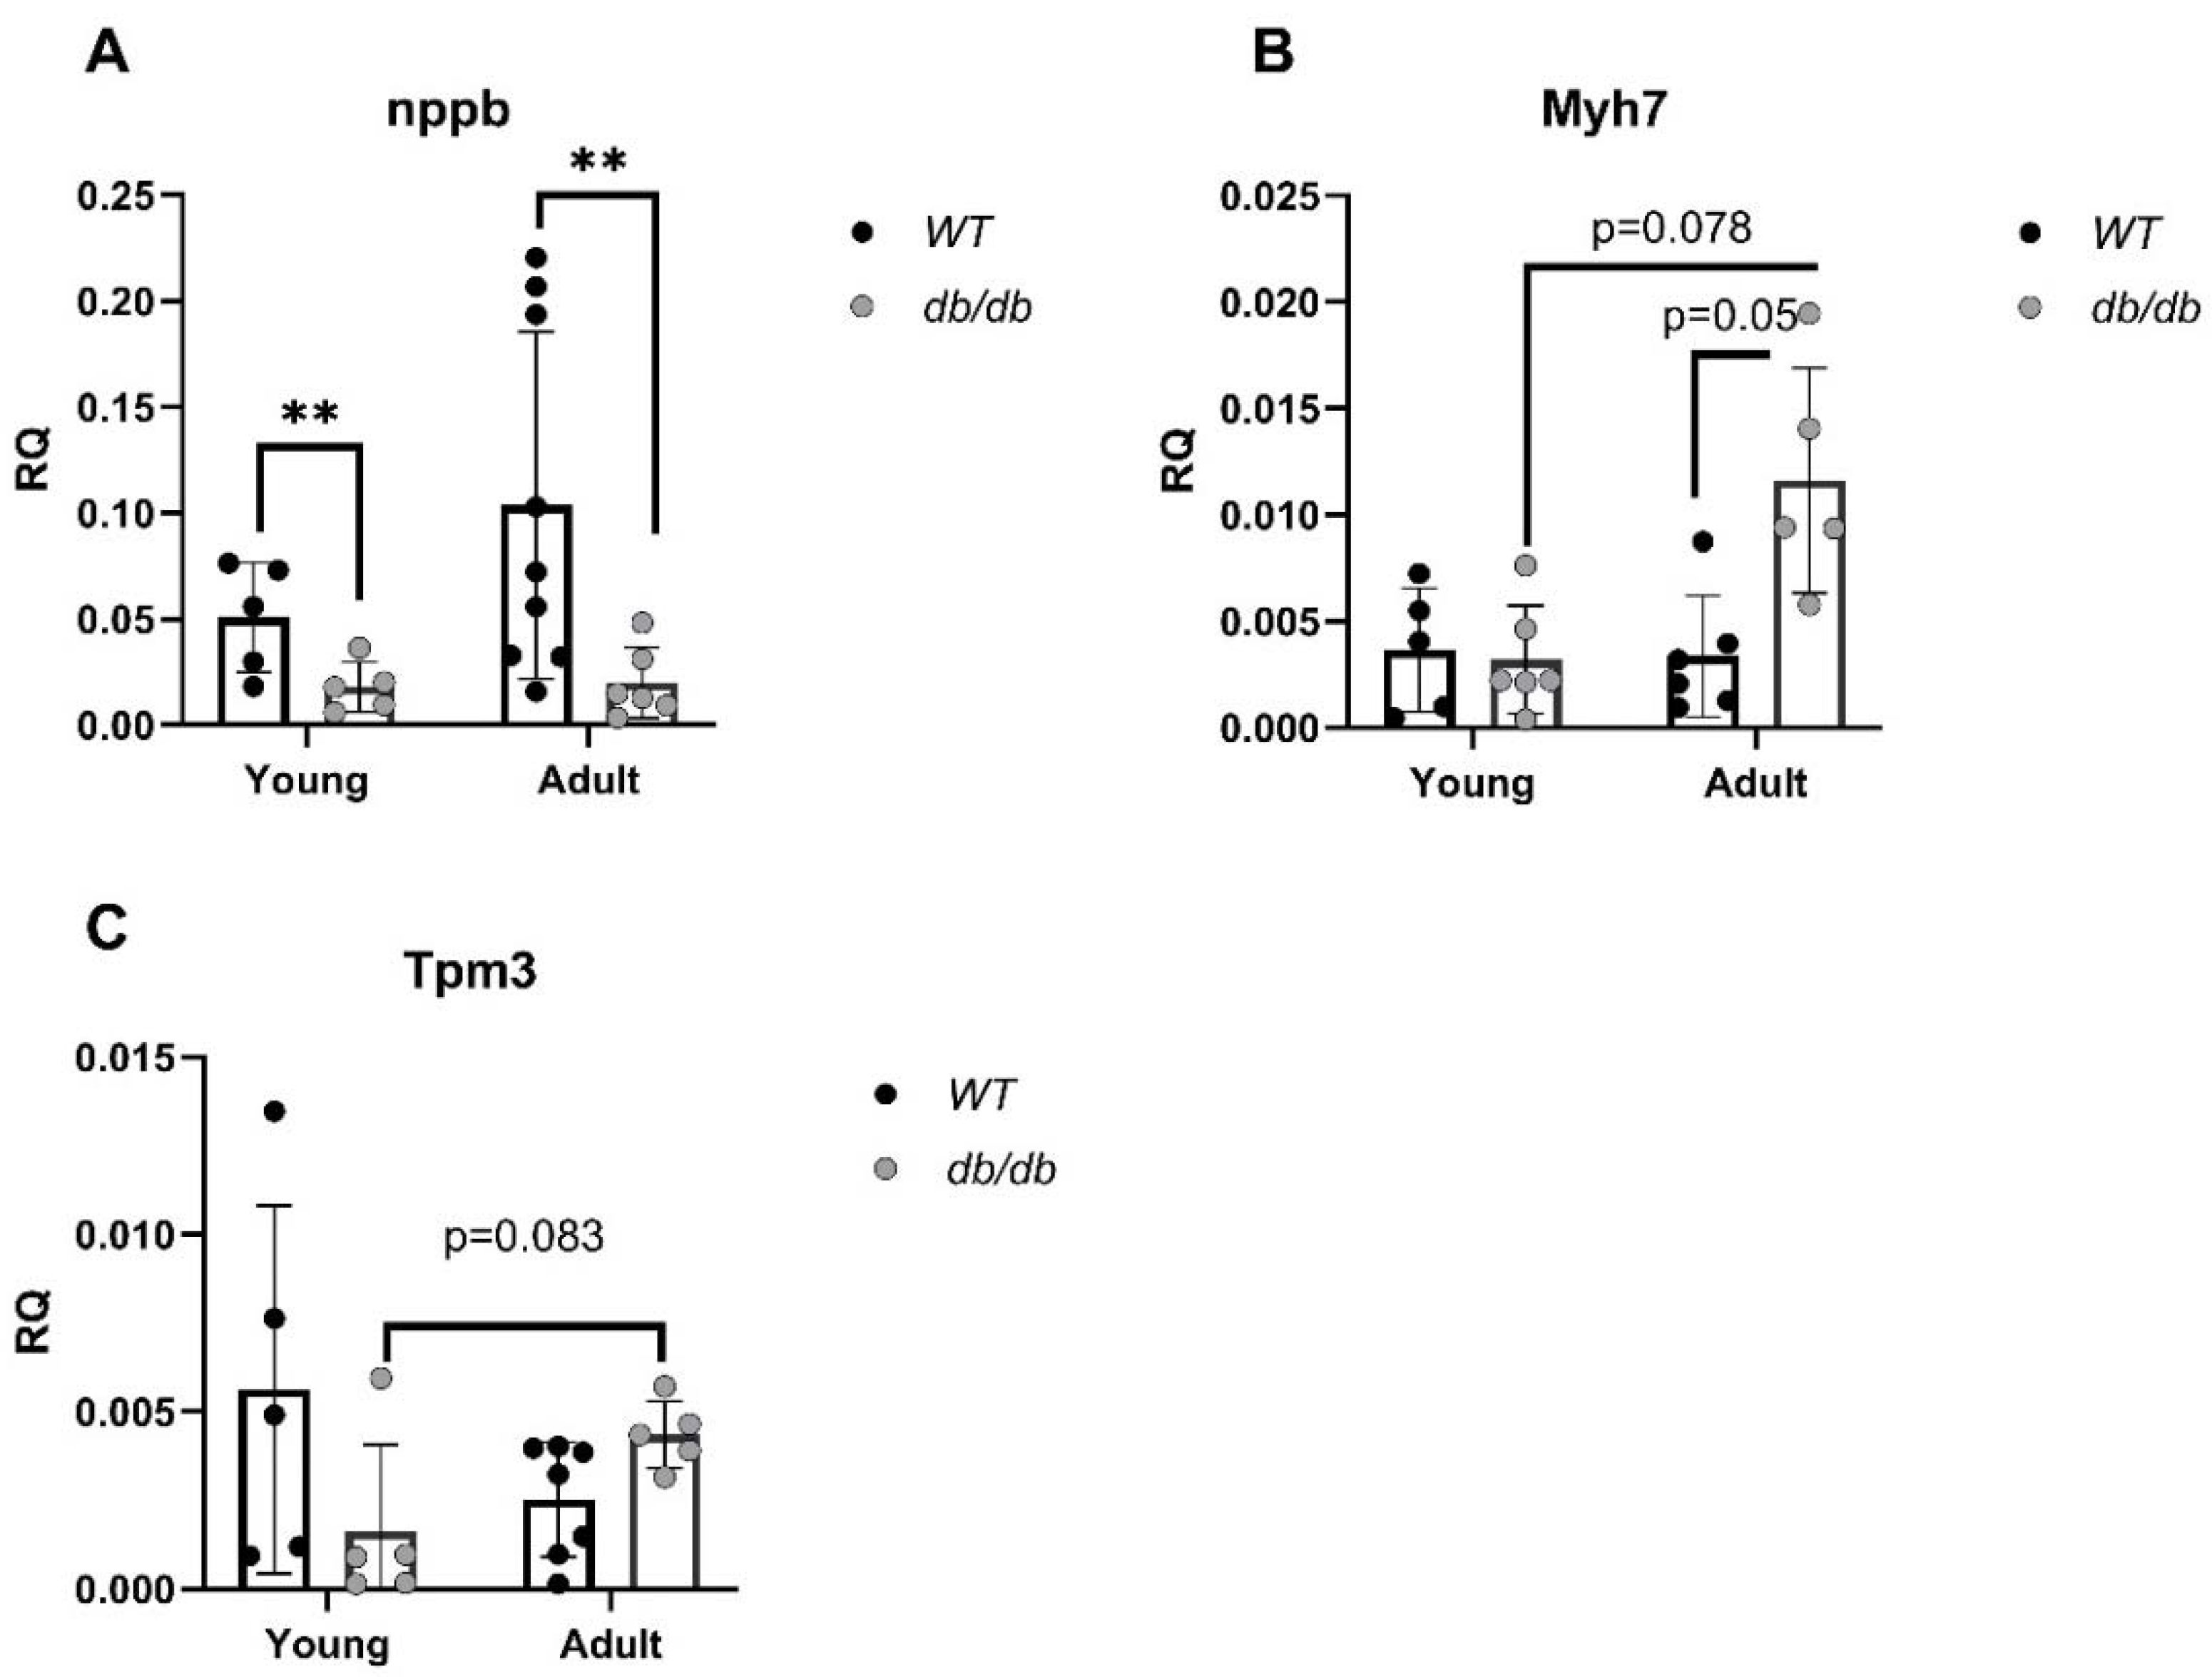
mRNA levels of cardiomyopathy-and UPS-related genes were evaluated. Cardiomyopathy-related genes such as B-type natriuretic peptide (
nppb), [
21], encoding the BNP protein, an indicator of heart failure, and myosin heavy chain 7 (
Myh7) [
22], encoding the beta (slow) heavy chain subunit of cardiac myosin, were both altered in
db/db mice compared with
WT mice. While
nppb was downregulated in diabetic mice regardless of age, differences were only significant in the comparison of
Adult mice (p<0.01) (
Figure 5A). In contrast,
Myh7 mRNA level was increased in
Adult db/db mice (p=0.05) (
Figure 5B). mRNA levels of tropomyosin alpha-3 (
Tpm3), encoding the protein which stabilizes actin, were reduced with age in
WT mice but increased with age in
db/db mice (
Figure 5C).
Gene expression of immunoproteasome components including the 11S α-unit and the three inducible β subunits, β5i, β1i, and β2i (encoded by:
Psme1, Psmb8, Psmb9 and
Psmb10, respectively) were significantly reduced in
Adult db/db mice compared with
Adult WT mice and regardless of age (
Figure 6A-6D).
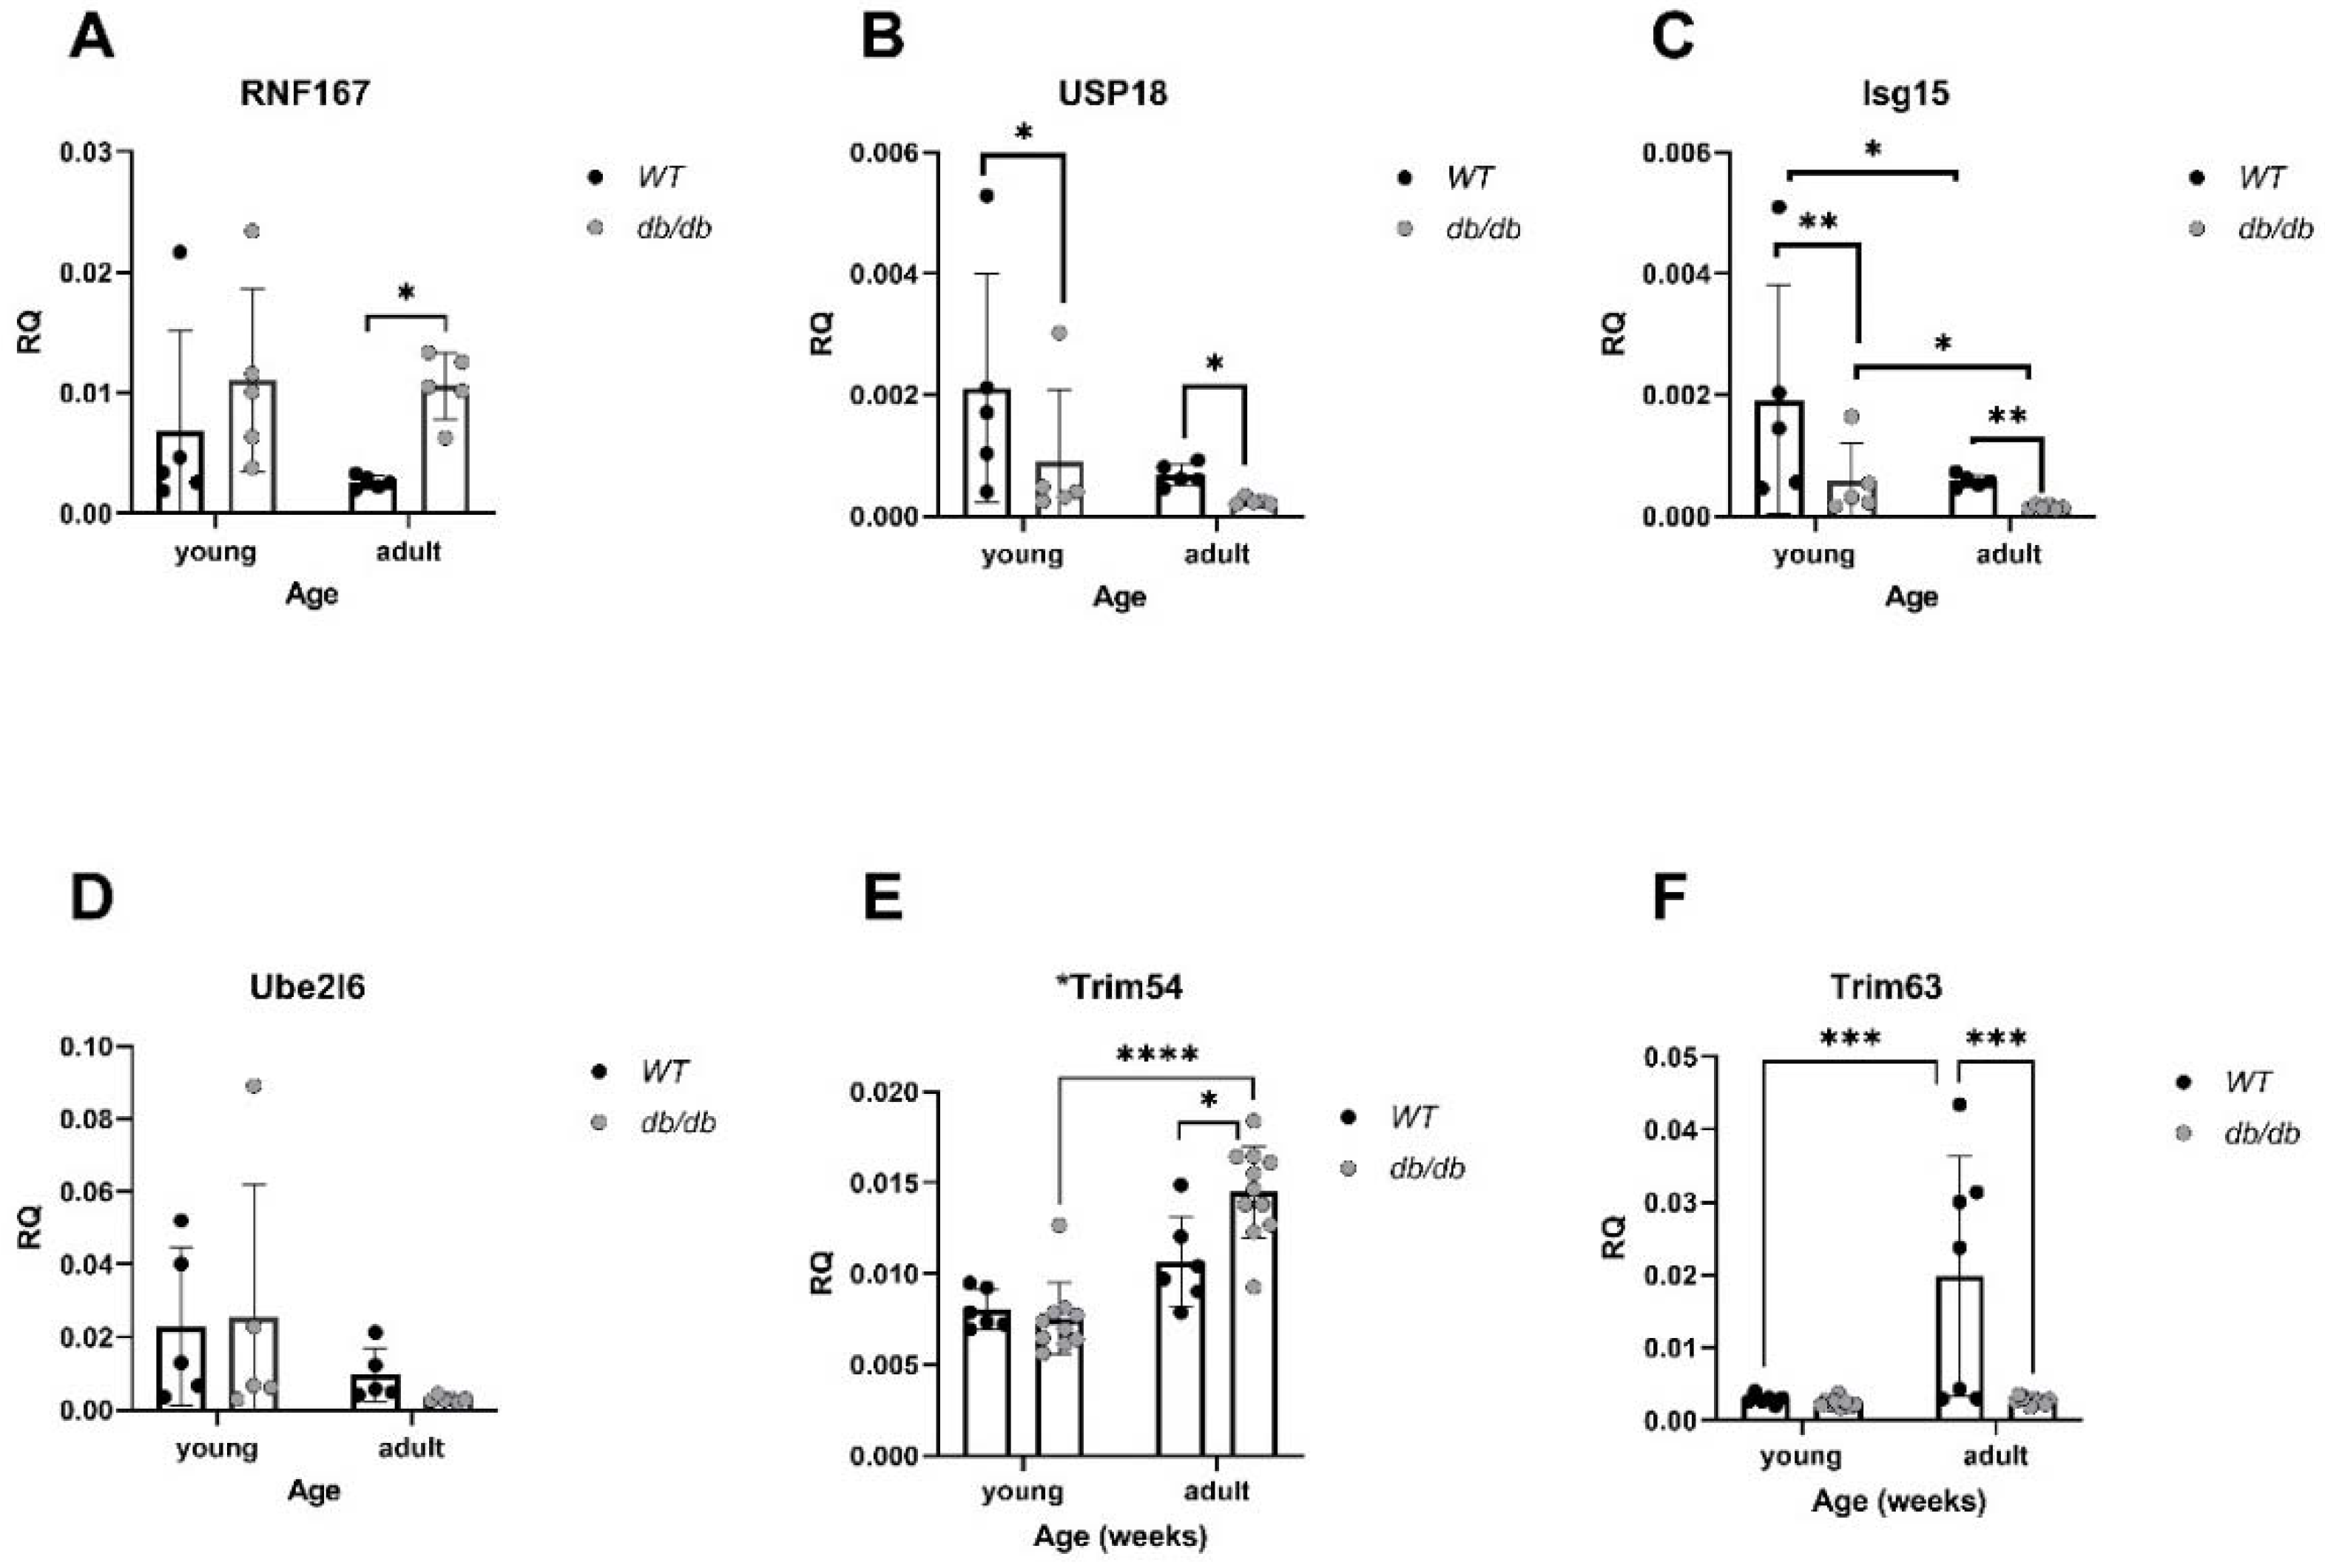
In parallel, mRNA levels of
RNF167, a gene encoding an E3 ubiquitin ligase, were elevated in
Adult diabetic mice compared with
Adult WT mice (P<0.05), (
Figure 7A). Expression of
USP18, a deubiquitinating enzyme (DUB), was significantly lower in diabetic mice compared with
WT mice (p<0.05), (
Figure 7B).
Isg15, encoding the ubiquitin-like protein- USP18 substrate, was significantly downregulated in diabetic mice compared with
WT, regardless of age (p<0.01), (
Figure 7C).
Trim54 and
Trim63, both encoding E3 ligases, were significantly altered. While
Trim54 was significantly upregulated in
Adult diabetic mice compared to
Young diabetic mice (p<0.01), (
Figure 7E),
Trim63 was downregulated in diabetic mice, regardless of age, (p<0.001), (
Figure 7F).
2.3. UPS-related protein expression in db/db mice
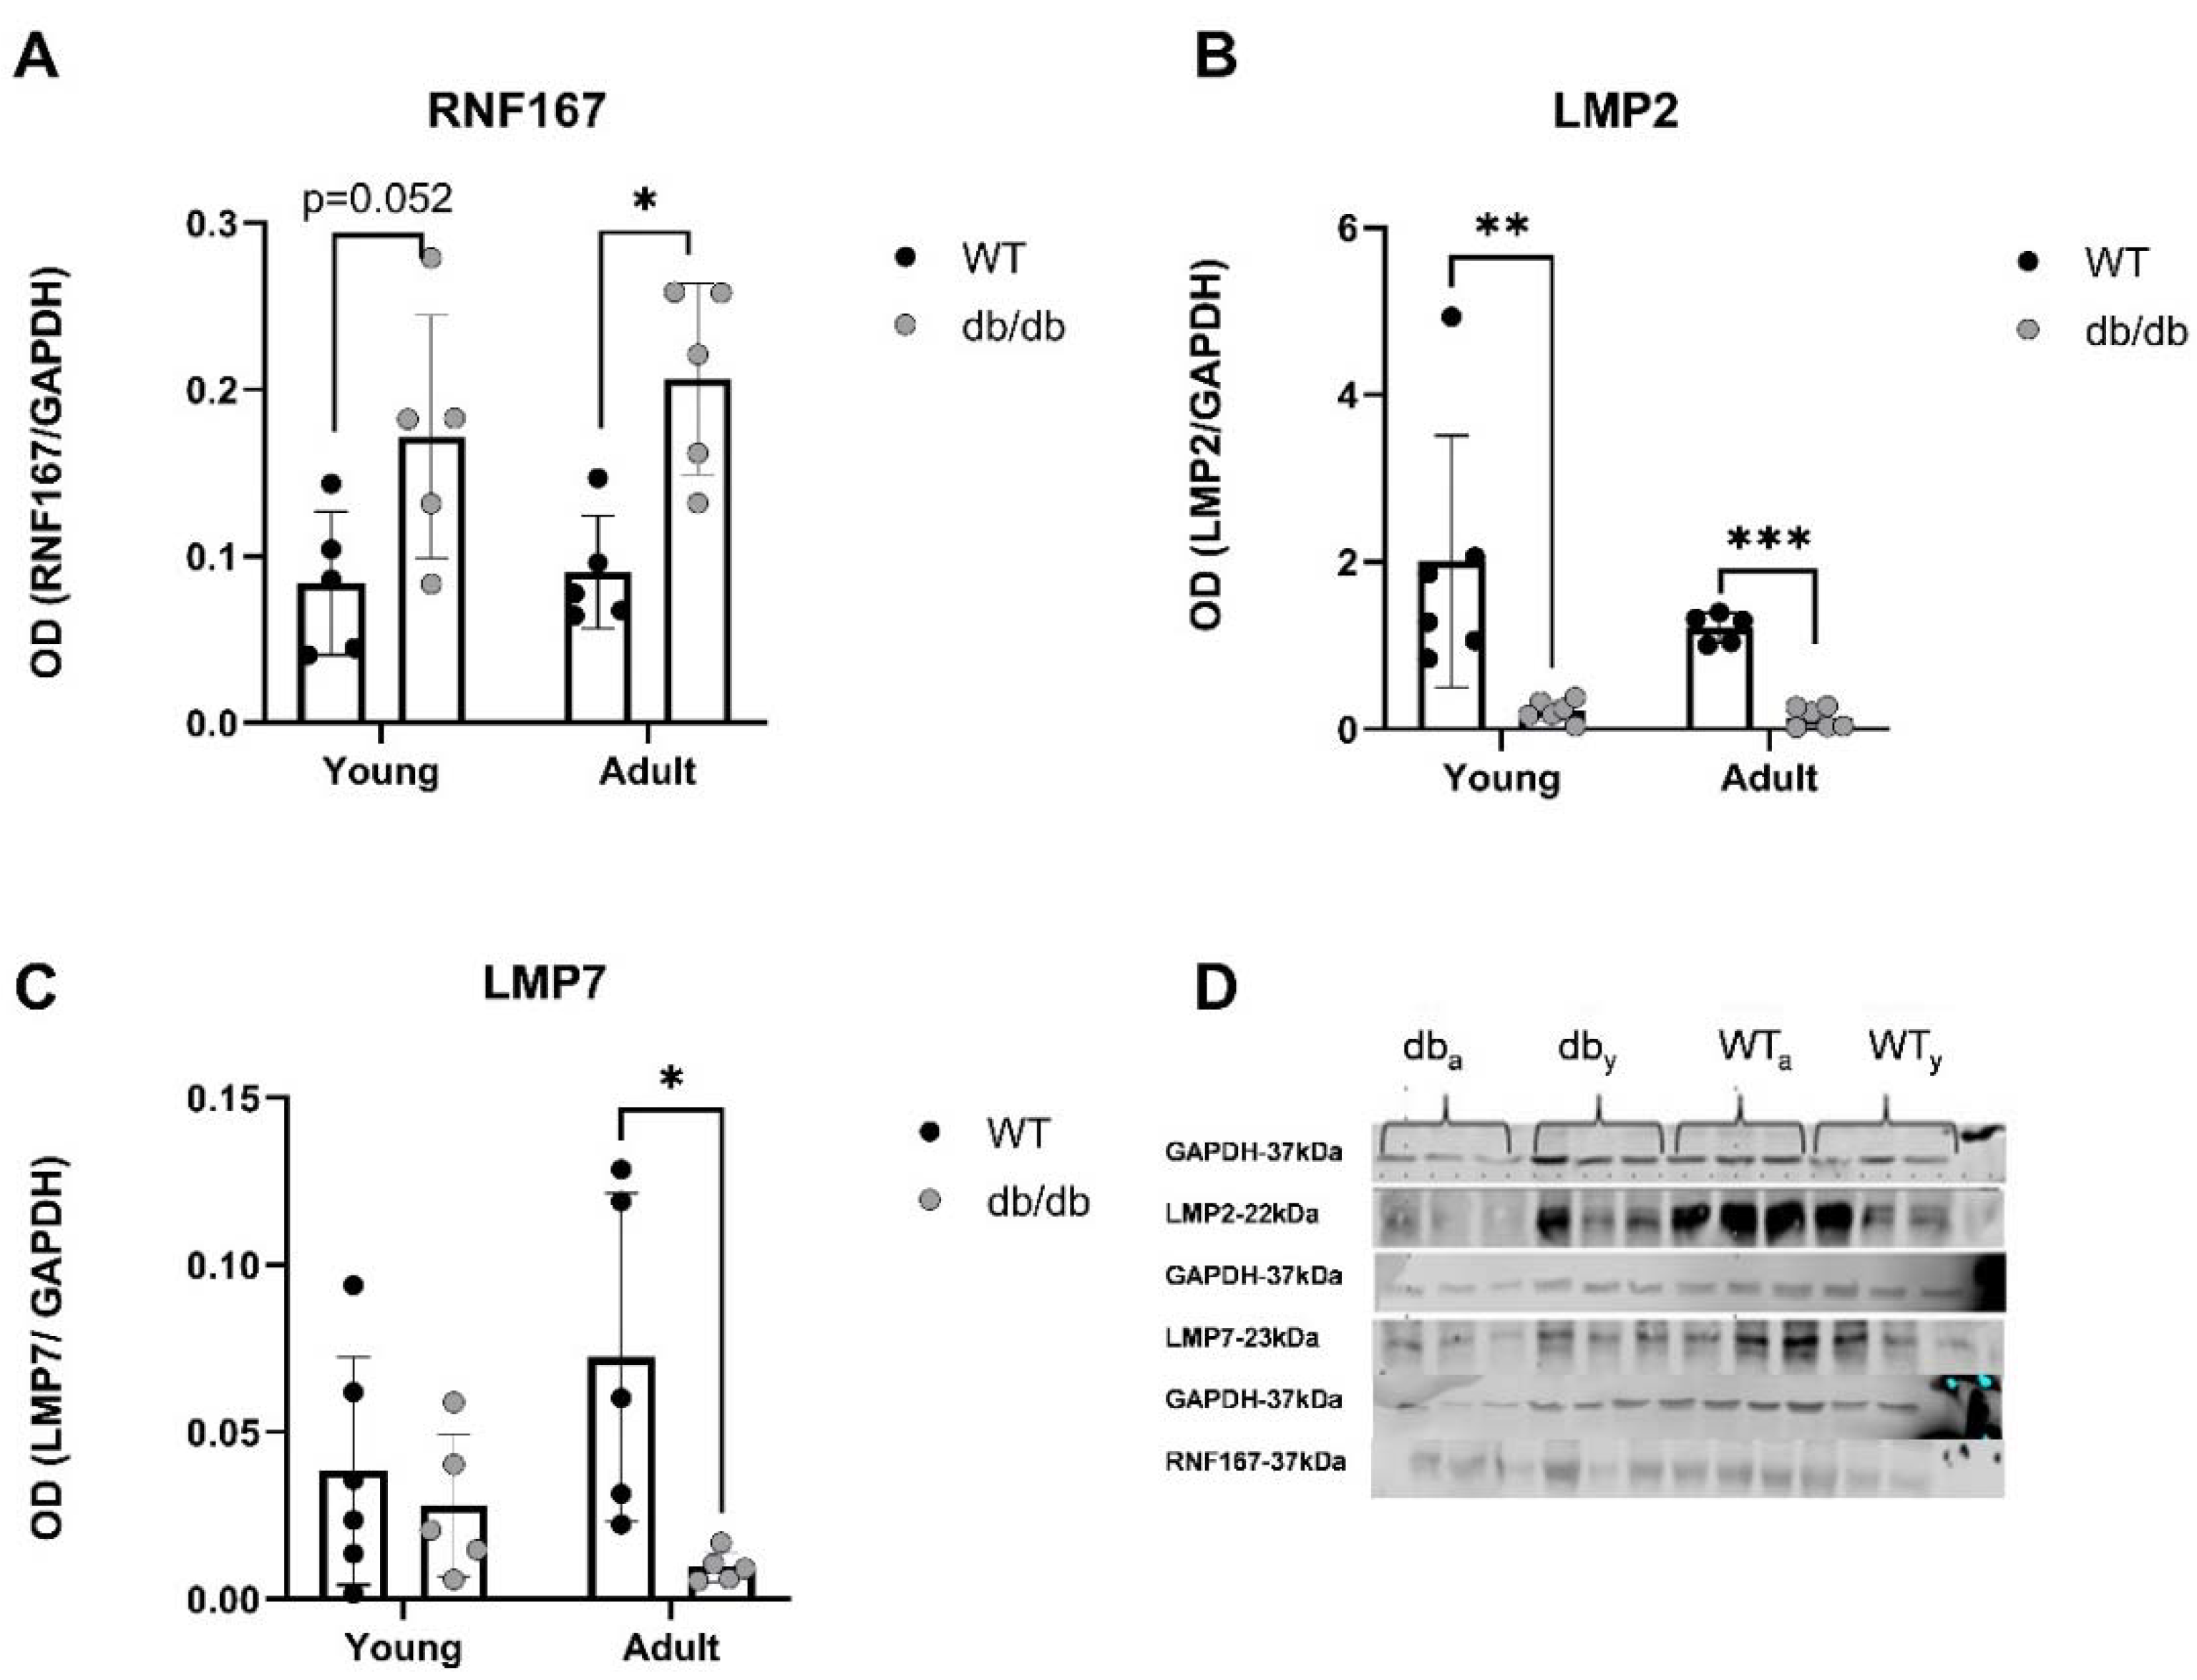
A trend of increasing RNF167 protein levels was detected in
Young db/db mice, while levels were significantly increased in
Adult db/db mice (
Figure 8A). LMP2 and LMP7 were both downregulated in
Adult db/db mice (
Figure 8B-C).
3. Discussion
The study investigated changes in UPS-related gene expression in the heart tissue of db/db mice at different stages of diabetes progression. The analysis revealed that genetic changes in UPS components were already detectable in Young, pre-diabetic mice, indicating an early alteration in UPS activity.
Young db/db mice are considered pre-diabetic, and transition to fully diabetic at approximately 12 weeks of age [
18]. Blood glucose levels in pre-diabetic
db/db mice were slightly higher than in age-matched
WT mice, with a significant value at the
Adult group (
Figure 2A). Heart/body weight ratio significantly declined with age in
WT. This decline is likely due to the greater increase in body and heart weight of
db/db mice, while leaving the heart/body weight ratio nearly unchanged (
Figure 2D). Differences of UPS expression in diabetic myocardial tissue, were already noted with
Young db/db exhibiting reduced 20S proteasome activity compared to
WT (
Figure 3). The 20S reduced activity aligns with reports by Predmore and colleagues, demonstrating reduced proteasomal activity in failing hearts [
23]. The 20S proteasome can remain free or bind to either 19S or 11S regulator units [
24] while 11S can improve 20S ability to specifically locate oxidized proteins. Based on our RNA-seq analysis, genes encoding the 19S particles were not different among the groups, however genes encoding the immunoproteasome and several cardiac genes expressed significant differences (
Figure 4E-4F).
nppb- a circulatory hormone and a heart failure biomarker was reduced in diabetic mice (
Figure 5A) in line with findings reported by Zhang et al, who found that
nppb synthesis is reduced following onset of systemic insulin resistance in mice [
21].
Myh7, was upregulated in
db/db mice (
Figure 5B), suggesting a change in cardiac muscle composition, with possible implications on contractility and functionality. Overexpression of
PSME1, a gene encoding the PA28α unit of 11S, was found to have a positive effect in diabetic and hyperglycemic rat hearts [25, 26]. The current study detected a reduction in
PSME1 mRNA levels in
db/db mice (
Figure 6A), while in
WT mice,
PSME1 mRNA levels increased with age. These findings underscore the importance of
PSME1 in healthy cardiac tissue.
We observed that the mRNA levels of immunoproteasome β subunits, specifically upregulated under stress conditions [
27], increased with age in
WT mice but not in
db/db mice (
Figure 6B-D). This suggests a reduced cellular response to oxidative stress in the diabetic heart, which can further impair protein homeostasis.
E3 ubiquitin ligases hold central role in the progression of cardiovascular pathologies [
27] e.g. cardiac hypertrophy, apoptosis inhibition [28, 29], regulation of cardiac reactive oxygen species (ROS) [
30]. We found upregulation of
RNF167 mRNA levels in
db/db mice (
Figure 7A), and significant increase in expression of its protein in
Adult db/db mice (
Figure 8A). RNF167 upregulation may simultaneously relate to several mechanisms including autophagy and proteasome degradation, both of which impact cellular protein homeostasis. RNF167 has been implicated in the regulation of lysosomal exocytosis [
31], of the α-amino-3-hydroxy-5-methyl-4-isoxazolepropionic acid glutamate receptor (AMPAR). RNF167 along with neural precursor cell-expressed developmentally downregulated gene 4-1 (Nedd4-1) were shown to facilitate ubiquitination of AMPAR in mammalian neurons, [
32] and thereby regulate cell-cell communication [
33]. However, no difference in Nedd4-1 RNA levels was detected between
db/db and
WT mice, further highlighting the specificity of RNF167 upregulation in diabetic mice.
We detected a few changes in mitophagy-related genes in diabetic mice. For example, BCL2/adenovirus-interacting protein 3 (
BNIP3), a mitophagy marker known to be upregulated by the c-Jun N-terminal protein kinase (JNK) pathway in ER-stressed cells and to affect contractility [
34], was downregulated compared with
WT mice.
PARK2 (Parkin), which enhances mitophagy by ubiquitinating mitochondria [
35], was upregulated in
Adult diabetic mice. No changes in any other autophagy genes, such as
ATGs, LC3, or
PINK1 were detected. The limited autophagy-related gene changes detected by RNA-seq in diabetic mice further support our hypothesis of a unique UPS compensatory mechanism underlying diabetic cardiomyopathy.
DUBs sort ubiquitinated proteins to authorize their entry into the proteasome thereby remove and recycle ubiquitin [
36]. Reduced expression of USP18, a DUB involved in regulating inflammation, was observed in diabetic mice (
Figure 7B), suggesting an impaired UPS regulation in the early prediabetes stages.
Reductions in LMP2 (β1i) and LMP7 (β5i) protein levels were also detected, indicating suboptimal functioning of the UPS in diabetic hearts. LMP7, is necessary for balanced protein homeostasis in a healthy aging heart [
37]. Here, we detected a reduction of both LMP2 and LMP7 protein levels in
Adult diabetic mice, suggesting a general immune susceptibility of the diabetic heart. While upregulation of immunoproteasome genes and proteins was expected, these findings proved incongruous with this prediction as the ratio of proteasome/immunoproteasome activity decreased in the heart with age.
Optimal functioning of cardiac UPS components including proteasome, immunoproteasome and E3 ligases, is essential to healthy cardiac function. The presented findings confirm a genetic UPS imbalance in db/db cardiac tissue. This improves our understanding of changes to protein homeostasis in the heart that either precede or accompany diabetes development and include a wide range of UPS players. These findings also raise questions regarding the crosstalk between UPS and other cellular processes such as autophagy, mitophagy, and lysosome trafficking in the diabetic heart. Future research should focus on characterizing the network of UPS players and their respective roles in healthy heart function. Such data may assist in diagnosing UPS imbalances and may identify biomarkers of early-stage cardiac stress prior to a diabetic diagnosis.
4. Materials and Methods
To test this hypothesis, we monitored UPS component expression in the hearts of db/db Young (pre-diabetic) and Adult (diabetic) mice, a T2DM model.
Animal model for T2DM: The animal experiments were approved by the Tel Aviv University Institutional Animal Care and Use Committee.Two strains of mice were used: BLKS/J -Leprdb/-Leprdb/OlaHsd (db/db) mice (a model for type 2 diabetes) and C57BLKs/6JOlaHsd (WT) mice (wild-type control). Mice were acclimated for two weeks in a pathogen-free facility and provided regular rodent chow and water ad libitum.
Animal study design: Mice were divided into two age groups: Young (4-8 weeks old) and Adult (11-18 weeks old).
Glucose measurements: Blood glucose levels were measured in mice after a 12-hour fast using a Glucometer. Mice were weighed and anesthetized with 2% isoflurane inhalation and blood samples were collected from the tail vein for glucose measurement.
Echocardiographic recordings: Mice were anesthetized with 2% isoflurane inhalation. Echocardiography was performed using a Vevo 2100 Imaging System with a 30-MHz linear transducer. Two-dimensional (2D) guided M-mode echocardiography was used to assess heart function. Left-ventricular end-diastolic dimensions (LVEDD) and left-ventricular end-systolic chamber dimensions (LVESD) were measured. Left-ventricular fractional shortening (FS) was calculated as a measure of cardiac function.
RNA extraction from heart tissue: RNA was extracted from heart tissue using the RNeasy Fibrous Tissue Mini Kit. The extracted RNA was quantified using a NANODROP and evaluated for RNA integrity using an RNA integrity number (RIN).
Genomics: RNA sequencing was performed at The Crown Genomics Institute of the Nancy and Stephen Grand Israel National Center for Personalized Medicine. Libraries were prepared using the G-INCPM mRNAseq protocol. Sequencing was performed using the Illumina HiSeq machine. Bioinformatics analysis was conducted to identify differentially expressed (DE) genes and determine relevant biological functions and pathways.
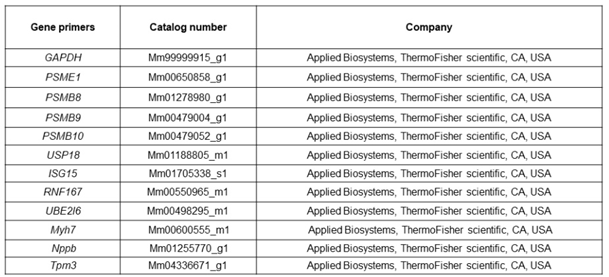
Quantitative real-time polymerase chain reaction (qPCR): cDNA was prepared from RNA samples using the TaqMan High-capacity cDNA Reverse Transcription (RT) kit. qPCR was performed using the Stepone Real-Time PCR cycler. Specific primers were used for amplification, and gene expression levels were quantified using the 2^(-ΔCT) method.
Table 2.
A list of primers used for qRT-PCR.
Table 2.
A list of primers used for qRT-PCR.
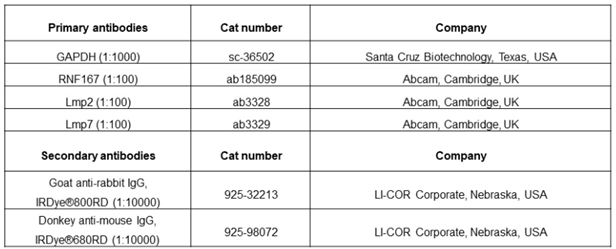
Protein analysis and 20S Proteasome activity: Protein extraction from heart tissue and cells was performed using appropriate buffers. Western blot analysis was conducted to detect protein expression using specific antibodies. 20S proteasome activity was measured using a fluorescence-based assay.
Table 3.
List of antibodies used for western blotting.
Table 3.
List of antibodies used for western blotting.
Statistical analysis: Data are presented as mean ± standard deviation. Differences between experimental groups were analyzed using two-way analysis of variance (ANOVA) followed by a Tukey test or the Mann–Whitney non-parametric test. A p-value of < 0.05 was considered statistically significant.
Figure 1.
The ubiquitin proteasome system: (A) Three types of enzymes promote degradation; ubiquitin-activating enzymes (E1), ubiquitin-conjugating enzymes (E2), and ubiquitin-ligating enzymes (E3). Initially, E1 binds a ubiquitin molecule forming an ATP-dependent thioester linkage. The ubiquitin relocates to an E2 enzyme, which either transfers the ubiquitin to E3 directly or binds to E3 as an adaptor protein. Together E2 and E3 attach ubiquitin to a lysine residue on the target protein. Deubiquitinating enzymes (DUBs) sort ubiquitinated proteins remove and recycle ubiquitin. (B) A constitutive proteasome 19S-20S-19S (left) and immunoproteasome 11S-20S-11S (right).
Figure 2.
Physiological differences obtained by glucose, body weight and heart weight measurements of Young and Adult db/db and WT mice. Y: 4-8-week-old. A: 11-18-week-old. Glucose: WTy: n=6, dby: n=6, WTa: n=6, dba: n=5, (A). Body weight: WTy: n=6, dby: n=6, WTa: n=6, dba: n=5, (B). Heart weight: WTy: n=6, dby: n=6, WTa: n=6, dba: n=5, (C). Heart/body weight .
Figure 3.
Abnormal 20S proteasome activity in diabetic mice. Young: 6-week-old (y), Adult: 12-week-old (a) WTy: n=5, dby: n=6, WTa: n=5 dba: n=5, Two-way ANOVA ** p < 0.01, *** p <0.001.
Figure 3.
Abnormal 20S proteasome activity in diabetic mice. Young: 6-week-old (y), Adult: 12-week-old (a) WTy: n=5, dby: n=6, WTa: n=5 dba: n=5, Two-way ANOVA ** p < 0.01, *** p <0.001.
Figure 4.
RNA sequencing of cardiac samples detected changes in over 500 genes. A principal component analysis (PCA) was performed to present the sample differences according to gene expression levels. Threshold for significance was set at p adjusted ≤≤ 0.05, Max counts per gene ≥≥ 30, |Fold Change| ≥≥ 2 (A). Differential expression (DE) comparisons found major gene expression differences between age-matched db/db and WT mice groups (B). DE of cardiomyopathy (C-D)- and UPS-related genes (E-F) detected by RNA sequencing in young (4-8-week-old) and adult (11-18-week-old) db/db vs. WT mice.
Figure 5.
Cardiomyopathy-related gene alterations in diabetic mice, detected by qRT-PCR. RNF167 (n=5) (A), USP18 (n=5), (B), Isg15 (n=WTy: n=5, dby: n=5, WTa: n=5, dba: n=6) (C), Ube2l6 (n=WTy: n=5, dby: n=5, WTa: n=5, dba: n=6) (D), nppb (n=WTy: n=5, dby: n=5, WTa: n=9, dba: n=7) (E). Myh7 (n=WTy: n=5, dby: n=5, WTa: n=6, dba: n=5) (F). Tpm3: (n=WTy: n=5, dby: n=5, WTa: n=7, dba: n=5) (G). Results are normalized to GAPDH. *P< 0.05, ** P< 0.01 using a Two-way ANOVA with interaction.
Figure 6.
Reduced expression of genes encoding for immunoproteasome components in diabetic mice. mRNA levels of proteasome component genes were compared between db/db and WT mice. Psme1: WTy: n=5, dby: n=5, WTa: n=8, dba: n=9, (A), Psmb8: WTy: n=5, dby: n=6, WTa: n=8, dba: n=9, (B). Psmb9: WTy: n=5, dby: n=4, WTa: n=10, dba: n=8, (C). Psmb10: WTy: n=6, dby: n=5, WTa: n=9, dba: n=9, (D). Results are normalized to GAPDH. Two-way ANOVA. * p< 0.05, ** p< 0.01, *** p< 0.001, **** p< 0.0001.
Figure 7.
Alterations in UPS-related gene expression in diabetic mice: mRNA levels of UPS genes were compared between db/db and WT mice. RNF167: All groups: n=5, (A). USP18: All groups: n=5, (B). Isg15: WTy: n=5, dby: n=5, WTa: n=5, dba: n=6, (C). Ube2l6: WTy: n=5, dby: n=5, WTa: n=5, dba: n=6, (D), Trim54 (Murf3): WTy: n=6, dby: n=6, WTa: n=10, dba: n=11, (E). Trim63 (Murf1): WTy: n=6, dby: n=7, WTa: n=9, dba: n=10, (F). Results are normalized to GAPDH. Two-way ANOVA * p< 0.05, ** p< 0.01, *** p< 0.001, **** p< 0.0001.
Figure 8.
UPS-related proteins are expressed differently in the heart of db/db mice compared with WT. Proteins expression was evaluated using western blot analysis. RNF176 (n=5) (A), LMP2 (n=5-6) (B) and LMP7 (n=5-6) (C), P<0.05) (D), *p< 0.05, **P<0.01. Multiple Mann-Whitney.
Figure 8.
UPS-related proteins are expressed differently in the heart of db/db mice compared with WT. Proteins expression was evaluated using western blot analysis. RNF176 (n=5) (A), LMP2 (n=5-6) (B) and LMP7 (n=5-6) (C), P<0.05) (D), *p< 0.05, **P<0.01. Multiple Mann-Whitney.
Table 1.
Echocardiography: Interventricular septum (IVS), left ventricular posterior wall (LVPW), left
ventricular end dimension diastole/systole (LVEDD/LVESD respectively), fractional shortening
(FS%). T-test * p < 0.05.
Table 1.
Echocardiography: Interventricular septum (IVS), left ventricular posterior wall (LVPW), left
ventricular end dimension diastole/systole (LVEDD/LVESD respectively), fractional shortening
(FS%). T-test * p < 0.05.
