Submitted:
09 August 2023
Posted:
11 August 2023
You are already at the latest version
Abstract
Keywords:
1. Introduction
2. Materials and Methods
2.1. Design of the software
2.2. Validation of application cases
3. Results
3.1. Design of the software
3.1.1. Subsubsection
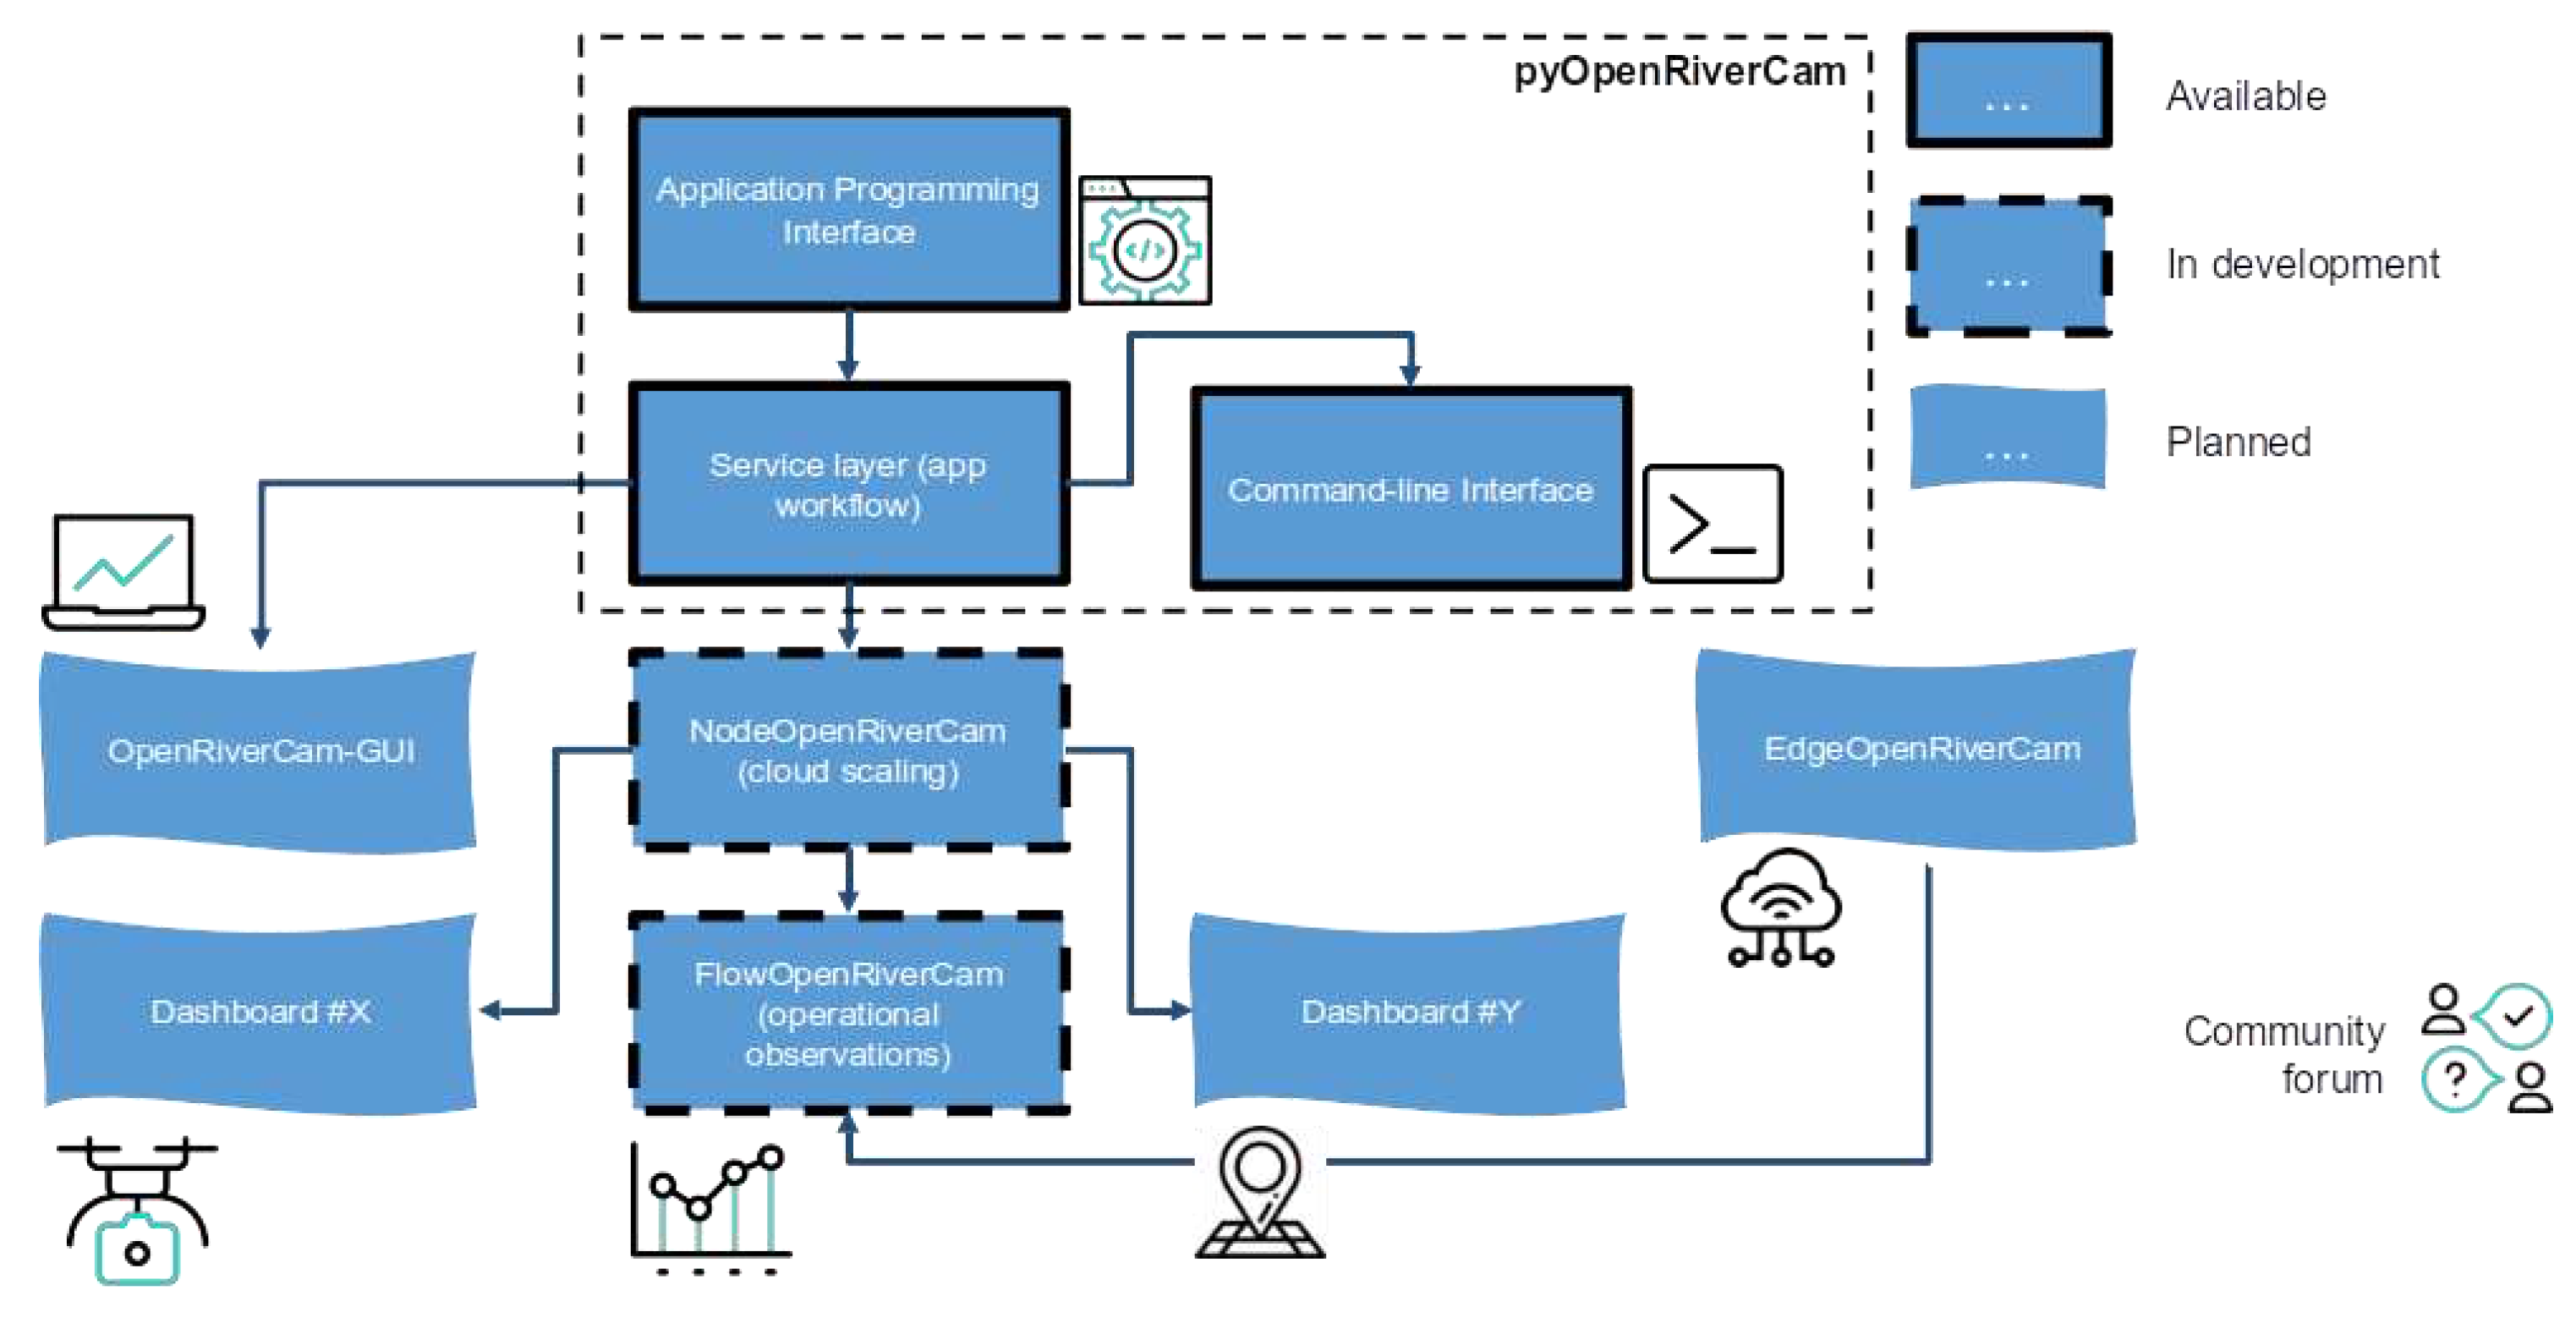
- Have the entire framework available in Github, with issue management.
- Establish a user forum with a code of conduct (not yet established at the time of writing, but part of the roadmap).
- Choose a license that guarantees on the one hand that anyone can further develop the software, and build applications, but also ensures that those developments then become available to other users of the code. We have chosen the Affero General Public License version 3 for this purpose.
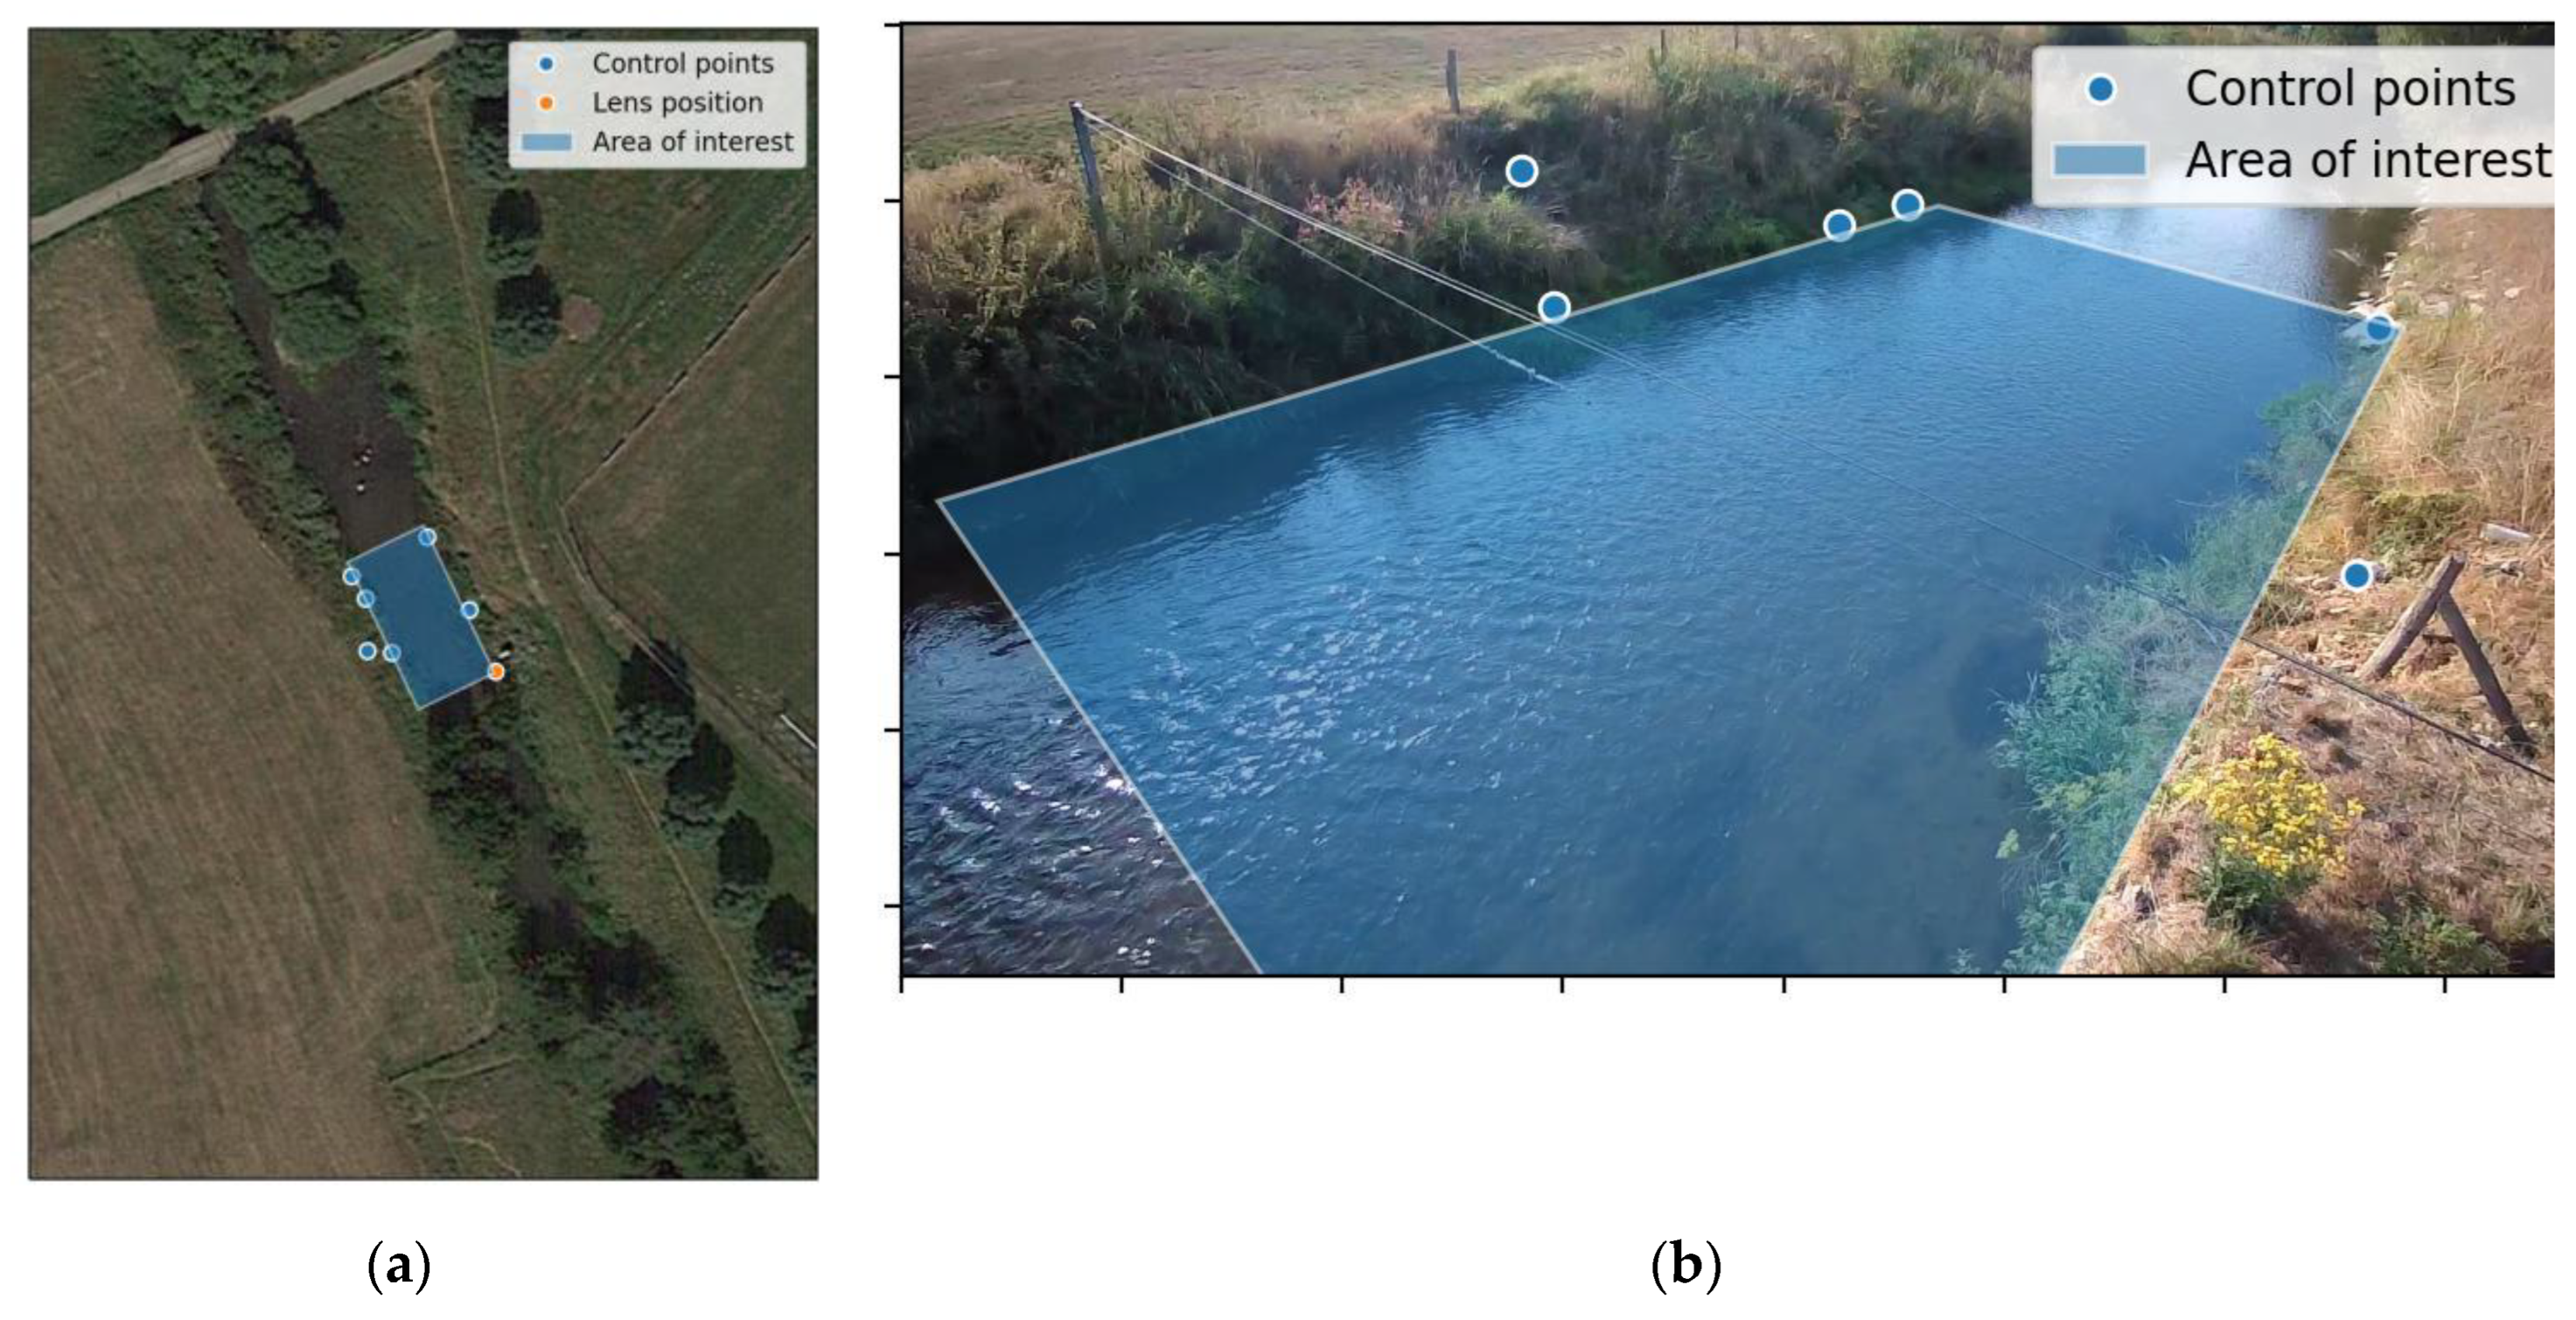
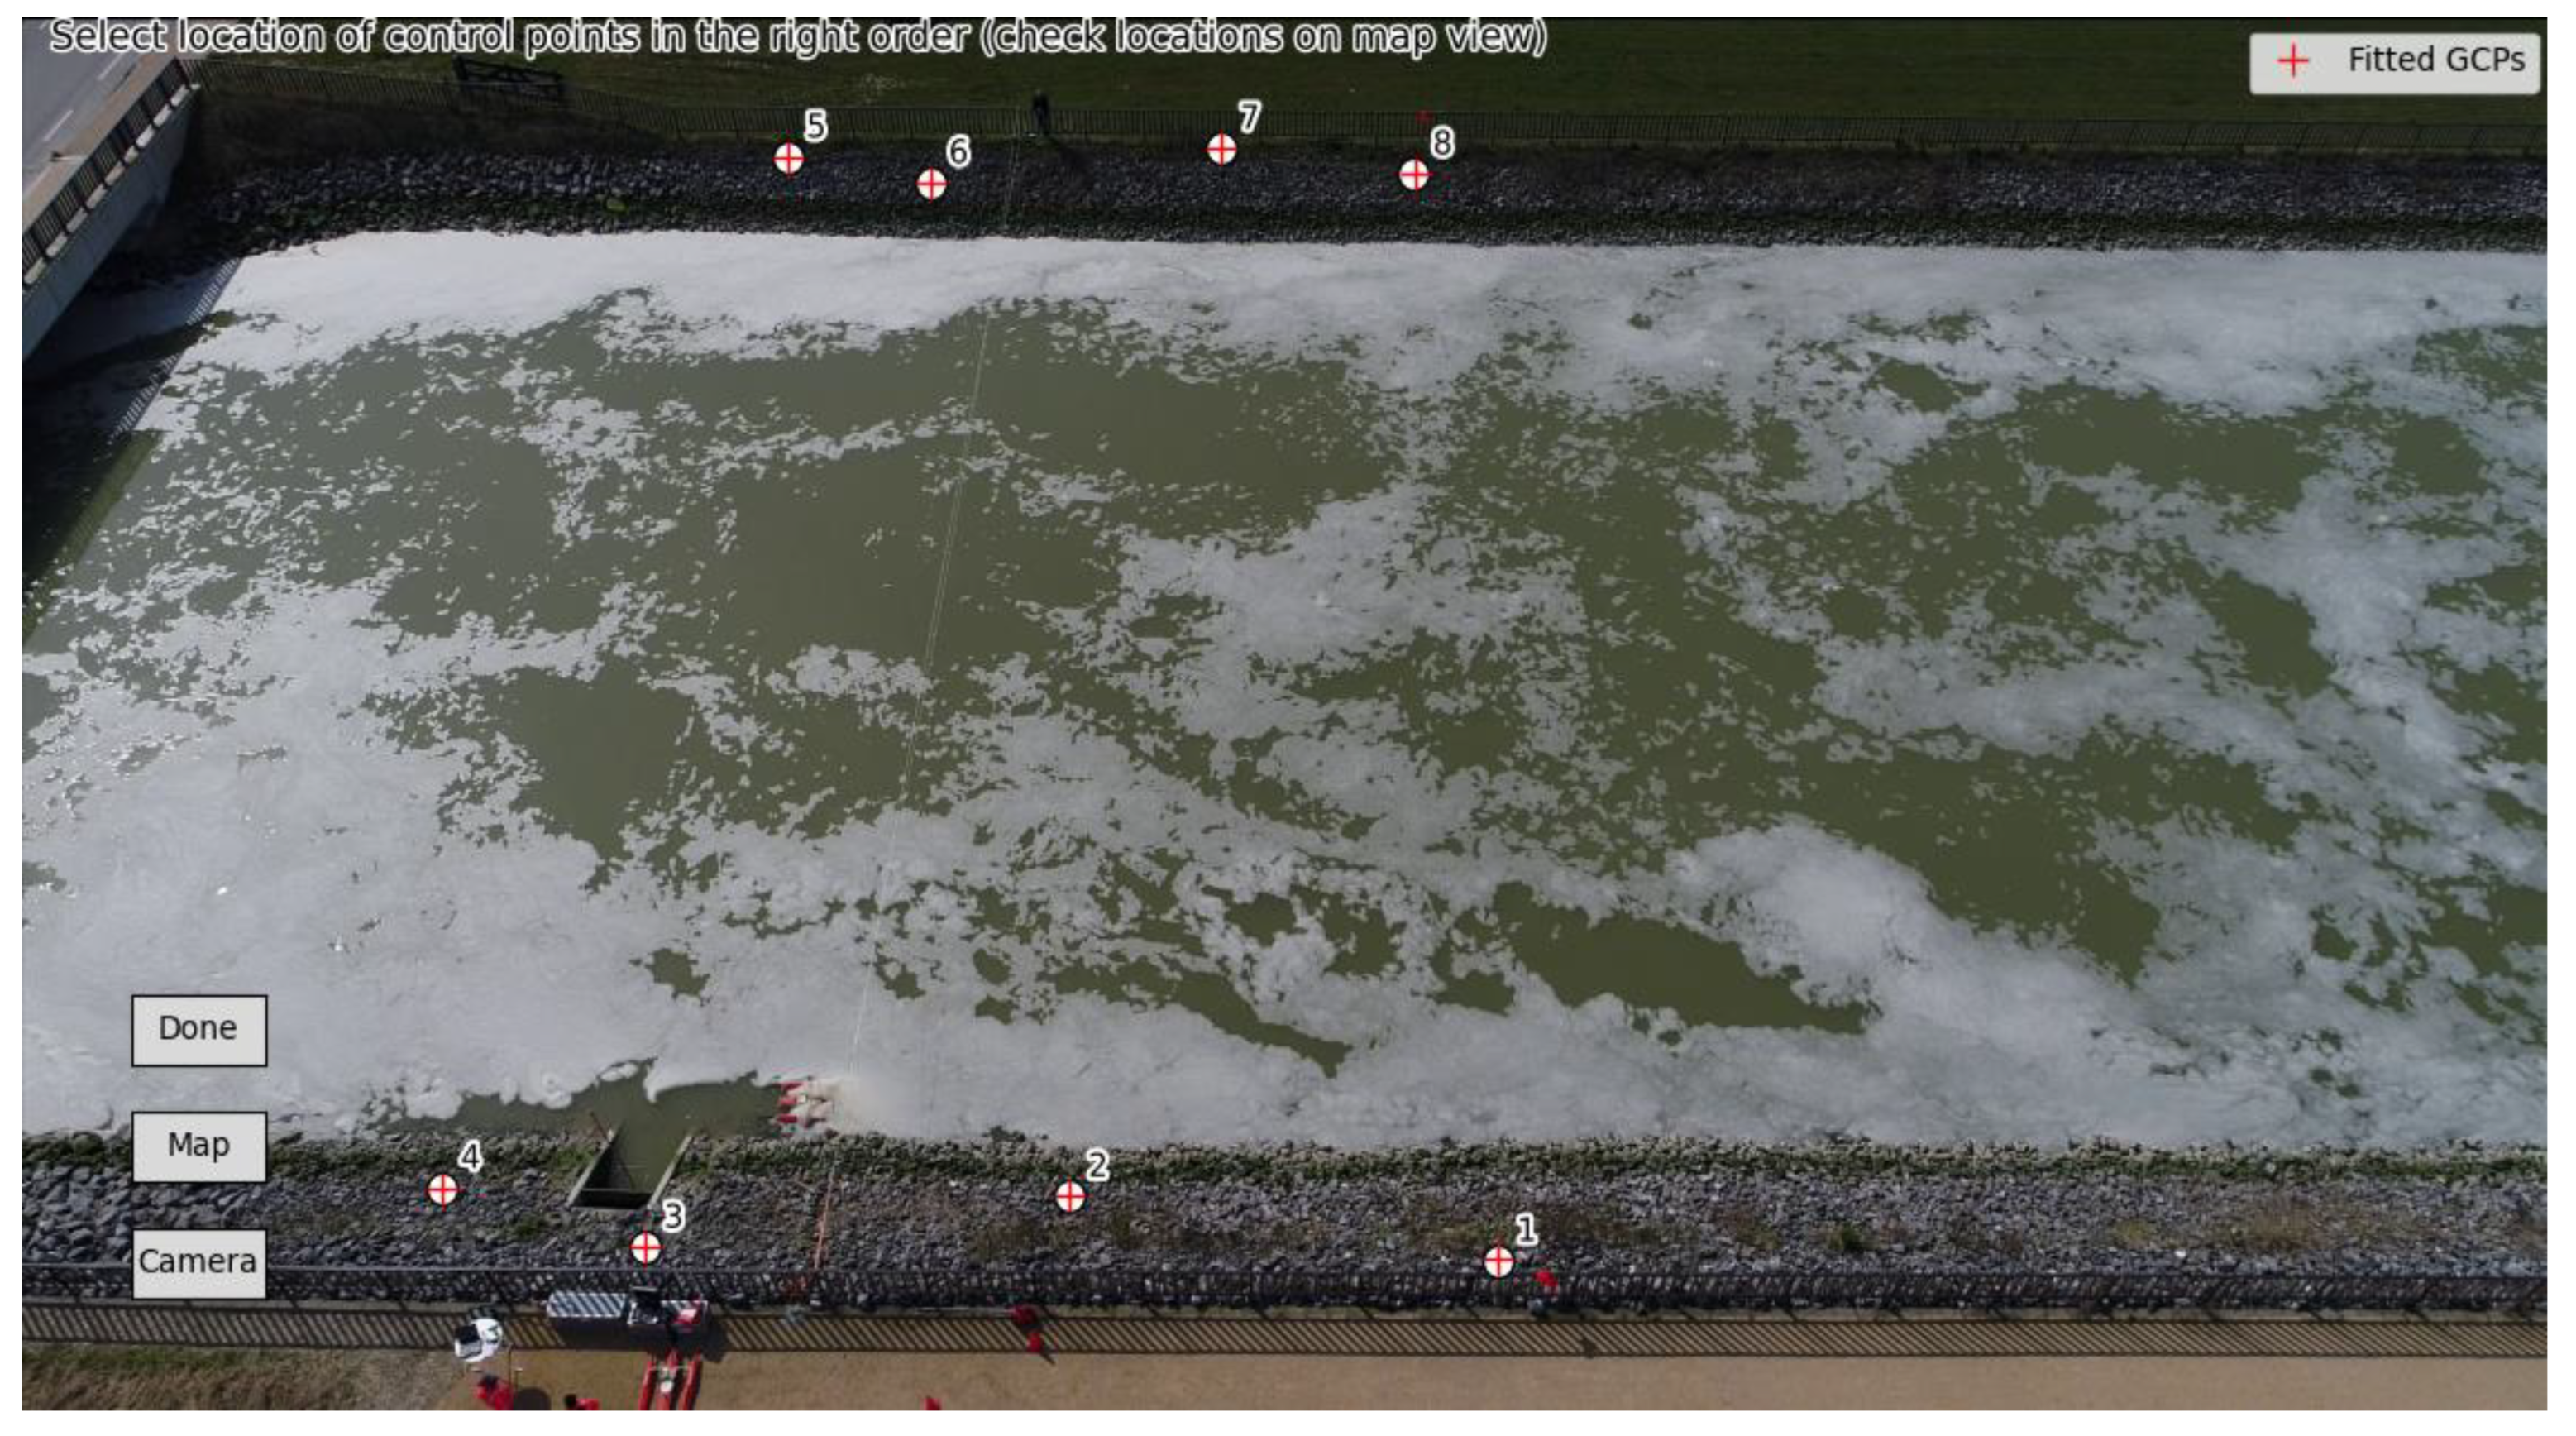
- CameraConfig: defines the camera extrinsic and intrinsic characterization, using several methods that make it very easy and intuitive for the user to provide the right information. For instance an area of interest can be defined in the camera objective, by clicking 4 points. A geographically perfectly rectangular bounding box will be fitted through them.
- Video: defines the video file to read, region to use for stabilization (if needed), the start and end frame and the CameraConfig object required to perform orthorectification on frames.
- Frames: derived from the Video object. A user can perform several preprocessing filters and thresholding on the frames and orthorectify the frames to the chosen resolution and area of interest.
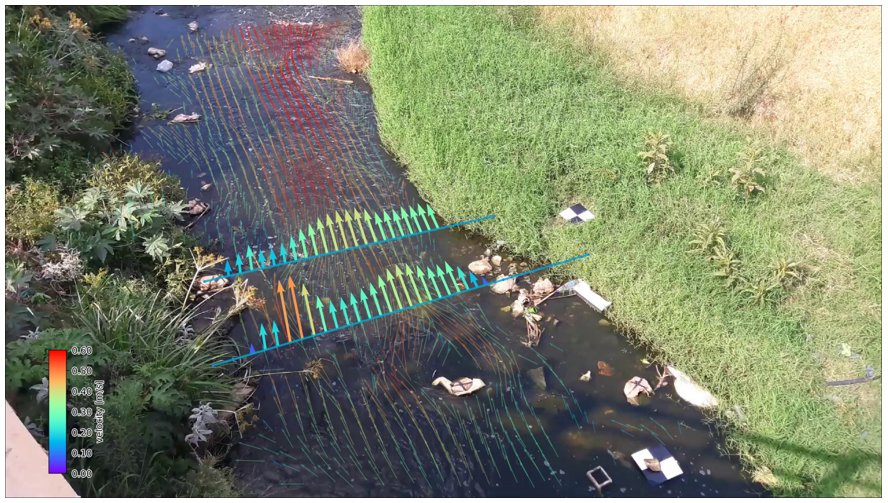
- Velocimetry: derived from the Frames object, after performing orthorectification, provides raw velocities, and several masking functions to remove spurious velocities. The PIV methods are using the OpenPIV library as a basis.
- Transect: derived from Velocimetry object by combination with a depth cross-section. Provides velocities over a cross-section by sampling from the 2D surface velocities using (optionally) x and y-directional window sizes, infilling of missing values with several methods, and interpretation of depth averaged velocities and river flow through integration.
- Plot: holds several plotting functions on top of the Frames, Velocimetry and Transect classes that can be combined to create plots with a raw or orthoprojected frame, 2D velocity information, and transect information in one graph.
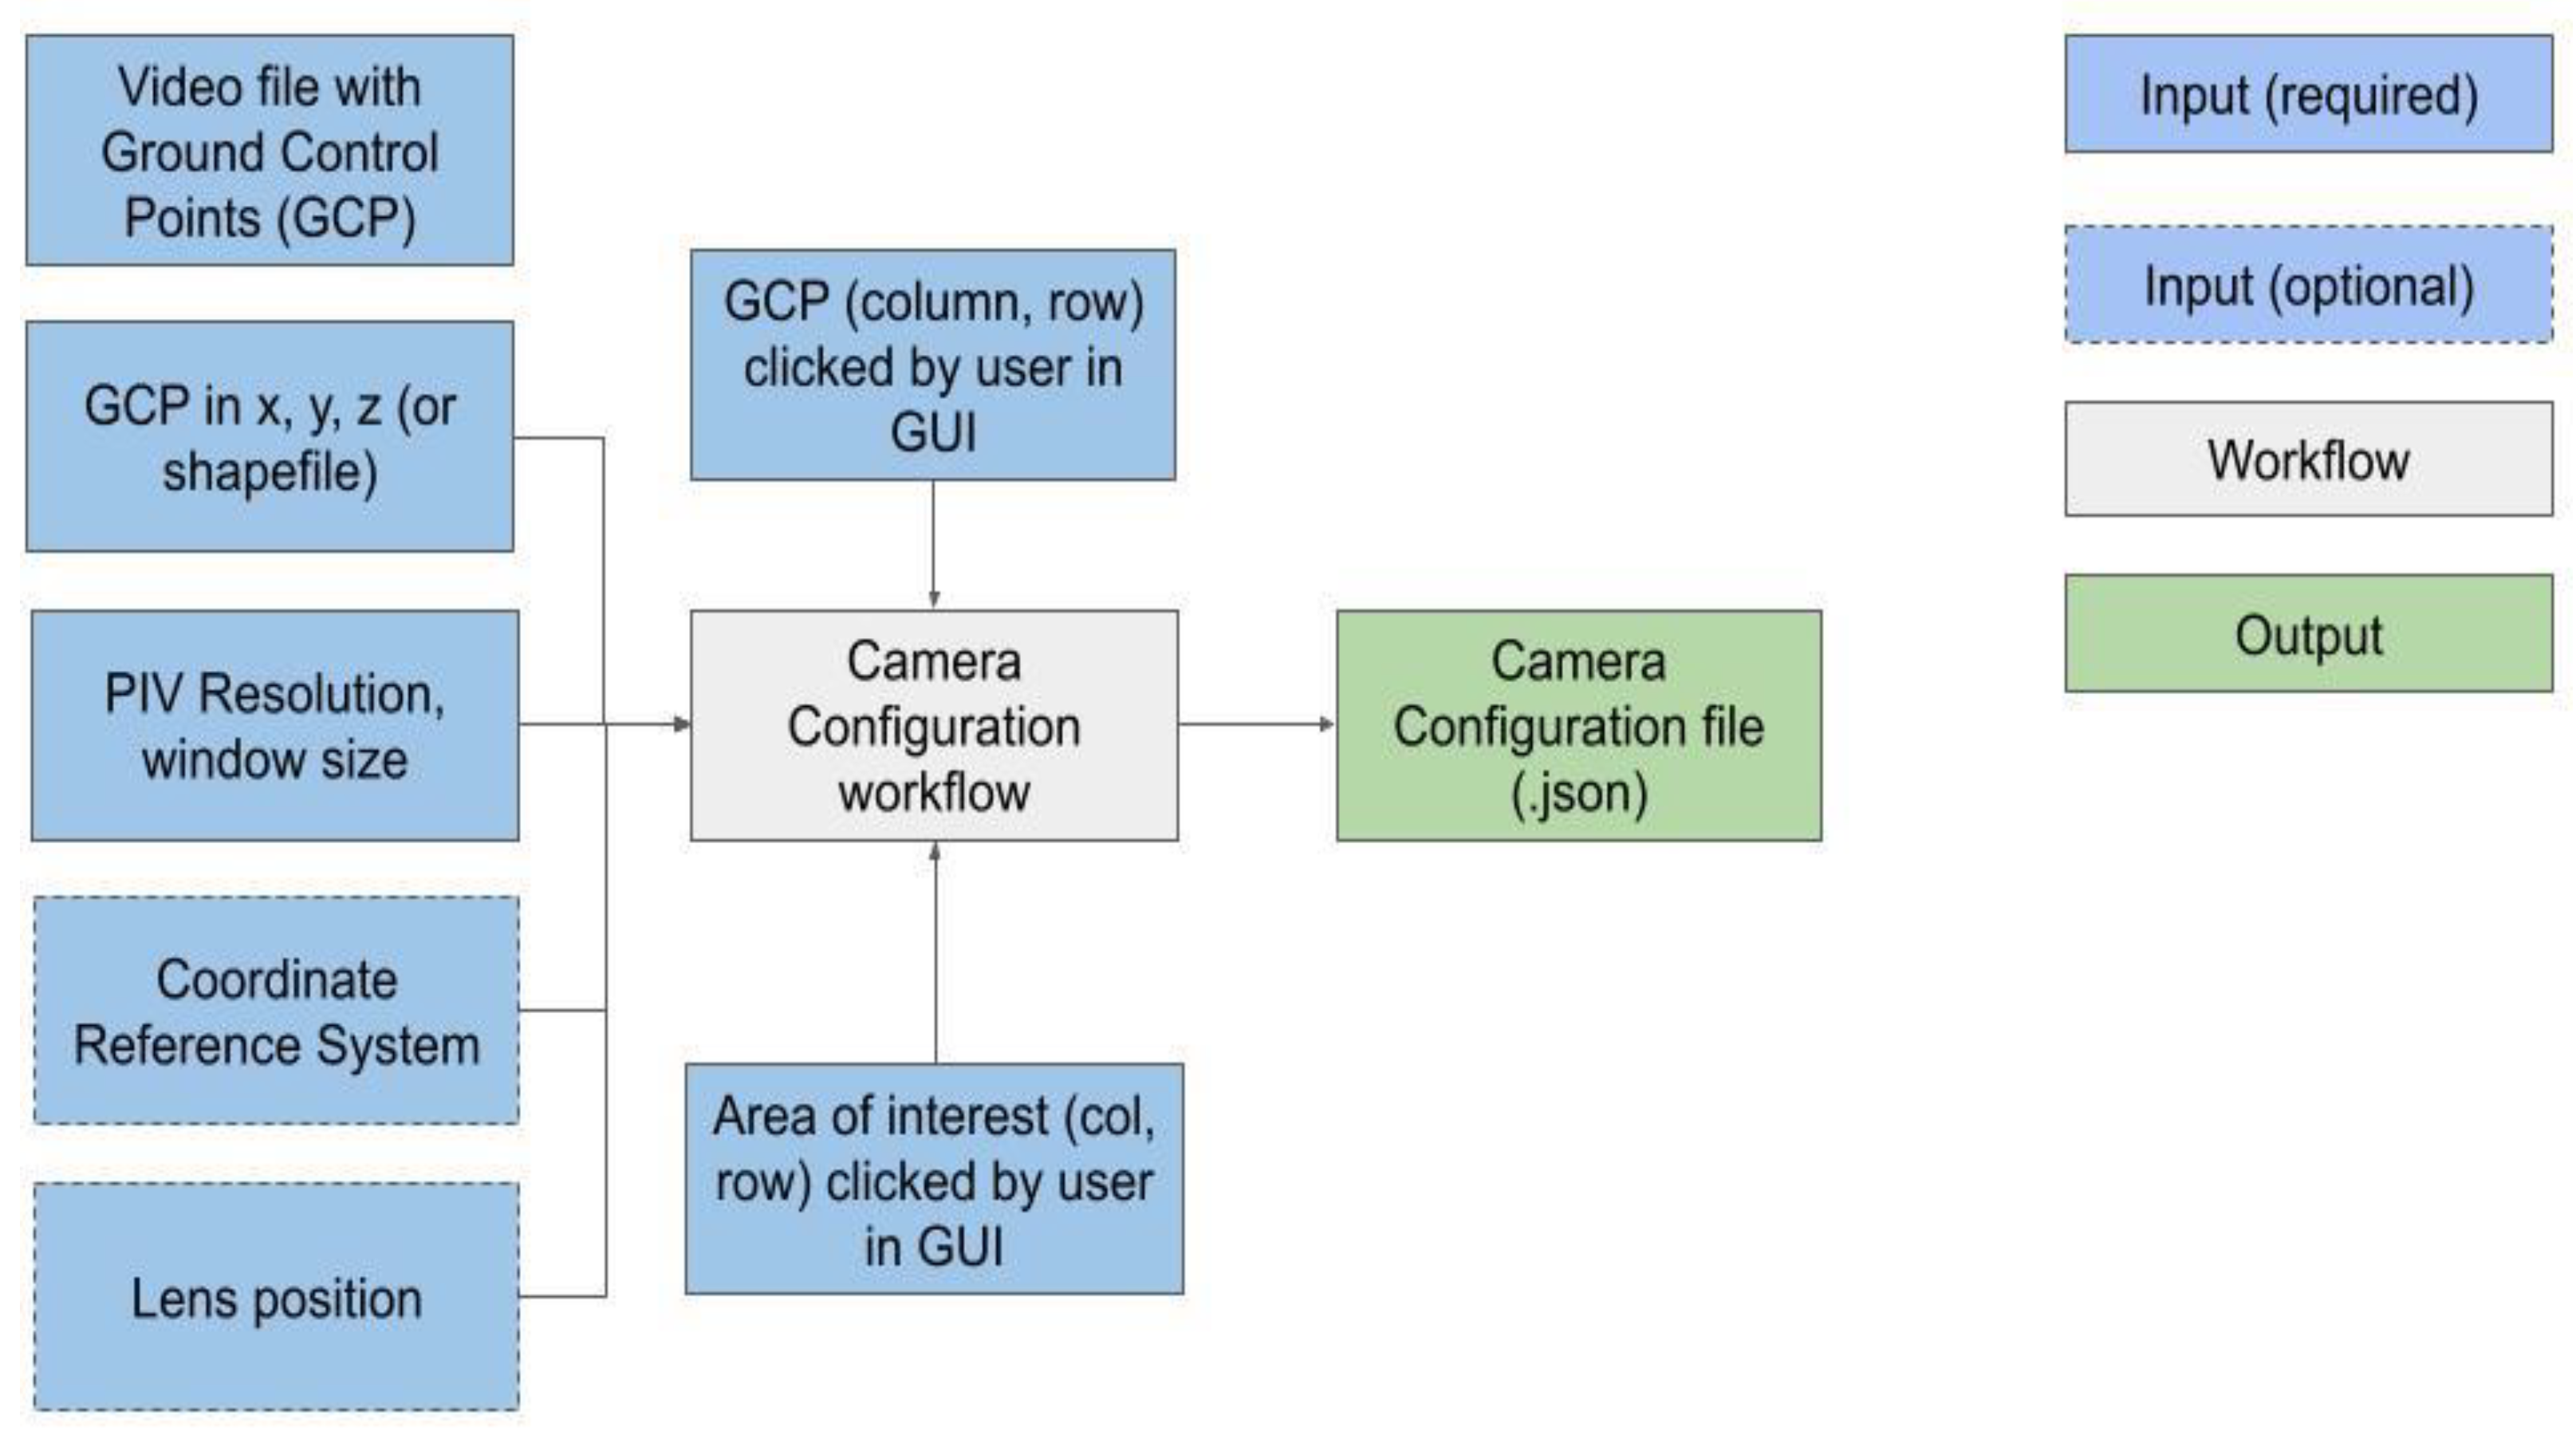
- the camera configuration workflow (see Figure 3): this workflow creates a configuration file that defines the camera lens characteristics, perspective, region of interest, water level datums, and stabilization parameters (for e. g. drone videos). Within the command-line interface, the workflow can collect parts of the required information interactively from the user through several interactive displays of frames.
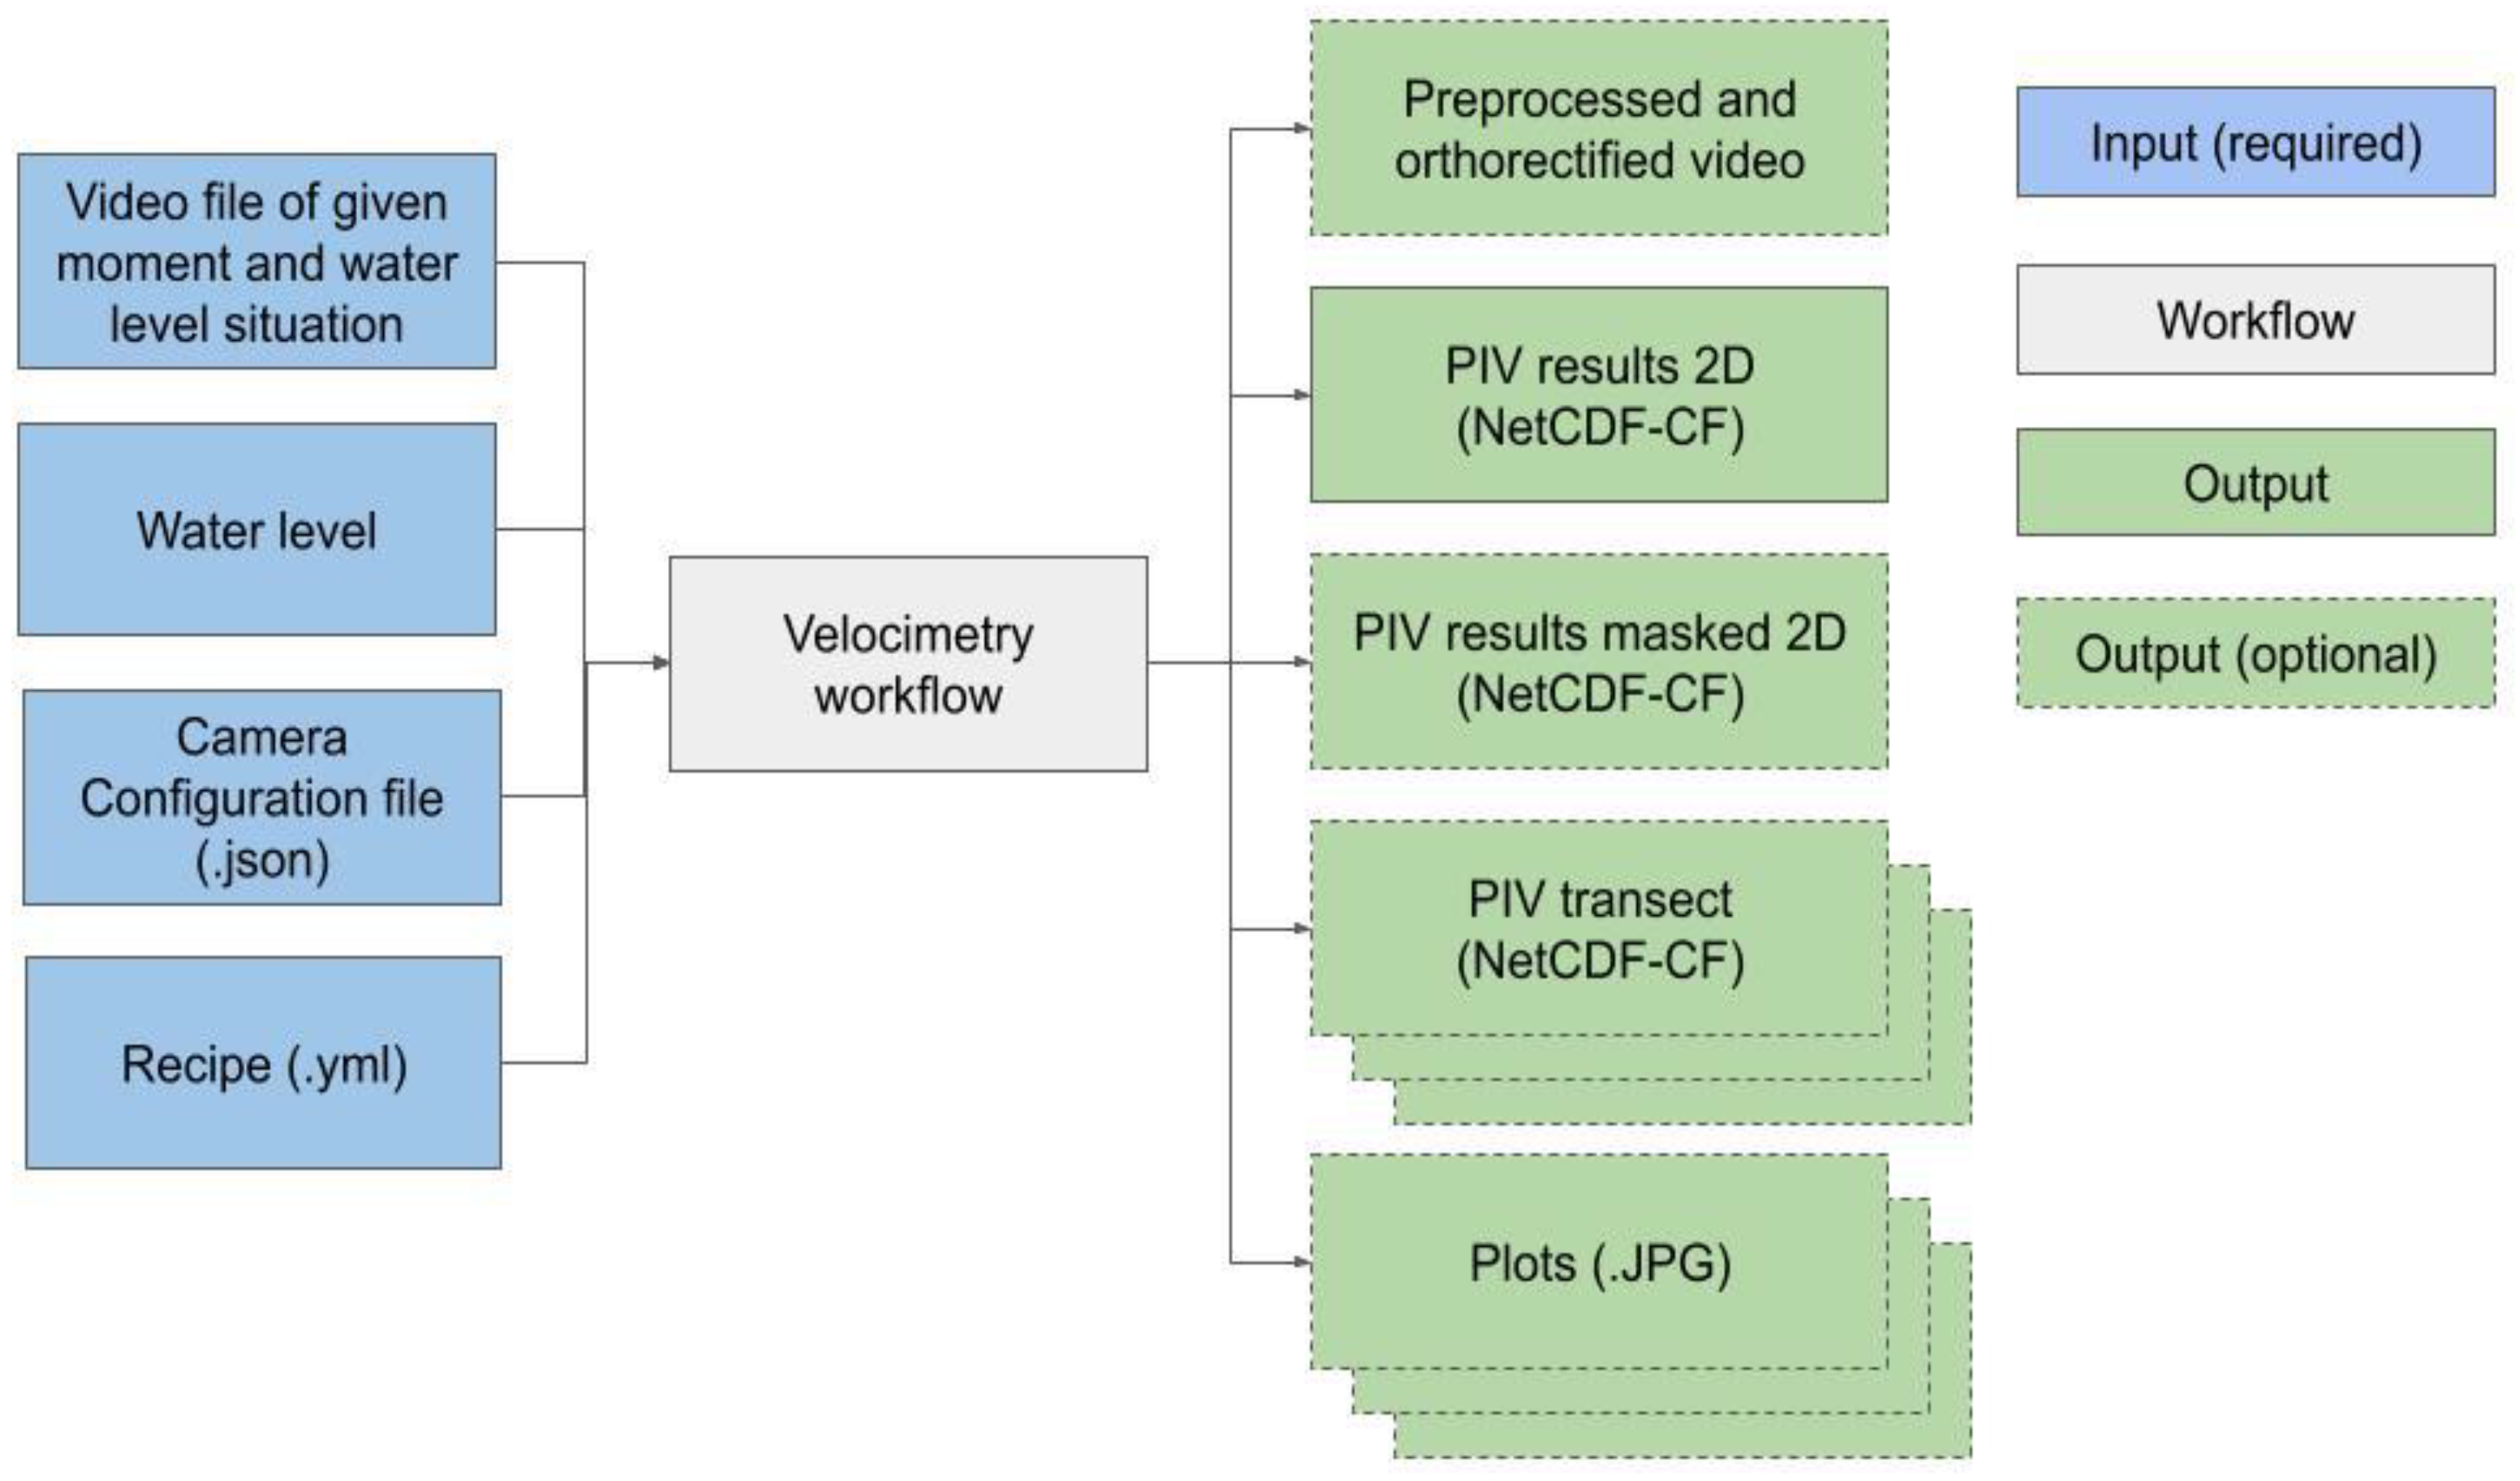
- the velocimetry workflow (see Figure 4): this workflow processes a video, with a camera configuration, and a “recipe” into end products such as velocity fields, cross section velocities, discharge, and plots. This is done through several steps, being frame stabilization (only if needed), preprocessing, orthorectification, velocimetry estimation and estimation of flow through measured cross sections. The “recipe” contains different steps, configured in a yaml formatted text file. The entire processing chain contains frame extraction, stabilization, preprocessing, orthorectification, PIV analysis, post-processing, transect extraction, discharge estimation and plotting all of which can be configured by the user through well-documented methods. The recipe is entirely serializable so that in future developments of platforms around pyOpenRiverCam, such as user interfaces, thin client server-side operated web dashboards or edge applications, can easily be configured through a serialized recipe sent from a user interface to the underlying API, wherever this API runs. The recipe can be re-used for many videos of the same objective, as long as the characteristics of the video and the orientation of the camera remain the same.
3.2. Validation of the OpenRiverCam software
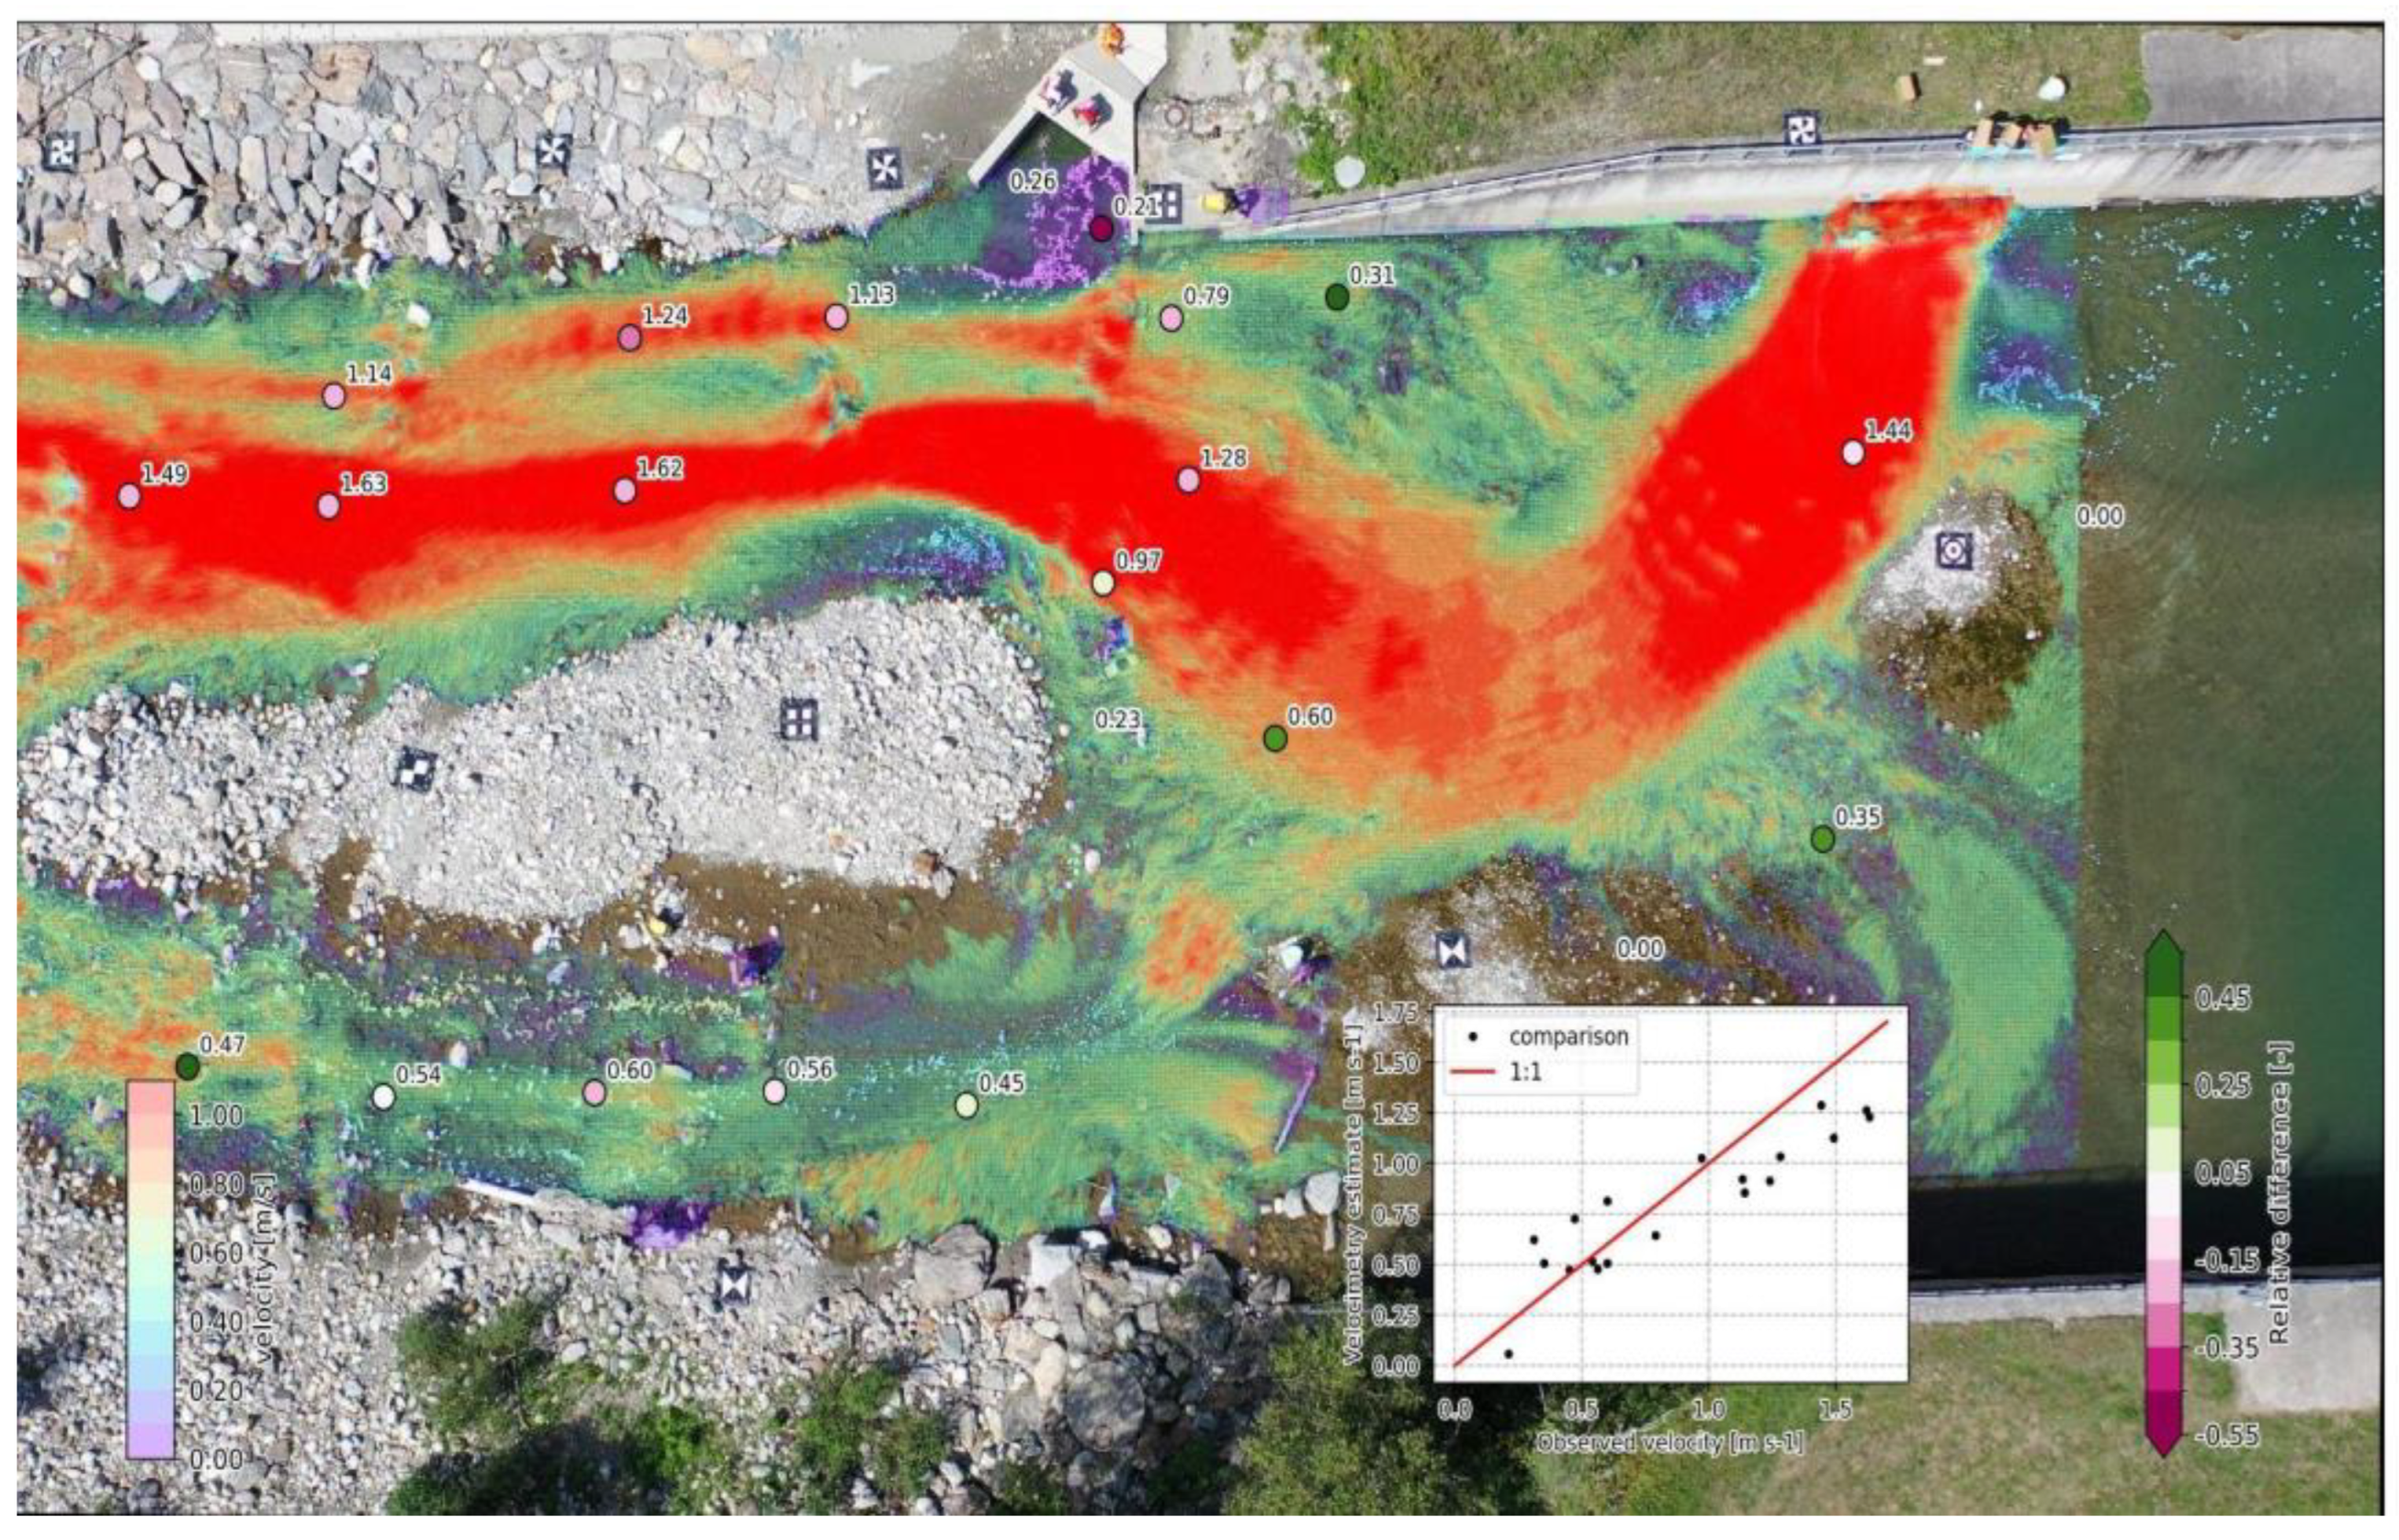
3.2.1. Case 1: Alpine river
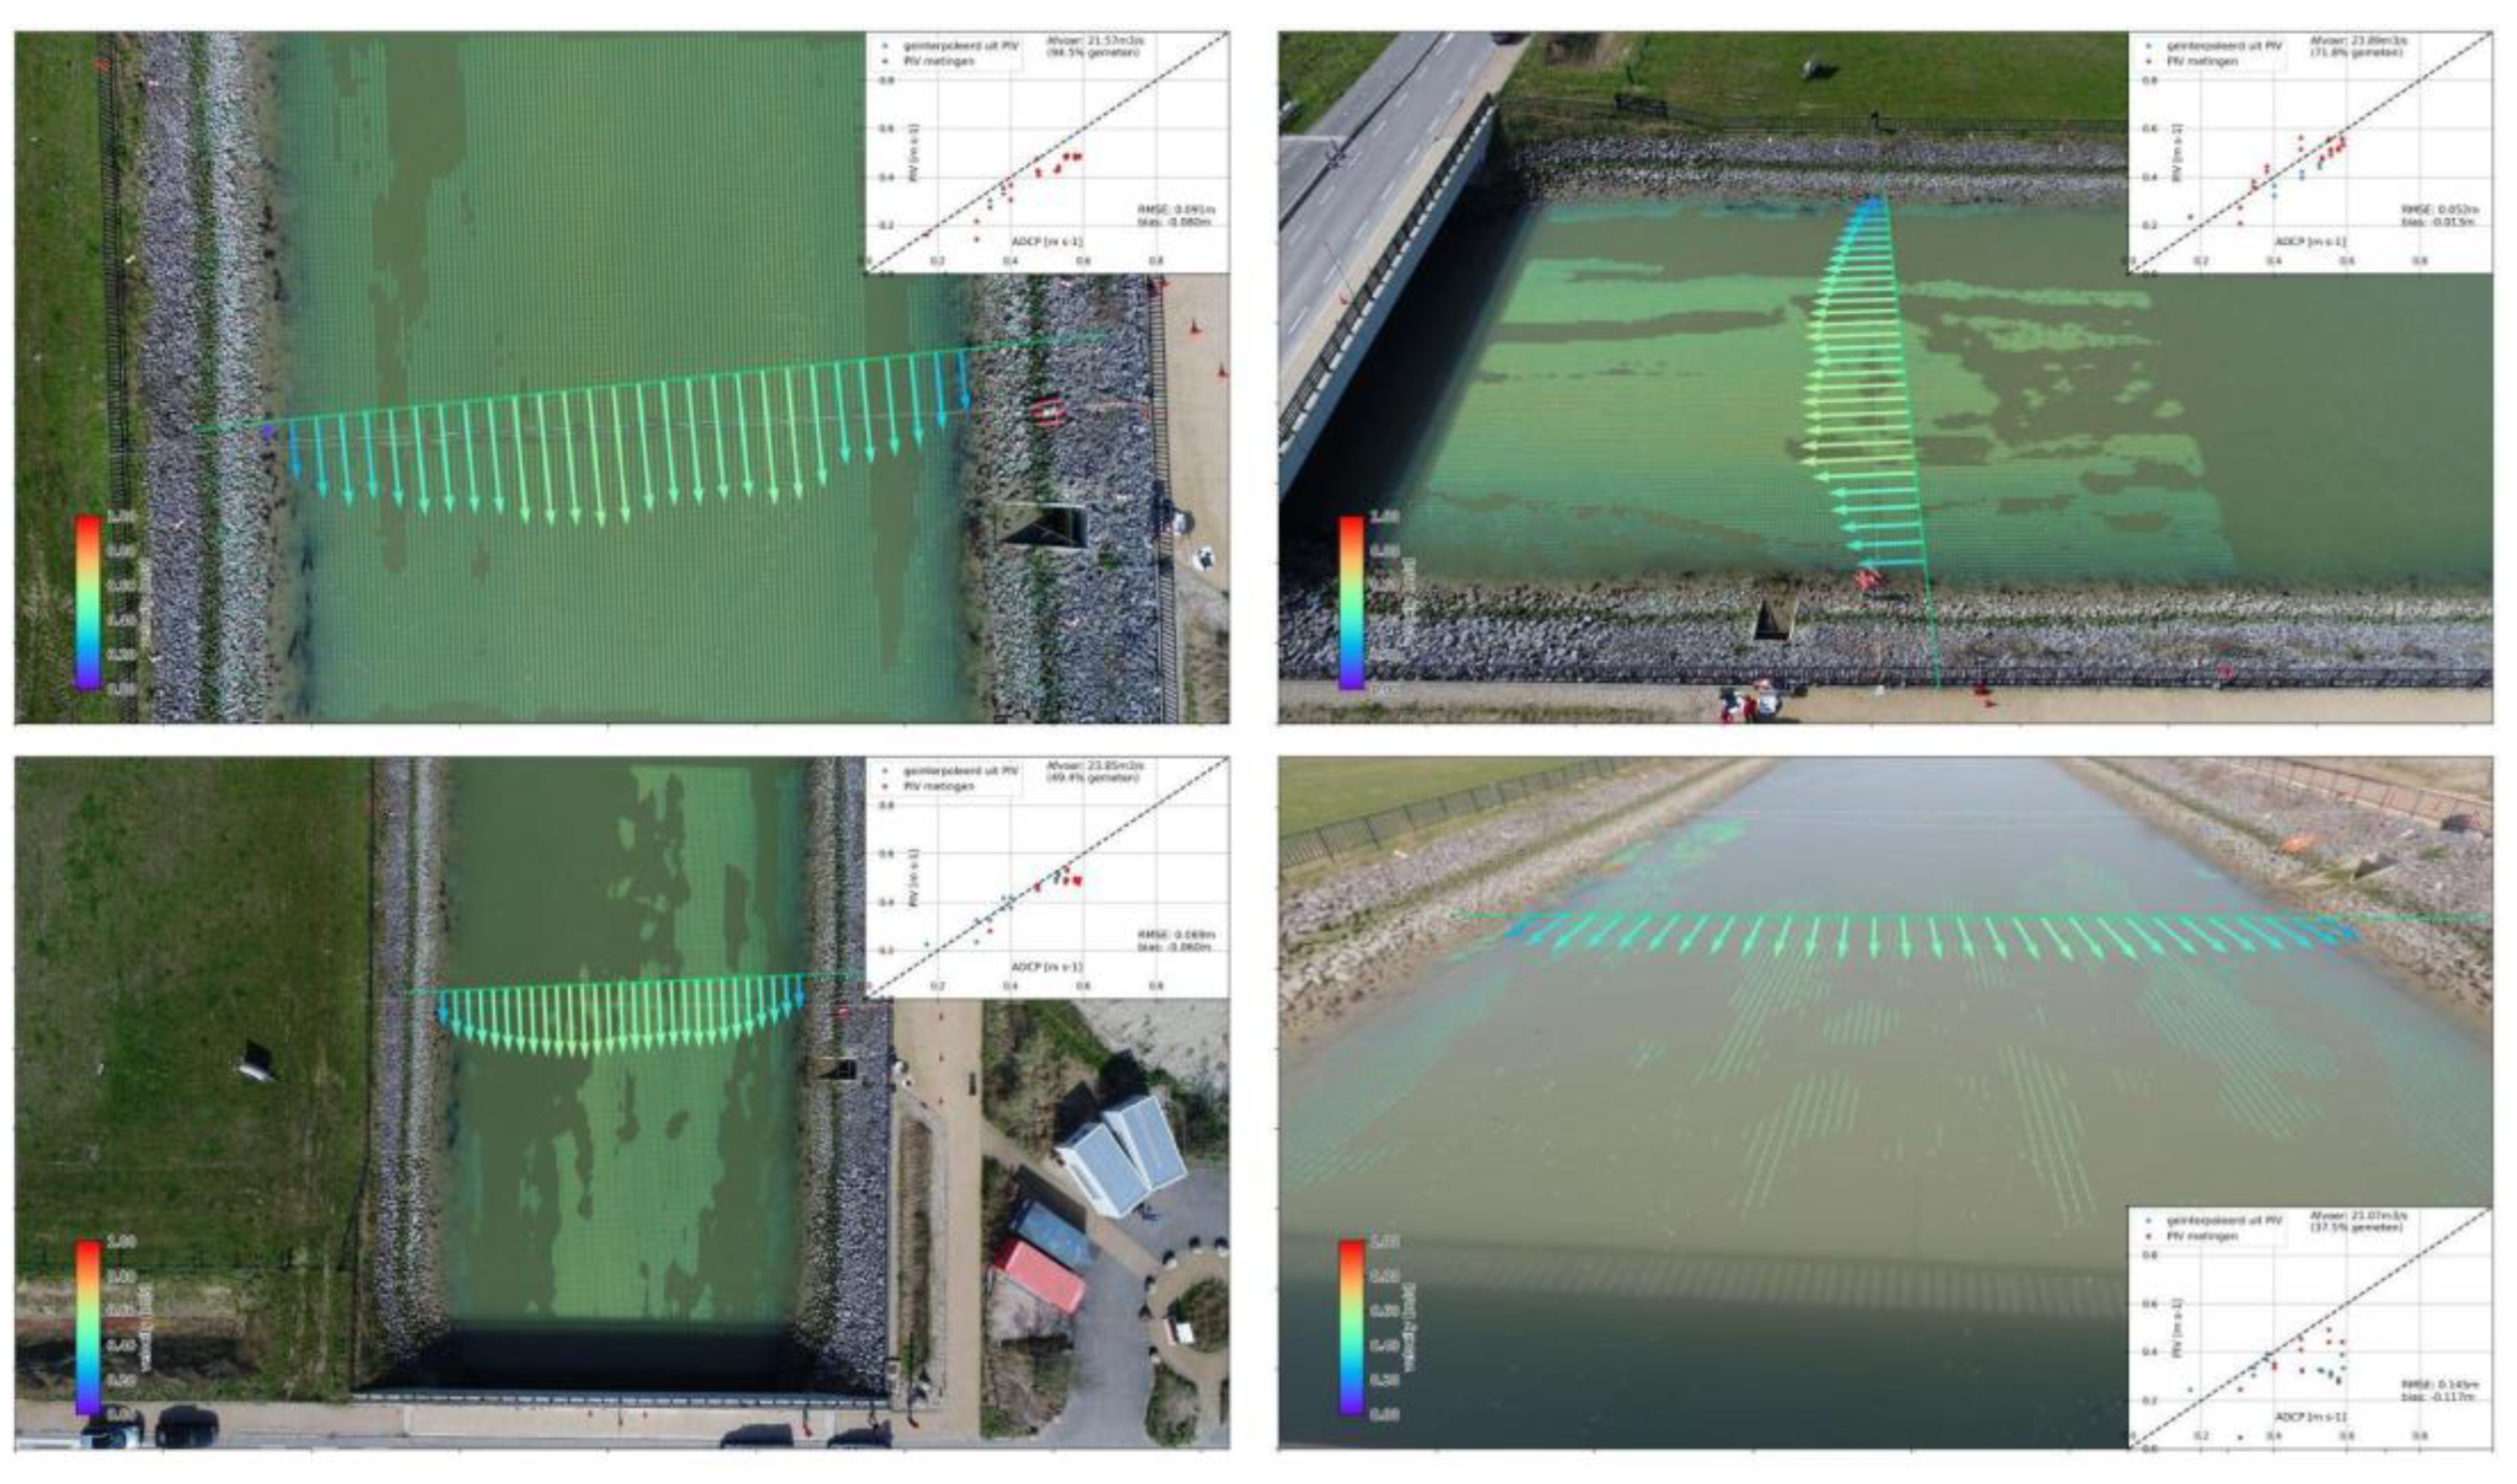
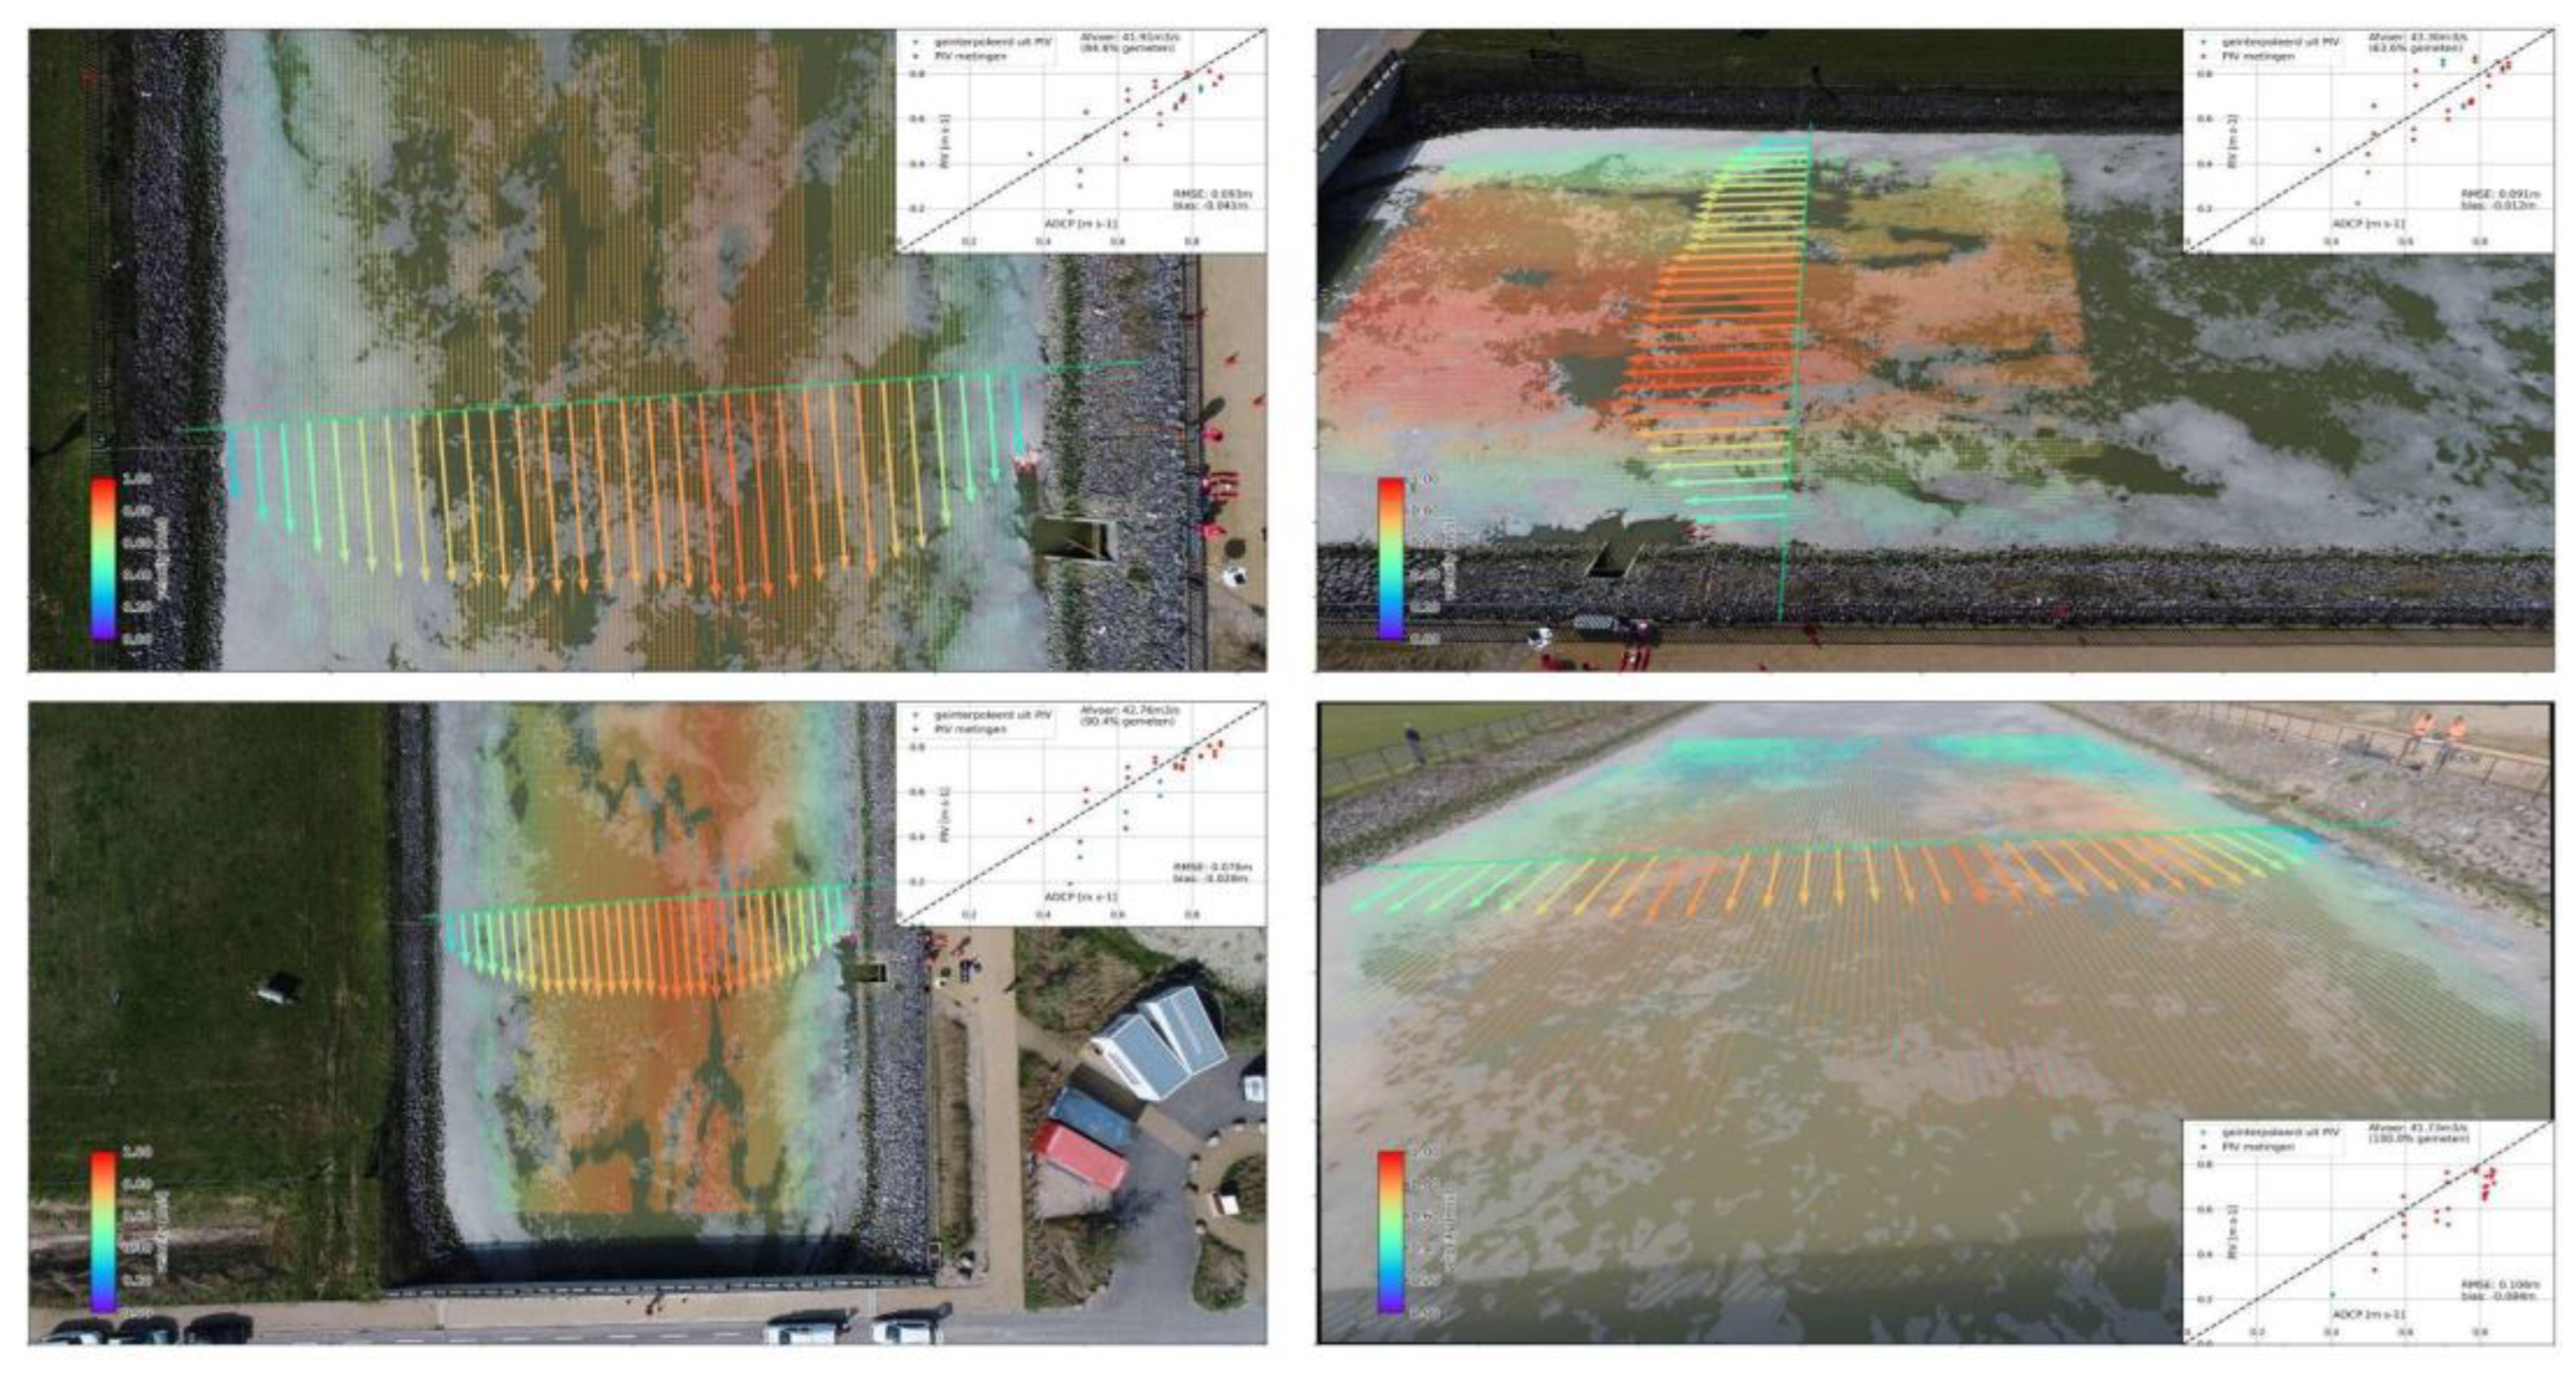
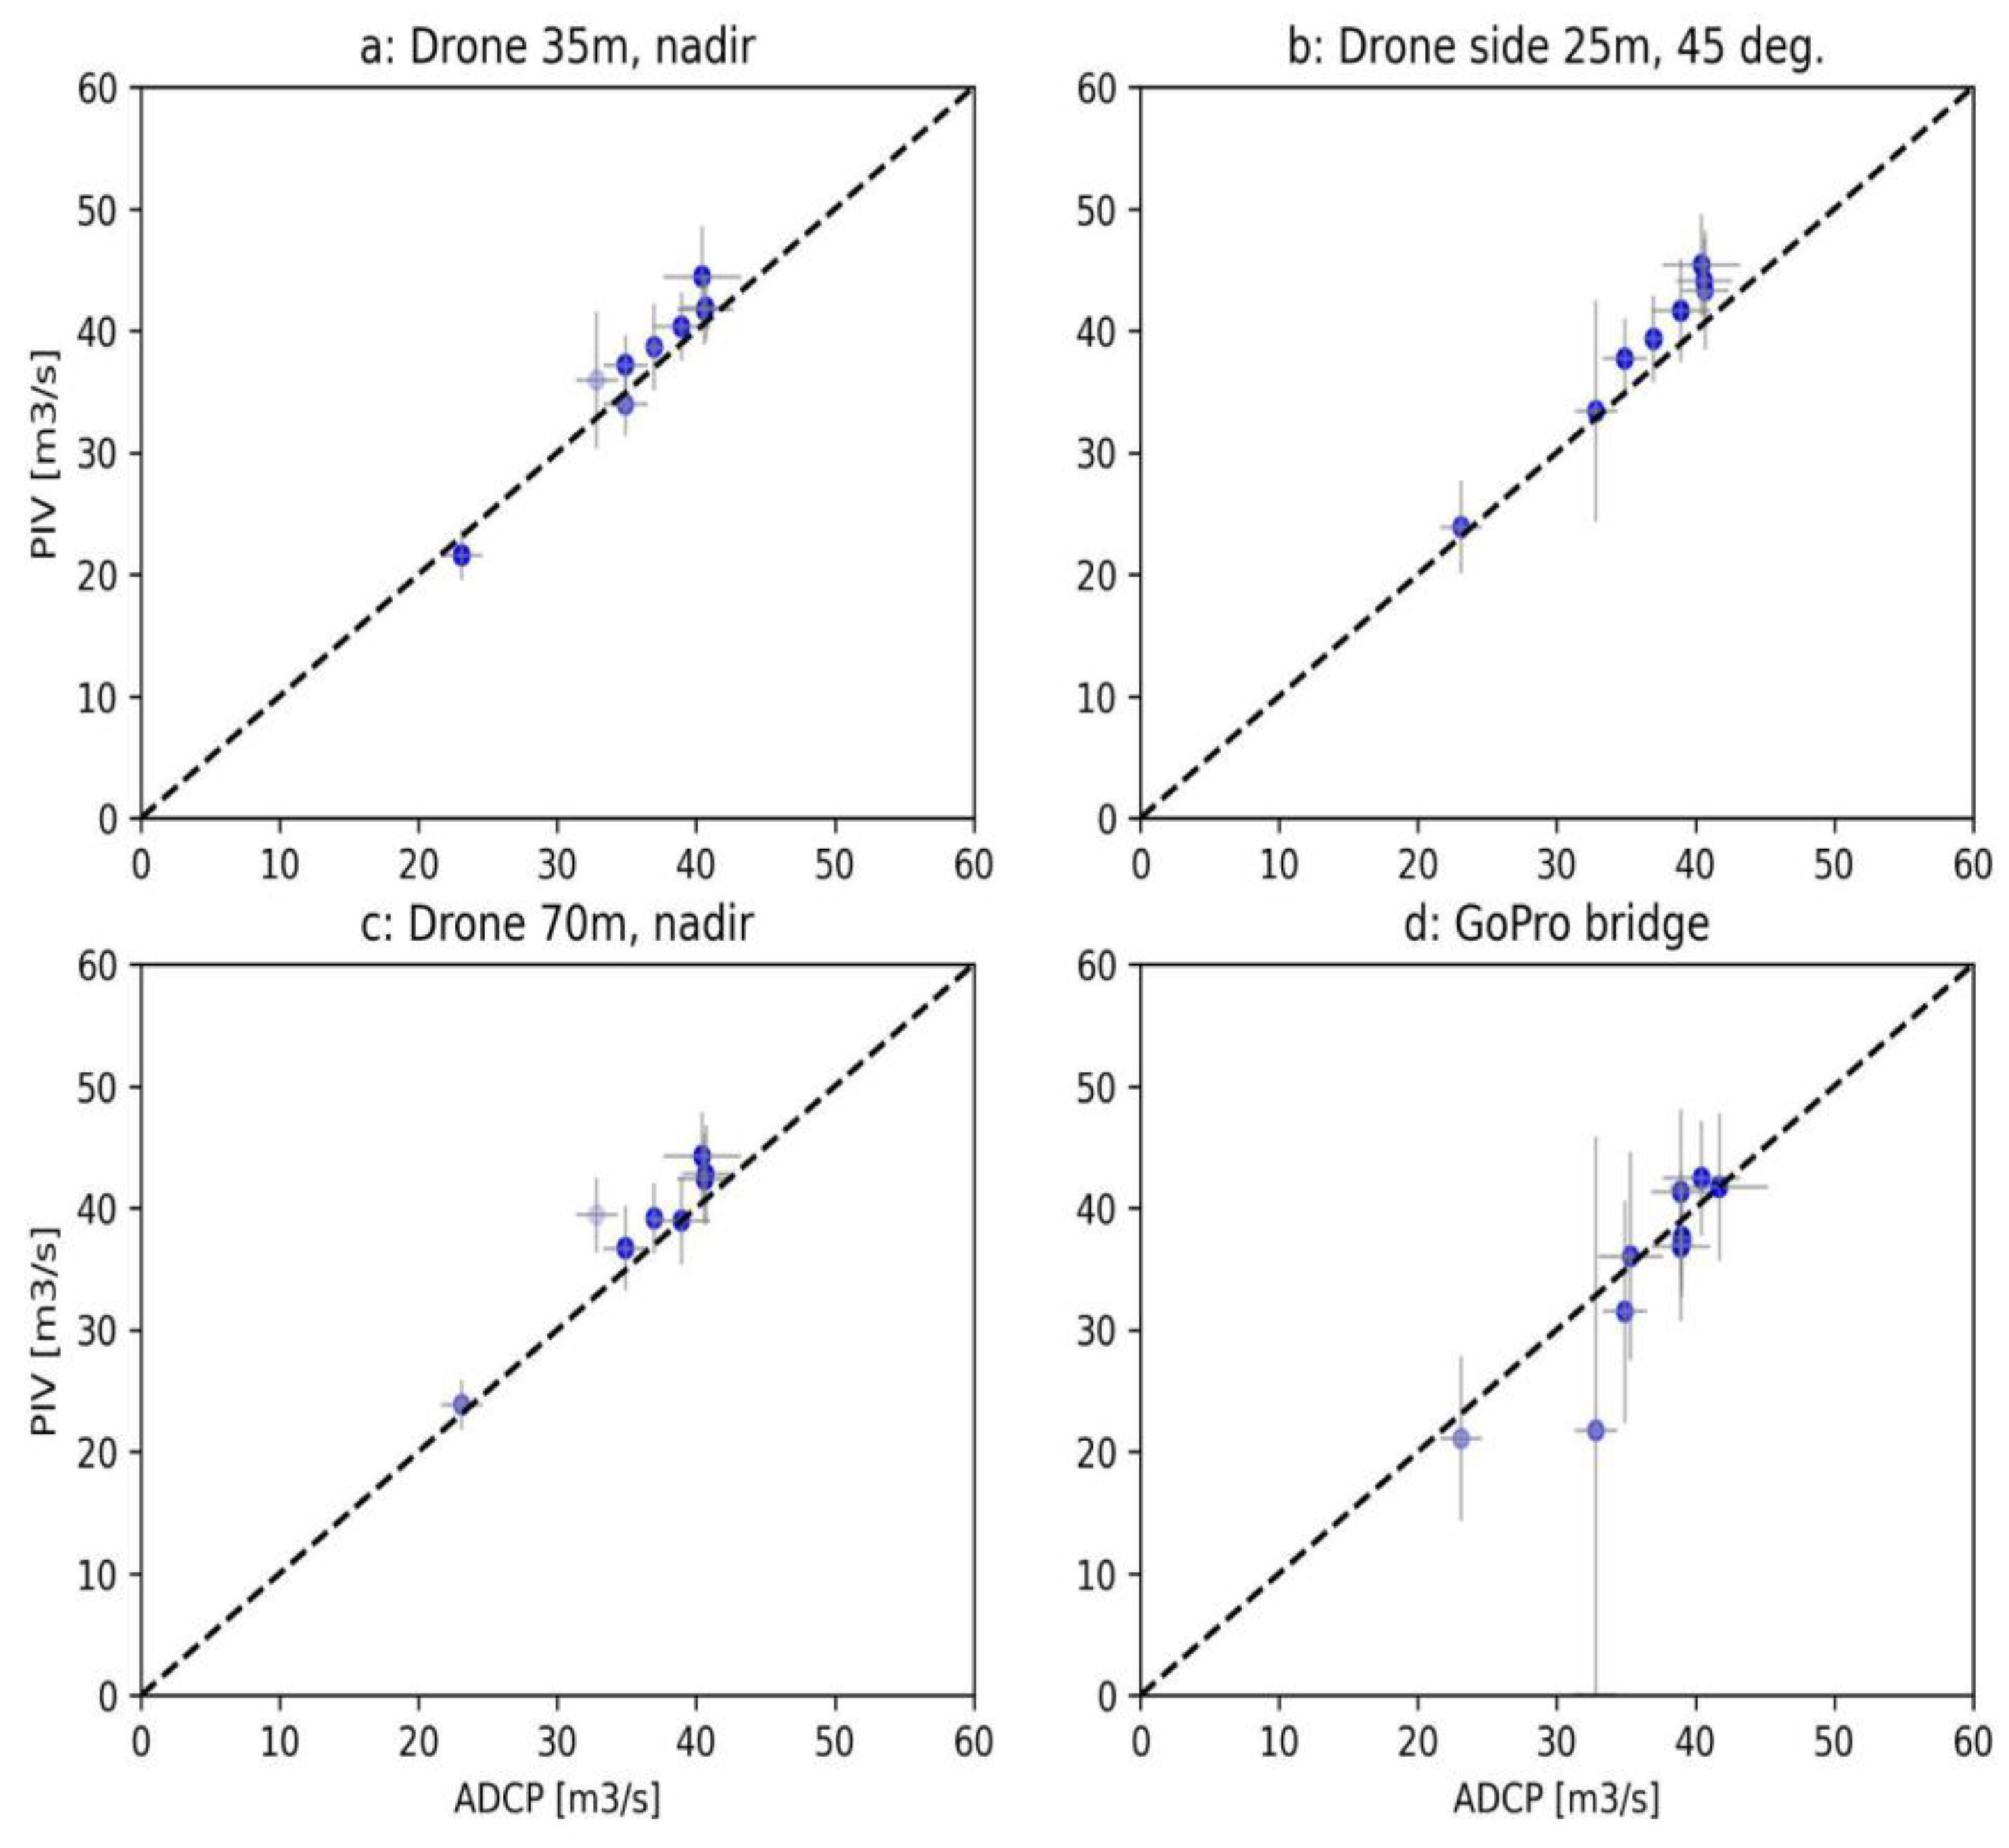
3.2.2. Case 2: tidal channel at Waterdunen
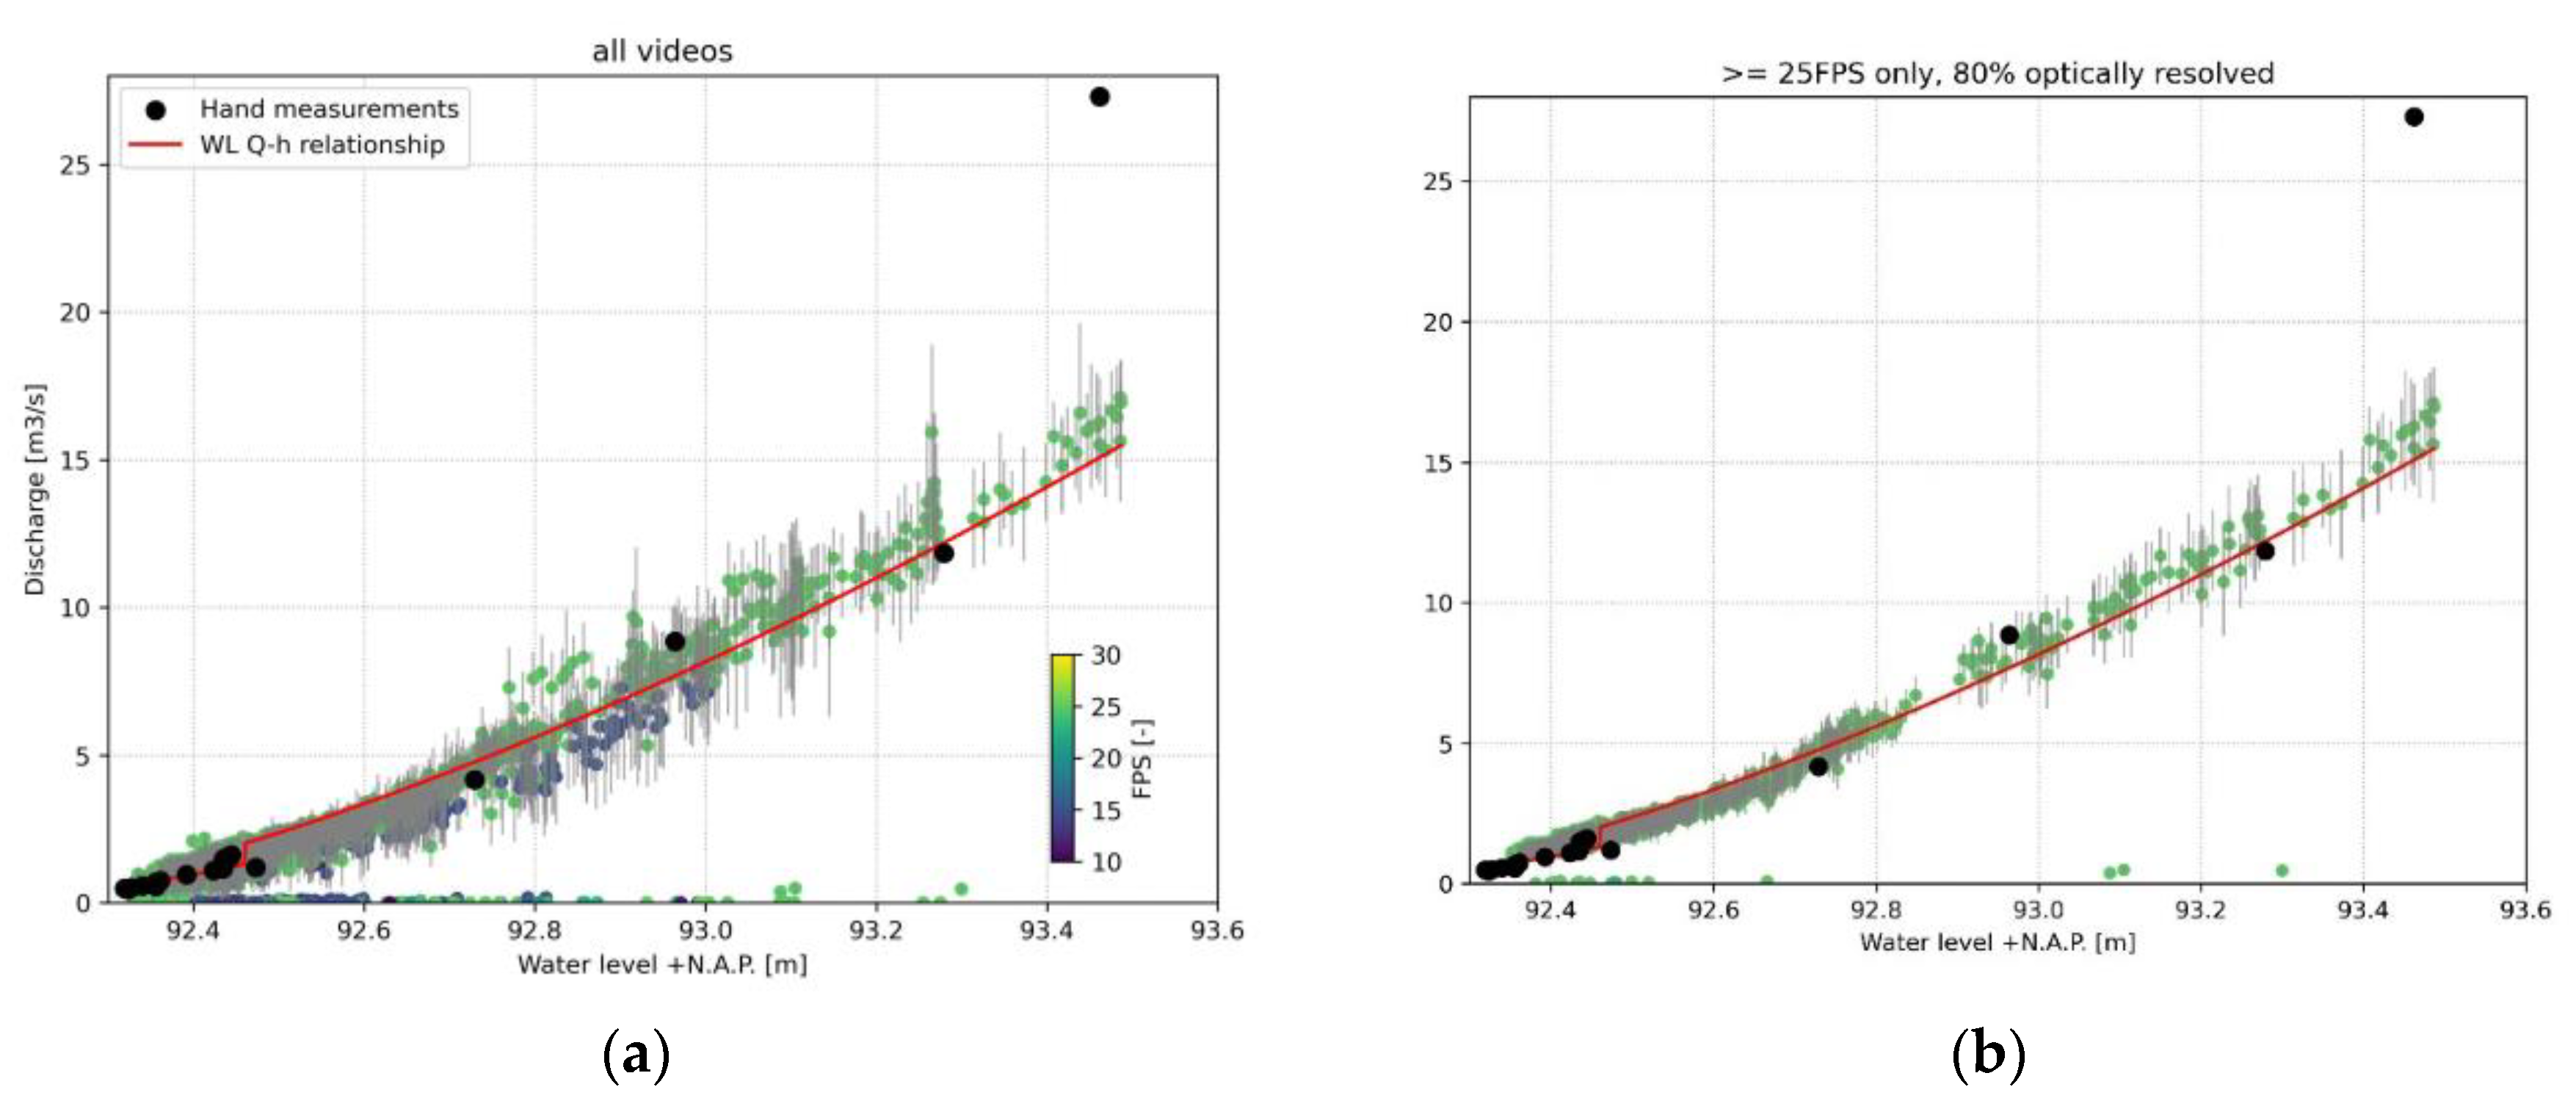
3.2.3. Case 3: Geul River at Hommerich
4. Discussion
4.1. Software development
- Start implementing use cases as soon as possible, even during low TRL phases. This enables short feedback loops from users within the use cases and ensures we develop what truly fits to their needs.
- Develop training materials, ideally multi-lingual. Currently we ensure that documentation remains up to date as a first step, but training materials will be essential to get started. This can be in the form of DIY online, videos, instructables or on-site training materials for dedicated training on-site, ideally with a real-world site visit and data collection.
- Develop and demonstrate data collection methods. Even though this paper focused strongly on the design and first applications of our software framework, its use will strongly depend on the ability of people to perform local data collection. Providing versatility in how this is done is of great importance in order to facilitate as many users as possible. E.g. an operational IP-camera with modem, power and internet facilities may in many cases prove to be complicated to maintain, and subject to vandalism.
- Develop a community of practice. Our GitHub issues pages are a good starting point, but a community forum would create much more interaction.
- Stay on top of the latest science and continuously improve and implement new methods. This is essential to stay relevant in this field. As new methods and approaches are developed, we will seek to implement these to ensure the latest science is available. This may include new methods to trace velocities e.g. [14], scientific developments in data assimilation and combination with hydraulic models [15,16], inclusion of satellite proxies or videos, and machine learning for data infilling, segmentation (e.g. for habitat studies) and more. Authors should discuss the results and how they can be interpreted from the perspective of previous studies and of the working hypotheses. The findings and their implications should be discussed in the broadest context possible. Future research directions may also be highlighted.
4.2. Application development
4.3. Potential outcomes
Author Contributions
Funding
Data Availability Statement
Acknowledgments
Conflicts of Interest
Appendix A
References
- Pappenberger, F.; Cloke, H.L.; Parker, D.J.; Wetterhall, F.; Richardson, D.S.; Thielen, J. The Monetary Benefit of Early Flood Warnings in Europe. Environ. Sci. Policy 2015, 51, 278–291. [Google Scholar] [CrossRef]
- Vorosmarty, C.; Askew, A.; Grabs, W.; Barry, R.G.; Birkett, C.; Doll, P.; Goodison, B.; Hall, A.; Jenne, R.; Kitaev, L.; et al. Global Water Data: A Newly Endangered Species. Eos Trans. Am. Geophys. Union 2001, 82, 54–54. [Google Scholar] [CrossRef]
- GRDC Data Portal. Available online: https://portal.grdc.bafg.de/ (accessed on 23 June 2023).
- Fujita, I.; Muste, M.; Kruger, A. Large-Scale Particle Image Velocimetry for Flow Analysis in Hydraulic Engineering Applications. J. Hydraul. Res. 1998, 36, 397–414. [Google Scholar] [CrossRef]
- Tauro, F.; Piscopia, R.; Grimaldi, S. PTV-Stream: A Simplified Particle Tracking Velocimetry Framework for Stream Surface Flow Monitoring. CATENA 2019, 172, 378–386. [Google Scholar] [CrossRef]
- Fujita, I.; Watanabe, H.; Tsubaki, R. Development of a Non-intrusive and Efficient Flow Monitoring Technique: The Space-time Image Velocimetry (STIV). Int. J. River Basin Manag. 2007, 5, 105–114. [Google Scholar] [CrossRef]
- Tauro, F.; Petroselli, A.; Grimaldi, S. Optical Sensing for Stream Flow Observations: A Review. J. Agric. Eng. 2018, 49, 199–206. [Google Scholar] [CrossRef]
- Jodeau, M.; Bel, C.; Antoine, G.; Bodart, G.; Coz, J.L.; Faure, J.-B.; Hauet, A.; Leclercq, F.; Haddad, H.; Legout, C.; et al. New Developments of Fudaa-LSPIV, a User-Friendly Software to Perform River Velocity Measurements in Various Flow Conditions. In River Flow 2020; CRC Press, 2020; ISBN 978-1-00-311095-8. [Google Scholar]
- Perks, M.T. KLT-IV v1.0: Image Velocimetry Software for Use with Fixed and Mobile Platforms. Geosci. Model Dev. 2020, 13, 6111–6130. [Google Scholar] [CrossRef]
- Peña-Haro, S.; Carrel, M.; Lüthi, B.; Hansen, I.; Lukes, R. Robust Image-Based Streamflow Measurements for Real-Time Continuous Monitoring. Front. Water 2021, 3. [Google Scholar] [CrossRef]
- Hydro-STIV | Numerical Analysis Specialized Company, Hydro Technology Institute. Available online: https://hydrosoken.co.jp/en/service/hydrostiv.php (accessed on 23 June 2023).
- Perks, M.T.; Dal Sasso, S.F.; Hauet, A.; Jamieson, E.; Le Coz, J.; Pearce, S.; Peña-Haro, S.; Pizarro, A.; Strelnikova, D.; Tauro, F.; et al. Towards Harmonisation of Image Velocimetry Techniques for River Surface Velocity Observations. Earth Syst. Sci. Data 2020, 12, 1545–1559. [Google Scholar] [CrossRef]
- OpenDroneMap. Available online: https://www.opendronemap.org/ (accessed on 26 June 2023).
- Dolcetti, G.; Hortobágyi, B.; Perks, M.; Tait, S.J.; Dervilis, N. Using Noncontact Measurement of Water Surface Dynamics to Estimate River Discharge. Water Resour. Res. 2022, 58, e2022WR032829. [Google Scholar] [CrossRef]
- Mansanarez, V.; Westerberg, I.K.; Lam, N.; Lyon, S.W. Rapid Stage-Discharge Rating Curve Assessment Using Hydraulic Modeling in an Uncertainty Framework. Water Resour. Res. 2019, 55, 9765–9787. [Google Scholar] [CrossRef]
- Samboko, H.T.; Schurer, S.; Savenije, H.H.G.; Makurira, H.; Banda, K.; Winsemius, H. Evaluating Low-Cost Topographic Surveys for Computations of Conveyance. Geosci. Instrum. Methods Data Syst. 2022, 11, 1–23. [Google Scholar] [CrossRef]
| Principle | Specific implementation in OpenRiverCam design and development |
|---|---|
| Design with the user | Through interaction on social media, in particular LinkedIn, and discussion with interested stakeholders, virtually and through in-person meetings, we gather user feedback and potential use cases, and make choices for the design that lead to fulfillment of an as wide as possible set of use cases. We encapsulated the interactions into so-called “user stories” that led to the design of the OpenRiverCam ecosystem. |
| Design for scale | OpenRiverCam is designed in an entirely modular fashion. Several building blocks are developed that can be used as stand-alone or in combinations so that uses at many different levels are assured, such as research, stand-alone application or scaled application through compute nodes, edge processing, and dashboard interfaces. In particular the compute nodes and edge processing abilities will make OpenRiverCam scalable. |
| Build for sustainability | We use widely accepted and well-maintained libraries only and provide software entirely with a copyleft license so that anyone can contribute to the software, or further develop the software. |
| Use Open Standards, Open Data, Open Source and Open Innovation | We use the Python language, as this is very broadly known and can therefore be used by many users. We use the NetCDF-CF convention and OGC standards as open standard for data, allowing for easy integration with many other platforms. |
| Reuse and improve | In order to guarantee that a small group of people can maintain the software indefinitely, we adopt well-maintained data models such as those embedded in the well-known xarray library. REST API development is planned in the well-known and maintained Django framework. |
| Be collaborative | We are in the process of defining a forum for user and designer/developer interaction and a code of conduct. We use the GitHub framework with continuous integration for unit testing and releases to assure quality of the code, striving for a minimum of 80% unit test coverage, and accepting issues of users on the platform. We already accept issues from users on Github. |
| Case study | Short description | Data Acquisition | Processing with OpenRiverCam | Validation approach |
|---|---|---|---|---|
| Alpine River (Perks et al., 2020) | Incidental observation with UAS, with partly artificial partly natural tracers | DJI Phantom FC40 at nadir orientation, with GoPro Hero3+ 4K camera, stabilized, resampled to 12.5Hz, orthorectified to 0.021 m / pixel | Background noise reduction with subtraction of time-averaged frames. PIV, masking of spurious velocities with correlation and outlier filter | Comparison against in-situ propeller observations in m s-1 |
| Tidal channel at “De Waterdunen” Zeeland - The Netherlands | Several videos from drone perspectives and a mobile camera on nearby bridge, at different moment in time during incoming tide | DJI Phantom 4, at 4096x2160 resolution | Stabilization, background noise reduction with time differencing and thresholding (minimum intensity >= 5), orthorectification (0.03 m), PIV (15 pixels window size), masking of spurious velocities using correlation, outlier filtering, and minimum valid velocity counting, cross section derivation and integration to discharge | Surface velocities: comparison with ADCP surface velocities; Discharge: comparison with ADCP discharge estimates. |
| Geul stream at “Hommerich”, Limburg - The Netherlands | 5 months collected videos with 15-minute frequency | FOSCAM FI9901EP IP camera with power cycling scheme and FTP server | Automated processing. background noise reduction with time differencing and thresholding negative values to zero, orthorectification (0.02 m), PIV (20 pixels window size), masking of spurious velocities using correlation, outlier filtering, and minimum valid velocity counting, cross section derivation and integration to discharge. | Comparison of water level discharge pairs collected through hand measurements by the Waterboard Limburg. |
| As a… | I want… | So that… | Core requirements |
|---|---|---|---|
| remotely operating user | to process videos immediately in the field | I know for sure I have the right results before going back from the field | Processing from a thin client |
| drone surveyor | to make videos of streams in the field and send them through smartphone | Dashboard, operated from a smartphone | |
| drone surveyor | to not have to cross a river to receive accurate velocity results | I can safely collect data from the banks, with only a drone as material | Get a result with only drone-based data collection, ideally no control points |
| hydrologist | to combine velocities with bathymetry sections | I can measure river flows | Integrate velocity estimates with cross-section surveys (x,y,z and s,z) |
| hydrologist | to combine several videos of velocity and discharge of single sites | I can reconstruct rating curves | single site processing with multiple videos |
| hydrologist | to combine videos from a smart phone that are more or less from the same position, without redoing control points all the time | I can quickly make videos during an event without a fixed camera | image co-registration and corrections on known points, or let user select these |
| environmental expert/hydrologist/other | to show velocities in a GIS environment | I can combine my data with other data such as land use changes, bathymetric charts, and so on | exports to known GIS raster or mesh formats |
| environmental expert | to show habitat suitability of certain species based on velocity results | I can use this for monitoring habitats | allow for a visualization of classes, and raster export of habitat suitability (API + dashboard) |
| engineer | to see how structures in the water influence the velocity patterns | I can show if structures do what they need to do, or show locations prone to erosion | combined visualization of velocity and CAD drawings of structures |
| engineer | to understand over large multi-km stretches where flow velocities are suitable for hydrokinetics | I can provide guidance where a local hydrokinetic system can be installed | multi-video processing with enough geospatial accuracy to enable seamless combination of results |
| engineer | to see differences between pre and post construction velocities for infrastructure or river restoration projects | I can provide monitoring as a product to my clients (engineering firms, environmental agencies, etc.) | comparability between videos, accurate co-registration, GIS interoperability |
Disclaimer/Publisher’s Note: The statements, opinions and data contained in all publications are solely those of the individual author(s) and contributor(s) and not of MDPI and/or the editor(s). MDPI and/or the editor(s) disclaim responsibility for any injury to people or property resulting from any ideas, methods, instructions or products referred to in the content. |
© 2023 by the authors. Licensee MDPI, Basel, Switzerland. This article is an open access article distributed under the terms and conditions of the Creative Commons Attribution (CC BY) license (https://creativecommons.org/licenses/by/4.0/).


