Preprint
Article

High-Voltage Electric Power Transmission Monitoring by Micro-Motion Estimation on Synthetic Aperture Radar Data

Altmetrics

Downloads

140

Views

115

Comments

0

This version is not peer-reviewed

Submitted:

09 August 2023

Posted:

11 August 2023

You are already at the latest version

Alerts
Abstract
Today electricity is distributed to the individual users via physical Copper connections. From the power stations, the energy is transported through transmission lines where the electricity, sinusoidally modulated at a fixed frequency of about 50 Hz, is raised up to a voltage in a range approximately variating between 30, and 110 kV. When electrons, aligned at this voltage, pass through the transmission lines, they cause coherent vibrations, sometimes even audible in the acoustic frequencies. In the spectrum of movements to which electric cables are subjected, there are also unexpected and sporadic movements caused by winds and rain. The problem of carrying out persistent, precise and spatially distributed monitoring of transmission line health is to use a large number of sensors physically distributed everywhere and somehow transmit the results to a control station. The use of synthetic aperture radar (SAR) data could be a viable solution of persistent and wide-area high-voltage vibration monitoring. In this paper we produce a comprehensive survey on how to monitor both movements in terms of vibrational displacement, due to weathering, and those due to electricity transmission, normally fixed at about 50 Hz. The results demonstrate the technical feasibility of an operational use of SAR for these purposes in the very short term. This would allow the possibility of monitoring malfunctions such as black-outs or other frequency anomalies.
Keywords: 
Subject: Engineering  -   Electrical and Electronic Engineering

1. Introduction

Infrastructure monitoring of high-voltage electric power transmission can be an expensive and complex effort when deployed on a large scale. This is mainly due to the need of having a relatively large number of distributed/networked sensors able to extract displacement and/or vibration information. Electric Power Transmission Cables Health Monitoring (EPTC-HM) can be a procedure of intensive and persistent health assessment for a structure through an automated system, a key element of cost-effective strategies for maintenance. Generally, the used sensors are constituted by differential global positioning system (GPS) and/or piezoelectric vibration detectors [1]. Authors demonstrate that an alternative, and, less expensive and much more portable approach can be used through spaceborne synthetic aperture radar (SAR), thanks to its coherent nature capable to accurately measure several parameters [2,3,4,5]. Extensive use of large-diameter conductors on high-voltage lines, and the desirability of obtaining smooth surface to minimize the corona losses, have made vibration monitoring a factor of major importance in high-voltage transmission line design [6]. There are many methods of measuring vibration using in-situ sensors. In [7], a fiber-optic interferometric sensor with intrinsic transducer along a length of the fiber is presented for vibration measurements of the magnetic core inside an oil-filled power transformer. Results show the successfully measurement of vibrations amplitudes due to sub-micron displacements. In [8], a method to simply and inexpensively measure the amount of conductor sag and, through simple calculation, the average conductor core temperature is successfully described, and the results of a field test are also summarized. Information from this measurement is a critical input to any method for dynamically rating transmission lines. Quadruple bundle large wind-induced oscillations leading to failures of I-type suspension sets are analyzed in [9]. Studies and analyzes performed on this problem with the aim of understanding the nature of the observed oscillations, the mechanism through which they are excited and the magnitude of the bending strains induced on the insulator strings are presented. Both computations and tests on an experimental span have been carried out to fully clarify the problem and submit an operative solution. For electric power transmission, high-voltage overhead power lines play an important role, as the costs for power transmission are comparatively low. Research [10] investigate possibilities for monitoring devices that are directly mounted onto a conductor. The feasibility of powering the device from the electric field, protection of electronic circuitry from strong electric fields, and data transmission by means of a wireless link is demonstrated, as well as its operability during the presence of strong magnetic fields due to high currents and transient signals due to partial and spark discharge events. Droplets formation on high-voltage transmission lines affected by rainfall amplifies the corona discharges from the conductors. The induced corona vibrations intensify the fatigue of high-voltage conductors and supporting elements. Research [11] validate a numerical simulation method to investigate the effects of different parameters (electric field strength and polarity, rain intensity, transverse wind velocity) on the amplitude of the induced corona vibrations. The model enables better comprehension of the induced corona vibration mechanism. Authors of [12] conducted measurements of overhead conductor vibration, caused by Von Karman vortex shedding, implementing new experimental device, capable of continuous monitoring of acceleration over a wide range of frequency and amplitude. Continuous real-time observations showed the important influence of wind direction and turbulence as well as some divergence in predictions of the Strouhal equation. Vibration-based condition monitoring of high-voltage transformers aims to identify the condition of its internal structures, such as the coils and core, by measuring the vibrations of the enclosure. Research [13] examines the vibration transmission characteristics on the basis of experimental work on a 110 kV power transformer. A series of dynamic and electrical tests were conducted on the power transformer with and without transformer cooling oil. Both internal and tank vibrations were measured simultaneously. The effects of transformer cooling oil on vibration transmission were discussed. Finally, the optimal positions on the tank for vibration measurement and monitoring of the transformer’s internal structures are presented. Vibration estimation has been widely discussed and demonstrated to be possible to accurately estimate vibrations through the use of spaceborne SAR sensors. Successful applications have been made in maritime surveillance [14,15], and infrastructure monitoring [16,17].
In summary, in this paper, we investigate the important question: can single-pass SAR data in space be used to assess whether high-voltage electric energy transportation lines are transmitting power correctly? The aim of the experimental analysis is to present a first assessment, answering this question by observing various transmission lines. A complete investigation concerning the frequency characterization of power lines is also reported, deriving the precise frequency assumed by the alternating current. We found two types of oscillations, the first, persistent, narrowband, centred at 50 Hz. Other oscillations due to space/time decorrelation, caused by layover interference, and vibration polarization variations, were isolated, so as to more accurately estimate the high voltage oscillation. At the same time we found other much lower frequencies due to cable oscillation caused by atmospheric agents such as wind. This article also carries out a survey aimed at identifying any weak points in the physical transmission line due to potentially dangerous spatial standing waves, or resonance waves, which could cause it to break. The power-line communication system bandwidth occupation, used for controller and telemetry, is also correctly detected.
The reminder of this paper is the following: In Section 2 the methodology we used to estimate the micro-vibrations generated by the high-voltage electrical network on overhead transmission cables is described. In Section 3 we show the experimental results we estimated by evaluating a single Staring-Spotlight SAR image observed by the COSMO-SkyMed (CSK) satellite. The experimental results are divided into four case studies, (from 1 to 4). In particular, in case study 4 we describe the performance of the methodology used, also describing its limitations. In the Section 4 we discuss about the results quality and the feasibility to employ this method into an operative environment. We conclude the article through Section 5.

2. Methodology

In this section the analytical formulation of the proposed micro-motion estimation technique is described. The SAR synthesizes the electromagnetic image through a ”side looking” acquisition, according to the observation geometry shown in Figure 1, where:
  • r is the zero-Doppler distance (constant);
  • R is the slant-range;
  • R 0 is the reference range at t = 0 ;
  • d a is the physical antenna aperture length;
  • V is the platform velocity;
  • d is the distance between two range acquisitions;
  • L s a is the total synthetic aperture length;
  • t is the acquisition time variable;
  • T is the observation duration;
  • t = 0 and t = T are the start and stop time acquisition respectively;
  • L = λ r L is the azimuth electromagnetic footprint width;
  • θ is the incidence angle of the electromagnetic radiation pattern;
  • V is the platform velocity.
All the above parameters are related to the staring-spotlight SAR acquisition that is adopted in this work. The SAR data belonging to the electromagnetic image are formed through the focusing process that involves the application of a two-dimensional matched filter acting in the range direction and in the azimuth direction. The single look complex (SLC) signal resulting from compression is given by [18]:
s S L C ( k , x ) = 2 N τ exp j 4 π λ r sinc π B c r k 2 R c sinc π B c D x for x = k t , k = { 0 , 1 , , N 1 } , x = { 0 , 1 , , M 1 } , with N , M N .
Equation (1) represents the focused SAR signal generated by the back-scattered electromagnetic energy of a pointing target supposed to be stationary. The terms B c r , and B c D = 4 N d λ r are the total chirp and Doppler bandwidths respectively. The total synthetic aperture is equal to L s a = 2 N d and the azimuth resolution δ D 1 B c D = λ R 2 L s a . In (1) the 2 R c parameter identifies the position in range where the maximum of the sinc function is positioned, while in azimuth it is centered around ”zero”. In the case where the peak of the sinc function has a nozero coordinate along the azimuth dimension, Equation (1) can be recast as:
s S L C ( k , x ) = 2 N τ exp j 4 π r λ sinc π B c r k L c g sinc π B c D x L D h for L c g , L D h N .

2.1. Doppler Sub-Apertures Model

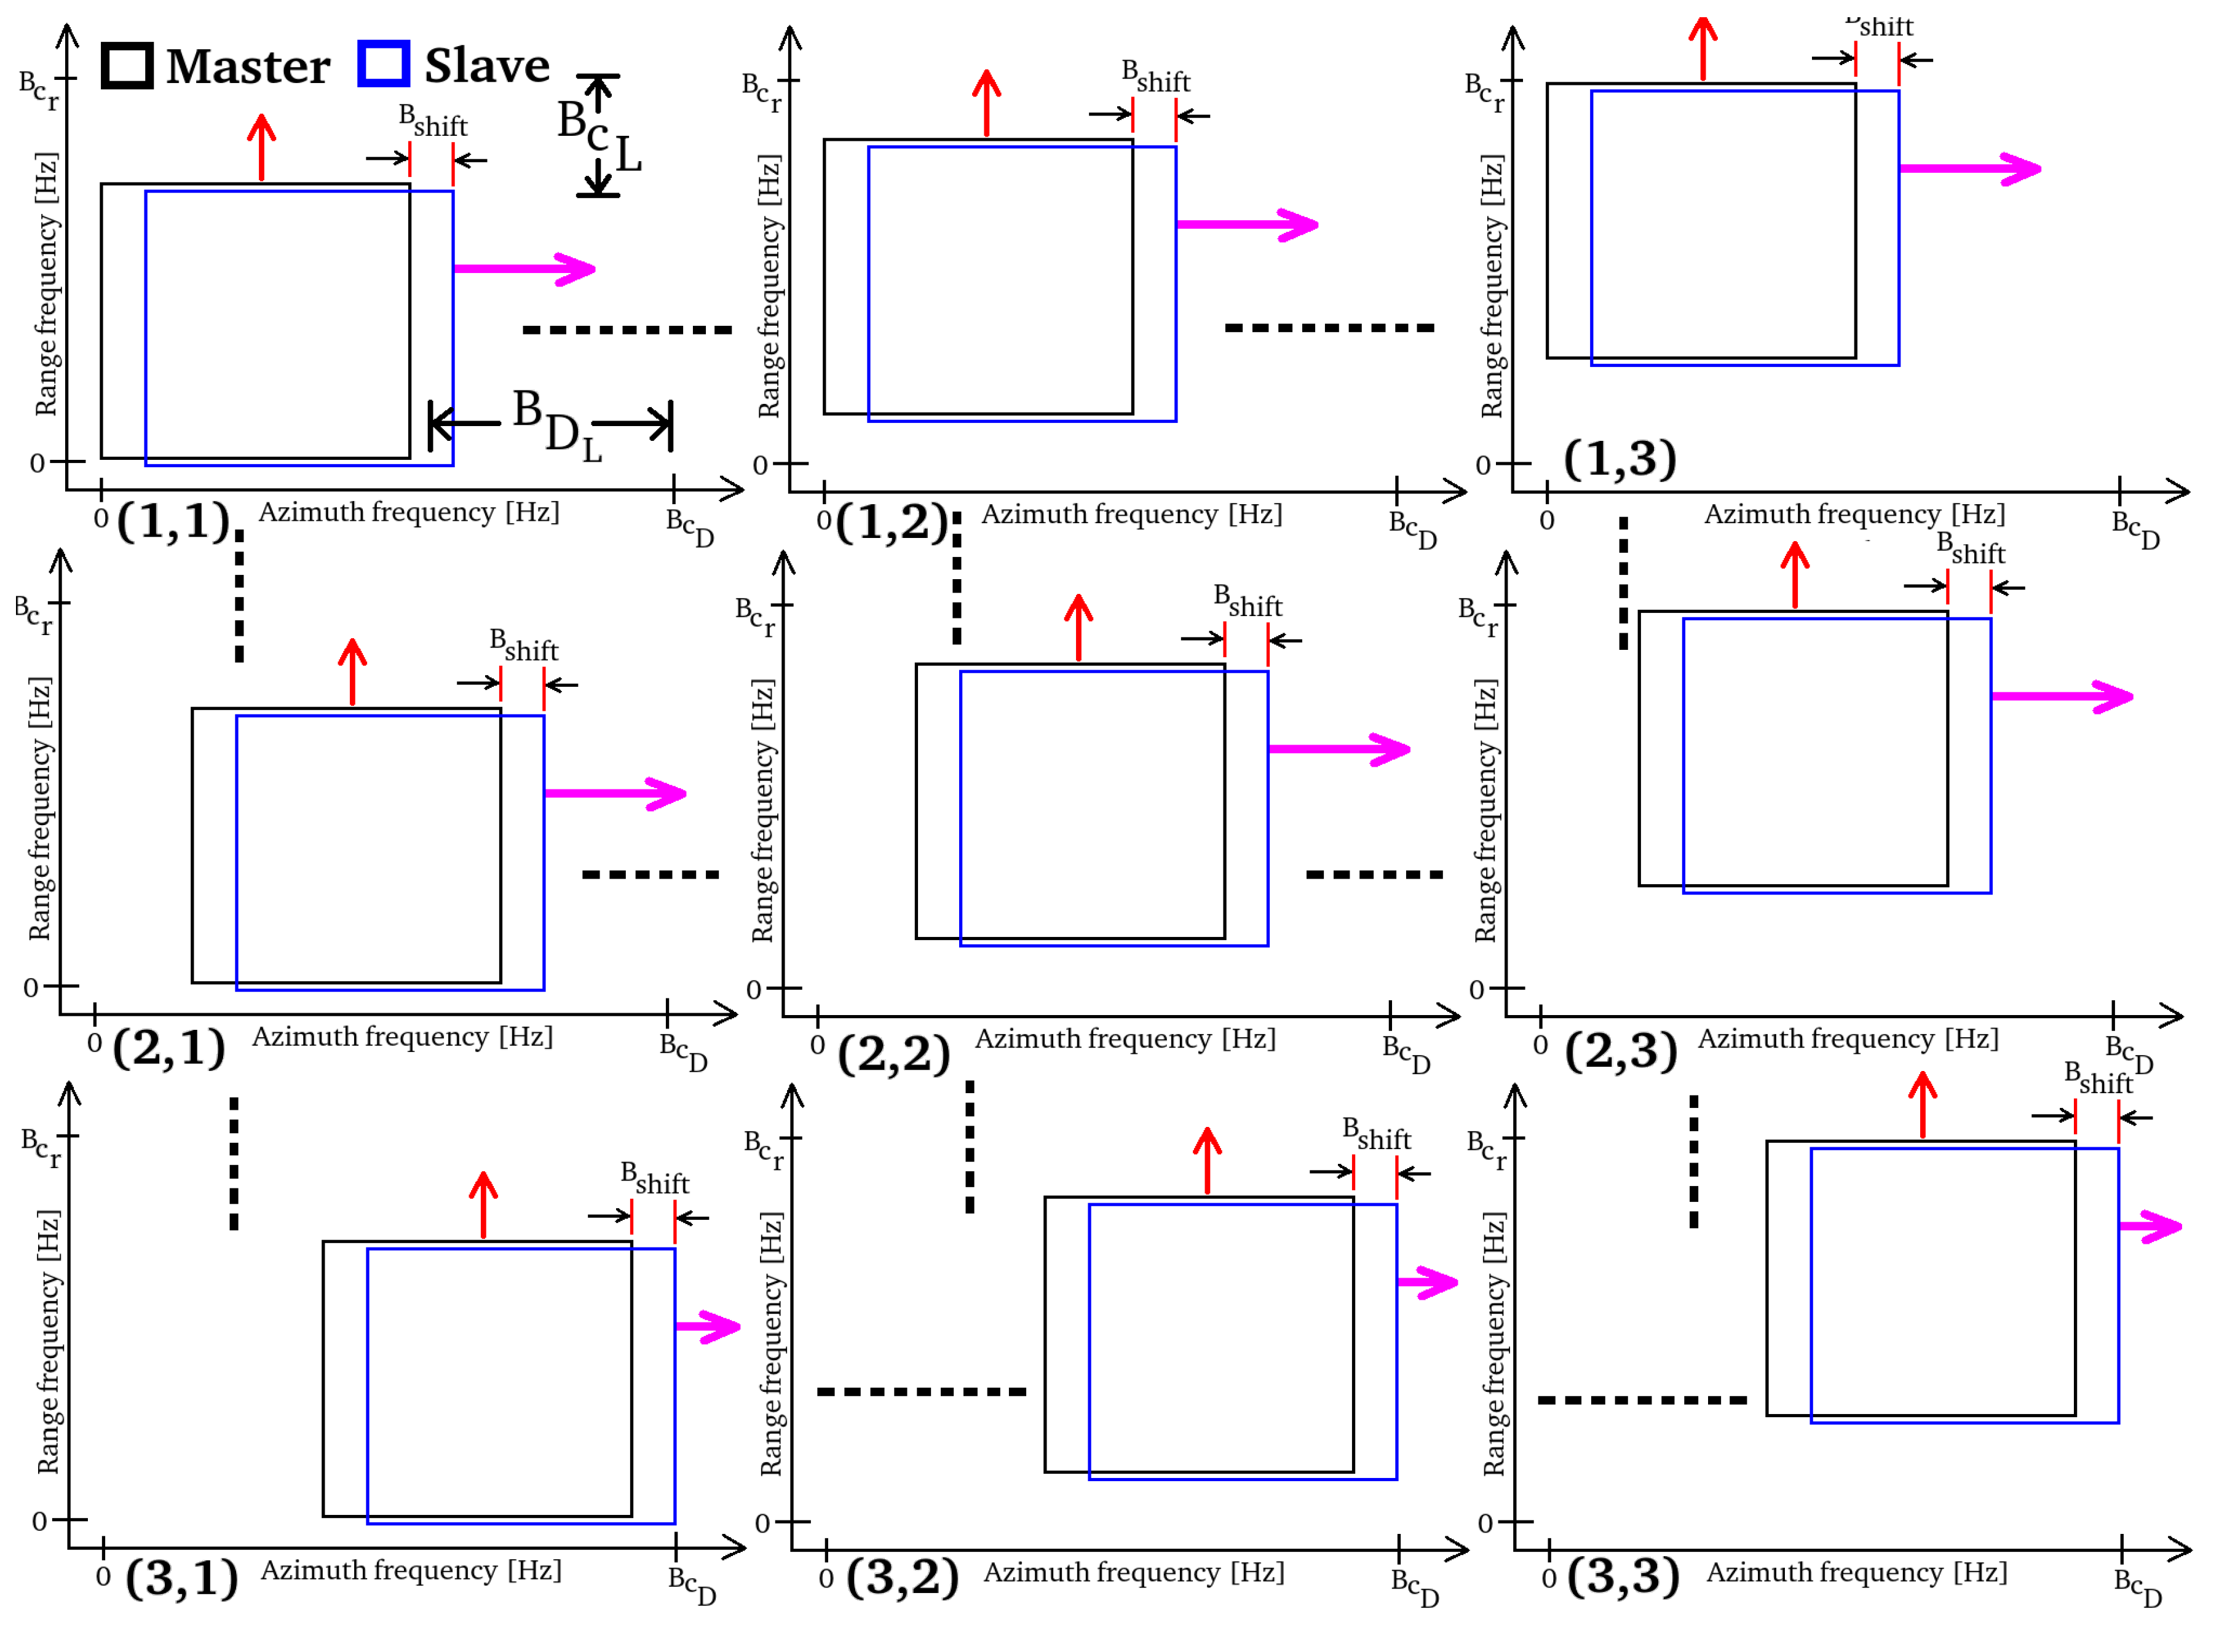
In this paper we experiment a strategy that employs both range and Doppler sub-apertures. The Doppler sub-apertures are generated to measure target motion, while those estimated in the range direction are synthesized to perform noise reduction of the high-voltage vibrational spectrum. Figure 2 represents the used bandwidth allocation strategy. From the single SAR image we calculate the 2D digital Fourier Transform (DFT) which has a rectangular shape. As can be seen from Figure 2, B C D is the total Doppler band synthesized with the SAR observation, while B D L = B C D 2 is the bandwidth we left out from the matched-filter boundaries, to obtain a sufficient sensitivity to estimate target motions. In this context formula is the focused SAR image, at maximum resolution, thus exploiting the whole band { B c r , B C D } , in accordance with the frequency allocation strategy shown in Figure 2, the following range-Doppler sub-apertures large-matrix is constructed for the Master multi-dimensional information:
S S L C ( k , x ) M = S S L C ( k , x ) M { 1 , 1 } S S L C ( k , x ) M { 1 , 2 } S S L C ( k , x ) M { 1 , 3 } S S L C ( k , x ) M { 1 , N c } S S L C ( k , x ) M { 2 , 1 } S S L C ( k , x ) M { 2 , 2 } S S L C ( k , x ) M { 2 , 3 } S S L C ( k , x ) M { 2 , N c } S S L C ( k , x ) M { N D , 1 } S S L C ( k , x ) M { N D , 2 } S S L C ( k , x ) M { N D , 3 } S S L C ( k , x ) M { N D , N c } for N c , N D N ,
and for the slave, the following large-matrix is presented:
S S L C ( k , x ) S = S S L C ( k , x ) S { 1 , 1 } S S L C ( k , x ) S { 1 , 2 } S S L C ( k , x ) S { 1 , 3 } S S L C ( k , x ) S { 1 , N c } S S L C ( k , x ) S { 2 , 1 } S S L C ( k , x ) S { 2 , 2 } S S L C ( k , x ) S { 2 , 3 } S S L C ( k , x ) S { 2 , N c } S S L C ( k , x ) S { N D , 1 } S S L C ( k , x ) S { N D , 2 } S S L C ( k , x ) S { N D , 3 } S S L C ( k , x ) S { N D , N c } for N c , N D N ,
The explanation of the chirp-Doppler sub-aperture strategy, represented in Figure 2 is the following: We consider sub-picture (1,1), where Master and slave sub-bands are generated by focusing the SAR image, where the matched-filter is set to exploit a range-azimuth bandwidth equal to B c r B c L , B c D B D L . The not-processed bandwidths { B c L , B D L } are divided into { N c , N D } equally-distributed bandwidths steps respectively. At this point N c rigid shifts of the master-slave system are made along the chirp bandwidth domain, this is made to populate an entire row of matrices 3, and 4. Each frequency range variation is equal to B c r B c L N C . These shifts in range can be seen in Figure 2 (1,1) where no-shifts are presented, while in Figure 2 (1,2), intermediate range-shift are generated, at the end the maximum of range shifts is presented in Figure 2 (1,3). The process is repeated N D times for each shift in azimuth, in fact, Figure 2 (2,1), (2,2), and (2,3), represent the range frequency variation strategy, when the Doppler band is located at the intermediate position N D 2 . To conclude, Figure 2 (3,1), (3,2), and (3,3), represent the range frequency variation trend, when the Doppler bandwidth is located at N D . At each Doppler frequency shift B c D B D L N D every column of matrices 3, and 4 is populated.

2.2. Doppler Sub-Aperture Strategy

The decomposition of the SAR data into Doppler sub apertures is formalized in this subsection, which is performed starting from the spectral representation of the focused SAR data. To this end, notice that the generic i th chirp sub-aperture 2-dimensional DFT of (2) is given by:
S S L C F i ( n , q ) = D F T 2 2 N τ exp j 4 π r λ sinc π B c r i k L c g sinc π B c D x L D h = 2 N τ exp j 4 π r λ k = 0 N 1 x = 0 M 1 sinc π B c r i n L c g sinc π B c D q L D h exp j 2 π k n N exp j 2 π x q M = 2 N τ exp j 4 π r λ 1 π B c r i rect n π B c r i 1 π B c D rect q π B c D exp j 2 π n L c g exp j 2 π q L D h .
From the last equation, it turns out that a single point stationary target has a two-dimensional rectangular nature with total length proportional to the range-azimuth bandwidths respectively. The term exp j 2 π n L c g exp j 2 π q L D h is due to the sinc function dislocation in range and azimuth. In the SAR, the movement of a point target with velocity in both range and azimuth direction is immediately warned by the focusing process, resulting in the following anomalies:
  • anomalous azimuth displacement in the presents of target constant range velocity;
  • azimuth smearing in the presence of target azimuth velocity or target range accelerations;
  • range-walking phenomenon, visible as range defocusing, in the presence of target range speed, backscattered energy is detected over one or more range resolution cells.
In practical cases, the backscattered energy from moving targets is distributed over several range-azimuth resolution cells. As a matter of fact, considering the point-like target T 1 (of Figure 1) that is moving with velocity v t whose range-azimuth and acceleration components are { v r , v a } , and { a r , a a } , respectively, then we can write
R 2 ( t ) = ( V t S a ) 2 + ( R 0 S r ) 2 with S r = v r t + 1 2 a r t 2 and S a = v a t + 1 2 a a t 2 R ( t ) = R 0 S r 1 + V t S a 2 R 0 S r 2 1 2 .
Considering the following Taylor expansion:
1 + x β 1 + β x
and that R 0 S r R 0 , and V t S a 2 V 2 t 2 2 V t S a , (6) can be written in the following form:
R ( t ) = R 0 S r + 1 2 V t S a 2 R 0 S r = | R 0 S r | + V 2 t 2 2 R 0 1 2 S a V t
= R 0 S r + V 2 t 2 2 R 0 V t S a R 0 = R 0 v r t 1 2 a r t 2 + V 2 t 2 2 R 0 V t v a t + 1 2 a a t 2 R 0 = R 0 v r t 1 2 a r t 2 + V 2 t 2 2 R 0 V v a t 2 R 0 V a a t 3 2 R 0 .
The term V a a t 3 2 R 0 can be neglected and by approximating V 2 2 V v a V v a 2 Equation (9) can be written like:
R ( V t ) = R 0 v r t + t 2 2 R 0 V v a 2 R 0 a r .
recasting (10) in terms of x = V t , we obtain [19]:
R ( x ) = R 0 ϵ r 1 x + 1 ϵ c 1 2 ϵ r 2 x 2 2 R 0 , x = V t .
where:
  • ϵ r 1 = v r V (due to range velocity);
  • ϵ r 2 = a r R 0 V 2 (due to range acceleration);
  • ϵ c 1 = v c V (due to azimuth velocity).
Thus, the above terms modify the received signal, as shown in [19], and should be taken into account in Equation (5) .

2.3. Vibrational Model of Cables and EPTC-HM

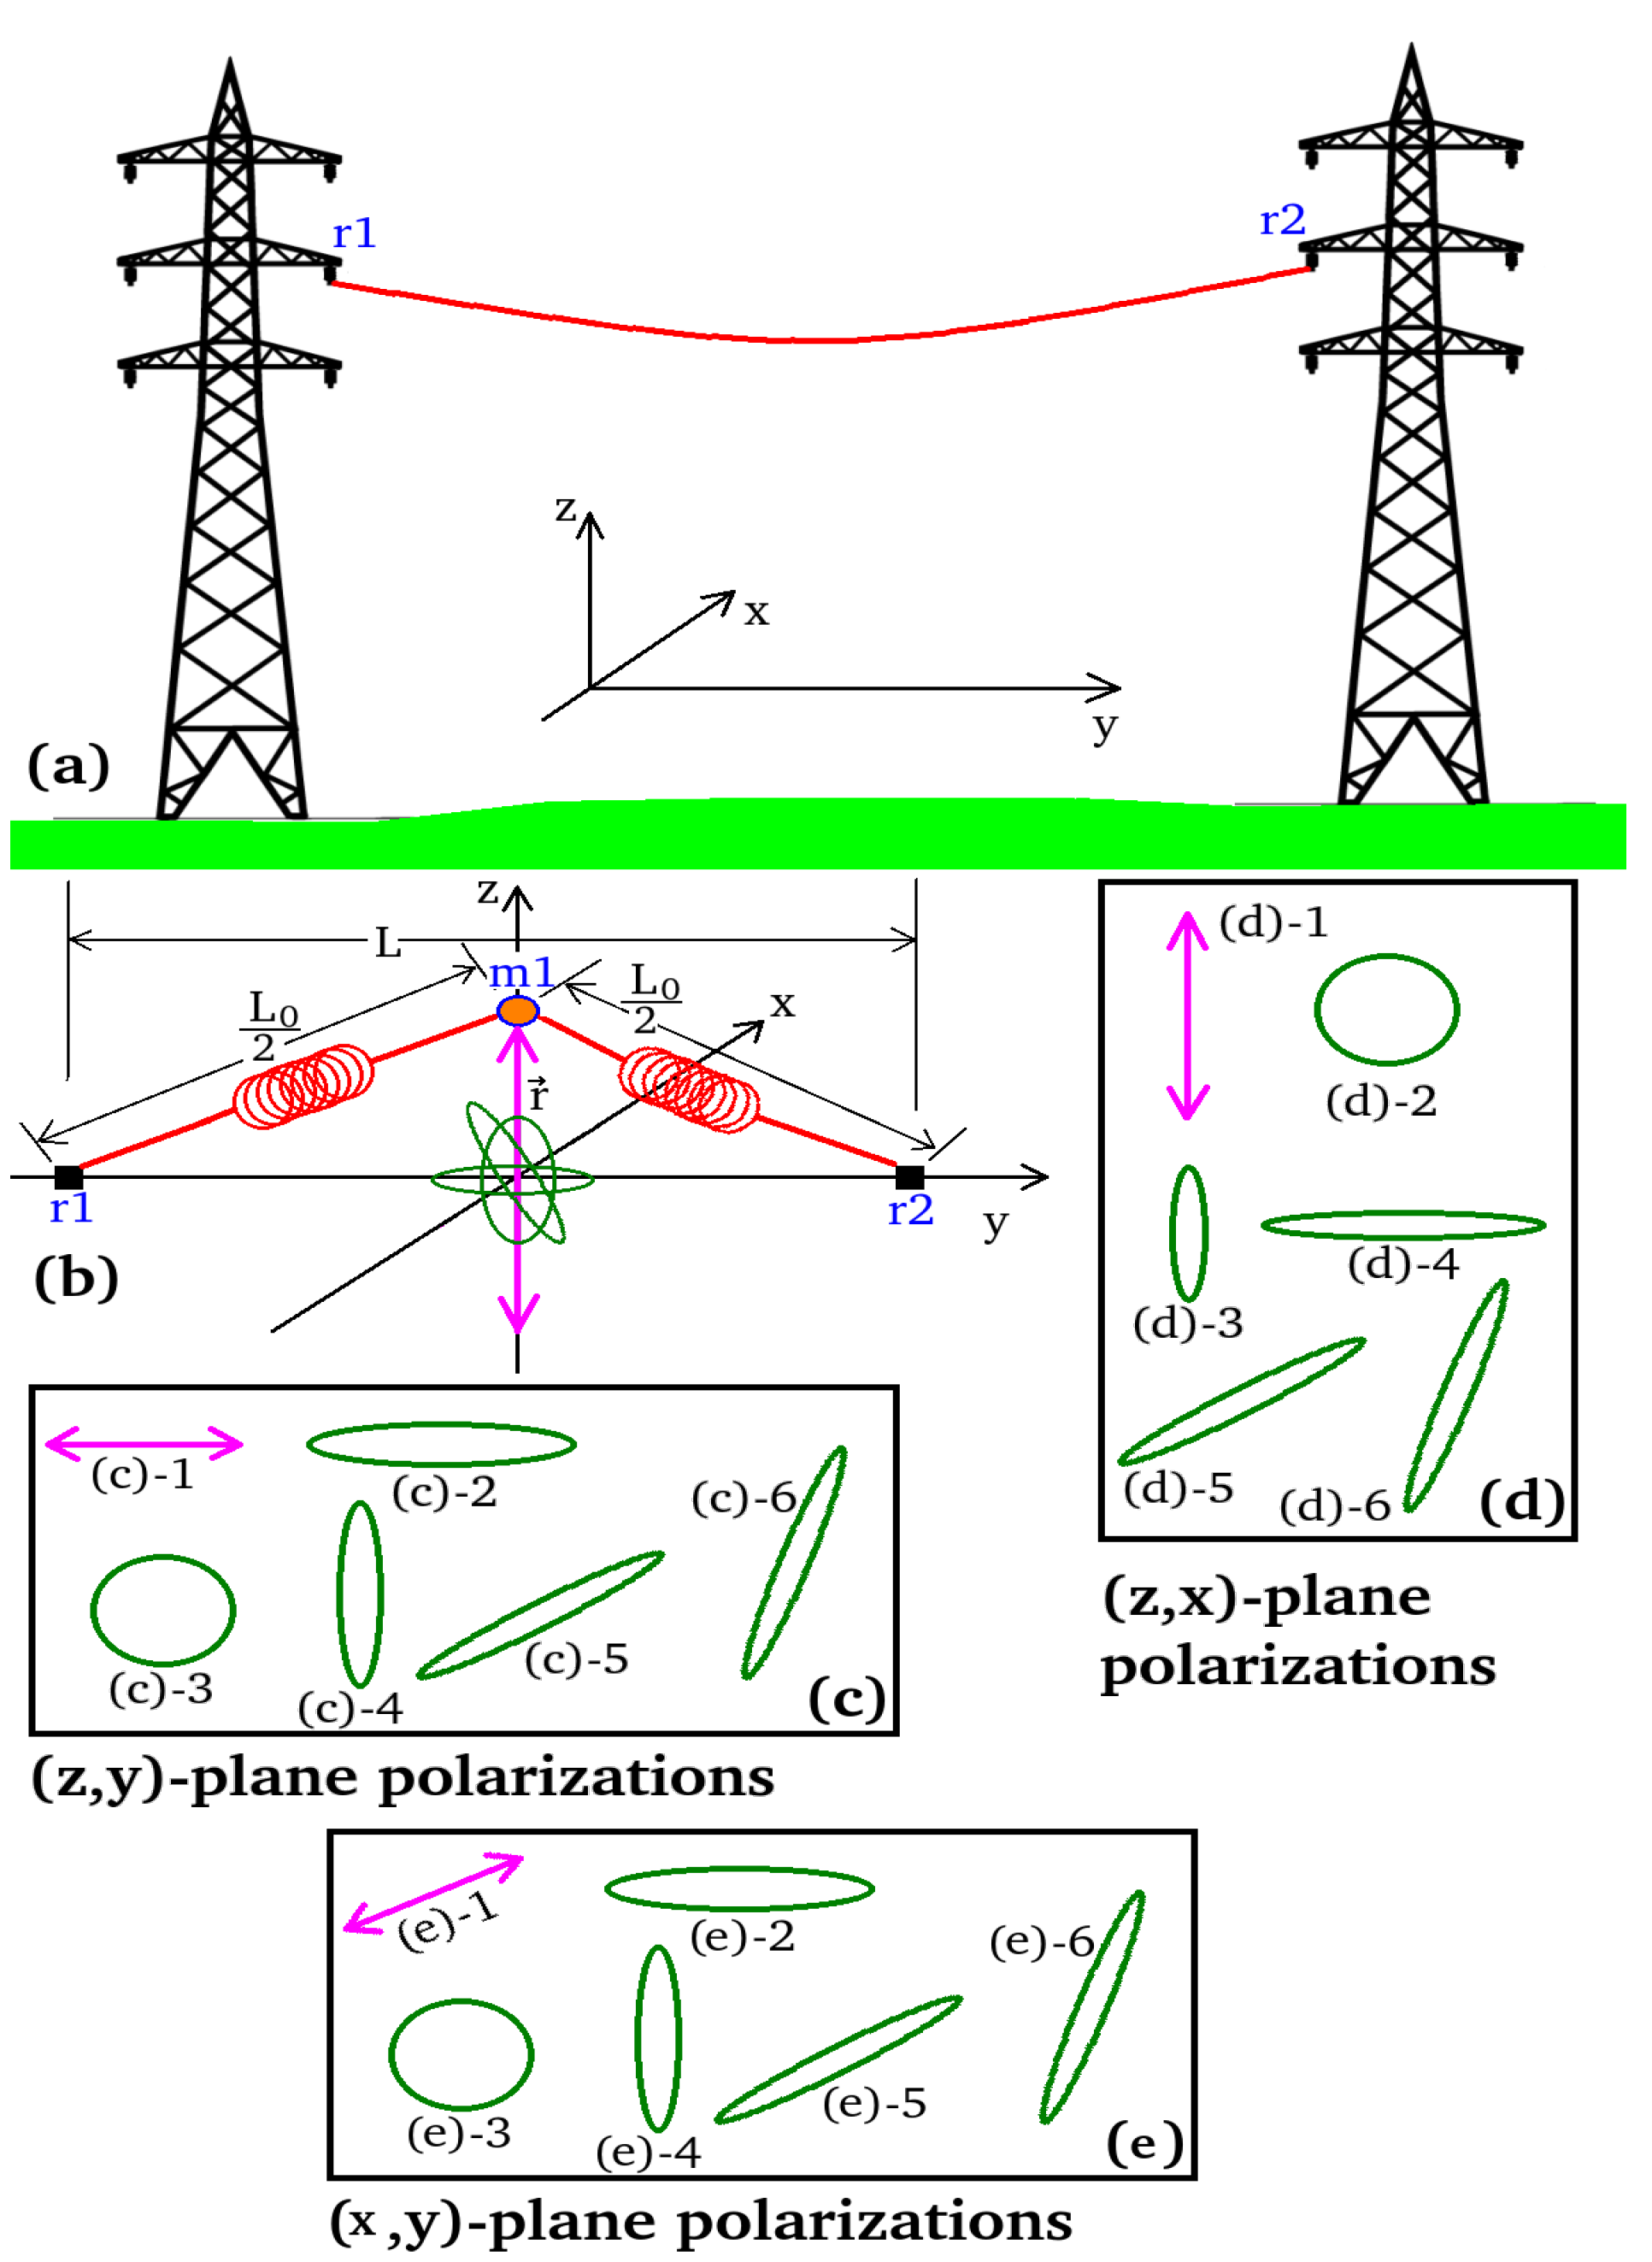
The vibrational model of electrical cables that we propose is schematically shown in Figure 3. Figure 3 (a) depicts two high-voltage pylons connected to each other via an electrical cable (in this case showed in red). The electric cable is physically constrained at points r 1 , and r 2 . Under ideal conditions, i.e. when no perturbation of forces interferes with the quiet state of the cable, this physical body, having mass, is pulled down by the gravitational force generated by the Earth mass. The result is that the cable is bent on the plane ( z , y ) and has a minimum in z precisely located at the middle of its total length. In this context we define its plane of symmetry on ( z , x ) . In this section we describe also the vibrational model of the high-voltage aerial electric cable. Let us consider a taut rope tied at both ends. This ideal object is very similar to the electric cable, which is suspended in air. We suppose the rope is perturbed by an impulsed force. According to this perturbation the rope begins to vibrate describing an harmonic motion (we are not considering any form of frictions). The resulting perturbation moves the rope through the space-time in the form of a sinusoidal function. The matter wave will then reach a constraint end that will cause it to reflect in the opposite direction. The reflected wave will then reach the opposite constraint that will make it reflect in the original direction and return back with the same frequency and amplitude. The rebounding wave is superimposed on the arriving wave, and the interference of two sine waves with the same amplitude and frequency propagating in opposite directions leads to the generation of an ideal and perpetual standing wave on the string (according to Classical Physics). The rope can move in all dimensions of space, and this depends on the nature of the perturbation, i.e. on the vector parameters, within space-time, of the applied force. e.g. the oscillation can arise as a jump rope. In this context, the rope tends to oscillate where each point on it can describe a circle, (this is a fact well known to children). When both ends are fixed, it is often difficult to steer the vibration, for example, so that the movement is restricted to a single transverse plane. In cases where the string supports are symmetrical, then there is no preferred plane of polarization. When the electric cable vibrates, it happens that the length of the string must also fluctuate. This phenomenon causes oscillations in the tension domain of the string. It is clear that these oscillations (i.e. the longitudinal ones) propagate through a frequency approximately twice as high as the frequency value of the transverse vibrations. The coupling between the transverse and longitudinal oscillations of the rope can essentially be modeled through non-linear phenomena. In Figure 3 (b). The figure ideally represents the same reference system as in Figure 3 (b), the electric cable is represented by a concentrated mass, located at the center of the rope. In m 1 two massless springs connecting r 1 with m 1 and r 2 with m 1 are visible. The oscillating system is represented by two springs with a certain constant of elasticity. Such a system has the same, identical representation as an electrical harmonic oscillator, where the mass, by similarity, can be represented as a capacitor, while the spring behaves exactly like an inductance. The system in Figure 3 is a good approximation of the ideal oscillator represented in Figure 3 (a). The mass m 1 can oscillate in different ways. The associated standing wave can so assume different configurations in terms of frequency and polarizations. The associated wave can be purely polarised in the ( y , z ) plane, in which case we refer to Figure 3 (c) where: configuration (c)-1 represents a movement purely described on the y-axis, and the cable being stretched alternately from one side and the other with respect to the plane of symmetry (z,x). In this case we are dealing with linearly-horizontal polarization. All other cases ranging from (c)-2 to (c)-6 represent different cases of not-linear polarizations, which can be circular and elliptical. Another case is when the associated wave is purely polarized in the ( x , z ) plane, in which case we refer to Figure 3 (d) where: configuration (d)-1 represents a movement described purely on the z-axis, and cable being stretched alternately to one side and the other with respect to the plane of symmetry (x,y). In this case polarization is linear-vertical. All other cases ranging from (d)-2 to (d)-6 represent different cases of non-linear polarizations (circular and elliptical). The same thing happens when the associated wave is purely polarized in the ( x , y ) plane. For this oscillation we refer to Figure 3 (e) where: configuration (e)-1 represents the harmonic movement purely drawn on the x-axis. Cable is alternately stretched from one side to the other with respect to the plane of symmetry (z,y). We are dealing with a linear-vertical polarization. All other cases ranging from (e)-2 to (e)-6 represent different cases of non-linear (circular and elliptical) polarization. All other polarization opportunities can be inclined in the (z,y), (z,x), and (x,y) planes that can also not to be excluded. From Figure 3 (b) the distance between the two constraint points r 1 and r 2 is equal to L, while the rope length, when relaxed (no harmonic motion), is equal to L 0 , finally we consider the cord to have an elastic constant equal to k. The vibrational force applied to the mass m 1 of Figure 3 (a) is equal to [20]:
F = 4 k r 1 L 0 L 2 + 4 r 2 .
If r L we can expand (12) in the following series:
F = 4 k r ( L L 0 ) r L 8 k L 0 r L 3 r L 5 + ,
where a precise approximation of (13) is the following cubic restoring force:
F = m r ¨ 4 k r ( L L 0 ) r L 1 + 2 L 0 ( L L 0 ) r L 2 .
Considering (14), the nonlinearity dominates when L L 0 . If we define:
ω 0 = 4 k m L L 0 L ,
and
k = 2 L 0 L 2 L L 0 .
Considering (14) we have:
r ¨ + ω 2 r 1 + K r 2 = 0 .
If we consider damping and forcing (17) is modified as:
r ¨ + λ r ˙ + ω 2 1 + K r 2 r = f ( ω t ) ,
where f ( ω t ) is the forcing term and λ is the damping coefficient. If nonlinearity of (18) is sufficiently low, it can be considered into the following two-degree-of-freedom linear harmonic oscillator:
r = A cos ω 0 t , B sin ω 0 t exp λ t 2 .
In 19  { A , B } are the major and minor axis of an ellipse perpendicular to the x-axis if we consider Figure 3 (c) case, to the y-axis if we consider Figure 3 (d), or to the z-axis if we consider Figure 3 (e). The harmonic oscillator (19) is the displacement generated by the vibration and it is that parameter that we estimate through the formula (11), considering the parameters ϵ r 1 , ϵ r 2 , ϵ c 1 .

2.4. Processing Framework

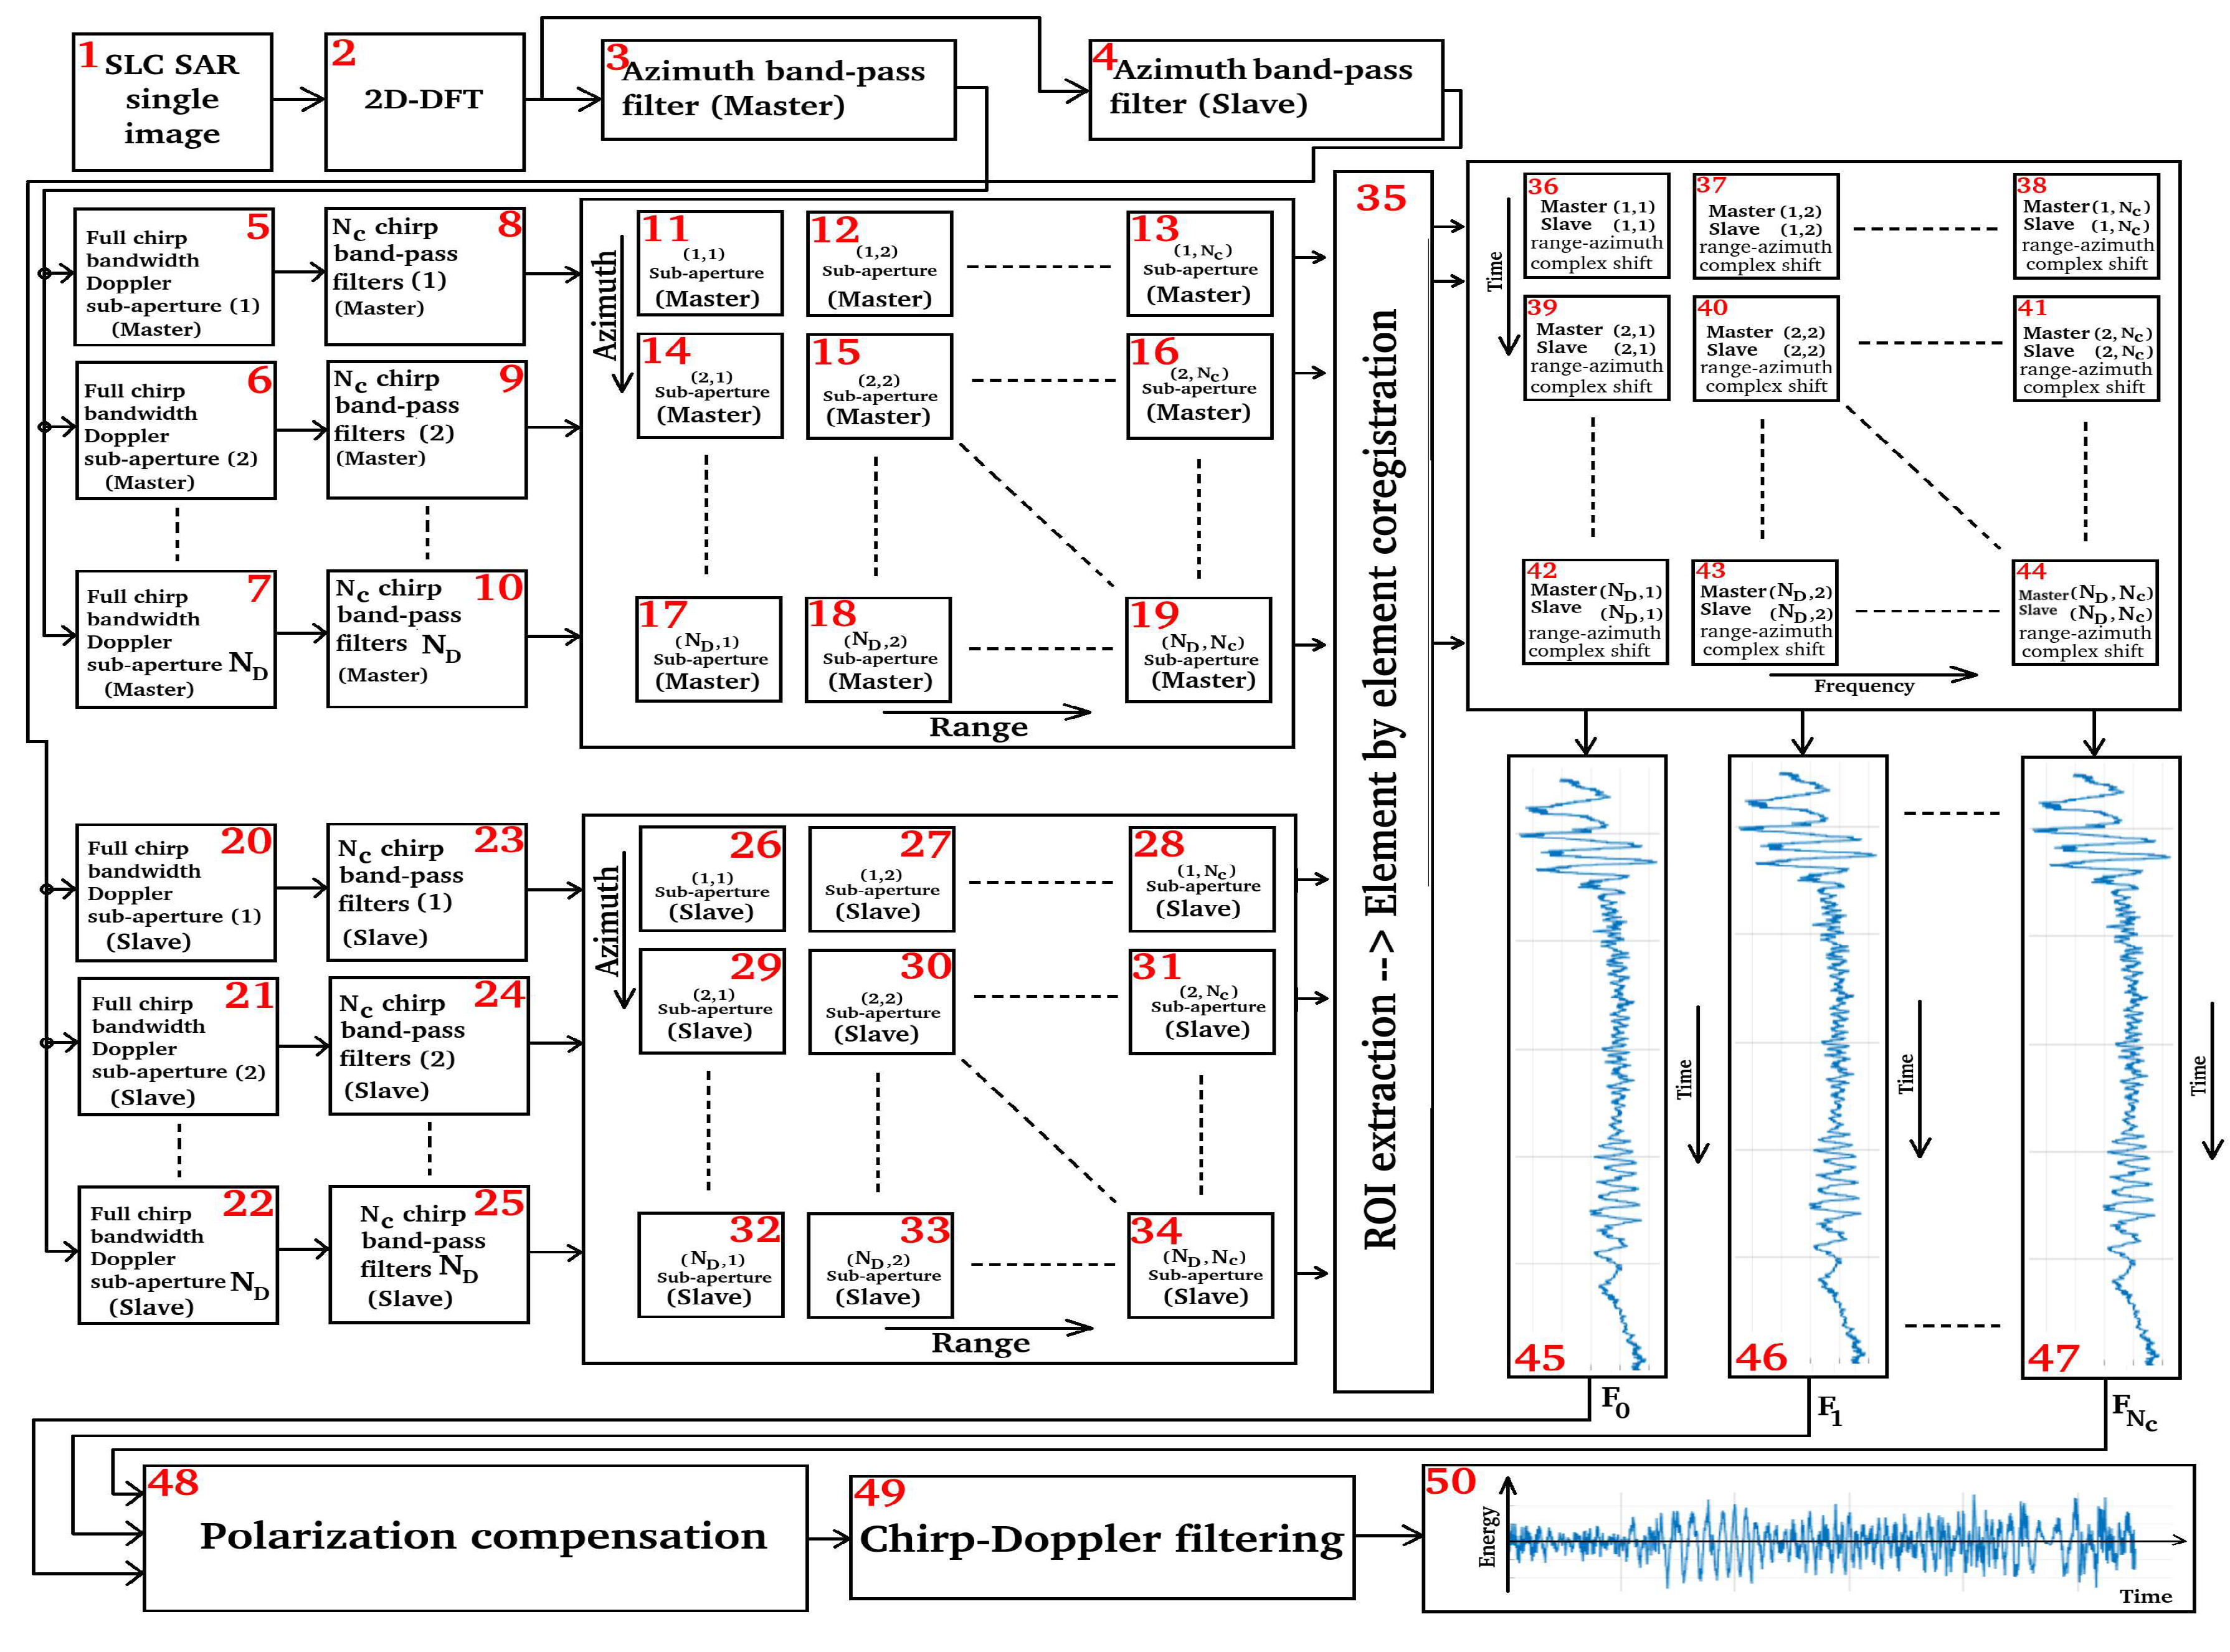
In this section we describe the processing framework we have designed in order to estimate the vibrations generated by high voltage, induced on overhead power cables, in case they are visible to radar. Figure 4 represents the computational scheme of the whole measurement system. We start from block 1, consisting of a single focused SAR image existing in the SLC configuration. Computational block 2 performs the 2D digital Fourier Transform (DFT) of the SLC image. At this point the full-band spectrum of the SAR image is split in two. An exact copy of the original spectrum is presented at the input of computational block 3, representing the filtering strategy of the master image. The second clone of the full-band spectrum is presented at the input of computational block 4, consisting of the multi-dimensional and programmable bandpass filter of the slave image. In order to aim of maximizing the clarity of the algorithm exposure, computational block 3 is subdivided into blocks 5, 6, 7, 8, 9, and 10, while the computational block 4 is expanded into blocks 20, 21, 22, 23, 24, and 25. Computational stages 5, and 6 perform the first filtering, according to the frequency allocation strategy depicted in Figure 2 (1,1), (1,2), e (1,3). The output of 8 generates the first row of the matrix 3, consisting of blocks 11, 12, and 13. Computational blocks 6, and 9 perform the second filtering, which consists of displaying the bands (2,1), (2,2), and (2,3) of Figure 2. The output of 9 generates the second row of the matrix 3, constituting blocks 14, 15, and 16. The last row of the matrix 3 is synthesized by computational blocks 7, and 10, consisting of 17, 18, and 19, in accordance with the frequency allocation strategy depicted in Figure 2 (3,1), (3,2), e (3,3).
The same is true for the slave image, which always has a Doppler frequency difference from the master of B c D 1 100 Hz. Computational blocks 20, and 23 perform the first filtering, according to the frequency allocation strategy depicted in Figure 2 (1,1), (1,2), e (1,3). The output of 23 generates the first row of the matrix 4, formed by blocks 26, 27, and 28. Computational stages 21, and 24 perform the second filtering, which consists of displaying the bands (2,1), (2,2), and (2,3) of Figure 2. The output of 24 generates the second row of the matrix 4, formed by blocks 29, 30, and 31. The last row of the matrix 4 is synthesized by computational blocks 22, and 25, consisting of 32, 33, and 34, in accordance with the frequency allocation strategy depicted in Figure 2 (3,1), (3,2), e (3,3).
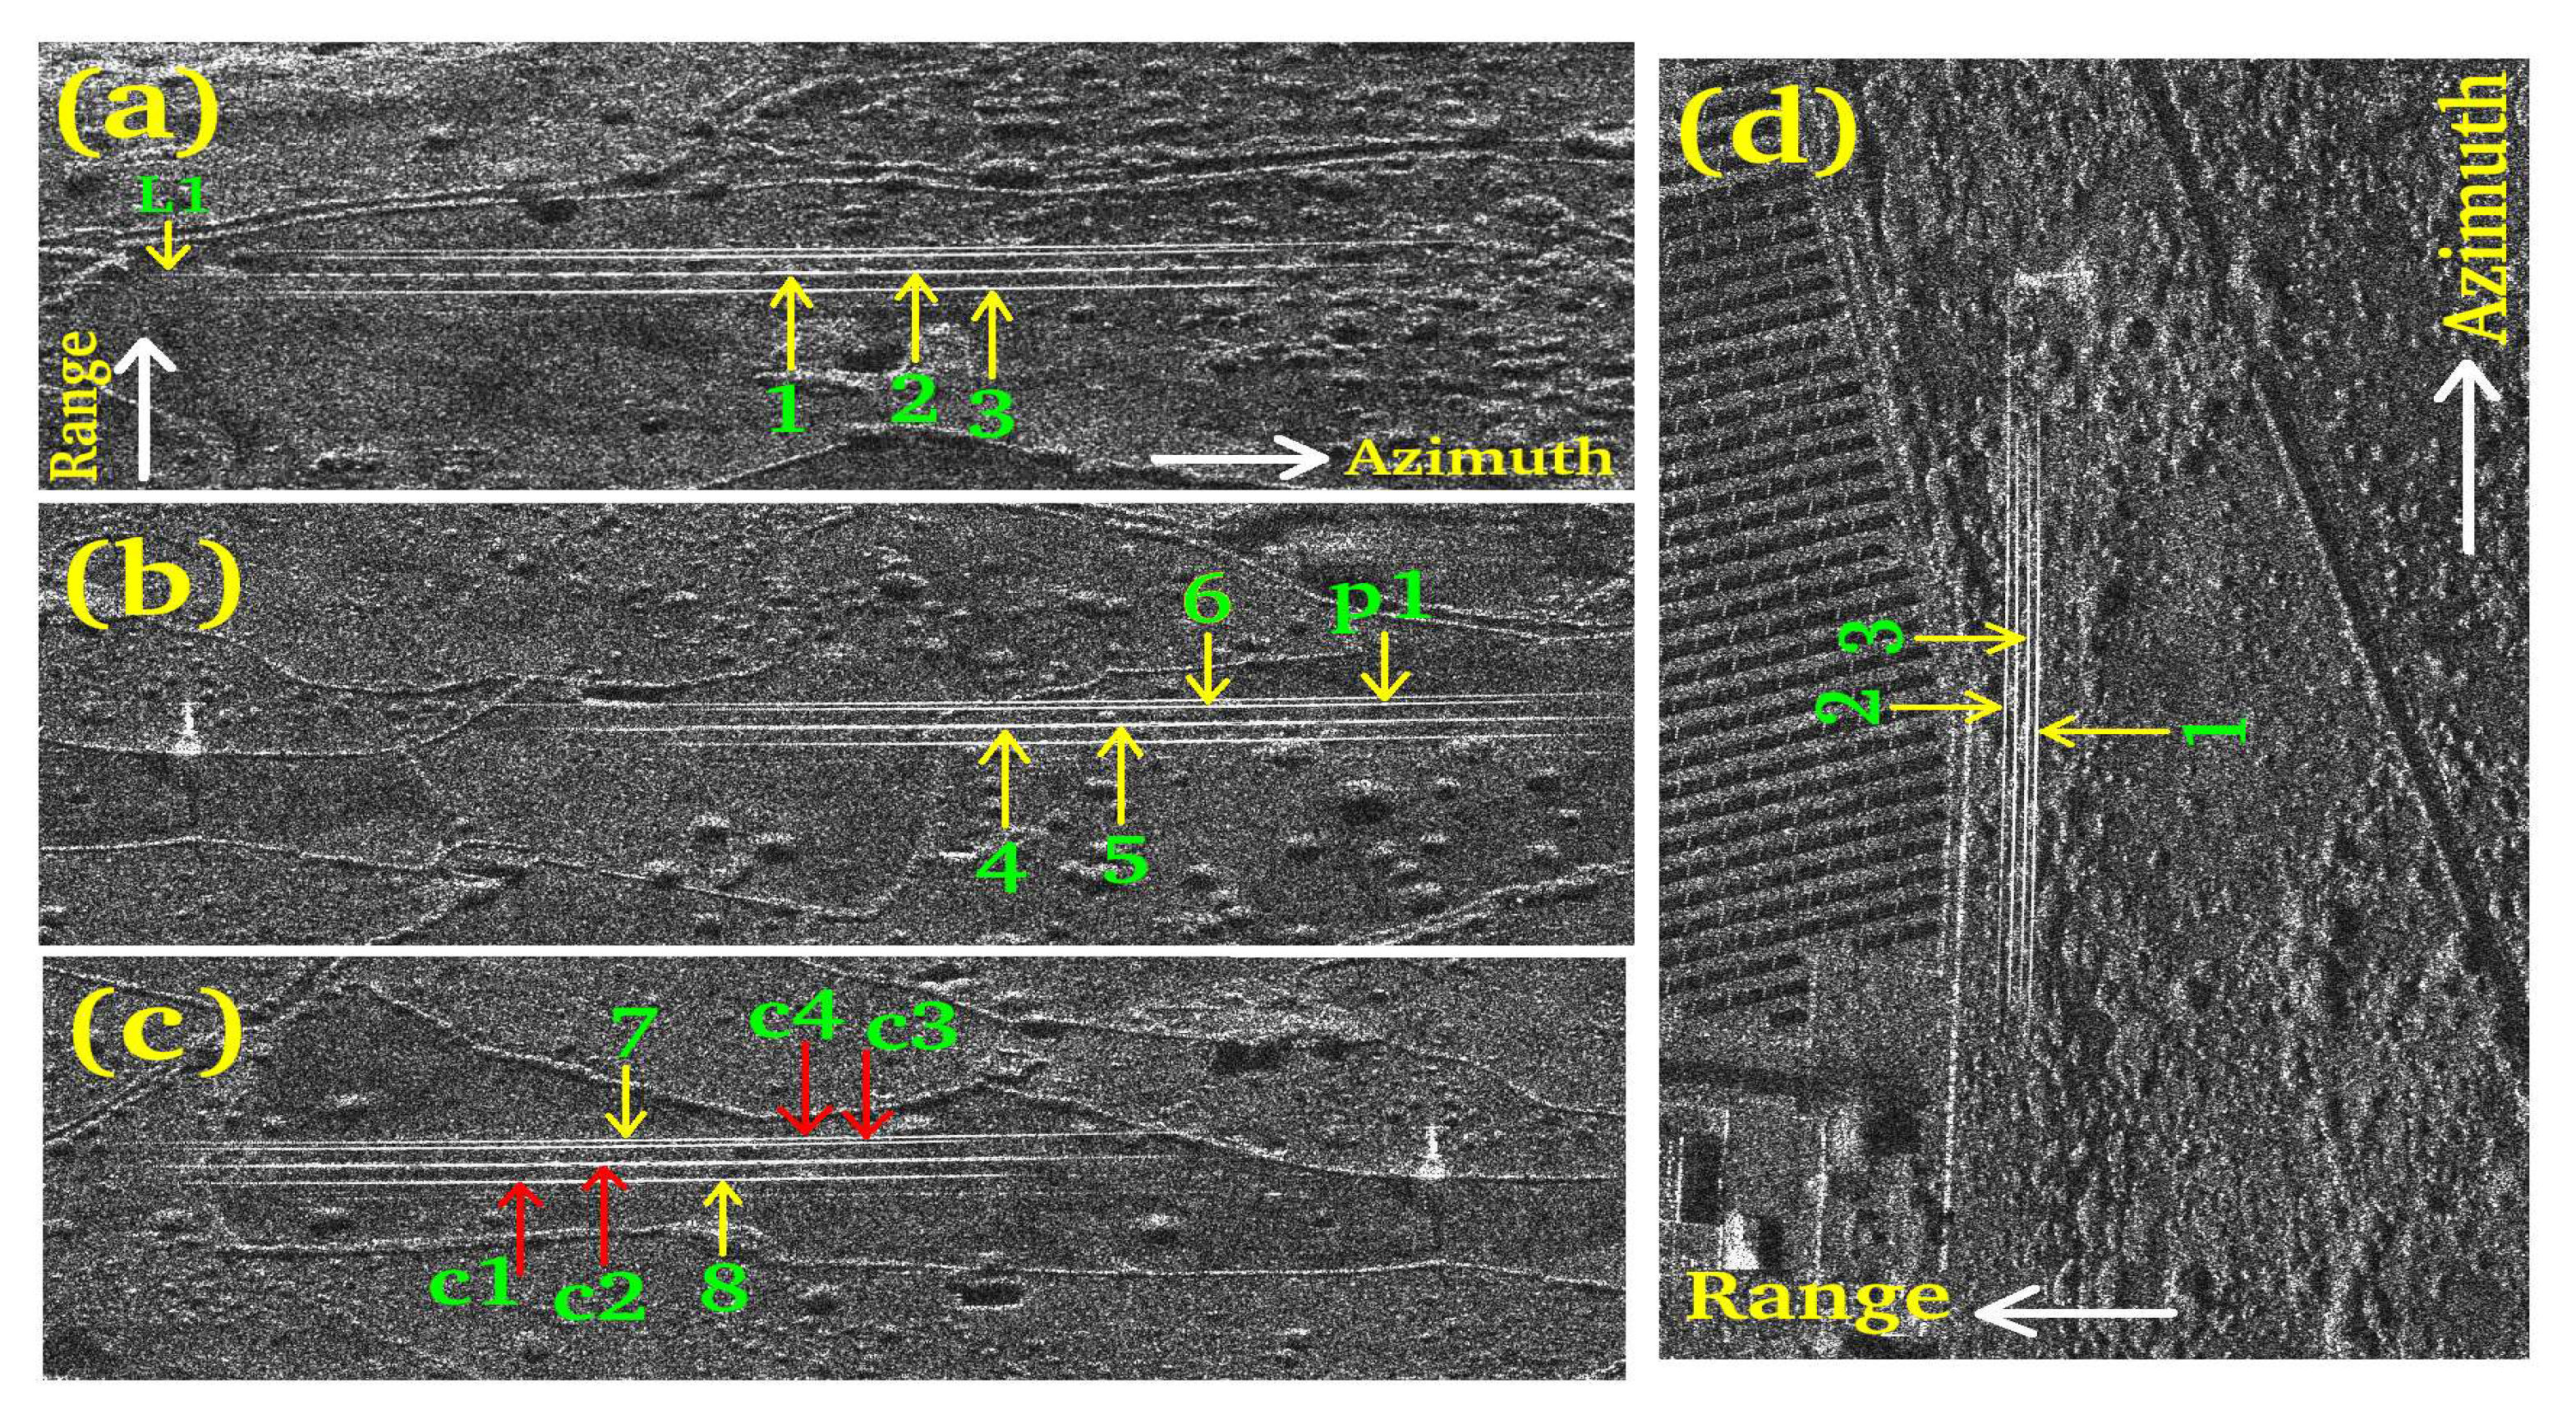
The matrices 3 and 3, identified by the blocks 11, 12, 13, 14, 15, 16, 18, and 19, constituting the master and the blocks 26, 27, 28, 29, 30, 31, 32, 33, and 35, being part of the slave, are presented to the computational stage 35 which has the task of performing the region of interest (ROI) extraction. In the present paper the ROIs are the images represented in Figure 8 for case study 1 and Figure 8 (c) for case study 2. In this context, for each point 1, 2, 3, visible in Figure 8 (a), 4, 5, 6, visible in Figure 8 (b) and 7, 8, c1, c2, c3, and c4, visible in Figure 8 (c), (belonging to case study 1), and points 1, 2, and 3, belonging to case study 2, shifts are calculated, using a sub-pixel coregistrator, for which the characteristics are listed in Table 2. The coregistrator acts according to the following strategy: The computational block 36 coregisters the sub-matrix 11 with the sub-matrix 32 and a complex number representing the shift of each previously listed measurement point located on the master, with respect to the slave, is generated. To complete the description, we list the following coregistration strategy sequence, used foe estimating all results:
  • block 36 coregisters sub-matrix 11 with sub-matrix 26;
  • block 37 coregisters sub-matrix 12 with sub-matrix 27;
  • block 38 coregisters sub-matrix 13 with sub-matrix 28;
  • block 39 coregisters sub-matrix 14 with sub-matrix 29;
  • block 40 coregisters sub-matrix 15 with sub-matrix 30;
  • block 41 coregisters sub-matrix 16 with sub-matrix 31;
  • block 42 coregisters sub-matrix 17 with sub-matrix 32;
  • block 43 coregisters sub-matrix 18 with sub-matrix 33;
  • block 44 coregisters sub-matrix 19 with sub-matrix 34.
Blocks 45, 46 and 47 contain the vibrational trend, in this case of a single measurement point, calculated at different frequencies. Block 45 contains the vibration (of length N D ) of the first chirp sub-aperture, extrapolated from column 36, 39,...,42, while block 46 contains the vibration (of length N D ) of the second chirp sub-aperture, extrapolated from column 37, 40,...,43, and finally the vibration (again of length N D ) of the last chirp sub-aperture, extrapolated from column 38, 41,...,44. The computational block 48 performs the wind-compensation, using a Golay filter, the computational block 49 averages all the vibrations calculated for each frequency, in order to obtain the vibrations generated by the alternating current (always of length N D ), contained in the block 50.

3. Experimental results

The experimental results were performed by processing a single Staring Spotlight SAR image observed by the COSMO-SkyMed satellite constellation. The band B s h i f t was set to about 1 100 of the total Doppler band, so as to be sensitive in estimating the vibration frequency generated by the high voltage, which is equal to 50 Hz. In the range direction, the original image was observed using an electromagnetic band equal to B C r , while the not processed bandwidth is set equal to B c L . This bandwidth is set approximately at B c L = 1 4 of B c r . The acquisition site is depicted inside the yellow box, indicated by the white arrow ”Experiments site” (not in scale), in Figure 5 and includes a sector of the territory of the island of Sardinia (Italy). Two extrapolated details of the same SAR image are represented in Figure 6 (a) and Figure 6 (b). All the experiments concerning case study 1 were performed on pixels contained in Figure 6 (a), while the experiments of case study 2 on pixels of the image in Figure 6 (b). Figure 7 (a), (b) are the images1 of Figure 6 (a) and Figure 6 (b) in ”slant“ coordinates respectively. The characteristics of the SAR acquisition are listed in Table 1, and the coregistration parameters are instead listed in Table 2. The complete list of the experimental results are finally listed in Table 3.
Figure 5. Geographical representation of the experiment site, located within the yellow box.
Preprints 82042 g005
Figure 6. SLC SAR orthorectified data consisting of case study 1.
Preprints 82042 g006
Figure 7. SLC SAR images. (a): case of study 1 environment. (b): Case of study 2 environment.
Preprints 82042 g007
Figure 8. Case of study 1 SLC SAR image. (a): Set of targets 1, 2, and 3. (b): Set of targets 4, 5, and 6. (c): Set of targets 7, 8, c1, c2, c3, and c4.
Preprints 82042 g008
Table 1. Characteristics of the SAR acquisitions.
SAR parametrer Value
Chirp bandwidth 300 MHz
Doppler bandwidth 24 kHz
PRF 3.3 kHz
PRT 0.303 ms
Antenna length 6 m
Type of acquisition Spotlight
Polarization HH
Acquisition duration 12.5 s
Platform velocity 7 km/s
Observation height 650000 m
Table 2. Coregistration parameters.
Coregistrator parametrer Value
Oversampling factor 1800
Number of points 1
Reference window 64 × 64
Search pixel window 1 × 1
Correlation window 16 6 m
Correlation strategy 2D cross correlation
Use DEM No
Table 3. List of experiments.
Record Case Study Reference frame Point label Reference Figure Coordinates (Lat) Coordinates (Lon) Experiment type
1 1 1 (Figure 7) (a) 1 Figure 8 (a) 41,076998 8.857188 Measurement
2 1 1 (Figure 7) (a) 2 Figure 8 (a) 41,076998 8.857188 Measurement
3 1 1 (Figure 7) (a) 3 Figure 8 (a) 41,076998 8.857188 Measurement
4 1 2 (Figure 7) (a) 4 Figure 8 (b) 41,076998 8.857188 Measurement
5 1 2 (Figure 7) (a) 5 Figure 8 (b) 41,076998 8.857188 Measurement
6 1 2 (Figure 7) (a) 6 Figure 8 (b) 41,076998 8.857188 Measurement
7 1 2 (Figure 7) (a) 7 Figure 8 (c) 41,076998 8.857188 Measurement
8 1 3 (Figure 7) (a) 8 Figure 8 (c) 41,076998 8.857188 Measurement
9 2 3 (Figure 7) (b) 9 Figure 8 (c) 41,076998 8.857188 Measurement
10 2 3 (Figure 7) (b) 10 Figure 8 (c) 41,076998 8.857188 Measurement
11 2 3 (Figure 7) (b) 11 Figure 8 (c) 41,076998 8.857188 Measurement
12 4 3 (Figure 7) (a) c1 Figure 8 (c) 41,076998 8.857188 Measurement
13 4 3 (Figure 7) (a) c2 Figure 8 (c) 41,076998 8.857188 Measurement
14 4 3 (Figure 7) (a) c3 Figure 8 (c) 41,076998 8.857188 Measurement
15 4 3 (Figure 7) (a) c4 Figure 8 (c) 41,076998 8.857188 Measurement
16 4 1 (Figure 7) (a) q1 Figure 7 (a) 41,076998 8.857188 Measurement
17 4 1 (Figure 7) (b) q2 Figure 7 (a) 41,076998 8.857188 Measurement
18 4 1 (Figure 7) (b) c1 Figure 8 (c) 41,076998 8.857188 Measurement
19 4 1 (Figure 7) (b) c2 Figure 8 (c) 41,076998 8.857188 Measurement
20 4 1 (Figure 7) (b) c3,c4 Figure 8 (c) 41,076998 8.857188 Measurement
21 2 1 (Figure 8 (a) w1 Figure 8 (b) 41,076998 8.857188 Performance
22 2 1 (Figure 8 (b) t2 Figure 8 (b) 41,076998 8.857188 Performance
23 2 1 (Figure 8 (b) t1 Figure 8 (a) 41,076998 8.857188 Performance
34 3 1 (Figure 7) (a) L1 Figure 8 (a) 41,076998 8.857188 Performance
25 3 1 (Figure 7) (b) t2 Figure 8 (a) 41,076998 8.857188 Performance
26 3 2 (Figure 7) (b) w1 Figure 8 (a) 41,076998 8.857188 Performance
20 3 1 (Figure 7) (b) p1 Figure 8 (a) 41,076998 8.857188 Performance
21 3 none none Figure 31 42.008071 12.544222 Validation

3.1. Study Case 1

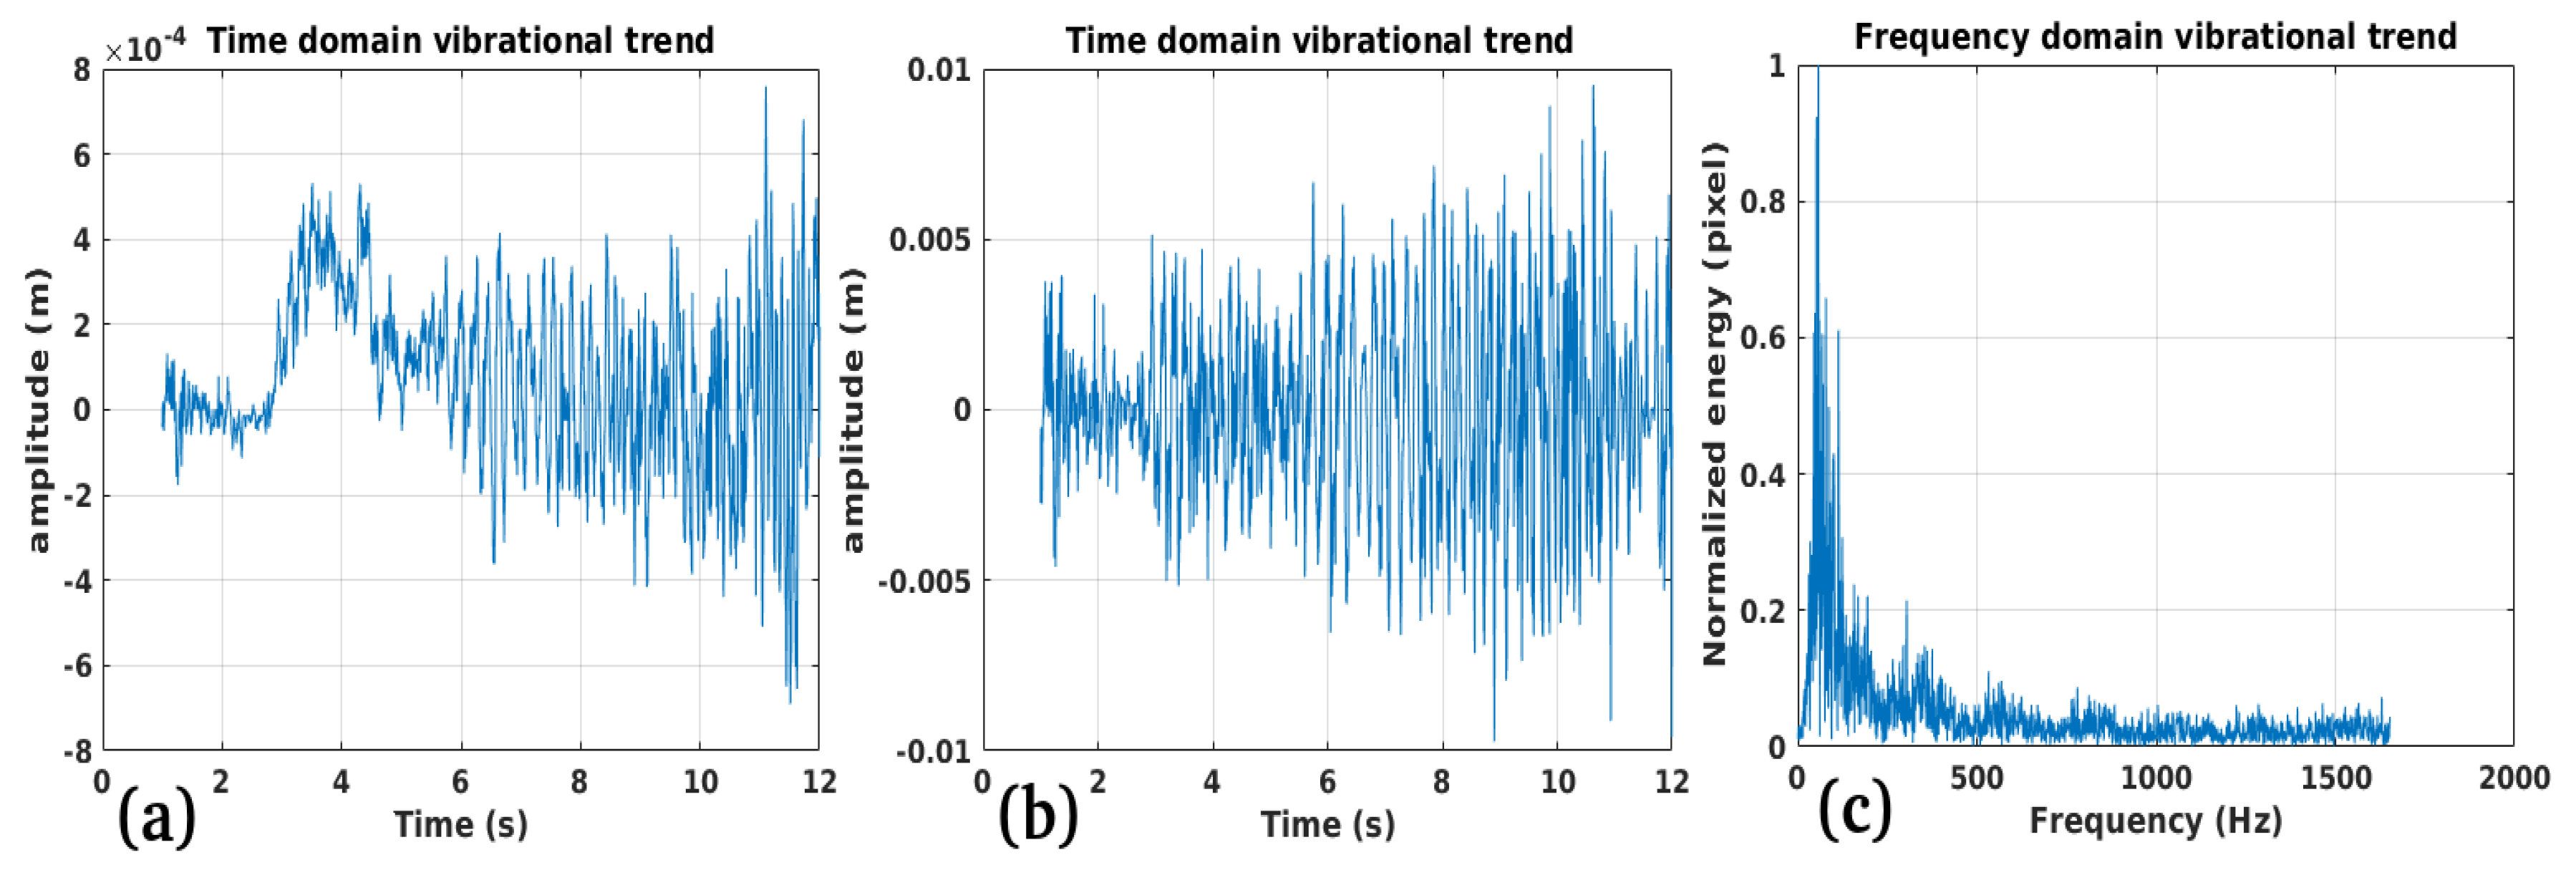
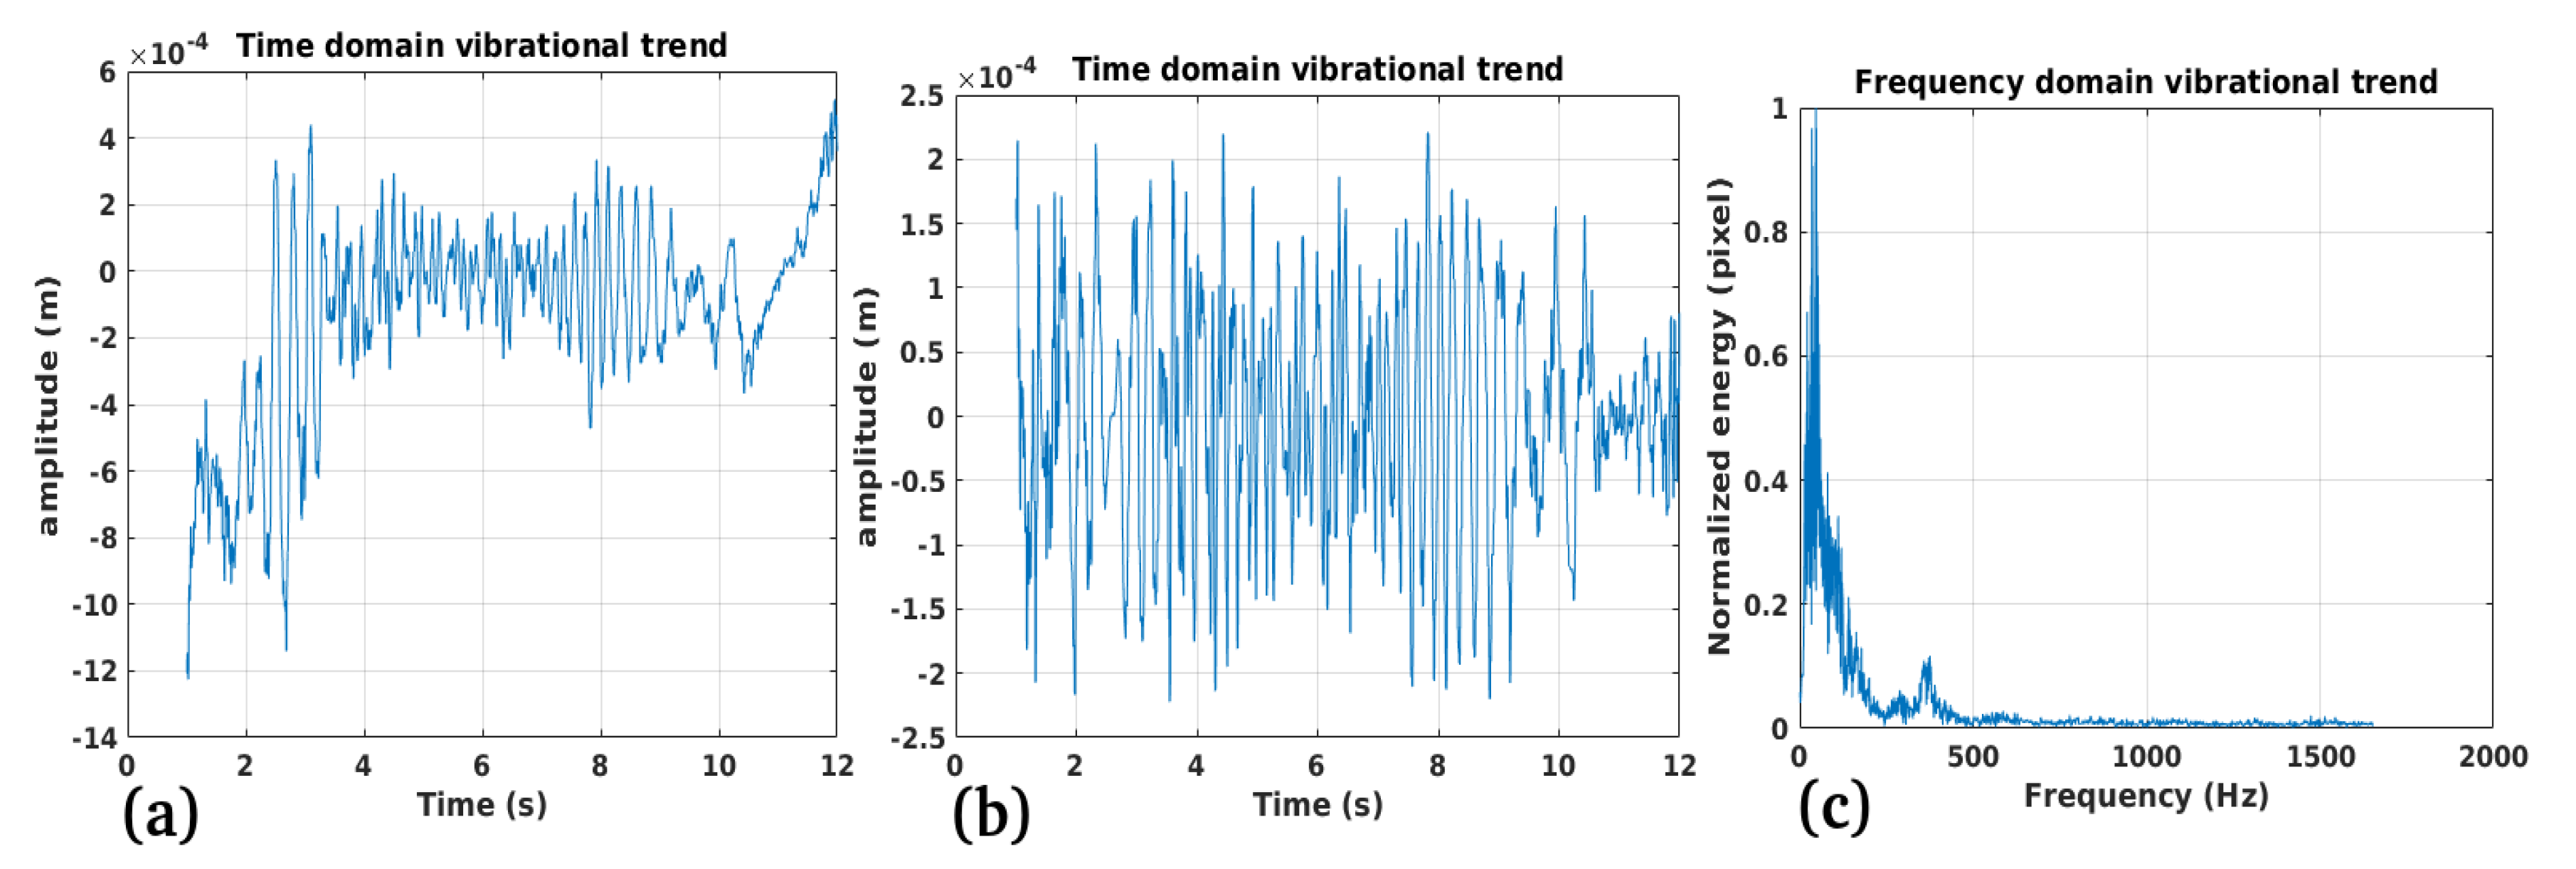
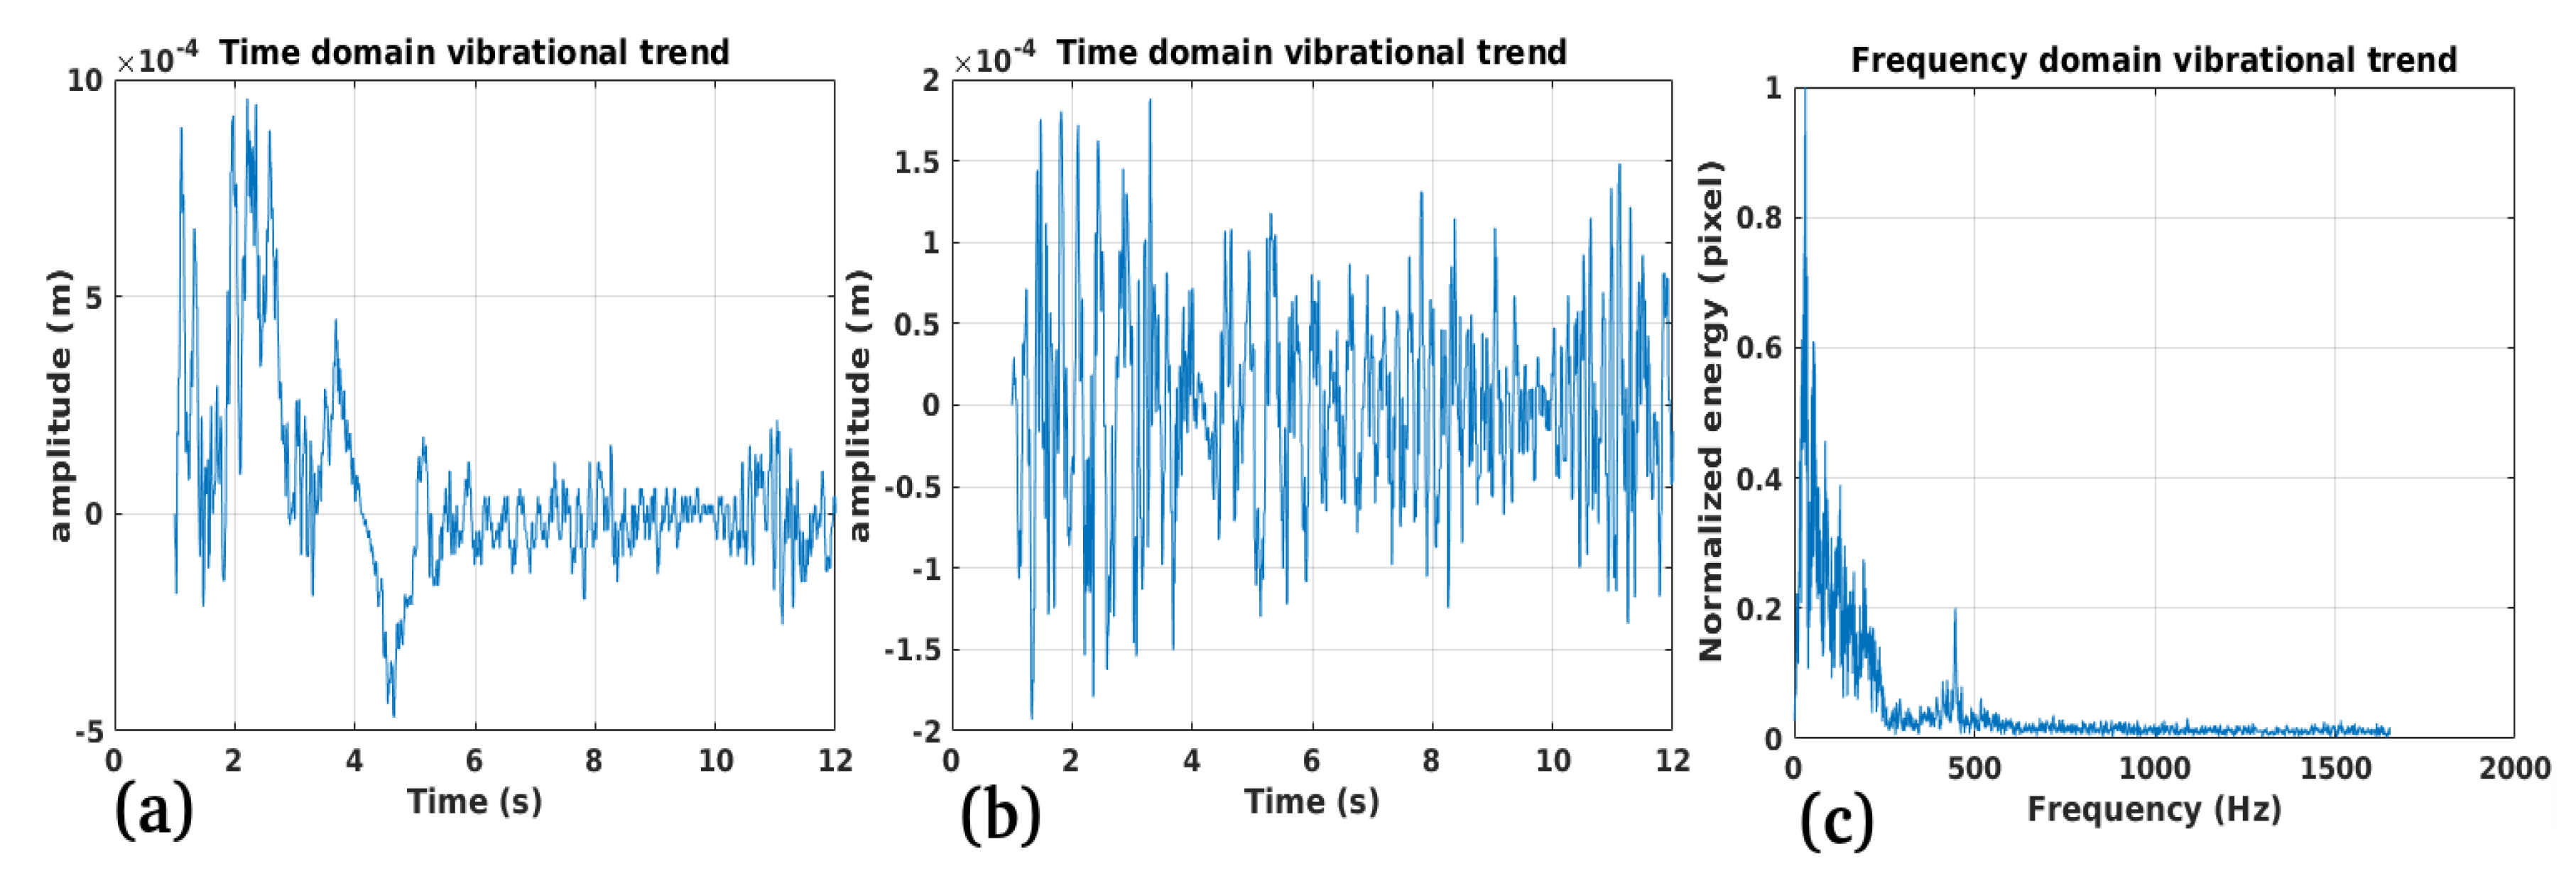
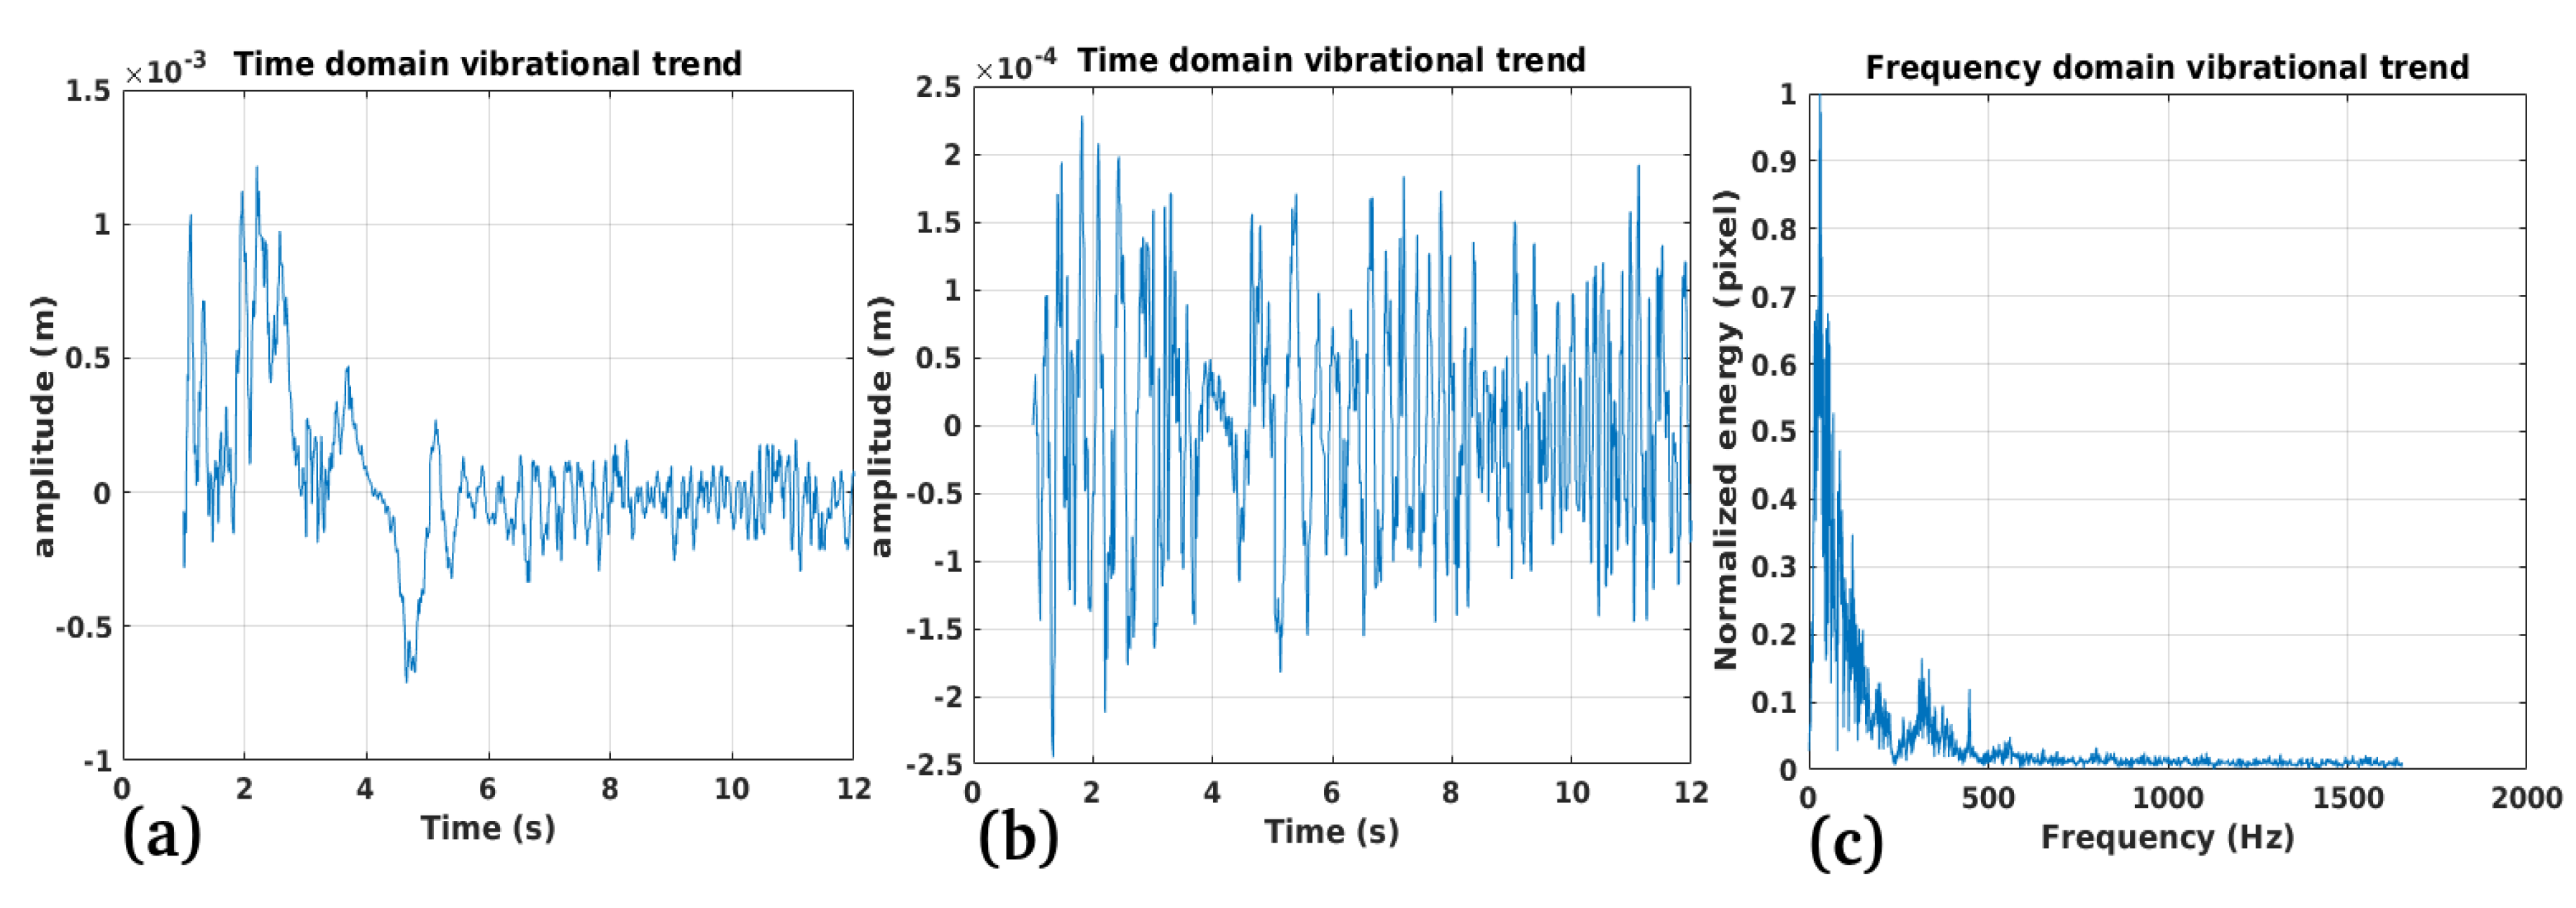
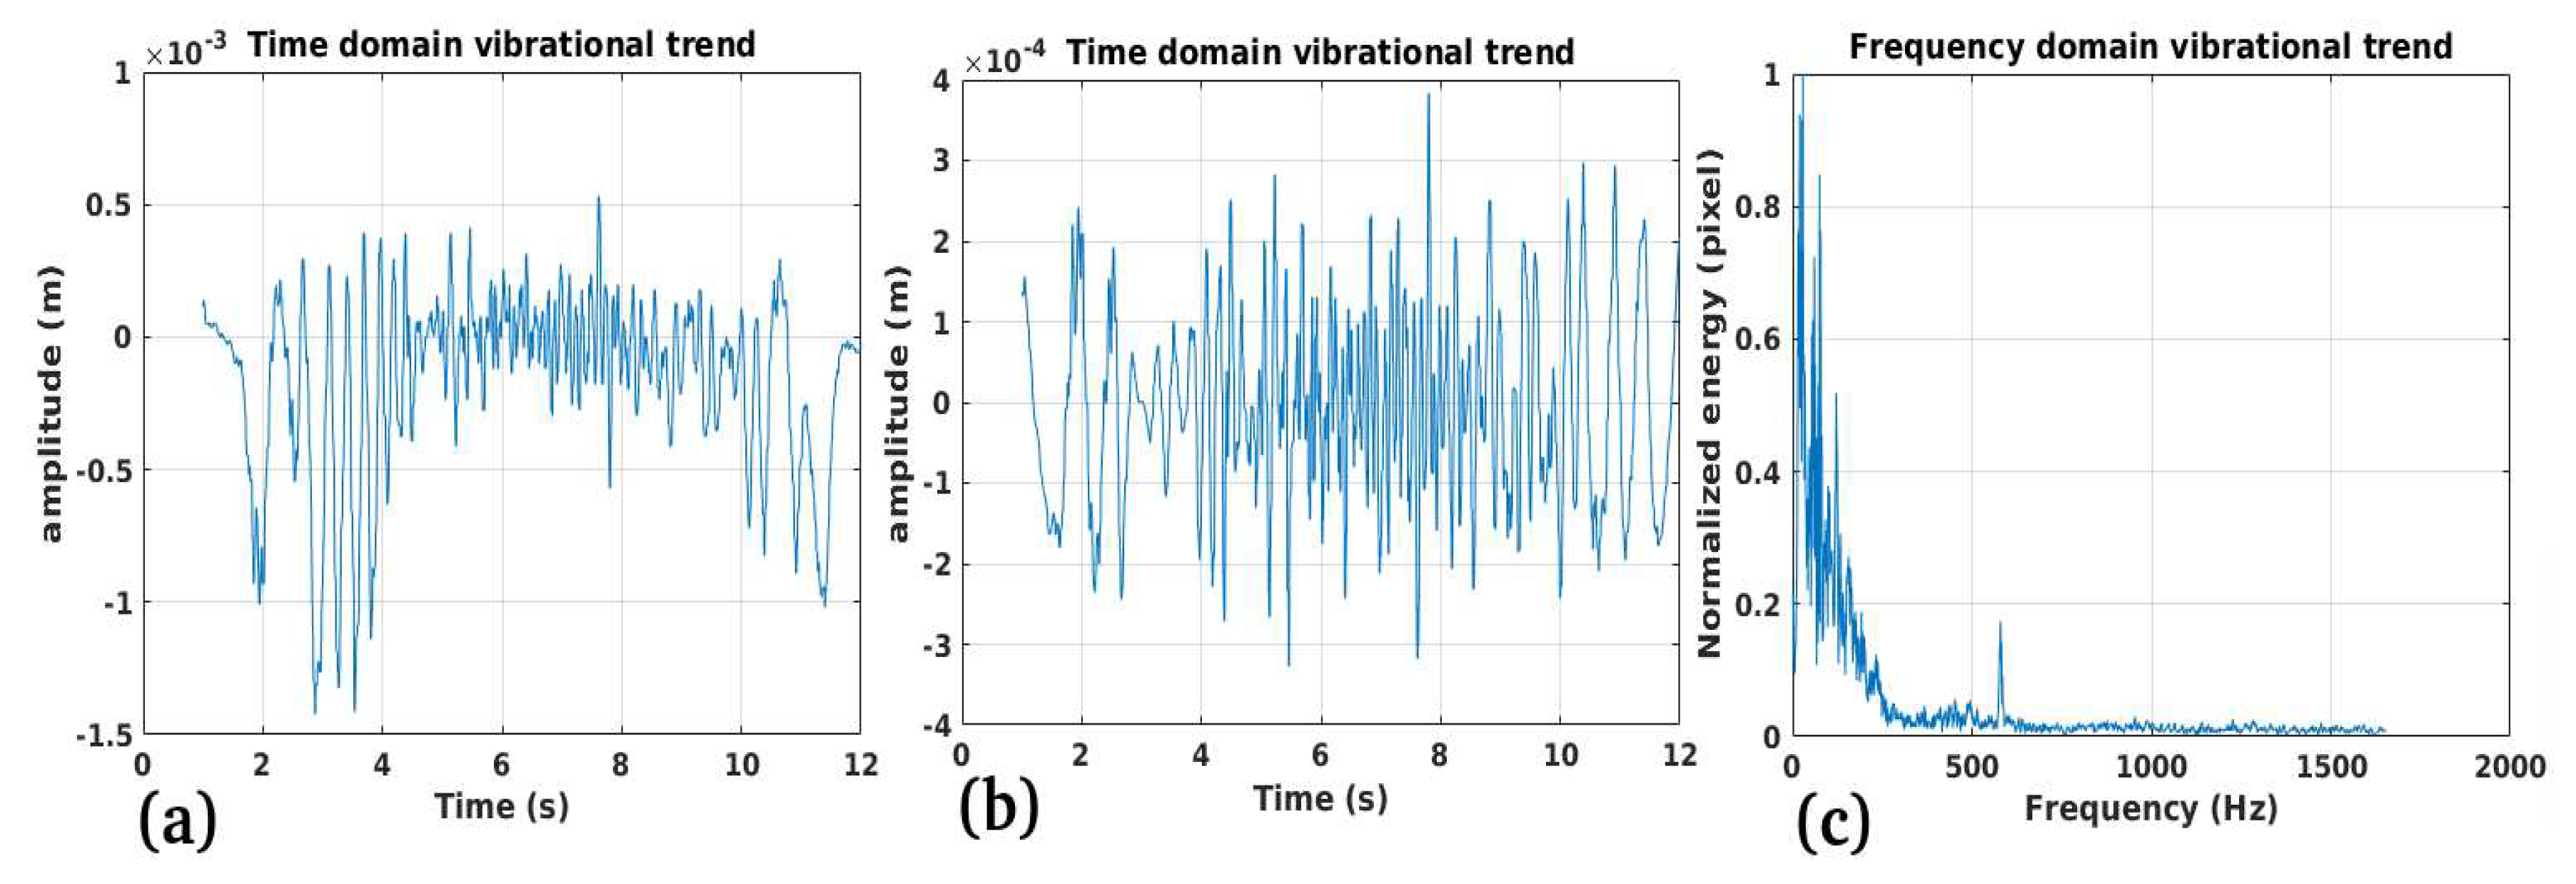
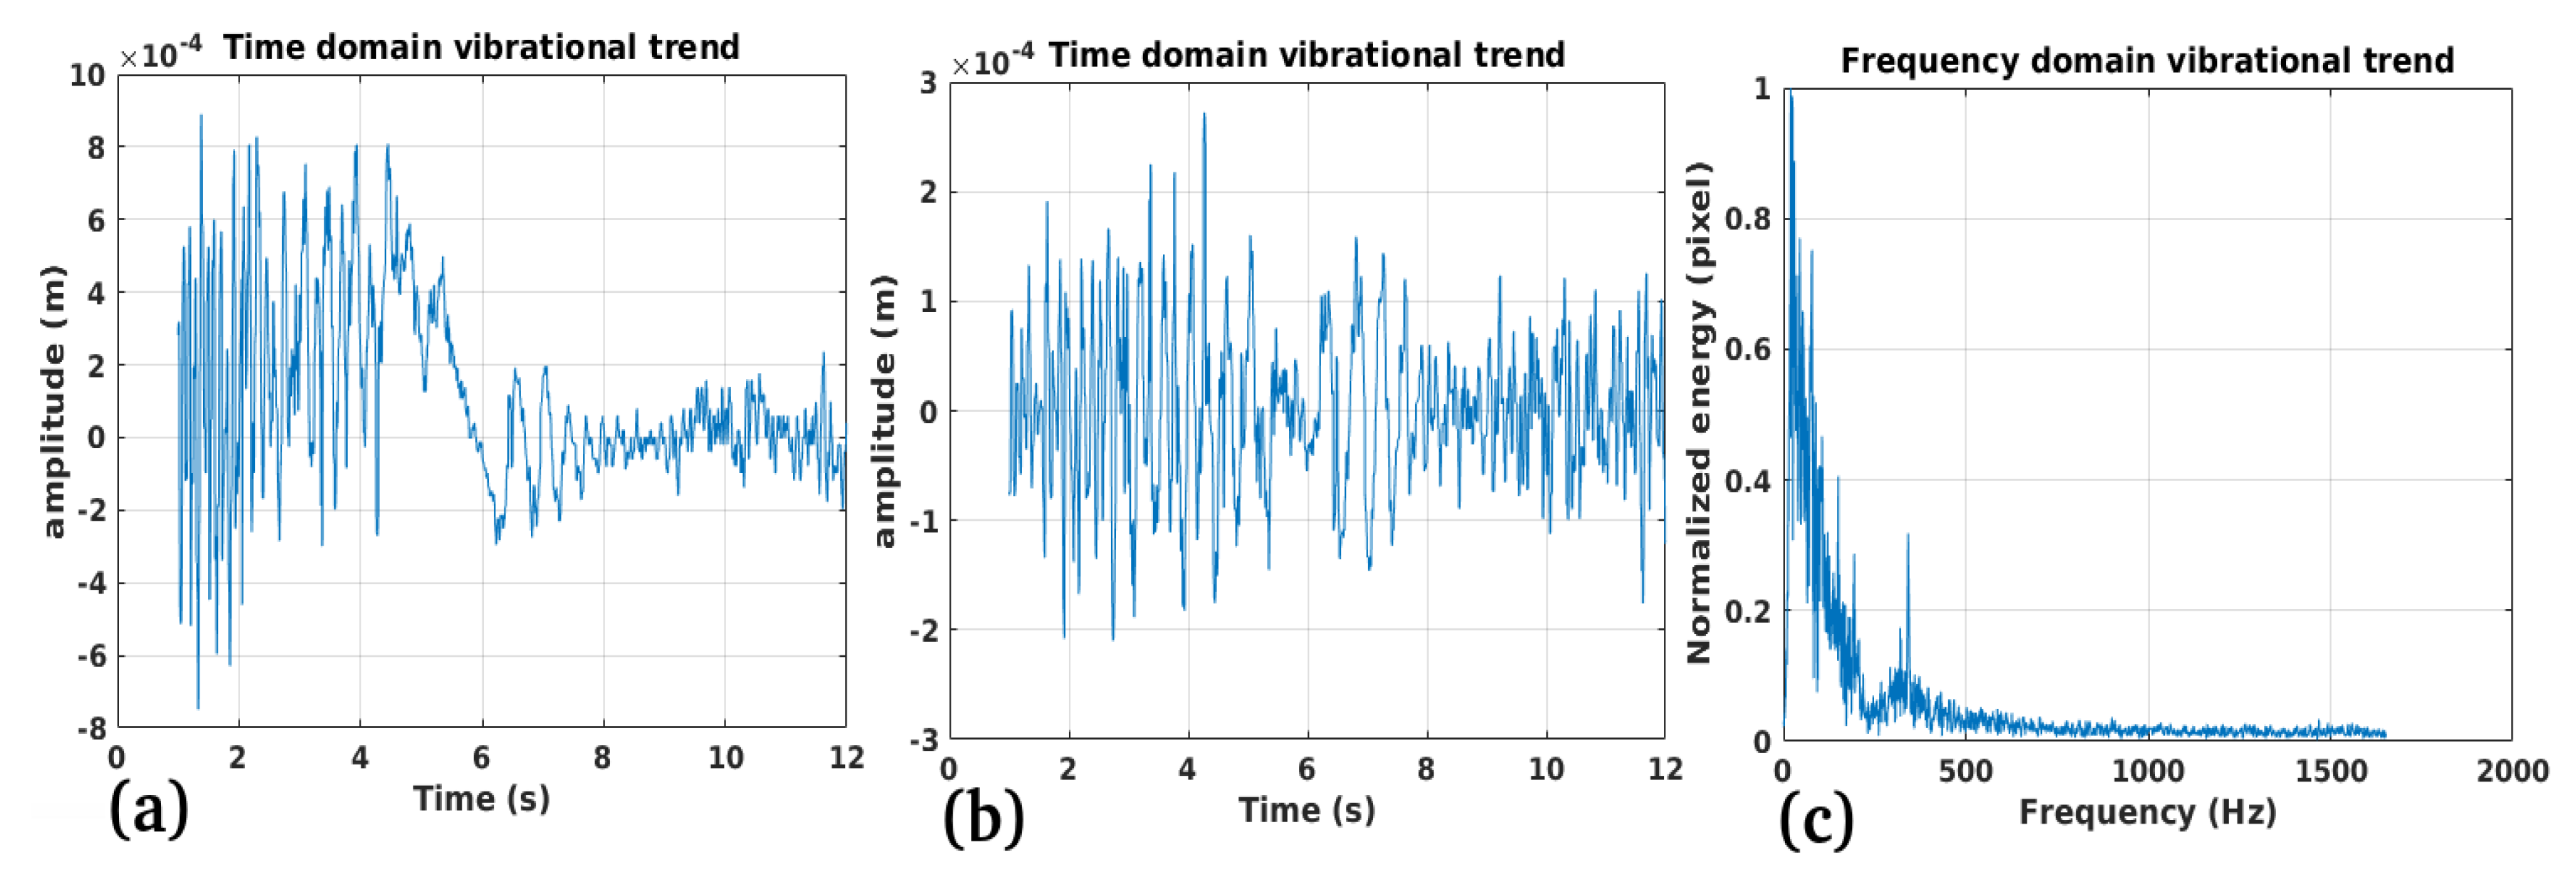
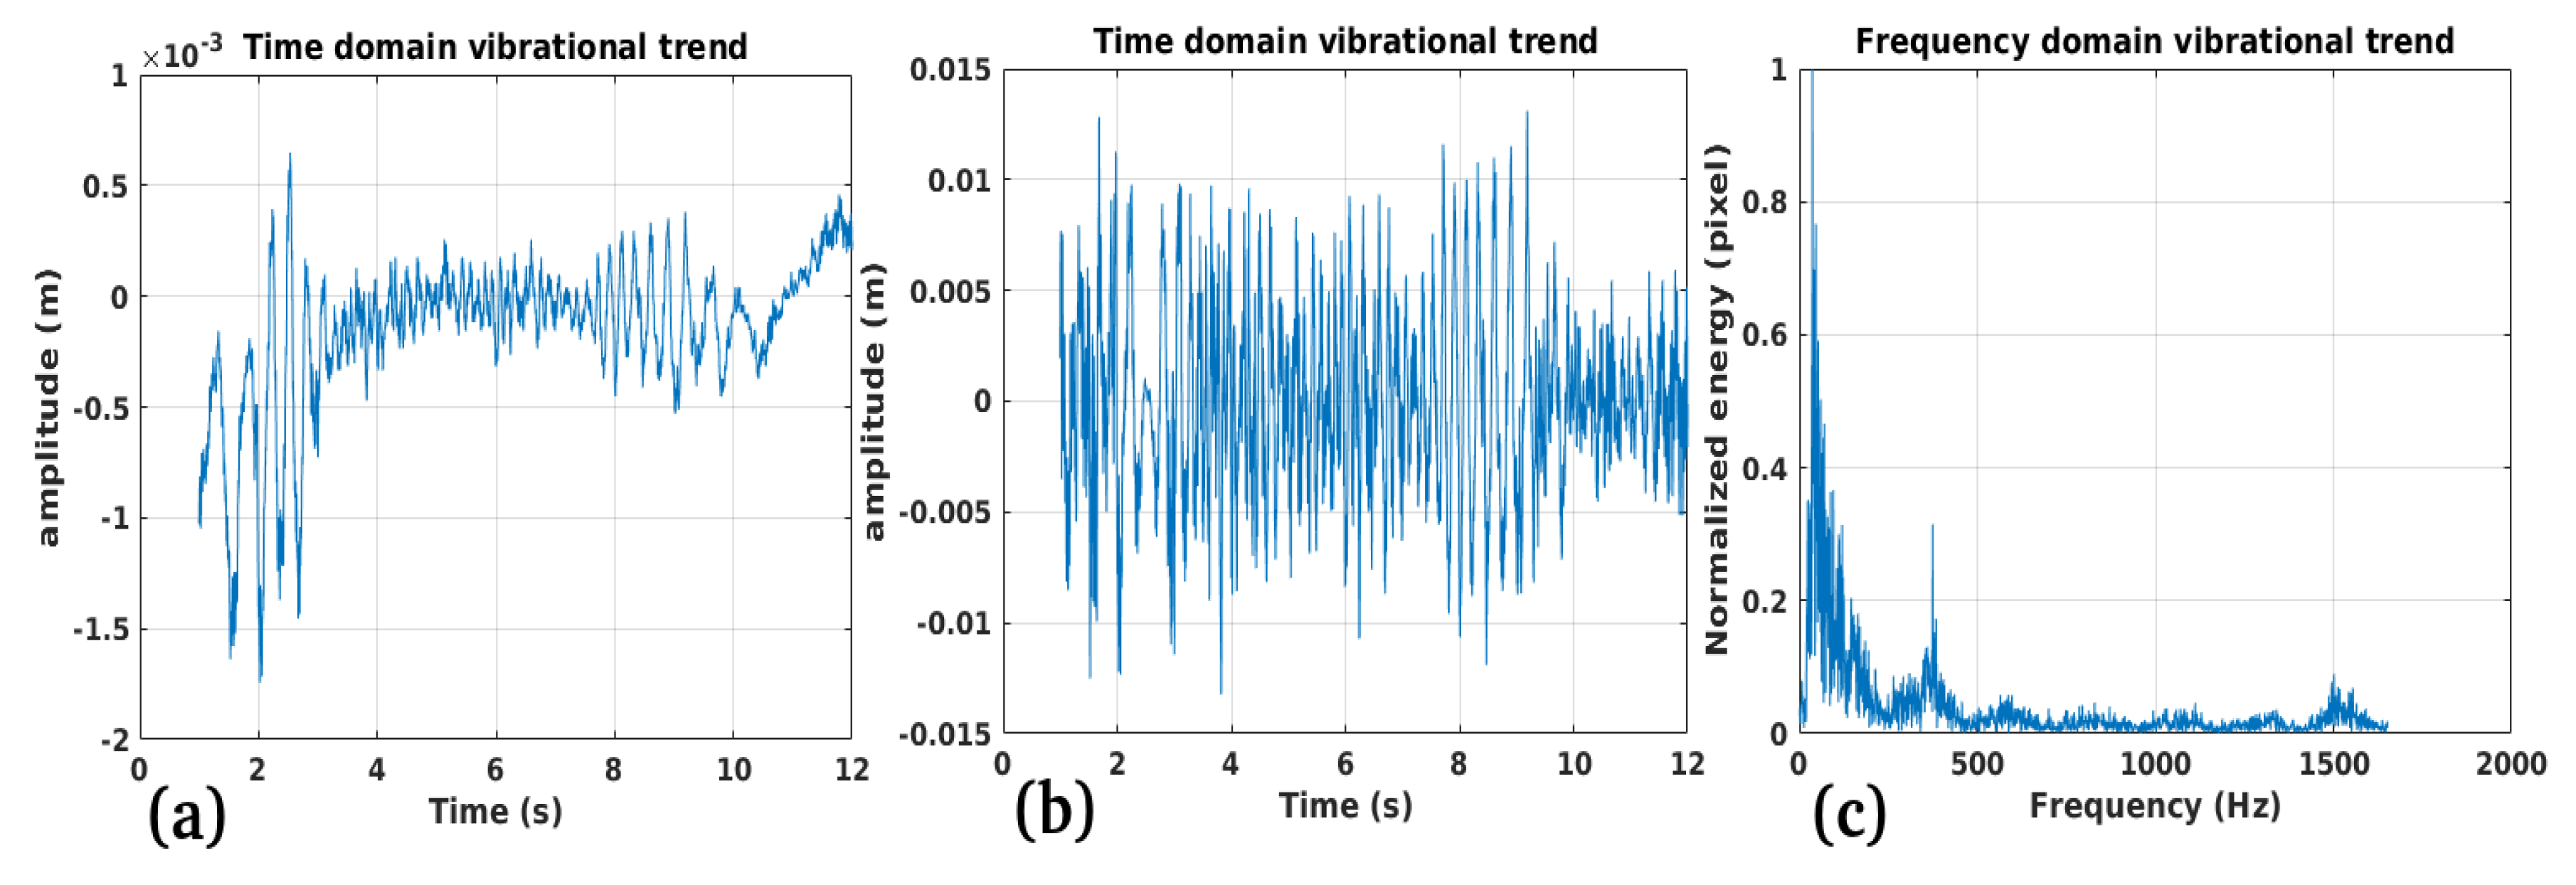
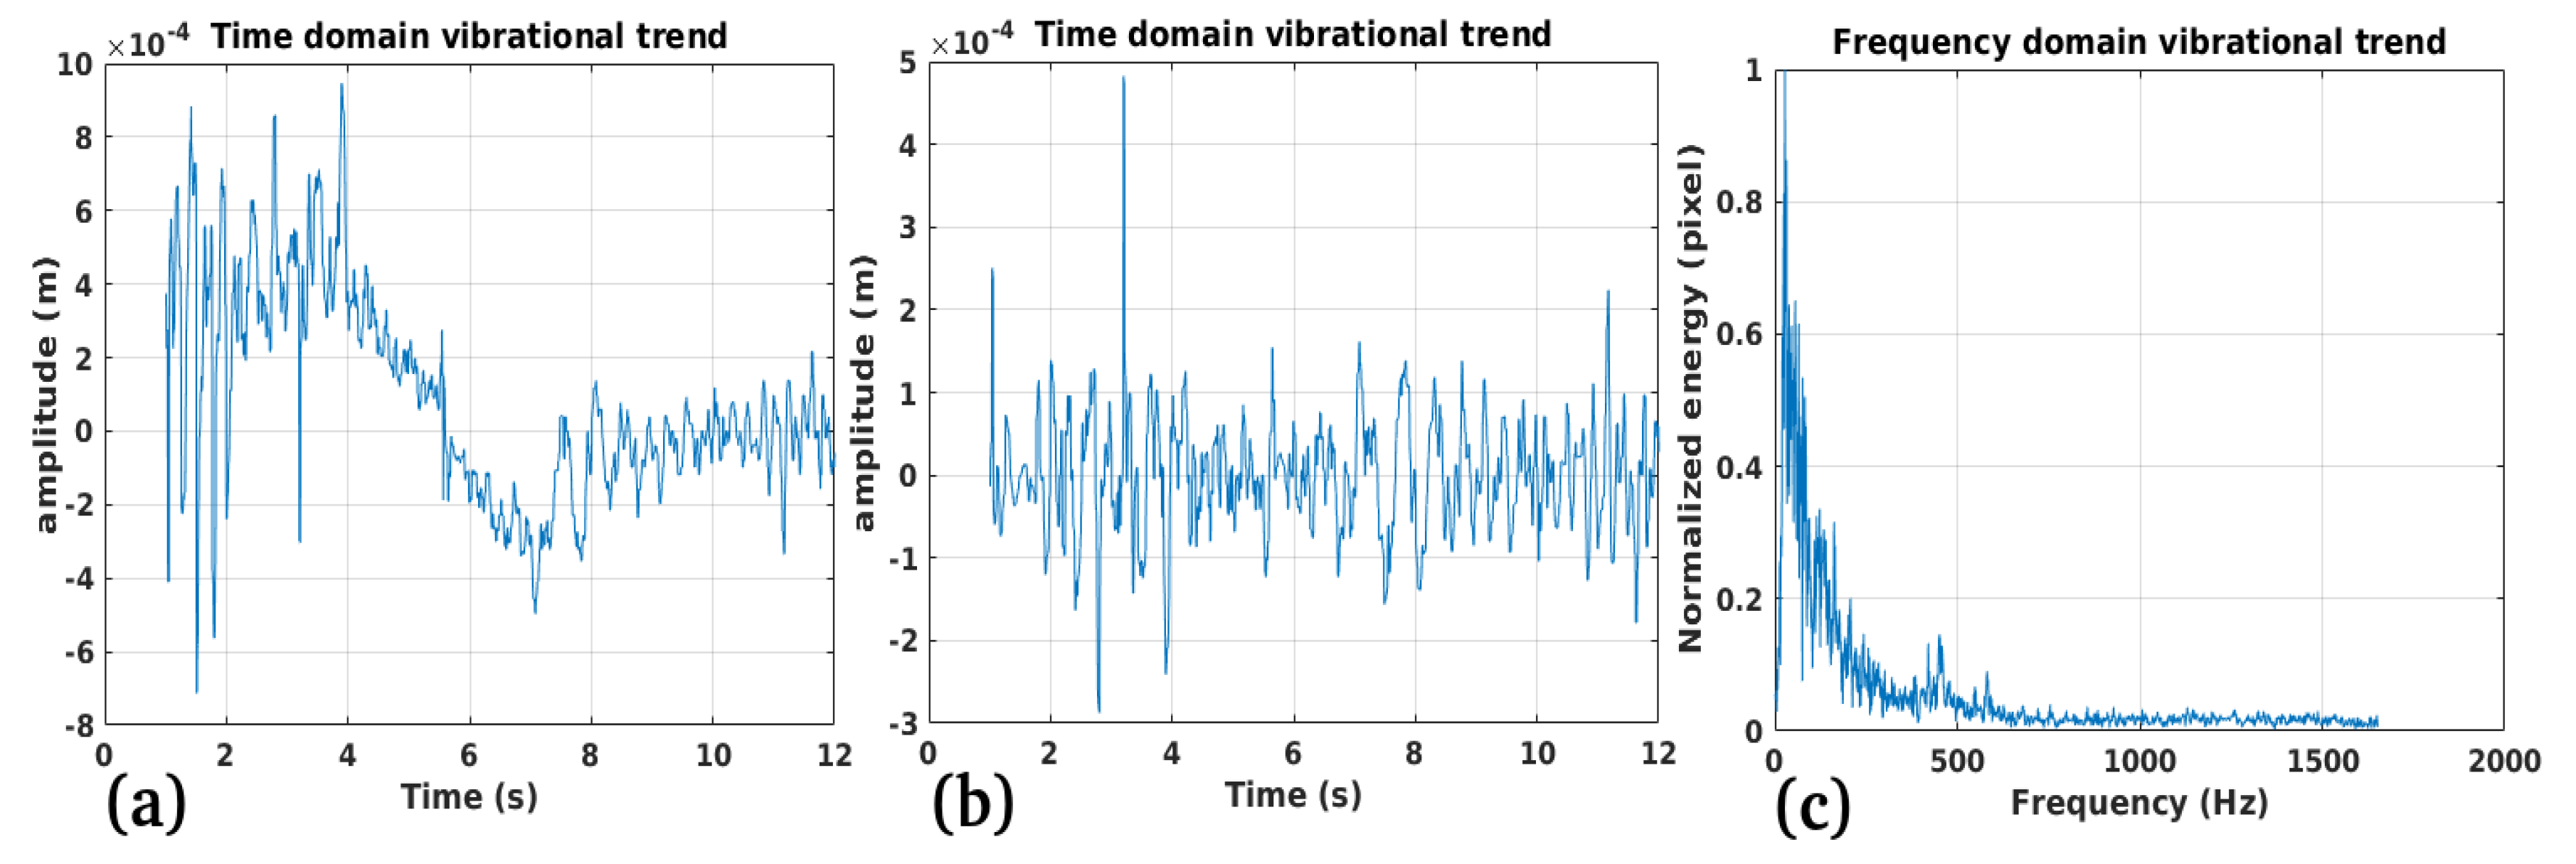
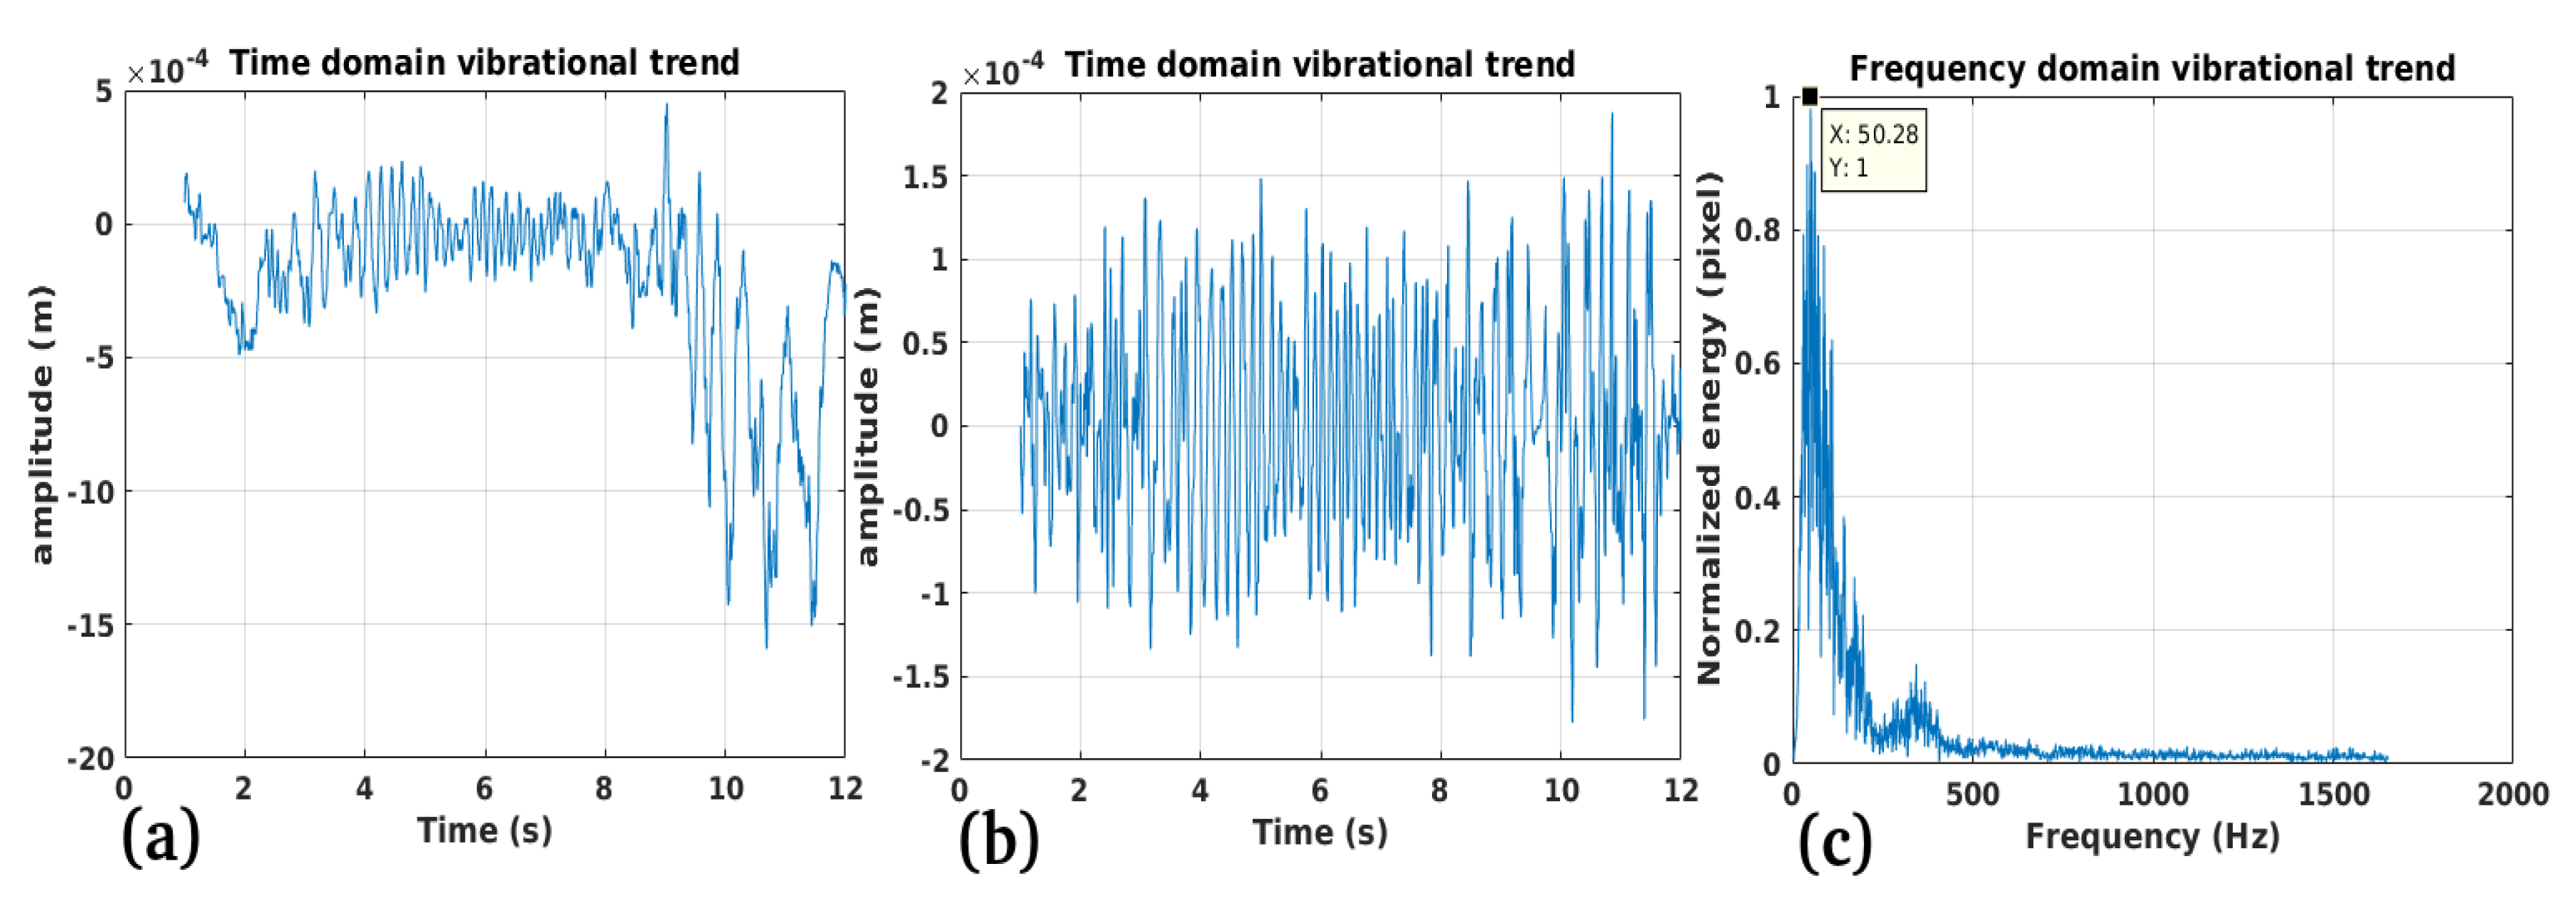
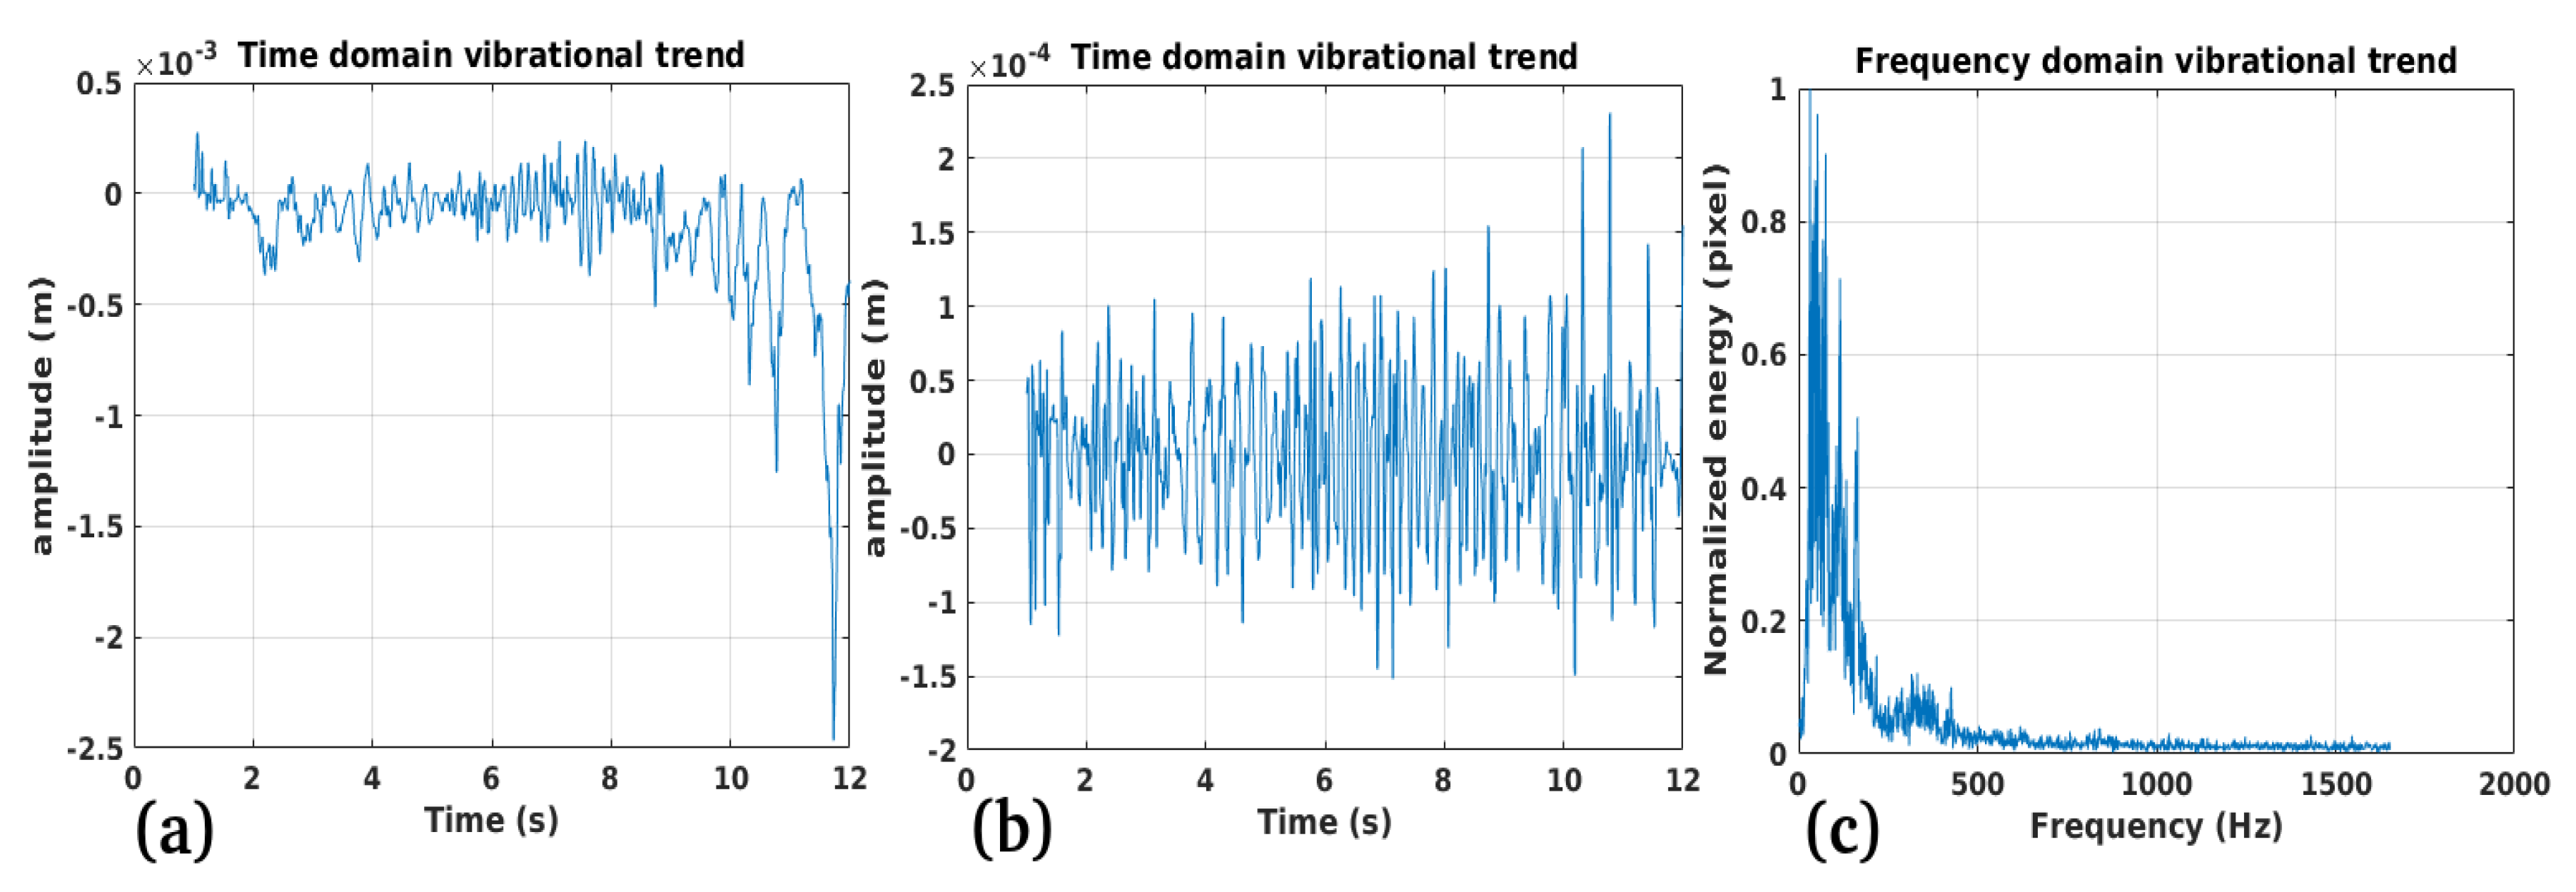
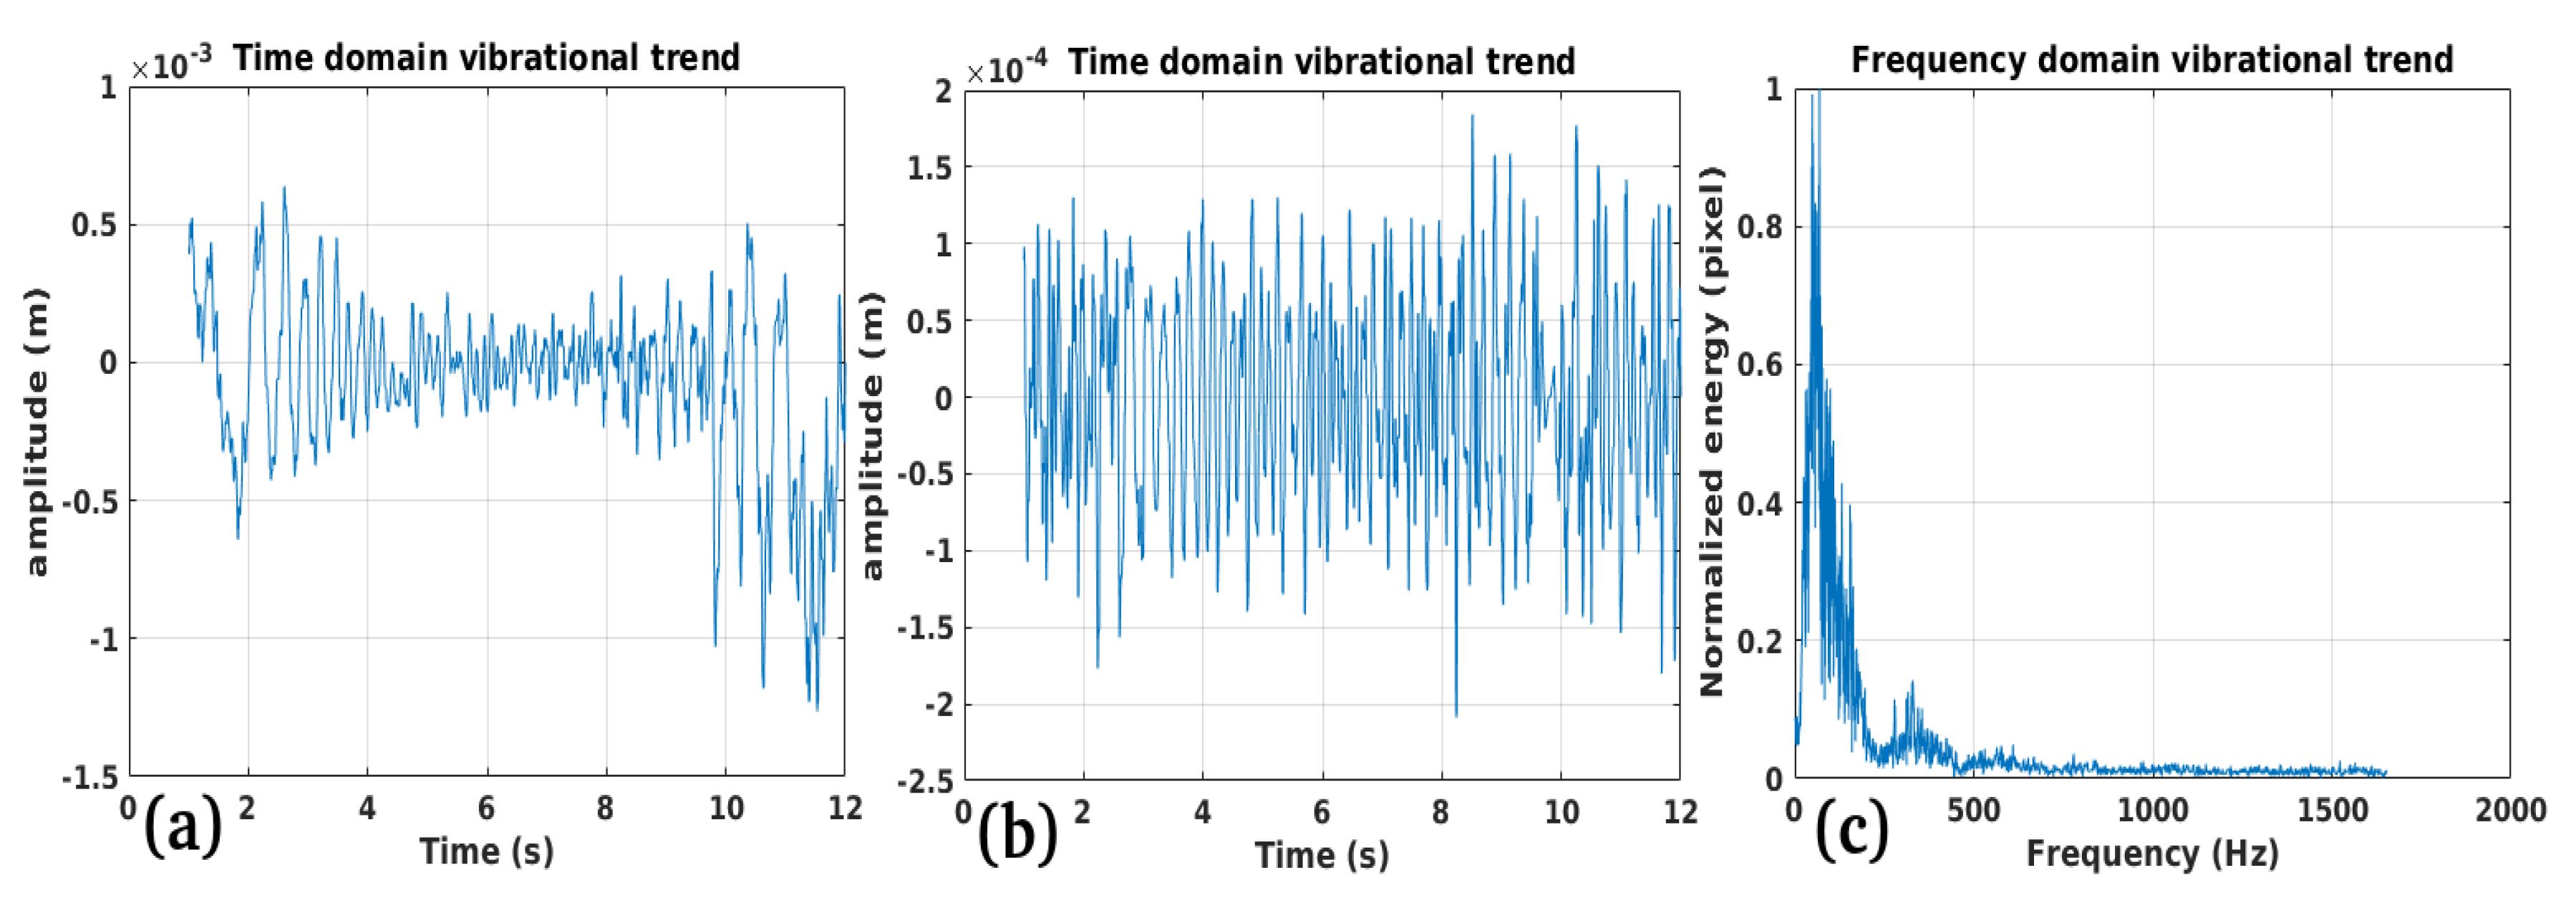
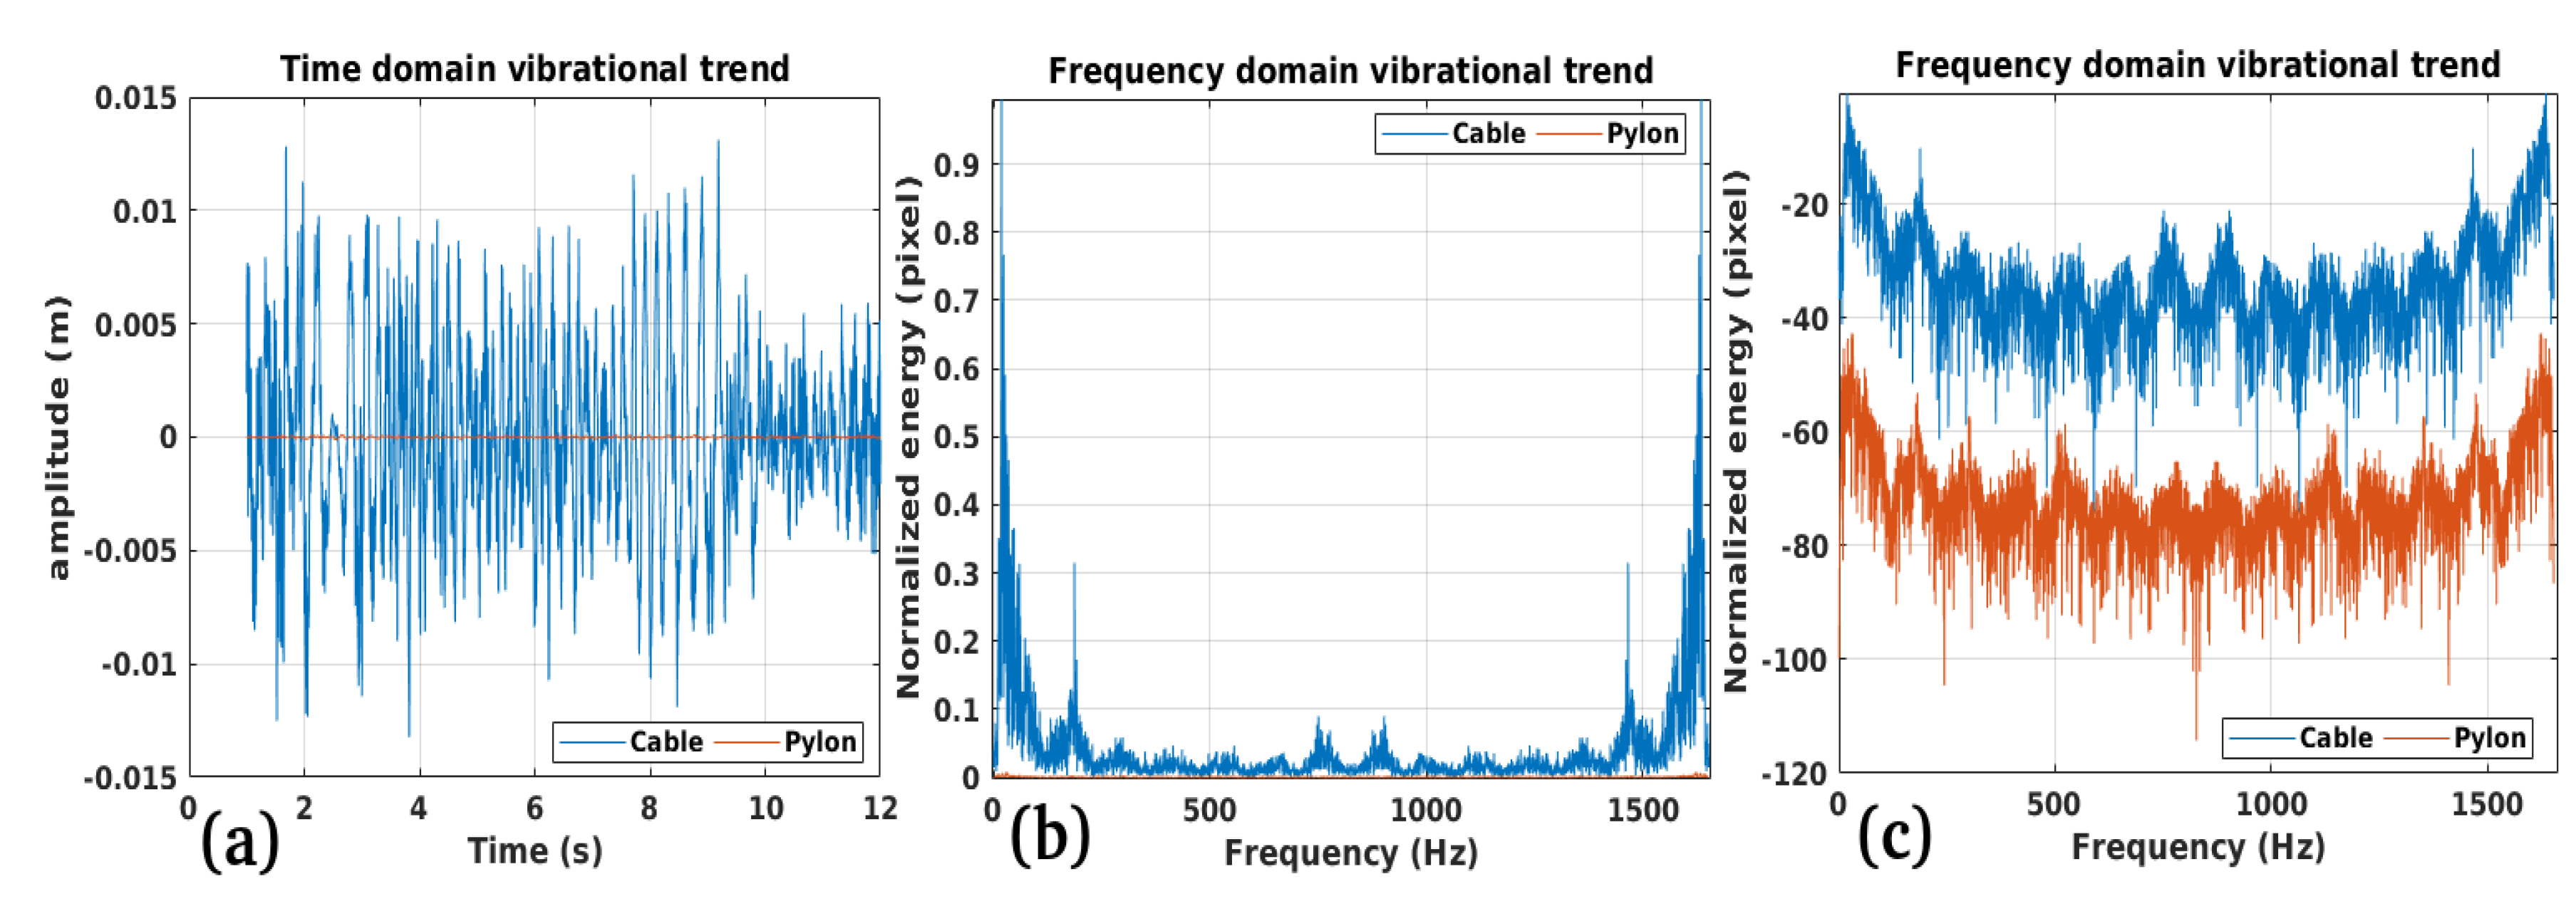
The experiments are carried out through 7 case studies. Case study number 1 consists of the time measurement of the vibrations of the electric cable, carried out on different points. We evaluated the oscillations by estimating both the polarization and the vibrational spectrum and found it to be in accordance with the vibrations generated by the 50 Hz AC voltage. The experiments concerning case study number 1 are summarized, via Table 1, in experiments number 1 to number 8. In Figure 9 (a), (b), and (c) represent the data of the oscillations calculated on point 1 of Figure 8 (a). The reference record is number 1, listed in Table 1. Figure 8 (a) represents the uncompensated oscillations, in the time domain. Non-compensated oscillations include both oscillations generated by the mains voltage and those generated by the rotation of the polarization angle of these oscillations. These events have a spectral predominance with lower frequency and higher harmonics in energy than those generated by the electrical current. Compensation is achieved by applying the optimal Golay filter [21]. Figure 8 (b) represents the compensated oscillations, in the time domain, in this case, the oscillations at 50 Hz massively visible. The oscillations spectrum are those shown in Figure 9 (c). Figure 10 (a), (b), and (c) represent oscillations data calculated on point 2 of Figure 8 (a). The reference record is number 2, listed in Table 1. Figure 10 (a), and (b) are the uncompensated and compensated temporal trends respectively. In Figure 10 (b), representing the time-domain compensated oscillations, and the 50 Hz vibrations are visible. The spectrum of these oscillations are those shown in Figure 10 (c). Figure 11 (a), (b), and (c) depicts temporal trends data calculated on point 3 of Figure 8 (a). The reference record is number 3, listed in Table 1. Figure 11 (a), and (b) represents the uncompensated and compensated oscillations respectively. In Figure 11 (b), representing the time-domain compensated oscillations, and the 50 Hz vibrations are visible. The vibrational spectrum are those shown in Figure 11 (c). In Figure 12 (a), (b), and (c) represent the data of the oscillations calculated on point 4 of Figure 8 (a). The reference record is number 4, listed in Table 1. Figure 12 (a), and (b) represents the uncompensated and compensated oscillations respectively. Figure 12 (c), is the compensated frequency-domain oscillation trend, where the vibrations energy spectral peaks are approximately centered at 50 Hz. In this experiment it is also possible to observe some spectral wrinkling coming out of the noise, located at a frequency of about 650 Hz. We think it is plausible that this is generated by the telemetry signals used to manage the power grid. The spectrum of these oscillations are those shown in Figure 12 (c). In Figure 13 (a), (b), and (c) represent the data of the oscillations calculated on point 5 of Figure 8 (a). The reference record is number 5, listed in Table 1. Figure 13 (a), and (b) represents the uncompensated and compensated oscillations respectively. In Figure 13 (b), representing the time-domain compensated oscillations, and the 50 Hz vibrations are visible. Also in this experiment it is possible to observe some spectral lines coming out of the noise, located at a frequency of about 350 Hz, probably generated by some telemetry signals used to manage the power grid. The spectrum of these oscillations are those shown in Figure 13 (c). Figure 14 and Figure 16, show the last two experiments concerning case study 1, namely the oscillations measured at points 7, and 8 shown in Figure 8 (c). These experiments refer to records 8, and 9 of the table. The precision of the measurements, both in the time domain (compensated and uncompensated), visible in Figure 14 (a), (b) and Figure 16 (a), (b), and those in the frequency domain, visible in Figure 14 (c) and Figure 16 (c).

3.2. Study Case 2

In this sub-section we perform all measurements concerning the case of study number 2. The objective is to obtain the same nature of the oscillations (the same course and polarization variation with respect to case of study 1 experiments), expecting the same vibrational emission spectrum. The measurements are conducted on points number 1, 2, and 3, visible in Figure 2, and the results refer to records 9, 10, and 11 of Table 3. We refer to Figure 17 (a), and (b) which represent the time-domain trends of the vibration, compensated and uncompensated, respectively. Figure 17 (c) represents the spectrum centered at 50.23 Hz, being a predominant frequency. The same is true for points 10, and 11, visible in Figure 18 (a), (b), and (c), and Figure 19, (a), (b), and (c).

3.3. Study Case 3

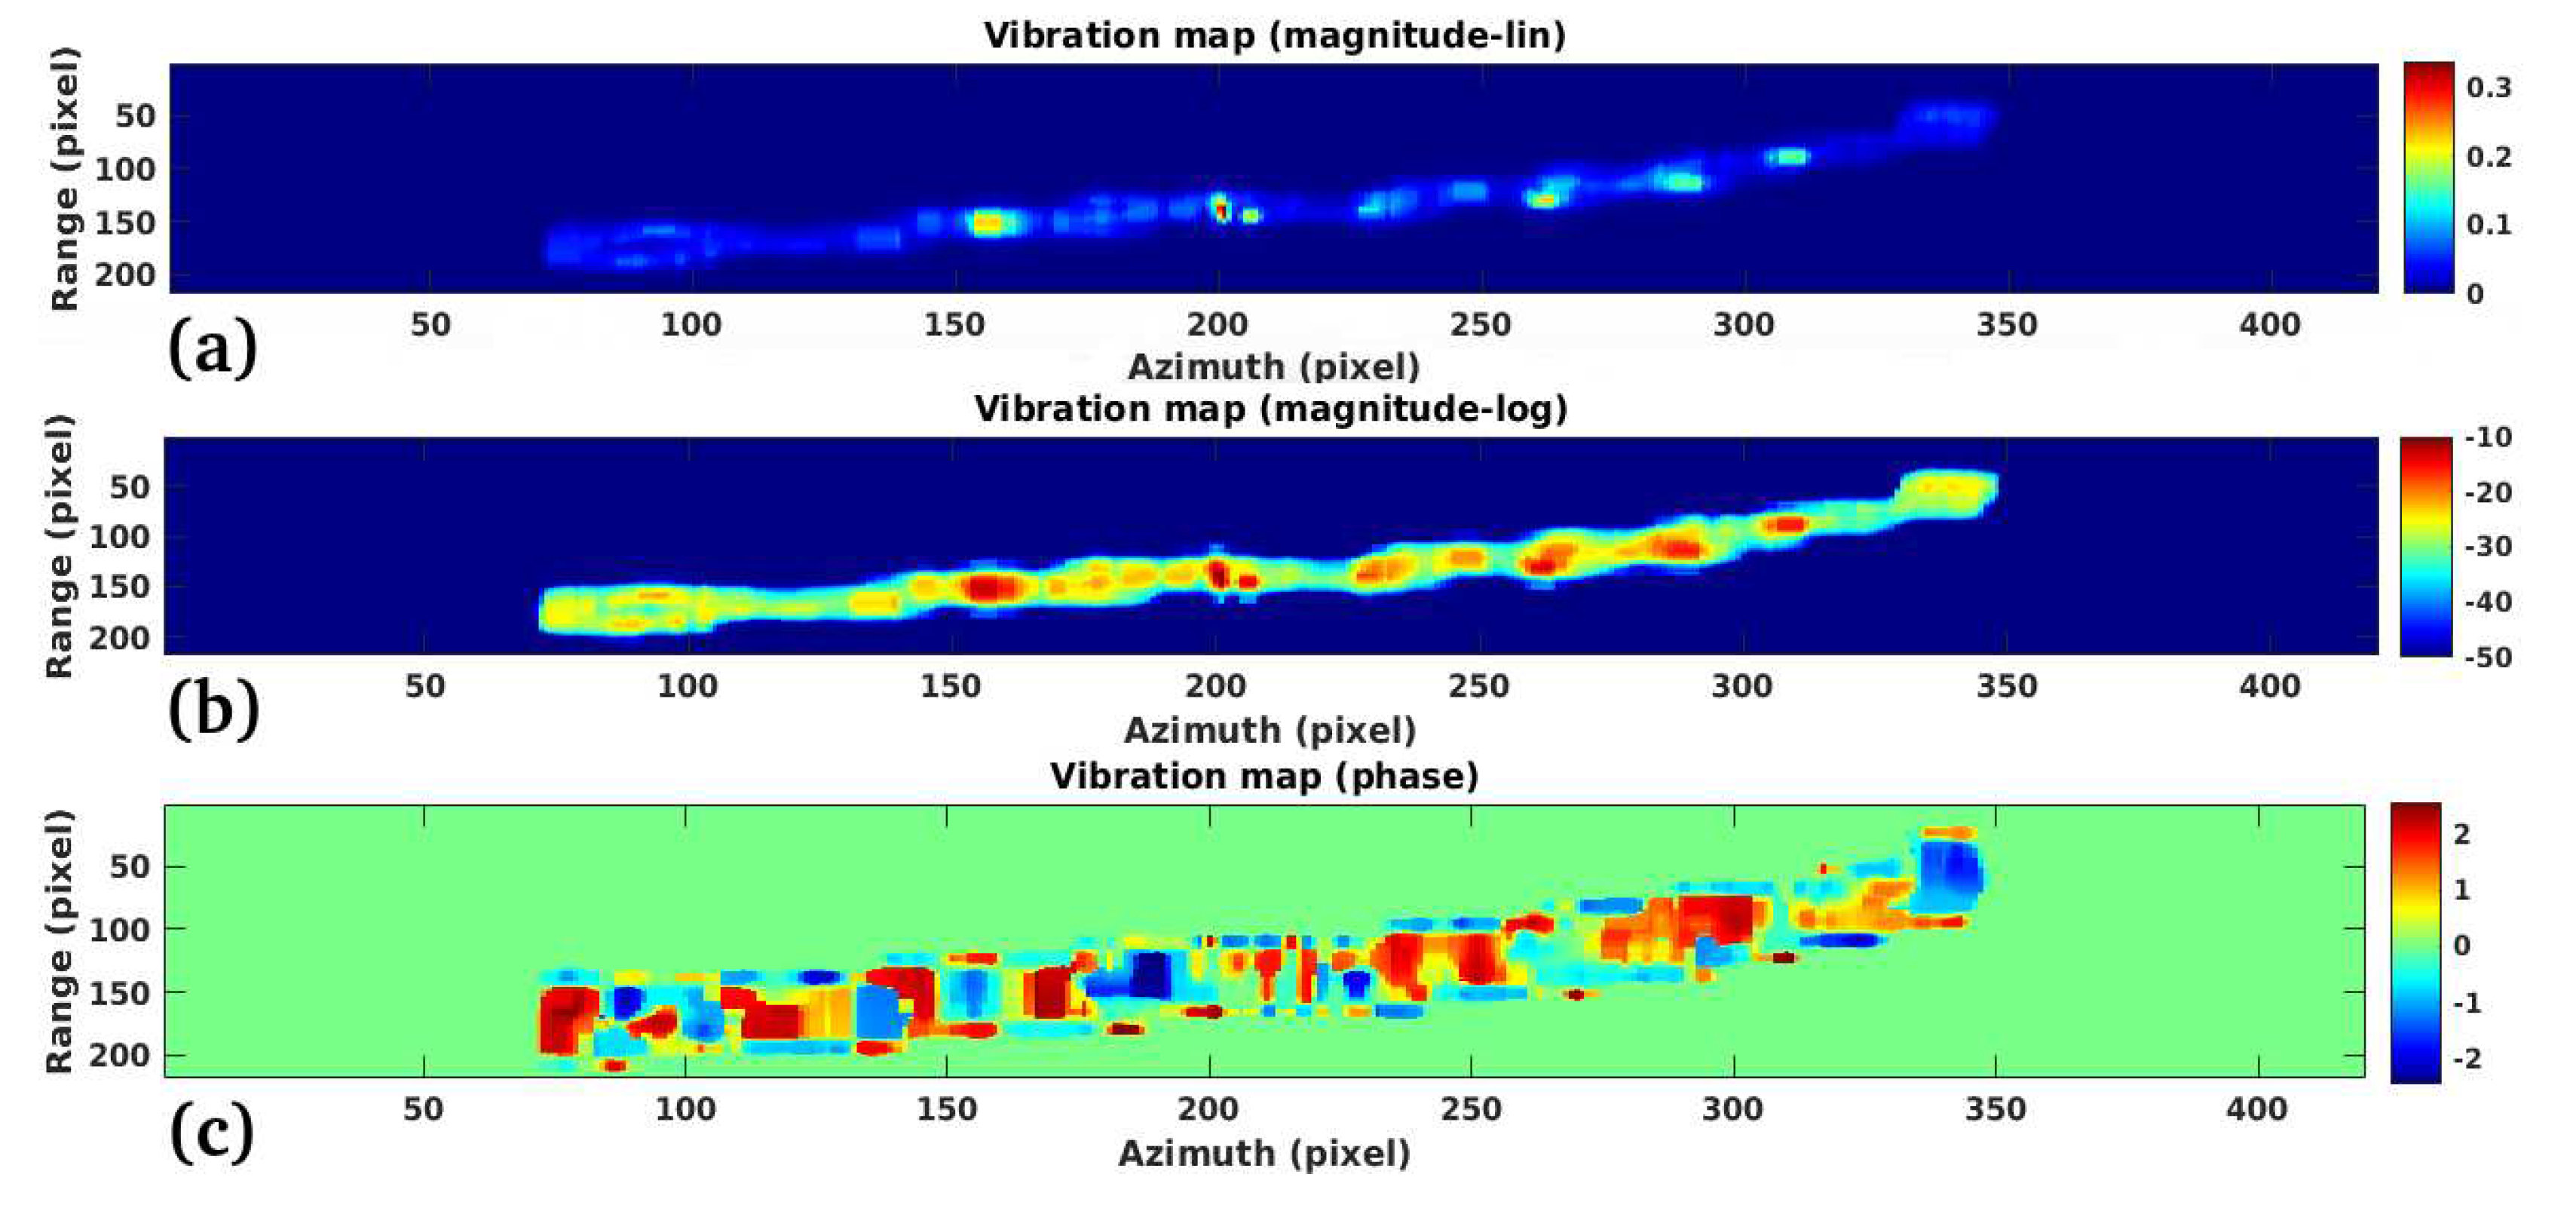
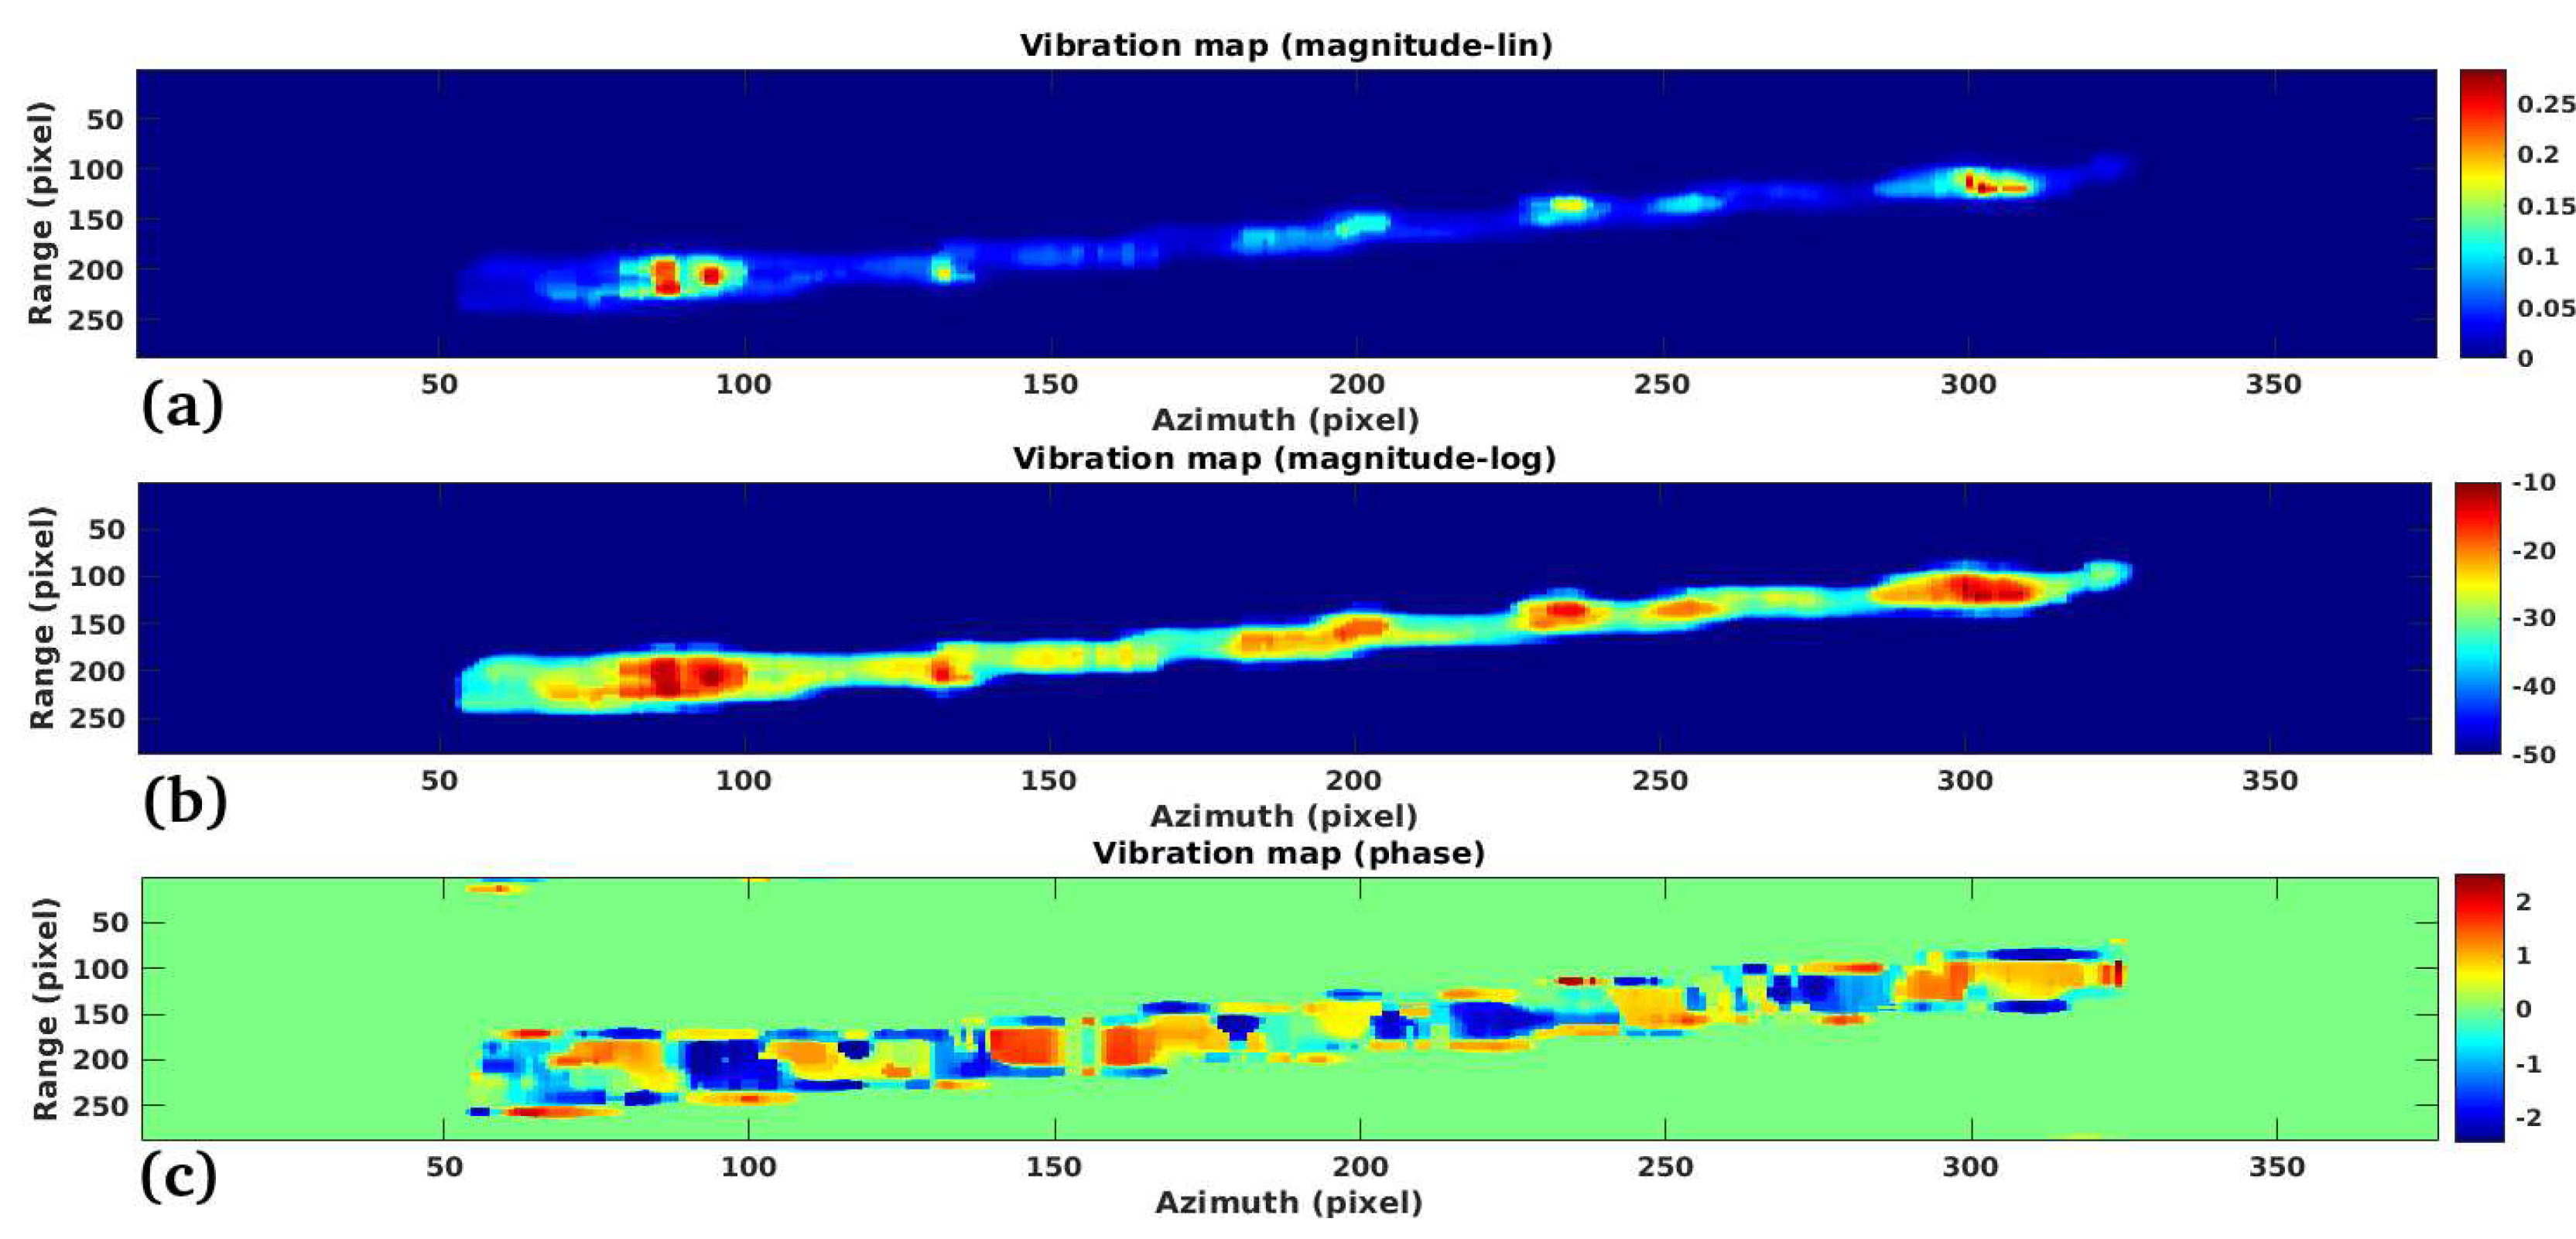
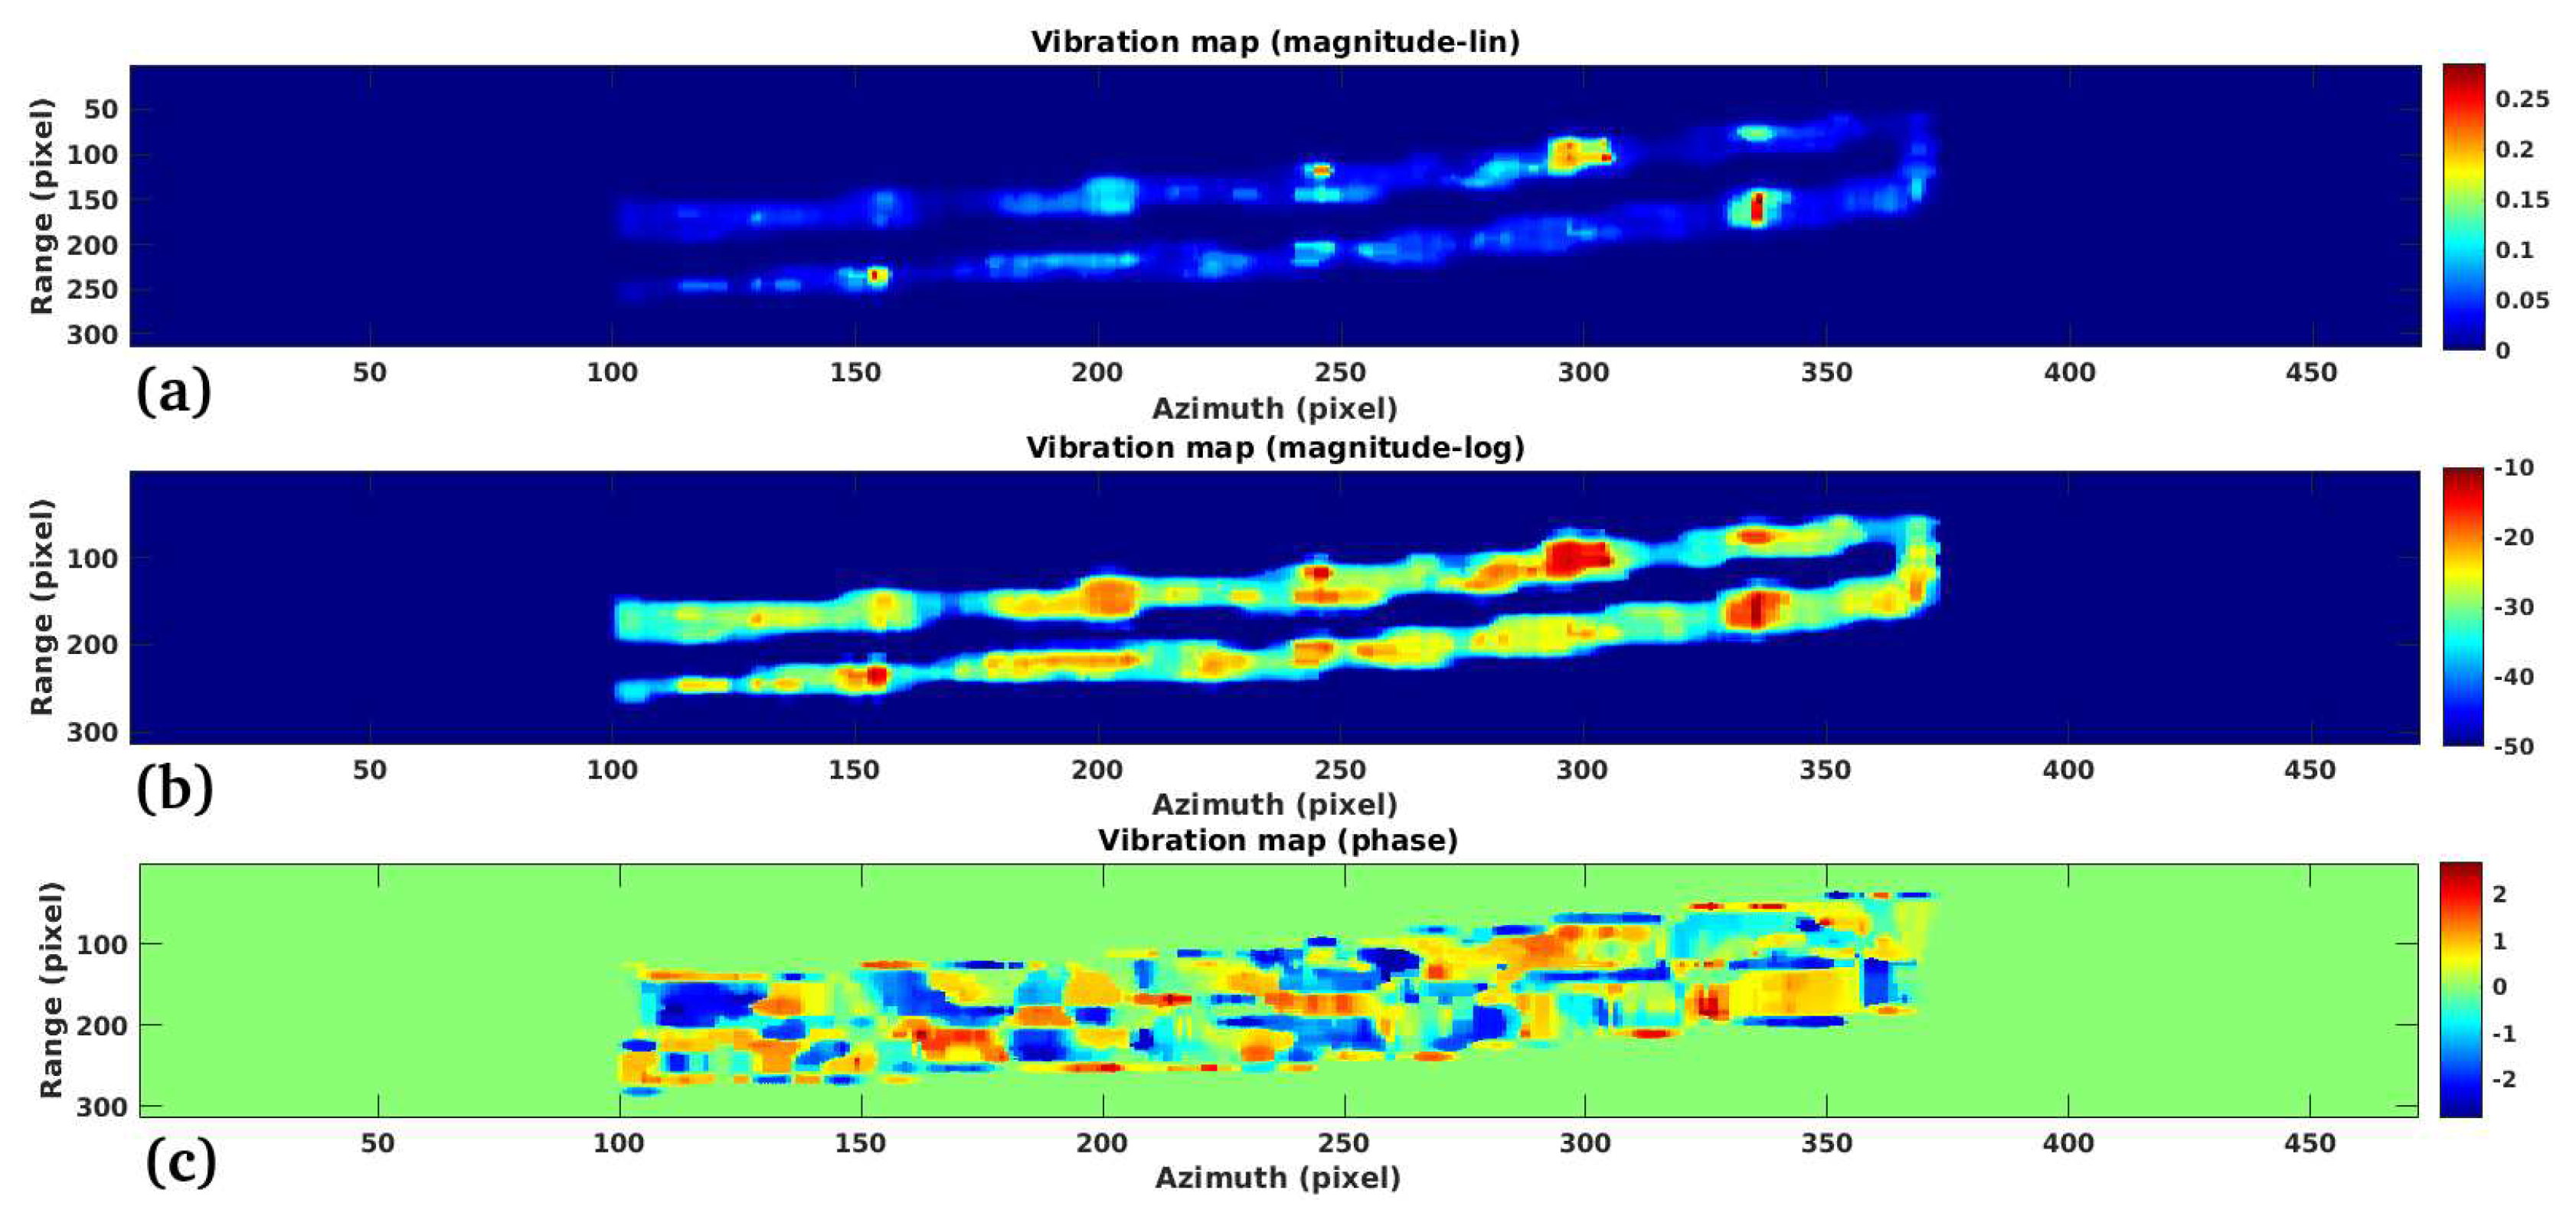
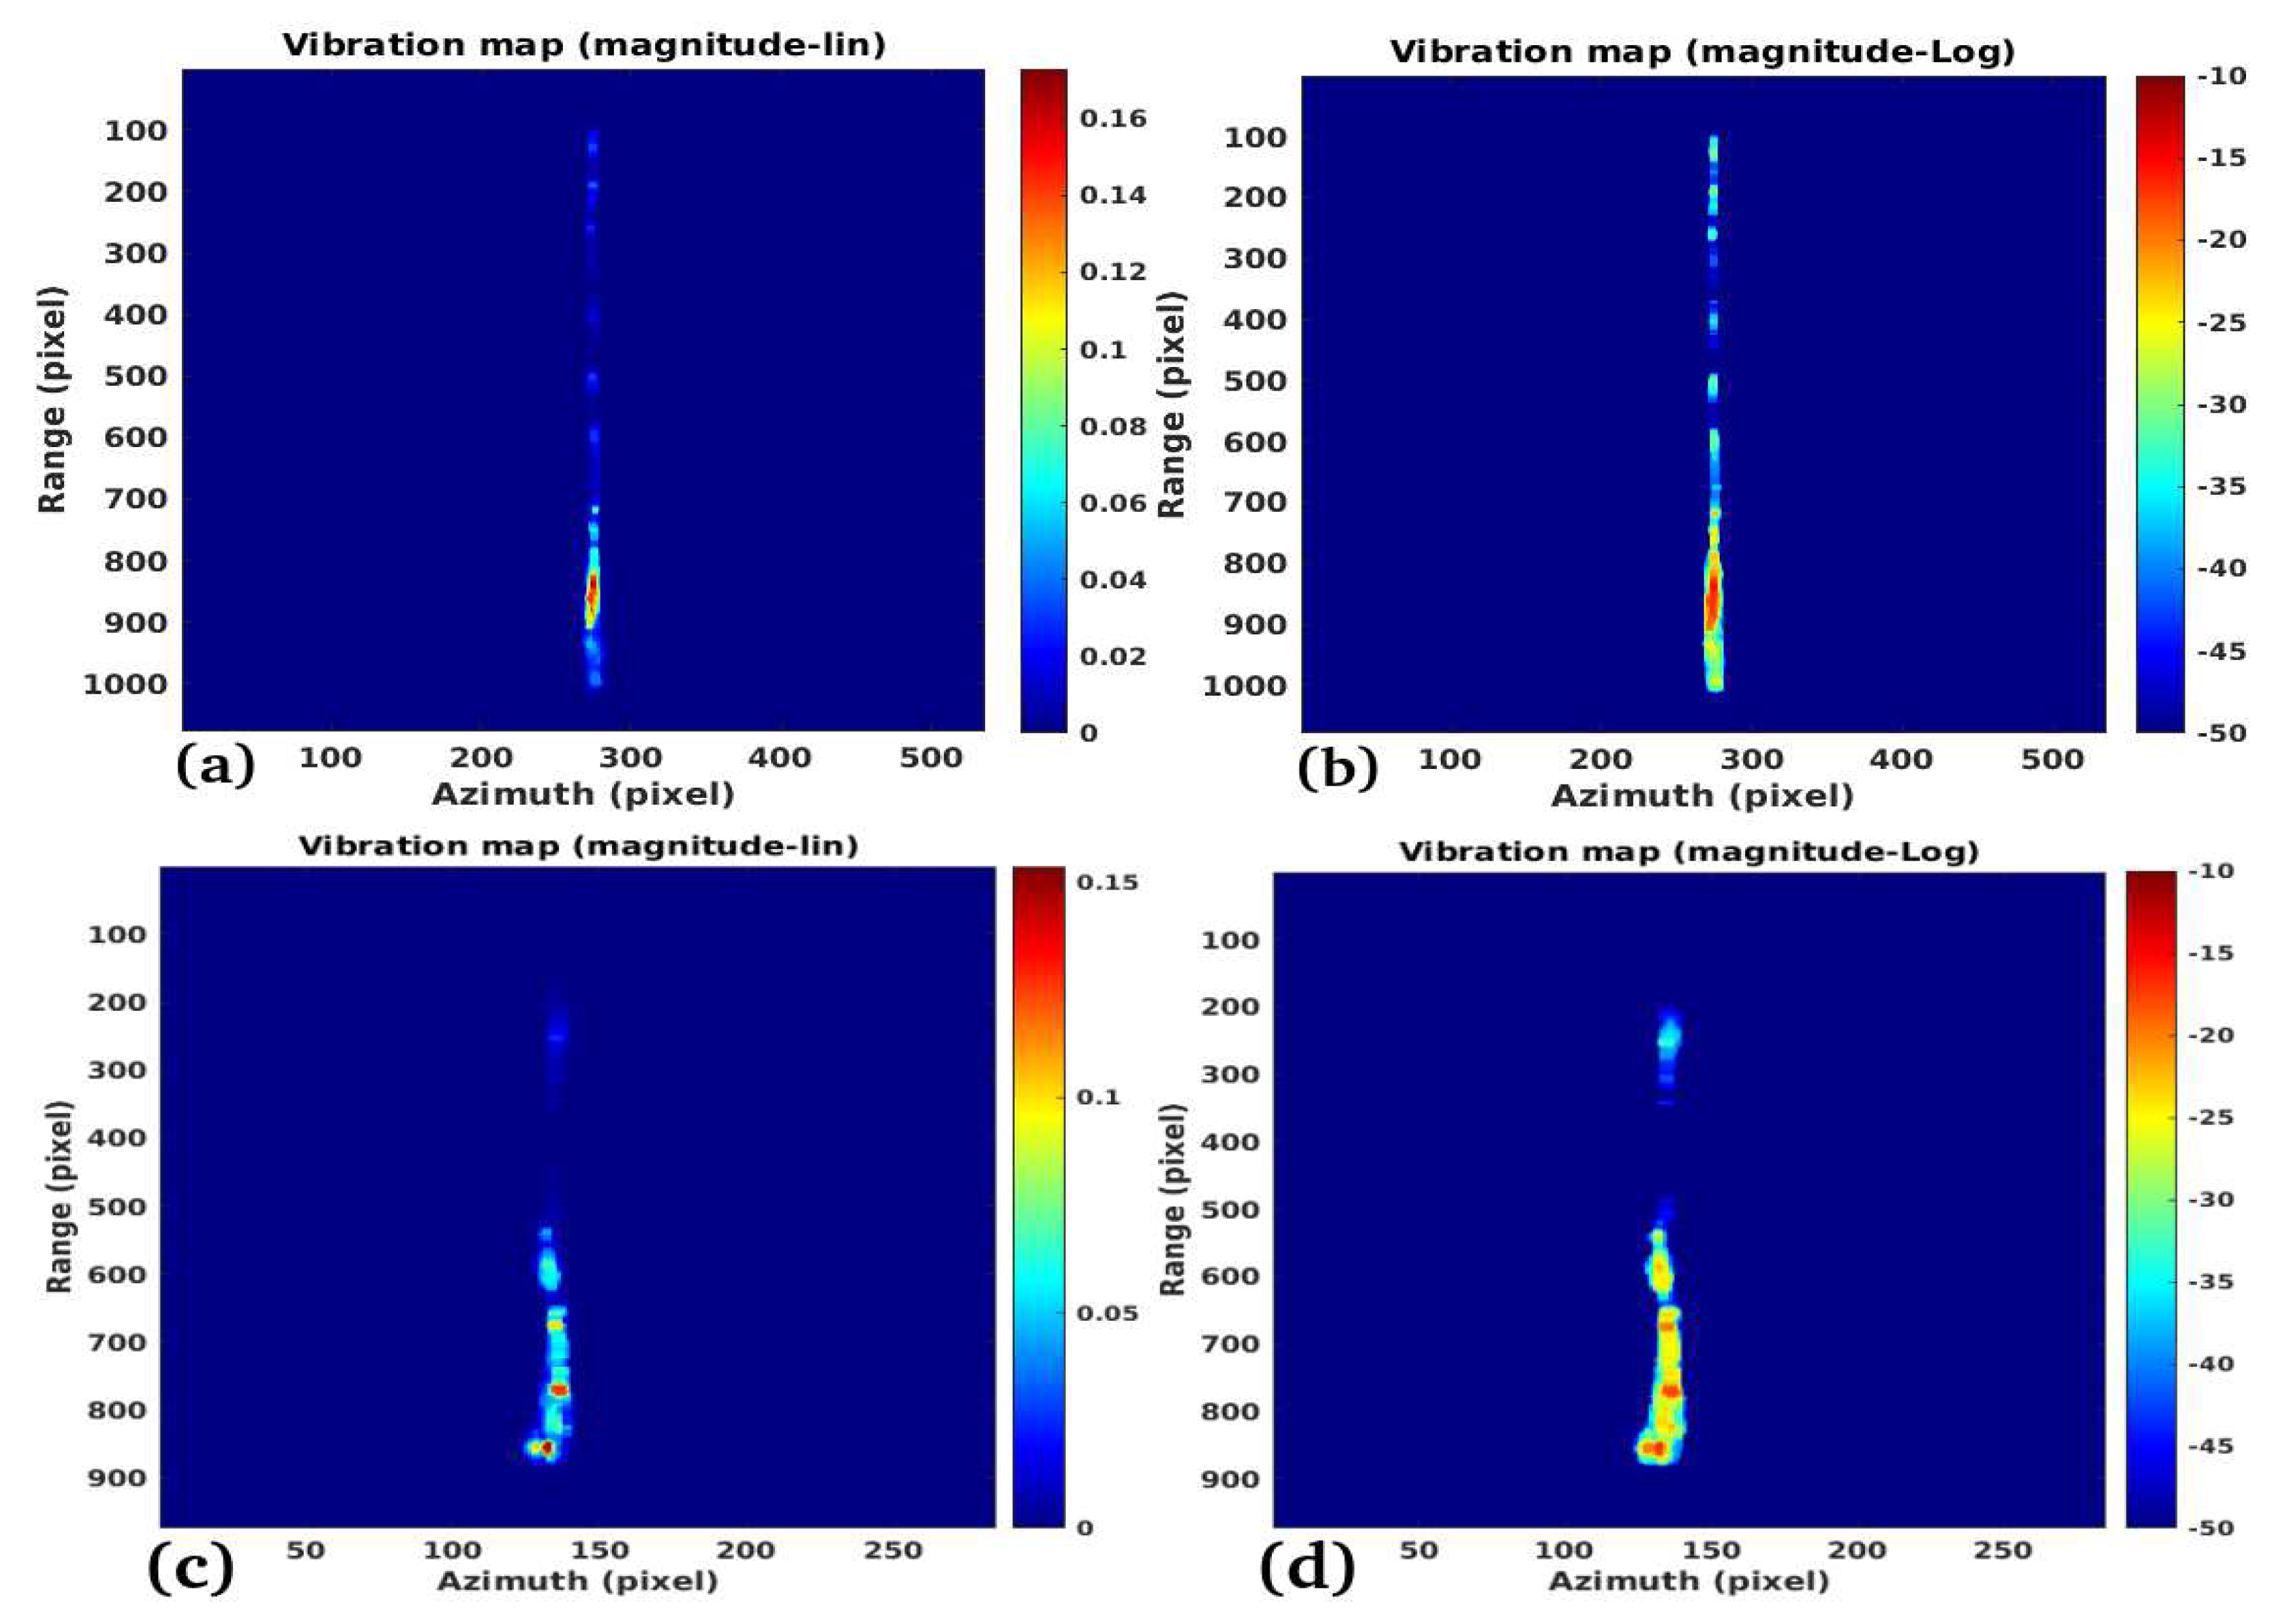
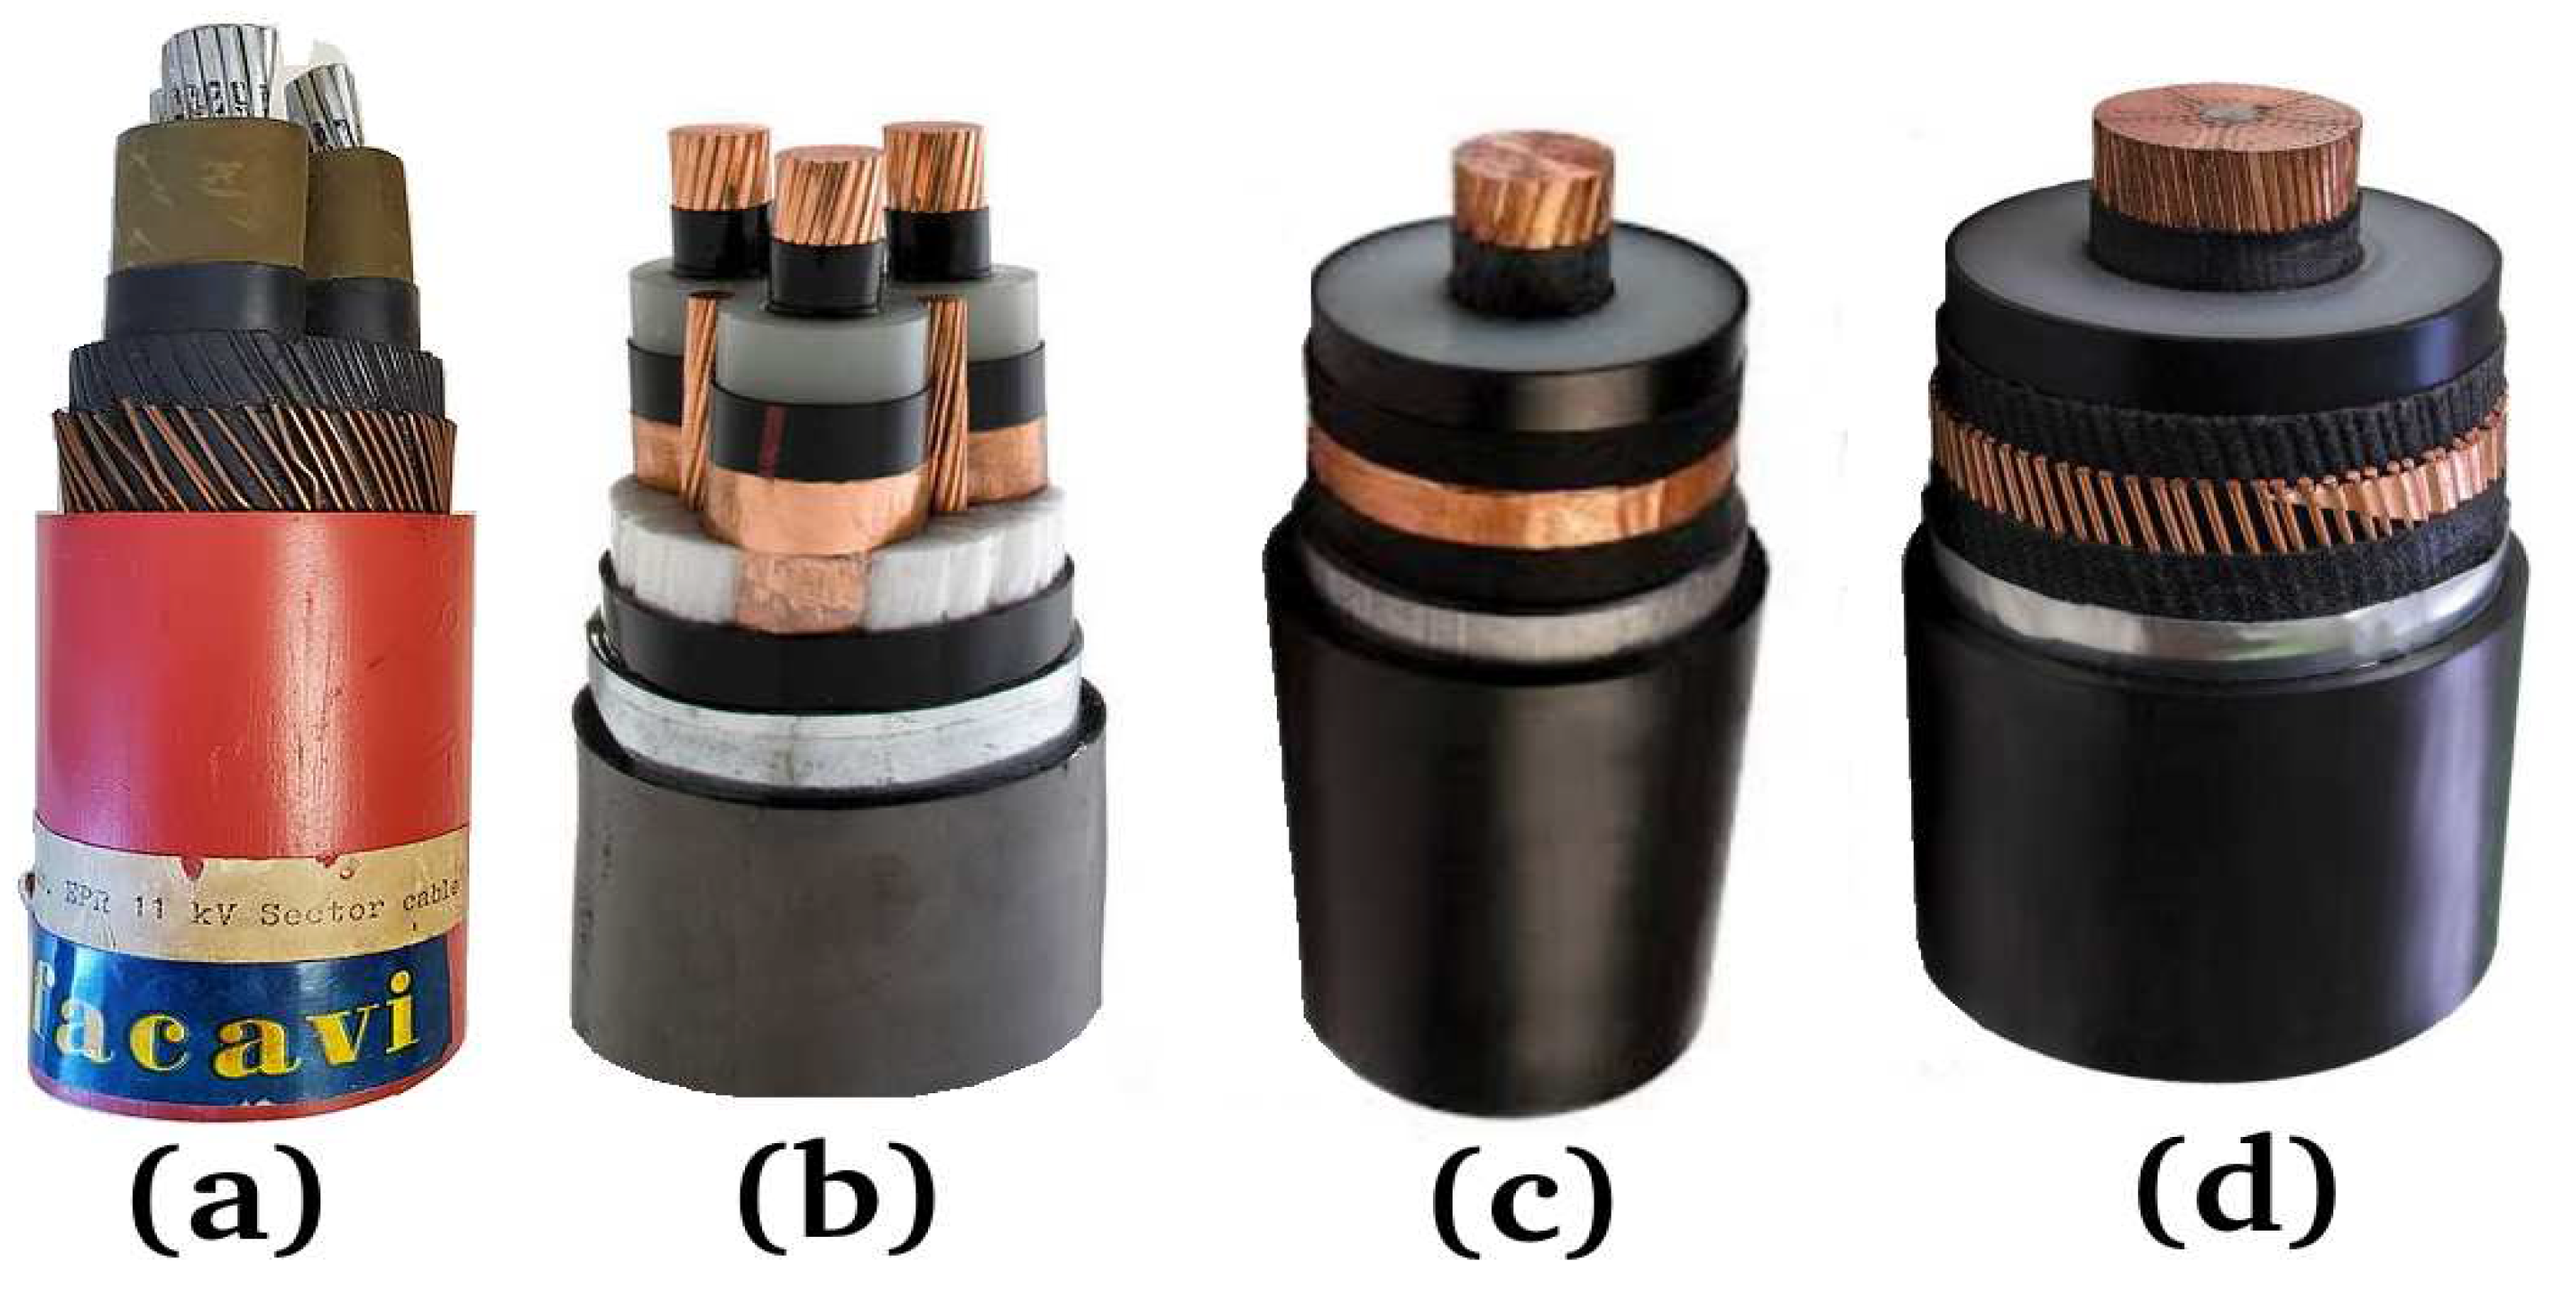
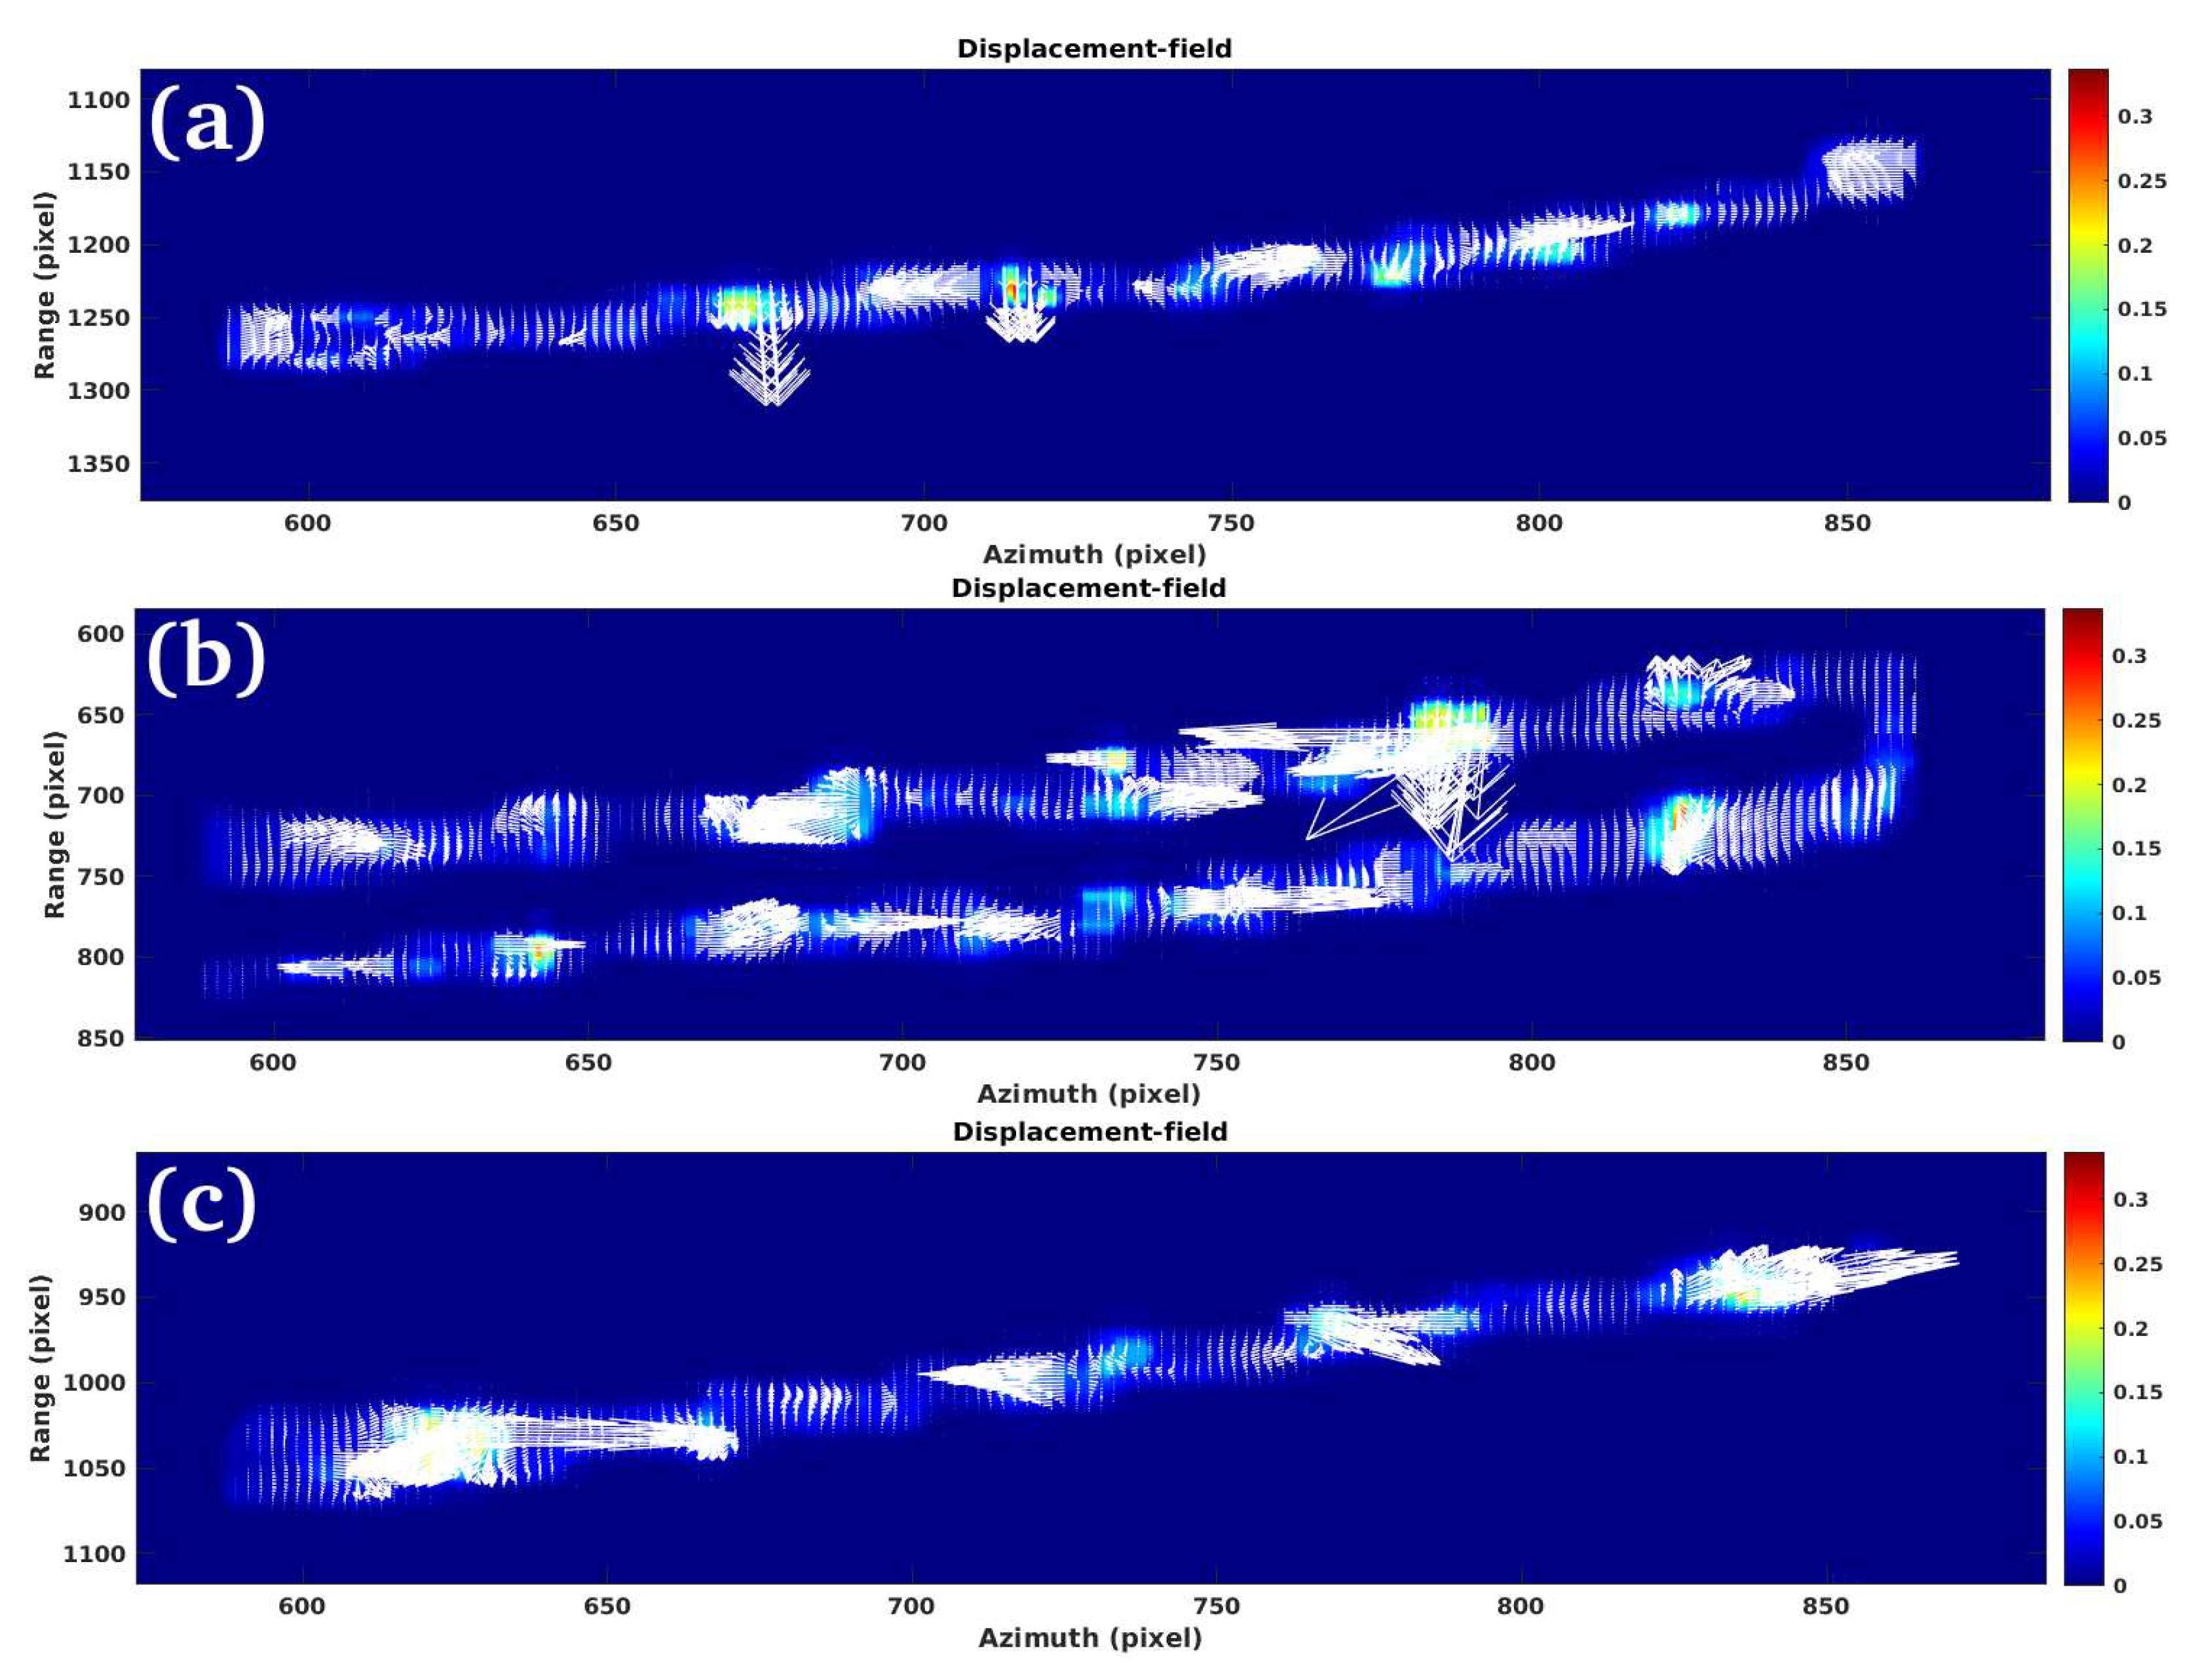
Case study 3 consists of estimating the vibration energy along the entire length of the electric cable visible to the radar, and of two electric pylons. The results of this case study can be seen in Figure 20 (a), (b), and (c), Figure 21 (a), (b), and (c), and Figure 22 (a), (b), and (c). The results were calculated over the entire extent of cables c1, c2,c3, and c4, visible in Figure 8 (c). Figure 20 (a) represents the vibrational energy, calculated by averaging the displacement over 50 time instants, on c1, and in the linear scale, while Figure 20 (b) represents the vibrational energy on the logarithmic scale. Figure 20 (c) depicts the displacement phase calculated on a time instant. Regarding the measurement of the vibrations observed on the pylons, the results are shown in Figure 23 (a), and (b), and Figure 23 (c), (d) where in Figure 23 (a), and Figure 23 (c), the modulus of vibrational energy is represented on a linear scale, while in Figure 23 (b), and Figure 23 (d), shows the modulus of vibrational energy on a logarithmic scale. As for the results calculated on the pylons, they are considered to be very reliable since only the top of the pylon is invaded by more energetic vibrations than the lower part, which is more attached to the ground. At the attachment of the cables, they are highly visible, as they act as a constraint generator and can therefore be subject to strong vibrational tensions. Figure 24 (a), (b), (c), and (d), represents four cable sections, all constructed differently. Figure 24 (a) represents a cable for the transport of electrical energy with a maximum voltage of up to 33 kV, with the core consisting of a trio of coiled silver cables. Each silver cable is made up of other cables with a smaller cross-sectional area, which are also rolled up. The cable is shielded by rubber tubes, an outer core of copper cables, coiled around the outside of the main cable. Figure 24 (b), is always made up of three coiled cables, in turn made up of other cables with a smaller cross-section, also coiled on themselves, but made of copper. The outer insulating core consists of a copper foil, rolled up around each main cable. Also this cable, the maximum voltage of use is up to 33 kV. Figure 24 (c) is a single-core cable with Teflon insulation and shielding made from a double core of copper foil, alternating with aluminum foil. The maximum use voltage of this cable is 50 kV. Finally, aa Figure 24 (d) represents a cable for the transmission of electrical energy at maximum voltage (up to 100 kV), consisting of a single copper core, Teflon insulation and a double shielding, alternating between copper and aluminium. This figure shows different technologies for the construction of electrical cables. The common feature of these different cases is that the power cables are all coiled along a spiral. In this context we expect the polarization of the vibrations to alternate between different values in a regular manner. Figure 25 (a), Figure 25 (c), and Figure 25 (b) represent the estimated displacement field, calculated between a time equal to 1 50 of the total SAR acquisition duration. A regular alternation of both the orientation and the width of the field lines is confirmed. These experiments refer to records 18, 19, and 20 of Table 3.

3.4. Study Case 4

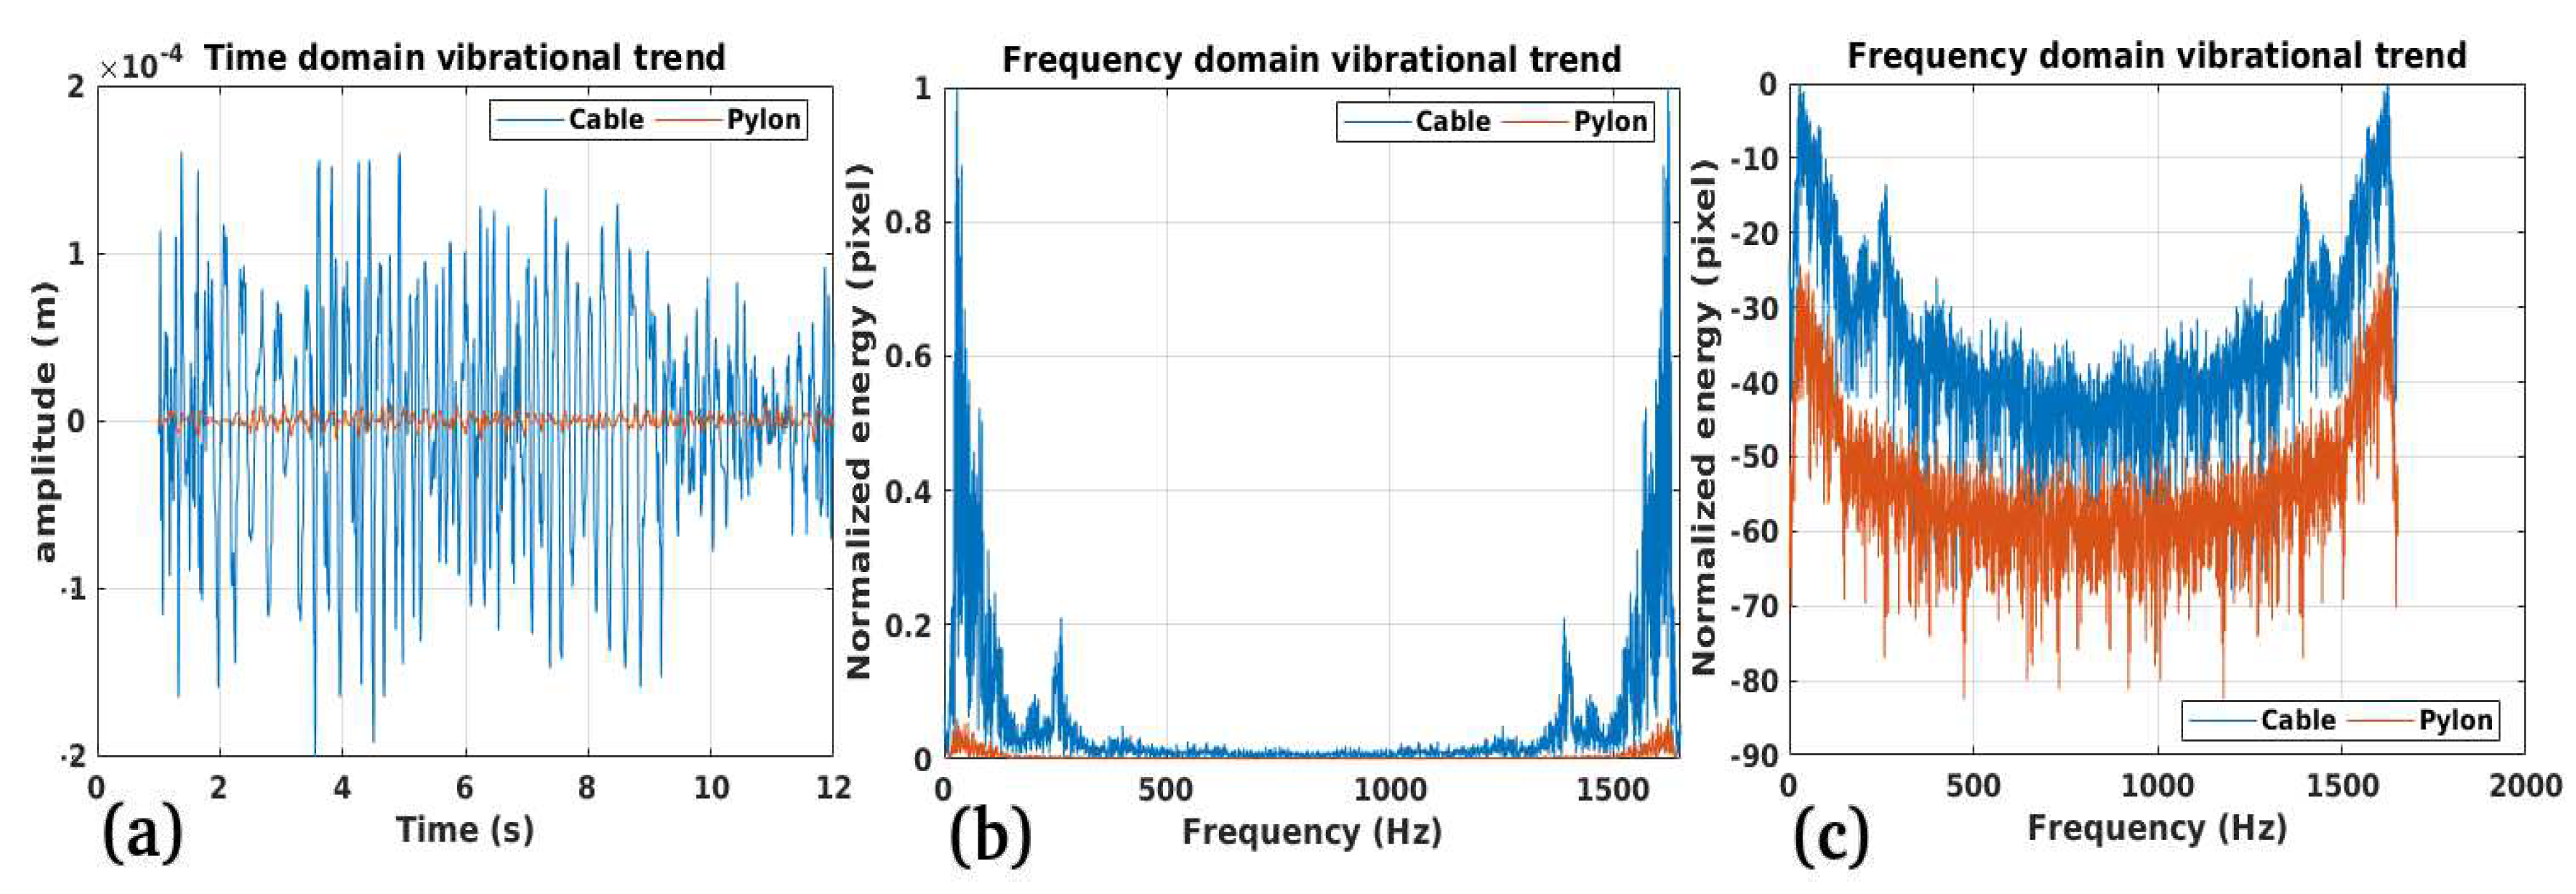
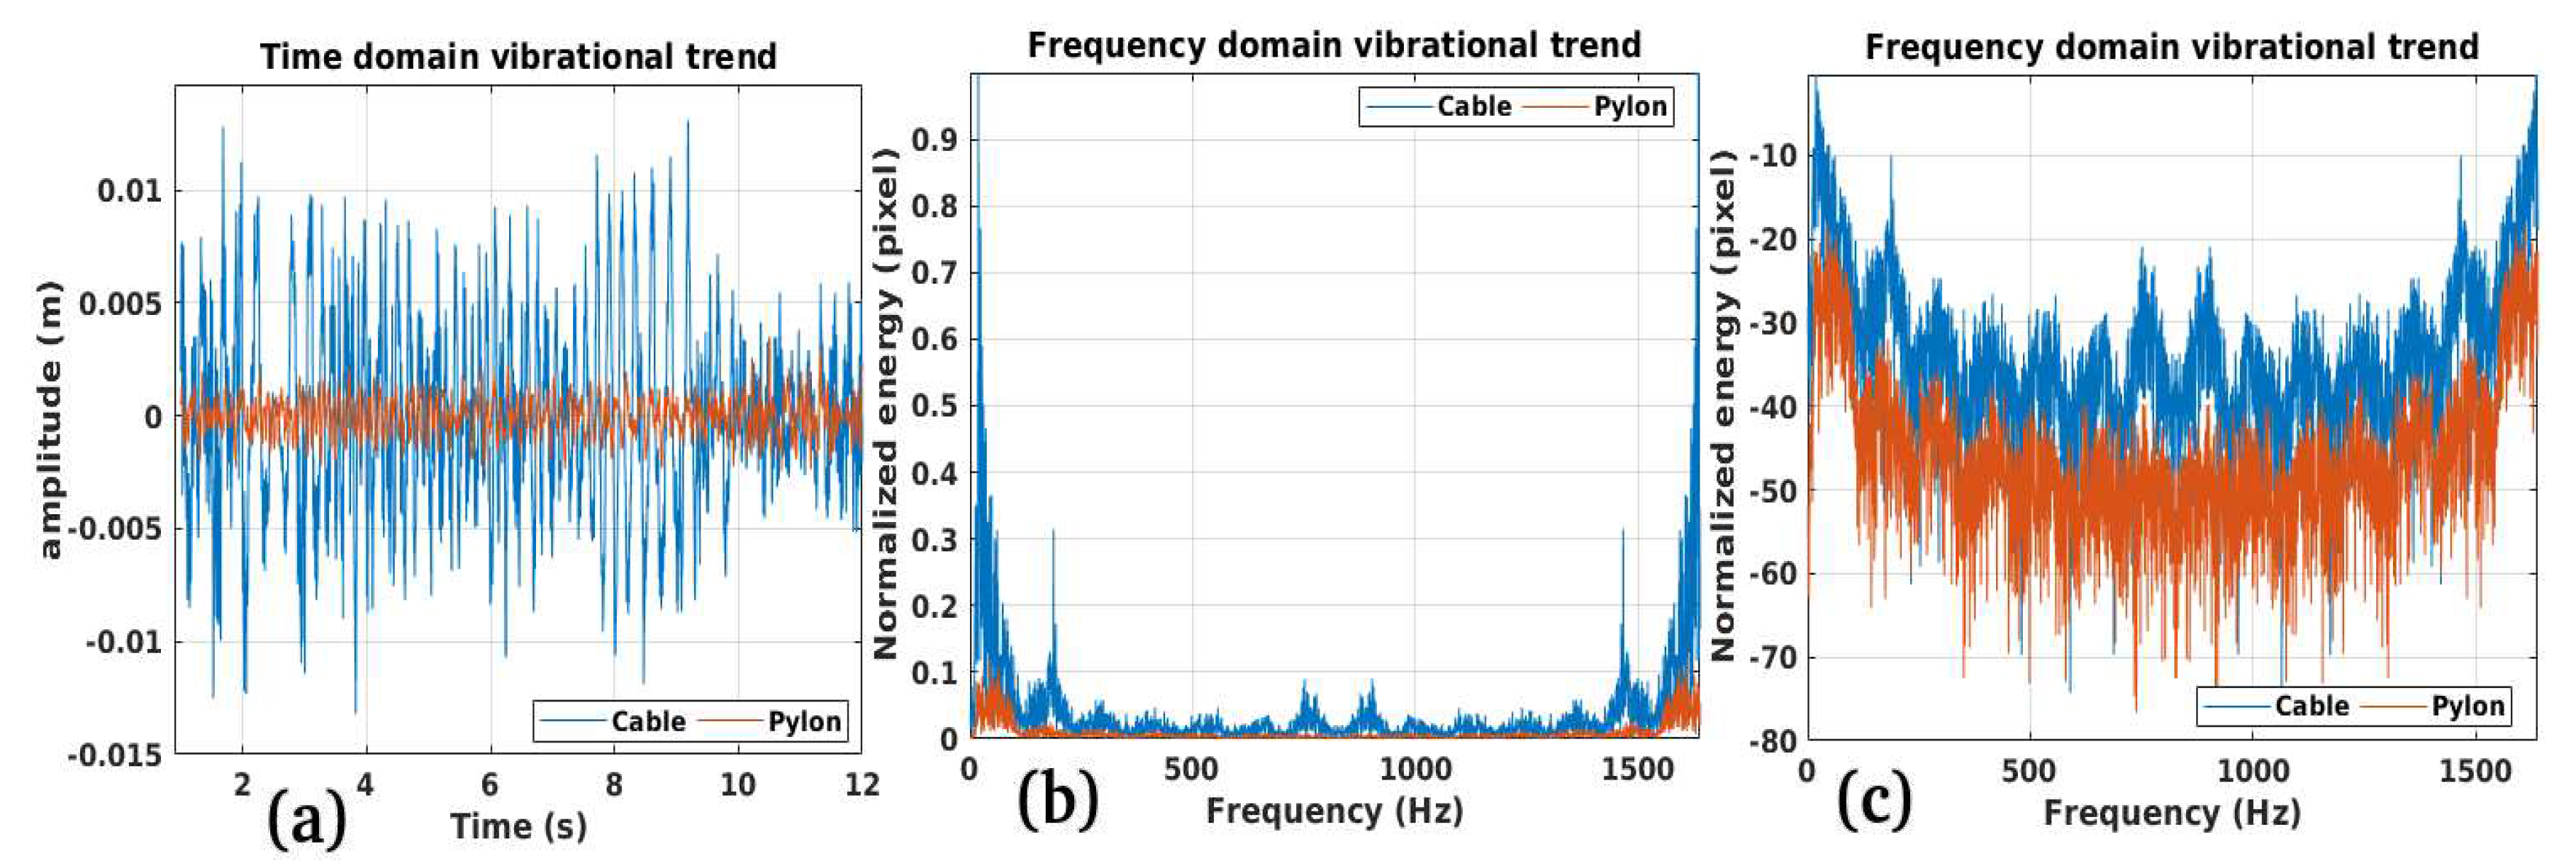
The last case study consists in the evaluation of both the performance and a validation experiment, carried out by comparing the vibrations estimated with the radar with some acoustic recordings made with a microphone installed under a high voltage overhead cable. The first experiment pertaining to case study 4, represents the comparison between the vibrations estimated on a point located on the electric cable, with the vibrations calculated on a very stable point of the SAR image, consisting of a piece of concrete wall at an angle. More precisely, the point chosen for the comparison was the one evaluated by the result shown in Figure 14 (b), while the stable point taken as reference is visible in Figure 7 (b), as point w1, located inside the red box 2. The reference record is number 21, according to Table 3. Figure 26 (a) represents the trend in the time domain of the vibrations measured on the electric cable, and visible in the blue color, while the vibrations, always in the time domain of the stable point wi located on the wall, is visible in the brown colour. The difference in signal amplitude is immediately apparent. Figure 26 (b) represents the trend in the frequency domain (the vibrational spectrum) regarding the vibrations of the cable compared with those measured on the wall. Also in this case the difference in energy of the blue spectrum compared to the brown one is evident. Figure 26 (c) is the dB version of the two trends, and it can be seen that the vibrational spectrum of the wall is -70 dB below the level of the vibrational spectrum of the electric cable. Figure 27 (a), and Figure 28 (b) represents the trend in the time domain of the vibrations measured on the electric cable, and visible in the blue color, while the vibrations, always in the time domain of the stable point wi located on the wall, is visible in the brown color. The difference in signal amplitude is immediately apparent. Figure 27 (b), anf Figure 28 (b) represents the trend in the frequency domain (the vibrational spectrum) regarding the vibrations of the cable compared with those measured on the wall. Also in this case the difference in energy of the blue spectrum compared to the brown one is evident. Figure 27 (c), and Figure 28 (c) represents is the dB version of the two trends, and it can be seen that the vibrational spectrum of the lower, and and the highest part of the pylon is located at -40 and -30 dB respectively.

Performance:

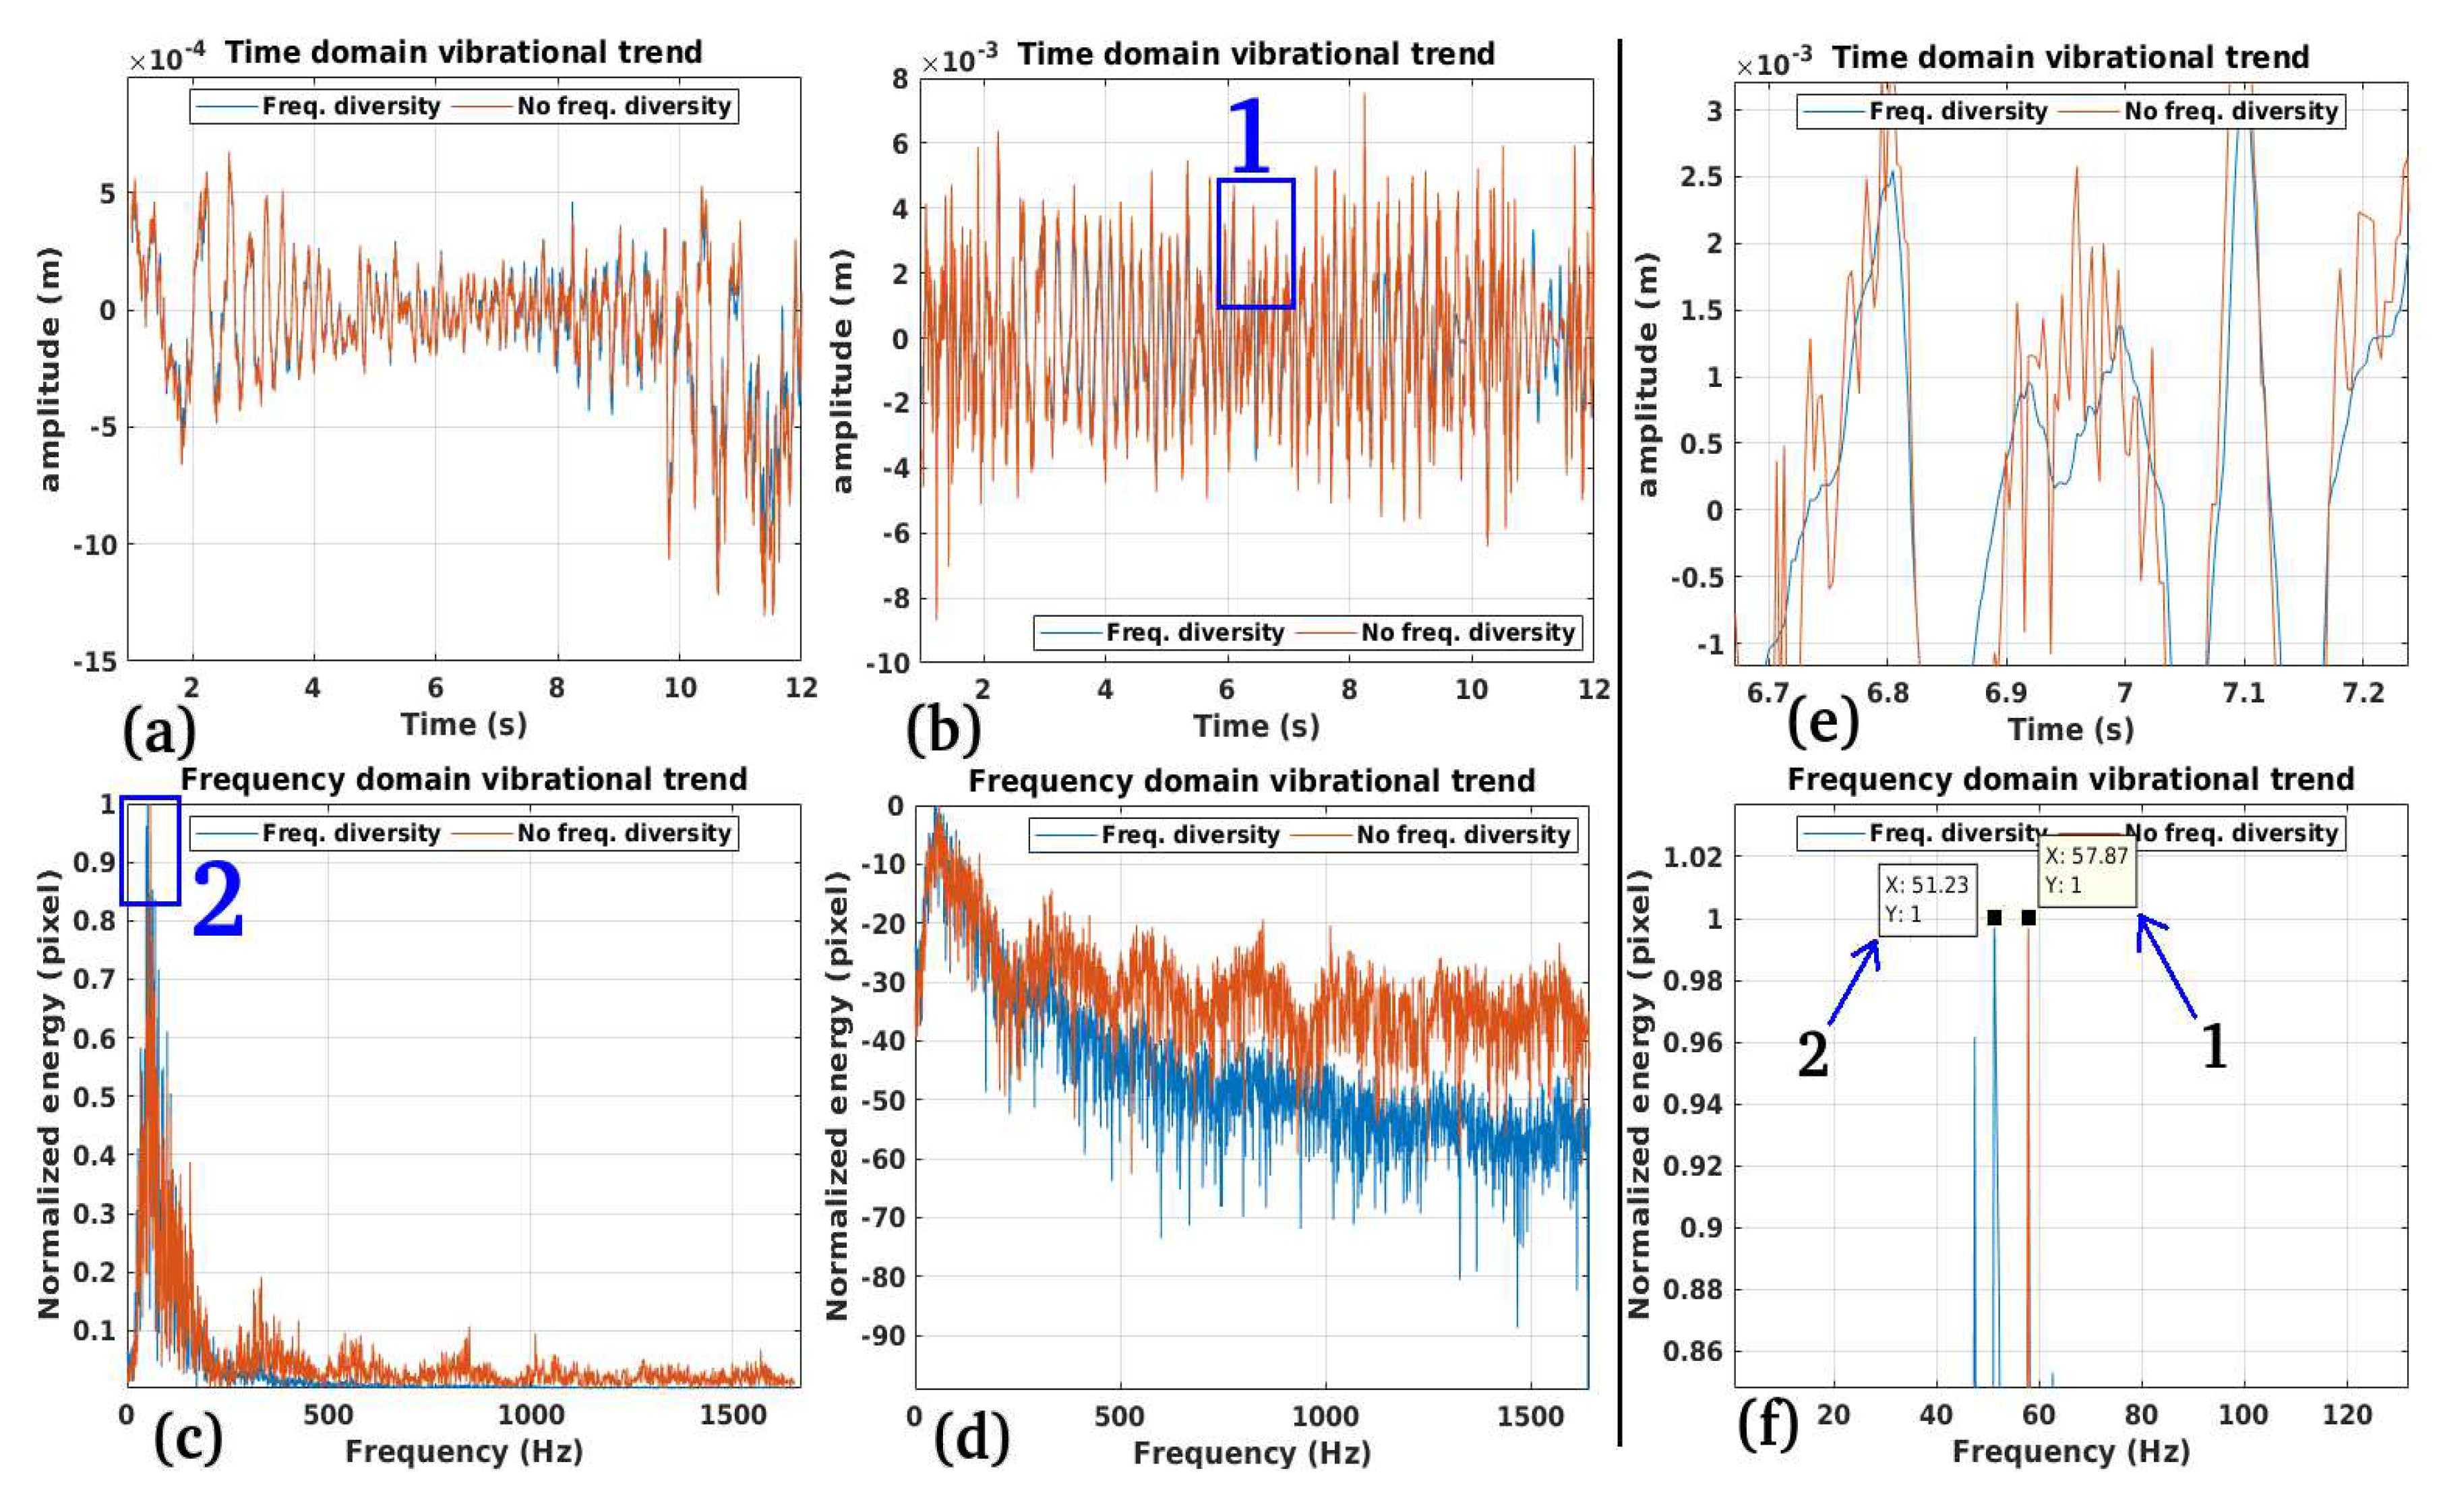
The next experiments, constituting case study number 4, is to quantify the performance of our algorithm. All the measurements we have made so far have required the evaluation of the vibrational profile measured only on bright pixels. The set of results we describe here were measured on a low bright pixel. This pixel is visible in Figure 8 (a). In Figure 29 (a), (b), and (c) are the uncompensated, compensated time domain, and spectum measured vibrational trend. The results confirm the feasibility of the measurement, carried out on the electrical cable, but observing a non-bright pixel. The next experiment is about showing how diversity in frequency is useful in obtaining more precise results. The results are summarized in Figure 30 from (a) to (f). Figure 30 (a) represents a vibrational trend calculated on a point that we have previously considered. For all results in Figure 30, the blue and brown functions are those estimated with frequency diversity while the brown function represents those estimated without frequency diversity. Figure 30 (b) represents the time course compensated by the errors of variation of the vibrational polarisation. The blue box number 1 contains a section of the time course that we will display in detail in Figure 30 (e), where we can see in blue the function with the frequency diversity, which is less noisy than the brown one. The spectra in linear and logarithmic scale are shown in Figure 30 (c), and (d). A substantial increase in the signal-to-noise ratio is also apparent here. Box 2 contains the peak of the spectral line generated by the alternating current, then two peaks are estimated, the first one (the blue one), estimated from the frequency variation, the second one, (the brown one), estimated without the frequency variation. The last sub-figure is shown in Figure 30 (f) where. Box 1, the one identified by the spectrum of the time-domain function estimated without the frequency variation, measures the energy peak at 57.87 Hz. The energy peak of the spectrum calculated from the estimated function through frequency diversity, (blue function), measures the frequency maximum at 51.23 Hz. This experiment demonstrates that chirp sub-apertures are a way of obtaining better results.
Figure 29. Estimated time and frequency domain vibrational trends. (a): Uncompensated time domain function. (b): Compensated time domain function. (c): Compensated frequency domain trend. Results are estimated on point 3 visible in Figure 8 (c).
Preprints 82042 g029
Figure 30. Vibrational results: (a): Time-domain vibrations (uncompensated). (b): Time-domain vibrations (compensated). (c): Linear visualization of the spectrum. (d): Log-scale visualization of the spectrum. (c): particular of the time domain fluctuation of (b), box 1. (f): Linear Spectrum energy peaks. For all functions in blue color, we refer to all chirp diversity results, and for all brows colored functions we refer to full-chirp-band focused results (without frequency diversity).
Preprints 82042 g030
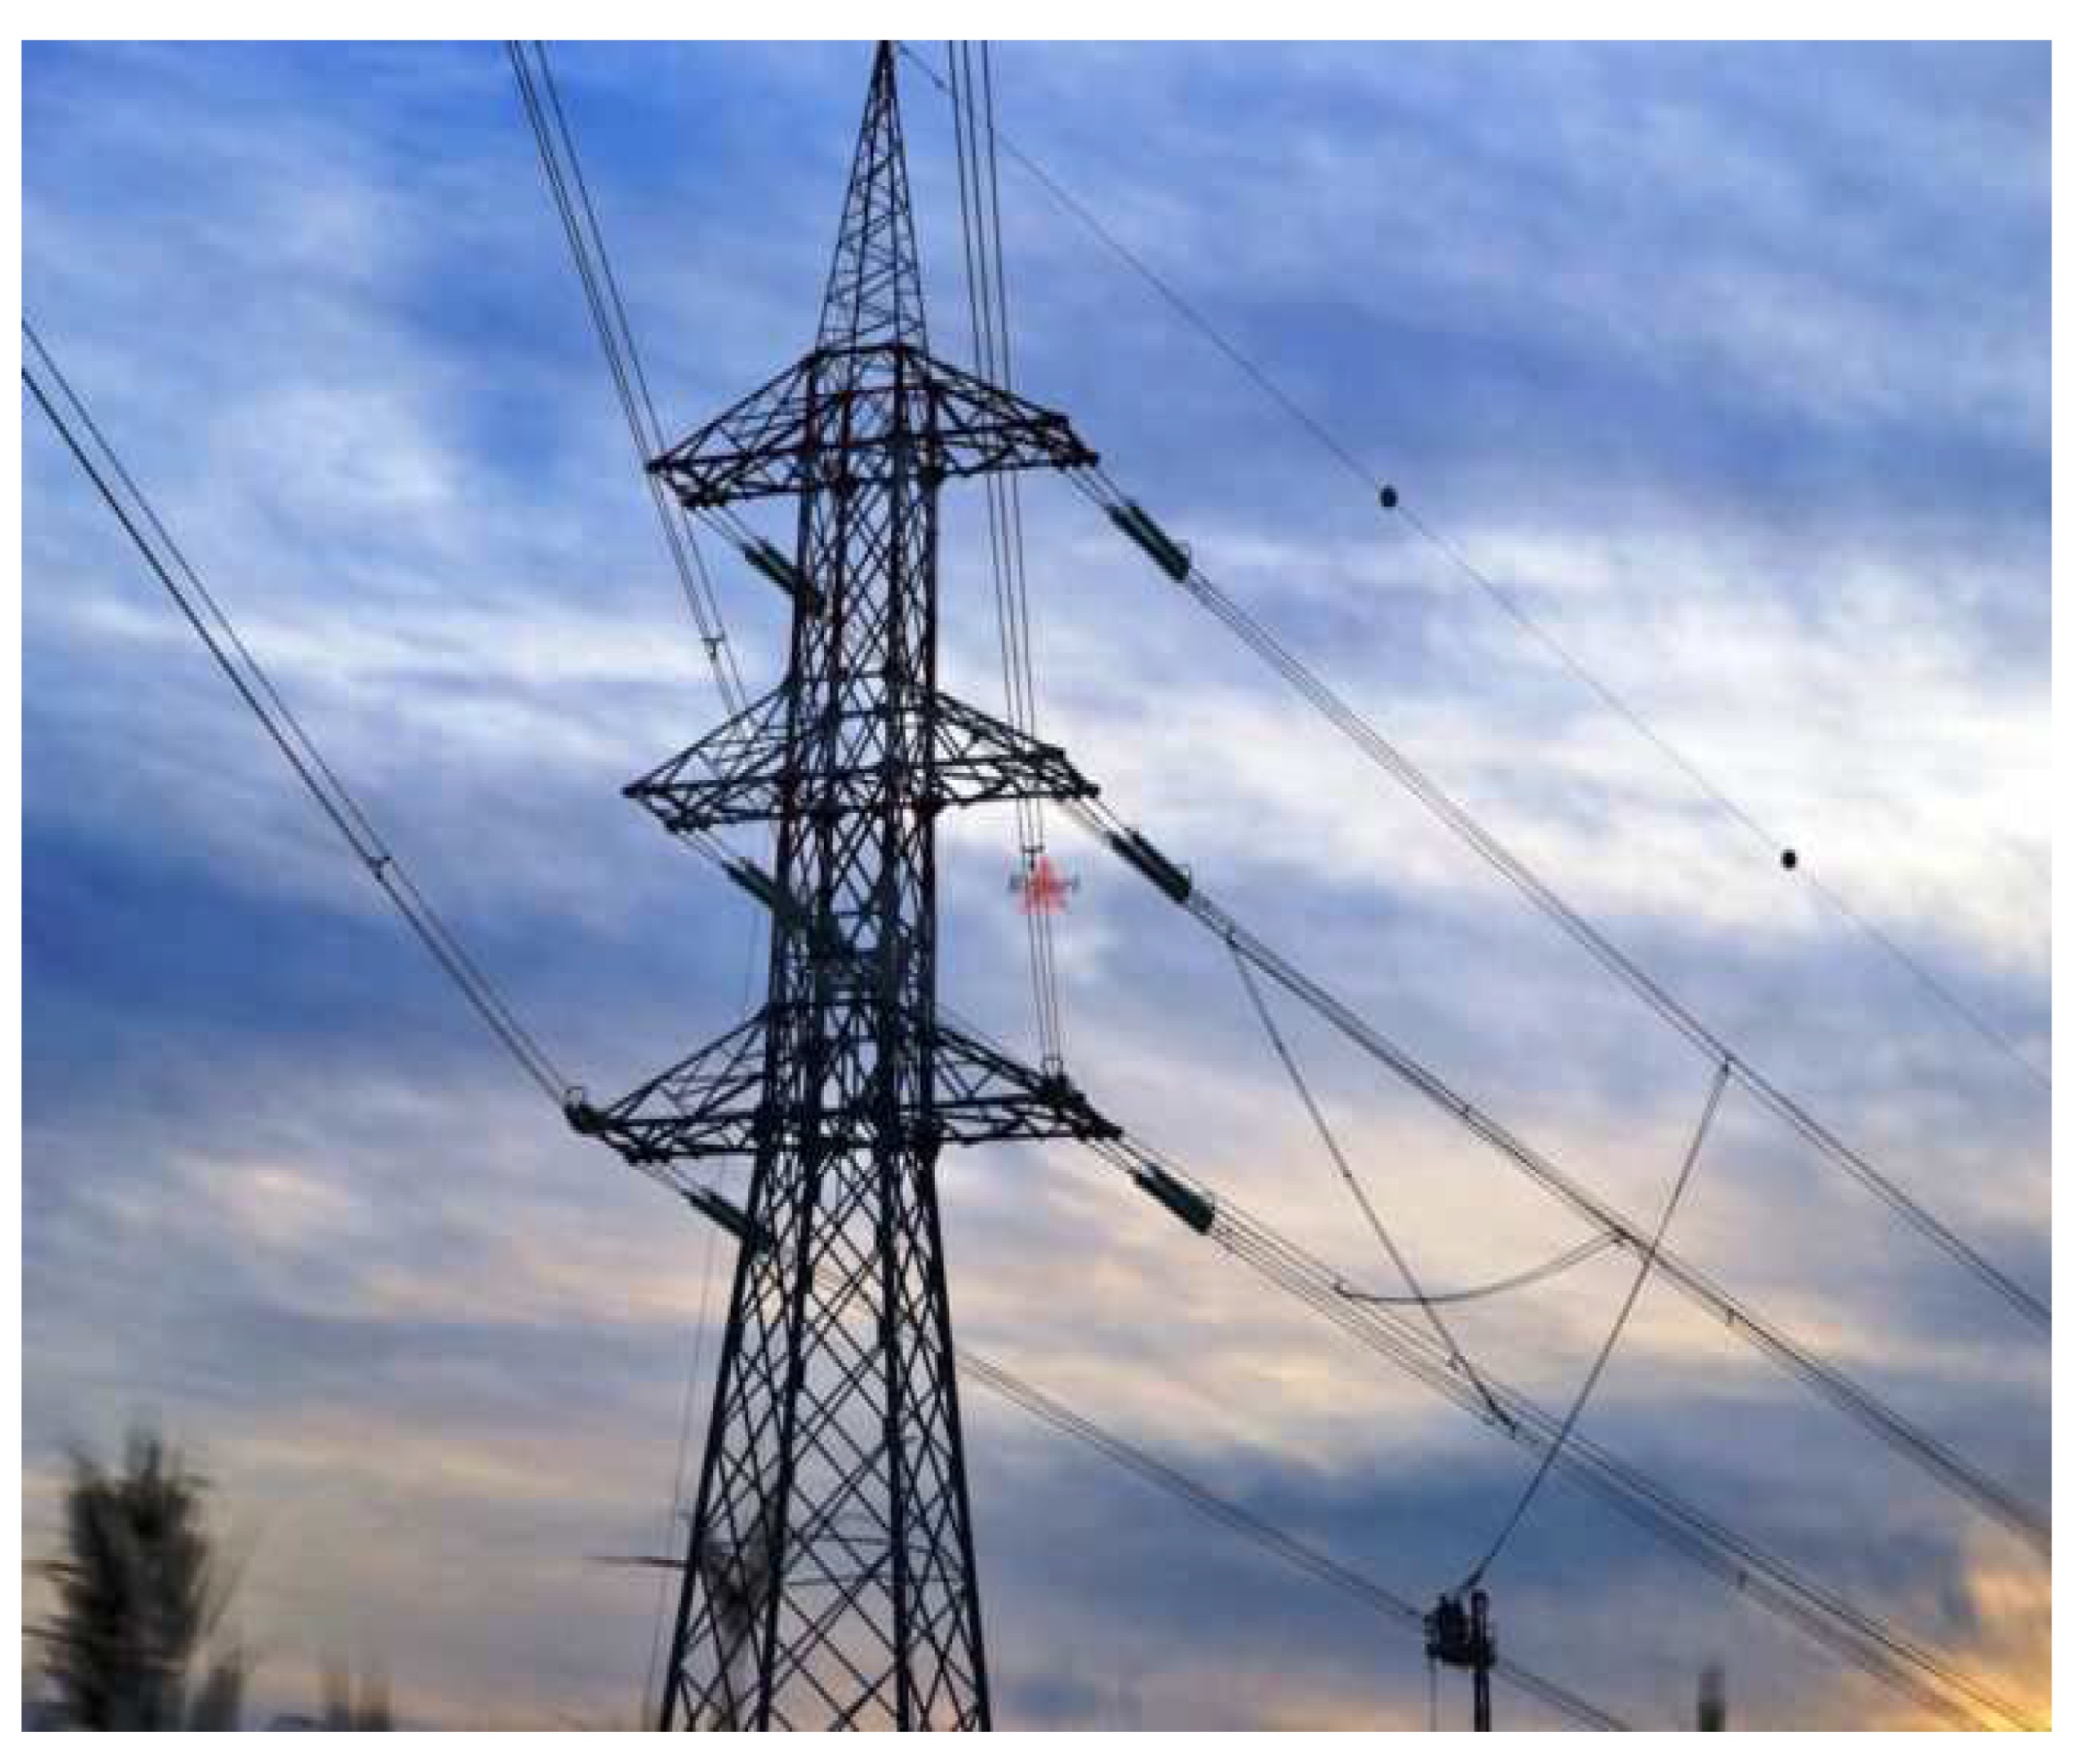
Figure 31. Electric pylon used to record acoustic data for validation.
Preprints 82042 g031
Figure 32. Vibrational spectrum. (a): Linear spectrum. (b): lo-scale spectrum. The blu functions are referred to the vibrations estimated by the radar, while the brown functions refers to the acoustic measurements.
Preprints 82042 g032
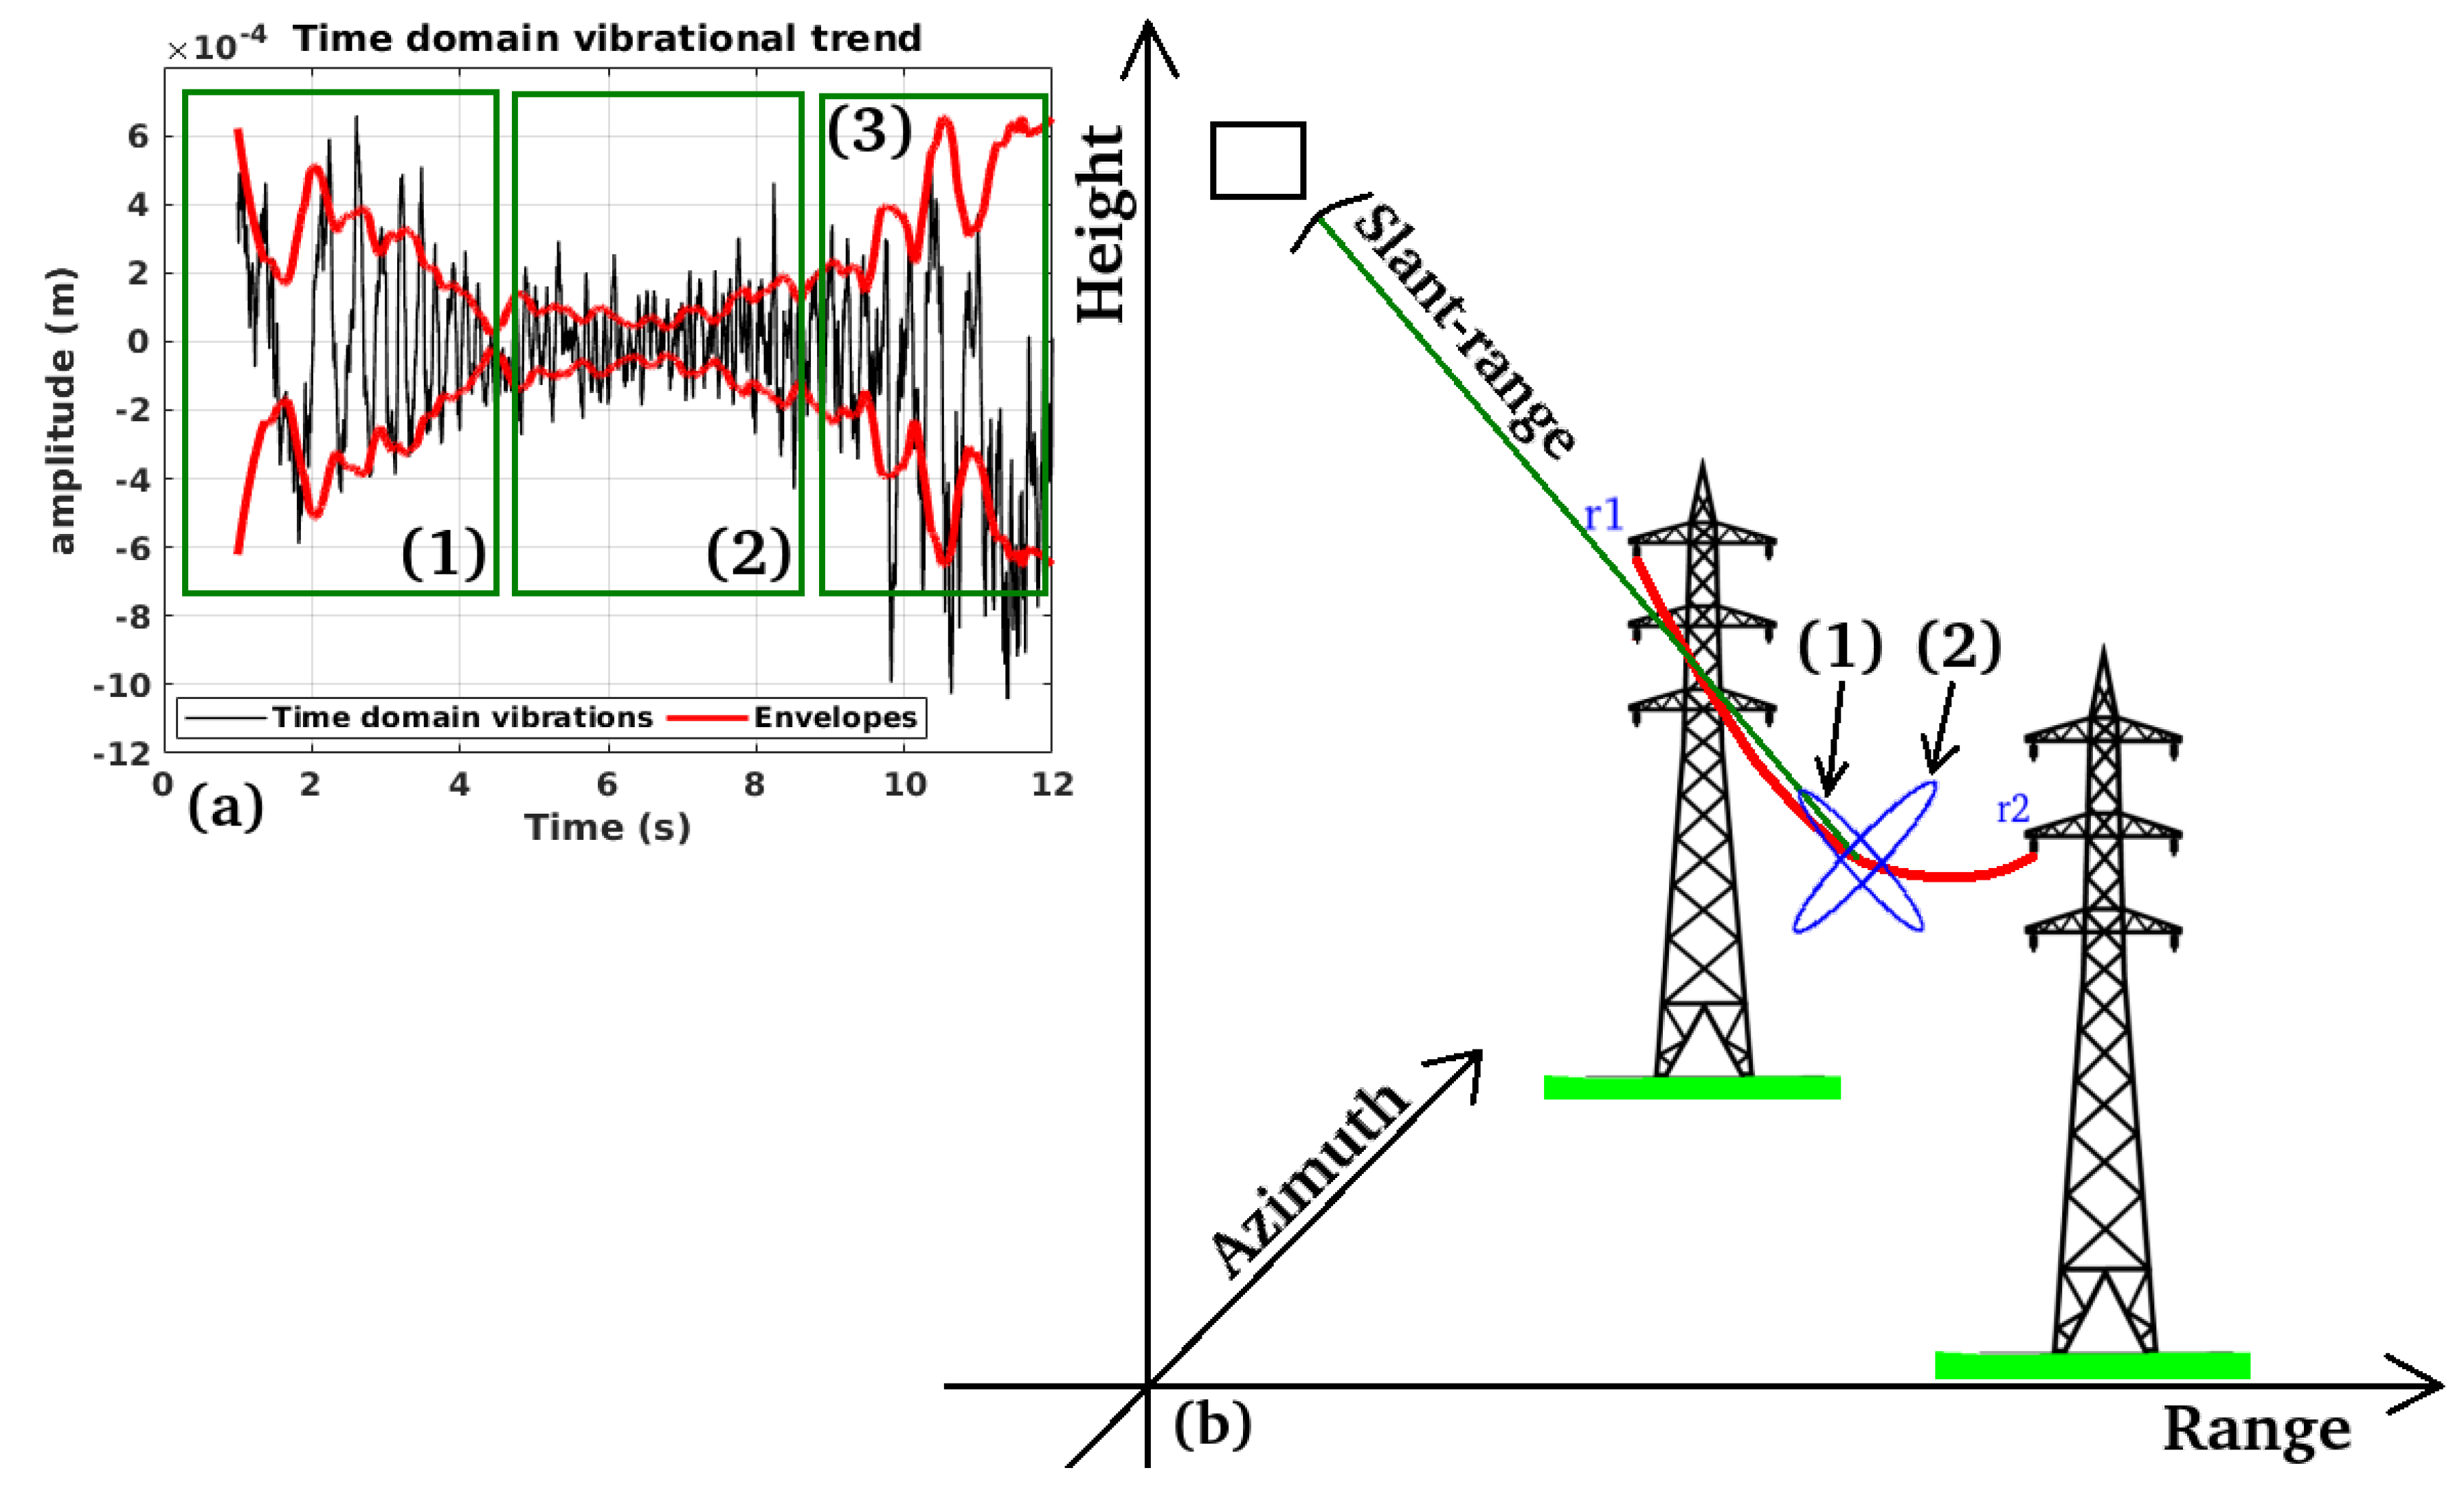
Figure 33. Vibrational measurements versus SAR geometry and vibrational polarization. (a): Time domain vibrational trend (black line) versus time-domain envelope (red line). (b): SAR acquisition geometry, when interacting with polarized vibrations.
Preprints 82042 g033

Validation:

The last experiment, concerning case study number 4, consists in the validation of our method with the aim of verifying the vibrational spectrum estimated with CSK with the spectrum of the vibrating signal acquired through acoustic detection. We installed a microphone underneath the pylon visible in Figure 31. The microphone records the audio track of the flickering generated by the alternating current flowing through the electric cables. Figure 32 (a) is the linear scale spectrum of the vibrational signal measured with CSK (blue colour), superimposed with the signal estimated through the audio recordings (brown graph). The spectral version is represented in the same way as the previous one, but on a logarithmic scale. The time domain version is represented in Figure 32 (c)-1, (c)-2, representing the measurement made with CSK and from the microphone respectively.

Limitations:

In this section we discuss the limitations assumed by the measurement technique we propose. It is not always possible to measure vibrations on electrical cables. First of all, power cables are not always visible, although the supporting masts are always visible. From experience in the SAR field it has been assumed that power cables are only visible when the orbit path is parallel to the physical path of the power cables. Considering these geometric limitations it is clear that not all power lines are always visible. Another limitation on vibration estimation is that not all vibrational polarisations are visible to radar. Figure 33 (a) represents the time-domain trend of the uncompensated vibrations from the polarisation point of view. The figure shows 3 different time courses. Those with the highest amplitude are those in boxes 1, and 3, while the function contained within box 2 is significantly lower. The explanation for this phenomenon is as follows: The radar is sensitive to the Doppler frequency variation as a function of the velocity component in the ”slant-range” direction. When the vibrations have a preferential polarisation in the direction of the radar LOS (ellipse 1 of Figure 33 (b)), the vibrational oscillations have a higher amplitude. The oscillations in Box 2 refer to the polarisation having a direction predominantly parallel to the Doppler-ambiguous direction in the ”cross-slant-range” direction.

4. Discussion

The results obtained in this work have shown that the use of amplitude information alone from SAR images is enough to estimate the m-m generated by electric cables. As a matter of fact, the exploitation of high-resolution SAR data has allowed to appreciate the m-m. The vibrations have been estimated in both time and frequency domains considering different electric cables. In the first domain, an analysis from the energy point of view can be performed, while in the second domain the main oscillation mode of the alternating voltage, can be identified at frequencies ranging around 50 Hz. By means of the many examples we have demonstrated the possibility of measuring the vibrations of electrical cables. We have shown that this can occur both on cable sections with high radar luminosity and when the radar reflectivity is lower. We have also shown that the vibrations present both on stable points of the scene under investigation and on the electrical masts, the vibrations we estimate have a much smaller amplitude than those measured on the electrical cable. The experience made in this work is that on cables the vibrational amplitude we estimated is not constant, but slowly variable in time. This could be caused by external perturbations that tend to rotate the axis of the prevailing polarization with respect to the direction of maximum Doppler sensitivity of the radar, i.e. the LOS. This rotation could occur for a variety of reasons, we believe that wind is one of the main causes. The second is that this polarisation may be naturally and constantly rotated due to the construction technology of electrical cables which tend to contract such cables consisting of a collection of smaller section cables rolled up in a regular spiral. We have calculated the displacement field in the space domain, i.e. in distributed displacement on the power cables, in terms of energy and phase. Also in this case we found a certain regularity in the distribution of the vibrational displacement. Finally, we validated the experiments by successfully comparing the spectrum of acoustic vibrations measured by installing a microphone under a high-voltage cable with the one measured by the radar. In addition, given the high quality of the vibration profiles, we believe that this work opens the way to a new paradigm for large areas of electric power grid frequency and EPTC-HM.

5. Conclusions

In this paper we have produced a study demonstrating the possibility of estimating the physical vibrations produced by high-voltage electrical energy when transported by overhead cables supported by metal pylons. We have shown the results of several experiments by measuring vibrations at specific points in the time domain and other spatially assigned measurements. We also showed the possibility of measuring the complex displacement field produced by this vibrational effect, by visualizing a regular pattern due mainly to the construction technology of the high voltage cables. Indeed today electricity is distributed to the individual users via physical Copper connections. From the power stations, the energy is transported through transmission lines where the electricity, sinusoidally modulated at a fixed frequency of about 50 Hz, is raised up to a voltage in a range approximately variating between 30, and 110 kV. When electrons, aligned at this voltage, pass through the transmission lines, they cause coherent vibrations, sometimes even audible in the acoustic frequencies. In the spectrum of movements to which electric cables are subjected, there are also unexpected and sporadic movements caused by winds and rain. The problem of carrying out persistent, precise and spatially distributed monitoring of transmission line health is to use a large number of sensors physically distributed everywhere and somehow transmit the results to a control station. The use of synthetic aperture radar (SAR) data could be a viable solution of persistent and wide-area high-voltage vibration monitoring. In this paper we produce a comprehensive survey on how to monitor both movements in terms of vibrational displacement, due to weathering, and those due to electricity transmission, normally fixed at about 50 Hz. The results demonstrate the technical feasibility of an operational use of SAR for these purposes in the very short term. This would allow the possibility of monitoring malfunctions such as black-outs or other frequency anomalies.

Author Contributions

Each author dealt with a specific study case and reviewed the other study cases. All authors reviewed the manuscript.

Acknowledgments

The authors would to thank the Italian Space Agency (ASI) for providing the SAR data. This research used the software SARPROZ: https://www.sarproz.com/, for performing the precise geocoding of the estimated vibration maps.

References

  1. Chen, H.P. Structural health monitoring of large civil engineering structures; John Wiley & Sons: Hoboken, NJ, USA, 2018. [Google Scholar]
  2. Scott, C.P.; Lohman, R.B.; Jordan, T.E. InSAR constraints on soil moisture evolution after the March 2015 extreme precipitation event in Chile. Scientific Reports 2017, 7. [Google Scholar] [CrossRef]
  3. Bekaert, D.P.S.; Hamlington, B.D.; Buzzanga, B.; Jones, C.E. Spaceborne Synthetic Aperture Radar Survey of Subsidence in Hampton Roads, Virginia (USA). Scientific Reports 2017, 7. [Google Scholar] [CrossRef]
  4. Burnol, A.; Aochi, H.; Raucoules, D.; Veloso, F.M.L.; Koudogbo, F.N.; Fumagalli, A.; Chiquet, P.; Maisons, C. Wavelet-based analysis of ground deformation coupling satellite acquisitions (Sentinel-1, SMOS) and data from shallow and deep wells in Southwestern France. Scientific Reports 2019, 9. [Google Scholar] [CrossRef]
  5. Raspini, F.; Carlà, T.; Intrieri, E.; Bardi, F.; Farina, P.; Ferretti, A.; Colombo, D.; Novali, F.; Casagli, N. Perspectives on the prediction of catastrophic slope failures from satellite InSAR. Scientific Reports 2019, 9, 13158. [Google Scholar]
  6. Carroll, J.S.; Koontz, J.A. Cable vibration—Methods of measurement. Electrical Engineering 1936, 55, 490–493. [Google Scholar] [CrossRef]
  7. Rivera, H.L.; García-Souto, J.A.; Sanz, J. Measurements of mechanical vibrations at magnetic cores of power transformers with fiber-optic interferometric intrinsic sensor. IEEE Journal of Selected Topics in Quantum Electronics 2000, 6, 788–797. [Google Scholar] [CrossRef]
  8. Olsen, R.G.; Edwards, K.S. A new method for real-time monitoring of high-voltage transmission-line conductor sag. IEEE transactions on power delivery 2002, 17, 1142–1152. [Google Scholar] [CrossRef]
  9. Diana, G.; Bocciolone, M.; Cheli, F.; Cigada, A.; Manenti, A. Large wind-induced vibrations on conductor bundles: laboratory scale measurements to reproduce the dynamic behavior of the spans and the suspension sets. IEEE Transactions on power delivery 2005, 20, 1617–1624. [Google Scholar] [CrossRef]
  10. Zangl, H.; Bretterklieber, T.; Brasseur, G. A feasibility study on autonomous online condition monitoring of high-voltage overhead power lines. IEEE Transactions on Instrumentation and Measurement 2009, 58, 1789–1796. [Google Scholar] [CrossRef]
  11. Brahami, M.; Gourbi, A.; Tilmatine, A.; Dascalescu, L. Numerical analysis of the induced corona vibrations on high-voltage transmission lines affected by rainfall. IEEE Transactions on power delivery 2011, 26, 617–624. [Google Scholar] [CrossRef]
  12. Godard, B.; Guerard, S.; Lilien, J.L. Original real-time observations of aeolian vibrations on power-line conductors. IEEE transactions on power delivery 2011, 26, 2111–2117. [Google Scholar] [CrossRef]
  13. Jin, M.; Pan, J.; Huang, H.; Zhou, J. Transmission of vibration of a power transformer from the internal structures to the tank. In Proceedings of the Acoustics 2012 Fremantle: Acoustics, Development and the Environment, Fremantle, Australia, 21–23 Novermber 2012; pp. 1–7. [Google Scholar]
  14. Biondi, F. COSMO-SkyMed staring spotlight SAR data for micro-motion and inclination angle estimation of ships by pixel tracking and convex optimization. Remote Sensing 2019, 11, 766. [Google Scholar]
  15. Biondi, F.; Addabbo, P.; Orlando, D.; Clemente, C. Micro-motion estimation of maritime targets using pixel tracking in COSMO-SkyMed synthetic aperture radar data—An operative assessment. Remote Sensing 2019, 11, 1637. [Google Scholar] [CrossRef]
  16. Biondi, F.; Addabbo, P.; Ullo, S.L.; Clemente, C.; Orlando, D. Perspectives on the structural health monitoring of bridges by synthetic aperture radar. Remote Sensing 2020, 12, 3852. [Google Scholar] [CrossRef]
  17. Biondi, F.; Addabbo, P.; Clemente, C.; Ullo, S.L.; Orlando, D. Monitoring of Critical Infrastructures by Micromotion Estimation: The Mosul Dam Destabilization. IEEE Journal of Selected Topics in Applied Earth Observations and Remote Sensing 2020, 13, 6337–6351. [Google Scholar] [CrossRef]
  18. Curlander, J.C.; McDonough, R.N. Synthetic aperture radar: systems and signal processing. Wiley: New York, NY, USA, 1991. [Google Scholar]
  19. Raney, R.K. Synthetic Aperture Imaging Radar and Moving Targets. IEEE Transactions on Aerospace and Electronic Systems 1971, AES-7, 499–505. [Google Scholar] [CrossRef]
  20. Tufillaro, N.B. Nonlinear and chaotic string vibrations. American Journal of Physics 1989, 57, 408–414. [Google Scholar] [CrossRef]
  21. Krishnan, S.R.; Seelamantula, C.S. On the selection of optimum Savitzky-Golay filters. IEEE transactions on signal processing 2012, 61, 380–391. [Google Scholar] [CrossRef]
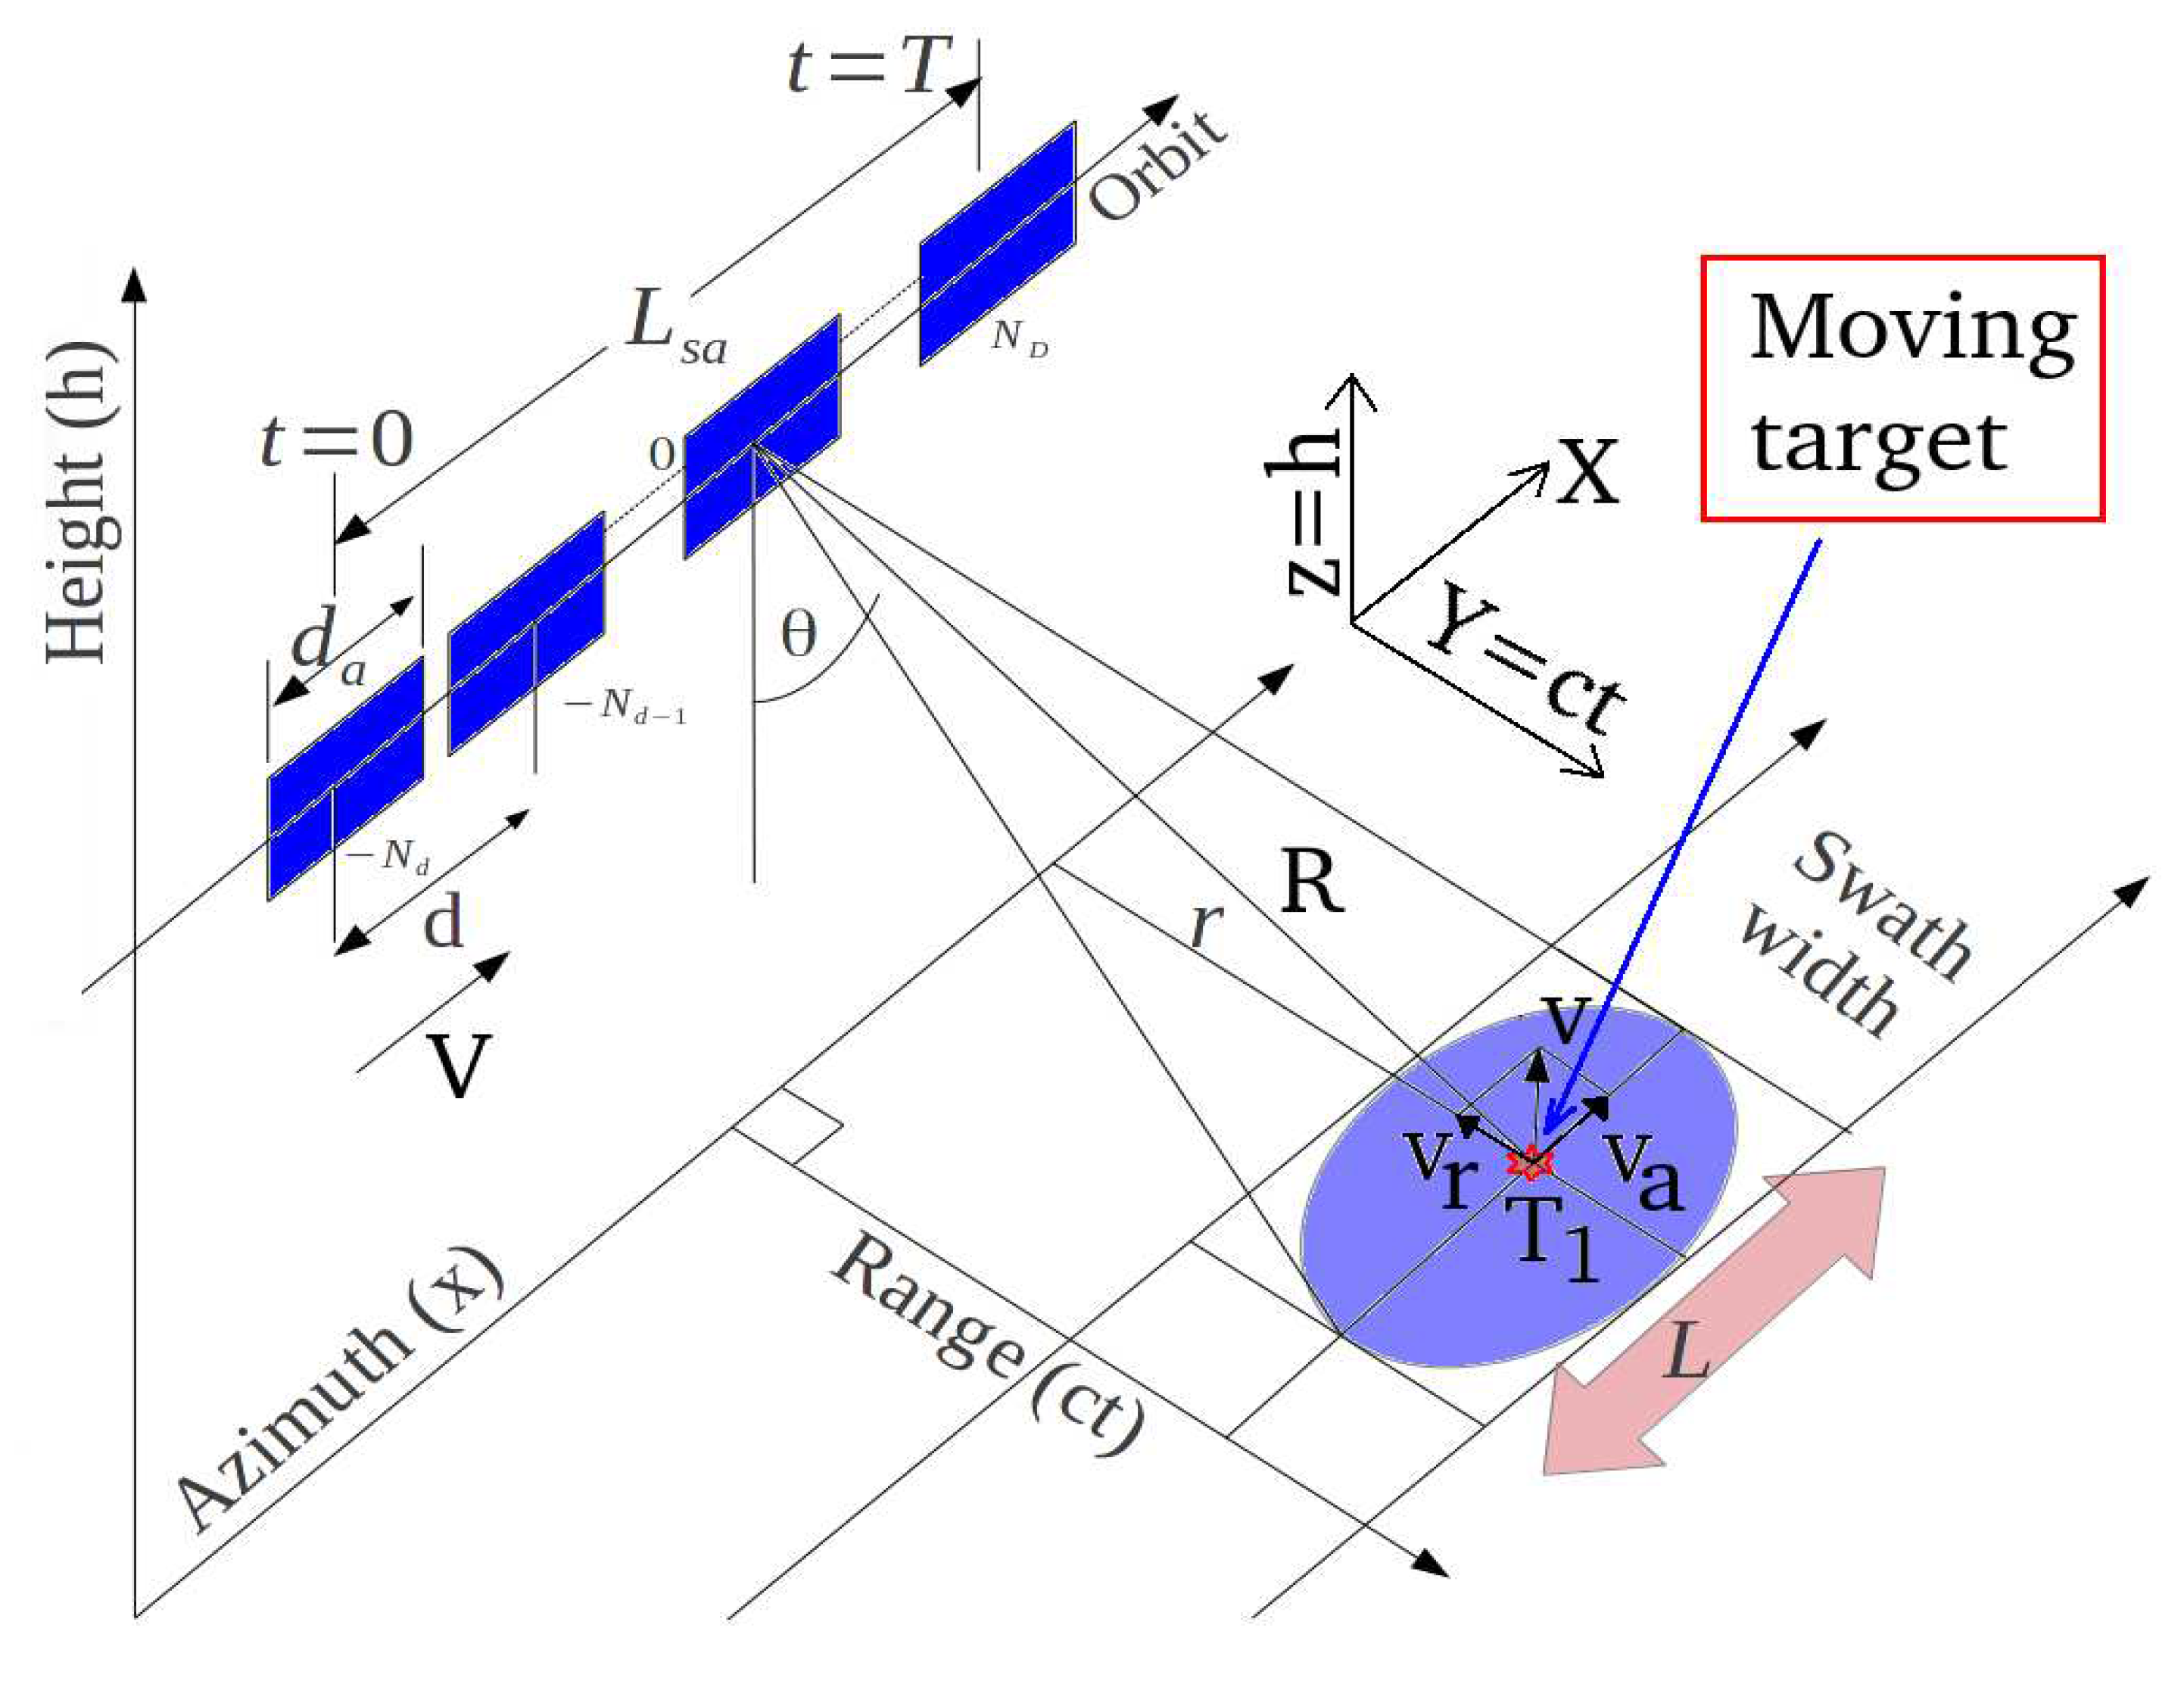
Figure 1. SAR acquisition geometry.
Preprints 82042 g001
Figure 2. Chirp-Doppler sub-aperture strategy.
Preprints 82042 g002
Figure 3. SAR acquisition geometry.
Preprints 82042 g003
Figure 4. Computational scheme.
Preprints 82042 g004
Figure 9. Estimated time and frequency domain vibrational trends. (a): Uncompensated time domain function. (b): Compensated time domain function. (c): Compensated frequency domain trend. Results are estimated on point 1 visible in Figure 8 (a).
Preprints 82042 g009
Figure 10. Estimated time and frequency domain vibrational trends. (a): Uncompensated time domain function. (b): Compensated time domain function. (c): Compensated frequency domain trend. Results are estimated on point 2 visible in Figure 8 (a).
Preprints 82042 g010
Figure 11. Estimated time and frequency domain vibrational trends. (a): Uncompensated time domain function. (b): Compensated time domain function. (c): Compensated frequency domain trend. Results are estimated on point 3 visible in Figure 8 (a).
Preprints 82042 g011
Figure 12. Estimated time and frequency domain vibrational trends. (a): Uncompensated time domain function. (b): Compensated time domain function. (c): Compensated frequency domain trend. Results are estimated on point 4 visible in Figure 8 (b).
Preprints 82042 g012
Figure 13. Estimated time and frequency domain vibrational trends. (a): Uncompensated time domain function. (b): Compensated time domain function. (c): Compensated frequency domain trend. Results are estimated on point 5 visible in Figure 8 (b).
Preprints 82042 g013
Figure 14. Estimated time and frequency domain vibrational trends. (a): Uncompensated time domain function. (b): Compensated time domain function. (c): Compensated frequency domain trend. Results are estimated on point 6 visible in Figure 8 (b).
Preprints 82042 g014
Figure 15. Estimated time and frequency domain vibrational trends. (a): Uncompensated time domain function. (b): Compensated time domain function. (c): Compensated frequency domain trend. Results are estimated on point 7 visible in Figure 8 (c).
Preprints 82042 g015
Figure 16. Estimated time and frequency domain vibrational trends. (a): Uncompensated time domain function. (b): Compensated time domain function. (c): Compensated frequency domain trend. Results are estimated on point 8 visible in Figure 8 (c).
Preprints 82042 g016
Figure 17. Estimated time and frequency domain vibrational trends. (a): Uncompensated time domain function. (b): Compensated time domain function. (c): Compensated frequency domain trend. Results are estimated on point 1 visible in Figure 8 (c).
Preprints 82042 g017
Figure 18. Estimated time and frequency domain vibrational trends. (a): Uncompensated time domain function. (b): Compensated time domain function. (c): Compensated frequency domain trend. Results are estimated on point 2 visible in Figure 8 (c).
Preprints 82042 g018
Figure 19. Estimated time and frequency domain vibrational trends. (a): Uncompensated time domain function. (b): Compensated time domain function. (c): Compensated frequency domain trend. Results are estimated on point 3 visible in Figure 8 (c).
Preprints 82042 g019
Figure 20. Vibration energy of target c1 visible in Figure 8. (a): magnitude in the linear scale. (b): magnitude in the log. scale. (c): Displacement phase.
Preprints 82042 g020
Figure 21. Vibration energy of target c2 visible in Figure 8. (a): magnitude in the linear scale. (b): magnitude in the log. scale. (c): Displacement phase.
Preprints 82042 g021
Figure 22. Vibration energy of targets c3, and c4, visible in Figure 8. (a): magnitude in the linear scale. (b): magnitude in the log. scale. (c): Displacement phase.
Preprints 82042 g022
Figure 23. Vibration energy of electric pylon q1 visible in Figure 7. (a): magnitude in the linear scale. (b): magnitude in the log. scale.
Preprints 82042 g023
Figure 24. Power transmission cables. (a), (b): Medium voltage power transmission cables. (c), (d): High-voltage power transmission cables.
Preprints 82042 g024
Figure 25. Vibration displacement field of target c1 visible in Figure 8.
Preprints 82042 g025
Figure 26. Comparison between the vibrational response measured at point 1 visible in Figure 8, located on the electrical cable, and at point w1, located on the base of the pylon, and visible in Figure 7 (b). (a): Time trend. (b): Spectrum on a linear scale. (c): Spectrum in logarithmic scale.
Preprints 82042 g026
Figure 27. Comparison between the vibrational response measured at point 1 visible in Figure 8, located on the electrical cable, and at point t1, located on the base of the pylon, and visible in Figure 7 (a), inside the yellow box q1. (a): Time trend. (b): Spectrum on a linear scale. (c): Spectrum in logarithmic scale.
Preprints 82042 g027
Figure 28. Comparison between the vibrational response measured at point 1 visible in Figure 8, located on the electrical cable, and at point t2, located on the base of the pylon, and visible in Figure 7 (b), inside the yellow box q1. (a): Time trend. (b): Spectrum on a linear scale. (c): Spectrum in logarithmic scale.
Preprints 82042 g028
Disclaimer/Publisher’s Note: The statements, opinions and data contained in all publications are solely those of the individual author(s) and contributor(s) and not of MDPI and/or the editor(s). MDPI and/or the editor(s) disclaim responsibility for any injury to people or property resulting from any ideas, methods, instructions or products referred to in the content.
Copyright: This open access article is published under a Creative Commons CC BY 4.0 license, which permit the free download, distribution, and reuse, provided that the author and preprint are cited in any reuse.
Prerpints.org logo

Preprints.org is a free preprint server supported by MDPI in Basel, Switzerland.

Subscribe

© 2024 MDPI (Basel, Switzerland) unless otherwise stated