Preprint
Article

Comprehensive Study of Drug-Induced Pruritus Based on Adverse Drug Reaction Report Database

Altmetrics

Downloads

183

Views

83

Comments

0

A peer-reviewed article of this preprint also exists.

This version is not peer-reviewed

Submitted:

11 August 2023

Posted:

11 August 2023

You are already at the latest version

Alerts
Abstract
Drug-induced pruritus triggers a desire to scratch, thereby diminishing one’s quality of life. Certain instances of this phenomenon follow complex mechanisms of action that diverge from histamine-mediated pathways, known contributors to pruritus. However, investigations into the relationship between drugs and pruritus are limited. In this study, data mining techniques were employed to comprehensively analyze the characteristics of drugs linked to pruritus, using the FDA Adverse Event Reporting System(FAERS) Data maintained in the United States. Reports linked to pruritus demonstrated noteworthy differences in gender, age, and weight when compared with non-pruritus cases. Among the leading candidates for drugs prompting pruritus were ophthalmic drugs, systemic antibacterials, contrast media, dermatological antifungals, and dermatological preparations. Principal component analysis showed that the second principal component served as an indicator for distinguishing between onsets at mucous membranes or the skin surface. Additionally, the third principal component functioned as an indicator for categorizing administration methods as either invasive or noninvasive. Furthermore, a hierarchical cluster analysis conducted on these obtained principal components revealed the potential for classifying drugs based on the site of pruritus onset and the method of drug administration. These findings contribute to the development of targeted prevention and treatment strategies for avoiding pruritus in clinical practice.
Keywords: 
Subject: Medicine and Pharmacology  -   Pharmacology and Toxicology

1. Introduction

Drug-induced pruritus is characterized by an instinctive urge to scratch brought about by a diverse array of drugs. This condition constitutes approximately 10% of all documented drug-related adverse effects and has garnered increasing attention in recent years [1]. Pruritus, commonly known as itching, has been reported to reduce the overall quality of life [2]. Furthermore, it can foster inadequate adherence to prescribed drug regimens. The imperative to mitigate pruritus stems from its potential to heighten the likelihood of patients discontinuing treatment, thereby exacerbating the primary disease. Consequently, understanding the mechanisms behind drug-induced pruritus assumes paramount significance in steering effective clinical management and therapeutic choices.
Over the preceding decades, numerous studies have delved into the intricacies of drug-induced pruritus and identified various drugs as potential triggers. Commonly cited associated drugs include opioids, antimalarials, and certain antibiotics [1,3]. The reported occurrence of drug-induced pruritus demonstrates variation according to the pharmacological classification of the drug in question. Particularly, relative differences in incidence manifest in antimicrobials due to their diverse pharmacological mechanisms [4]. However, the classification of pruritus based on drug efficacy and mechanisms remains predominantly unexplored. Antihistamines, serving as the primary antipruritic drugs, inhibit histamine released from mast cells. Nevertheless, certain instances of pruritus have been ascribed to chemical mediators other than histamine [5]. In fact, certain pruritus-inducing drugs have been associated with multifaceted mechanisms involving several chemical mediators [6].
Investigating such complex phenomena requires the application of more advanced analytical methods against when dealing with large databases. While some pioneering investigations have used data mining techniques to explore potential trends within adverse event databases, research employing this approach to explore drug-induced pruritus remains relatively limited [7]. Despite the growing importance of investigating pruritus, many studies pertaining to this condition have grappled with limitations such as a limited subject pool, data derived from a single country, and a confined concentration on specific drug-pruritus associations.
Hence, the present study undertook an all-encompassing, worldwide investigation into drug-induced pruritus. The US Food and Drug Administration’s (FDA) FAERS was used to conduct a comprehensive analysis to study suspected drug-induced adverse events on a global scale. This endeavor not only comprehensively investigated a broad spectrum of drug categories but also incorporated diverse patient characteristics (gender, age, weight) and their association with pruritus. The drug analysis aimed to identify and provide potential insights regarding drug-pruritus associations using innovative data mining methods. The study primarily focused on the pharmacological classifications of drugs acknowledged to induce pruritus.
Findings from this study provide therapeutic strategies for mitigating drug-induced pruritus. An effort was exerted to examine patient demographics to enable doctors to enhance treatment choices by considering distinct patient characteristics. In adittion, our objective was to provide an assessment list of drugs warranting careful consideration when treating patients with an increased susceptibility to pruritus. We also aimed to contribute toward refining the precision of pruritus risk evaluation by classifying causative drugs based on their characteristics.

2. Results

2.1. Data Table for Analysis
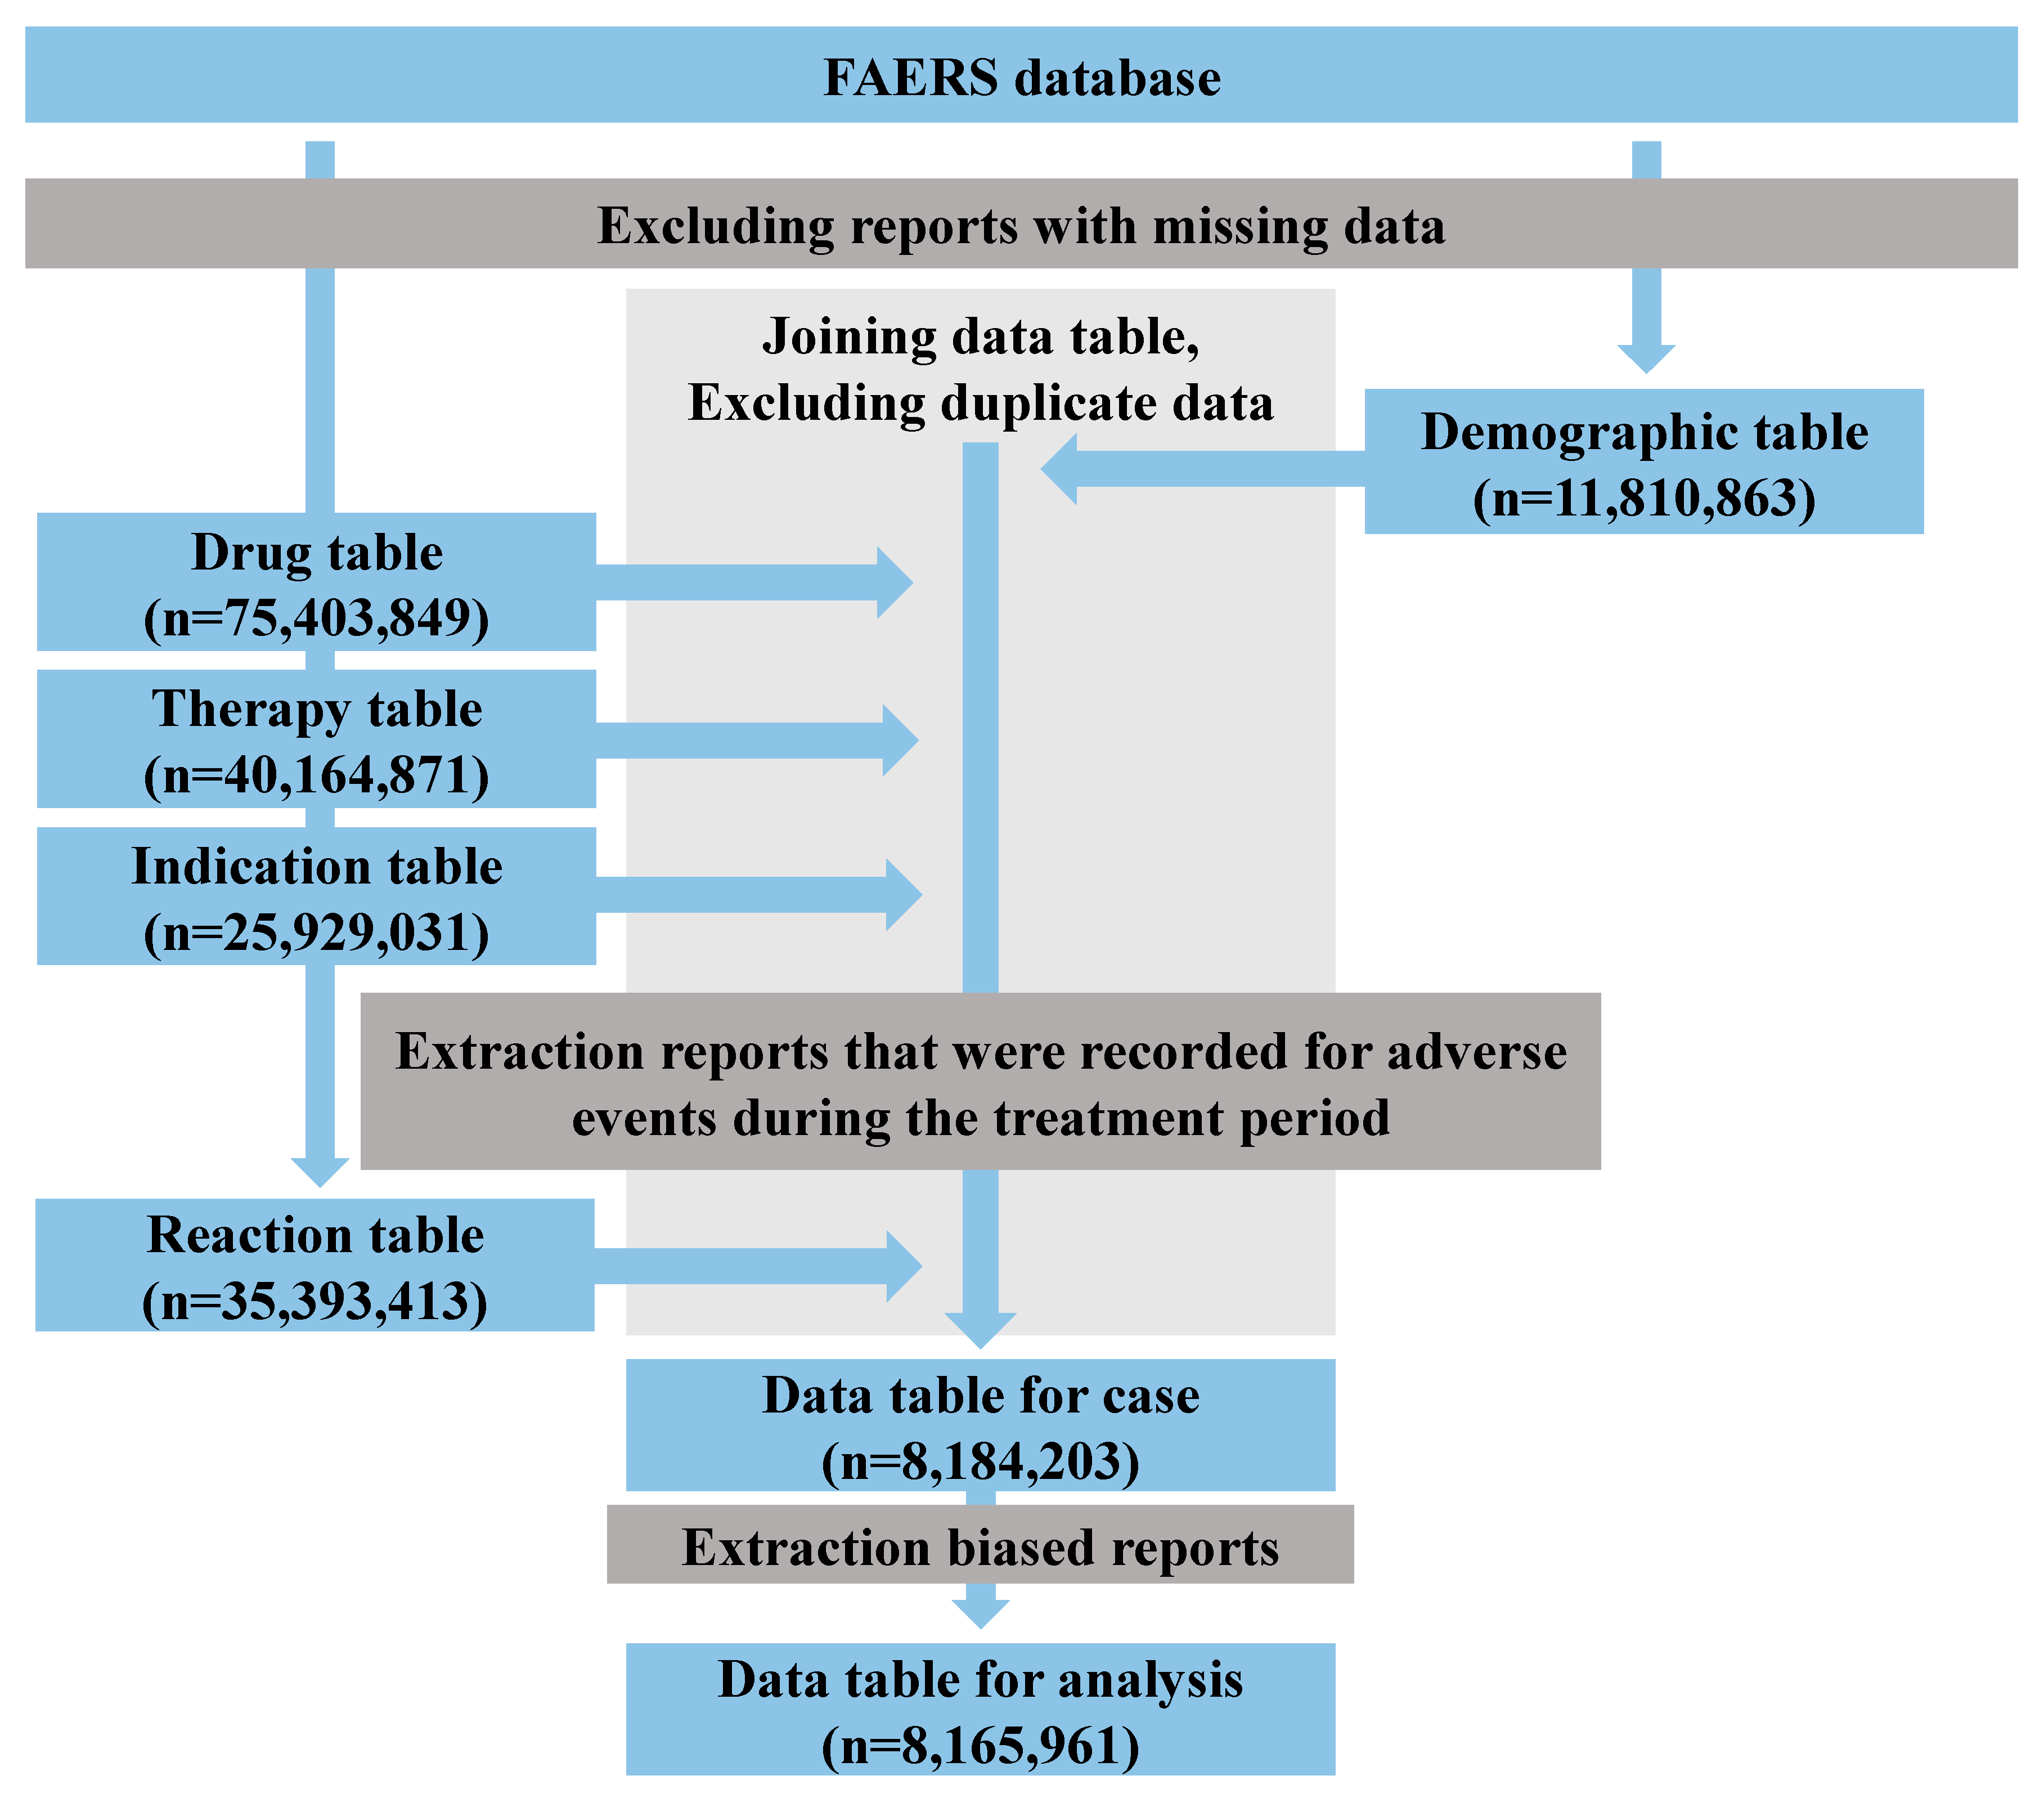
Data extracted from FAERS encompassed records spanning from the first quarter of 2004 to the first quarter of 2020. The total number of adverse events obtained from the Demographic table totaled 11,810,863. Utilizing the procedural sequence outlined in the flowchart for constructing data tables, we employed the Drug table comprising 75,403,849 reports, the Therapy table encompassing 40,164,871 reports, and the Indication table with 25,929,031 reports (Figure 2). This chronological organization facilitated the identification of 8,184,203 reports that exhibited an apparent correlation between drug use and adverse drug reactions. Among these, 90,976 (1.1%) reports pertained to pruritus. Subsequent to the removal of reports exhibiting a pronounced potential for bias, an analysis-ready data table comprising 8,165,961 entries was employed.
Figure 1. Flowchart of the data table creation.
Preprints 82174 g001

2.2. Relevance of Drug-Induced Pruritus to Patient Characteristics

All patient groups, including both male-only and female-only cohorts, underwent scrutiny to ascertain the presence or absence of pruritus, along with considerations of age and weight (Table 1). For each parameter, data tables were subjected to analysis after eliminating reports with missing values.
In the comprehensive data table, pruritus was reported in 86,989 out of 7,396,343 cases (Table 1). Among these, the mean age within the pruritic and non-pruritic groups was 50.30 ± 20.24 and 53.17 ± 21.09 years, respectively. Notably, the pruritic group exhibited statistically significant seniority (P < 0.0001), albeit with a negligible difference of 3 years. The mean body weights in the pruritic and non-pruritic groups were 88.26±44.93 kg and 83.44±44.55 kg, respectively, and while a significant difference was observable (P < 0.0001), the difference was insignificant at 5 kg.
Within the male data table, occurrences of pruritus were reported in 26,081 out of 2,752,150 cases (Table 1). The mean age for the pruritic and non-pruritic groups was 52.13 ± 20.65 and 55.57 ± 21.11 years, respectively. In essence, the non-pruritic group displayed statistically significant seniority (P < 0.0001), yet this translated to a marginal difference of 3 years. The mean weights for the pruritic and non-pruritic groups were 91.27±44.77 kg and 86.22±45.34 kg, respectively. Although a statistically significant difference was evident (P < 0.0001), the difference was insignificant at 5 kg.
Within the female data table, instances of pruritus were reported in 193 out of 4,089,839 cases (Table 1). Among these, the mean age for the pruritic and non-pruritic groups was 49.44 ± 19.99 and 55.15 ± 20.92 years, respectively. Similar to the male group, the non-pruritic group was notably older (P < 0.0001), although the difference was insignificant at 5 years. The mean body weights within the pruritic and non-pruritic groups were 86.63±44.94 kg and 81.87±43.90 kg, respectively. These were significantly different (P < 0.0001), yet the difference remained insignificant at 5 kg.
This shows the number of cases and patients in each category.

2.3. Signal Detection of Pruritus-Inducing Drugs
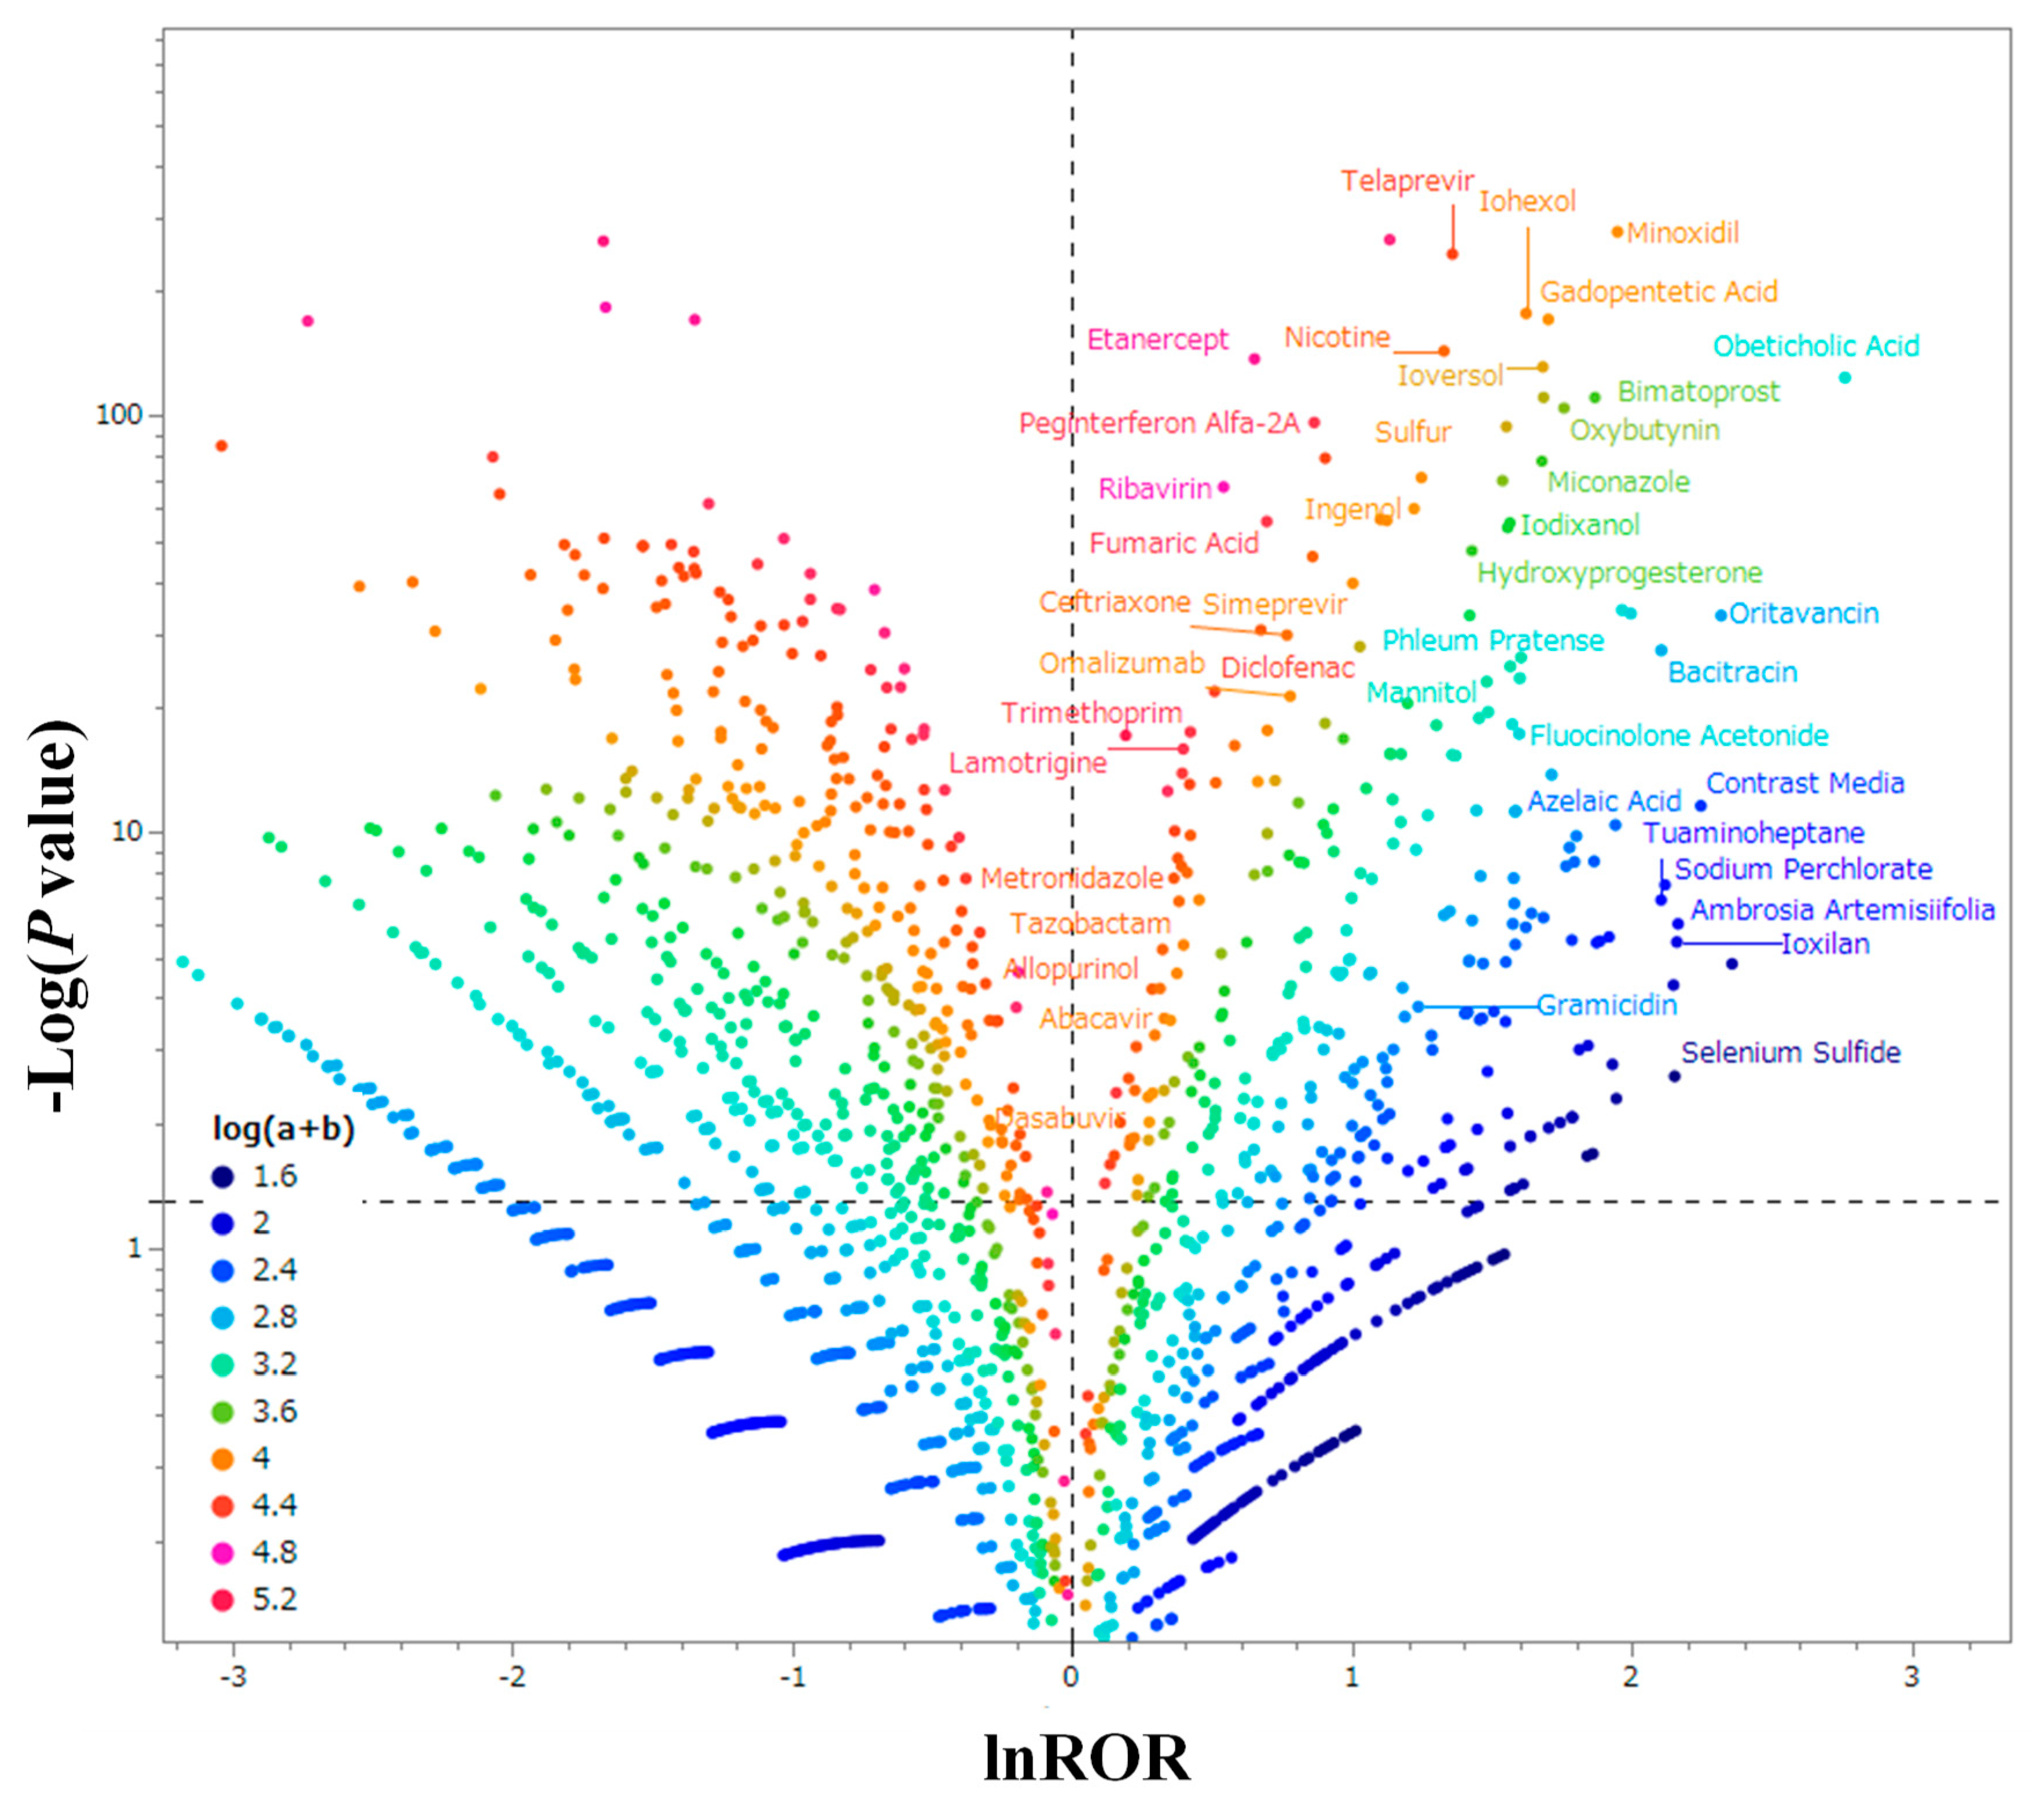
A scatterplot was generated, positioning the natural logarithm of the ROR (ln(ROR)) along the X-axis and Fisher’s exact probability test (-Log 10 (P-value)) along the Y-axis (Figure 3). In the context of this plot, the positive X direction illustrates the distribution of drugs where pruritus occurrences surpass other adverse events. Similarly, the positive Y direction indicates notable statistical significance. In essence, the plots distributed in the upper right-hand corner of Figure 2 tend to significantly induce pruritus. These drugs were classified based on their effects in accordance with the Anatomical Therapeutic Chemical Classification (ATC) of the Kyoto Encyclopedia of Genes and Genomes (KEGG), developed by Minoru Kanehisa [8]. The main medicinal classifications encompassing drugs exhibiting signals associated with cases of pruritus induction included ophthalmic drugs, systemic antibacterials, contrast media, dermatological antifungals, other dermatological preparations, corticosteroids and dermatological preparations, gynecological anti-infectives and disinfectants, antineoplastic drugs, immunosuppressive drugs, and vaccines.
Figure 2. Drugs associated with pruritus.
Preprints 82174 g002
This figure depicts the relationship between pruritus and the suspected drug. The dotted line extending vertically along the Y-axis represents P = 0.05, while the dotted line extending horizontally along the X-axis corresponds to lnROR = 0. The color of each point is categorized based on the ordinary logarithm of the number of reports for each drug. Shades ranging from blue to green to red signify ascending order of report counts, from the least to the most reported.
Illustrated in the upper-right quadrant of Figure 2 are drugs that exhibit notable signals, along with their corresponding primary drug categories. Within each of these significant drug categories, the top five drugs with the highest reported odds ratio (reported odds ratio) are as follows: bimatoprost (6.46), oritavancin (10.15), ioxiran (8.66), selenium disulfide (8.59), and minoxidil (7.00).
Additionally, the top drugs presenting the largest reported odds ratios, yet not falling within the main drug classes, include obeticholic acid (15.79).
Table 2. Drugs with signals associated with induced cases of pruritus.
Therapeutic_correspondence Drug
Ophthalmologicals Acetylcysteine, Alcaftadine, Azithromycin, Besifloxacin, Bimatoprost, Boric acid, Brimonidine, Brinzolamide, Bromfenac, Carmellose, Cefuroxime, Chlorhexidine, Clonidine, Desonide, Diclofenac, Dorzolamide, Erythromycin, Fluocinolone acetonide, Fluorescein, Fluorometholone, Glycerol, Hypromellose, Ketotifen, Latanoprost, Lifitegrast, Loteprednol, Macrogol 400, Moxifloxacin, Naphazoline, Neomycin, Netarsudil, Olopatadine, Paraffin, Paraffin, Liquid, Polymyxin b, Polysorbate 80, Povidone-iodine, Propylene glycol, Sulfacetamide, Tetracaine, Tetracycline, Tetryzoline, Timolol, Tobramycin, Travoprost, Triamcinolone, Vancomycin
Antibacterials for systemic use Amoxicillin, Azithromycin, Bacitracin, Cefaclor, Cefadroxil, Cefalexin, Cefazolin, Cefdinir, Cefixime, Cefoxitin, Cefprozil, Cefradine, Ceftaroline fosamil, Ceftazidime, Ceftibuten, Ceftizoxime, Ceftriaxone, Cefuroxime, Clarithromycin, Clindamycin, Cloxacillin, Dalbavancin, Dicloxacillin, Doxycycline, Erythromycin, Fosfomycin, Gemifloxacin, Metronidazole, Moxifloxacin, Nafcillin, Neomycin, Oritavancin, Phenoxymethylpenicillin, Piperacillin, Polymyxin b, Pristinamycin, Sulfamethoxazole, Tazobactam, Tetracycline, Ticarcillin, Tobramycin, Trimethoprim, Vancomycin
Contrast media Amidotrizoic acid, barium, Gadobenic acid, Gadobutrol, Gadodiamide, Gadofosveset, Gadopentetic acid, Gadoteric acid, Gadoteridol, Gadoxetic acid, Iodixanol, Iohexol, Iomeprol, Iopamidol, Ioversol, Ioxaglic acid, Ioxilan, Perflutren
Antifungals for dermatological use Butenafine, Ciclopirox, Clotrimazole, Eeconazole, Efinaconazole, Fluconazole, Ketoconazole, Miconazole, Nystatin, Naftifine,Selenium sulfide, Tioconazole, Terbinafine, Terbinafine, Tavaborole
Other dermatological preparations Brimonidine, Crisaborole, Diclofenac, Dupilumab, Eflornithine, Hydroquinone, Ivermectin, Minoxidil, Sulfur, Pimecrolimus, Povidone-iodine
Corticosteroids, dermatological preparations Beclometasone, Clobetasol, Desoximetasone, Desonide, Fluorometholone, Fluocinonide, Fluocinolone acetonide, Methylprednisolone, Methylprednisolone, Triamcinolone, Ulobetasol
Gynecological antiinfectives and antiseptics Ciclopirox, Clindamycin, Clotrimazole, EconazoleKetoconazole, Metronidazole, Miconazole, Nystatin, Povidone-iodine, Tioconazole
Antineoplastic agents Aminolevulinic acid, Asparaginase, Carboplatin, Celecoxib, Cetuximab, Chlormethine, Oxaliplatin, Pegaspargase, Rituximab, Tretinoin
Immunosuppressants Anakinra, Belimumab, Dalimumab, Etanercept, Fumaric acid, Ixekizumab, Ocrelizumab, Sarilumab, Secukinumab
Vaccines Hpv vaccine, Pneumococcal vaccine, Varicella zoster vaccine

2.4. Characteristics of the Adverse Event Related to Pruritus Using Principal Component Analysis
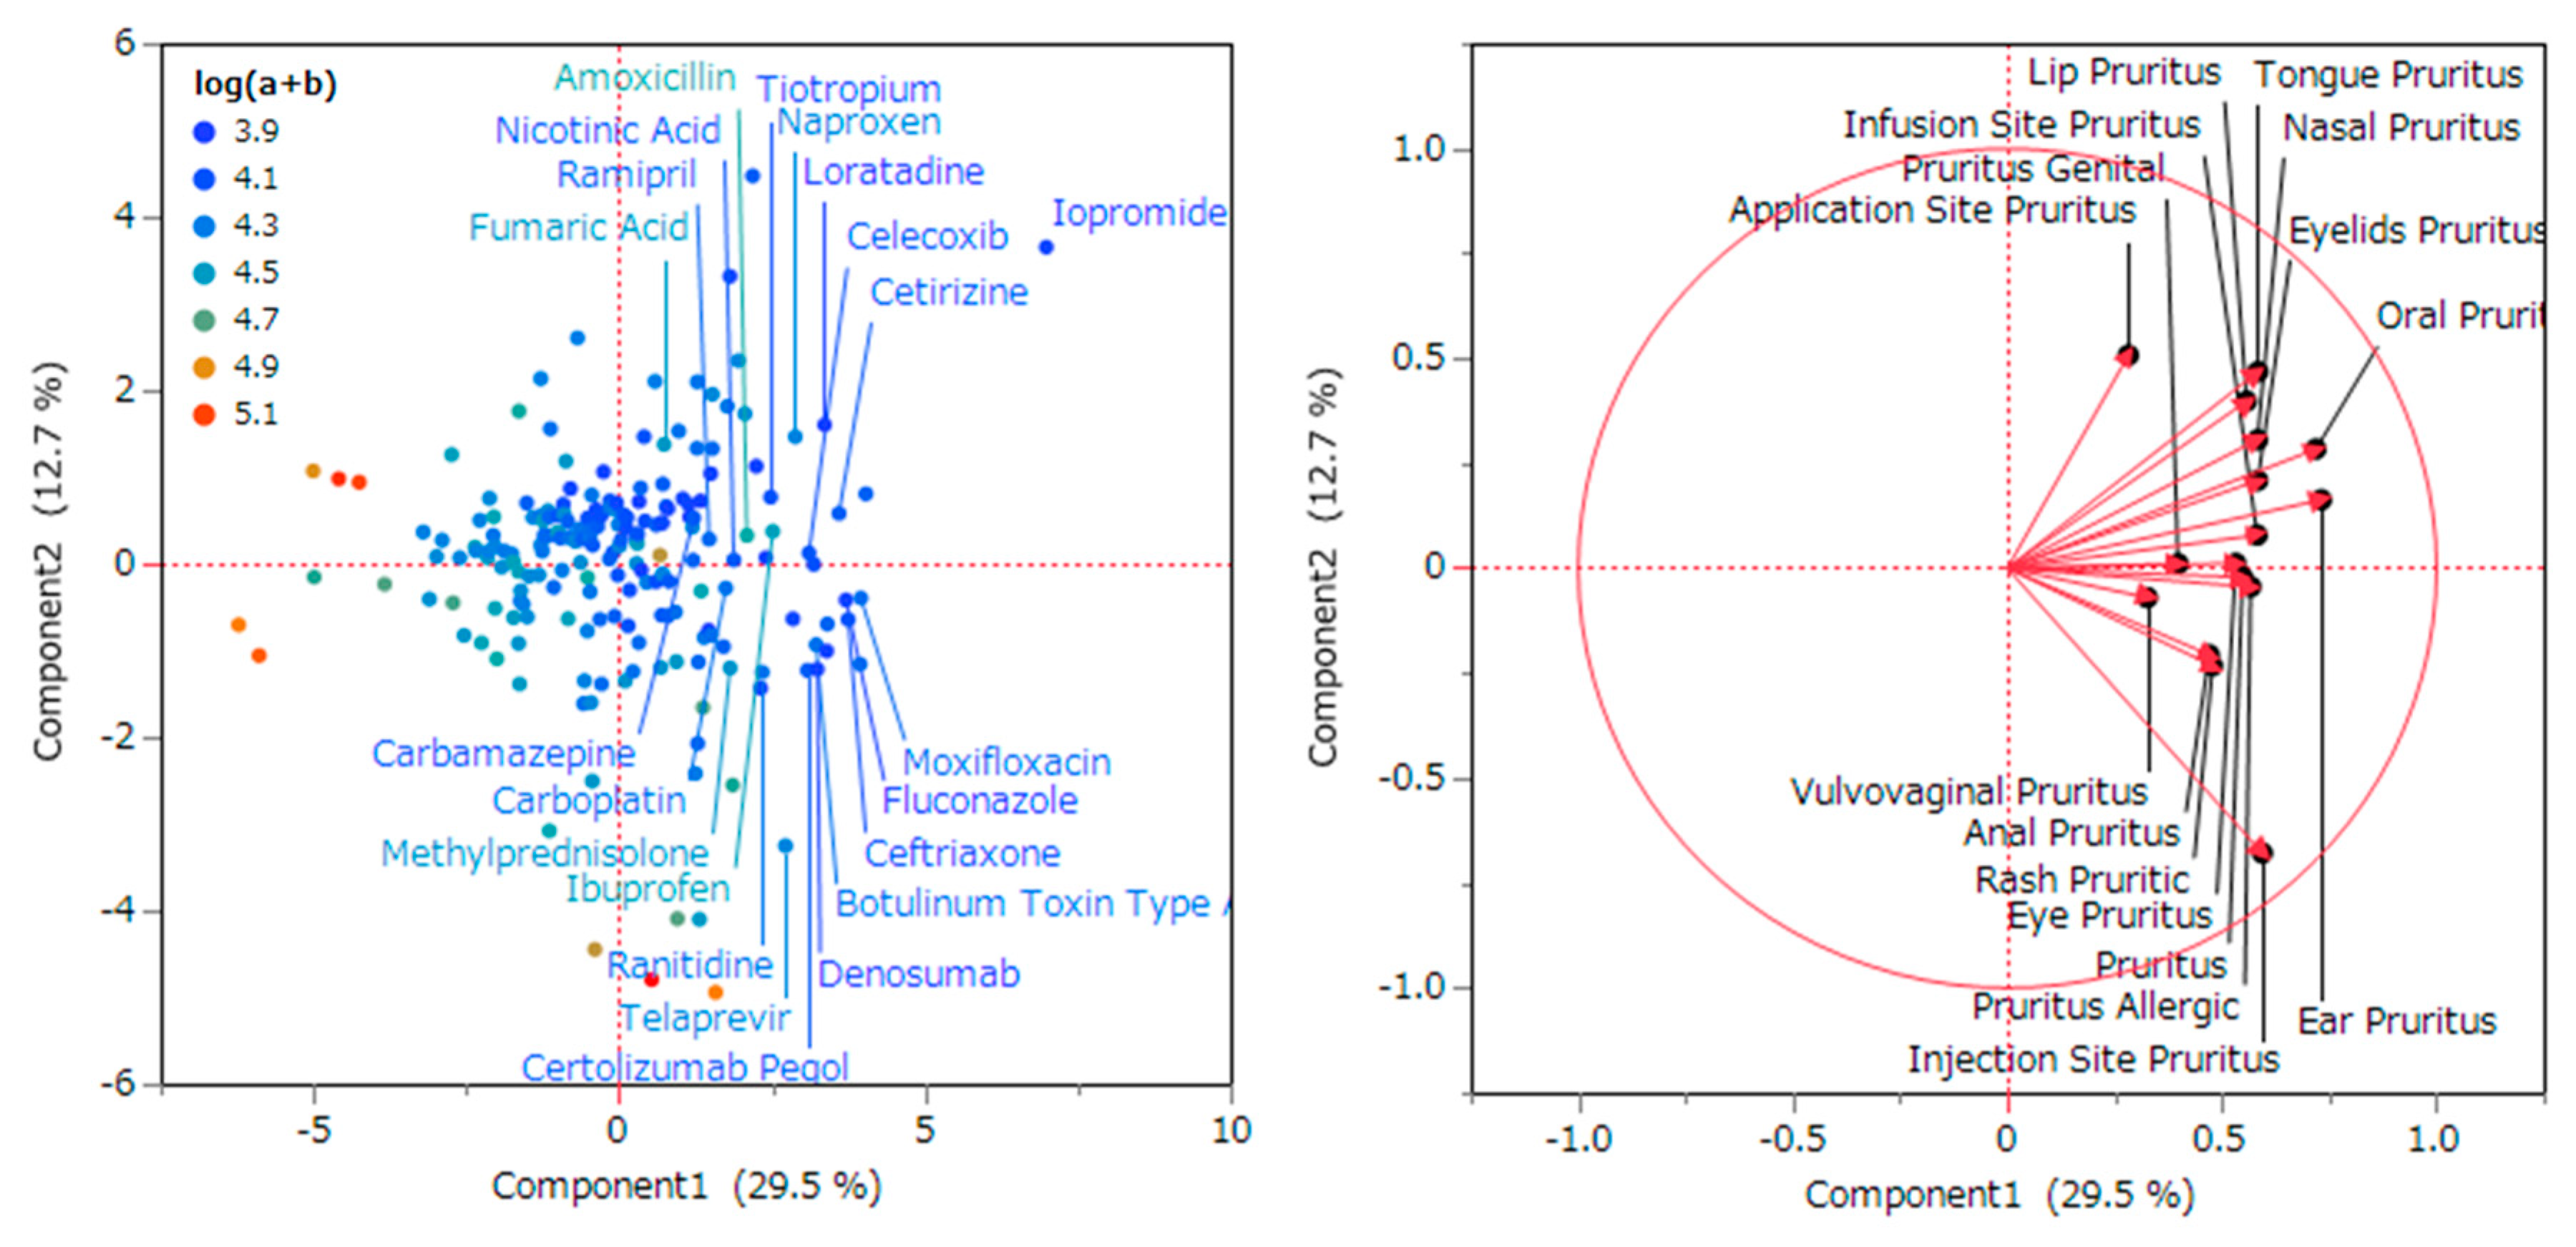
The principal components’ contribution consisted of 29.5% for the first, 12.7% for the second, and 10.9% for the third. The contribution ratio signifies the proportion of each principal component’s variance relative to the total variance [9]. Subsequently, the relationship between the recommended terms linked to pruritus and the principal components was depicted in a plot featuring a loading vector for each recommended term.
Score plots and loading plots were generated, positioning the first principal component on the X-axis and the second principal component on the Y-axis. All vectors representing recommended pruritus-related terms on the X-axis demonstrated a positive correlation. Additionally, in the univariate analysis, the first principal component exhibited a correlation with the ordinary logarithm of the number of reports (a + b). Conversely, primary drug classes positively correlated with the first principal component encompassed systemic antibacterials, anticancer drugs, ophthalmic drugs, immunosuppressive drugs, and systemic antivirals (Table 3). Drugs exhibiting a strong positive correlation with the first principal component, along with their corresponding factor loadings, included the contrast agent iopromide (9.40), the systemic antihistamine loratadine (4.71), the systemic antibacterial agent ceftriaxone (4.34), the systemic antibacterial and ophthalmic agent moxifloxacin (4.26), and the anti-inflammatory and anti-rheumatic, gynecological and topical for joint and muscle pain naproxen (4.22). Factor loadings are correlation coefficients that express the strength of the correlation between the principal components and individual variables [8]. A higher absolute value indicates a stronger correlation.
This presents the drugs within the plot that exhibit a positive correlation with the first principal component featured in the (a) score plot depicted in Figure 3. The arrangement is organized by drug effects according to the ATC of KEGG.
Figure 3. Relationship between pruritus-related adverse effects and drugs through principal component analysis.(a) Score plot and (b) loading plot. (a) The score plot illustrates the correlation between drugs and the initial and second principal components. Each data point corresponds to a specific drug. (b) Each loading vector signifies a particular side effect. The length of the loading vector reflects the degree of correlation between side effects and the principal components.
Preprints 82174 g003
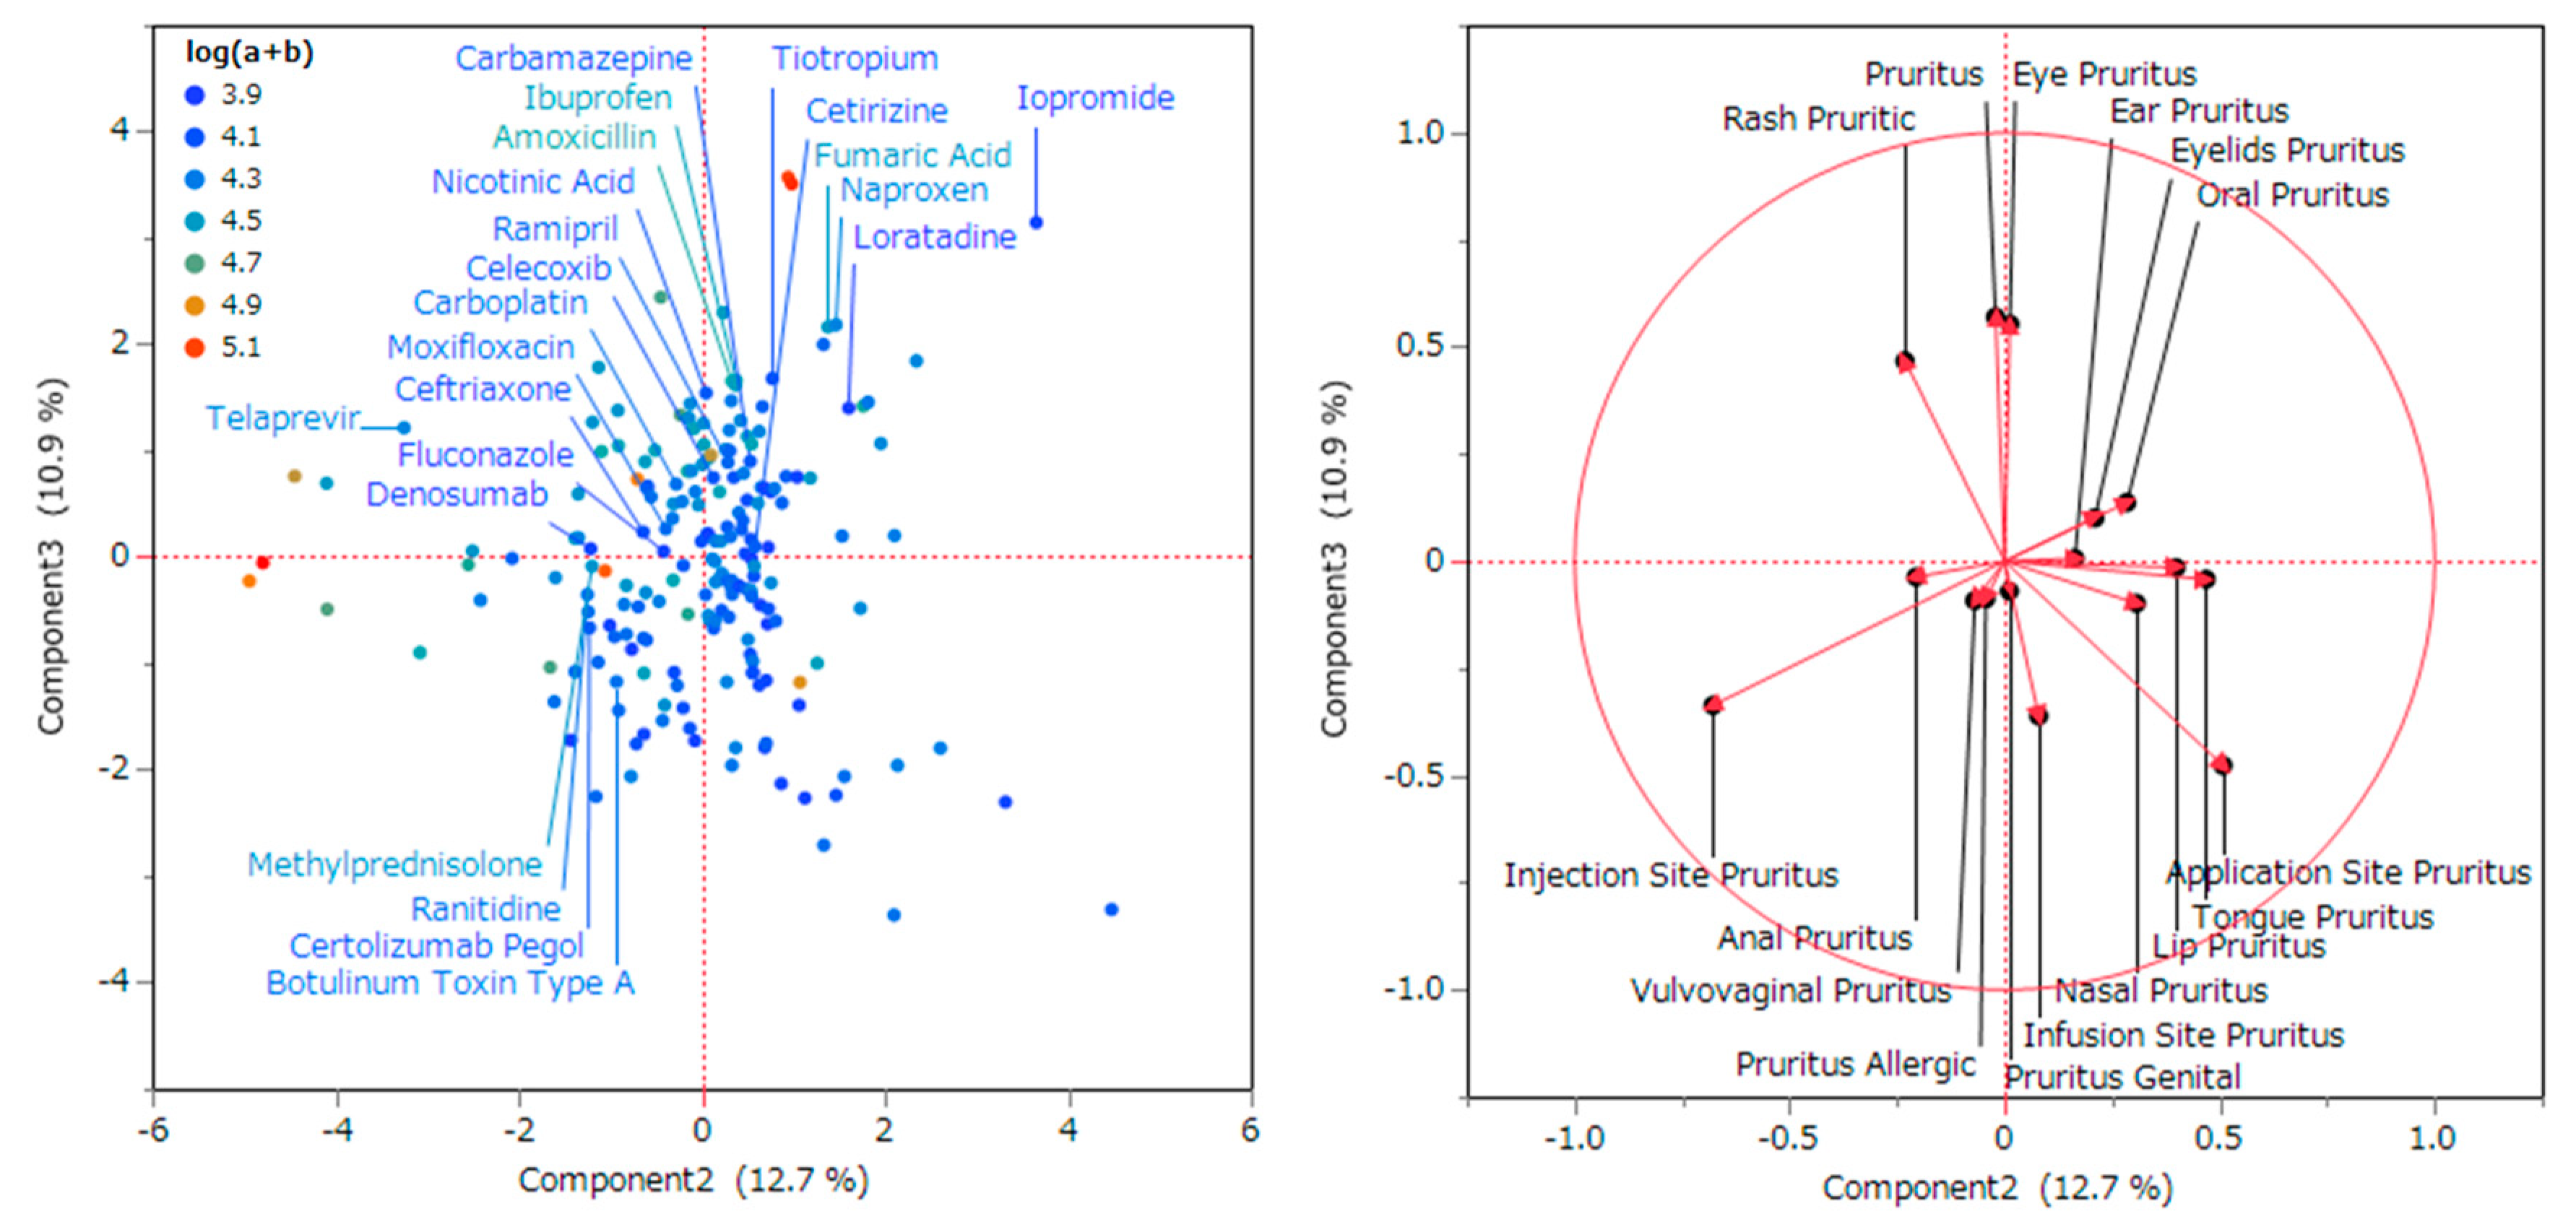
Subsequently, score and loading plots were generated, positioning the second principal component on the X-axis and the third principal component on the Y-axis. The adverse effects and their respective factor loadings associated with each variable that correlated positively with the second principal component included application site itchiness (0.50767), tongue itchiness (0.46828), lip itchiness (0.39825), nose itchiness (0.30621), and oral itchiness (0.28397). Conversely, adverse effects and their factor loadings linked to variables negatively correlated with the second principal component comprised injection site itch (-0.67840) and erythema scratchiness (-0.23182).
In relation to the third principal component, adverse effects and their associated factor loadings for each variable positively correlated with the third principal component encompassed itching (0.56996), itchy eyes (0.55315), and itchy erythema (0.46732). Conversely, adverse effects and their factor loadings linked to variables negatively correlated with the third principal component included application site itch (-0.47643), injection site itch (−0.36073), and injection site itch (−0.33621).
Figure 4. Principal component analysis of the relationship between pruritus-related adverse effects and drugs.(a) Score plot and (b) loading plot. The (a) score plot illustrates the correlation between each drug and the second and third principal components. Each data point corresponds to a specific drug. (b) Each loading vector denotes specific side effects. The magnitude of the loading vector reflects the intensity of the correlation between side effects and the principal components.
Preprints 82174 g004

2.5. Characteristics of the Adverse Event Related to Pruritus Using Hierarchical Clustering

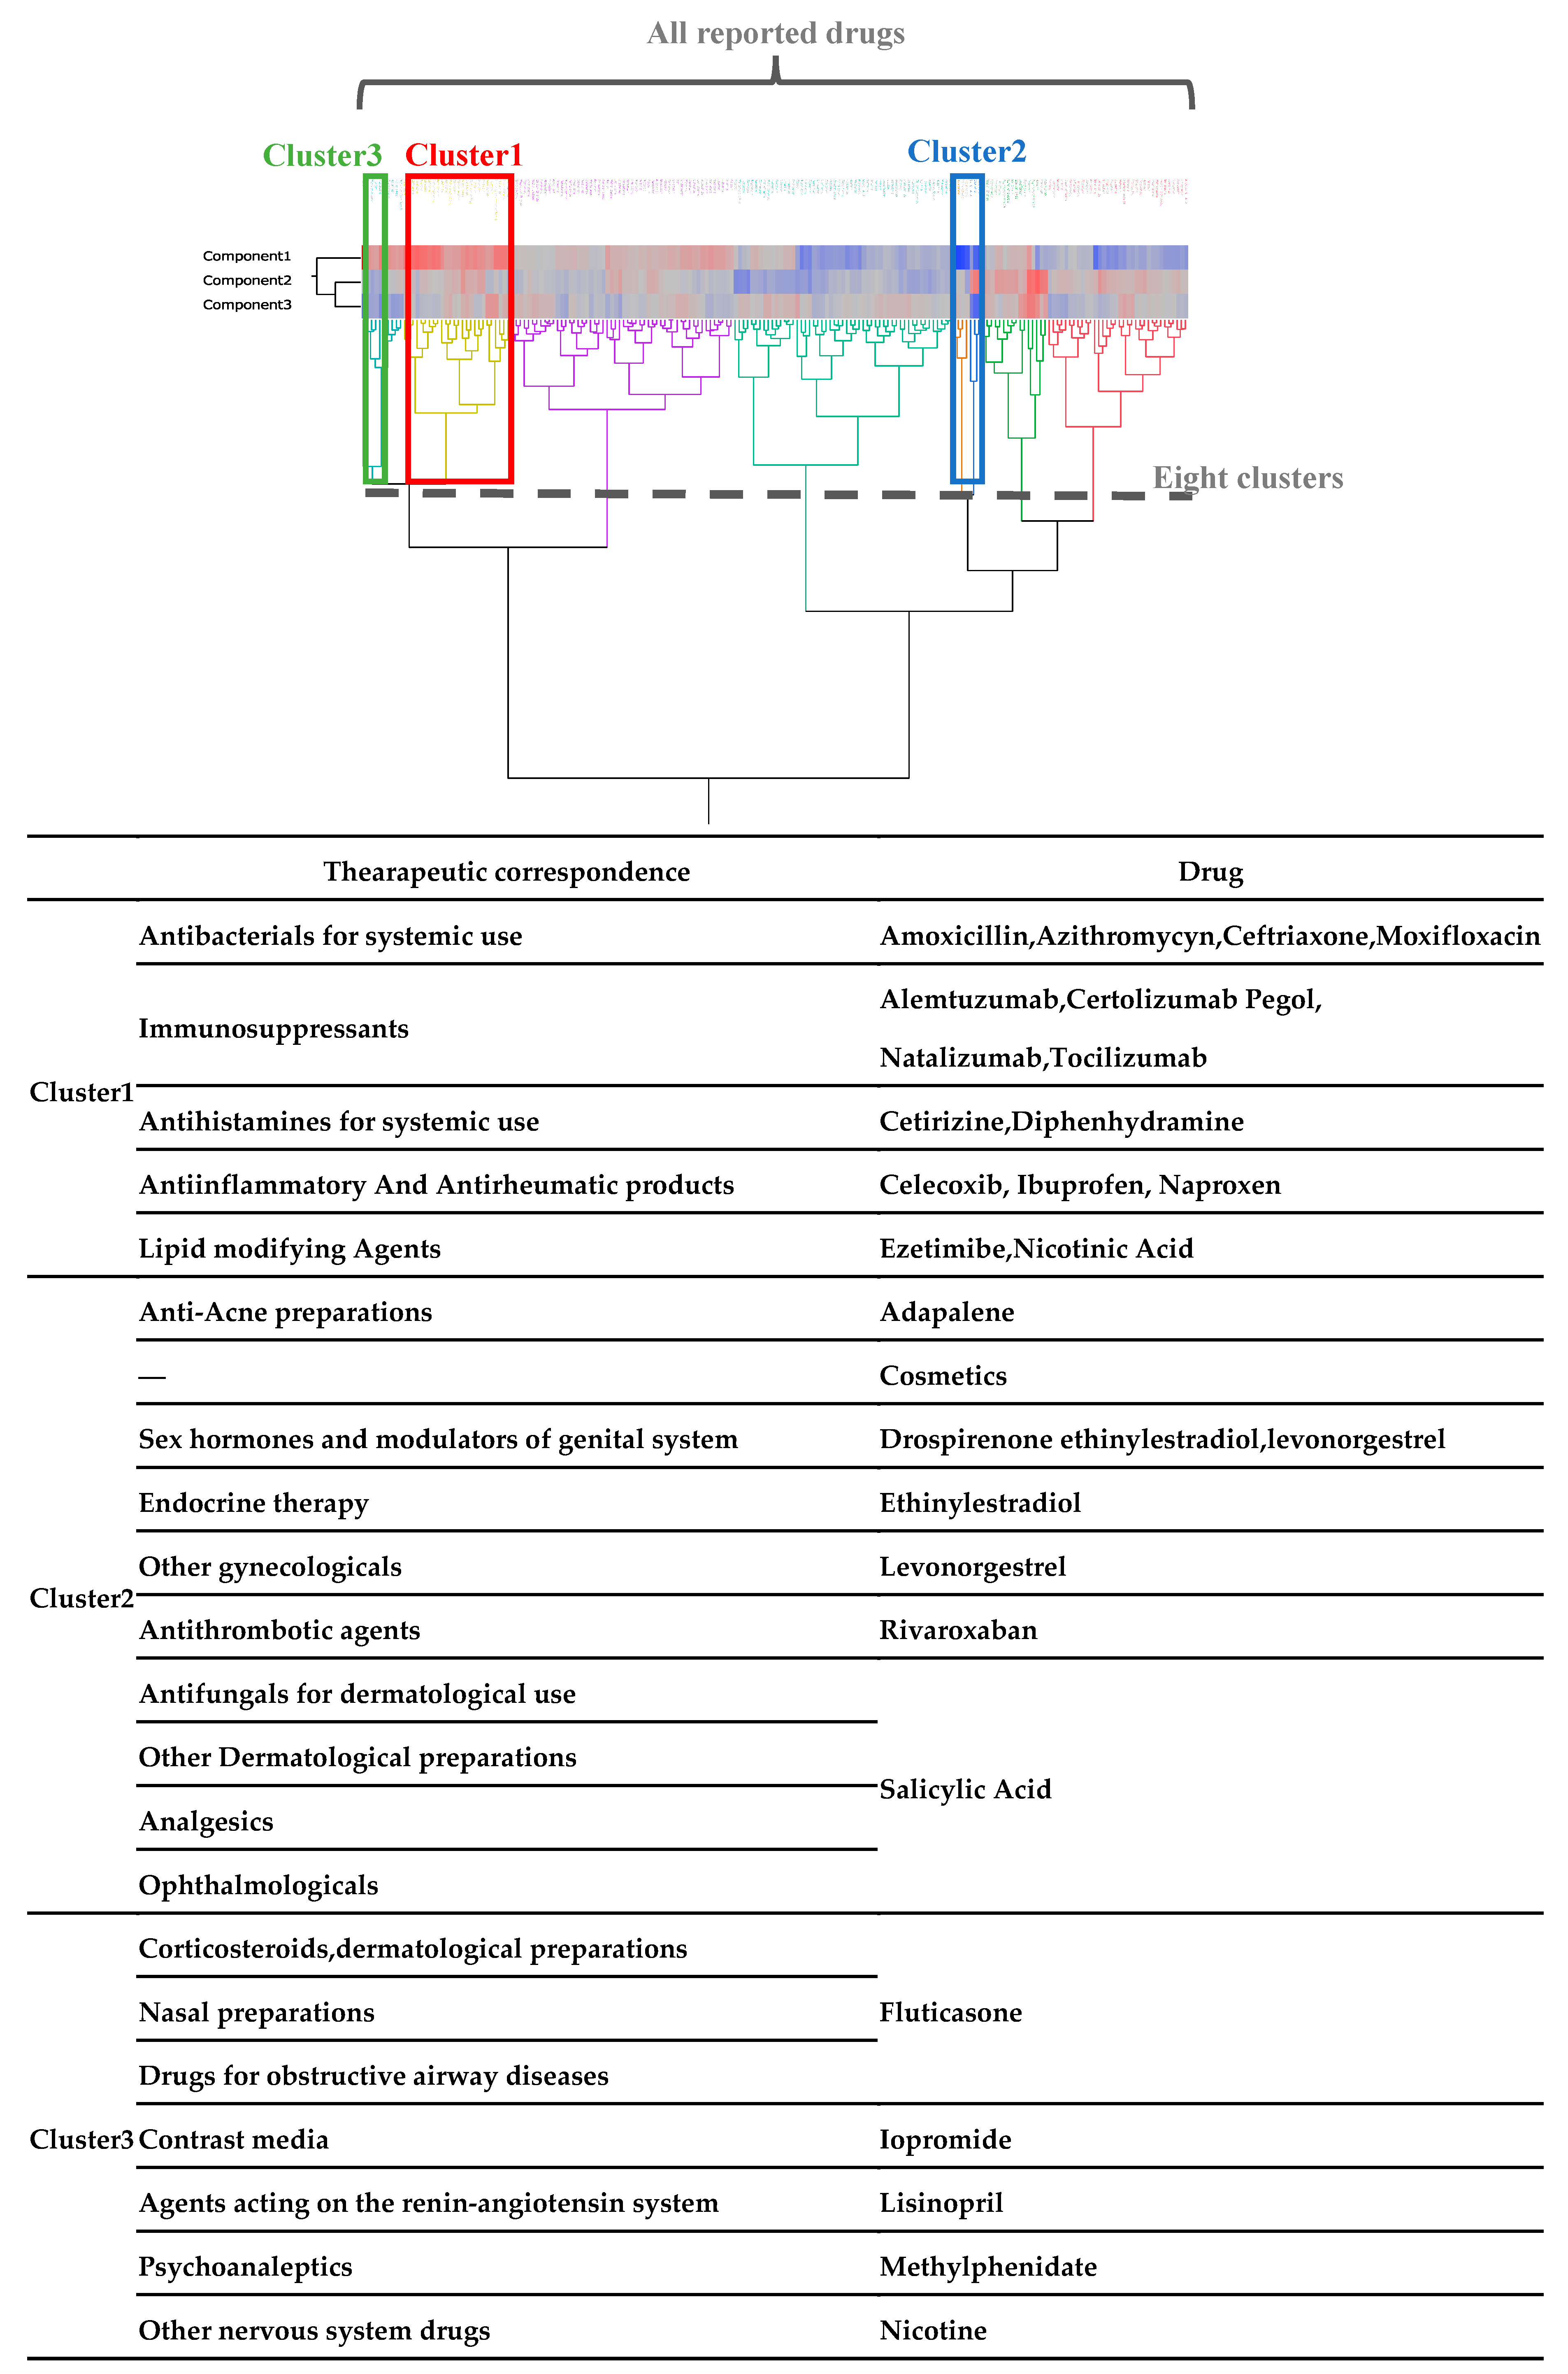
From the hierarchical cluster analysis’s dendrogram, three distinct clusters emerged. Within cluster 1 (marked in red boxes), the first principal component demonstrated a robust positive correlation with systemic antibacterials, immunosuppressants, systemic antihistamines, anti-inflammatory and anti-rheumatic drugs, and lipid-modifying agents.
In cluster 2 (marked in blue boxes), the first principal component exhibited a pronounced negative correlation with anti-acne preparations, cosmetics, agents for modulating sex hormones and the reproductive system, endocrine therapies, other gynecological drugs, anti-acne preparations, antithrombotic drugs, and dermatological antifungal drugs.
Cluster 3 (indicated by the green box) encompasses a group marked by a positive correlation with the first principal component, a negative correlation with the second principal component, and a negative correlation with the third principal component. The drugs within this group encompass fluticasone, methylphenidate, nicotine, iopromide, and lisinopril.
Figure 5. Classification of drugs related to principal components using hierarchical cluster analysis.
Preprints 82174 g005
The hierarchical tree diagram depicts the interrelation among drugs linked to the initial three principal components. The diagram is divided into eight clusters delineated by dashed lines. The color gradient segregates the loading values of the principal components into a spectrum from red to gray to blue, denoting ascending levels of loading values. Cluster 1 signifies the assortment of drugs displaying a positive correlation with the first principal component. In contrast, Cluster 2 encompasses drugs exhibiting a negative correlation with the first principal component. Meanwhile, Cluster 3 designates drugs that display a positive correlation with the first principal component, a negative correlation with the second principal component, and a negative correlation with the third principal component.

3. Discussion

3.1. Definition of Pruritus

In a general context, drug-induced pruritus is typically characterized by primary itchiness devoid of skin lesions. It comprises approximately 5% of all reported adverse drug reactions [10]. Conversely, drug-induced pruritus accompanied by skin lesions is termed secondary itching. This phenomenon is acknowledged to stem from a detrimental cycle in which itching triggers scratching behavior, resulting in skin lesions, which subsequently induce fresh itching. Discriminating between these two forms of itching is notably challenging, and past research endeavors have often amalgamated both types of itching under a broader definition. In this current study, the correct identification of the presence or absence of skin lesions for each case was unattainable. Therefore, pruritus in the present investigation was delineated by encompassing both primary and secondary forms of itchiness.

3.2. Data Cleaning

In this study, duplicate cases were eliminated. Within each data table, instances with duplicate combinations of values in columns necessary for the analysis were filtered out, retaining only cases with distinct value combinations in the requisite columns. In simpler terms, solely cases featuring distinct value combinations in columns essential for analysis were extracted. The indispensable columns for analysis encompassed patient ID and adverse event date in the Demographic table; patient ID, drug name, and drug-specific number of the case in the Drug table; patient ID, primary disease, and drug-specific number of the case in the Indication table; patient ID and primary disease in the Reaction Patient ID and name of the adverse event in the Reaction table; patient ID and unique drug number of the case in the Therapy table; and initiation date of medication and date of onset of adverse event in the Therapy table.

3.3. Drug-Induced Pruritus and Patient Characteristics

Patients who reported experiencing pruritus were frequently observed to be of the female gender, significantly younger, and with a higher body weight compared to non-pruritic patients. Similar results were also evident in the context of pruritus associated with psoriasis [11]. An earlier study by Anil Gulsel Bahali et al. conducted a retrospective cross-sectional analysis involving 880 patients with psoriasis, revealing a notably higher prevalence of pruritus among women. Among the female participants, 324 exhibited pruritus while 160 did not (P = 0.005); for males, 229 experienced pruritus and 167 did not. The psoriasis patients with pruritus were noted to possess a considerably elevated Body Mass Index (BMI) in comparison to those without pruritus (mean BMI: 28.2±7.0 for pruritic individuals, 27.2±6.3 for non-pruritic individuals; P = 0.025). However, Bahali et al.’s study yielded contrasting results concerning age in comparison to the present study. Their findings indicated that there was no significant age disparity between psoriasis patients with and without pruritus (mean age of pruritic patients: 43.6 ± 16.7 years, mean age of non-pruritic patients: 44.2 ± 16.5 years, P = 0.649). It’s important to consider that the study is conducted with a substantial number of participants, potentially contributing to statistically significant differences in gender, BMI, and age. Additionally, Bahali et al.’s research was retrospective and observational, which might have introduced biases in subject selection. Hence, there is a requirement for prospective follow-up studies, such as cohort studies, to ensure more accurate and reliable findings.

3.4. Characteristics of Pruritus-Inducing Drugs

In the present study, the primary drugs inducing pruritus encompassed ophthalmic drugs, systemic antibacterials, contrast media, dermatological antifungals, dermatological preparations, corticosteroids, gynecological anti-infectives and disinfectants, antineoplastics, and immunosuppressive drugs. Earlier studies also highlighted potential pruritogenic drugs, including antihypertensive drugs, anti-arrhythmics, anticoagulants, antidiabetic drugs, lipid-lowering drugs, antibiotics and chemotherapy, psychotropic drugs, antiepileptic drugs, contrast media, cell growth inhibitors, cytokine growth factors, monoclonal antibodies, and plasma bulking agents [1]. Among the drug classes reported in this study, antibacterial agents, contrast agents, and antifungal agents overlapped with the findings from these prior studies. Notably, hydroxyethyl starch (HES) despite having a confirmed pruritus mechanism, wasn't recognized as an inducer of pruritus in this current study [12].
Within the top five drug classes, the drugs with the most elevated reported odds ratios and their corresponding values were bimatoprost (6.46), oritavancin (10.15), ioxiran (8.66), selenium disulfide (8.59), and minoxidil (7.00). Furthermore, the single drug with the highest reported odds ratio value, which wasn't classified within the main drug classes, was obeticholic acid (15.79).
Bimatoprost is an eye drop employed for diminishing intraocular pressure in patients with open-angle glaucoma and ocular hypertension and to cosmetically treat anemia. Structurally resembling prostaglandin F2α, it functions as an agonist, activating the prostaglandin FP receptor. This stimulation leads to elevated levels of matrix metalloproteinases (MMPs) in the ciliary muscle and sclera. These MMPs facilitate the degradation of collagen within the extracellular matrix, thereby enhancing uveoscleral outflow and reducing intraocular pressure. While they are implicated in regenerating the outer papilla root sheath and the entire hair follicle, it remains uncertain if bimatoprost’s effects are mediated through this pathway. To the best of our knowledge, no reports exist regarding the mechanism of action of bimatoprost that establish a connection with pruritus. Nevertheless, a four-year safety study has indicated that bimatoprost ophthalmic solution triggers ocular pruritus in 9% of patients. For dermal application, the incidence of ocular pruritus was reported to be below 4% [13].
Oritavancin diphosphate (Oritavancin) is a semi-synthetic, long-acting lipoglycopeptide (LGP) with potent activity against Gram-positive pathogens such as methicillin-resistant Staphylococcus aureus. It operates through three distinct mechanisms: (i) obstructing cell wall synthesis (transglycosylation) by binding to the peptide stems of peptidoglycan precursors, (ii) hampering the peptide transfer (cross-linking) phase of cell wall formation by binding to peptide cross-links within the cell wall, and (iii) disrupting bacterial membrane integrity, leading to depolarization, heightened permeability, and swift cell demise [14].While our exploration did not reveal any reports suggesting a connection between pruritus and this mechanism of action, pruritus did emerge as an adverse event during a phase III international multicenter randomized double-blind clinical trial. In this clinical investigation, conducted to evaluate the efficacy and safety of inpatient treatment for acute bacterial skin and skin structure infections, subjects were monitored over a span of 60 days to assess the safety and tolerability of a prolonged half-life of distribution, partly attributed to the increased protein binding of oritavancin. Notably, pruritus manifested as an injection-related reaction during the trial, which subsequently resolved upon reducing the injection rate [15].
Ioxiran is capable of intravenous administration to facilitate excretory urography and contrast-enhanced computed tomography scans of both the head and body. This non-ionic monomeric substance possesses low osmolarity and was developed with the aim of enhancing the safety and tolerance of X-ray contrast agents [16]. While our exploration did not uncover any reports detailing ioxiran’s mechanism of action in relation to pruritus, instances of pruritus have been documented as minor repercussions of contrast media usage. It’s noteworthy that these minor side effects, including pruritus, generally exhibit short duration, are self-limiting, and seldom necessitate specific intervention [17].
Selenium disulfide (SeS2) is an effective treatment option for dandruff, a milder manifestation of seborrhoeic dermatitis. It exhibits antifungal properties against Malassezia furfur and also demonstrates the ability to inhibit the growth of Staphylococcus epidermidis in vitro. Shampoos containing SeS2 often incorporate salicylic acid, renowned for its keratolytic properties, which aids in reducing scalp dandruff. Scalp dandruff, a characteristic feature of seborrheic dermatitis, involves mild to moderate flaking of the scalp, leading to a greasy, flaky appearance accompanied by pruritus. In a randomized, double-blind, parallel-group study, participants who used a 1% salicylic acid shampoo containing selenium disulfide subsequent to initial ketoconazole treatment experienced a decrease in pruritus (average score decreased from 2.16 to 0.81, P < 0.0004). Conversely, subjects who used selenium disulfide shampoo after initial ketoconazole treatment displayed no additional reduction in pruritus compared to after the initial treatment (average score increased from 1.57 to 1.89, P = 0.3496). The observed variation in effectiveness is believed to arise from SeS2 not only reducing Malassezia spp. levels, but also from the concurrent presence of the keratolytic agent salicylic acid, which significantly reduced Staphylococcus spp. [18]. The results of this previous study suggest that SeS2 may not contribute to the reduction of pruritus on its own. Therefore, future intervention studies with and without SeS2 should determine its association with pruritus.
Topical minoxidil serves as a remedy for male and female pattern baldness, encompassing androgenetic alopecia. Proposed mechanisms of action encompass vasodilation, anti-inflammatory properties, stimulation of the Wnt/β-catenin signaling pathway, and antiandrogenic effects. While our exploration yielded no reports linking pruritus to the mechanism of action, solutions containing minoxidil have previously been implicated in causing scalp pruritus. In a patch test, it was observed that among 11 patients, seven exhibited sensitivity to pruritus triggered by polyethylene glycol (PEG), a solubility-enhancing agent, whereas only two displayed a response to minoxidil, and two demonstrated sensitivity to both PEG and minoxidil. These findings imply that pruritus associated with minoxidil presents a lower occurrence than that with PEG, thus suggesting better tolerance for treatment-related pruritus. Additional clinical trials have also established that topical minoxidil is primarily linked to scalp pruritus. This propensity is attributed to the limited absorption of minoxidil upon topical application, leading to scalp inflammation and dandruff [19].
Obeticholic acid (OCA) medication employed in the secondary treatment of primary biliary cholangitis (PBC). OCAs have gained significance as a complementary approach to the standard utilization of ursodeoxycholic acid (UDCA), mainly due to the observation that a substantial proportion of patients, around 40%, do not witness a significant reduction in the risk of death, and gastrointestinal issues are prevalent in most patients [20]. These OCAs target the endogenous farnesoid X receptor and exhibit a molecular structure akin to the ligand kenodeoxycholic acid. The mode of action involves (i) the inhibition of bile acid synthesis, (ii) the stimulation of negative regulators of bile synthesis production, and (iii) the regulation of bile acid transporter expression. Yet, the exact reason behind OCA-induced pruritus remains elusive. Recent exploration has ventured into the hypothesis that OCAs might trigger pruritus via the endogenous opioid system [21]. This hypothesis is supported by findings demonstrating that in experimental animals, accumulated bile acids due to bile stasis activate scratching behavior through TGR5 receptors, mediated by opioids [22]. Given that OCAs also interact with TGR5, it is suggested that OCA-induced pruritus is related to opioids. Indeed, in an international double-blind, placebo-controlled trial assessing OCA monotherapy in PBC patients, notable pruritus was reported in the OCA-treated group (placebo: 35%; OCA 10 mg: 70%; OCA 50 mg: 94%); A noteworthy proportion of patients in the OCA 10 mg group (15%) and the OCA 50 mg group (38%) discontinued treatment due to pruritus. These findings affirm the dose-dependent correlation between OCA and the incidence and intensity of pruritus

3.5. Principal Component Analysis

In this study, the relationship between each side effect (Preferred Term) and the corresponding drug was assessed using principal components. Each principal component was elucidated through a loading vector representing the associated side effects.
In the context of the first principal component, all vectors corresponding to side effects displayed a positive correlation (Figure 3, right). Consequently, the first principal component was construed as an indicator of pruritus incidence. Drugs that exhibited a positive correlation with the first principal component, along with their respective drug classes, encompassed antihistamines such as loratadine (Figure 3, left). Antihistamines have increasingly been utilized as antipruritics, although their efficacy has been reported to be inadequate for certain pruritus cases. This led to the speculation that the elevated frequency of antihistamine reports might arise from false-positive reports in pruritic patients who did not respond favorably to antihistamine treatment. Essentially, instances of residual or intensified pruritus might have been reported even when loratadine was administered as a therapeutic intervention.
Regarding the second principal component, the vectors representing adverse reactions were segregated into those that exhibited positive and negative correlations. Notably, strongly positively correlated adverse reactions encompassed sensations like itching at application sites, including the tongue, lips, nose, and oral cavity. Application site itching pertains to itching experienced on body surfaces, such as the skin and mucous membranes, where the drug is applied locally. This type of itching has been reported for various medications like ciprofloxacin and calcineurin inhibitors, particularly following topical application, resulting in localized reactions on the skin and mucous membranes [1]. Furthermore, pruritus occurring in regions such as the tongue, lips, nose, and oral cavity is rooted in the mucosal epithelium [23].Thus, it was postulated that these side effects share the characteristic of originating on mucous membranes. In contrast, adverse reactions that were strongly negatively correlated included injection site pruritus and erythematous pruritus. Since injection sites are classified based on administration mode, such as epidermal, dermal interstitium, subcutaneous tissue, muscle, and vein, it was inferred that their impact on mucous membranes would be minimal [24,25]. For instance, skin reactions at injection sites occurred in about 10.3% of cases following COVID-19 vaccination, often accompanied by pruritus [26]. Erythema pruritus is a clear indication of the presence of a rash or skin lesion. Immune checkpoint inhibitor-associated skin toxicity, involving xerosis and pruritus followed by scratching (seen in 10%–30% of patients), also frequently involves the appearance of a rash [27]. Consequently, it was assumed that these side effects share the trait of manifesting on the skin’s surface.
Hence, the second principal component was interpreted as a comprehensive indicator of the location where pruritus originates. Categorizing the site of onset into mucous membranes and skin surfaces was deemed to have clinical significance. This classification holds importance in the realm of drug-induced rashes, where the involvement of mucous membranes at the onset site has been noted as a metric for clinicians to gauge the severity of the condition [28]. Since rashes are often accompanied by intense pruritus, instances where pruritus involves mucous membranes might warrant particular attention.
As for the third principal component, the vector representing adverse effects was likewise segregated into those with positive and negative correlations. Adverse reactions that exhibited strong negative correlations encompassed sensations such as itching at application sites, injection sites, and infusionsites. The term "injection" generally refers to the swift administration of a relatively small, precise drug dosage over a few seconds to a minute. On the other hand, the term "infusion" pertains to intravenous administration methods using bags and pump systems that administer drugs over a duration of minutes to hours. These side effects appeared to be more intrusive, primarily due to the use of needles in the administration process. However, preparations that induce pruritus at the application site do not typically involve the use of injection needles. Conversely, the side effects exhibiting a robust positive correlation included general itching, eye itching, and erythematous itching. Scratchiness is an encompassing side effect that incorporates other Preferred Term (PT) denoted as pruritus within this study. Therefore, it was presumed that this side effect might cover cases that could be categorized under different PT terms. Notably, these side effects appeared to be less invasive, given that the administration method did not entail the utilization of needles. Consequently, the third principal component could be construed as an indicator of invasiveness in the method of administration, manifested as a positive or negative direction. While there could be clinical significance investigating the connection between drug-induced pruritus and the method of administration, limited literature on this matter exists. Presently, the method of administration is reported as one of the risk factors associated with the development of disease in the context of penicillin allergy. From an epidemiological standpoint, it is suggested that parenteral administration is more likely to cause allergies compared to oral administration. In this study, penicillin allegy include IgE-mediated reactions, plus pruritus and/or nonurticarial skin erupions. However, it remains plausible that this observation stems from an oversight in accounting for the influence of dosage adjustments [29].
Drawing from these outcomes, a hierarchical cluster analysis was conducted to further elucidate the relationship between each primary ingredient and the respective drug.

3.6. Hierarchical Cluster Analysis

Utilizing hierarchical cluster analysis, the dataset was partitioned into distinct groups sharing similarities. In this investigation, a total of 200 drugs underwent division based on their correlation with the three principal components, followed by an assessment of the traits exhibited by these clusters.
Clusters with a strong positive correlation to the first principal component (in red boxes) included systemic antibacterials, immunosuppressants, systemic antihistamines, and anti-inflammatory and anti-rheumatic drugs. These specific drugs were deemed to correspond with the reported prevalence of pruritus, given that the first principal component can be interpreted as an indicator of the reported pruritus frequency. Within this subset of drugs, those that emerged as the primary inducers of pruritus in the Volcano plot, attributed to their notably elevated odds ratios of reporting, were systemic antibacterial agents and immunosuppressive drugs. However, it’s important to note that the reported odds ratios (ROR) of these drugs could potentially be influenced by their higher reporting frequency. Given that the ROR serves as a metric comparing the pruritus induction proportion between different drugs, variations in reporting frequency might lead to under- or over-representation of the ROR value. As such, in future endeavors, it is recommended to explore the percentage of pruritus induced by systemic antimicrobials and immunosuppressive drugs using alternative methodologies that are more suitable and robust.
Clusters with a strong negative correlation for the first principal component (in blue boxes) include anti-acne preparations (adapalene), cosmetics, sex hormone and reproductive system modulators (drospirenone, ethinylestradiol levonorgestrel), endocrine therapy (ethinylestradiol), other gynecological drugs (levonorgestrel), anti-acne preparations (adapalene), antithrombotic agents (rivaroxaban), and dermatological antifungals (salicylic acid). Considering that the first principal component can be interpreted as a measure of the reported pruritus frequency, these drugs could be construed as having a relatively infrequent reported occurrence of pruritus.
Clusters displaying a positive correlation with the first principal component, a negative correlation with the second principal component, and a negative correlation with the third principal component (highlighted in green boxes) encompass fluticasone, methylphenidate, nicotine, iopromide, and lisinopril. Given that the second principal component serves as an indicator distinguishing the onset site between mucous membranes and skin surfaces, and the third principal component categorizes the administration method as either invasive or noninvasive, it can be interpreted that these drugs are more inclined to induce pruritus on the skin when administered with highly invasive administration methods.

3.7. Limitations

The study is subject to four limitations arising from the database used.
Initially, the database comprises instances acknowledged as adverse events by the individuals submitting the reports. This is founded on the aggregation of spontaneous reports originating from healthcare professionals, pharmaceutical firms, and patients. Consequently, instances of repeated reports from numerous submitters are present within the database. Furthermore, despite the recommendation by FAERS for the reporting of all suspected adverse events, it is acknowledged that limitations exist due to potential challenges in diagnosing adverse events. Notably, approximately 66% of physicians who abstained from reporting indicated their non-reporting in instances where the causal connection between the adverse event and the suspected drug was ambiguous [30]. This recognition underscores that under-reporting of adverse events stemming from such factors is a formidable challenge. Moreover, the reporting trends tend to vary over time. Emerging drugs may experience reduced reporting, while drugs garnering augmented attention in the context of adverse events may encounter elevated reporting rates. The presence of these biases poses challenges in accurately determining the denominator information for drug-induced pruritus, i.e., the total number of individuals using the drug [31,32].In our endeavor to appropriately evaluate the provocation of adverse events for each drug, we employed an imbalance analysis strategy. This approach detects a signal, represented by the ROR, which capitalizes on the imbalanced risk of adverse events for individual drugs, enabling a relative assessment [33]. Additionally, to ensure the signal’s reliability, we ensured that each case exhibited a significant P-value and featured a minimum threshold of reported instances.
Second,, the database encompassed instances with missing or erroneous cell values. As a result, we addressed this concern by excluding cases with incomplete cells and rectifying the issue. Furthermore, we tackled the analysis of patient backgrounds by establishing value ranges for cells and eliminating cases with outlying cell values.
Third, the feasibility of analysis varies depending on the specific context. Cases involving multiple drugs make it challenging to pinpoint the exact drug responsible for the adverse event [34].While fatal adverse events undergo verification by the FDA, other adverse events are entered based on the reporter’s discretion, potentially leading to suspected adverse events being false positives.
Fourth, while this analysis constitutes a risk assessment for patients globally reporting adverse reactions, an inherent bias exists in the reporting frequency across different countries [35]. Hence, future endeavors should undertake comprehensive studies encompassing diverse or restricted populations, considering variations in patient demographics like ethnicity and medical history.

4. Materials and Methods

4.1. Data Source

In this investigation, the FDA Adverse Event Reporting Systems (FAERS) database was employed, which constitutes the US FDA repository of reports concerning adverse events arising from globally used medications, encompassing Japan as well. Notably, this database boasts a higher accumulation of aggregated cases in comparison to other repositories of adverse event reports [36]. The dataset comprises inputs from healthcare professionals and spontaneous reports furnished by patients. Eida in 2011 demonstrated the utility of data mining algorithms in detecting signals within the FAERS dataset, with the ROR emerging as the most prominent indicator. To commence, the FAERS database was procured at no cost from the FDA’s official website [37]. Subsequently, data cleansing procedures were executed, yielding a refined database tailored for analytical purposes. The study extracted a substantial count of 11,810,863 adverse drug events recorded from the first quarter of 2004 up to the initial quarter of 2020.

4.2. Definitions of Pruritus-Related Adverse Events

The adverse event descriptors found within the FAERS database are originated from the System Organ Class (SOC) delineated in the Medical Dictionary for Regulatory Activities (MedDRA), an international compendium of pharmaceutical terminologies. These SOCs serve as an integral component of the MedDRA hierarchy and constitute the uppermost tier of concepts that indicate the organs wherein the fundamental PT expressions are categorized. Every PT is associated with one or more corresponding SOCs [38].In the present investigation, PTs associated with pruritus were exhaustively extracted from MedDRA version 23.0. Specifically, terms containing "prurtus," "pruritic," "itch," or "itching" were considered. Among these, PTs encompassing 37 terminologies implying itching were classified as "pruritus," which constitutes the term under scrutiny within this study (refer to Table 7).

4.3. Preparation of Data Table for Analysis

The study relied on the database extracted from the FDA Adverse Event Reporting System(FAERS), which was selected due to its extensive dataset[39]. The FAERS is comprised of seven distinct data tables: (1) Demographic table, (2) Drug table, (3) Indication table, (4) Outcome table, (5) Reaction table, (6) Report sources table, and (7) Therapy table. The figure shows the items included in each table and the number of reports from Q1 2004 to Q1 2020.
In this study, the analytical data tables were constructed following the methodology outlined by Kurosaki et al [40].
After the removal of incomplete data entries from each respective data table, the unique identification numbers of primary reports were cross-referenced against a demographic table featuring 11,810,863 reports, a Drug table encompassing 75,403,849 reports, a Therapy table containing 75,403,849 reports, the Therapy table housing 40,164,871 reports, and the Indication table accounting for 25,929,031 reports. These tables were amalgamated into a unified data table while eliminating instances of duplicated reports.
Subsequently, for the purpose of chronological arrangement, we gathered reports where the onset of adverse events aligned within the timeframe of medication usage. These reports were then consolidated into a Reaction table, resulting in a total of 35,393,413 entries. However, considering that drugs listed in the Drug table encompassed designations as suspect drugs, concomitant drugs, or interactions based on their involvement in adverse drug reactions, all of these categories were regarded as prospective suspect drugs. Throughout the time series, we successfully extracted 8,184,203 reports illustrating a discernible connection between drug utilization and adverse drug reactions [41]. It is worth noting that instances where drug indications were also reported as adverse events, typically due to insufficient drug efficacy, could potentially introduce spurious signals. To counter this, we meticulously identified reports where pruritus-related PTs were cited as indications (underlying diseases). Subsequently, 18,242 reports involving patients in this context were systematically removed based on case IDs. Although the potential for exclusion of non-spurious signals couldn't be completely ruled out, its influence on the computation of the ROR employed for analysis was minimal. The resulting dataset, comprising 8,165,961 reports post-elimination, constituted the foundation for the analysis.

4.4. Patient Information on Drug-Induced Pruritus

A bivariate analysis was executed employing patient particulars, such as gender, age, and weight, as explanatory factors, and itchiness as the dependent variable. Fisher’s exact test was employed for gender, a categorical variable, while Wilcoxon’s rank sum test was applied for age and weight, being continuous variables, with corresponding P values calculated. Additionally, the dataset was stratified based on gender, and for each group, the count of cases/patients, mean age accompanied by standard deviation, and mean weight along with standard deviation were computed, contingent upon the presence or absence of pruritus. However, prior to conducting these analyses, any missing values or outliers were effectively removed. In terms of age, values ranging from 0 to 130 years were retained, while all other values were identified as outliers. Similarly, for weight, values between 0 kg and 600 kg were retained, whereas all other values were categorized as outliers.

4.5. Extraction of Suspect Drugs for Pruritus Using Data Mining Methods

Signal detection within the context of a spontaneous adverse event report database constitutes a data mining approach that facilitates the inference of connections between pharmaceutical products and adverse events. This is achieved even in cases where the precise number of patients utilizing a specific medication (population) remains unknown, through the exploitation of disproportionate and relative occurrences of each adverse event [39]. This methodology enables the calculation of signal indicators. For this study, the ROR was employed, recognized as a more sensitive and less biased signal measure compared to the proportional reporting ratio.
The analysis encompassed all drugs categorized by their generic names within the FAERS database. The analysis dataset was organized based on the presence or absence of pruritus for each drug, subsequently forming a cross-tabulation table (Figure 7). Given that a 2 × 2 contingency table cannot be accurately calculated with cells containing 0 values, and small cell frequencies introduce instability in estimation, a correction was applied by adding 0.5 to all cells (Haldane Anscombe semi-correction)[42]. Subsequently, the ROR was computed (Figure 1). This ratio represents the probability of a specific drug triggering a particular adverse event in relation to the probability of another drug causing a distinct adverse event (Table 8) [39]. Signal presence was defined based on the lower limit of the 95% confidence interval of the ROR surpassing 1, determined through P values from Fisher’s exact test. Ultimately, a combination of the ROR and P-value statistics facilitated the assessment of the proportion and significance of pruritus for each drug, visualized through a Volcano plot. This method is widely recognized in the realm of bioinformatics and genomics for visualizing trends in gene expression [43].
For this study, drugs exhibiting a strong correlation with drug-induced pruritus were designated as those possessing a ROR of ≥1, a Fisher’s exact probability test P-value <0.05, and a minimum of 50 reports. These drugs were identified as demonstrating a signal associated with occurrences of induced pruritus.
The cells within the cross-tabulation encompass four distinct groups: the cohort using the suspected drug, the cohort utilizing other medications, the group experiencing pruritus, and the group not encountering pruritus (where “a” through “d” denote the respective report counts). Utilizing the mentioned formulas, the RORs alongside their corresponding 95% confidence intervals were derived.
ROR ( repoting   odds   ratio ) = a / b c / d
95 %   Confidence   Interval = exp log R O R ± 1.96 1 a + 1 b + 1 c + 1 d

4.6. Analysis of Drugs Associated with Pruritus Using Principal Component Analysis and Hierarchical Cluster Analysis
To examine the similarity in the relationship between each drug and pruritus, this study employed principal component analysis and hierarchical cluster analysis. Adverse event descriptions from the FAERS were organized into groups according to disease state and domain using a standardized MedDRA query (SMQ). Initially, 29 terms were extracted from the PT category of the MedDRA query designed for pruritus, with a minimum reported patient count (N) of 50 (Table 7). Subsequently, a 2 × 2 contingency table was generated for each of these 29 adverse event terms, contrasting the presence or absence of all medications reported in FAERS. Based on these tables, the reporting odds ratio (ROR) was computed. The calculated RORs were then transformed into natural logarithms and consolidated into a single dataset, with each adverse event term along the X-axis and each medicinal product along the Y-axis. This dataset was constructed specifically for the 200 drugs with over 10,000 adverse event reports.
Principal component analysis was conducted on this dataset using a covariance matrix. This analytical method allows for the examination of quantitative data described by multiple variables by reducing correlations between variables and condensing them into a smaller number of composite variables, while minimizing information loss [44]. Contribution rates and factor loadings for each variable were computed for each principal component. The first, second, and third principal components were used to interpret the characteristics and side effects of the medications.
Additionally, hierarchical cluster analysis was applied to visually group the adverse event terms. Hierarchical cluster analysis is an analytical technique where clusters are sequentially formed from highly similar data, visualized in a tree diagram. In this study, the Ward method, utilizing Euclidean distance with loadings derived from the principal components, was employed. The hierarchical cluster analysis resulted in the creation of three distinct clusters.

4.7. Statistical Analysis.

All statistical analyses were carried out using JMP Pro 16.2.0 (SAS Institute Inc., Cary, NC, USA), and statistical significance was determined based on a P-value threshold of less than 0.05.

5. Conclusions

This study aimed to analyze drug-induced pruritus by utilizing the FAERS database, which contains adverse event reports from various regions worldwide. Notably, this study stands as the first comprehensive effort to identify causative drugs and assess their relative risk. The implications of this study’s findings extend beyond the drugs examined, potentially applying to a wide range of other medications. The study yielded novel insights into the characteristics and trends of drugs causing pruritus, offering a valuable classification approach that considers both the onset of pruritus and the method of medication administration. Therefore, these findings hold promise for shedding light on the underlying mechanisms of drug-induced pruritus. Understanding the pathogenesis of pruritus could lead to the development of targeted prevention and treatment strategies, ultimately enhancing the quality of life for affected patients.

Author Contributions

The conceptualization of the study was carried out by Y.U. Y.U. also contributed to the methodology and software used. Y.U. and Y.N. were involved in the validation process. The formal analysis was a joint effort by Y.N. and Y.U. Y.N. and Y.U. conducted the investigation and utilized available resources. Both Y.N. and Y.U. curated the data for the study. Y.N. took the lead in preparing the original draft of the manuscript, while Y.N., M.S. and Y.U. contributed to its review and editing. Visualization tasks were handled by Y.N. and Y.U. Y.U. supervised the study. Project administration was under the responsibility of Y.U. Lastly, Y.U. secured funding for the project. All authors have thoroughly reviewed and approved the final version of the manuscript for publication.

Funding

This research received partial support from KAKENHI, granted by the Japan Society for the Promotion of Science (JSPS) (22K06707).

Institutional Review Board Statement

Not applicable.

Informed Consent Statement

Not applicable.

Data Availability Statement

The data is included within the article.

Conflicts of Interest

The authors have no conflicts of interest to declare.

References

  1. Reich, A.; Ständer, S.; Szepietowski, J. Drug-induced Pruritus: A Review. Acta Dermato-Venereologica 2009, 89, 236–244. [Google Scholar] [CrossRef]
  2. Ensslin, C.J.; Rosen, A.C.; Wu, S.; Lacouture, M.E. Pruritus in patients treated with targeted cancer therapies: Systematic review and meta-analysis. J. Am. Acad. Dermatol. 2013, 69, 708–720. [Google Scholar] [CrossRef]
  3. Ebata, T. Drug-Induced Itch Management. Curr. Probl. Dermatol. 2016, 50, 155–163. [Google Scholar] [CrossRef]
  4. Huang, A.H.; Kaffenberger, B.H.; Reich, A.; Szepietowski, J.C.; Ständer, S.; Kwatra, S.G. Pruritus Associated with Commonly Prescribed Medications in a Tertiary Care Center. Medicines 2019, 6, 84. [Google Scholar] [CrossRef]
  5. Kuraishi, Y. Methods for Preclinical Assessment of Antipruritic Agents and Itch Mechanisms Independent of Mast-Cell Histamine. Biol. Pharm. Bull. 2015, 38, 635–644. [Google Scholar] [CrossRef]
  6. Sanjel, B.; Shim, W.-S. Recent advances in understanding the molecular mechanisms of cholestatic pruritus: A review. Biochim. et Biophys. Acta (BBA) - Mol. Basis Dis. 2020, 1866, 165958. [Google Scholar] [CrossRef]
  7. Harpaz, R.; DuMouchel, W.; LePendu, P.; Bauer-Mehren, A.; Ryan, P.; Shah, N.H. Performance of Pharmacovigilance Signal-Detection Algorithms for the FDA Adverse Event Reporting System. Clin. Pharmacol. Ther. 2013, 93, 539–546. [Google Scholar] [CrossRef]
  8. Ogata, H.; Goto, S.; Sato, K.; Fujibuchi, W.; Bono, H.; Kanehisa, M. KEGG: Kyoto Encyclopedia of Genes and Genomes. Nucleic Acids Res. 1999, 27, 29–34. [Google Scholar] [CrossRef]
  9. Jolliffe, I.T.; Cadima, J. Principal component analysis: A review and recent developments. Philos. Trans. R. Soc. A Math. Phys. Eng. Sci. 2016, 374, 20150202. [Google Scholar] [CrossRef]
  10. Golpanian, R. S., Yosipovitch, G., & Dodiuk-Gad, R. P. (2022). Drug-induced pruritus without primary rash. In Drug Eruptions (pp. 211–226). Cham: Springer International Publishing.
  11. Bahali, A.G.; Onsun, N.; Su, O.; Ozkaya, D.B.; Dizman, D.; Topukcu, B.; Uysal, O. The relationship between pruritus and clinical variables in patients with psoriasis. An. Bras. de Dermatol. 2017, 92, 470–473. [Google Scholar] [CrossRef]
  12. Leunig, A.; Szeimies, R.-M.; Wilmes, E.; Gutmann, R.; Stolz, W.; Feyh, J. Klinische und elektronenmikroskopische Untersuchung zur Hörsturztherapie mit der Kombination 10% HES 200/0,5 und Pentoxifyllin [Clinical and electron microscopy study of sudden deafness treatment with the 10% HES 200/0.5 and pentoxifylline combination]. Laryngo-Rhino-Otologie 1995, 74, 135–140. [Google Scholar] [CrossRef]
  13. Huang, A. S., & Meyer, J. J. (2022). Bimatoprost Ophthalmic Solution. In StatPearls. StatPearls Publishing.
  14. Lupia, T.; De Benedetto, I.; Bosio, R.; Shbaklo, N.; De Rosa, F.G.; Corcione, S. Role of Oritavancin in the Treatment of Infective Endocarditis, Catheter- or Device-Related Infections, Bloodstream Infections, and Bone and Prosthetic Joint Infections in Humans: Narrative Review and Possible Developments. Life 2023, 13, 959. [Google Scholar] [CrossRef]
  15. Messina, J.A.; Fowler, V.G.; Corey, G.R. Oritavancin for acute bacterial skin and skin structure infections. Expert Opin. Pharmacother. 2015, 16, 1091–8. [Google Scholar] [CrossRef]
  16. The MICAD Research Team. (2006). N-(2,3-Dihydroxypropyl)-N´-(2-hydroxyethyl)-5-[N-(2,3-dihydroxypropyl)acetamido]-2,4,6-triiodoisophthalamide. In Molecular Imaging and Contrast Agent Database (MICAD). National Center for Biotechnology Information (US).
  17. Thomsen, H.; Morcos, S. Radiographic contrast media. BJU Int. 2002, 86, 1–10. [Google Scholar] [CrossRef]
  18. Massiot, P.; Clavaud, C.; Thomas, M.; Ott, A.; Guéniche, A.; Panhard, S.; Muller, B.; Michelin, C.; Kerob, D.; Bouloc, A.; et al. Continuous clinical improvement of mild-to-moderate seborrheic dermatitis and rebalancing of the scalp microbiome using a selenium disulfide–based shampoo after an initial treatment with ketoconazole. J. Cosmet. Dermatol. 2021, 21, 2215–2225. [Google Scholar] [CrossRef]
  19. Gupta, A.K.; Talukder, M.; Venkataraman, M.; Bamimore, M.A. Minoxidil: a comprehensive review. J. Dermatol. Treat. 2022, 33, 1896–1906. [Google Scholar] [CrossRef]
  20. Kowdley, K.V.; Luketic, V.; Chapman, R.; Hirschfield, G.M.; Poupon, R.; Schramm, C.; Vincent, C.; Rust, C.; Parés, A.; Mason, A.; et al. A randomized trial of obeticholic acid monotherapy in patients with primary biliary cholangitis. Hepatology 2018, 67, 1890–1902. [Google Scholar] [CrossRef]
  21. Bergasa, N.V. The pruritus of cholestasis: From bile acids to opiate agonists: Relevant after all these years. Med Hypotheses 2018, 110, 86–89. [Google Scholar] [CrossRef]
  22. Alemi, F.; Kwon, E.; Poole, D.P.; Lieu, T.; Lyo, V.; Cattaruzza, F.; Cevikbas, F.; Steinhoff, M.; Nassini, R.; Materazzi, S.; et al. The TGR5 receptor mediates bile acid–induced itch and analgesia. J. Clin. Investig. 2013, 123, 1513–1530. [Google Scholar] [CrossRef]
  23. Lycke, N. Recent progress in mucosal vaccine development: potential and limitations. Nat. Rev. Immunol. 2012, 12, 592–605. [Google Scholar] [CrossRef]
  24. Zhou, Q.; Jin, J.-F.; Zhu, L.-L.; Chen, M.; Xu, H.-M.; Wang, H.-F.; Feng, X.-Q.; Zhu, X.-P. The optimal choice of medication administration route regarding intravenous, intramuscular, and subcutaneous injection. Patient Preference Adherence 2015, 9, 923–942. [Google Scholar] [CrossRef] [PubMed]
  25. Hutin, Y., Hauri, A., Chiarello, L., Catlin, M., Stilwell, B., Ghebrehiwet, T., Garner, J., & Injection Safety Best Practices Development Group (2003). Best infection control practices for intradermal, subcutaneous, and intramuscular needle injections. Bulletin of the World Health Organization, 81(7), 491–500.
  26. Seirafianpour, F.; Pourriyahi, H.; Mesgarha, M.G.; Pour Mohammad, A.; Shaka, Z.; Goodarzi, A. A systematic review on mucocutaneous presentations after COVID-19 vaccination and expert recommendations about vaccination of important immune-mediated dermatologic disorders. Dermatol. Ther. 2022, 35, e15461. [Google Scholar] [CrossRef]
  27. Lacouture, M.; Sibaud, V. Toxic Side Effects of Targeted Therapies and Immunotherapies Affecting the Skin, Oral Mucosa, Hair, and Nails. Am. J. Clin. Dermatol. 2018, 19, 31–39. [Google Scholar] [CrossRef]
  28. Stern, R.S. Exanthematous Drug Eruptions. New Engl. J. Med. 2012, 366, 2492–2501. [Google Scholar] [CrossRef] [PubMed]
  29. Adkinsonjr, N. Risk factors for drug allergy. J. Allergy Clin. Immunol. 1984, 74, 567–572. [Google Scholar] [CrossRef] [PubMed]
  30. Hasford, J.; Goettler, M.; Munter, K.-H.; Müller-Oerlinghausen, B. Physicians' knowledge and attitudes regarding the spontaneous reporting system for adverse drug reactions. J. Clin. Epidemiology 2002, 55, 945–950. [Google Scholar] [CrossRef] [PubMed]
  31. Alomar, M.; Tawfiq, A.M.; Hassan, N.; Palaian, S. Post marketing surveillance of suspected adverse drug reactions through spontaneous reporting: current status, challenges and the future. Ther. Adv. Drug Saf. 2020, 11. [Google Scholar] [CrossRef]
  32. Sakaeda, T.; Tamon, A.; Kadoyama, K.; Okuno, Y. Data Mining of the Public Version of the FDA Adverse Event Reporting System. Int. J. Med Sci. 2013, 10, 796–803. [Google Scholar] [CrossRef]
  33. Gravel, C. A., Douros, A. (2023). Considerations on the use of different comparators in pharmacovigilance: A methodological review. British journal of clinical pharmacology, Advance online publicationpublication. [CrossRef]
  34. Poleksic, A.; Xie, L. Database of adverse events associated with drugs and drug combinations. Sci. Rep. 2019, 9, 20025. [Google Scholar] [CrossRef]
  35. Yu, R.J.; Krantz, M.S.; Phillips, E.J.; Stone, C.A. Emerging Causes of Drug-Induced Anaphylaxis: A Review of Anaphylaxis-Associated Reports in the FDA Adverse Event Reporting System (FAERS). J. Allergy Clin. Immunol. Pr. 2021, 9, 819–829. [Google Scholar] [CrossRef]
  36. Sakaeda, T.; Tamon, A.; Kadoyama, K.; Okuno, Y. Data Mining of the Public Version of the FDA Adverse Event Reporting System. Int. J. Med Sci. 2013, 10, 796–803. [Google Scholar] [CrossRef] [PubMed]
  37. FDA Adverse Event Reporting System (FAERS): Latest quarterly data. Available online: fileshttps://www.fda.gov/drugs/questions-and-answers-fdas-adverse-event-reporting-system-faers/fda-adverse-event-reporting-system-faers-latest-quarterly-data-files (accessed on 4 August 2023).
  38. Introductory Guide for Standardized MedDRA Queries (SMQs) Version 23.0 March 2020. Available online: https://admin.meddra.org/sites/default/files/guidance/file/SMQ_intguide_23_0_English.pdf.
  39. Khan, M.A.A.; Hamid, S.; Babar, Z.-U. Pharmacovigilance in High-Income Countries: Current Developments and a Review of Literature. Pharmacy 2023, 11, 10. [Google Scholar] [CrossRef] [PubMed]
  40. Kurosaki, K.; Uesawa, Y. Molecular Initiating Events Associated with Drug-Induced Liver Malignant Tumors: An Integrated Study of the FDA Adverse Event Reporting System and Toxicity Predictions. Biomolecules 2021, 11, 944. [Google Scholar] [CrossRef] [PubMed]
  41. Neha, R.; Beulah, E.; Anusha, B.; Vasista, S.; Stephy, C.; Subeesh, V. Aromatase inhibitors associated osteonecrosis of jaw: signal refining to identify pseudo safety signals. Int. J. Clin. Pharm. 2020, 42, 721–727. [Google Scholar] [CrossRef]
  42. Weber, F.; Knapp, G.; Ickstadt, K.; Kundt, G.; Glass, Ä. Zero-cell corrections in random-effects meta-analyses. Res. Synth. Methods 2020, 11, 913–919. [Google Scholar] [CrossRef]
  43. Cui, X.; A Churchill, G. Statistical tests for differential expression in cDNA microarray experiments. Genome Biol. 2003, 4, 210. [Google Scholar] [CrossRef]
  44. Zhang, Z.; Castelló, A. Principal components analysis in clinical studies. Ann. Transl. Med. 2017, 5, 351–351. [Google Scholar] [CrossRef]
Table 1. Patient background.
Pruritus Non-pruritus Sum
Average±SD Number of cases Number of patients Average±SD Number of cases Number of patients Number of cases
All data table Both gender - 86,989 57,559 - 7,309,045 1,326,056 7,396,343
Age 50.30±20.24 81,230 53,512 53.17±21.09 6,760,759 1,219,276 6,841,989
Weight 88.26±44.93 39,102 26,865 83.44±44.55 3,821,673 612,533 3,860,775
Male data table Age 52.13±20.65 26,081 16,403 55.57±21.11 2,726,069 491,447 2,752,150
Weight 91.27±44.77 13,804 8,843 86.22±45.34 1,566,742 255,369 1,580,546
Female data table Age 49.44±19.99 55,149 37,109 55.15±20.92 4,034,690 727,829 4,089,839
Weight 86.63±44.94 25,298 18,022 81.87±43.90 2,254,931 357,164 2,280,229
Table 3. Drugs positively correlated with the first principal component obtained using principal component analysis and their drug class.
Therapeutic_correspondence Drug
Antibacterials for systemic use Amoxicillin, Azithromycin, Ceftriaxone, Ciprofloxacin, Clarithromycin, Levofloxacin, Linezolid, Metronidazole, Moxifloxacin, Piperacillin, sulfamethoxazole, tazobactam, trimethoprim, vancomycin
Antineoplastic agents Carboplatin, Celecoxib, Gemcitabine, Imatinib, Nilotinib, Nivolumab, Oxaliplatin, Pazopanib, Regorafenib, Rituximab
Ophthalmologicals Aciclovir, Azithromycin, Ciclosporin, Ciprofloxacin, Diclofenac, Levofloxacin, Lidocaine, Moxifloxacin, Vancomycin
Immunosuppressants Alemtuzumab, Certolizumab pegol, Ciclosporin, Fumaric acid, Infliximab, Natalizumab, Teriflunomide, Tocilizumab, Tofacitinib
Antivirals for systemic use Aciclovir, Dasabuvir, Emtricitabine, Lamivudine, Sofosbuvir, Telaprevir, Valaciclovir
Table 7. Analysis of 37 PTs.
Preferred Term Number of patients
1 Pruritus 40618
2 Rash Pruritic 6287
3 Injection Site Pruritus 3034
4 Application Site Pruritus 2401
5 Eye Pruritus 2278
6 Vulvovaginal Pruritus 647
7 Oral Pruritus 400
8 Ear Pruritus 294
9 Eyelids Pruritus 263
10 Anal Pruritus 253
11 Pruritus Genital 195
12 Pruritus Allergic 127
13 Tongue Pruritus 124
14 Infusion Site Pruritus 122
15 Implant Site Pruritus 97
16 Nasal Pruritus 89
17 Lip Pruritus 80
18 Instillation Site Pruritus 46
19 Catheter Site Pruritus 23
20 Gingival Pruritus 14
21 Itching Scar 7
22 Administration Site Pruritus 6
23 Incision Site Pruritus 6
24 Vaccination Site Pruritus 6
25 Aquagenic Pruritus 5
26 Cholestatic Pruritus 4
27 Stoma Site Pruritus 2
28 Vessel Puncture Site Pruritus 2
29 Medical Device Site Pruritus 1
30 Papular Pruritic Eruption Of Hiv 0
31 Vascular Access Site Pruritus 0
32 Tumor Pruritus 0
33 Post Procedural Pruritus 0
34 Puncture Site Pruritus 0
35 Uraemic Pruritus 0
36 Senile Pruritus 0
37 Brachioradial Pruritus 0
Table 8. Cross-tabulation table and formula for odds ratios (ROR) reported for adverse events.
Pruritus Non-Pruritus
Suspected drug a b
Other drugs c d
Disclaimer/Publisher’s Note: The statements, opinions and data contained in all publications are solely those of the individual author(s) and contributor(s) and not of MDPI and/or the editor(s). MDPI and/or the editor(s) disclaim responsibility for any injury to people or property resulting from any ideas, methods, instructions or products referred to in the content.
Copyright: This open access article is published under a Creative Commons CC BY 4.0 license, which permit the free download, distribution, and reuse, provided that the author and preprint are cited in any reuse.
Prerpints.org logo

Preprints.org is a free preprint server supported by MDPI in Basel, Switzerland.

Subscribe

© 2024 MDPI (Basel, Switzerland) unless otherwise stated