1. Introduction
Harbin is located in the high latitude cold zone [
1]. In recent years, frost disaster has been one of the major crop disasters in the study area. Therefore, based on the meteorological data from 1961 to 2022, this study used linear fitting and Mann-Kendall mutation test to analyze the change characteristics of frost date and time in Harbin. Pearson method and multiple linear regression were used to analyze geographic factors, temperature and population density. With reference to previous studies, taking the minimum surface temperature ≤0℃ as the index of frost[
2], the date of frost formation in northern China is basically after August 1. Therefore, in this study, the first date of frost formation after August 1 is called the Frost Star Date (FSD), and the last date of frost formation before August 1 is called the Frost End Date (FED). The period between FED and FSD is called the Frost-Free Season (FFS). This article converts the date of each year into the form of a numeric symbol, that is, the January 1 diary is 1, the March 1 diary is 60, and the March 1 diary is 61 in leap years.
In recent years, as the global temperature has risen, the temperature in the 2010s has increased by 1.09 ° C compared with the mid-19th century to the late 19th century. [
3] The spatiotemporal variation of frost and the disasters caused by extreme weather have attracted wide attention from scholars around the world.Snow and ice are essential components of the global hydrological and energy cycles, and they are closely associated with the frost occurrence[
4] Frost will have an important impact on the regulation of a Municipality's reservoir, and it is an important part of the hydrological facilities, infrastructure construction, winter tourism and so on.[
5]FSD, FED and growing season length will have a certain impact on annual runoff, drought frequency, evaporation, etc.[
6] Extreme disasters can make the same plants have different access to nutrients, leading to differences in plant growth,[
7] and reproduction.[
8] Frost damage can cause great damage to wheat,[
9,
10,
11] persimmon,[
12] broad beans[
13] and other crops[
14,
15,
16,
17]. If the plant is born for a long time in the frost period, it will be greatly affected, not only the economic loss, but also the ecological environment will be greatly affected. In Europe, warming in early spring results in a "false spring", in which plants are more vulnerable to frost.[
18] Some scholars say that early spring can lead to premature development of plant organs, causing vulnerable plant organs to be exposed to cold weather, leading to greater damage to plants.[
19] In the United States, late frost can have different effects on different species of Ozark tree species, but estimating damage is difficult because there is no significant link between damage and later growth.[
20]
At the same time, frost will also affect the impact resistance of reinforced concrete beams[
21]. The result is carbonation of reinforced concrete, which reduces the durability of the original structure[
22]. Frost damage will affect the viscosity of coarse aggregate reinforced concrete and ordinary reinforced concrete.[
23,
24]. At the same time, pervious concrete is more susceptible to damage in frost conditions.[
25]
With the global warming trend, With the trend of global warming, all regions are facing the problem of increasing FFS. In 1973, the annual number of frost days in China was about 2d higher than the average from 1961 to 1990. From 1973 to 1985, the annual number of frost days was close to the average level, and the inter-annual change was very small; After 1985, the annual number of frost days decreased rapidly, and the reversal was obvious around 1992. The initial extension of FFS lagged behind the rapid increase in daily minimum temperatures by about 10 years, while the decrease in the number of annual frost days lagged by about 15 years.[
26] The contribution of altitude to frost day variation is 96-100%. The vertical gradient of frost day is about 7 days /100 m. During the period 1936-2013, the long-term trend of frost day was not significant, and the frost day change rate was basically negative, not less than -1.5 days per decade. During the most intense global warming, the frost day change rate is less than -3 days per decade and, in some cases, equal to -15 days per decade.[
27] Due to the unique topography of the Libyan Peninsula (IP), frost days vary widely, with the general trend being 0.4-1.6 days later for FSD per day and 0.42-1.29 days earlier for FED per year.[
28] In the United States from 1948 to 1999, FSD showed a trend of delay, FED showed a trend of advance, and FFS showed a trend of extension.[
29] Although the temperature in South Korea has increased year by year, frost day and FSD have not increased or delayed, and even the last frost date has been delayed by 0.5 days per year.[
30] In Japan, the first frost date is delayed by 0.224 days per year, and the last frost date is advanced by 0.228 days per year. Sites with strong winds contributed to a decrease in the temperature criterion.[
31]
So far, few efforts have been made to describe the nature of these changes in space and time, especially in relation to other variables. In this study, not only geographical factors, but also temperature and population density are analyzed and discussed. Understanding the changes of FSD,FED and FFS in Harbin is of great significance for global warming research and agricultural production. The purpose of this study is to: (1) analyze the spatio-temporal variation characteristics of FSD,FED and FFS indices in Harbin during 1961-2022; (2) explore the relationship between FSD,FED and FFS and temperature and population density in Harbin.
2. Study Area, Data Sources, and Methods
2.1. Study area
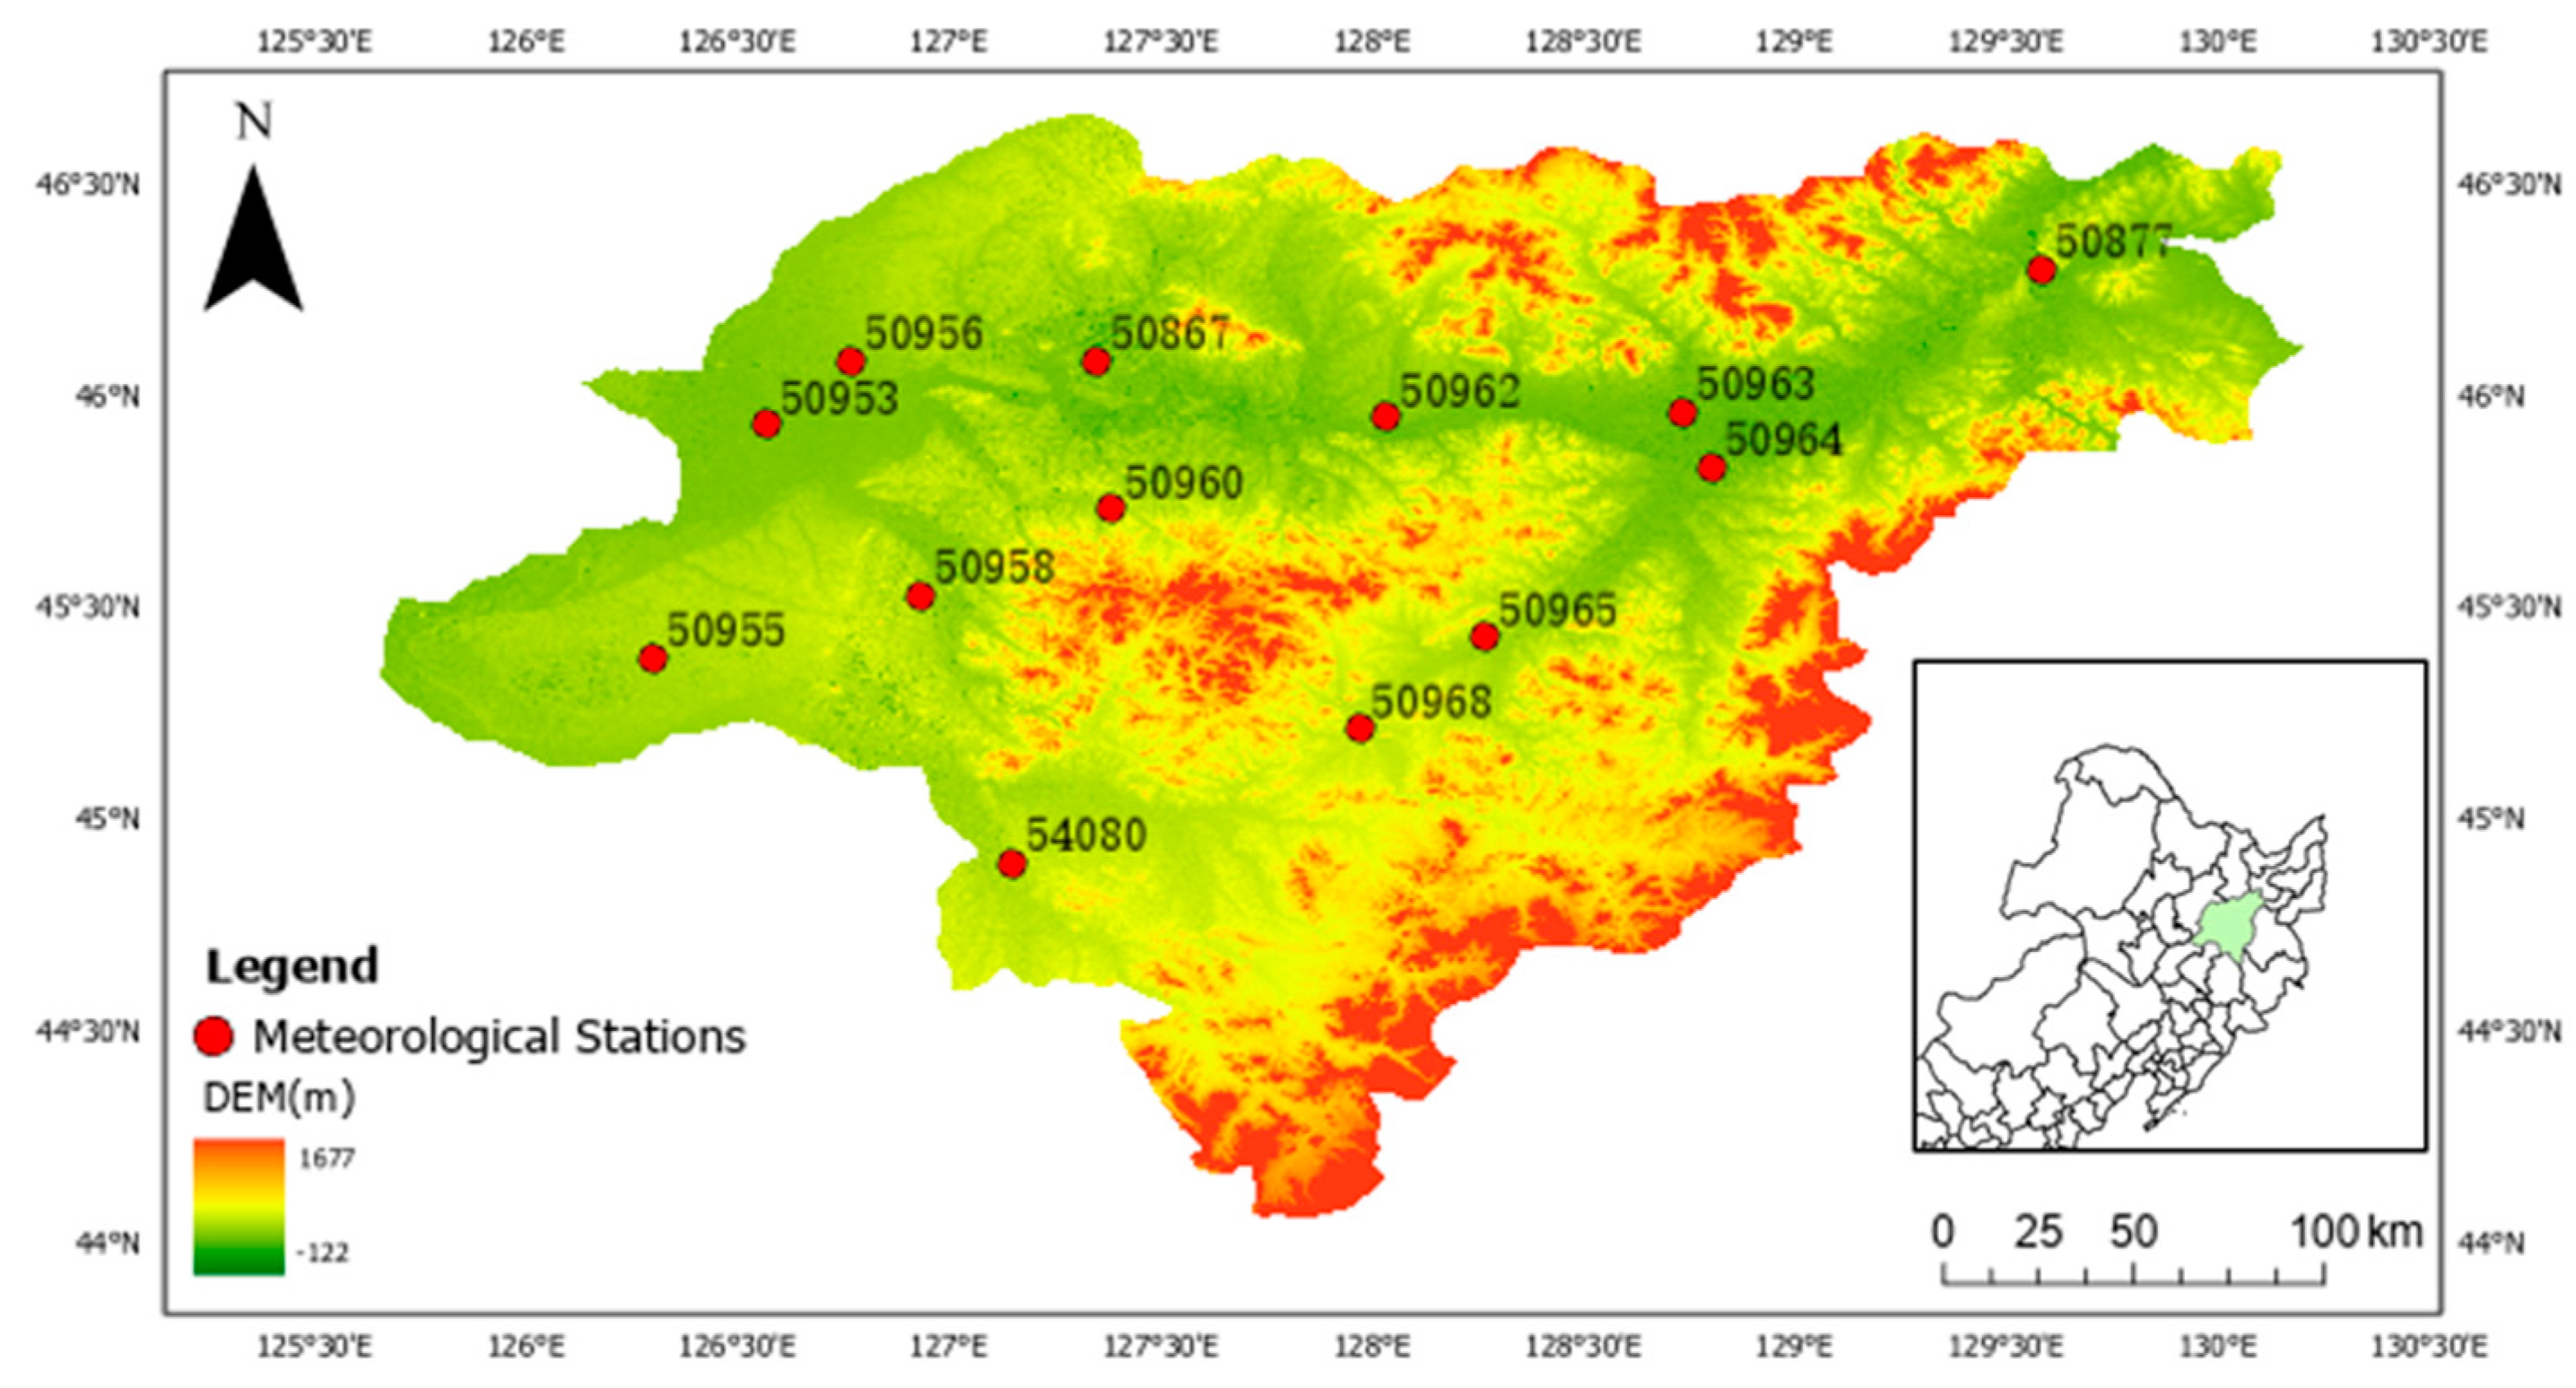
The study area is located in Harbin, Heilongjiang Province, China (125°42 '-130°10' E and 44°04 '-46°40 N) ,which is a representative Municipality of the high-latitude cold zone. It covers an area of about 53,000 square kilometers, with an average altitude of 118.3m. The climate is characterized by a mid-temperate continental monsoon, with an average annual temperature of about 4.1℃, an average annual maximum temperature of 9.6°C, an average annual minimum temperature of -2.2°C, an average annual wind speed of about 5.5 m/s, and an average annual humidity of about 70%.[
1,
32]
Figure 1 shows the geographical location of the study area, geomorphological features and the location of meteorological stations.
Table 1 shows the codes and names of each meteorological station.
2.2. Data Sources
The meteorological data used in this study are the 0-cm surface air temperatures of 13 meteorological stations in Harbin, provided by the Harbin Meteorological Bureau. This study utilizes a 30m spatial resolution digital ground model provided by the Japan Aerospace Exploration Agency (JAXA) to obtain digital elevation data (DEM) for Harbin. Population density data were obtained from seven censuses in China, of which the first through sixth census data were from the website of Scientific Data of China[
33](
http://www.csdata.org/p/574/), and the data of the seventh census were from the official website of the Harbin Municipal People's Government(
https://www.harbin.gov.cn/haerbin/c104569/202105/c01_70396.shtml).
2.3. Methods
In this study, the trend of key variables was analyzed by linear trend fitting, the significance of it was tested by Mann-Kendall mutation test, and the authenticity of mutation points was tested by pettitt method and sliding T test. Ordinary Kriging interpolation method is used to interpolate the key variables of frost from the point scale to the regional scale. Considering that the factors affecting the key variables of frost include not only latitude and longitude, but also altitude, this study takes altitude as a covariate to improve the longitude of interpolation. Pearson correlation coefficient method and multiple linear regression were utilized to calculate the correlation and regression of elevation, longitude, latitude, air temperature and population density with the key variables of frost.
3. Results
3.1. Temporal and spatial variation and mutation test of FSD
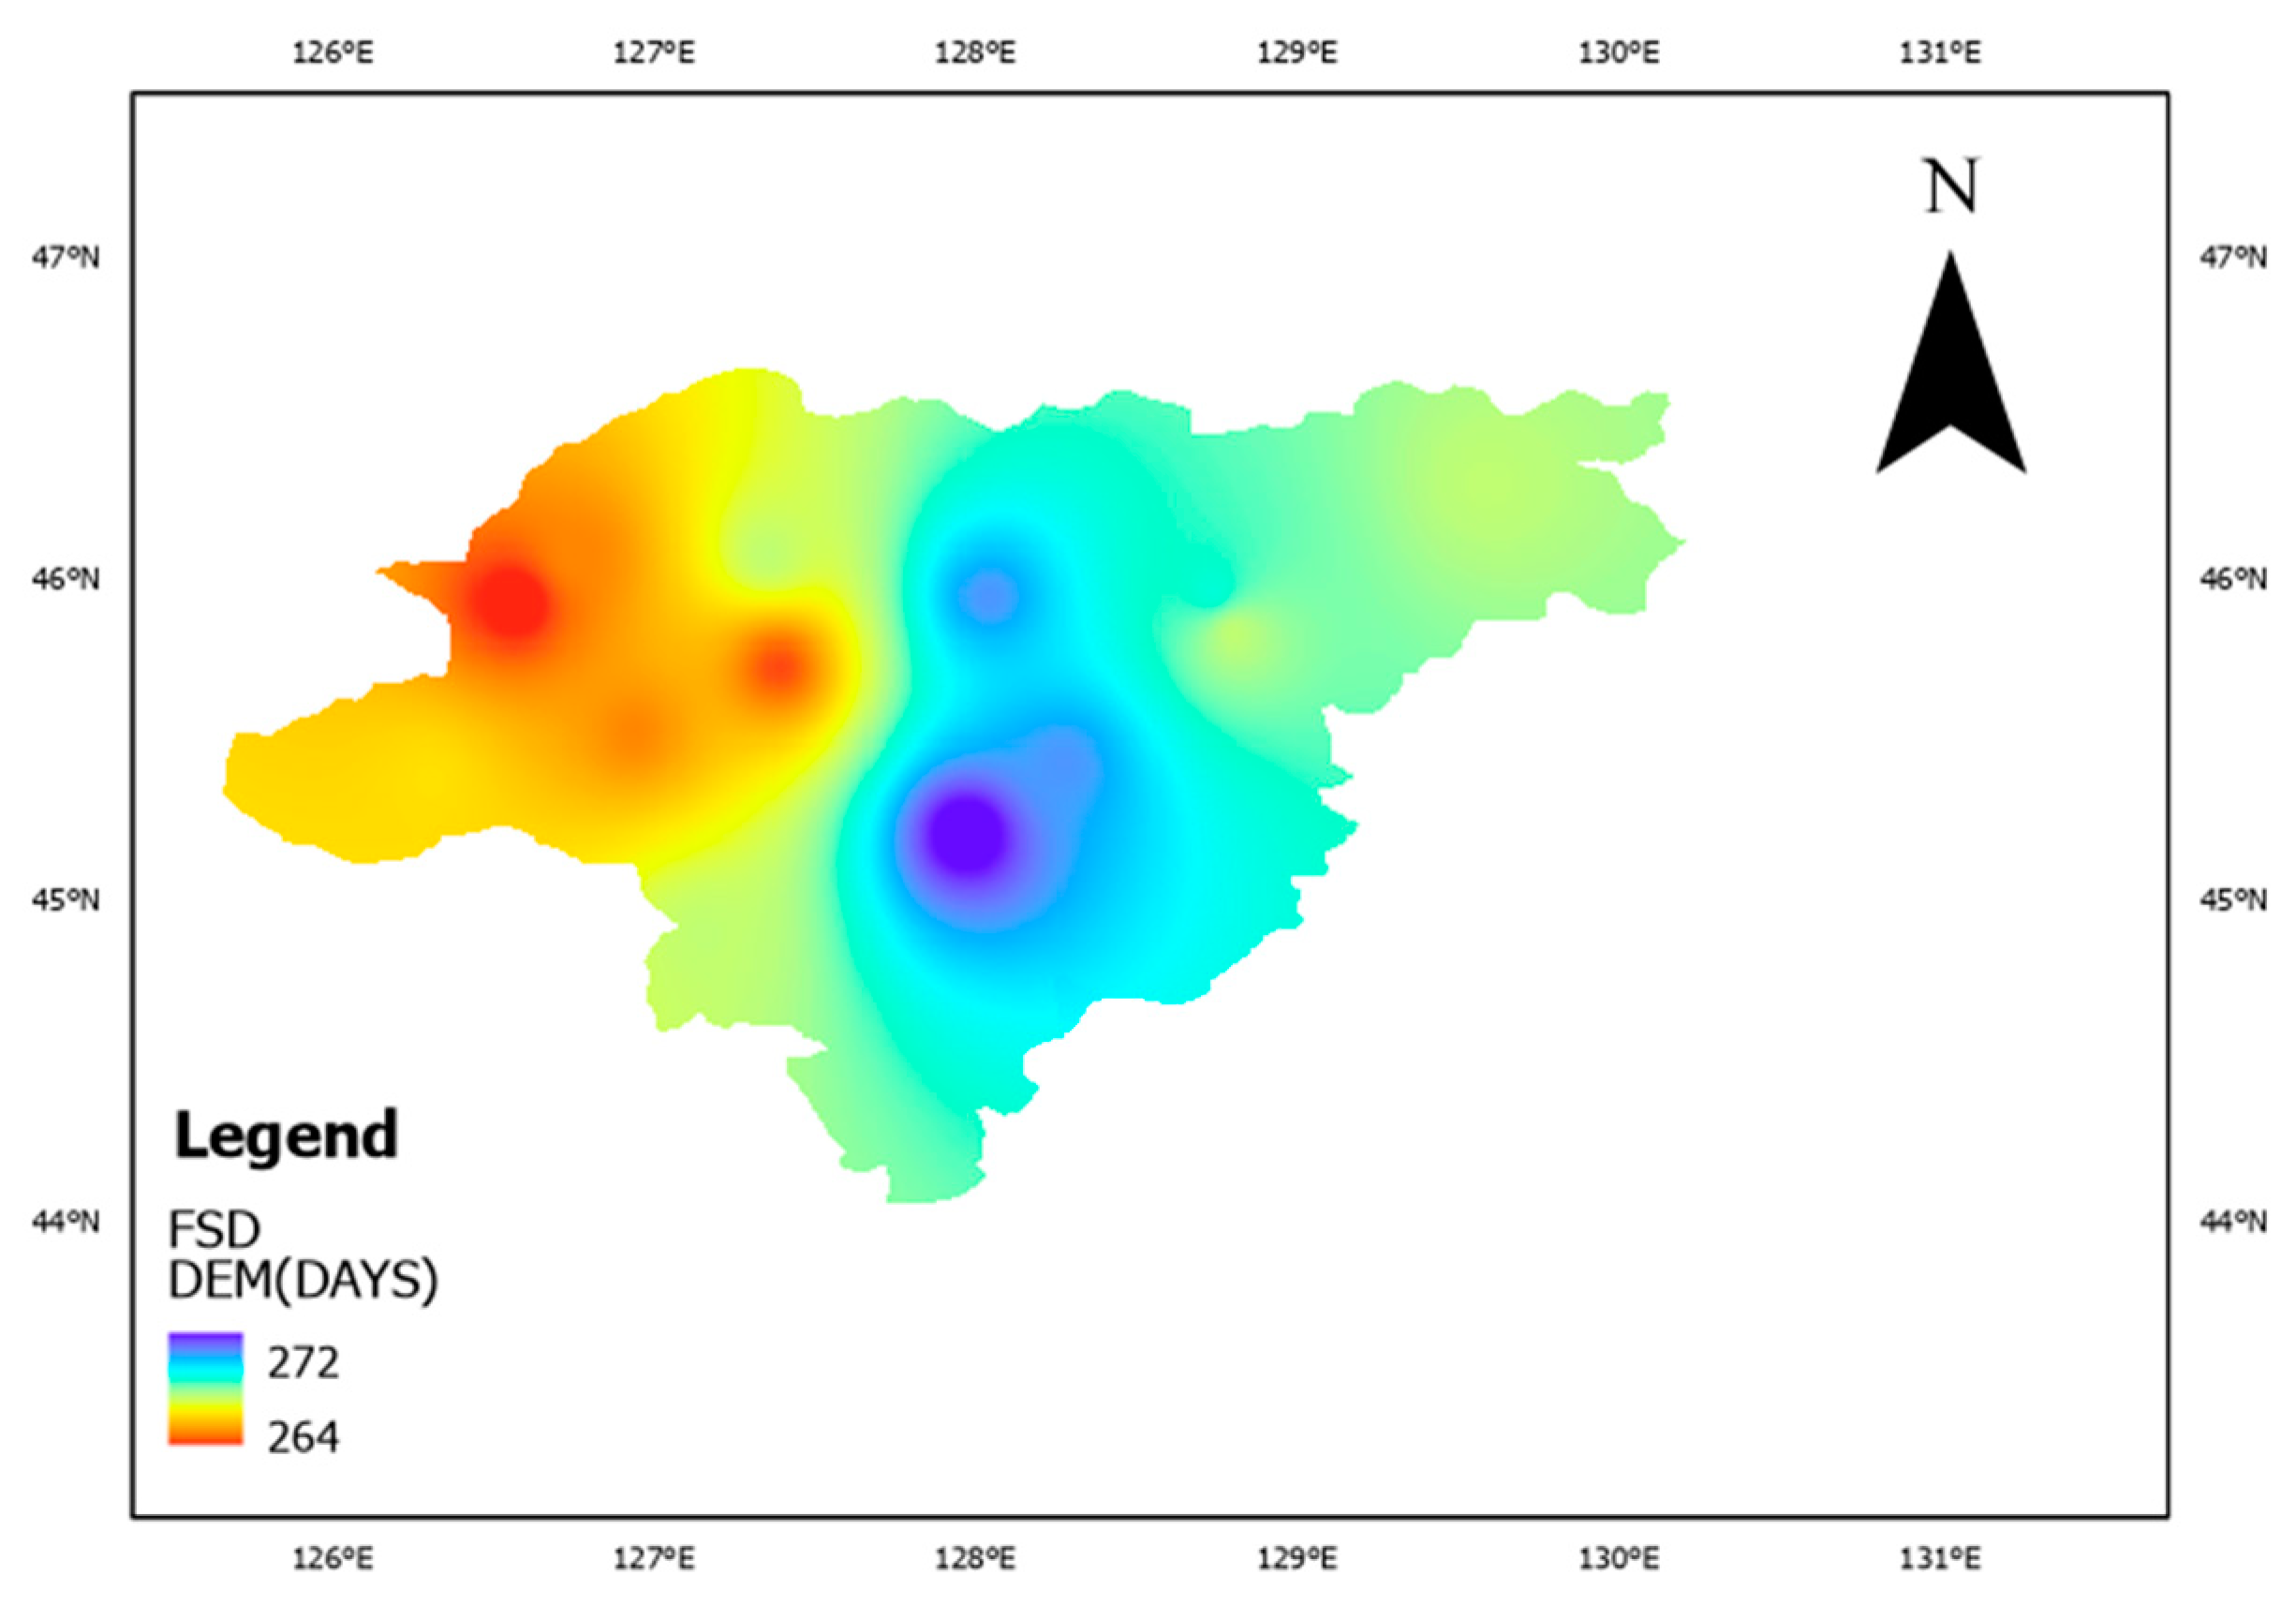
Figure 2 shows the spatial distribution of FSD in Harbin during 1961-2022. From
Figure 3, it can be seen that the FSD arrives earlier in the south-central part of Harbin and later in the western part. The overall trend is a gradual advancement from the east and west ends to the center. The FSD in Harbin is between the 264th and 272nd, i.e., September 21st to September 29th of the year.
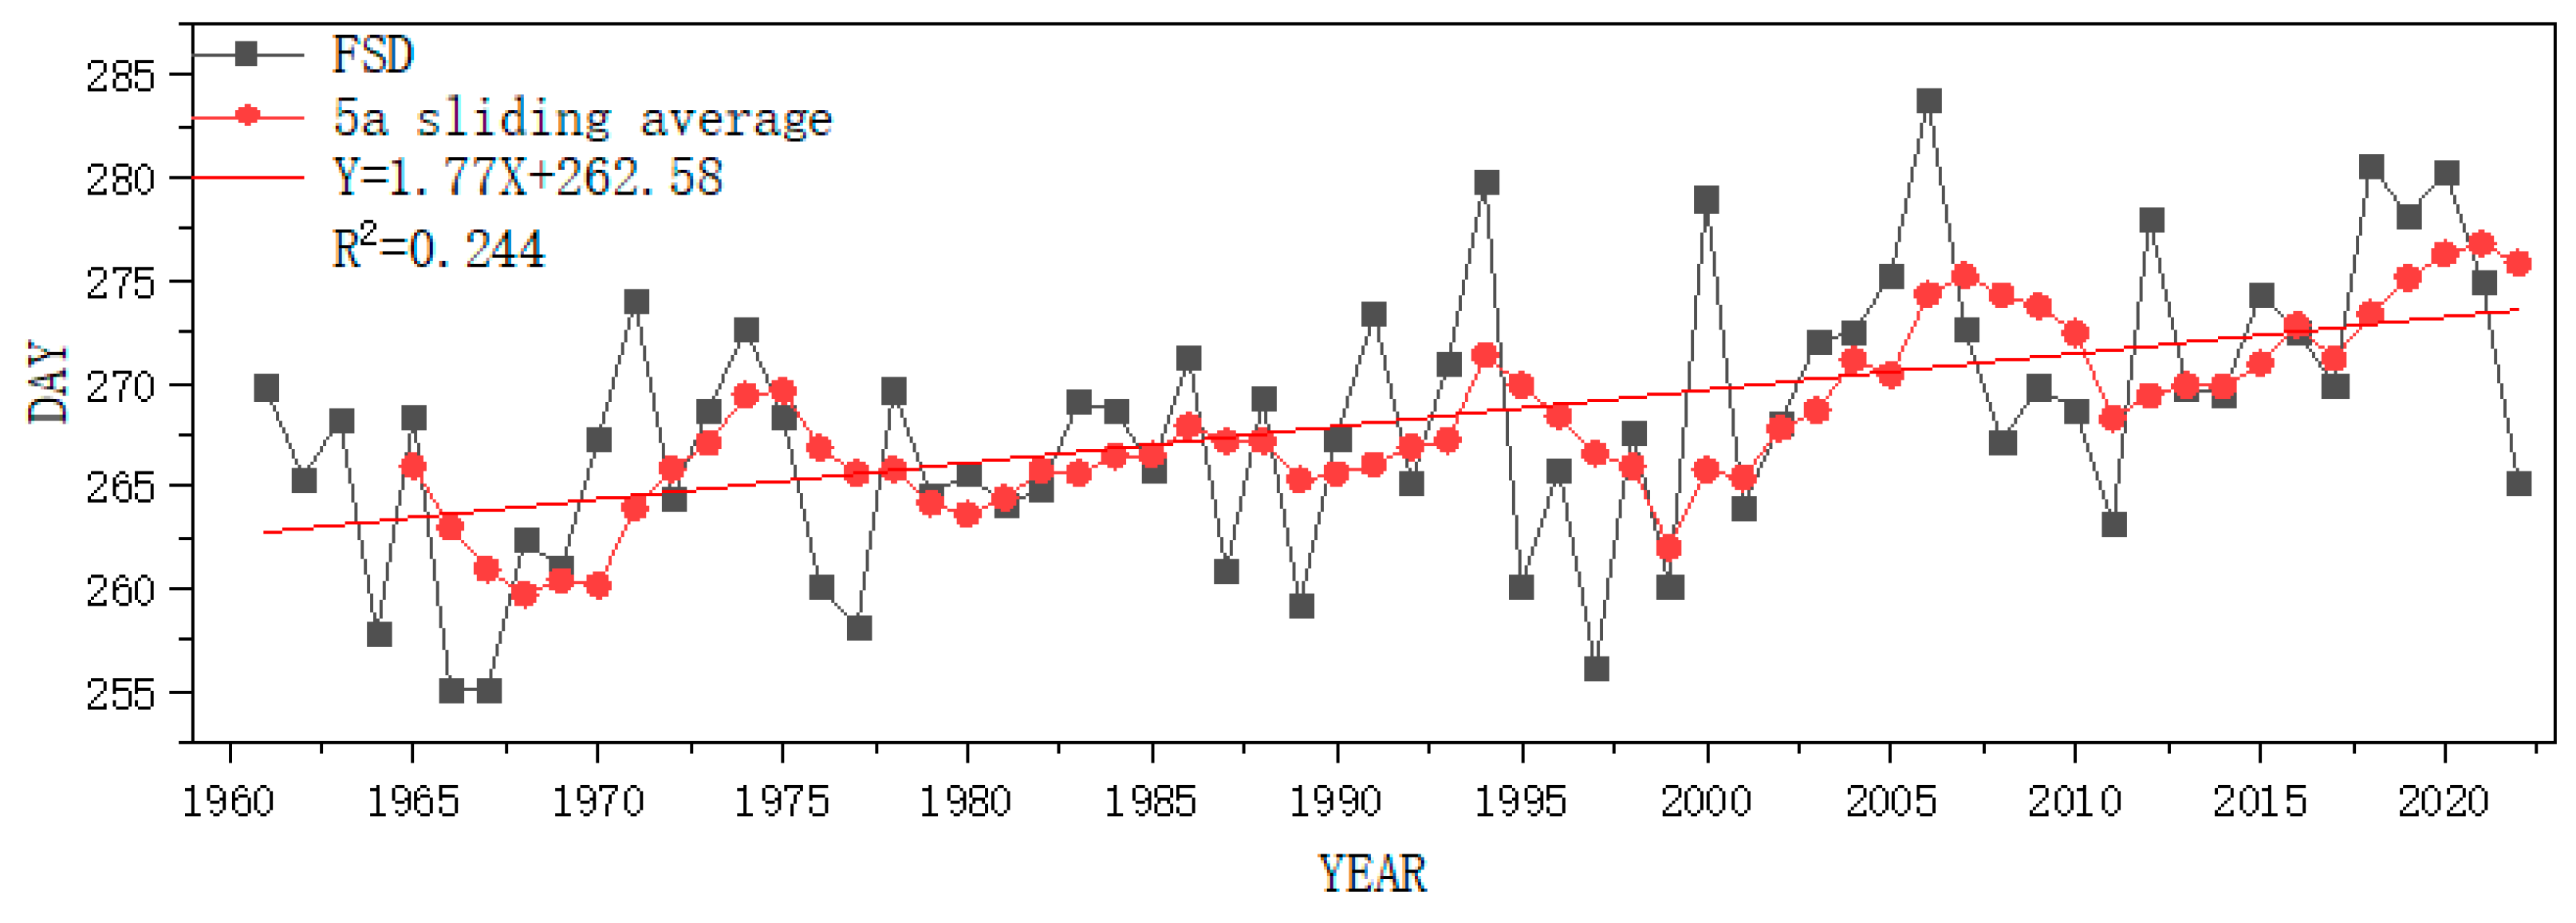
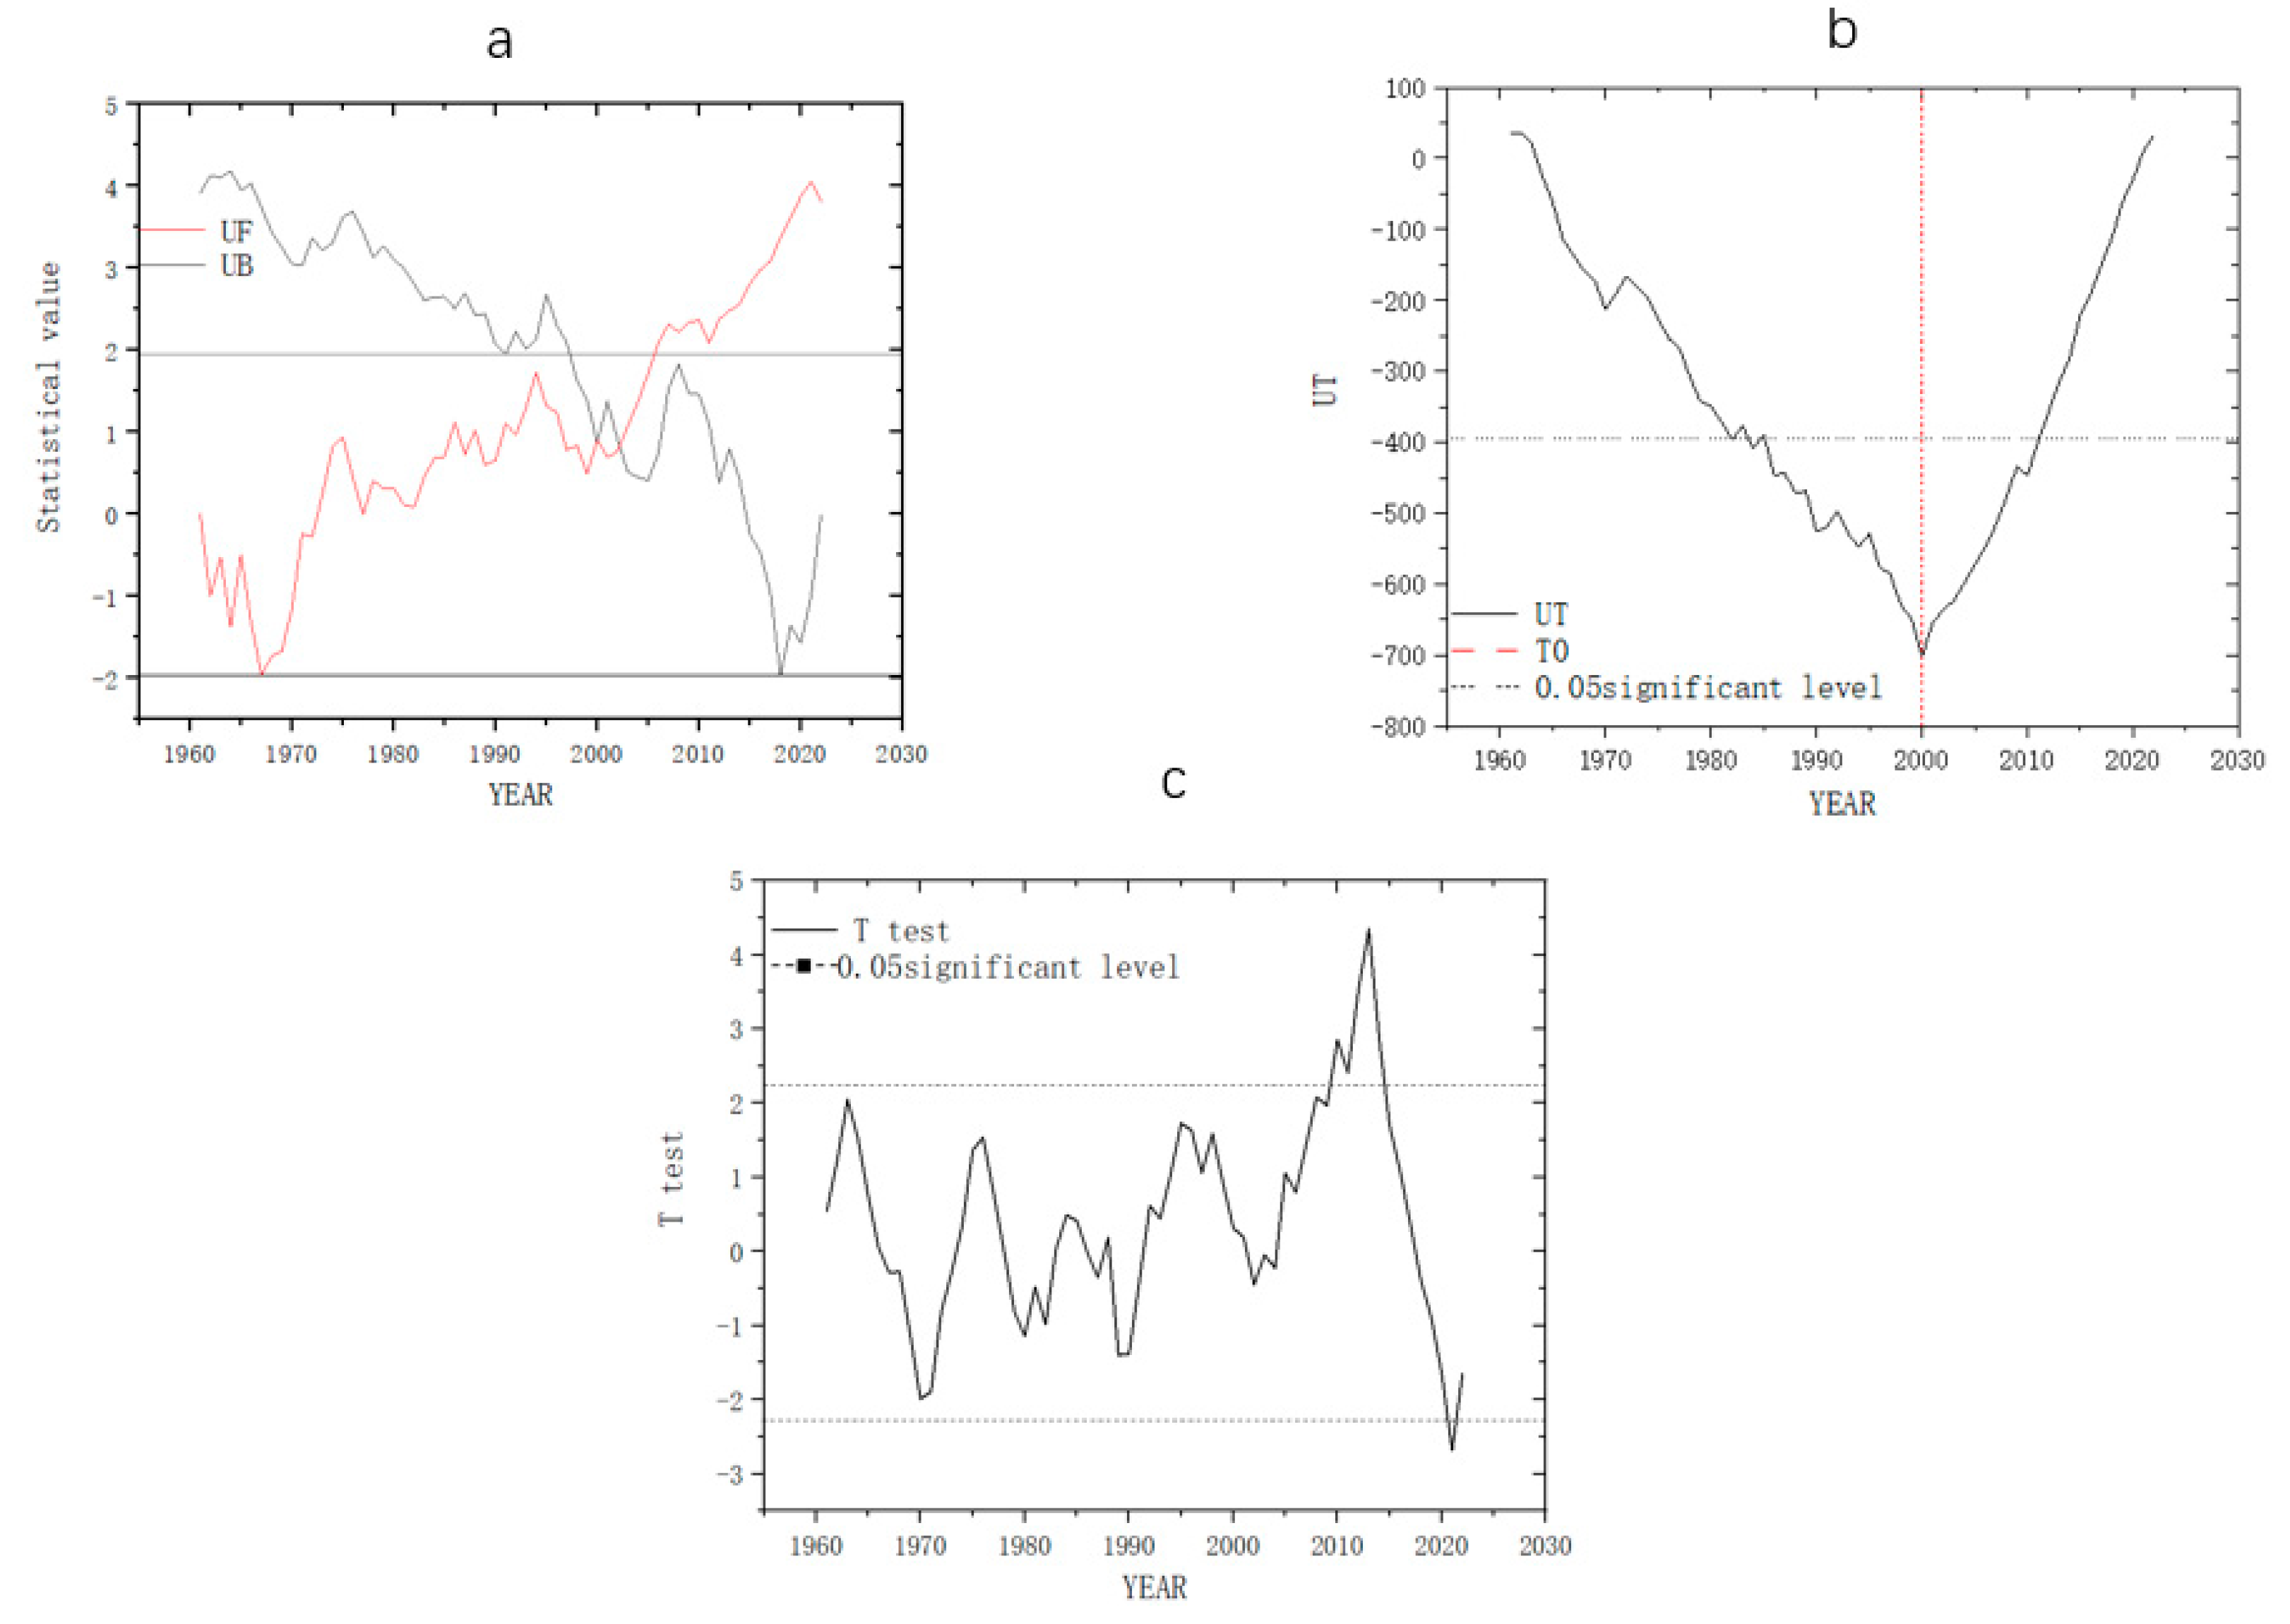
Figure 4 shows the overall variation of FSD in Harbin, which shows a delayed trend from year to year. The FSD increased by 7.8 days at a rate of -1.27 d/10a throughout the study period .The earliest FSD was in 1966, on the 255th, i.e., September 18th of that year, and the latest was in 2006, on the 283rd, i.e., October 10th of that year. We used the Mann-Kendall mutation test to check the significance of the change trend of FSD, and used the pettitt method and the sliding T test to check the authenticity of the mutation points. The results showed that FFD was mutated in 2000 by Mann-Kendall mutation test. And the mutation points passed the significance test of α = 0.05 by pettitt method and sliding T test, indicating that there were significant differences between mutation points. Before the mutation, the average arrival time of FSD in the study area was 265d, i.e., September 22nd of that year and after that, the arrival time averaged to be the 272nd, i.e., September 29th of that year.
3.2. Temporal and spatial change and mutation test of FED
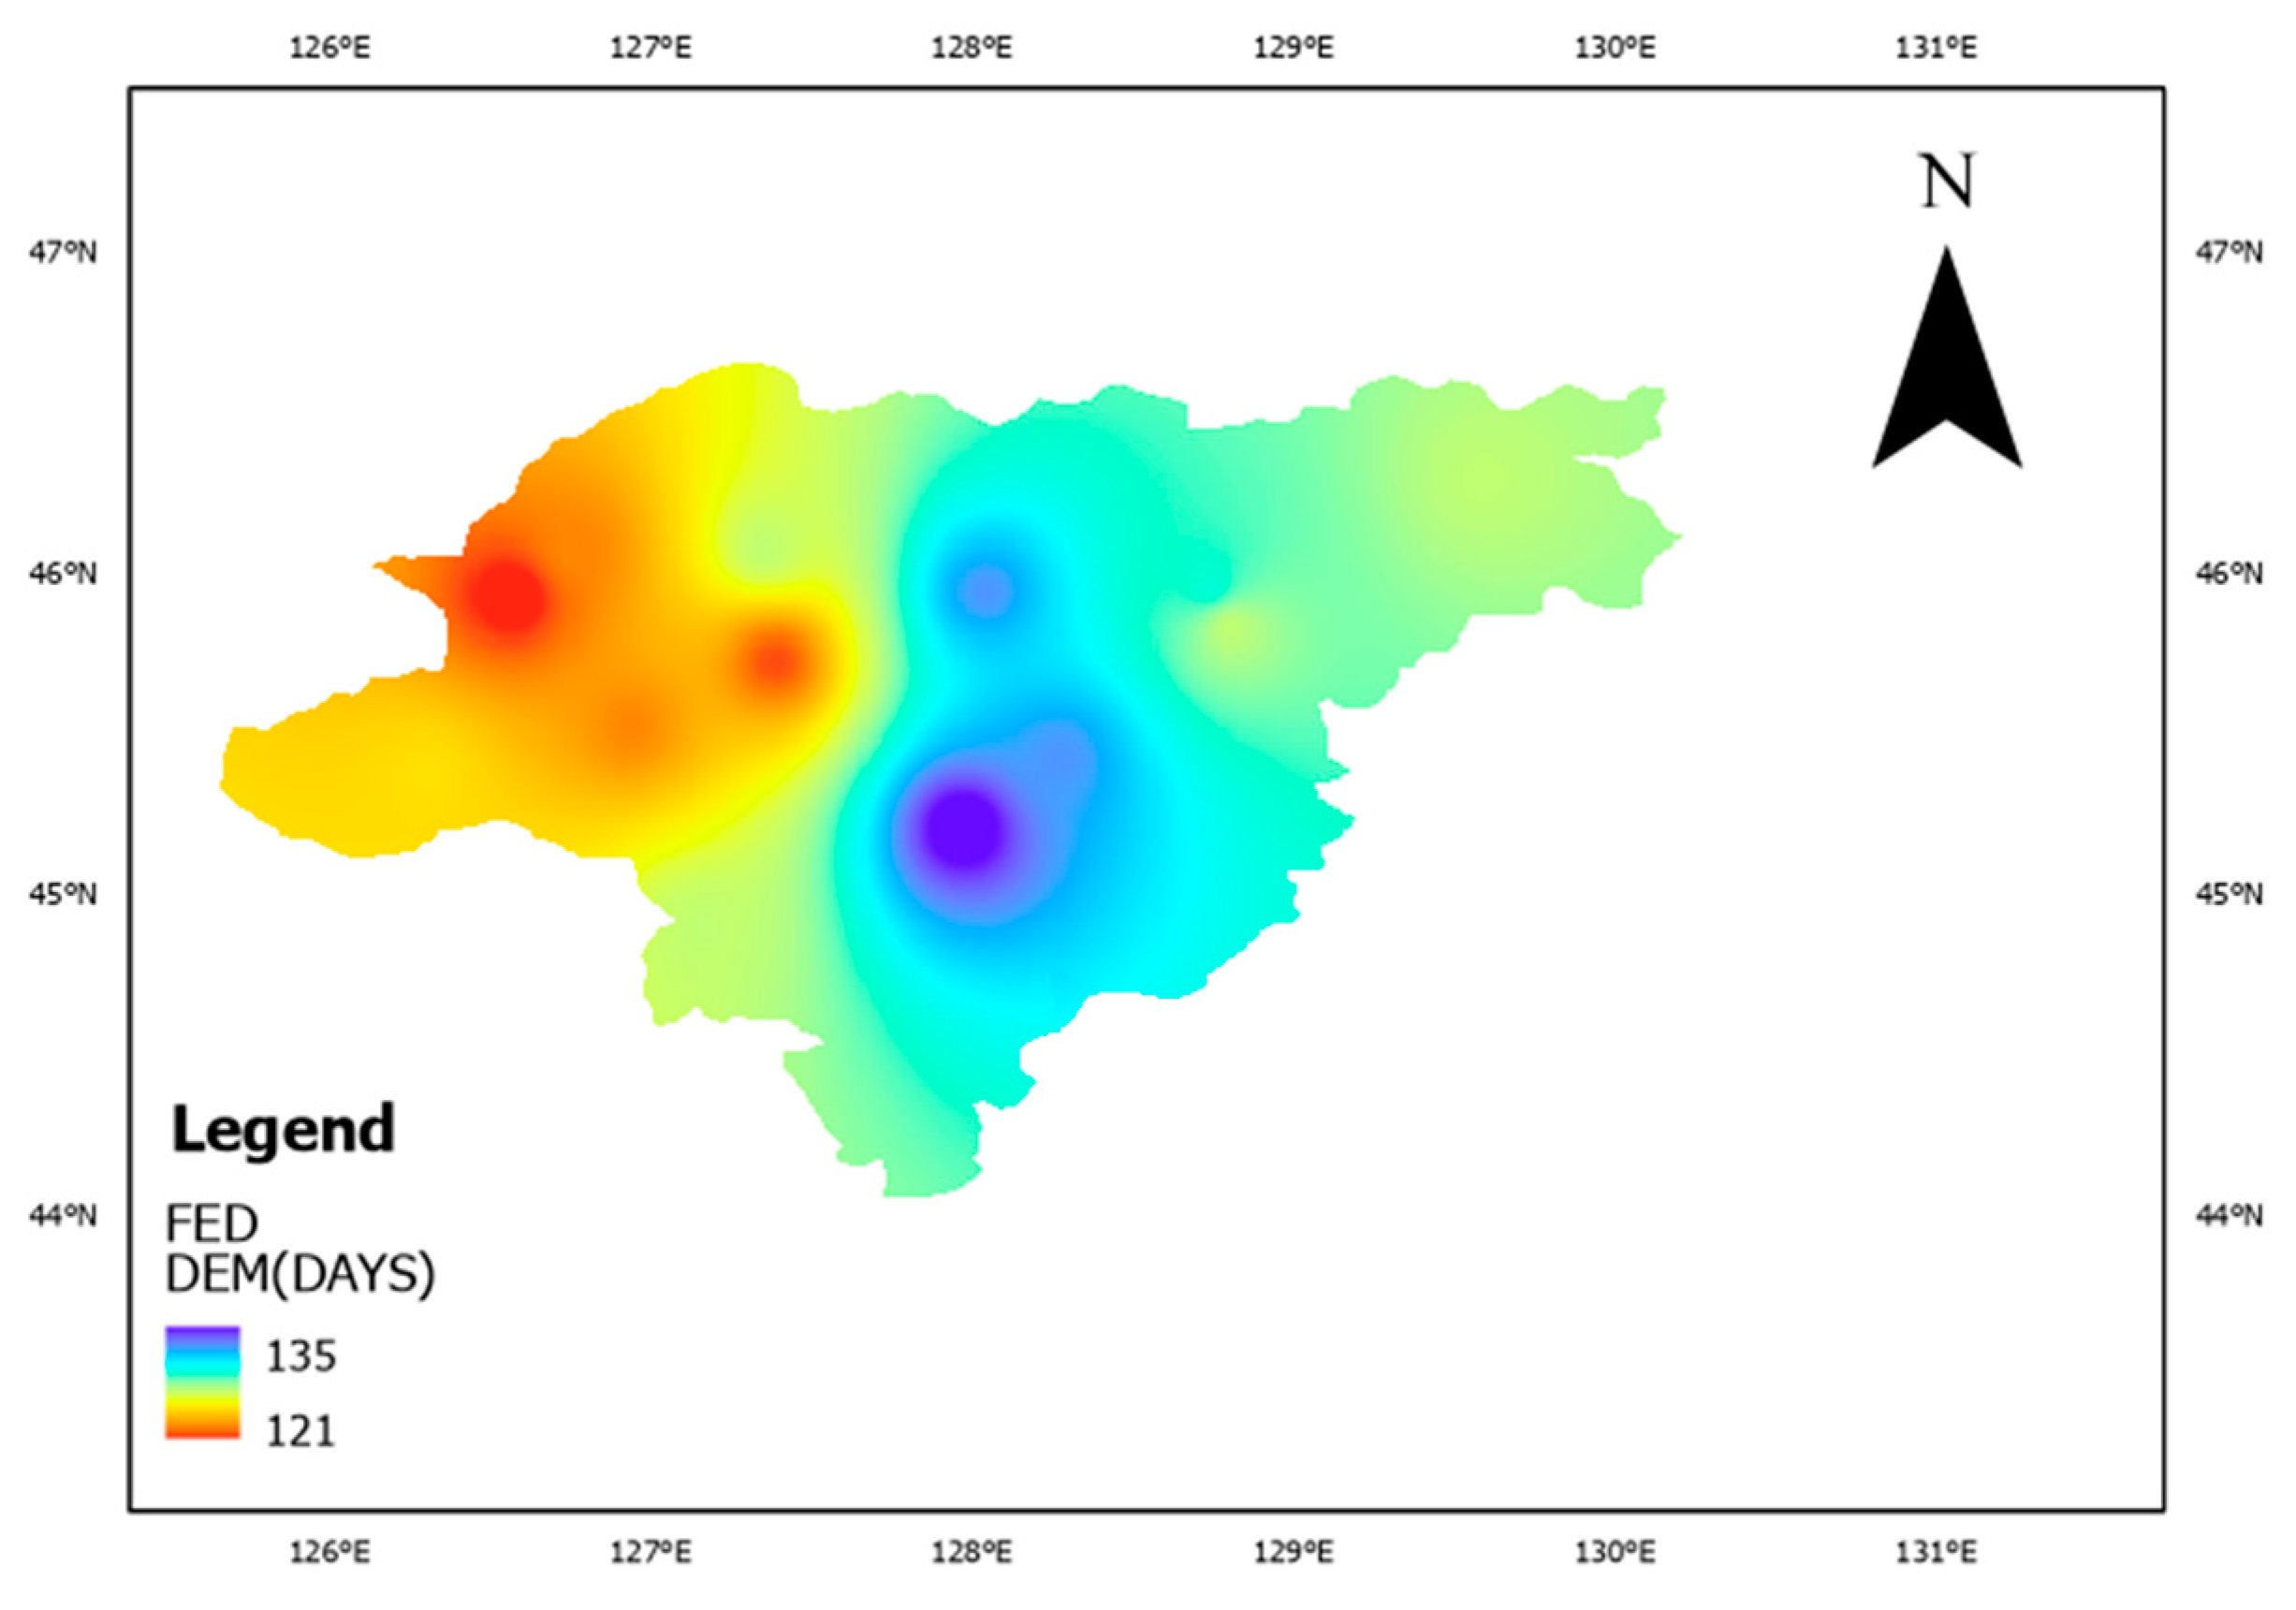
Figure 5 shows the spatial distribution of FED in Harbin during 1961-2022. From
Figure 6, it can be seen that the FED arrived later in the south-central part of Harbin, while earlier in the west. The overall trend is a gradual postponement from the east and west ends by toward the center. The FED days in Harbin are between the 121st and 135th days, i.e., from April 1st to April 15th.
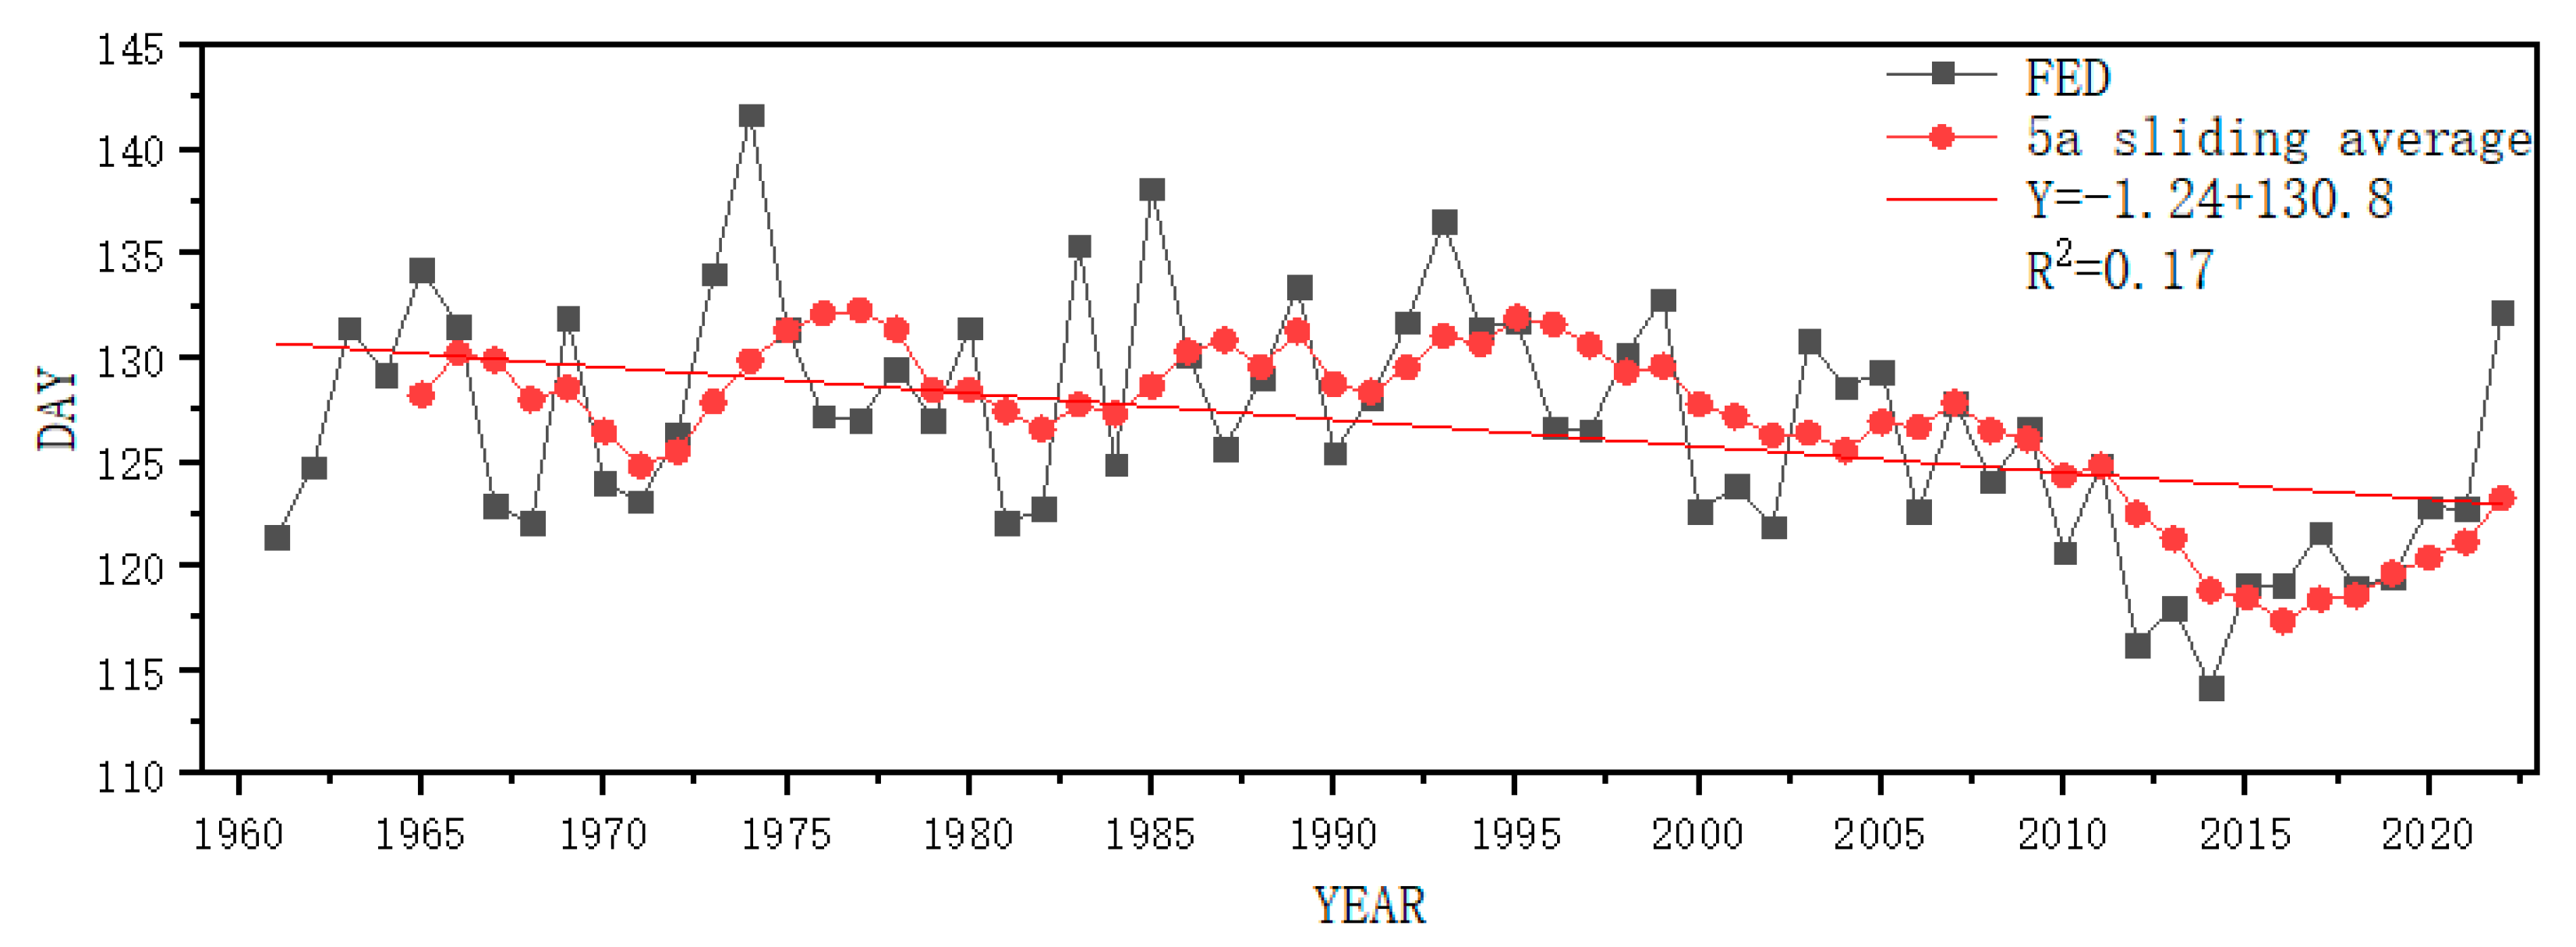
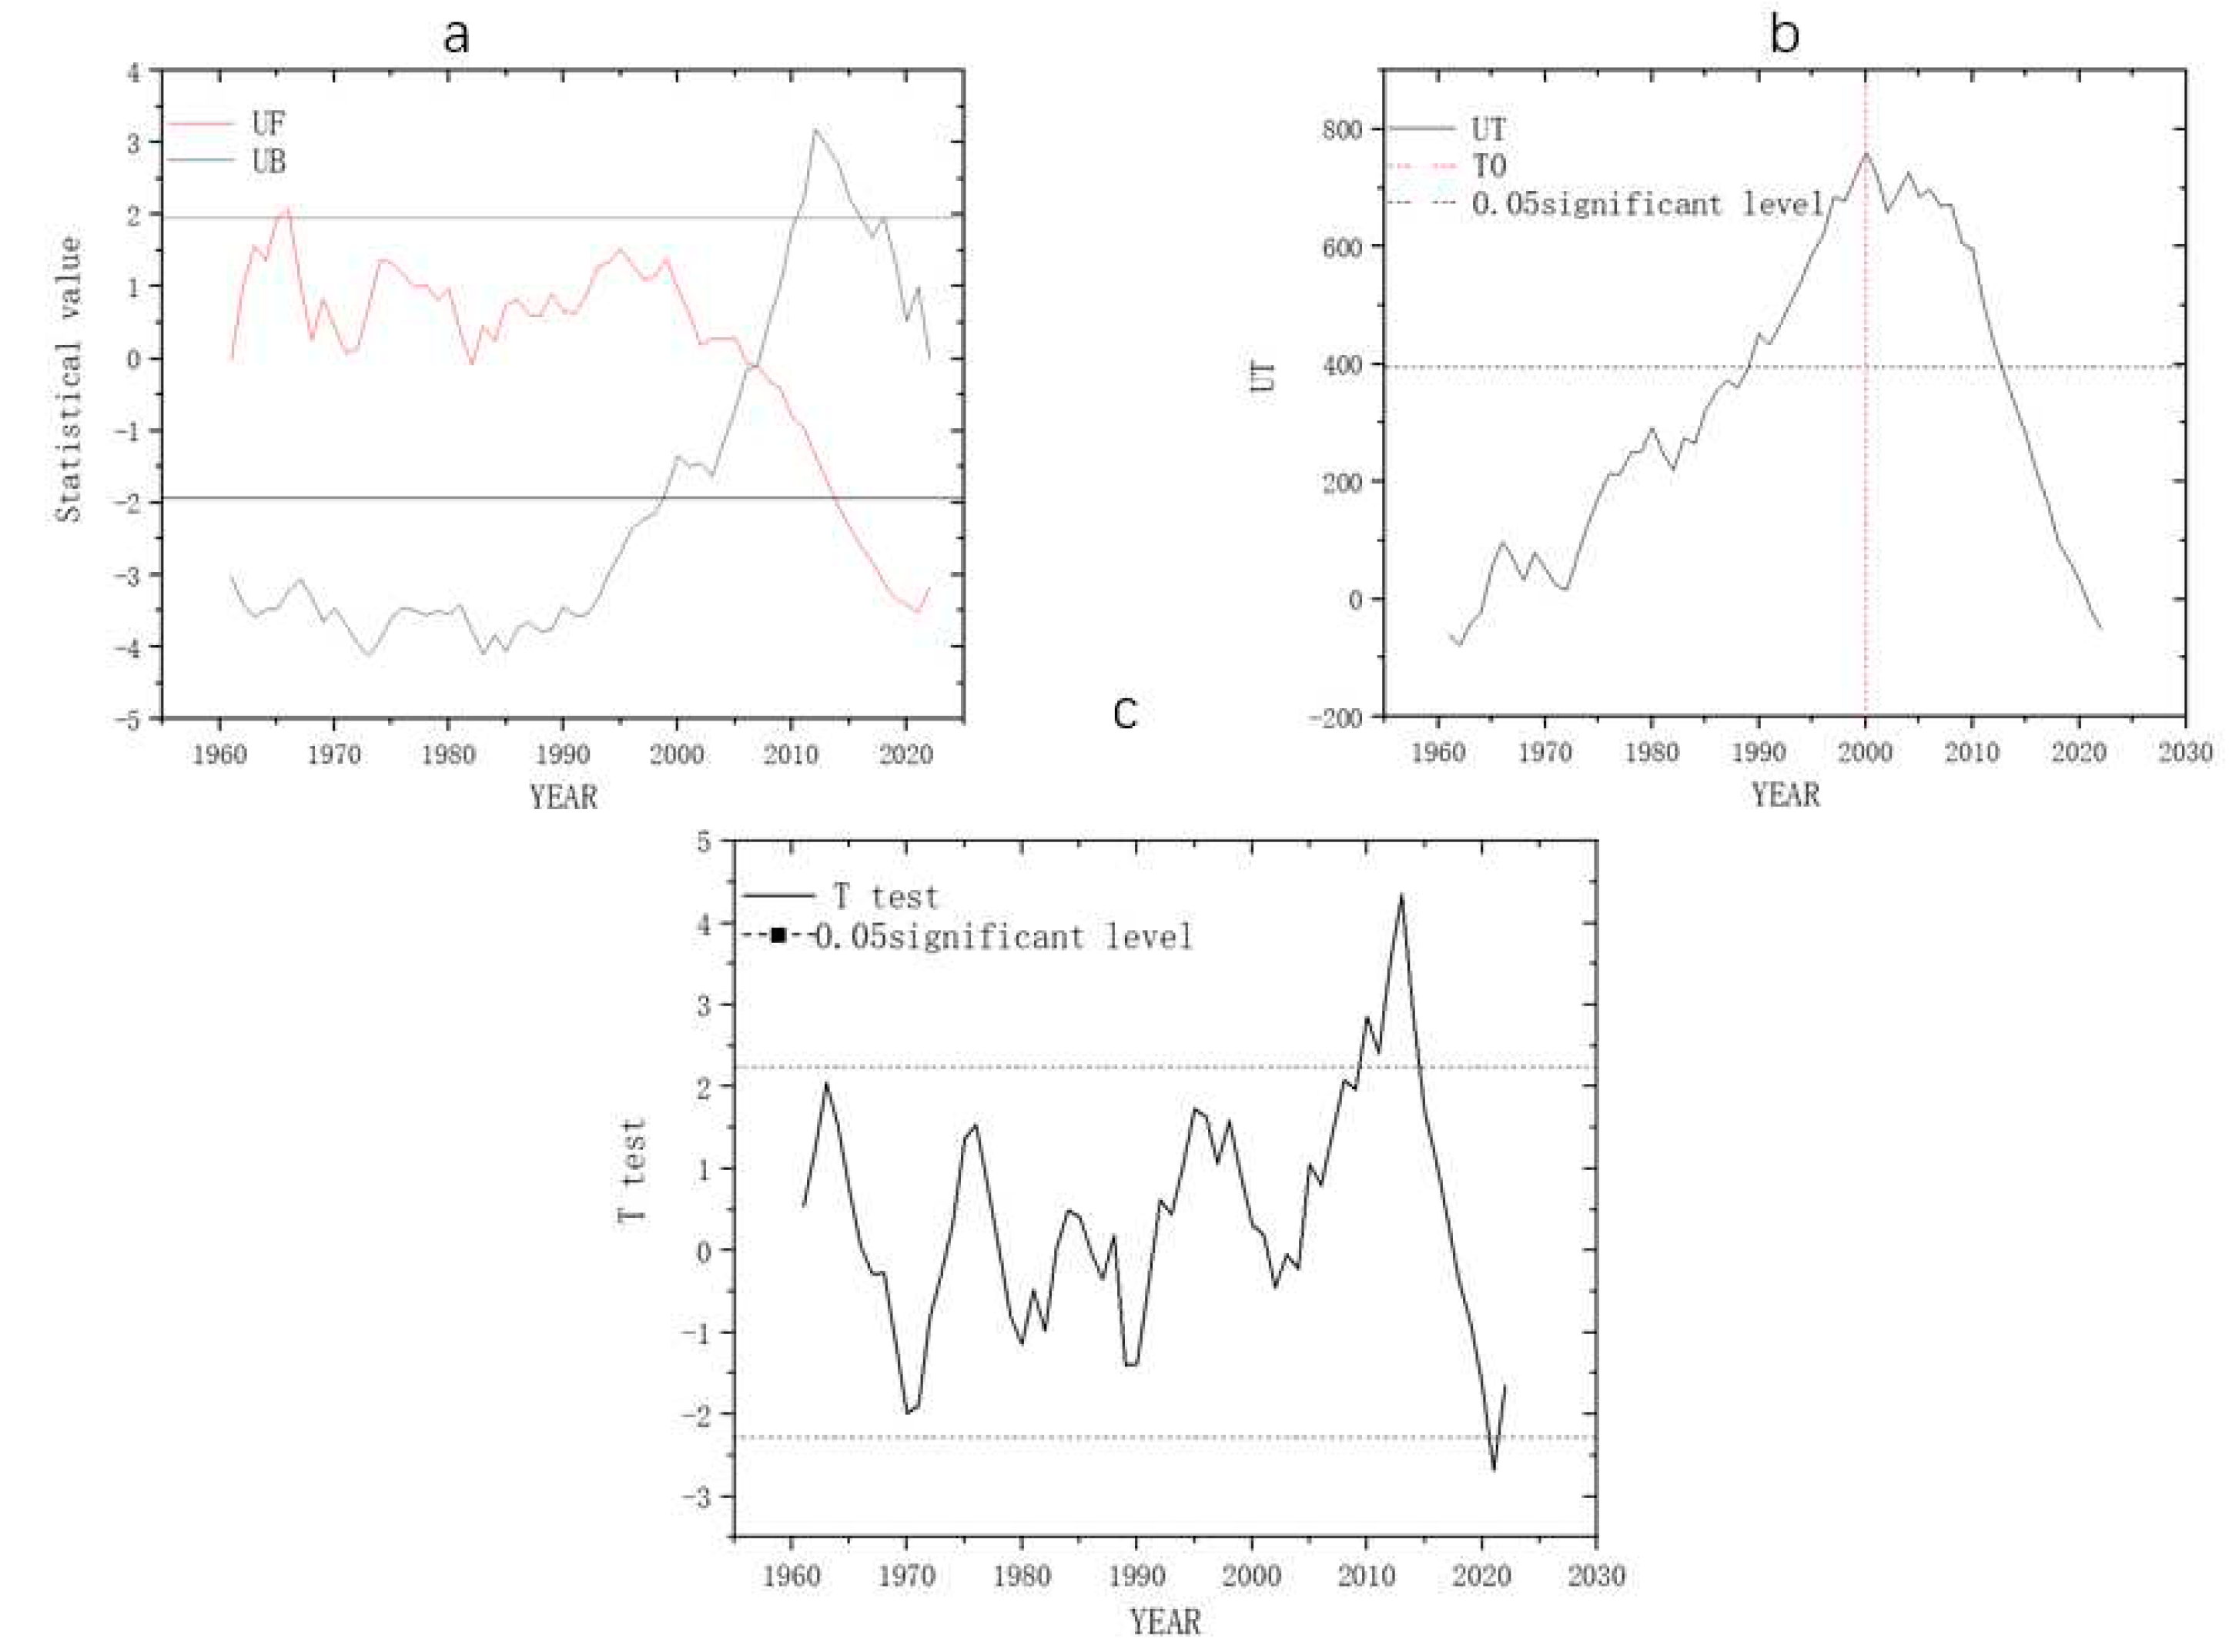
Figure 7 shows the overall change of the FED in Harbin, with a trend of delay from year to year. The FED increased by 10.9 days at a rate of 1.77d/10a throughout the study period.The earliest year of FED was 2014, on the 114th day of the year i.e., April 24th of that year, and the latest year was 1974, on the 141st day of the year i.e., May 11th of that year. The FED increased by 10.9 days at a rate of 1.77d/10a throughout the study period.The earliest year of FED was 2014, on the 114th day, i.e., April 24th, and the latest was 1974, on the 141st, i.e., May 11st of that year. We used the Mann-Kendall mutation test to check the significance of the change trend of FED, and tested the veracity of the mutation points by the pettitt method and the sliding T test. By Mann-Kendall mutation test it was concluded that the mutation of FED in 2000 was tested by Mann-Kendall mutation test,and the mutation point passed the significance test of α = 0.05 by pettitt method and sliding T test, indicating that there were significant differences between mutation points. Before the mutation, the arrival time of FED in the study area averaged 128th , i.e., April 8th, and after that, the arrival time of FED averaged 121st d, i.e., April 1st of the year.
3.3. Test of spatio-temporal variation and abrupt change of FFS
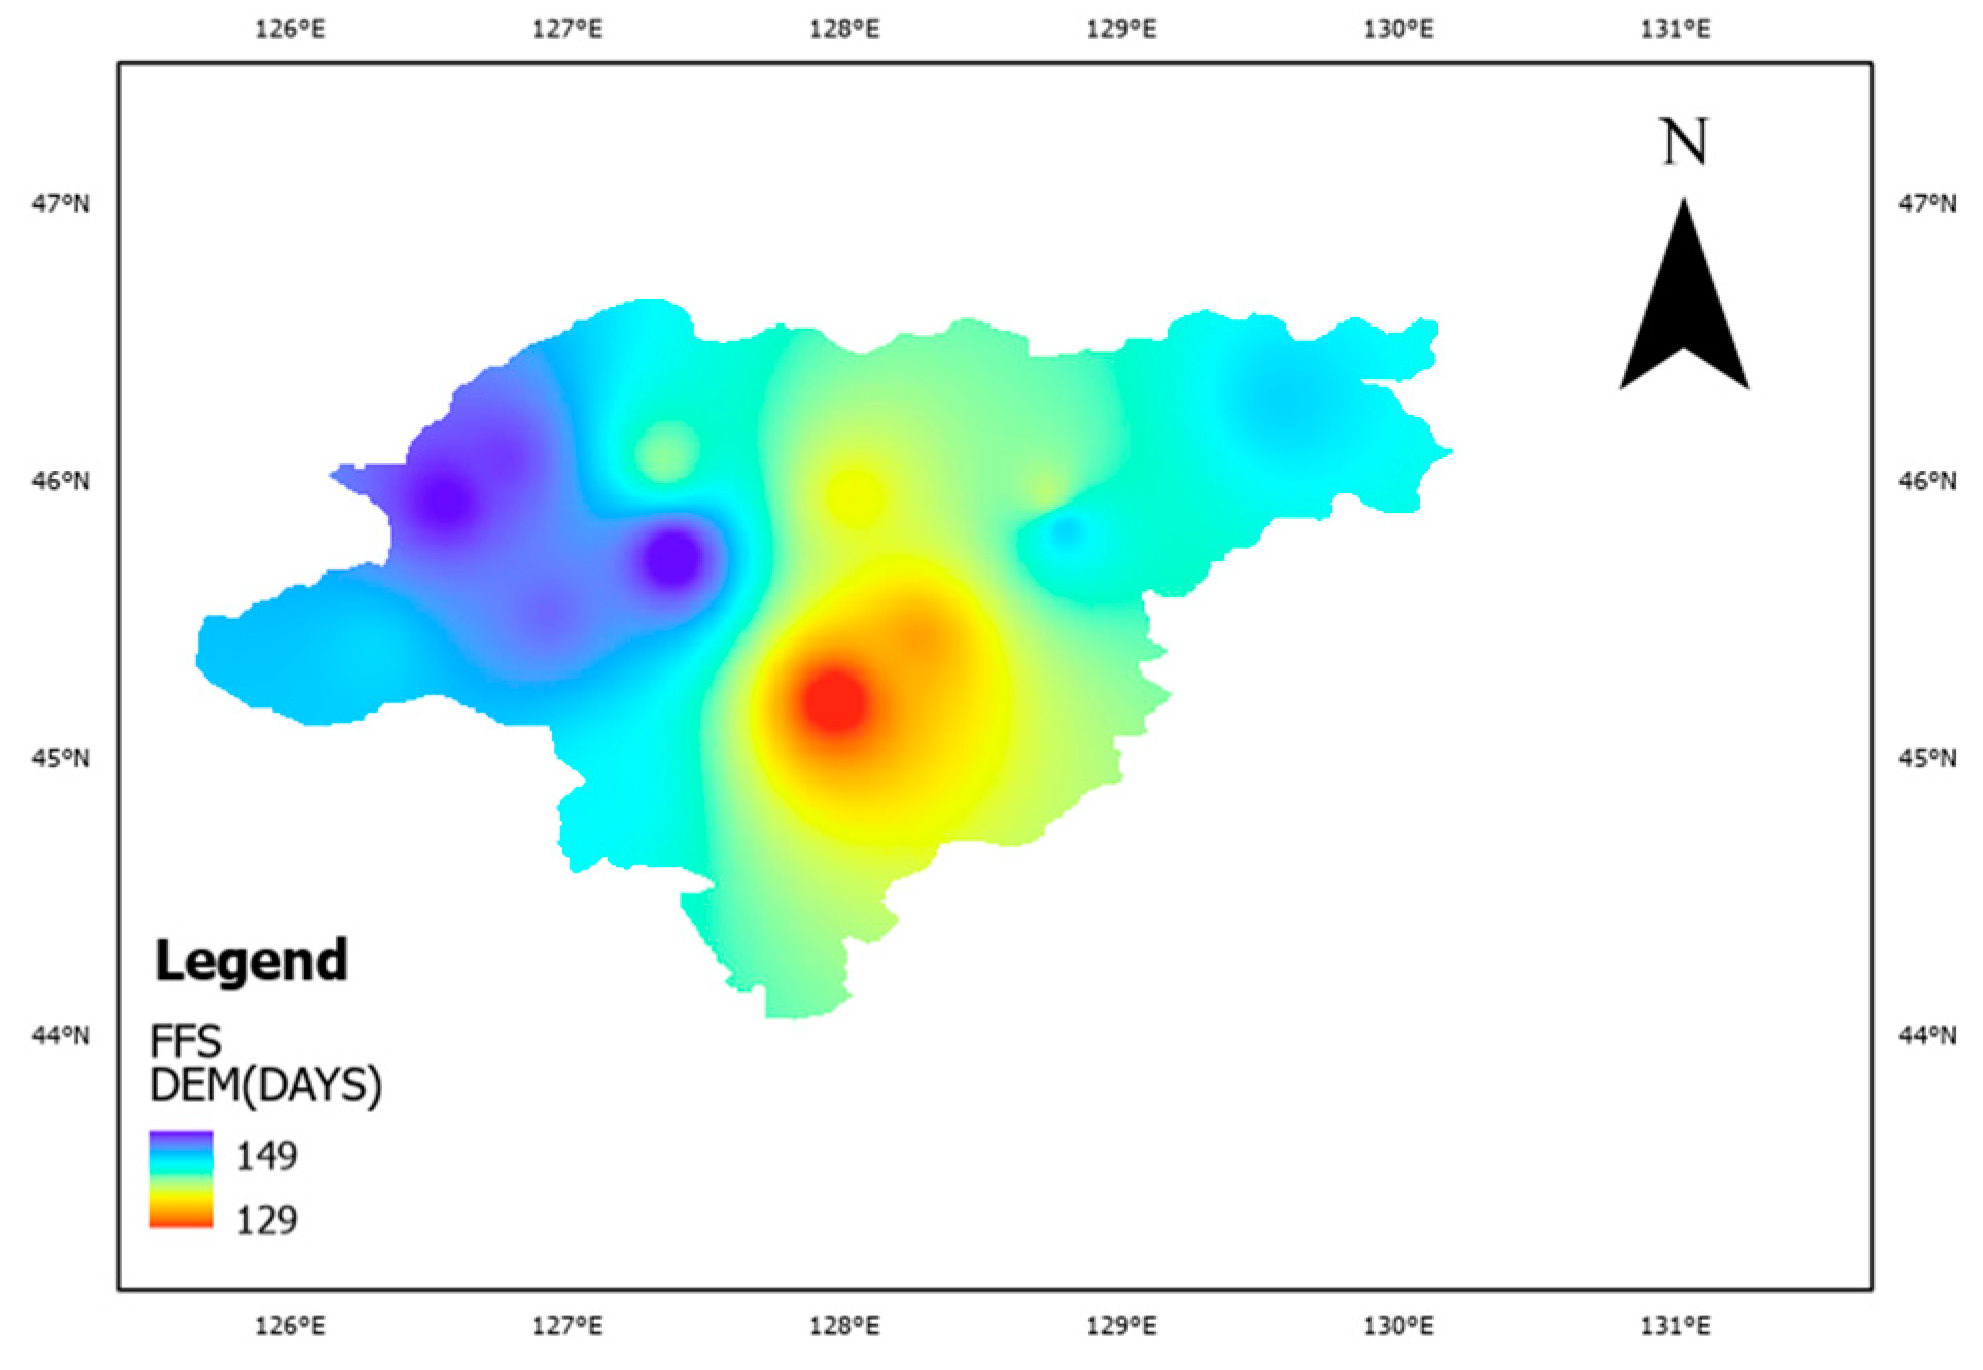
Figure 8 shows the spatial distribution of FFS in Harbin from 1961 to 2022. It can be seen from
Figure 9 that the FFS is later in the south-central part of Harbin, while FFS in the western part is longer. The overall trend is decreasing from the east and west ends to the center, and the number of days of occurrence is in the range of 129-149 days.
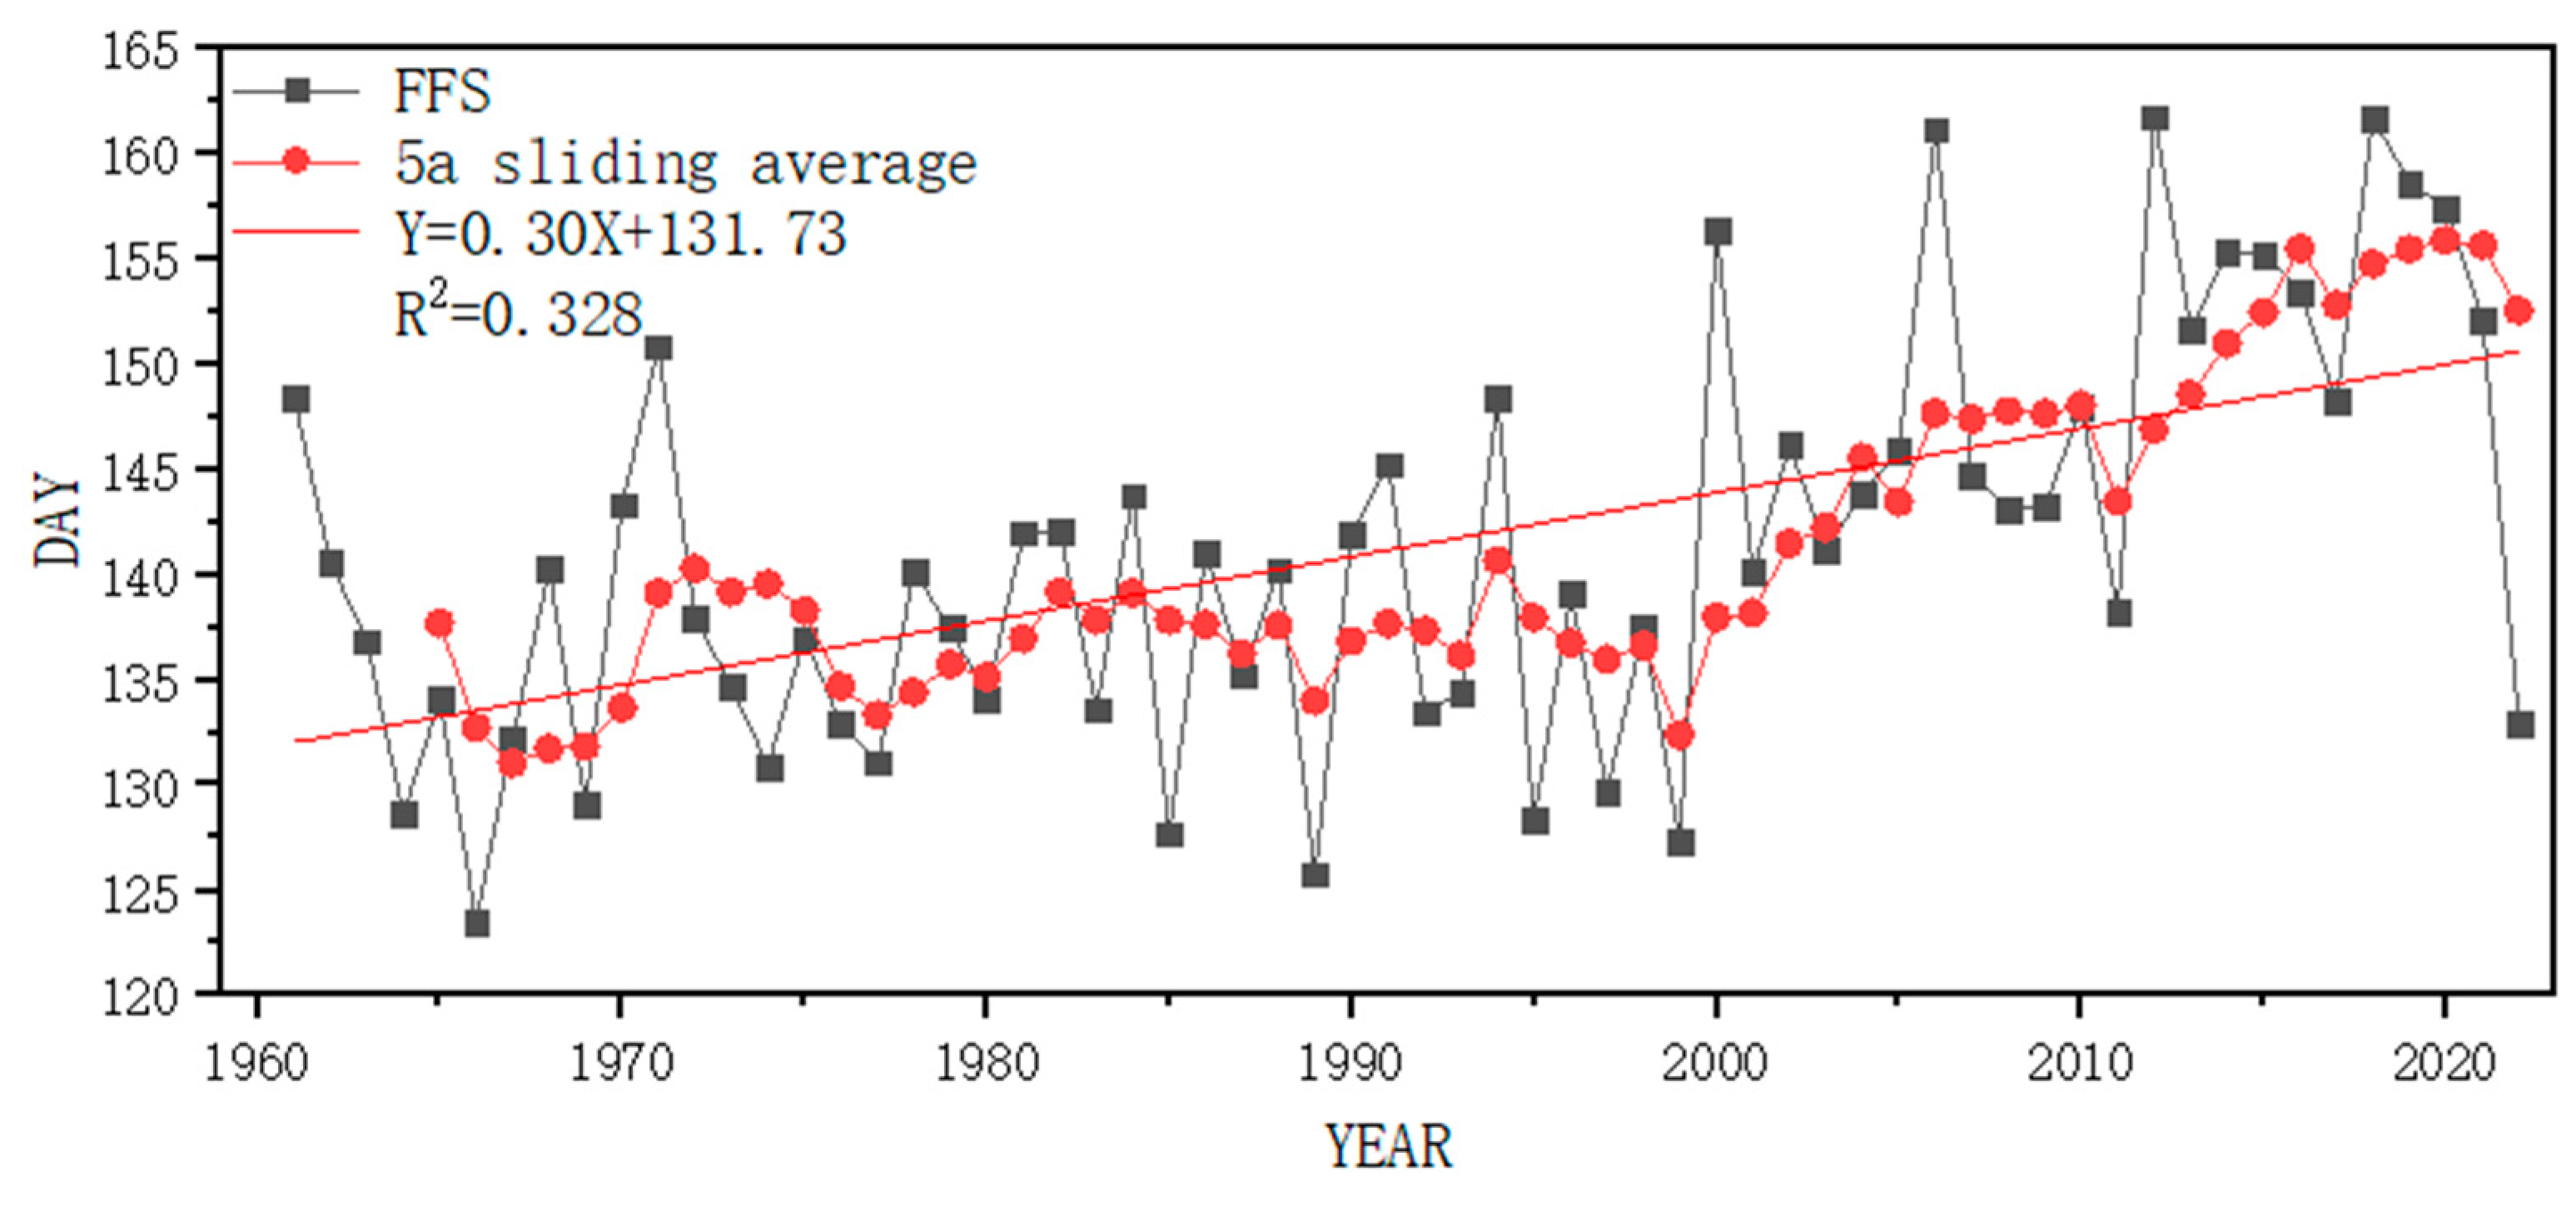
Figure 10 shows the overall change of FFS in Harbin, presents a trend of lengthening year by year. FFS increased by 18.9 days at a rate of 3.05d/10a throughout the study period, with the highest FFS in 2012 (161 days) and the shortest FFS in 1966 (123 days). We used the Mann-Kendall mutation test to check the significance of the trend of the FFS and the pettitt method and sliding T test to check the authenticity of the mutation points. The results showed that the mutation of FFS occurred in 2004 by Mann-Kendall mutation test, and the significance test of α = 0.05 by pettitt method and sliding T test, indicating that there were significant differences among mutation points. Before mutation, the average FFS in the study area was 137d. After the mutation, FFS averaged 150 days in the study area.
3.4. Factors influencing of frost
The correlations and regression coefficients of FSD, FED and FFS with geographic factors, mean temperature and population density in Harbin are shown in
Table 2. FSD, FED and FFS with temperature r are 0.363, -0.614 and 0.557.FED and FFS are significantly correlated with temperature, whereas the correlations with both geographic factors and population density are not significant. The regression coefficients show that for every 1° increase in latitude FSD will be advanced by 1.44 days, FED will be delayed by 5.15 days and FFS will be prolonged by 6.6 days. For every 1°C increase in mean temperature FSD will advance by 1.38 days, FED will be delayed by 3.026 days and FFS will be prolonged by 4.409 days. In Harbin, FSD and FFS are negatively correlated with latitude and positively correlated with temperature, while FED is positively correlated with latitude and negatively correlated with temperature. The FSD, FED and FFS in the central part of Harbin Municipality are the earliest, latest and longest, respectively, so the influence of longitude cannot be reflected in Pearson correlation coefficient method and multiple regression analysis method.
4. Discussion
In this study, we collected data on the number of frost days in Harbin for a total of 62 years from 1961 to 2022. Most of the annual FFS appeared in mid-late May to mid-early September, about 140 days; FSD appeared in mid- to late August; and FED appeared in mid- to early May. In the late 1950s and 1960s, FSD would advance to late August to early September and FED was delayed to early June each year. FSD appeared earliest in 1966 and 1967, both on the 255th, i.e., August 18th, and latest in 2006 on the 283rd, i.e., October 10th. FED appeared earliest in 2015 on the 114th, i.e., April 24th, and latest in 1974 on the 141st day, i.e., April 21st of that year. The most frosty year was 2012 with 161 days and the shortest was 1966 with 123 days.
4.1. Trends in FSD,FED and FFS
As shown in
Table 3, the propensity rates for FSD and FFS showed an increasing trend for each site in Harbin. For FED, there was an increasing trend in the propensity rate for some sites. In general, FSD showed a delayed tendency, FED showed an advanced tendency, and FFS showed an extended tendency. Analysis using the method of unary linear regression showed an increasing tendency for both FSD and FFS at all sites, and an overall decreasing tendency for FED.
Using the mean values of the frost elements at each station, it can be seen that FSD appeared earliest at weather station 50968 on the 264th, i.e., September 21st, and latest at 50956 on the 270th, i.e., September 27th of the mean year. FED appeared earliest at 50953 on the 121st, i.e., May 1st of the mean year, and latest at 50968, on the 135th, i.e., March 15th of the mean year. The highest number of FFS occurrences was at weather station 50960, with a number of 149 days, and the lowest was at 50948, with only 129 days.
With global warming, FSD is delayed, FED is advanced and FFS is extended in Harbin, which will extend the growing season of the crops, provide sufficient heat resources for regional agricultural production, and facilitate the expansion of suitable planting areas for crop cultivation. Heilongjiang Province is a major grain producing area in China, and the sensitivity of crop growth to frost will vary with different crops and climatic conditions. Therefore, different systems and methods are needed to reduce the damage of frost to crops.
4.2. Testing FSD,FED and FFS based on grey relational analysis
Therefore, this study adopts grey correlation analysis method to judge several factors. The resulting grey correlation coefficient is shown in
Table 4: The longitude has a high gray correlation with FSD,FED and FFS. Because the longitude has no linear relationship with FSD,FED and FFS, the longitude is not significant when using Pearson method and multiple regression method.
5. Conclusions
By analyzing the spatial and temporal variations of FSD, FED and FFS in Harbin and the effects of geographic factors, temperature and population density on them, the results show that:
(1) The earliest year in which FSD appeared was 1966 and 1967, both on the 255th day, i.e., August 18th, and the latest was 2006, on the 283rd day, i.e., October 10th.The earliest year of FED was 2015, on the 114th day, i.e., April 24th of that year, and the latest was 1974, on the 141st day, i.e., April 21st of that year. The longest year of frost was 2012 with 161 days and the shortest was 1966 with 123 days.
(2) Throughout the study period, FSD increased by 7.8 days at a rate of -1.27d/10a, FED increased by 10.9 days at a rate of 1.77d/10a, and FFS increased by 18.9 days at a rate of 3.05d/10a. The propensity rates of FSD and FFS at each site in Harbin showed an increasing trend. For FED, some sites showed an increasing trend. In general, FSD showed a delayed trend, FED showed an advanced trend, and FFS showed a prolonged trend. Using the method of unary linear regression, the sites showed an increasing trend for both FSD and FFS, and an overall decreasing trend for FED.
(3) During the whole study period, FSD was mutated in 2000, and the arrival time of FSD in the study area averaged the 265th, i.e., September 22nd. And after the mutation, the arrival time of it changed to the 272nd, i.e., September 29th. FED was mutated in 2006, and the arrival time of FED in the study area averaged the 128th, i.e., April 8th of that year. After the mutation, it changed to the 121st, i.e., April 1st of that year. FFS was mutated in 2004, and FFS in the study area averaged 137 d prior to the mutation, after that, changed to 150d.
(4) In Harbin Municipality, FSD and FFS were negatively correlated with latitude and positively correlated with temperature, while FED was positively correlated with latitude and negatively correlated with temperature. The FSD, FED, and FFS in central Harbin are the earliest, latest, and longest, respectively, so the effect of longitude could not be captured when applying the Pearson correlation coefficient method and multiple regression methods. Several factors were judged by grey correlation analysis method. The longitude is significantly related to FSD, FED and FFS.
Author Contributions
Conceptualization, T.Z. and C.D.; software, T.Z.; validation, C.D., C.Z. and Y.Z.; formal analysis, M.Y.; investigation, C.Z. and Y.Z.; resources, C.D.; data curation, S.L.; writing—original draft preparation, T.Z.; writing—review and editing, M.Y. and C.Z.; visualization, T.Z. and C.Z.; funding acquisition, C.D. All authors have read and agreed to the published version of the manuscript.
Funding
This study was supported by 2020 Higher Education Teaching Reform Key Commissioned Project, (Grant No. SJGZ20200135) , Innovative research project for graduate students of Heilongjiang University,(Grant No. YJSCX2021-083HLJU).
Data Availability Statement
Frost formation data provided in this study are available on request from corresponding authors. Population density data were obtained from seven censuses in China, of which the first through sixth census data were from the website of Scientific Data of China(
http://www.csdata.org/p/574/), and the data of the seventh census were from the official website of the Harbin Municipal People's Government(
https://www.harbin.gov.cn/haerbin/c104569/202105/c01_70396.shtml).
Conflicts of Interest
The authors declare that they have no conflict of interest.
References
- Song, C.; Dai, C.; Wang, C.; Yu, M.; Gao, Y.; Tu, W. Characteristic Analysis of the Spatio-Temporal Distribution of Key Variables of the Soil Freeze–Thaw Processes over Heilongjiang Province, China. Water 2022, 14, 2573. [Google Scholar] [CrossRef]
- Xiang, L.; Lijuan, C.; Peiqun, Z. Characteristics of Interdecadal Variations in First-Frost Date in Northern China During 1954-2005. Advances in Climate Change Research 2008. [Google Scholar]
-
Climate Change 2021: The Physical Science Basis. Contribution of Working Group I to the Sixth Assessment Report of the Intergovernmental Panel on Climate Change; Masson-Delmotte, V., Zhai, P., Pirani, A., Connors, S.L., Péan, C., Berger, S., Caud, N., Chen, Y., Goldfarb, L., Gomis, M.I., Huang, M., Leitzell, K., Lonnoy, E., Matthews, J.B.R., Maycock, T.K., Waterfield, T., Yelekçi, Ö., Yu, R., Zhou, B., Eds.; Cambridge University Press: Cambridge, United Kingdom; New York, NY, USA, 2021. [Google Scholar]
- Adger, W.N.; Huq, S.; Brown, K.; Conway, D.; Hulme, M. Adaptation to Climate Change in the Developing World. Progress in Development Studies 2003, 3, 179–195. [Google Scholar] [CrossRef]
- Burakowski, E.A.; Wake, C.P.; Braswell, B.; Brown, D.P. Trends in Wintertime Climate in the Northeastern United States: 1965–2005. J. Geophys. Res. 2008, 113, D20114. [Google Scholar] [CrossRef]
- Huntington, T.G.; Richardson, A.D.; McGuire, K.J.; Hayhoe, K. Climate and Hydrological Changes in the Northeastern United States: Recent Trends and Implications for Forested and Aquatic EcosystemsThis Article Is One of a Selection of Papers from NE Forests 2100: A Synthesis of Climate Change Impacts on Forests of the Northeastern US and Eastern Canada. Can. J. For. Res. 2009, 39, 199–212. [Google Scholar] [CrossRef]
- Strain, B.R. The Effect of a Late Spring Frost on the Radial Growth of Variant Quaking Aspen Biotypes. Forest Science 1966, 3. [Google Scholar] [CrossRef]
- Inouye, D.W. Effects of Climate Change on Phenology, Frost Damage, and Floral Abundance of Montane Wildflowers. Ecology 2008, 89, 353–362. [Google Scholar] [CrossRef]
- Perry, E.M.; Nuttall, J.G.; Wallace, A.J.; Fitzgerald, G.J. In-Field Methods for Rapid Detection of Frost Damage in Australian Dryland Wheat during the Reproductive and Grain-Filling Phase. Crop Pasture Sci. 2017, 68, 516. [Google Scholar] [CrossRef]
- Leske, B.A.; Biddulph, T.B. Estimating Effects of Radiation Frost on Wheat Using a Field-Based Frost Control Treatment to Stop Freezing Damage. Genes 2022, 13, 578. [Google Scholar] [CrossRef] [PubMed]
- Fuller, M.P.; Fuller, A.M.; Kaniouras, S.; Christophers, J.; Fredericks, T. The Freezing Characteristics of Wheat at Ear Emergence. European Journal of Agronomy 2007, 26, 435–441. [Google Scholar] [CrossRef]
- Kang, S.K.; Ahn, K.H.; Choi, S.T.; Do, K.R.; Cho, K.S. Effect of Planting Site and Direction of Fruiting on Fruit Frost Damage in Persimmon (Diospyros Kaki ’Fuyu’) Fruits from Environment-Friendly Orchard. Korean Journal of Organic Agricultue 2014, 22, 789–799. [Google Scholar] [CrossRef]
- Alharbi, N.H.; Alghamdi, S.S.; Migdadi, H.M.; El-Harty, E.H.; Adhikari, K.N. Evaluation of Frost Damage and Pod Set in Faba Bean (Vicia Faba L.) under Field Conditions. Plants 2021, 10, 1925. [Google Scholar] [CrossRef] [PubMed]
- Julian, C.; Herrero, M.; Rodrigo, J. Flower Bud Drop and Pre-Blossom Frost Damage in Apricot (Prunus Armeniaca L.). Journal of Applied Botany and Food Quality 2007, 81, 21–25. [Google Scholar] [CrossRef]
- Lou, W.; Zhao, Y.; Huang, X.; Zhu, T.; Yang, M.; Deng, S.; Zhou, Z.; Zhang, Y.; Sun, Q.; Chen, S. Frost Risk Assessment Based on the Frost-Induced Injury Rate of Tea Buds: A Case Study of the Yuezhou Longjing Tea Production Area, China. European Journal of Agronomy 2023, 147, 126839. [Google Scholar] [CrossRef]
- Guillaume, C.; Isabelle, C.; Marc, B.; Thierry, A. Assessing Frost Damages Using Dynamic Models in Walnut Trees: Exposure Rather than Vulnerability Controls Frost Risks: Frost Risks in Walnut Trees. Plant Cell Environ 2018, 41, 1008–1021. [Google Scholar] [CrossRef]
- Souther, S.; McGraw, J.B. Vulnerability of Wild American Ginseng to an Extreme Early Spring Temperature Fluctuation. Population Ecology 2011, 53, 119–129. [Google Scholar] [CrossRef]
- Ma, Q.; Huang, J.; Hänninen, H.; Berninger, F. Divergent Trends in the Risk of Spring Frost Damage to Trees in Europe with Recent Warming. Glob Change Biol 2019, 25, 351–360. [Google Scholar] [CrossRef]
- Gu, L.; Hanson, P.J.; Post, W.M.; Kaiser, D.P.; Yang, B.; Nemani, R.; Pallardy, S.G.; Meyers, T. The 2007 Eastern US Spring Freeze: Increased Cold Damage in a Warming World? BioScience 2008, 58, 253–262. [Google Scholar] [CrossRef]
- Meiners, S.J.; Presley, G.N. Differential Damage of a Late Frost to Ozark Tree Species 1. The Journal of the Torrey Botanical Society 2015, 142, 12–17. [Google Scholar] [CrossRef]
- Kurihashi, Y.; Konno, H.; Hama, Y. Effects of Frost-Damaged Reinforced Concrete Beams on Their Impact Resistance Behavior. Construction and Building Materials 2021, 274, 122089. [Google Scholar] [CrossRef]
- Carbonation of concrete cover of reinforcement as a cause of loss of durability of structures. Archives of Civil Engineering 2023. [CrossRef]
- Su, T.; Huang, Z.; Yuan, J.; Zou, Z.; Wang, C.; Yi, H. Bond Properties of Deformed Rebar in Frost-Damaged Recycled Coarse Aggregate Concrete under Repeated Loading. J. Mater. Civ. Eng. 2022, 34, 04022257. [Google Scholar] [CrossRef]
- Xu, S.; Nie, B.; Li, A. Bond Properties for Plain Bars in Frost-Damaged Concrete. Magazine of Concrete Research 2019, 71, 975–988. [Google Scholar] [CrossRef]
- Tahiri, I.; Dangla, P.; Vandamme, M.; Vu, Q.H. Numerical Investigation of Salt-Frost Damage of Pervious Concrete at the Scale of a Few Aggregates. Cement and Concrete Research 2022, 162, 106971. [Google Scholar] [CrossRef]
- Liu, B.; Henderson, M.; Xu, M. Spatiotemporal Change in China’s Frost Days and Frost-Free Season, 1955–2000. J. Geophys. Res. 2008, 113, D12104. [Google Scholar] [CrossRef]
- Elizbarashvili, E.Sh.; Elizbarashvili, M.E.; Elizbarashvili, Sh.E.; Kutaladze, N.B.; Gogiya, N.M. Characteristics of Frost Days in the Mountain Regions of Georgia. Russ. Meteorol. Hydrol. 2019, 44, 145–151. [Google Scholar] [CrossRef]
- García-Martín, A.; Paniagua, L.L.; Moral, F.J.; Rebollo, F.J.; Rozas, M.A. Spatiotemporal Analysis of the Frost Regime in the Iberian Peninsula in the Context of Climate Change (1975–2018). Sustainability 2021, 13, 8491. [Google Scholar] [CrossRef]
- Easterling, D.R. RECENT CHANGES IN FROST DAYS AND THE FROST-FREE SEASON IN THE UNITED STATES. Bull. Amer. Meteor. Soc. 2002, 83, 1327–1332. [Google Scholar] [CrossRef]
- Jo, E.S.; Kim, H.-M.; Shin, J.-Y.; Kim, K.R.; Lee, Y.H.; Jee, J.-B. Characteristics and Trends of Spatiotemporal Distribution of Frost Occurrence in South Korea for 21 Years. Korean Journal of Agricultural and Forest Meteorology 2022, 24, 83–94. [Google Scholar]
- Masaki, Y. First and Last Frost Date Determinations Based on Meteorological Observations in Japan: Trend Analysis and Estimation Scheme Construction. Theor Appl Climatol 2021, 145, 411–426. [Google Scholar] [CrossRef]
- Qiang; Zhou; Zhaoqiang; Tianxiao; Liu; Dong; Hou; Renjie; Cui; Song Spatiotemporal Characteristics of Droughts and Floods in Northeastern China and Their Impacts on Agriculture. STOCHASTIC ENVIRONMENTAL RESEARCH AND RISK ASSESSMENT 2018, 32, 2913–2931. [CrossRef]
- Key Laboratory of Transport Industry of Big Data Application Technologies for Comprehensive Transport, Beijing Jiaotong University; Wu, H.; Gao, L.; Key Laboratory of Transport Industry of Big Data Application Technologies for Comprehensive Transport, Beijing Jiaotong University; Song, D.; Key Laboratory of Transport Industry of Big Data Application Technologies for Comprehensive Transport, Beijing Jiaotong University; Yang, Y.; Key Laboratory of Transport Industry of Big Data Application Technologies for Comprehensive Transport, Beijing Jiaotong University; Xu, C.; Key Laboratory of Transport Industry of Big Data Application Technologies for Comprehensive Transport, Beijing Jiaotong University; et al. A Dataset of District/County-Level Population Distribution of China’s Six National Censuses. CSD 2022, 7. [Google Scholar] [CrossRef]
Figure 1.
Study area and distribution of meteorological stations.
Figure 1.
Study area and distribution of meteorological stations.
Figure 2.
Spatial distribution of FSD in Harbin Municipality from 1961 to 2022.
Figure 2.
Spatial distribution of FSD in Harbin Municipality from 1961 to 2022.
Figure 3.
Interannual variation in FSD in Harbin Municipality.
Figure 3.
Interannual variation in FSD in Harbin Municipality.
Figure 4.
M-K(a), pettitt(b), sliding t-test(c) of FSD in Harbin Municipality.
Figure 4.
M-K(a), pettitt(b), sliding t-test(c) of FSD in Harbin Municipality.
Figure 5.
Spatial distribution of FED in Harbin Municipality from 1961 to 2022.
Figure 5.
Spatial distribution of FED in Harbin Municipality from 1961 to 2022.
Figure 6.
Interannual variation in FED in Harbin Municipality.
Figure 6.
Interannual variation in FED in Harbin Municipality.
Figure 7.
M-K(a), pettitt(b),sliding t-test(c) of FSD in Harbin Municipality.
Figure 7.
M-K(a), pettitt(b),sliding t-test(c) of FSD in Harbin Municipality.
Figure 8.
Spatial distribution of FFS in Harbin Municipality from 1961 to 2022.
Figure 8.
Spatial distribution of FFS in Harbin Municipality from 1961 to 2022.
Figure 9.
Interannual variation in FED in Harbin Municipality.
Figure 9.
Interannual variation in FED in Harbin Municipality.
Figure 10.
M-K(a),pettitt(b),sliding t-test(c) of FFS in Harbin Municipality.
Figure 10.
M-K(a),pettitt(b),sliding t-test(c) of FFS in Harbin Municipality.
Table 1.
Names of different meteorological stations.
Table 1.
Names of different meteorological stations.
| Station |
Name |
Station |
Name |
| 50867 |
Bayan |
50962 |
Mulan |
| 50877 |
Yilan |
50963 |
Tonghe |
| 50953 |
Harbin |
50964 |
Fangzheng |
| 50955 |
Shuangcheng |
50965 |
Yanshou |
| 50956 |
Hulan |
50968 |
Shangzhi |
| 50958 |
Acheng |
54080 |
Wuchang |
| 50960 |
Binxian |
—— |
—— |
Table 2.
Relationships of the FSD, FED and FFS with the geographical parameters, average temperature and population in Harbin Municipality.
Table 2.
Relationships of the FSD, FED and FFS with the geographical parameters, average temperature and population in Harbin Municipality.
| Factor |
IF |
FSD |
FED |
FFS |
| CC |
ASL |
-0.05 |
-0.048 |
0.016 |
| LAT |
0.523 |
-0.121 |
0.165 |
| LON |
0.147 |
-0.134 |
0.145 |
| TEMP |
0.363 |
-0.614*
|
0.557*
|
| POP |
0.187 |
-0.514 |
0.426 |
| RG |
ASL |
0.007 |
-0.028 |
0.036 |
| LAT |
1.314 |
-0.4164 |
5.478 |
| LON |
-0.013 |
1.505 |
-1.519 |
| TEMP |
1.383 |
-3.026 |
4.409 |
| POP |
~0 |
-0.002 |
0.002 |
Table 3.
Variations of the FSD, FED and FFS in different meteorological stations of Harbin Municipality from 1961 to 2022.
Table 3.
Variations of the FSD, FED and FFS in different meteorological stations of Harbin Municipality from 1961 to 2022.
| meteorological stations |
FSD |
FED |
FFS |
| Ave.(d) |
Tre.(d/10a) |
Ave.(d) |
Tre.(d/10a) |
Ave.(d) |
Tre.(d/10a) |
| 50867 |
267 |
2.14 |
127 |
-1.87 |
139 |
4.01 |
| 50877 |
269 |
2.22 |
127 |
-1.64 |
143 |
3.86 |
| 50953 |
269 |
2.01 |
121 |
-2.23 |
148 |
4.24 |
| 50955 |
268 |
1.64 |
125 |
0.8 |
143 |
0.84 |
| 50956 |
270 |
1.52 |
123 |
0.27 |
147 |
1.25 |
| 50958 |
268 |
1.06 |
122 |
-0.21 |
146 |
1.27 |
| 50960 |
272 |
0.61 |
122 |
0.18 |
149 |
0.43 |
| 50962 |
267 |
2.09 |
132 |
-2.22 |
136 |
4.31 |
| 50963 |
267 |
1.92 |
129 |
-2.72 |
138 |
4.63 |
| 50964 |
270 |
1.59 |
127 |
-1.48 |
143 |
3.07 |
| 50965 |
265 |
1.78 |
132 |
-1.93 |
133 |
3.71 |
| 50968 |
264 |
2.91 |
135 |
-2.74 |
129 |
5.65 |
| 54080 |
269 |
1.59 |
127 |
-0.73 |
142 |
2.32 |
| Ave. |
268 |
1.77 |
127 |
-1.27 |
141 |
3.05 |
Table 4.
Grey correlation coefficient of the FSD ,FED and FFS with the geographical parameters, average temperature and population in Harbin Municipality.
Table 4.
Grey correlation coefficient of the FSD ,FED and FFS with the geographical parameters, average temperature and population in Harbin Municipality.
| Factor |
IF |
FSD |
FED |
FFS |
| GCC |
ASL |
0.942967 |
0.939464 |
0.951001 |
| LAT |
0.987238 |
0.975974 |
0.992901 |
| LON |
0.988881 |
0.97644 |
0.993903 |
| TEMP |
0.958773 |
0.971249 |
0.960265 |
| POP |
0.848286 |
0.847311 |
0.857801 |
|
Disclaimer/Publisher’s Note: The statements, opinions and data contained in all publications are solely those of the individual author(s) and contributor(s) and not of MDPI and/or the editor(s). MDPI and/or the editor(s) disclaim responsibility for any injury to people or property resulting from any ideas, methods, instructions or products referred to in the content. |
© 2023 by the authors. Licensee MDPI, Basel, Switzerland. This article is an open access article distributed under the terms and conditions of the Creative Commons Attribution (CC BY) license (http://creativecommons.org/licenses/by/4.0/).
