Submitted:
11 August 2023
Posted:
14 August 2023
You are already at the latest version
Abstract
Keywords:
Introduction
Materials and methods
Participants
Experiment 1
Experiment 2
Data analysis
Results
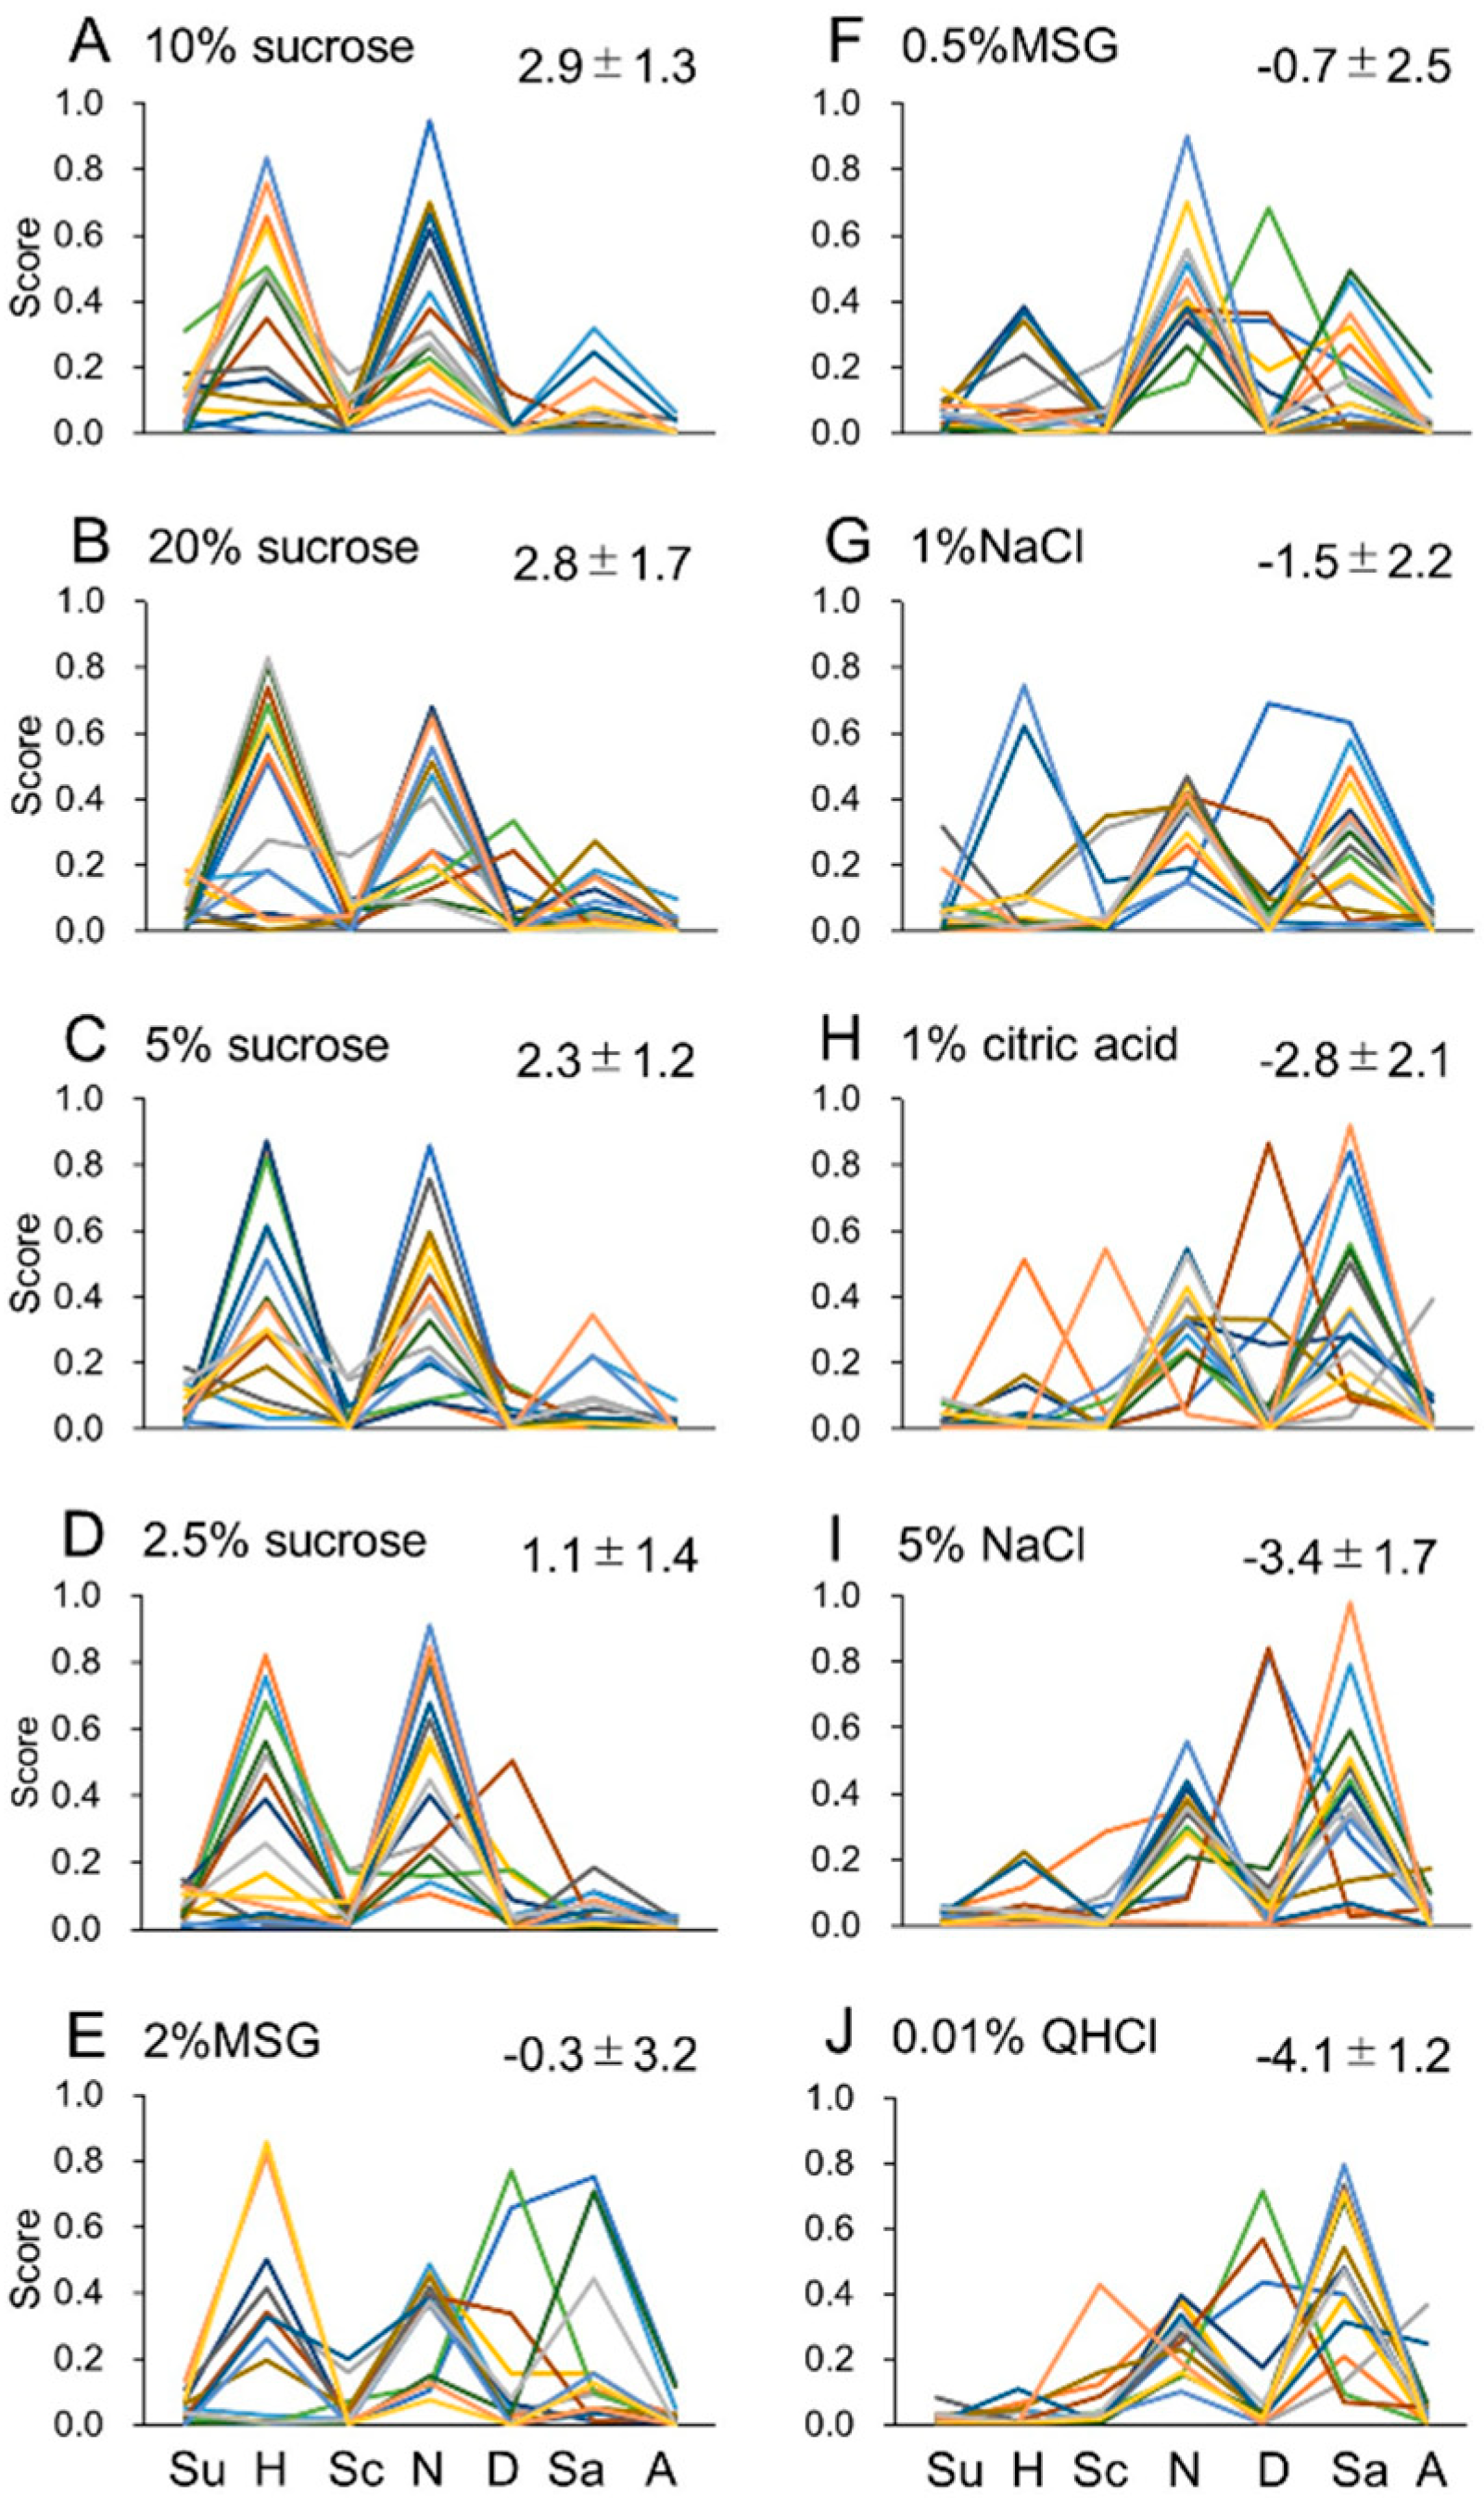
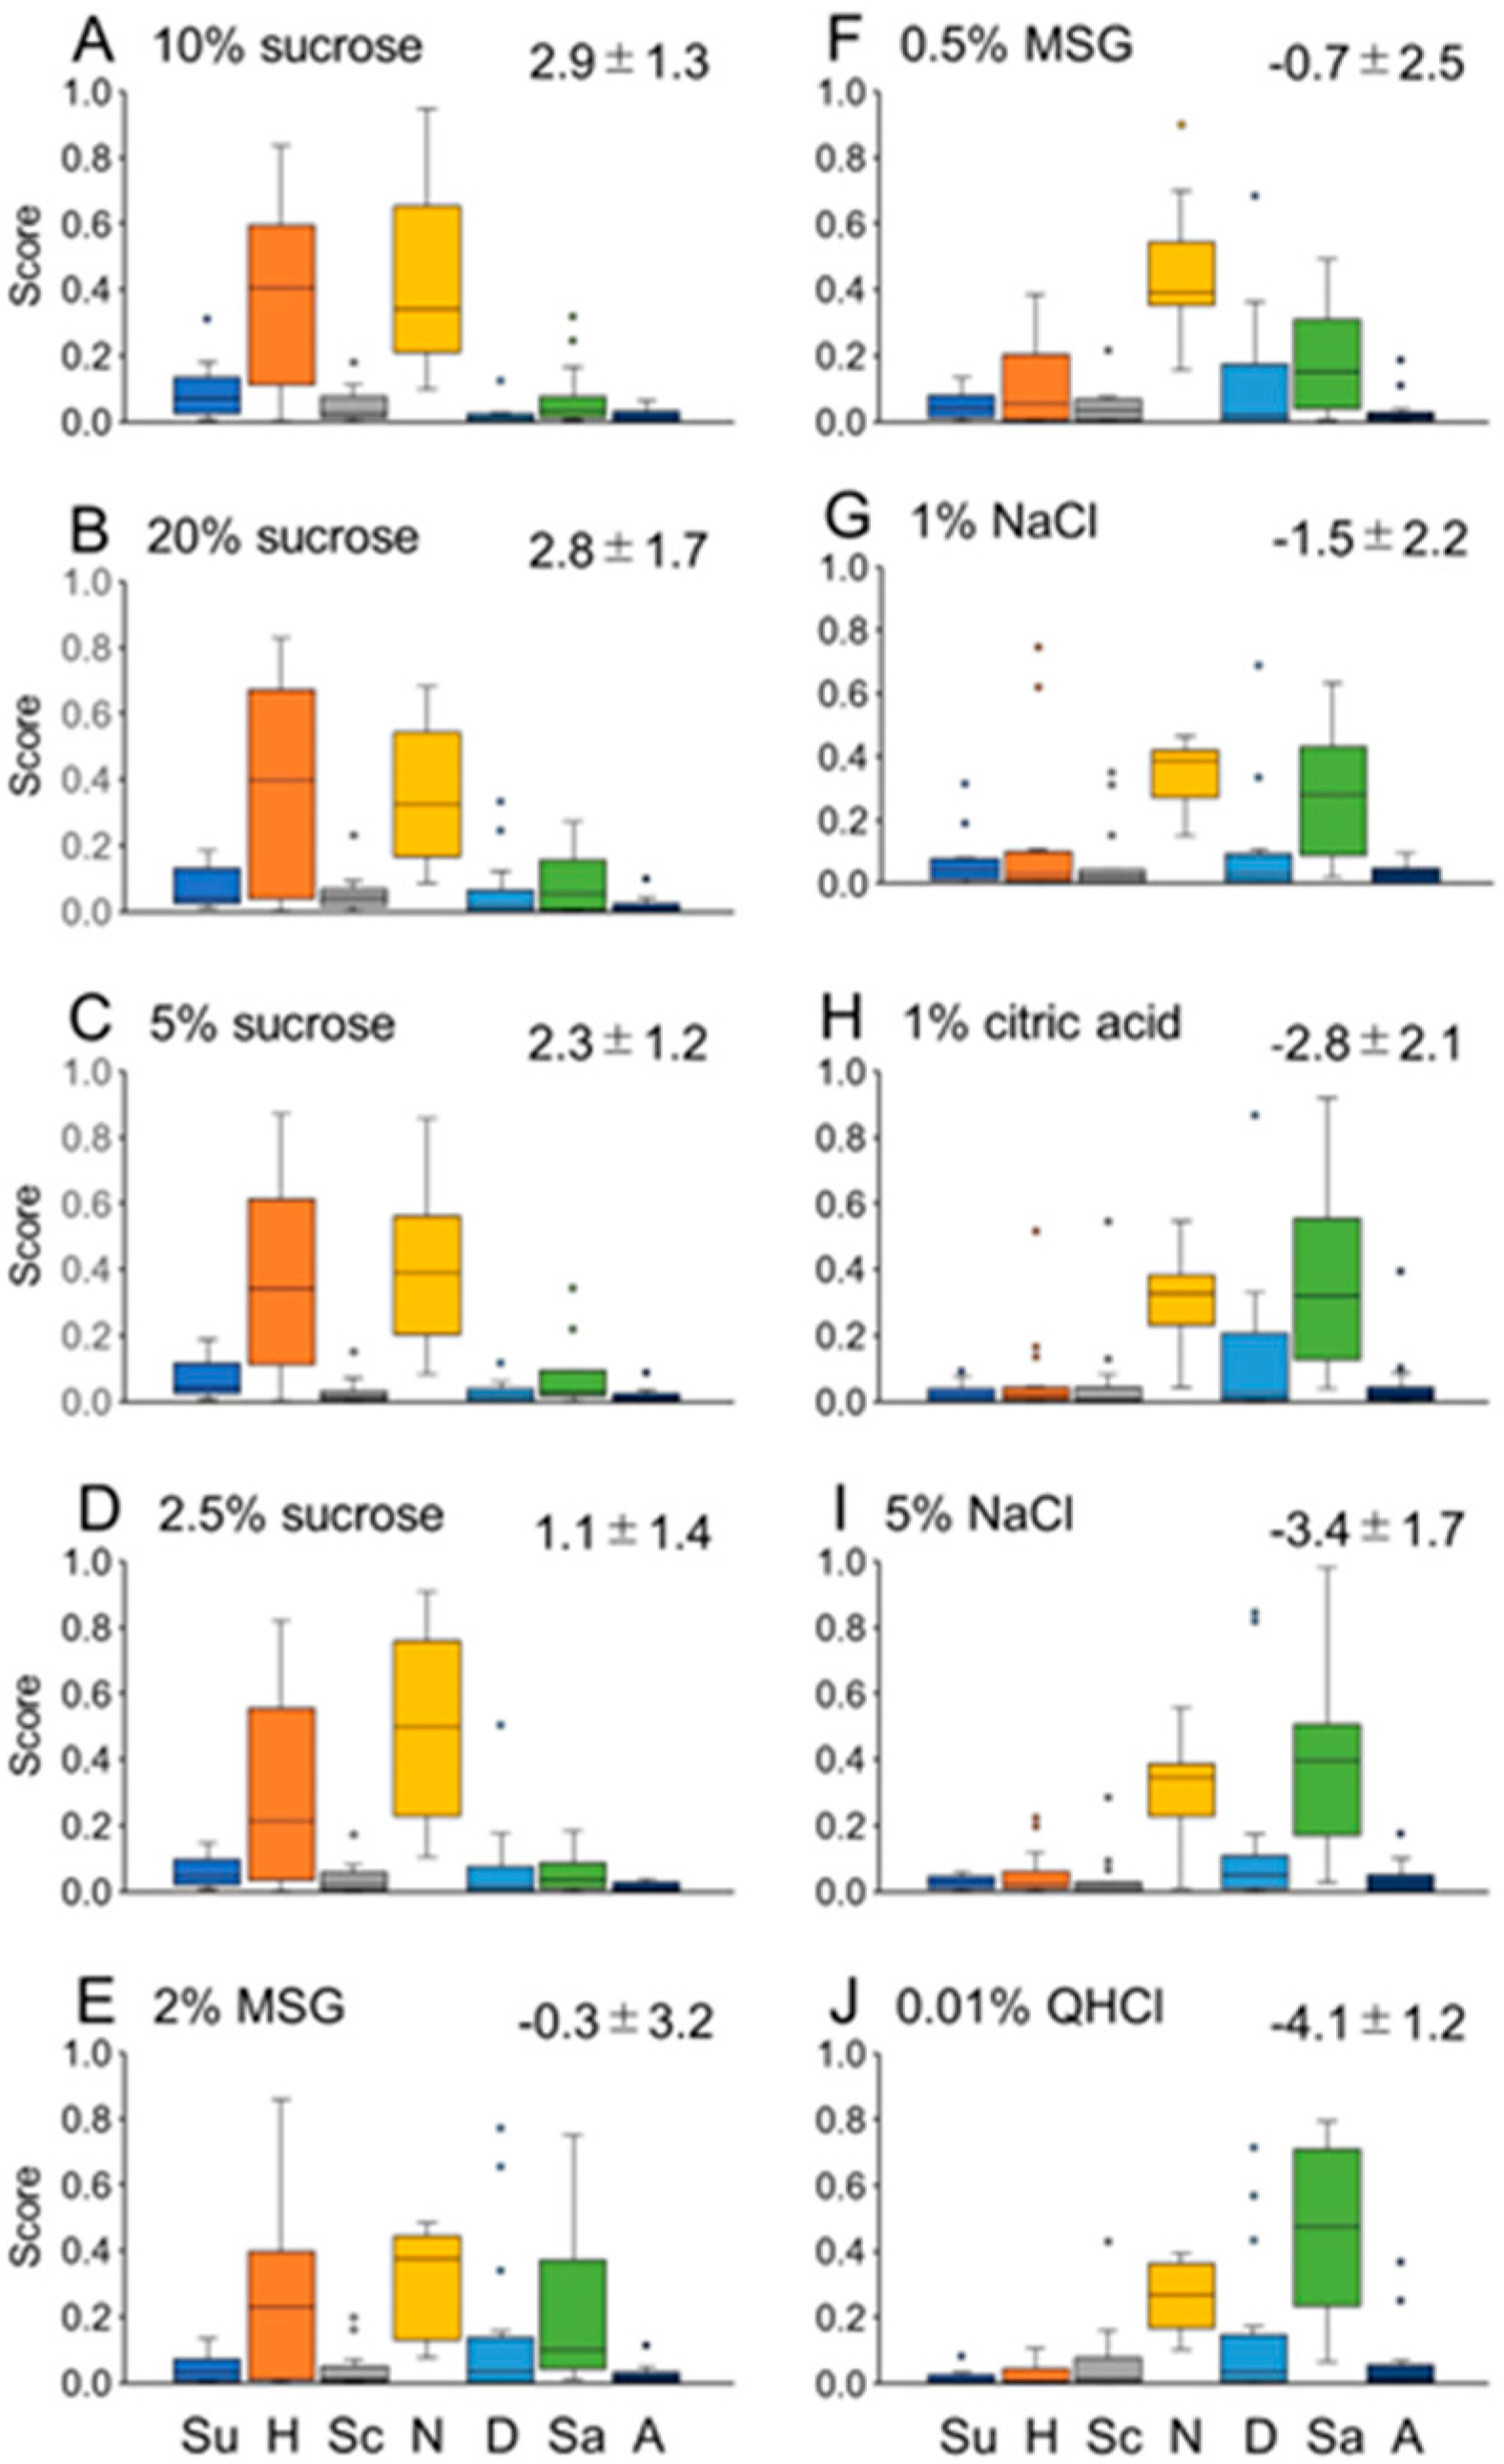
Experiment 1
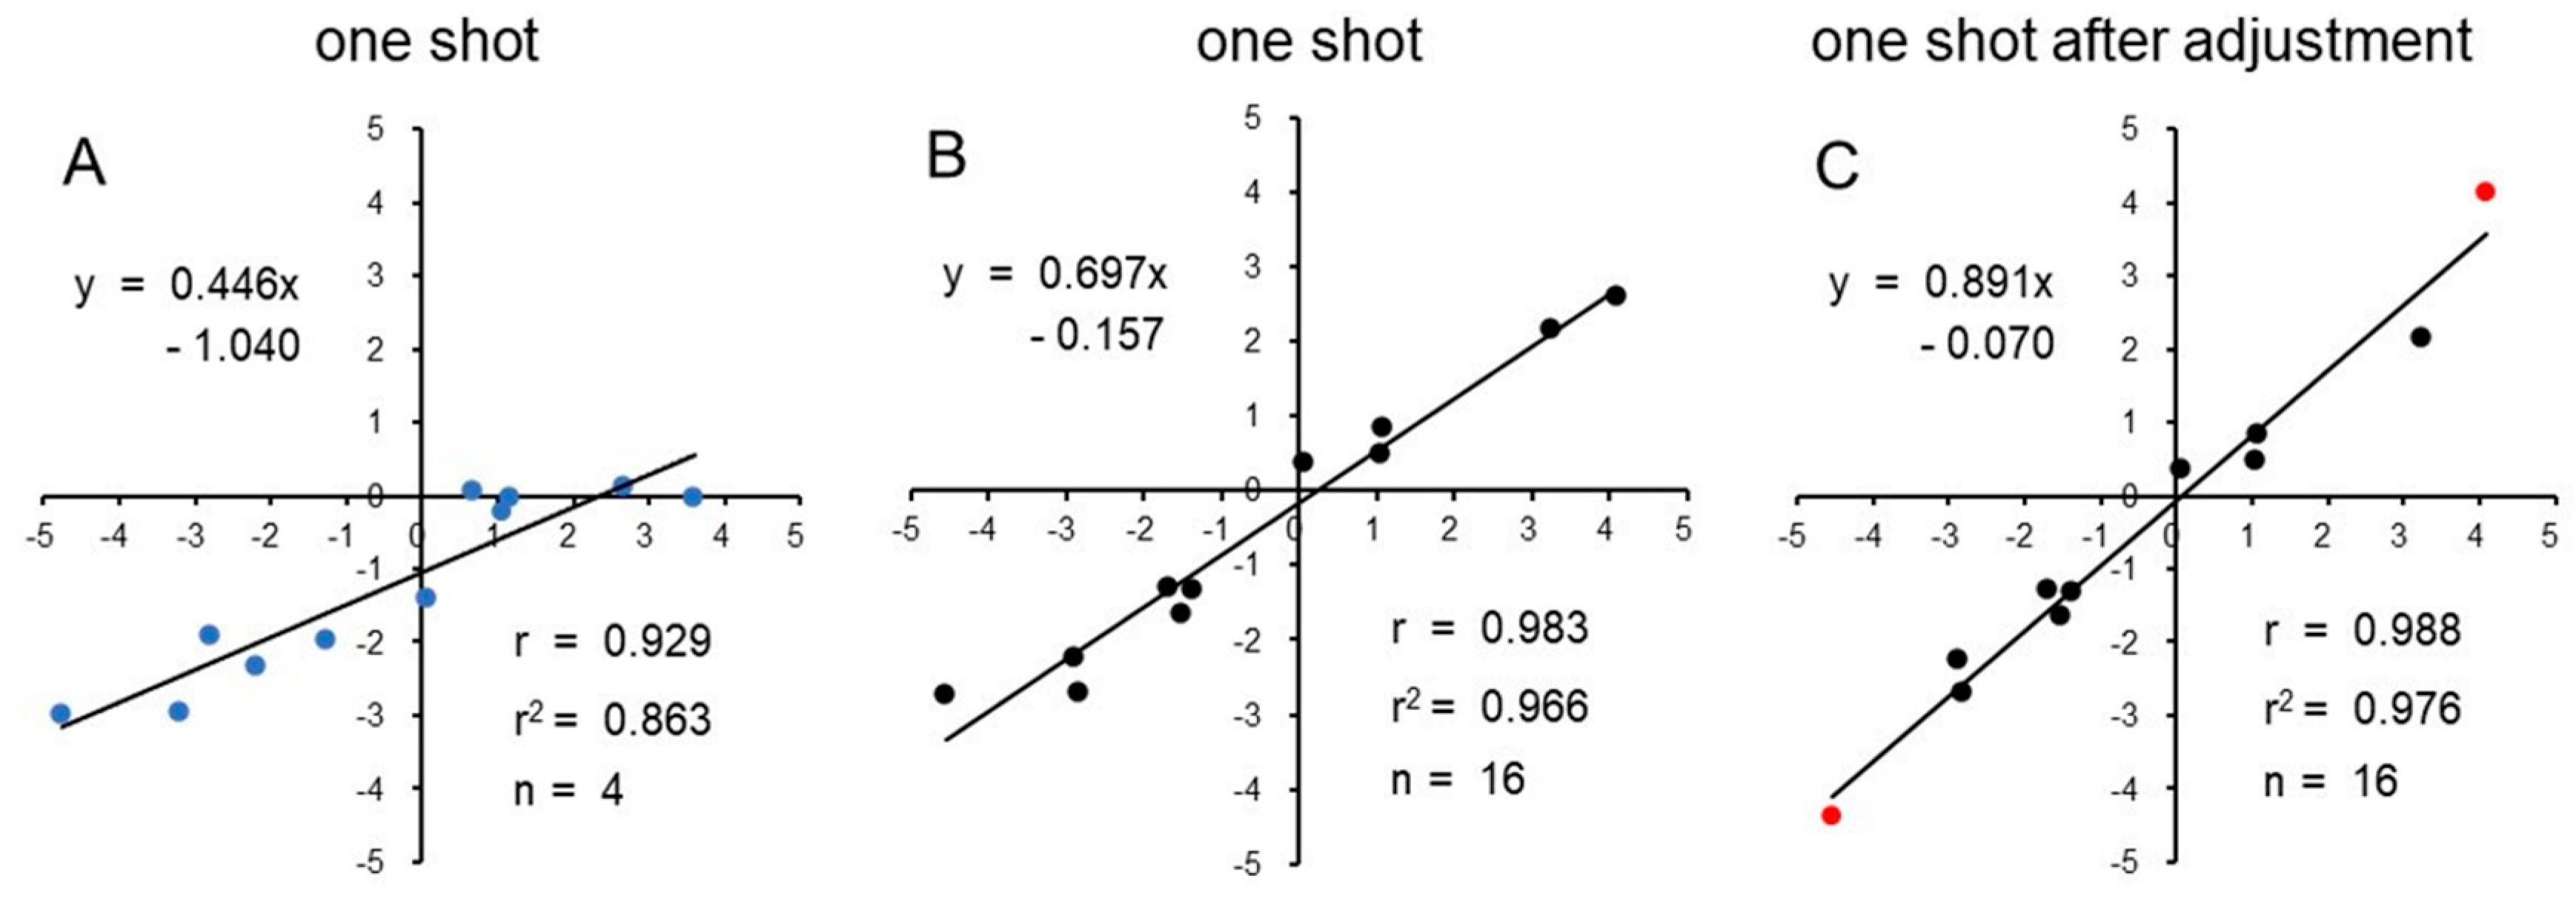
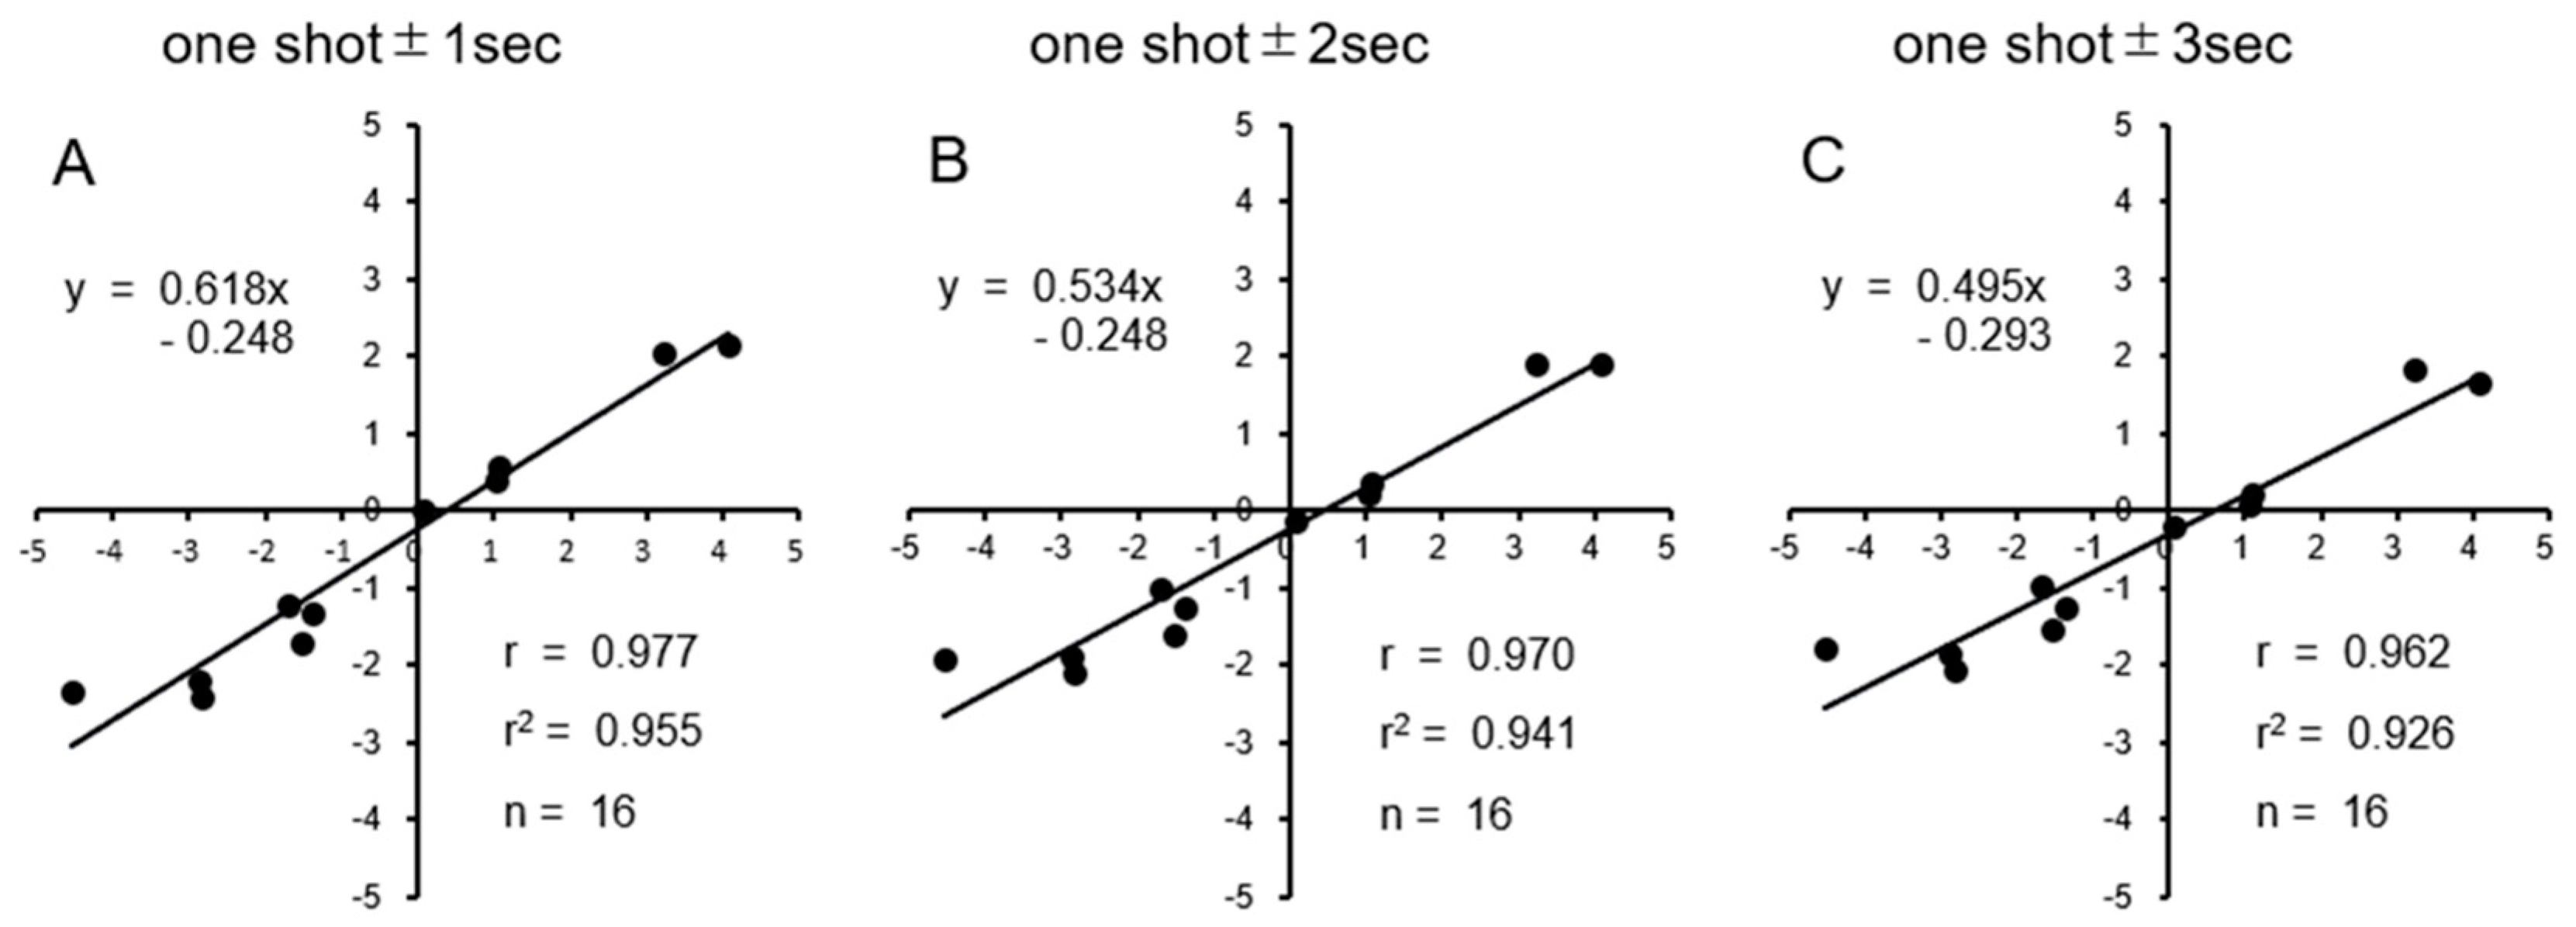
Experiment 2
Discussion
Author Contributions
Funding
Institutional Review Board Statement
Data Availability
Conflicts of Interest
References
- Steiner, J.E. The gustofacial response: Observation on normal and anencephalic newborn infants. In Symposium on Oral Sensation and Perception-IV; Bosma, J.F., Ed.; NIH-DHEW: Bethesda, 1973; pp. 254–278. [Google Scholar]
- Steiner, J.E.; Glaser, D.; Hawilo, M.E.; Berridge, K.C. Comparative expression of hedonic impact: affective reactions to taste by human infants and other primates. Neurosci Biobehav Rev. 2001, 25, 53–74. [Google Scholar] [CrossRef] [PubMed]
- Torrico, D.D.; Fuentes, S.; Gonzalez, V.C.; Ashman, H.; Dunshea, F.R. Cross-cultural effects of food product familiarity on sensory acceptability and non-invasive physiological responses of consumers. Food Res Int. 2019, 115, 439–450. [Google Scholar] [CrossRef] [PubMed]
- Bartkiene, E.; Steibliene, V.; Adomaitiene, V.; Juodeikiene, G.; Cernauskas, D.; Lele, V.; et al. Factors affecting consumer food preferences: food taste and depression-based evoked emotional expressions with the use of face reading technology. Biomed Res Int. 2019, 2097415. [Google Scholar] [CrossRef] [PubMed]
- de Wijk, R. A.; He, W.; Mensink, M.G.; Verhoeven, R.H.; de Graaf, C. ANS responses and facial expressions differentiate between the taste of commercial breakfast drinks. PLOS ONE. 2014, 9, e93823. [Google Scholar] [CrossRef] [PubMed]
- Danner, L.; Haindl, S.; Joechl, M.; Duerrschmid, K. Facial expressions and autonomous nervous system responses elicited by tasting different juices. Food Res Int. 2014, 64, 81–90. [Google Scholar] [CrossRef] [PubMed]
- He, W.; Boesveldt, S.; Delplanque, S.; de Graaf, C.; de Wijk, R.A. Sensory-specific satiety: Added insights from autonomic nervous system responses and facial expressions. Physiol Behav. 2017, 170, 12–18. [Google Scholar] [CrossRef] [PubMed]
- Samant, S.S; Chapko, M.J.; Seo, H, -S. Predicting consumer liking and preference based on emotional responses and sensory perception: A study with basic taste solutions. Food Res Int. 2017, 100, 3295–334. [Google Scholar] [CrossRef] [PubMed]
- Zhi, R.; Cao, L.; Cao, G. Asians' facial responsiveness to basic tastes by automated facial expression analysis system. J Food Sci. 2017, 82, 794–806. [Google Scholar] [CrossRef] [PubMed]
- Zhi, R.; Wan, J.; Zhang, D.; Li, W. Correlation between hedonic liking and facial expression measurement using dynamic affective response representation. Food Res Int. 2018, 108, 237–245. [Google Scholar] [CrossRef] [PubMed]
- Kaneko, D.; Hogervorst, M.; Toet, A.; van, Erp. JBF.; Kallen, V.; Brouwer, A.M. Explicit and implicit responses to tasting drinks associated with different tasting experiences. Sensors (Basel) 2019, 19, 4397. [Google Scholar] [CrossRef] [PubMed]
- Yamamoto, T.; Mizuta, H.; Ueji, K. Analysis of facial expressions in response to basic taste stimuli using artificial intelligence to predict perceived hedonic ratings. PLOS ONE. 2021, 16, e0250928. [Google Scholar] [CrossRef]
- Ekman, P.; Friesen, W.V. Constants across cultures in the face and emotion. J Pers Soc Psychol. 1971, 17, 124–129. [Google Scholar] [CrossRef] [PubMed]
- Pizarek, A.; Vickers, Z. Effects of swallowing and spitting on flavor intensity. J. Sensory. Stud. 2017, 32, e12277. [Google Scholar] [CrossRef]
- Running, C.A.; Hayes, J.E. Sip and spit or sip and swallow: Choice of method differentially alters taste intensity estimates across stimuli. Physiol. Behav. 2017, 181, 95–99. [Google Scholar] [CrossRef] [PubMed]
- Dupré, D.; Krumhuber, E.G.; Küster, D.; McKeown, G.J. A performance comparison of eight commercially available automatic classifiers for facial affect recognition. PLOS ONE. 2020, 15, e0231968. [Google Scholar] [CrossRef]
- Wang, Y.; Zhu, Z.; Chen, B.; Fang, F. ; Perceptual learning and recognition confusion reveal the underlying relationships among the six basic emotions. Cogn Emot 2019, 33, 754–767. [Google Scholar] [CrossRef]

Disclaimer/Publisher’s Note: The statements, opinions and data contained in all publications are solely those of the individual author(s) and contributor(s) and not of MDPI and/or the editor(s). MDPI and/or the editor(s) disclaim responsibility for any injury to people or property resulting from any ideas, methods, instructions or products referred to in the content. |
© 2023 by the authors. Licensee MDPI, Basel, Switzerland. This article is an open access article distributed under the terms and conditions of the Creative Commons Attribution (CC BY) license (https://creativecommons.org/licenses/by/4.0/).


