
Submitted:
12 August 2023
Posted:
14 August 2023
You are already at the latest version
Abstract
Soluble cell adhesion molecules (sCAMs) are secreted ectodomain fragments of surface adhesion molecules, ICAM1 and VCAM1. sCAMs have diverse immune functions beyond their primary function, impacting immune cell recruitment and activation. Elevated sVCAM1 levels have been associated with poor cardiovascular disease (CVD) outcomes, supporting its role as a potential diagnostic marker and therapeutic target. Inhibiting sVCAM1 release or interaction with immune cells could offer cardioprotection in conditions such as diabetes. Membrane bound surface adhesion molecules are widely expressed in a wide variety of cell types with higher expression in endothelial cells (ECs), but the source of sCAMs in the circulation is not clear. Hypothesizing that endothelial cells (ECs) could be a potential source of sCAMs, this study investigated whether dysfunctional EC signaling mechanisms during diabetes cause VCAM1 ectodomain shedding. Our results from samples from a inducible diabetic mouse model revealed increased sVCAM1 plasma levels in diabetes. Protein analysis indicated upregulated VCAM1 expression and metalloproteases ADAM10 and ADAM17 in diabetic ECs. ADAMs are known for proteolytic cleavage of adhesion molecules, contributing to inflammation. GSK3β, implicated in EC VCAM1 expression, was found to be activated in diabetic ECs. GSK3β overexpression in control ECs increased ADAM10/17 and VCAM1. A GSK3β inhibitor reduced active GSK3β and VCAM1 ectodomain shedding. These findings suggest that diabetic ECs with elevated GSK3β activity led to VCAM1 upregulation and ADAM10/17-mediated sVCAM1 shedding. This mechanism underscores the potential therapeutic role of GSK3β inhibition in reducing the levels of circulating sVCAM1. The complex roles of sCAMs extend well beyond CVD. Thus, unraveling the intricate involvement of sCAMs in the initiation and progression of vascular disease particularly in diabetes, holds significant therapeutic potential.
Keywords:
diabetic vascular disease
; endothelial cells
; soluble vascular cell adhesion molecule 1
1. Introduction
Diabetes mellitus is a chronic metabolic disorder characterized by hyperglycemia resulting from insulin resistance and/or impaired insulin secretion. The pathogenesis of diabetes involves complex immune and inflammatory processes that contribute to the development and progression of the disease [1,2]. Among the key players in these processes are soluble Intercellular Adhesion Molecule 1 (sICAM1) and soluble Vascular Cell Adhesion Molecule 1 (sVCAM1). This paper examines the role of insulin resistance-triggered glycogen synthase kinase 3β (GSK3β) in endothelial cells as a potential source of circulating sVCAM1 in diabetic mice.
ICAM1 and VCAM1 are transmembrane glycoproteins expressed on the surface of various cell types, including endothelial cells and immune cells. They facilitate immune cell recruitment and adhesion during inflammation, which is crucial for the immune response. However, these adhesion molecules can undergo proteolytic cleavage during inflammatory conditions, releasing soluble forms into the bloodstream, referred to as sICAM1 and sVCAM1 [3,4]. Several studies have investigated the association between soluble CAM (sCAMs) levels and diabetes. Both sICAM1 and sVCAM1 have been implicated in the development of diabetic cardiovascular complications [5,6,7,8,9]. In type 2 diabetes (T2D), increased sICAM1 levels have been reported in the serum of diabetic patients compared to healthy individuals [6]. These elevated levels of sICAM1 are associated with insulin resistance, suggesting its potential as a biomarker for assessing diabetes risk and progression. sVCAM1 has particularly emerged as a biomarker in cardiovascular disease [7]. Elevated levels of sVCAM1 have been observed in diabetic patients, particularly those with poor glycemic control and complications [8]. Diabetes-related complications, such as retinopathy, nephropathy, and cardiovascular disease, are major contributors to morbidity and mortality in diabetic patients [10]. In diabetic retinopathy, increased sVCAM1 levels have been associated with the severity of retinal vascular abnormalities and inflammation in mice and humans [9,11]. Moreover, sVCAM1 has been linked to diabetic nephropathy, with higher levels observed in patients with renal dysfunction [12]. Elevated levels of these soluble adhesion molecules are associated with endothelial dysfunction, atherosclerosis, and increased cardiovascular risk in diabetic individuals[13]. Thus, evidence suggests that sICAM1 and sVCAM1 may serve as indicators of diabetic complications. Given the role of sICAM1 and sVCAM1 in diabetic inflammation and complications, targeting these soluble adhesion molecules presents potential therapeutic implications. Inhibiting the expression or activity of sICAM1 and sVCAM1 could attenuate inflammatory responses and mitigate the progression of diabetic vascular disease. Preclinical studies have explored currently available and commonly used drugs and their effect on sICAM1 and sVCAM1 levels, demonstrating promising results in ameliorating diabetic vascular dysfunction[14,15]. Furthermore, emerging therapeutic strategies aim to directly target the interactions between sICAM1 and sVCAM1 with their receptors, preventing immune cell adhesion and inflammation in diabetes. Despite this knowledge, the source(s) for these increased circulating CAMs in diabetes or other conditions is not well defined.
sICAM1 and sVCAM1 undergo proteolytic cleavage from their membrane-bound forms in a dynamic process significantly influenced by the actions of a family of enzymes called ‘A Disintegrin and Metalloproteases (ADAMs)’. Among these enzymes, ADAM10 and ADAM17 stand out as key players in the generation of soluble adhesion molecules [5,16,17,18]. The proteolytic activity of ADAM10 and ADAM17 is tightly regulated to maintain homeostasis and prevent excessive proteolysis. Several mechanisms control their activation and substrate recognition. The dysregulation of ADAM10 and ADAM17 activity has been implicated in various inflammatory diseases and pathological conditions. Altered cleavage of ICAM1 and VCAM1 by these metalloproteases may contribute to the pathogenesis of conditions such as atherosclerosis, rheumatoid arthritis, and cancer [16,17,18]. Understanding the regulation of these metalloproteases and their impact on soluble adhesion molecules may offer potential therapeutic targets for various inflammatory diseases. Here, we have uncovered that insulin resistance leads to the activation of GSK3β in mesenteric artery endothelial cells, which upregulates VCAM1 expression. GSK3β also independently activates ADAM10 and ADAM17 expression. Together, these metalloproteases cause the shedding of the VCAM1 ectodomain to increase extracellular levels of sVCAM1. A GSK3β inhibitor, tideglusib, was found to be effective in limiting activation of the enzyme and significantly reduced ectodomain shedding of VCAM1. Thus, this article highlights the source of sVCAM1 and identifies a potential checkpoint to prevent VCAM1 shedding that could improve cardiovascular function in diabetes.
2. Results
2.1. High-Fat Diet Combined with Low-Dose Streptozotocin Induces an Insulin-Resistant, T2D Phenotype in Mice
Mice on the HFD-STZ treatment showed a gradual increase in body weight from the start of the diet, with the animals after eight weeks of HFD weighing ~38g (Figure 1A). Fasting blood glucose of the HFD-STZ mice also gradually increased over the same time (Figure 1B). For instance, at 8w after HD start, fasting blood glucose was ∼13 mmol/L, compared with ∼5.5 mmol/L in control mice, or ∼2.36-fold higher (Figure 1B). After the STZ injections, body parameters were measured again, which indicated that fasting blood glucose was ∼18 mmol/L or ∼3.4-fold higher (Figure 1B). The glucose tolerance test (GTT) was performed as done in our previous publication[19] and expressed as area under curve (AUC)[20]. Results indicate that although GTT showed an upward trend after 8 wks of HFD, it was after the STZ injections that glucose tolerance was significantly affected in the diabetic mice (Figure 1C). Next, the HOMA2-IR surrogate index was used to determine the level of insulin resistance in these mice. Fasting blood glucose (Figure 1B) and plasma insulin values (Figure 1D) were uploaded into the HOMA2-IR calculator described in the methods and HOMA2-IR indices were recorded. Results indicate that 8 wk after the start of HFD, HOMA2-IR index was ~1.6 (Figure 1E). However, 2wk after STZ injections, the HOMA2-IR index was ~2.5 (Figure 1E). These data indicate that a high-fat diet combined with STZ leads to obesity, and insulin resistance in mice which resembles a T2D phenotype.
2.2. Plasma Soluble VCAM-1 (sVCAM1) Levels Increase with Insulin Resistance
To verify if the occurrence of insulin resistance influences circulating sVCAM1 levels, plasma from control and diabetic mice was tested using an sVCAM1 ELISA kit. Results suggest that plasma sVCAM1 levels were slightly elevated in pre-insulin-resistant mice, approximately after 8 wks of HFD alone (Figure 2A) but was not significantly different from control mice. In contrast, there was a significant increase in plasma sVCAM1 in the mice after STZ injections that became insulin resistant (Figure 2A). These data suggest that the occurrence of insulin resistance triggers an increase in circulating levels of sVCAM1.
2.3. Endothelial Cells as a Possible Source of Plasma sVCAM1 in Diabetic Animals
Adhesion molecules like VCAM1 are known to be widely expressed in endothelial cells. Hence, we postulated that sVCAM1 shedding occurs from endothelial cells during T2D. To analyze this, mesenteric artery endothelial cells were isolated as described previously and primary cultured for 8–10 days. sVCAM1 levels in the cell culture media were sampled on day 8 of culture after which the cells were lyzed for protein analysis. Results from ELISA of the culture supernatant revealed that sVCAM1 levels were significantly greater in diabetic cells isolated after STZ (wk10) injections than controls or those isolated before STZ injections (wk8, Figure 2E). Next, the expression of VCAM1 in endothelial cells was analyzed using the ProteinSimple AbbyTM capillary electrophoresis Western system (Figure 2B). Results indicated that there was significant upregulation of VCAM1 expression in diabetic endothelial cells after STZ injection than before (Figure 2D). These data suggest that insulin resistance might have a critical role in inducing both the expression of VCAM1 and the shedding of sVCAM1 from endothelial cells.
2.4. Diabetic Endothelial Cells Have Upregulated ADAM10 and ADAM17 Expression
Next, to determine the likely signaling causing VCAM1 shedding in diabetic endothelial cells, we examined the expression of two metalloproteases, ADAM10 and ADAM17, previously suggested to cause VCAM1 shedding. In isolated cells from diabetic mesenteric arteries, the expression of ADAM10 and ADAM17 was upregulated (Figure 3A,B) which coincided with the increase in plasma and extracellular sVCAM1 levels. Next, to verify if the upregulated ADAM10/17 also caused VCAM1 shedding, we overexpressed ADAM10 or 17 plasmid vectors in control endothelial cells and analyzed protein expression. Results indicate that ADAM10 and ADAM17 plasmid vectors increased expression of either protein ~2.5 fold each compared to controls transfected with empty vector (Figure 3A,B). When either ADAM10 or 17 were overexpressed, there was also an increase in cellular VCAM1 expression (Figure 3C,D) and sVCAM1 in the extracellular media (Figure 3E). These results suggest that upregulation of ADAM10 or 17 in diabetic endothelial cells likely causes an increase in sVCAM1 shedding. Since we had also observed an increase in VCAM1 protein expression, we next investigated the possible mechanisms involved.
2.5. Diabetic Endothelial Cell GSK3β Regulates the Expression of ADAM10/17 and VCAM1
Insulin resistance is associated with dysfunctional insulin receptor signaling, affecting the activity of the downstream Akt kinase. Since basal Akt activity phosphorylates and deactivates GSK3β, we hypothesized that insulin resistance likely led to an activation of GSK3β, which induced ADAM10/17 and VCAM1 expression. To verify this, we first probed for levels of inactive GSK3β (pGSK3β-Ser9). Results indicate that pGSK3β levels rapidly fell after the STZ injections in HFD mice (Figure 4A,B), suggesting that insulin resistance was key to activating endothelial GSK3β. We then treated control endothelial cells with MK2206, a specific pan-Akt inhibitor, to inactivate Akt and thereby stimulate GSK3β activation. Results indicate that in the presence of the Akt inhibitor, pGSK3β levels significantly decreased (Figure 4A,B). In addition, when GSK3β was activated by the Akt inhibitor in ECs, the expression of ADAM10, 17, and VCAM1 also significantly increased (Figure 4C–F). In the presence of the Akt inhibitor, MK2206, there was also an increase in sVCAM1 present in the cell culture media (Figure 4G). These results suggest that GSK3β activation in endothelial cells is responsible for an upregulation of VCAM1 expression. GSK3β is also likely involved in ADAM10/17 upregulation that cleave VCAM1 and cause its shedding.
2.6. Selective Inhibition of GSK3β Downregulates Plasma sVCAM1 Levels.
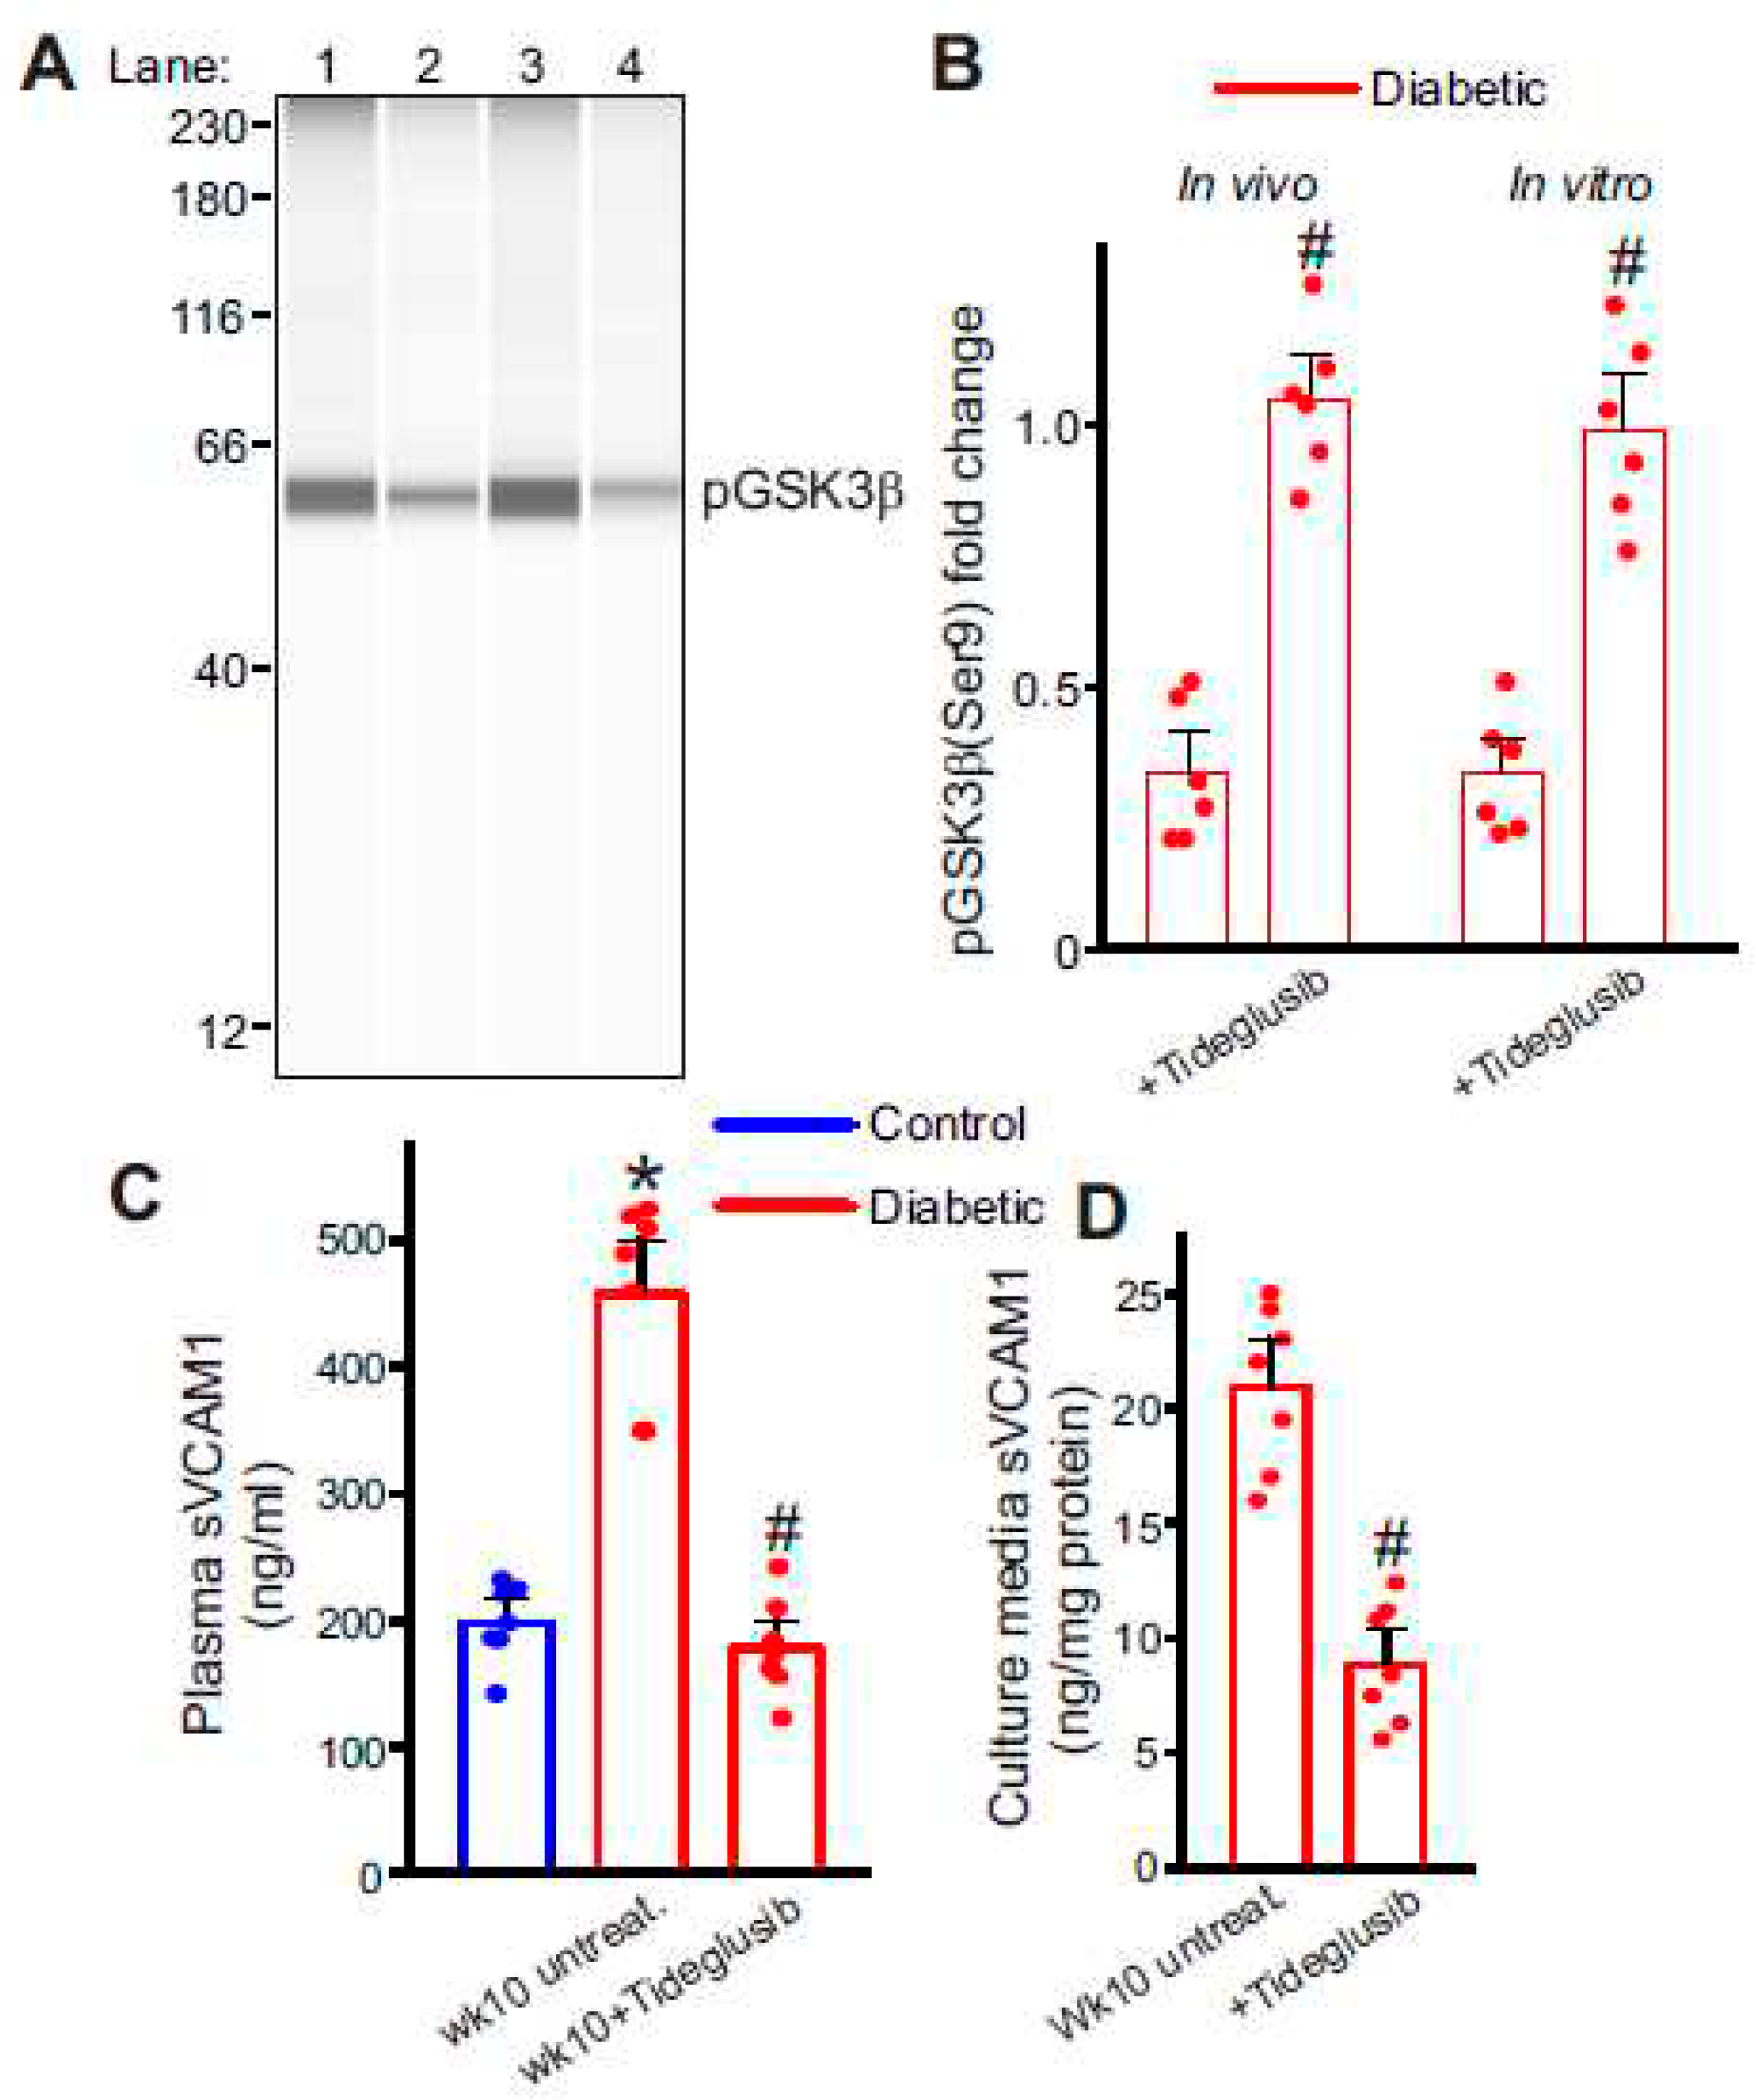
We then tested if GSK3β inhibition was a viable option to decrease plasma sVCAM1 levels in diabetic animals. HFD mice that were injected with STZ were allowed recuperation period of 3 days to allow elimination of STZ. Tideglusib injections were commenced after this period for 2 weeks until mice were euthanized at the end of wk10. As before, plasma samples and mesenteric arteries were collected at the end of the treatment period for analysis. ECs were also collected after STZ injections and were treated with tideglusib in vitro. For this tideglusib (100 nM) was added to the EC culture along with fresh media every day. Results from ELISA show a significant drop in plasma sVCAM1 levels compared to untreated controls (Figure 5A). Protein analysis also showed a significant increase in pGSK3β levels in both whole mesenteric artery samples (Figure 5C,D) and cultured diabetic endothelial cells (Figure 5C,D). sVCAM1 levels of the extracellular media was also significantly reduced compared to untreated diabetic cells (Figure 5B). These data indicate that diabetic EC GSK3β inhibition can decrease the circulating levels of sVCAM1.
In summary, these results indicate that insulin resistance increases circulating levels of sVCAM1. Activation of GSK3β in ECs after insulin resistance upregulates VCAM1 expression whose ectodomain is cleaved by the metalloproteases ADAM10 and ADAM17 that also show increased expression in diabetic ECs. Inhibition of diabetic EC GSK3β can reduce levels of circulating sVCAM1 and could decrease cardiovascular disease risk and confer long-term cardiovascular protection.
3. Discussion
The role of circulating soluble cell adhesion molecules (sCAMs) as indicators of cardiovascular disease risk has been extensively debated. However, the precise sources for these sCAMs have yet to be identified. Cell-adhesion molecules are expressed in a wide variety of cells. Still, given their robust expression in endothelial cells (ECs) and the large surface area in the body that these cells occupy, it was reasonable to hypothesize endothelial cells as potential sources of sCAMs observed in the plasma during disease. This study examined if dysfunctional ECs secrete sCAMs, the potential signaling mechanisms involved, and possible therapeutic targeting to decrease sCAM levels in diabetic mice. Our results suggest that C57BL/6 mice on HFD for 6–8 weeks had a HOMA2-IR index of ~1.6, but after low-dose STZ injections, their HOMA2-IR values were ~2.4, suggesting the development of insulin resistance. Plasma sVCAM1 levels detected by ELISA showed an increase in sVCAM1 following the onset of insulin resistance (IR). To test the hypothesis that dysfunctional ECs likely released sVCAM1, mesenteric arteries from pre- and post-IR diabetic mice were isolated and primary cultured. Extracellular media collected from these EC cultures revealed an increase in sVCAM1 levels compared to control cells. Interestingly, protein analysis revealed that VCAM1 expression and two metalloproteases, ADAM10 and ADAM17, were upregulated in post-IR diabetic ECs. Overexpression of ADAM10 or 17 in control ECs revealed an increase in VCAM1 expression and extracellular sVCAM1 levels. Diabetic ECs had increased active GSK3β expression, and when GSK3β expression was activated in control ECs, the expression of ADAM10/17 and VCAM1 increased. Tideglusib, a specific GSK3β inhibitor, was tested both in vivo and in vitro. In both cases, there was a significant reduction in the expression of active GSK3β and plasma/extracellular sVCAM1 expression. These data collectively suggest that endothelial cells from insulin-resistant diabetic mice have upregulated GSK3β activity which increases VCAM1 expression and the expression of metalloproteases ADAM10 and 17 leading to cleavage of VCAM1 and shedding of its extracellular domain into the plasma as sVCAM1.
ICAM1 and VCAM1 are transmembrane glycoproteins expressed on the surface of various cell types, including endothelial cells and immune cells. They facilitate immune cell recruitment and adhesion during inflammation, which is crucial for a satisfactory immune response[3,4]. However, these adhesion molecules can undergo proteolytic cleavage during inflammatory conditions, releasing soluble forms into the bloodstream, referred to as soluble ICAM1 (sICAM1) and soluble VCAM1 (sVCAM1)[3,4,5,6,7,8,9]. These soluble forms of CAMs are involved in diverse immune processes beyond their cell-adhesion roles[5,6,7,8,9,21,22,23]. They participate in leukocyte migration, transendothelial migration, and immune cell activation, influencing the immune response's overall outcome[3,21,23,24].
Cardiovascular disease (CVD) is a leading cause of mortality worldwide, necessitating the identification of reliable biomarkers for early diagnosis and prognosis. Several studies have investigated the association of sICAM1 and sVCAM1 with CVD, and their potential as diagnostic markers has been a subject of extensive debate[4,21,22,23,25,26,27,28,29,30]. Elevated levels of both sICAM1 and sVCAM1 have been reported in individuals with CVD, with sVCAM1 levels emerging as a particularly promising predictor of adverse outcomes in cardiovascular conditions[7,13]. Researchers have proposed using monoclonal antibodies or small molecule inhibitors to target sICAM1 and sVCAM1 to dampen excessive immune responses in inflammatory diseases[25,28]. Such therapeutic interventions could mitigate tissue damage and reduce disease severity in rheumatoid arthritis and inflammatory bowel disease. Moreover, the significance of sVCAM1 in cardiovascular disease suggests its potential as a therapeutic target for managing atherosclerosis and related complications[4,21,22,23,25,26,27,28,29,30]. Inhibition of sVCAM1 release or its interaction with immune cells could slow the progression of atherosclerosis and reduce the risk of cardiovascular events. Aside from their potential as diagnostic markers, these soluble CAMs have also garnered attention as potential therapeutic targets in various diseases, extending beyond CVD. Some research studies have investigated their involvement in cancer, indicating their possible relevance in a broader range of conditions[31,32,33]. This expanding knowledge highlights the importance of understanding the complex roles of these soluble adhesion molecules in various disease contexts.
Results from our study show that plasma sVCAM1 levels increased after the onset of insulin resistance. We used the HFD-low dose STZ injections to induce insulin resistance in C57BL/6 mice. The C57BL/6 HFD-low dose STZ (HFD-STZ) model of type 2 diabetes (T2D) is an exceptional tool that closely imitates the polygenic nature of human disease [34,35,36,37,38,39,40,41]. We chose the inducible model to precisely time the occurrence of insulin resistance in our study mice. It's worth noting here that this model's efficacy largely depends on the diet composition. The majority of studies employing this model (without STZ injections) utilize feed with 60% of its adjusted calories derived from fat. Despite this high-fat content, a considerable period of 9–11 weeks is still required to achieve reliable induction of insulin resistance[42,43]. US diets are estimated to be 30–40% energy from fat[44,45,46]. In our study, we utilized the TD.88137 'Western diet,' which derives ~45% of its calorific value from milk fat. We also used an updated version of the HOMA-IR index calculator to estimate insulin resistance in our mice[47,48]. Our experimental mice typically achieved a HOMA2-IR index of ~2 or above, an accepted threshold for IR, after diet only for twelve weeks or more. Still, administration of low-dose STZ injections at ~8 weeks of HFD reliably induced insulin resistance with calculated HOMA2-IR indices of >2. Our next goal was to determine the source of soluble VCAM1.
Endothelial cells are known for their robust CAM expression. Typically, these proteins are plasma membrane-localized, and their levels increase during various inflammatory conditions to aid in the immune response. Diabetes is increasingly recognized as an inflammatory disease[49,50,51]. While dysfunctional endothelium is commonly observed in diabetic vasculature[52,53], the crosstalk between endothelial cells and the immune system is still unclear. Given their large surface area, we tested the hypothesis that ECs and specifically from the mesenteric artery, are likely sources of circulating sVCAM1. In this study, extracellular sVCAM1 levels were increased in the media of cultured ECs from diabetic arteries. Interestingly, EC VCAM1 protein levels were also increased, suggesting that protein expression and cleavage are upregulated in diabetic ECs.
ADAMs, a group of transmembrane matrix metalloproteases (MMPs), play a significant role in the proteolytic cleavage of adhesion molecules and chemokines [54]. In diabetic vasculature, the dysregulation of ADAMs has garnered significant interest due to their pivotal role in inflammation, cell adhesion, and extracellular matrix remodeling. ADAM10 and ADAM17 have been extensively studied in the context of diabetic vasculature. These metalloproteases are involved in the proteolytic cleavage of cell surface molecules, such as CX3CL1, VCAM-1, ICAM-1, and JAM-A, which play essential roles in endothelial cell function and leukocyte adhesion[5,16,17,18]. Dysregulated ADAM activity can increase sCAM ectodomain shedding, contributing to endothelial dysfunction and the recruitment of inflammatory cells in diabetic vasculature[55]. In diabetic retinopathy, ADAM17-mediated cleavage of CX3CL1 and VCAM-1 in retinal endothelial cells has been associated with vascular leakage and retinal neovascularization[56]. Moreover, ADAM10-mediated shedding of CX3CL1 has been linked to diabetic nephropathy, where increased levels of soluble CX3CL1 contribute to kidney injury and fibrosis[57]. In several CVDs, ADAM10 and ADAM17-mediated cleavage of adhesion molecules has been implicated in atherosclerosis and vascular remodeling[58]. The elevated levels of sCAMs have been suggested as important mediators of progressive endothelial dysfunction seen in the diabetic vasculature that is often refractive to commonly employed anti-diabetic treatment strategies. In our study, expectedly, we found an increase in the expression of ADAM10 and ADAM17 in diabetic ECs. Hence, it was highly likely that one or both enzymes mediate the ectodomain cleavage and shedding of EC VCAM1.
We found that the critical instigator in EC VCAM1 expression and sVCAM1 shedding was GSK3β. Our data showed an increase in active GSK3β in ECs after the insulin resistance, which was associated with a concurrent increase in VCAM1, ADAM10, and 17 expressions. Insulin acts via the insulin receptor to activate downstream Akt signaling[59,60,61,62]. Insulin resistance is associated with dysfunctional Akt signaling[59,60,61,62]. Phosphorylation of GSK3β at serine-9 is critical in regulating the activation of GSK3β in cells. Akt kinase downstream to the insulin receptor is one of several kinases that can deactivate GSK3β[59,60,61,62]. GSK3β activation was shown to increase EC VCAM1 expression after TNF-alpha treatment[63]. Hence it is likely that activated GSK3β directly increased the expression of VCAM1 in our diabetic ECs. Similarly, while active GSK3β was upregulated in diabetic ECs, activation of GSK3β in control ECs using an Akt inhibitor was followed by an increase in ADAM10 and 17 expressions. These results suggest that 1. Basal Akt activity in ECs plays a major role in modulating GSK3β activation and 2. ADAM10/17 upregulation was likely associated with the increase in GSK3β activation. Several other kinases are known to be activated in diabetes and it is possible that GSK3β is only one of the mechanisms that triggers ADAM10 and 17 upregulation. Finally, we tested the effect of a specific GSK3β inhibitor on EC sVCAM1 shedding. Tideglusib (NP-12, NP031112) is a selective and irreversible GSK3β inhibitor that was previously in clinical trials for Alzheimer’s disease and progressive supranuclear palsy[64,65,66]. Although withdrawn for lack of efficacy in these conditions, the drug has remained a vital investigational tool. Tideglusib was administered to diabetic mice three days after completion of the STZ injections. Mice received the drug only with no other concurrent anti-diabetic therapy to help better identify the specific effects of GSK3β inhibition. One week of drug administration significantly decreased the whole mesenteric artery and EC GSK3β activation. There was also a significant drop in plasma and extracellular media sVCAM1 levels. These data suggest that arterial/EC GSK3β inhibition can significantly reduce the circulating levels of sVCAM1 and may offer long-term cardiovascular protection, especially when combined with other anti-diabetic drug therapies.
The interpretation of the upregulation of ADAM10 and ADAM17, particularly in ECs, is not straightforward due to its context-dependent implications. EC surface adhesion molecules, such as VCAM1, play a crucial role in mediating leukocyte attachment and infiltration. This suggests that VCAM1 ectodomain shedding by metalloproteases may regulate the local inflammatory response in healthy tissue. However, in the context of diabetes, multiple factors, including the activation of GSK3β, can trigger a self-sustaining deleterious feedback loop, further enhancing the expression of these metalloproteases. Recent research has shown that EC ADAM17 can cleave the insulin receptor ectodomain, leading to cellular insulin resistance[67], which could exacerbate insulin resistance with initial upregulation of ADAM17 potentially leading to further GSK3β activation. Moreover, the role of circulating sVCAM1 and sICAM1 is likely more complex than anticipated. These circulating CAMs could induce the activation of circulating and resident immune cells, thus triggering an inflammatory response. Hence, the sheddase activity of ADAMs in the diabetic vasculature, along with the impact of released ectodomains into the circulation, needs renewed attention.
4. Materials and Methods
4.1. Animal Usage
All experimental protocols were in accordance with institutional guidelines approved by the Institutional Animal Care and Use Committee, UTHSC. Male C57BL/6J were used for experiments, and diabetic mice were generated using the high-fat diet (HFD)-low dose streptozotocin (STZ, Sigma Aldrich) protocol described in our previous publication[19]. Briefly, 6wk old mice were started on HFD. Mice in the HFD group were fed with TD.88137 (Inotiv, previously Envigo). Following eight weeks of HFD, mice were injected with low-dose STZ (40mg/Kg/d, IP, 4 doses) to induce insulin resistance and were continued on HFD for another 2 weeks. Mice were euthanized before or after STZ injections as required. Blood glucose was assessed using AlphaTrak2 glucose test strips, and plasma insulin was evaluated using a mouse insulin ELISA kit (Crystal Chem). The homeostasis model assessment-2 (HOMA2-IR) index was calculated using the calculator available on the Diabetes Trials Unit of the University of Oxford website (https://www.dtu.ox.ac.uk/homacalculator/)[47] and done previously[39]. Tideglusib (10 mg/kg/d, IP, for one week, Sigma Aldrich) was started 3 days after the treatment group's final dose of STZ and continued until the end of the experimental period. Tideglusib was dissolved in 4% DMSO + corn oil for in vivo administration.
4.2. Tissue Preparation
For the collection of arteries, mice were humanely euthanized with an overdose of isofluorane anesthesia followed by decapitation. Mesenteric arteries were collected and cleaned in ice-cold physiological saline solution (PSS) that contained (in mM): 112 NaCl, 6 KCl, 24 NaHCO3, 1.8 CaCl2, 1.2 MgSO4, 1.2 KH2PO4, and 10 glucose, gassed with 21% O2, 5% CO2, and 74% N2 to pH 7.4, and processed for downstream applications.
4.3. Endothelial Cell (EC) Isolation and Culture
ECs were isolated following a standard protocol described in our previous publication with slight modifications[68]. EC basal media (Endothelial cell GM MV2, PromoCell) containing 2 mg/ml collagenase type 1 (Worthington Biochemical) was gently pushed into the isolated mesenteric arterial lumen using a tuberculin syringe and left to incubate for 30–40 min at 37 °C after which the cells were gently flushed out with EC basal media. The isolated cells were passed through a CD31 magnetic microbead containing separation column (Miltenyi Biotec) for positive selection of ECs. With the column placed in a magnetic stand, two washes of the column were performed with BSA containing phosphate-buffered saline (PBS) to flush out other cell types. Finally, the CD31 bead-bound cells were flushed into media containing EC basal media (Promocell) and manufacturer-recommended supplements (Promocell). Primary cultured ECs were used for experiments between 7–14 days of isolation when the cells became confluent.
4.4. Plasmid Vectors and EC Overexpression
Full-length mouse ADAM10 and ADAM17 untagged ORF clones were purchased from Origene Inc. The ORF fragments were then amplified via PCR to contain HindIII and BamHI cloning sites, and the resulting construct was subcloned into pcDNA3.1(+) vector (ThermoFisher Scientific). For overexpression of ADAM10 or 17, 10 µg each plasmid vector was incorporated into Lipofectamine 3000 reagent (ThermoFisher Scientific) and added to each well of primary ECs. Cells were isolated after 48h of transfection for Capillary electrophoresis Western blotting or other analysis.
4.5. sVCAM1 ELISA
Soluble VCAM-1 levels in the plasma were assayed by using Human soluble VCAM-1 ELISA kit (ThermoFisher Scientific) as per manufacturer’s instructions. Briefly, for quantification of sVCAM-1, those plates were washed twice with 400 μg of wash buffer (PBS with 0.05% Tween 20) followed by 100 μL of Assay Buffer and 100 μL of diluted plasma and incubated in each plate well. Fifty micrograms of the provided biotin-conjugated anti-human sVCAM-1 was added to the well and incubated for 2h at room temperature. Following three washes, 100 µL of substrate solution (tetramethylbenzidine) was added to each well and incubated for 10 min at room temperature. 1M phosphoric acid was then added as a stop solution and the absorbance analyzed at 450nm using an ELISA reader. Test readings were then plotted against a standard curve to determine sample concentrations.
4.6. AbbyTM Capillary Electrophoresis Immunoassay (Simple Western)
Mesenteric artery isolates and EC lysates were homogenized in ice-cold RIPA buffer (25 mM Tris pH 7.6, 150 mM NaCl, 1% Igepal CA-630, 1% sodium deoxycholate, 0.1% SDS) with protease inhibitor cocktail (Sigma Aldrich) using a mechanical homogenizer. The homogenate was centrifuged at 10,000 rpm for 5 min at 4 °C, and the supernatant was collected. Protein concentration was quantified with the Amido Black technique. Proteins were then resolved by capillary electrophoresis using the AbbyTM system (ProteinSimple, San Jose, CA). Equal amount of protein was loaded onto each well of the cartridge. The following primary antibodies were used: anti-VCAM1 (MAB6432, Biotechne), anti-ADAM10 (14194, Cell Signaling Tech), anti-ADAM17 (NBP1-77044, Novus Bio.) and anti-phospho-GSK3β (9323, Cell Signaling Tech). Following this, the anti-rabbit secondary antibody detection module (ProteinSimple) was used to detect the band of interest. Each individual capillary can be probed with a different primary antibody if needed which allows simultaneous probing of multiple antibodies on one capillary cartridge. Protein expression was normalized to the total protein present in each lane as done in prior publications[69,70,71]. For this, manufacturer provided Replex reagentTM (ProteinSimple) was used to strip the antibodies from the lanes after their detection followed by use of the Total protein detection module (ProteinSimple) which utilizes biotin labeling of all proteins. Bands were then analyzed using the built-in CompassTM software (ProteinSimple). The full length of capillary runs for representative images are shown. Total protein lanes of each main figure are shown in the Supplementary Figure S1. Band intensities of each lane were normalized to the total protein band intensities of the respective samples and expressed as fold change compared to control or non-diabetic samples.
4.7. Statistical Analysis
OriginLab and GraphPad InStat software were used for statistical analysis. Data are expressed as means ± SE. Student’s t test, Mann–Whitney U test, and ANOVA with Bonferroni’s post hoc test for multiple group comparisons were used where appropriate. P < 0.05 was considered significant.
5. Conclusions
In conclusion, in this study we show that circulating sVCAM1 levels are increased in insulin-resistant HFD-fed mice. This increase was found to be due to an increase in the expression of metalloproteases, ADAM10 and ADAM17 in diabetic ECs, whose expressions were triggered by activation of GSK3β. Inhibition of GSK3β in vitro and in vivo decreased VCAM1 ectodomain shedding and could possibly offer cardioprotection in diabetes.
Supplementary Materials
The following supporting information can be downloaded at the website of this paper posted on Preprints.org.
Author Contributions
Conceptualization, M.A.B. and M.D.L.; methodology, M.A.B., S.R., U.P.S. and D.M.C.; investigation, M.A.B., S.R., K.L. and M.D.L.; resources, U.P.S., D.M.C. and M.D.L.; writing–original draft, M.A.B. and M.D.L.; writing–review & editing, M.A.B. and M.D.L.; supervision, M.D.L.; project administration, M.D.L. All authors have read and agreed to the published version of the manuscript.
Funding
This research received no external funding.
Institutional Review Board Statement
The animal study protocol was approved by the Institutional Review Board of University of Tennessee Health Science Center (22-0354, Most recent re-approval of original protocol: 5/2/2022).
Informed Consent Statement
Not applicable.
Data Availability Statement
The data presented in this study are available in the article.
Acknowledgments
The authors would like to thank UTHSC for material and equipment support.
Conflicts of Interest
The authors declare no conflict of interest.
References
- Maric-Bilkan C. Sex differences in micro- and macro-vascular complications of diabetes mellitus. Clinical science (London, England : 1979). 2017;131:833-846. [CrossRef]
- Kautzky-Willer A, Harreiter J. Sex and gender differences in therapy of type 2 diabetes. Diabetes research and clinical practice. 2017;131:230-241. [CrossRef]
- Ramos TN, Bullard DC, Barnum SR. ICAM-1: Isoforms and Phenotypes. The Journal of Immunology. 2014;192:4469. [CrossRef]
- Kallmann B.A. HV, Toyka K.V., Rieckmann P. Soluble VCAM-1 Release Indicates Inflammatory Blood-Brain Barrier Pathology and Further Modulates Adhesion. In: Hommes O.R., Comi G. (eds) Early Indicators Early Treatments Neuroprotection in Multiple Sclerosis. Topics in Neuroscience. 2004:115-117.
- Garton KJ, Gough PJ, Philalay J, Wille PT, Blobel CP, Whitehead RH, Dempsey PJ, Raines EW. Stimulated shedding of vascular cell adhesion molecule 1 (VCAM-1) is mediated by tumor necrosis factor-alpha-converting enzyme (ADAM 17). The Journal of biological chemistry. 2003;278:37459-37464. [CrossRef]
- Bruno CM, Valenti M, Bertino G, Ardiri A, Bruno F, Cunsolo M, Pulvirenti D, Neri S. Plasma ICAM-1 and VCAM-1 levels in type 2 diabetic patients with and without microalbuminuria. Minerva Med. 2008;99:1-5.
- Troncoso MF, Ortiz-Quintero J, Garrido-Moreno V, Sanhueza-Olivares F, Guerrero-Moncayo A, Chiong M, Castro PF, García L, Gabrielli L, Corbalán R, et al. VCAM-1 as a predictor biomarker in cardiovascular disease. Biochimica et Biophysica Acta (BBA) - Molecular Basis of Disease. 2021;1867:166170. [CrossRef]
- Schmidt AM, Crandall J, Hori O, Cao R, Lakatta E. Elevated plasma levels of vascular cell adhesion molecule-1 (VCAM-1) in diabetic patients with microalbuminuria: a marker of vascular dysfunction and progressive vascular disease. Br J Haematol. 1996;92:747-750. [CrossRef]
- Xu Y, Hou H, Zhao L. The role of VCAM-1 in diabetic retinopathy: A systematic review and meta-analysis. Journal of diabetes and its complications. 2023;37:108380. [CrossRef]
- Paneni F, Beckman JA, Creager MA, Cosentino F. Diabetes and vascular disease: pathophysiology, clinical consequences, and medical therapy: part I. European heart journal. 2013;34:2436-2443. [CrossRef]
- Gustavsson C, Agardh CD, Zetterqvist AV, Nilsson J, Agardh E, Gomez MF. Vascular cellular adhesion molecule-1 (VCAM-1) expression in mice retinal vessels is affected by both hyperglycemia and hyperlipidemia. PloS one. 2010;5:e12699. [CrossRef]
- Chen J, Liu Q, He J, Li Y. Immune responses in diabetic nephropathy: Pathogenic mechanisms and therapeutic target. Front Immunol. 2022;13:958790. [CrossRef]
- Hegazy GA, Awan Z, Hashem E, Al-Ama N, Abunaji AB. Levels of soluble cell adhesion molecules in type 2 diabetes mellitus patients with macrovascular complications. J Int Med Res. 2020;48:300060519893858. [CrossRef]
- Hocaoglu-Emre FS, Saribal D, Yenmis G, Guvenen G. Vascular Cell Adhesion Molecule 1, Intercellular Adhesion Molecule 1, and Cluster of Differentiation 146 Levels in Patients with Type 2 Diabetes with Complications. Endocrinol Metab (Seoul). 2017;32:99-105. [CrossRef]
- Hackman A, Abe Y, Insull W, Pownall H, Smith L, Dunn K, Gotto AM, Ballantyne CM. Levels of Soluble Cell Adhesion Molecules in Patients With Dyslipidemia. Circulation. 1996;93:1334-1338. doi: doi:10.1161/01.CIR.93.7.1334.
- Koenen RR, Pruessmeyer J, Soehnlein O, Fraemohs L, Zernecke A, Schwarz N, Reiss K, Sarabi A, Lindbom L, Hackeng TM, et al. Regulated release and functional modulation of junctional adhesion molecule A by disintegrin metalloproteinases. Blood. 2009;113:4799-4809. [CrossRef]
- Tsakadze NL, Sithu SD, Sen U, English WR, Murphy G, D'Souza SE. Tumor Necrosis Factor-α-converting Enzyme (TACE/ADAM-17) Mediates the Ectodomain Cleavage of Intercellular Adhesion Molecule-1 (ICAM-1)*. Journal of Biological Chemistry. 2006;281:3157-3164. [CrossRef]
- Maas SL, Donners M, van der Vorst EPC. ADAM10 and ADAM17, Major Regulators of Chronic Kidney Disease Induced Atherosclerosis? Int J Mol Sci. 2023;24. [CrossRef]
- Leo MD, Peixoto-Nieves D, Yin W, Raghavan S, Muralidharan P, Mata-Daboin A, Jaggar JH. TMEM16A channel upregulation in arterial smooth muscle cells produces vasoconstriction during diabetes. American journal of physiology Heart and circulatory physiology. 2021;320:H1089-h1101. [CrossRef]
- Nagy C, Einwallner E. Study of In Vivo Glucose Metabolism in High-fat Diet-fed Mice Using Oral Glucose Tolerance Test (OGTT) and Insulin Tolerance Test (ITT). J Vis Exp. 2018. [CrossRef]
- Bui TM, Wiesolek HL, Sumagin R. ICAM-1: A master regulator of cellular responses in inflammation, injury resolution, and tumorigenesis. J Leukoc Biol. 2020;108:787-799. [CrossRef]
- Berardi C, Wassel CL, Decker PA, Larson NB, Kirsch PS, Andrade M, Tsai MY, Pankow JS, Sale MM, Sicotte H, et al. Elevated Levels of Adhesion Proteins Are Associated With Low Ankle-Brachial Index. Angiology. 2017;68:322-329. [CrossRef]
- Kotteas EA, Boulas P, Gkiozos I, Tsagkouli S, Tsoukalas G, Syrigos KN. The Intercellular Cell Adhesion Molecule-1 (ICAM-1) in Lung Cancer: Implications for Disease Progression and Prognosis. Anticancer Research. 2014;34:4665.
- Champagne B, Tremblay P, Cantin A, St. Pierre Y. Proteolytic Cleavage of ICAM-1 by Human Neutrophil Elastase. The Journal of Immunology. 1998;161:6398.
- Witte DR, Broekmans WM, Kardinaal AF, Klöpping-Ketelaars IA, van Poppel G, Bots ML, Kluft C, Princen JM. Soluble intercellular adhesion molecule 1 and flow-mediated dilatation are related to the estimated risk of coronary heart disease independently from each other. Atherosclerosis. 2003;170:147-153. [CrossRef]
- Semaan HB, Gurbel PA, Anderson JL, Muhlestein JB, Carlquist JF, Horne BD, Serebruany VL. Soluble VCAM-1 and E-Selectin, but Not ICAM-1 Discriminate Endothelial Injury in Patients with Documented Coronary Artery Disease. Cardiology. 2000;93:7-10. [CrossRef]
- Demerath E, Towne B, Blangero J, Siervogel RM. The relationship of soluble ICAM-1, VCAM-1, P-selectin and E-selectin to cardiovascular disease risk factors in healthy men and women. Annals of Human Biology. 2001;28:664-678. [CrossRef]
- Haarmann A, Nowak E, Deiß A, van der Pol S, Monoranu CM, Kooij G, Müller N, van der Valk P, Stoll G, de Vries HE, et al. Soluble VCAM-1 impairs human brain endothelial barrier integrity via integrin α-4-transduced outside-in signalling. Acta Neuropathol. 2015;129:639-652. [CrossRef]
- Ridker PM, Hennekens CH, Roitman-Johnson B, Stampfer MJ, Allen J. Plasma concentration of soluble intercellular adhesion molecule 1 and risks of future myocardial infarction in apparently healthy men. The Lancet. 1998;351:88-92. [CrossRef]
- Hwang SJ, Ballantyne CM, Sharrett AR, Smith LC, Davis CE, Gotto AM, Jr., Boerwinkle E. Circulating adhesion molecules VCAM-1, ICAM-1, and E-selectin in carotid atherosclerosis and incident coronary heart disease cases: the Atherosclerosis Risk In Communities (ARIC) study. Circulation. 1997;96:4219-4225. [CrossRef]
- Ling S, Nheu L, Komesaroff PA. Cell adhesion molecules as pharmaceutical target in atherosclerosis. Mini Rev Med Chem. 2012;12:175-183. [CrossRef]
- Allen S, Moran N. Cell Adhesion Molecules: Therapeutic Targets for Inhibition of Inflammatory States. Semin Thromb Hemost. 2015;41:563-571. [CrossRef]
- Harjunpää H, Llort Asens M, Guenther C, Fagerholm SC. Cell Adhesion Molecules and Their Roles and Regulation in the Immune and Tumor Microenvironment. Frontiers in Immunology. 2019;10. [CrossRef]
- Wang CY, Liao JK. A mouse model of diet-induced obesity and insulin resistance. Methods in molecular biology (Clifton, NJ). 2012;821:421-433. [CrossRef]
- Gilbert ER, Fu Z, Liu D. Development of a nongenetic mouse model of type 2 diabetes. Experimental diabetes research. 2011;2011:416254. [CrossRef]
- Leiter EH. Multiple low-dose streptozotocin-induced hyperglycemia and insulitis in C57BL mice: influence of inbred background, sex, and thymus. Proceedings of the National Academy of Sciences of the United States of America. 1982;79:630-634.
- Furman BL. Streptozotocin-Induced Diabetic Models in Mice and Rats. Curr Protoc. 2021;1:e78. [CrossRef]
- Leguina-Ruzzi A, Ortiz R, Velarde V. The streptozotocin-high fat diet induced diabetic mouse model exhibits severe skin damage and alterations in local lipid mediators. Biomed J. 2018;41:328-332. [CrossRef]
- Avtanski D, Pavlov VA, Tracey KJ, Poretsky L. Characterization of inflammation and insulin resistance in high-fat diet-induced male C57BL/6J mouse model of obesity. Animal Model Exp Med. 2019;2:252-258. [CrossRef]
- Parilla JH, Willard JR, Barrow BM, Zraika S. A Mouse Model of Beta-Cell Dysfunction as Seen in Human Type 2 Diabetes. J Diabetes Res. 2018;2018:6106051. [CrossRef]
- Nath S, Ghosh SK, Choudhury Y. A murine model of type 2 diabetes mellitus developed using a combination of high fat diet and multiple low doses of streptozotocin treatment mimics the metabolic characteristics of type 2 diabetes mellitus in humans. J Pharmacol Toxicol Methods. 2017;84:20-30. [CrossRef]
- Heydemann A. An Overview of Murine High Fat Diet as a Model for Type 2 Diabetes Mellitus. Journal of Diabetes Research. 2016;2016:2902351. [CrossRef]
- Mosser RE, Maulis MF, Moullé VS, Dunn JC, Carboneau BA, Arasi K, Pappan K, Poitout V, Gannon M. High-fat diet-induced β-cell proliferation occurs prior to insulin resistance in C57Bl/6J male mice. American Journal of Physiology-Endocrinology and Metabolism. 2015;308:E573-E582. [CrossRef]
- Christians JK, Lennie KI, Wild LK, Garcha R. Effects of high-fat diets on fetal growth in rodents: a systematic review. Reproductive Biology and Endocrinology. 2019;17:39. [CrossRef]
- Lai M, Chandrasekera PC, Barnard ND. You are what you eat, or are you? The challenges of translating high-fat-fed rodents to human obesity and diabetes. Nutr Diabetes. 2014;4:e135. [CrossRef]
- Austin GL, Ogden LG, Hill JO. Trends in carbohydrate, fat, and protein intakes and association with energy intake in normal-weight, overweight, and obese individuals: 1971-2006. Am J Clin Nutr. 2011;93:836-843. [CrossRef]
- Wallace TM, Levy JC, Matthews DR. Use and abuse of HOMA modeling. Diabetes care. 2004;27:1487-1495. [CrossRef]
- Matthews DR. Insulin resistance and beta-cell function--a clinical perspective. Diabetes, obesity & metabolism. 2001;3 Suppl 1:S28-33.
- Krystel-Whittemore M, Dileepan KN, Wood JG. Mast Cell: A Multi-Functional Master Cell. Front Immunol. 2015;6:620. [CrossRef]
- Shi M, Shi G-P. Different Roles of Mast Cells in Obesity and Diabetes: Lessons from Experimental Animals and Humans. Frontiers in Immunology. 2012;3:7.
- Wang J, Shi G-P. Mast cell stabilization: novel medication for obesity and diabetes. Diabetes/metabolism research and reviews. 2011;27:919-924. [CrossRef]
- Roberts AC, Porter KE. Cellular and molecular mechanisms of endothelial dysfunction in diabetes. Diabetes and Vascular Disease Research. 2013;10:472-482. [CrossRef]
- Sena CM, Pereira AM, Seiça R. Endothelial dysfunction — A major mediator of diabetic vascular disease. Biochimica et Biophysica Acta (BBA) - Molecular Basis of Disease. 2013;1832:2216-2231. [CrossRef]
- Dreymueller D, Pruessmeyer J, Groth E, Ludwig A. The role of ADAM-mediated shedding in vascular biology. European Journal of Cell Biology. 2012;91:472-485. [CrossRef]
- Morsing SKH, Rademakers T, Brouns SLN, Stalborch ADV, Donners M, van Buul JD. ADAM10-Mediated Cleavage of ICAM-1 Is Involved in Neutrophil Transendothelial Migration. Cells. 2021;10. [CrossRef]
- Palau V, Jarrín J, Villanueva S, Benito D, Márquez E, Rodríguez E, Soler MJ, Oliveras A, Gimeno J, Sans L, et al. Endothelial ADAM17 Expression in the Progression of Kidney Injury in an Obese Mouse Model of Pre-Diabetes. Int J Mol Sci. 2021;23. [CrossRef]
- Abu El-Asrar AM, Nawaz MI, Ahmad A, De Zutter A, Siddiquei MM, Blanter M, Allegaert E, Gikandi PW, De Hertogh G, Van Damme J, et al. Evaluation of Proteoforms of the Transmembrane Chemokines CXCL16 and CX3CL1, Their Receptors, and Their Processing Metalloproteinases ADAM10 and ADAM17 in Proliferative Diabetic Retinopathy. Front Immunol. 2020;11:601639. [CrossRef]
- Shalaby L, Thounaojam M, Tawfik A, Li J, Hussein K, Jahng WJ, Al-Shabrawey M, Kwok HF, Bartoli M, Gutsaeva D. Role of Endothelial ADAM17 in Early Vascular Changes Associated with Diabetic Retinopathy. J Clin Med. 2020;9. [CrossRef]
- Boucher J, Kleinridders A, Kahn CR. Insulin receptor signaling in normal and insulin-resistant states. Cold Spring Harbor perspectives in biology. 2014;6. [CrossRef]
- De Meyts P. The Insulin Receptor and Its Signal Transduction Network. In: De Groot LJ, Chrousos G, Dungan K, Feingold KR, Grossman A, Hershman JM, Koch C, Korbonits M, McLachlan R, New M, et al., eds. Endotext. South Dartmouth (MA): MDText.com, Inc.; 2000.
- Bandyopadhyay G, Standaert ML, Galloway L, Moscat J, Farese RV. Evidence for involvement of protein kinase C (PKC)-zeta and noninvolvement of diacylglycerol-sensitive PKCs in insulin-stimulated glucose transport in L6 myotubes. Endocrinology. 1997;138:4721-4731. [CrossRef]
- Standaert ML, Galloway L, Karnam P, Bandyopadhyay G, Moscat J, Farese RV. Protein kinase C-zeta as a downstream effector of phosphatidylinositol 3-kinase during insulin stimulation in rat adipocytes. Potential role in glucose transport. The Journal of biological chemistry. 1997;272:30075-30082.
- Eto M, Kouroedov A, Cosentino F, Lüscher TF. Glycogen synthase kinase-3 mediates endothelial cell activation by tumor necrosis factor-alpha. Circulation. 2005;112:1316-1322. [CrossRef]
- del Ser T, Steinwachs KC, Gertz HJ, Andres MV, Gomez-Carrillo B, Medina M, Vericat JA, Redondo P, Fleet D, Leon T. Treatment of Alzheimer's disease with the GSK-3 inhibitor tideglusib: a pilot study. Journal of Alzheimer's disease : JAD. 2013;33:205-215. [CrossRef]
- Lovestone S, Boada M, Dubois B, Hull M, Rinne JO, Huppertz HJ, Calero M, Andres MV, Gomez-Carrillo B, Leon T, et al. A phase II trial of tideglusib in Alzheimer's disease. Journal of Alzheimer's disease : JAD. 2015;45:75-88. [CrossRef]
- Tolosa E, Litvan I, Hoglinger GU, Burn D, Lees A, Andres MV, Gomez-Carrillo B, Leon T, Del Ser T. A phase 2 trial of the GSK-3 inhibitor tideglusib in progressive supranuclear palsy. Movement disorders : official journal of the Movement Disorder Society. 2014;29:470-478. [CrossRef]
- Ghiarone T, Castorena-Gonzalez JA, Foote CA, Ramirez-Perez FI, Ferreira-Santos L, Cabral-Amador FJ, de la Torre R, Ganga RR, Wheeler AA, Manrique-Acevedo C, et al. ADAM17 cleaves the insulin receptor ectodomain on endothelial cells and causes vascular insulin resistance. American journal of physiology Heart and circulatory physiology. 2022;323:H688-h701. [CrossRef]
- MacKay CE, Floen M, Leo MD, Hasan R, Garrud TAC, Fernández-Peña C, Singh P, Malik KU, Jaggar JH. A plasma membrane-localized polycystin-1/polycystin-2 complex in endothelial cells elicits vasodilation. eLife. 2022;11:e74765. [CrossRef]
- Ritchie JL, Walters JL, Galliou JMC, Christian RJ, Qi S, Savenkova MI, Ibarra CK, Grogan SR, Fuchs RA. Basolateral amygdala corticotropin-releasing factor receptor type 1 regulates context-cocaine memory strength during reconsolidation in a sex-dependent manner. Neuropharmacology. 2021;200:108819. [CrossRef]
- Beekman C, Janson AA, Baghat A, van Deutekom JC, Datson NA. Use of capillary Western immunoassay (Wes) for quantification of dystrophin levels in skeletal muscle of healthy controls and individuals with Becker and Duchenne muscular dystrophy. PloS one. 2018;13:e0195850. [CrossRef]
- Krishnan V, Ali S, Gonzales AL, Thakore P, Griffin CS, Yamasaki E, Alvarado MG, Johnson MT, Trebak M, Earley S. STIM1-dependent peripheral coupling governs the contractility of vascular smooth muscle cells. eLife. 2022;11:e70278. [CrossRef]
Figure 1.
C57BL6/J mice on a high-fat diet with low dose-streptozotocin injections develop T2D. (A) Body weight (g) readings from week 2 of HFD (age: 6 weeks) until week 12. STZ was injected into mice at wk8 of HFD and most mice were euthanized at wk10. n = 6 for each data point. *P < 0.05 vs. nondiabetic control. (B) Fasting blood glucose (mmol/L) recordings from non-diabetic controls, wk8 of HFD prior to STZ and wk10 after STZ injections. n = 30 for each. *P < 0.05 vs. nondiabetic. (C) Oral glucose tolerance test in control and HFD mice before and after STZ at wk8 and wk10 respectively. n = 6 for each. *P < 0.05 vs. nondiabetic. (D) Plasma insulin (pmol/L) in non-diabetic controls and HFD-STZ mice. n = 30 for each. (E) HOMA2-IR indices of non-diabetic, wk8 HFD and wk10 HFD-STZ mice calculated from values of (B,D). n = 30 for each. *P < 0.05 vs. nondiabetic controls.
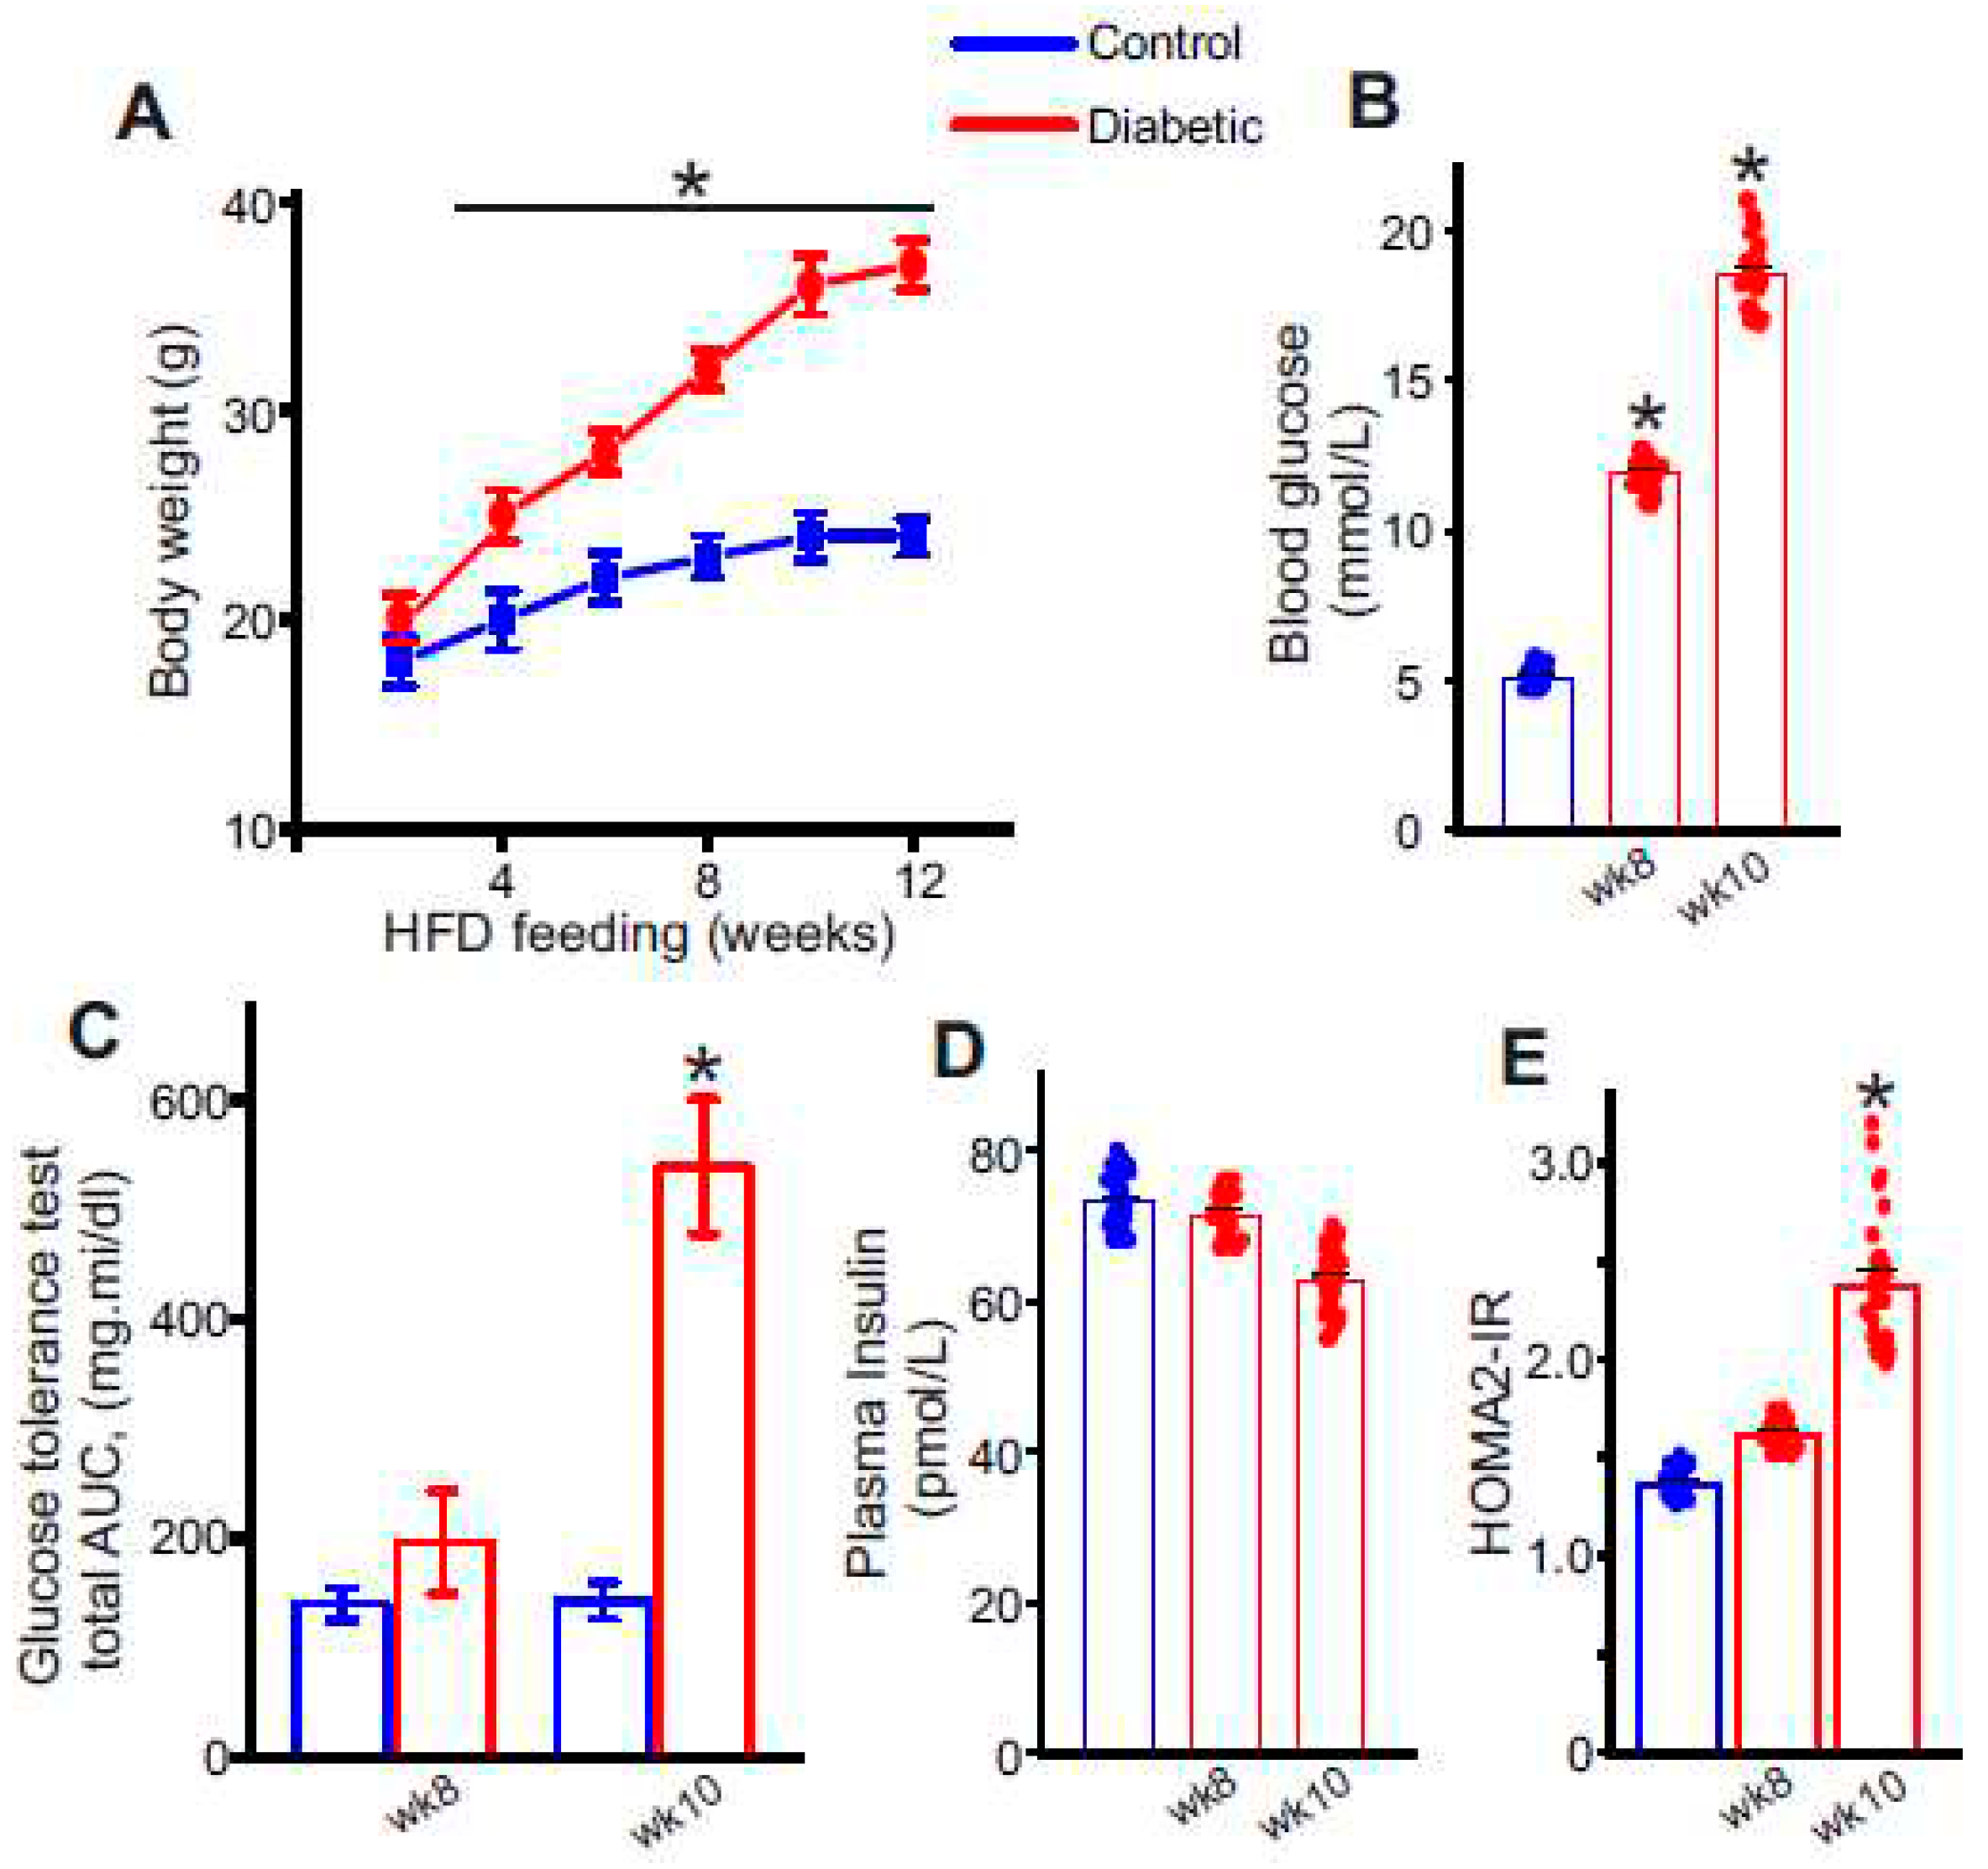
Figure 2.
Circulating sVCAM1 levels increase after STZ injections and onset of insulin resistance. (A) Plasma sVCAM1 levels measured from nondiabetic and HFD mice before (wk8) and after STZ (wk10) injections. n = 30 for each. *P < 0.05 vs. nondiabetic. (B) Photograph of the AbbyTM (ProteinSimple) Simple Western instrument showing loaded lanes and capillary setup. (C) Representative full length Simple Western of VCAM1 protein in isolated control and diabetic endothelial cells. Lane numbers indicate, 1: nondiabetic control, 2: HFD wk6, 3: HFD wk8, 4: HFD-STZ wk10. (D) Mean data of VCAM1 protein expression in diabetic ECs. n = 6 each. *P < 0.05 vs. nondiabetic controls. (E) Mean data of sVCAM1 levels in culture media of ECs isolated from nondiabetic or diabetic mice. n = 30 each. *P < 0.05 vs. nondiabetic controls.
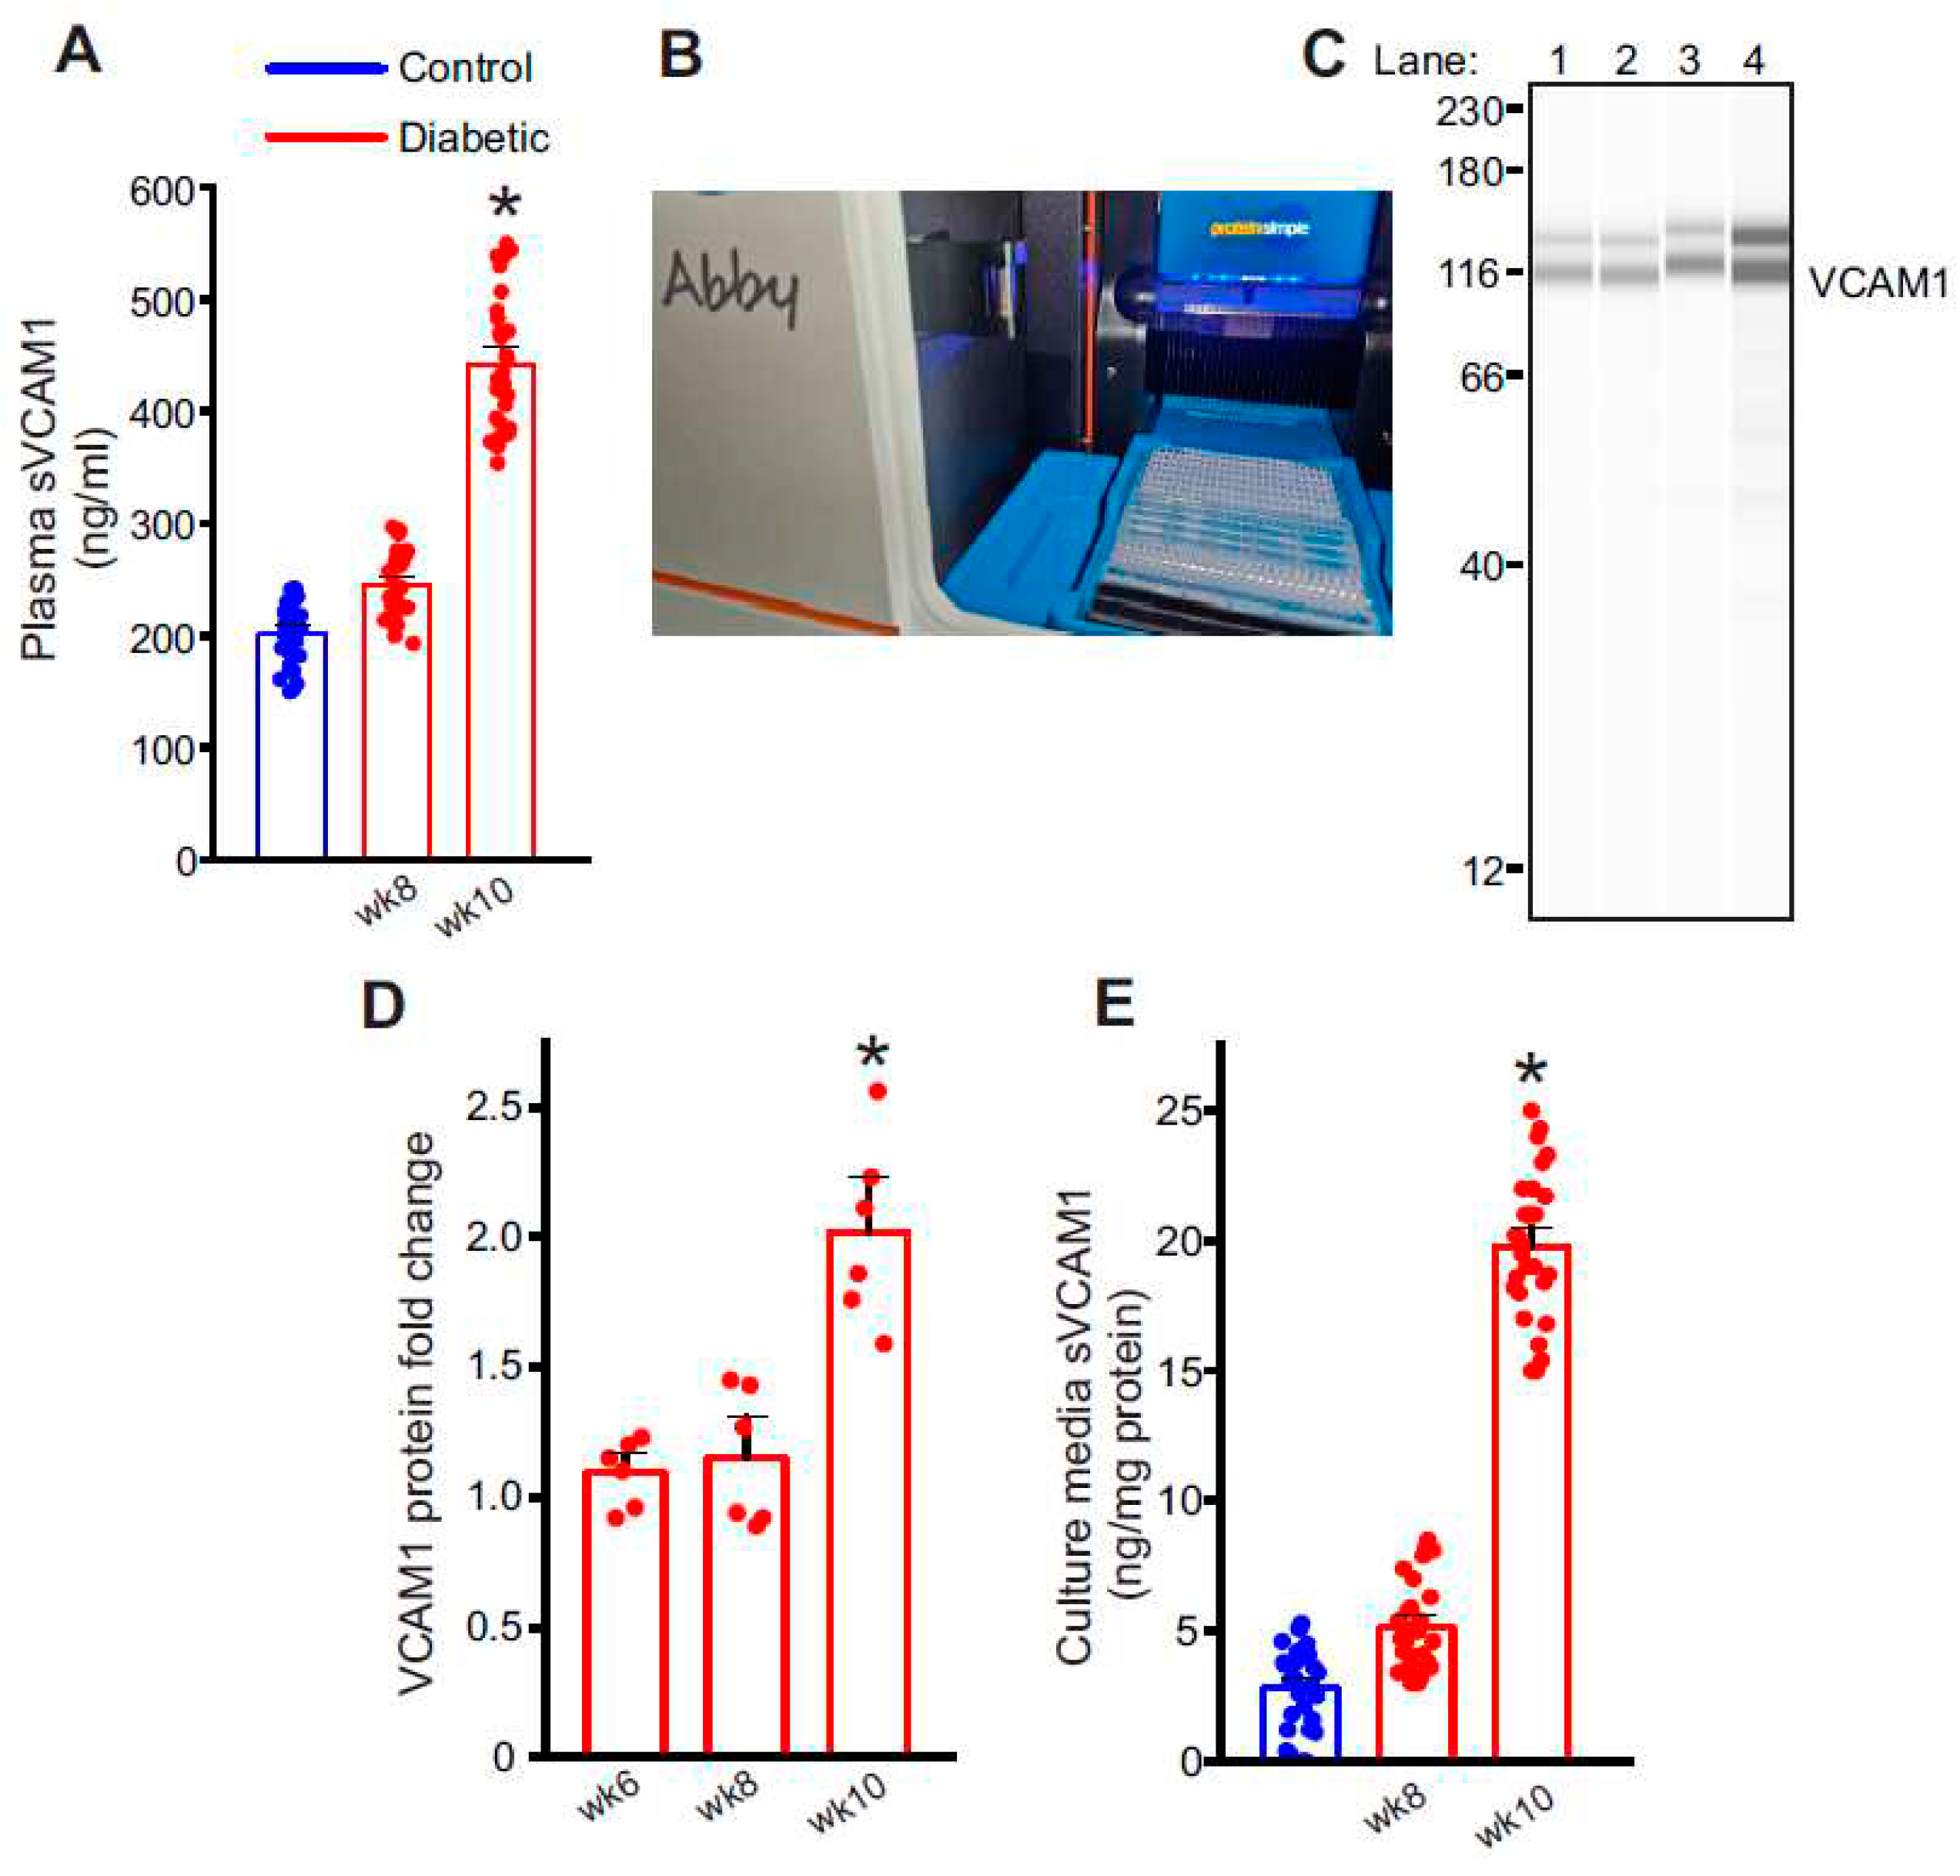
Figure 3.
Metalloproteases, ADAM10 and ADAM17 are involved in VCAM1 ectodomain shedding. (A) Representative full length Simple Western of ADAM10 and ADAM17 proteins in isolated control and diabetic endothelial cells. Lane numbers indicate, 1: nondiabetic control, 2: HFD wk8, 3: HFD-STZ wk10, 4: ADAM10 overexpression in control cells, 5: nondiabetic control, 6: HFD wk8, 7: HFD-STZ wk10, 8: ADAM17 overexpression in control cells. (B) Mean data of ADAM10 and ADAM17 protein fold change in wk10 HFD-STZ diabetic ECs and plasmid overexpression. n = 6 each. *P < 0.05 vs. nondiabetic controls or empty vector transfected. (C) Representative full length Simple Western of VCAM1 protein from samples of control cells transfected with empty vector or ADAM10 and 17 plasmids. Lane numbers indicate, 1: empty vector, 2: ADAM10 overexpression, 3: ADAM17 overexpression. (D) Mean data of VCAM1 protein fold change after ADAM10 or ADAM17 overexpression. n = 6 each. *P < 0.05 vs. empty vector transfected. (E) Mean data of sVCAM1 levels in culture media of ECs isolated from empty vector transfected or ADAM10 or ADAM17 overexpression cells. n = 8–9 each. *P < 0.05 vs. empty vector transfected.
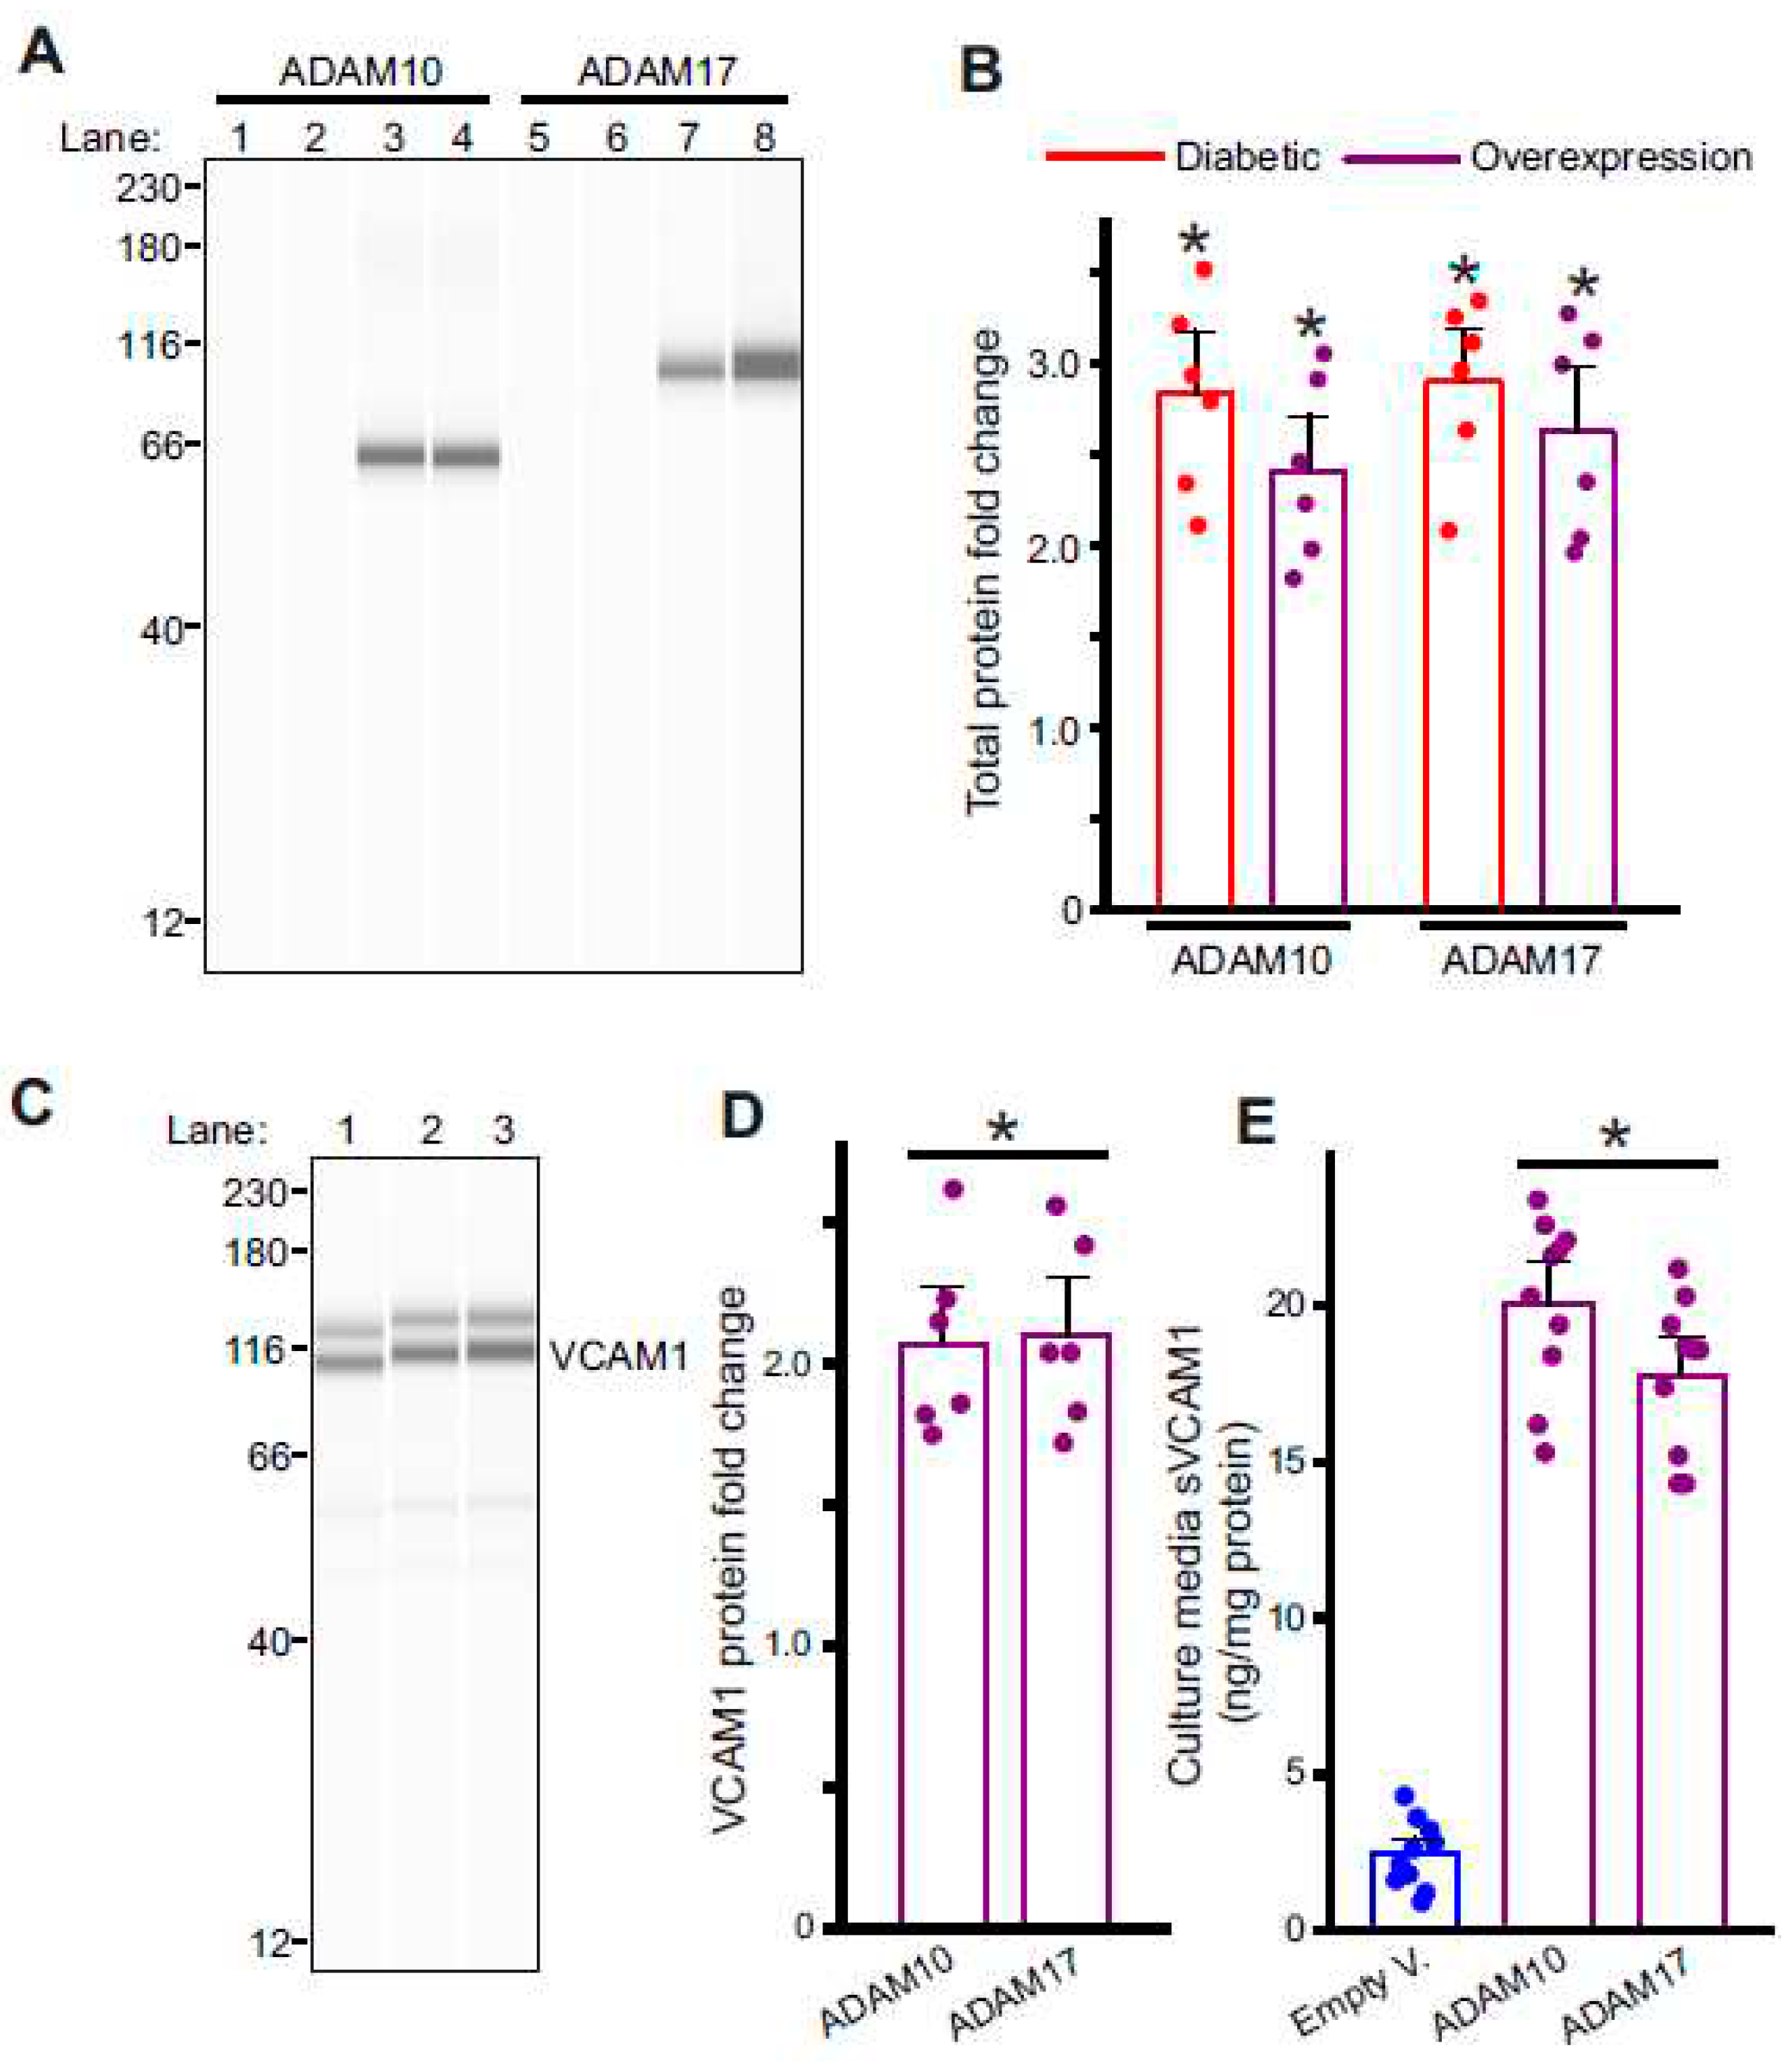
Figure 4.
GSK3β activation induces sVCAM1 shedding. (A) Representative full length Simple Western of pGSK3β (Ser9) protein in isolated control and diabetic endothelial cells. Lane numbers indicate, 1: nondiabetic control, 2: HFD wk8, 3: HFD-STZ wk10, 4: Control cells treated with MK2206. (B) Mean data. n = 6 each. *P < 0.05 vs. nondiabetic or untreated controls. (C) Representative full length Simple Western of VCAM1 in controls with/without MK2206. Lane numbers indicate, 1: untreated control, 2: control + MK2206. (D) Mean data of VCAM1 protein expression in control ECs with/without MK2206. n = 6 each. *P < 0.05 vs. untreated controls. (E) Representative full length Simple Western of ADAM10 or ADAM17 proteins in control ECs with/without MK2206. Lane numbers indicate, 1,3: untreated controls, 2,4: control + MK2206. (F) Mean data. n = 6 each. *P < 0.05 vs. untreated controls. G: Mean data of sVCAM1 levels in culture media of ECs treated with MK2206. n = 10 each. *P < 0.05 vs. untreated.
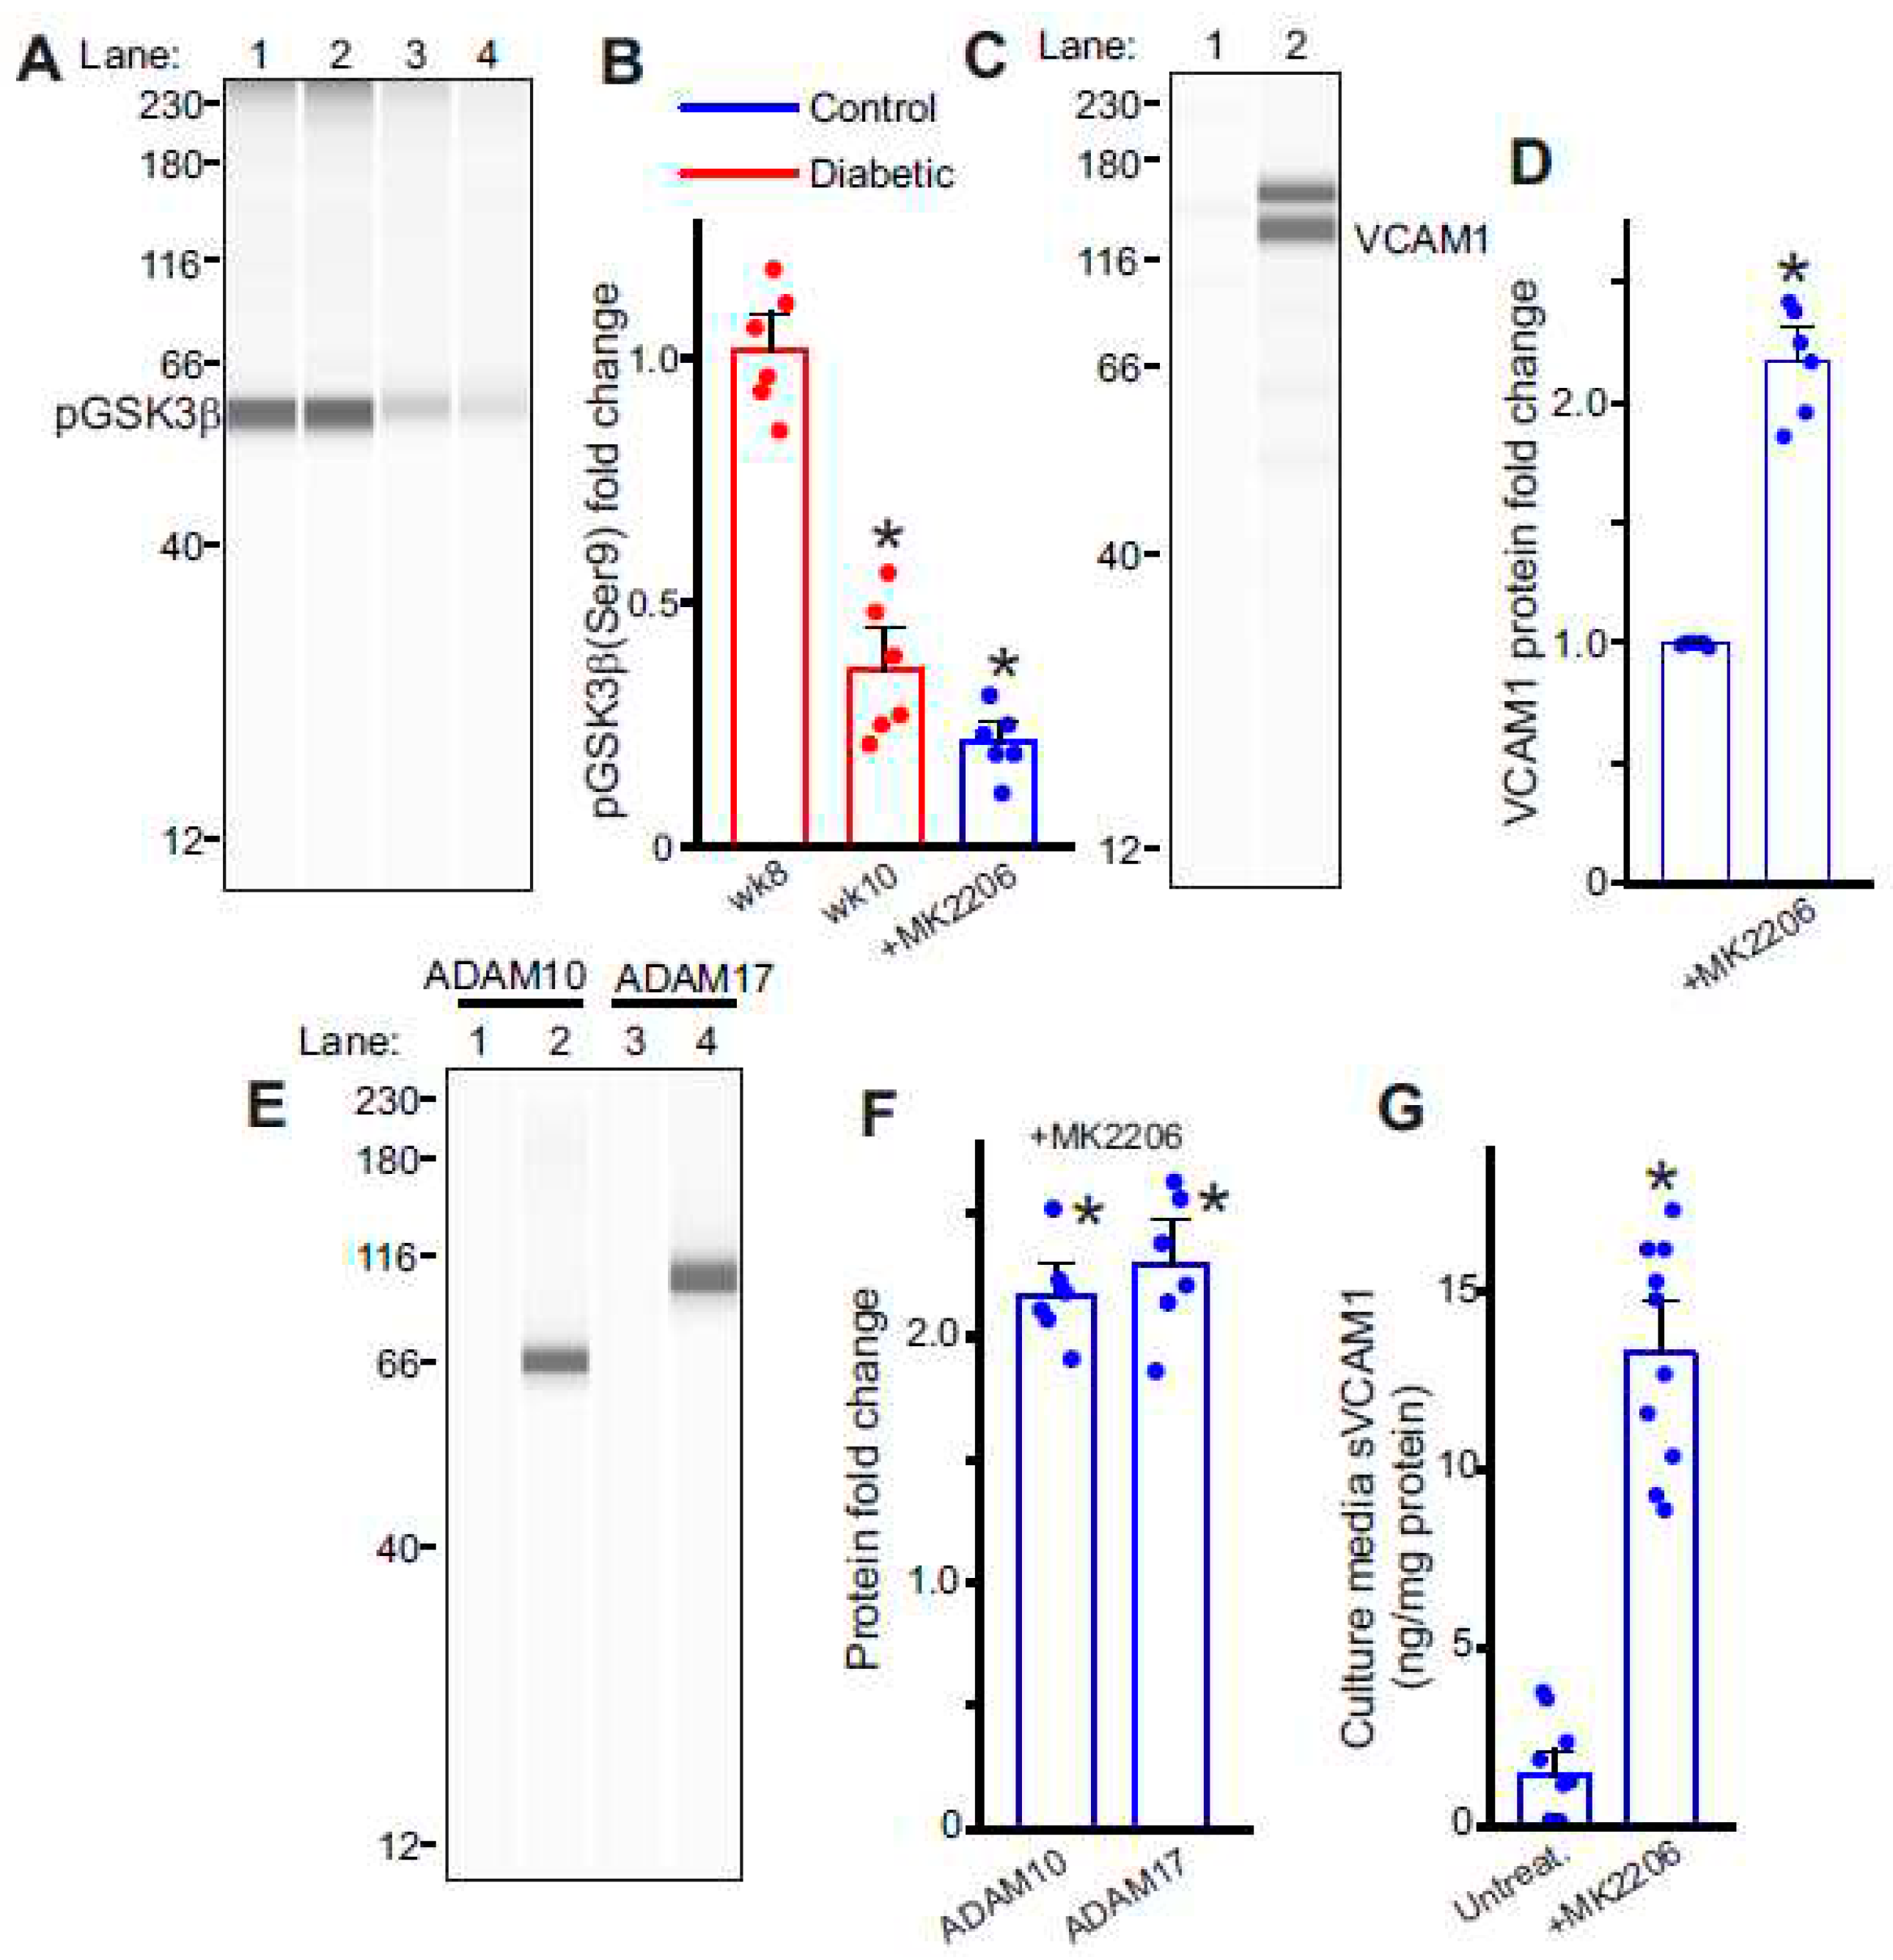
Figure 5.
Inhibition of GSK3β activation reduces sVCAM1 shedding. (A) Representative full length Simple Western of pGSK3β (Ser9) protein in isolated control and diabetic mesenteric artery samples and ECs. Lane numbers indicate, Mesenteric artery lysates from 1: Tideglusib treated and 2: wk10 HFD-STZ untreated; EC lysates from 3: Tideglusib treated and 4: wk10 HFD-STZ cells untreated. (B) Mean data. n = 6 each. #P < 0.05 vs. respective untreated diabetic. (C) Plasma sVCAM1 levels measured from nondiabetic and HFD mice after STZ (wk10) injections with/without Tideglusib treatment. n = 6 each. *P < 0.05 vs. nondiabetic, #P < 0.05 vs. untreated diabetic. (D) Mean data of sVCAM1 levels in culture media of wk10 HFD-STZ mesenteric artery ECs treated with Tideglusib in vitro. n = 7 each. #P < 0.05 vs. wk10 HFD-STZ ECs untreated.
Disclaimer/Publisher’s Note: The statements, opinions and data contained in all publications are solely those of the individual author(s) and contributor(s) and not of MDPI and/or the editor(s). MDPI and/or the editor(s) disclaim responsibility for any injury to people or property resulting from any ideas, methods, instructions or products referred to in the content. |
© 2023 by the authors. Licensee MDPI, Basel, Switzerland. This article is an open access article distributed under the terms and conditions of the Creative Commons Attribution (CC BY) license (http://creativecommons.org/licenses/by/4.0/).
Copyright: This open access article is published under a Creative Commons CC BY 4.0 license, which permit the free download, distribution, and reuse, provided that the author and preprint are cited in any reuse.


