1. Introduction
The Financial Stability Board defines Financial Technologies as "technologically enabled financial innovations that could result in new business models, applications, processes, or products with an associated material effect on financial markets and institutions and on the provision of financial services". While innovation in finance is not a new concept, the focus on technological innovations and its pace have increased significantly. Fintech solutions that make use of big data analytics, artificial intelligence and blockchain technologies are currently introduced at an unprecedented rate. These new technologies are changing the nature of the financial industry, creating many opportunities that offer a more inclusive access to financial services. On the other hand, FinTech solutions leave the door open to many risks, that may hamper consumer protection and financial stability. Relevant examples of such risks are underestimation of creditworthiness, market risk uncompliance, fraud detection and, as a possible major source of risks, cyber-attacks (see e.g. [
13]).
Across the world, there is a strong need to improve the competitiveness of the fintech sector, introducing a risk management framework, and cyber risk management in particular, to prevent and mitigate cyber attacks.
Cyber risks can be defined as "any risk emerging from intentional attacks on information and communication technology (ICT) systems that compromises the confidentiality, availability, or the integrity of data or services". According according to this definition, cyber risk does not strictly coincide with IT operational risks, as it relates only to intentional attacks, on one hand; and it deals not only with monetary losses, but also with reputational losses, on the other.
In the last few years the number of cyber attacks on information technology (IT) systems has surged and, therefore, the need to measure cyber risks has considerably increased.
While the scientific literature on the measurement of operational risks based on loss data constitutes a reasonably large body, that on cyber risk measurement is very limited. The lack of literature on cyber risk measurement may be due to the limited availability of cyber loss data, which are typically not disclosed, to avoid reputational losses. [
8] show how to solve this problem, treating loss data as the levels of an ordinal variable.
Another problem that hampers the availability of correct cyber loss data is the interdependence among cyber losses, due to the fact that cyber attacks have often a multiple target (see e.g. [
3,
10]
This motivates the work of this paper, in which we aim to contribute to cyber risk measurement by means of a methodology able to capture interdependencies (contagion) among cyber losses.
Over the past decade, especially after the global financial crisis in 2008, the study of financial risks arising from interconnectedness between individuals and institutions, has attracted the attention of researchers and regulatory authorities. From a statistical viewpoint, the assessment of vulnerabilities originated by contagion channels was supported by the use of financial networks [
2,
4].
Most existing analytical works used balance sheet and other financial statements to extract financial links [
12], while a second group focused on co-movements of security prices [
1,
6].
This paper combines the two latter approaches in the context of cyber risk analysis and contributes to the study of interconnectedness in the financial and economic system by proposing a multivariate model for count time series. The model has a score-driven specification: the time-varying intensity parameter determining the probability that an extreme market event occurs follows the specification of general autoregressive score (GAS) models, also known as dynamic conditional score models [
5,
9]. In the GAS framework, time-varying parameters depend on their lagged values and on the scaled score of the conditional observation density. GAS models belong to the class of observation-driven models and are found to perform comparably to parameter-driven models in terms of predictive accuracy. From a computational point of view, they can be easily estimated through maximum likelihood optimization.
We apply the model to the daily count of cyber events in different economic sectors, from 2018 to 2021, and find significant time dependence, along with some cross-sector effects.
2. Materials and Methods
A well-known distribution for non-negative integer variables is the negative binomial, which generalizes the Poisson distribution. The negative binomial distribution is derived from the Poisson-gamma mixture and is characterized by a location parameter - also defined as the intensity of the count process - and a dispersion parameter . The higher , the higher the overdispersion in the data. Indeed, when , the negative binomial distribution reduces to the Poisson one, where the variance is equal to the mean.
In our model, the observations in each count time series of cyber events
i follow a negative binomial distribution with a time-varying location parameter
and a static dispersion parameter
:
First, we reparametrize the location parameter through an exponential link:
. This is a common choice in the specification of generalized linear models, as it ensures strict positivity of the time-varying parameter without imposing restrictions on the coefficients. Then, to model the time-varying location parameters
, we use a Generalized Autoregressive Score (GAS) specification [
5,
9]. In the general GAS specification, the dynamics of filtered parameters
are captured by an autoregressive term and by the scaled score (gradient) of the conditional observation density through the recursions
where
is the vector of time-varying parameters,
are the constant parameters,
is the
diagonal matrix of autoregressive parameters,
A is the
matrix of coefficients associated to the scaled score and
is a scaling function for the score
. Moreover, we assume:
where
e,
,
are column vectors. In addition, to be able to estimate the values of
and
, we impose
.
The score
corresponds to the first derivative of the negative binomial log-likelihood function:
Without loss of generality, we use a unit scaling, that is we assume .
In the context of our cyber risk application, the coefficients in the
A matrix express in-sector and cross-sector dependence through the score. Being the latter calculated as the scaled difference between the observed and expected number of events (i.e. the shock) at the previous time, the
A coefficients determine the impact of unexpected cyber losses occurred in
on the expected cyber losses in
t in the same sector (diagonal effects) and in other sectors (off-diagonal effects). Formulation (
3) gives a further insight into the interpretation of parameters:
e measures the own effect of shock events in sector
i, while the
and
vectors act as multipliers of the off-diagonal elements of
A. The
B coefficients express, instead, dependence of the expected number of cyber losses on the past expectations, while the
C constant parameters determine the unconditional and long-term mean of the number of events.
3. Results
This section may be divided by subheadings. It should provide a concise and precise description of the experimental results, their interpretation as well as the experimental conclusions that can be drawn.
3.1. Data
We apply our modelling approach to the daily cyber attack data collected by an international data provider in an agnostic and independent manner, which essentially involves transforming each news of cyber attacks into a severity scale that goes from "low" to "high" values. The data, which can be publicly visualised at
www.hackmanac.com, consists of daily times series of cyber losses, categorised by severity and by economic sector of belonging of the attacked company. The time series covers a full three years period, from 2018 to 2021.
The data has already been analysed by means of rank regression models, in [
8]. Here we extend the work taking into account time and sectorial dependence.
For each day in the analysed time period, we count the number of cyber attacks in each of the following sectors: Education, Government, Healthcare, Financial, Information and Communication Technology (ICT), Trade. We consider only high severity events, corresponding to "high" or "critical" losses. Thus, we end up with six count time series of extreme events.
In particular, the companies included in our analysis belong to the following industries: Financial (FIN), Information and Communication Technology (ICT), Manufacturing (MFG), Energy (ENG), Trade (TRD).
We remark that all the considered series show a high frequency of zeros and are overdispersed, i.e. their variance is higher than the mean. These features motivate the use of count data models for rare events allowing for possible zero-inflation and overdispersion.
3.2. Empirical findings
We now present results of fitting the negative binomial score-driven model introduced in
Section 2 to the time series of extreme CDS movements in different sectors of the Eurostoxx 50 Index (see
Section 3.1). By letting the
coefficients equal to those estimated at the univariate level and maximizing the log-likelihood, we estimate the parameters entering the score-driven dynamics and obtain predictions for the counts.
The coefficients - estimated through likelihood maximisation - for the proposed score-driven model are shown in
Table 1, together with the corresponding standard errors.
Table 1 indicates, along with the presence of a significant constant parameter (the
c coefficient), the presence of significant time dependence (expressed by the
b autoregressive coefficients) for all sectors and, particularly, for the Education one. This is in line with the observation that, during the COVID-19 period, on-line educational services have substantially increased and, along them, cyber attacks to educational institutions.
On the other hand,
Table 2 captures the sectorial dependence among cyber attacks. In particular, coefficients in row
i in
Table 2 express the impact that shocks to the number of cyber attacks in other sectors (along the columns) has on sector
i, while coefficients in column
j measure the extent to which cyber attacks in sector
j affect the others (along the rows). The value of the off-diagonal elements, capturing cross-sector dependence, is determined by the
and
parameters entering specification (
3).
The diagonal elements of the
A matrix can be instead interpreted as in-sector channels of contagion, that is the impact of shocks to the number of cyber attacks in a sector on the expected number of cyber attacks in the same sector. Their value is determined by the estimated
e parameters in (
3).
Based on our results, the sector which affects others most strongly turns out to be ICT, followed by Government, both impacting particularly on the Educational sector. The result is in line with the intuition that the ICT sector, being more dependent on technology, is also the more subject to attacks; whereas the Government sector, being strategic for a country, plays a rather central role. Looking instead at "in-strength" centrality, the sector most impacted by cyber attacks in other sectors is the Educational one. This is in line with the intuition that the Educational sector is often among the most open to innovations and the least protected. The Educational sector is also the one showing the highest in-sector dependence,
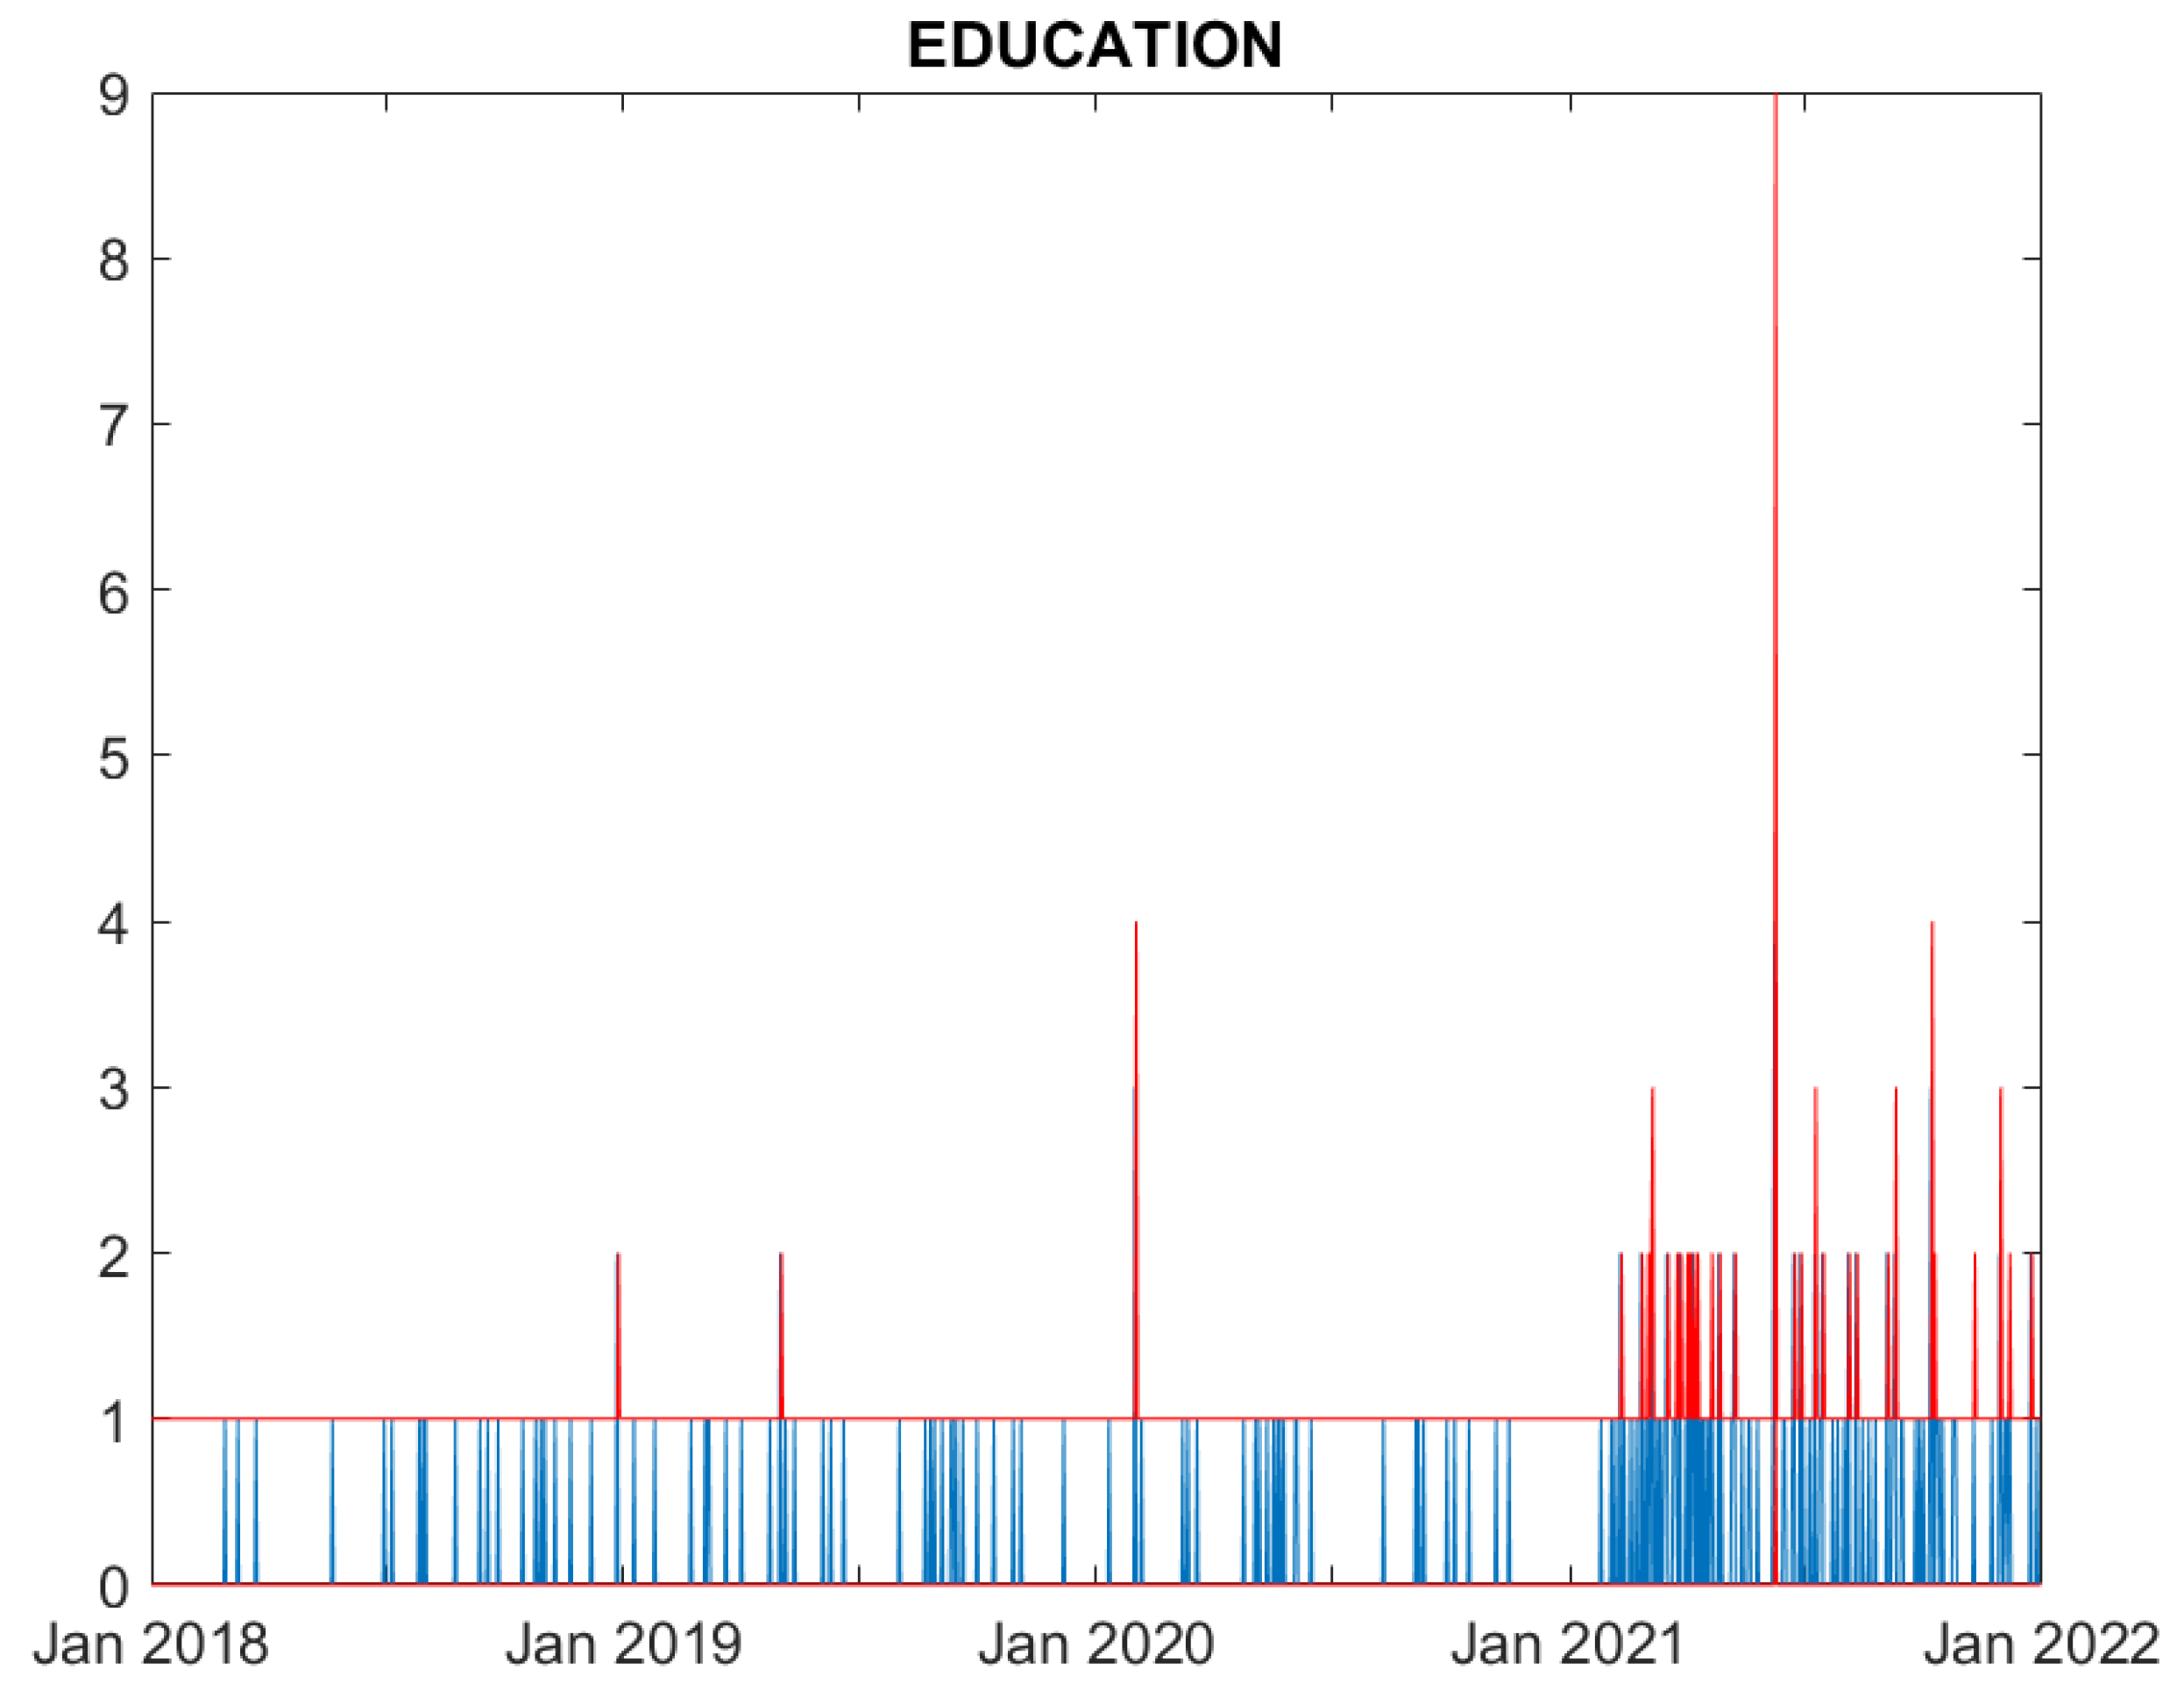
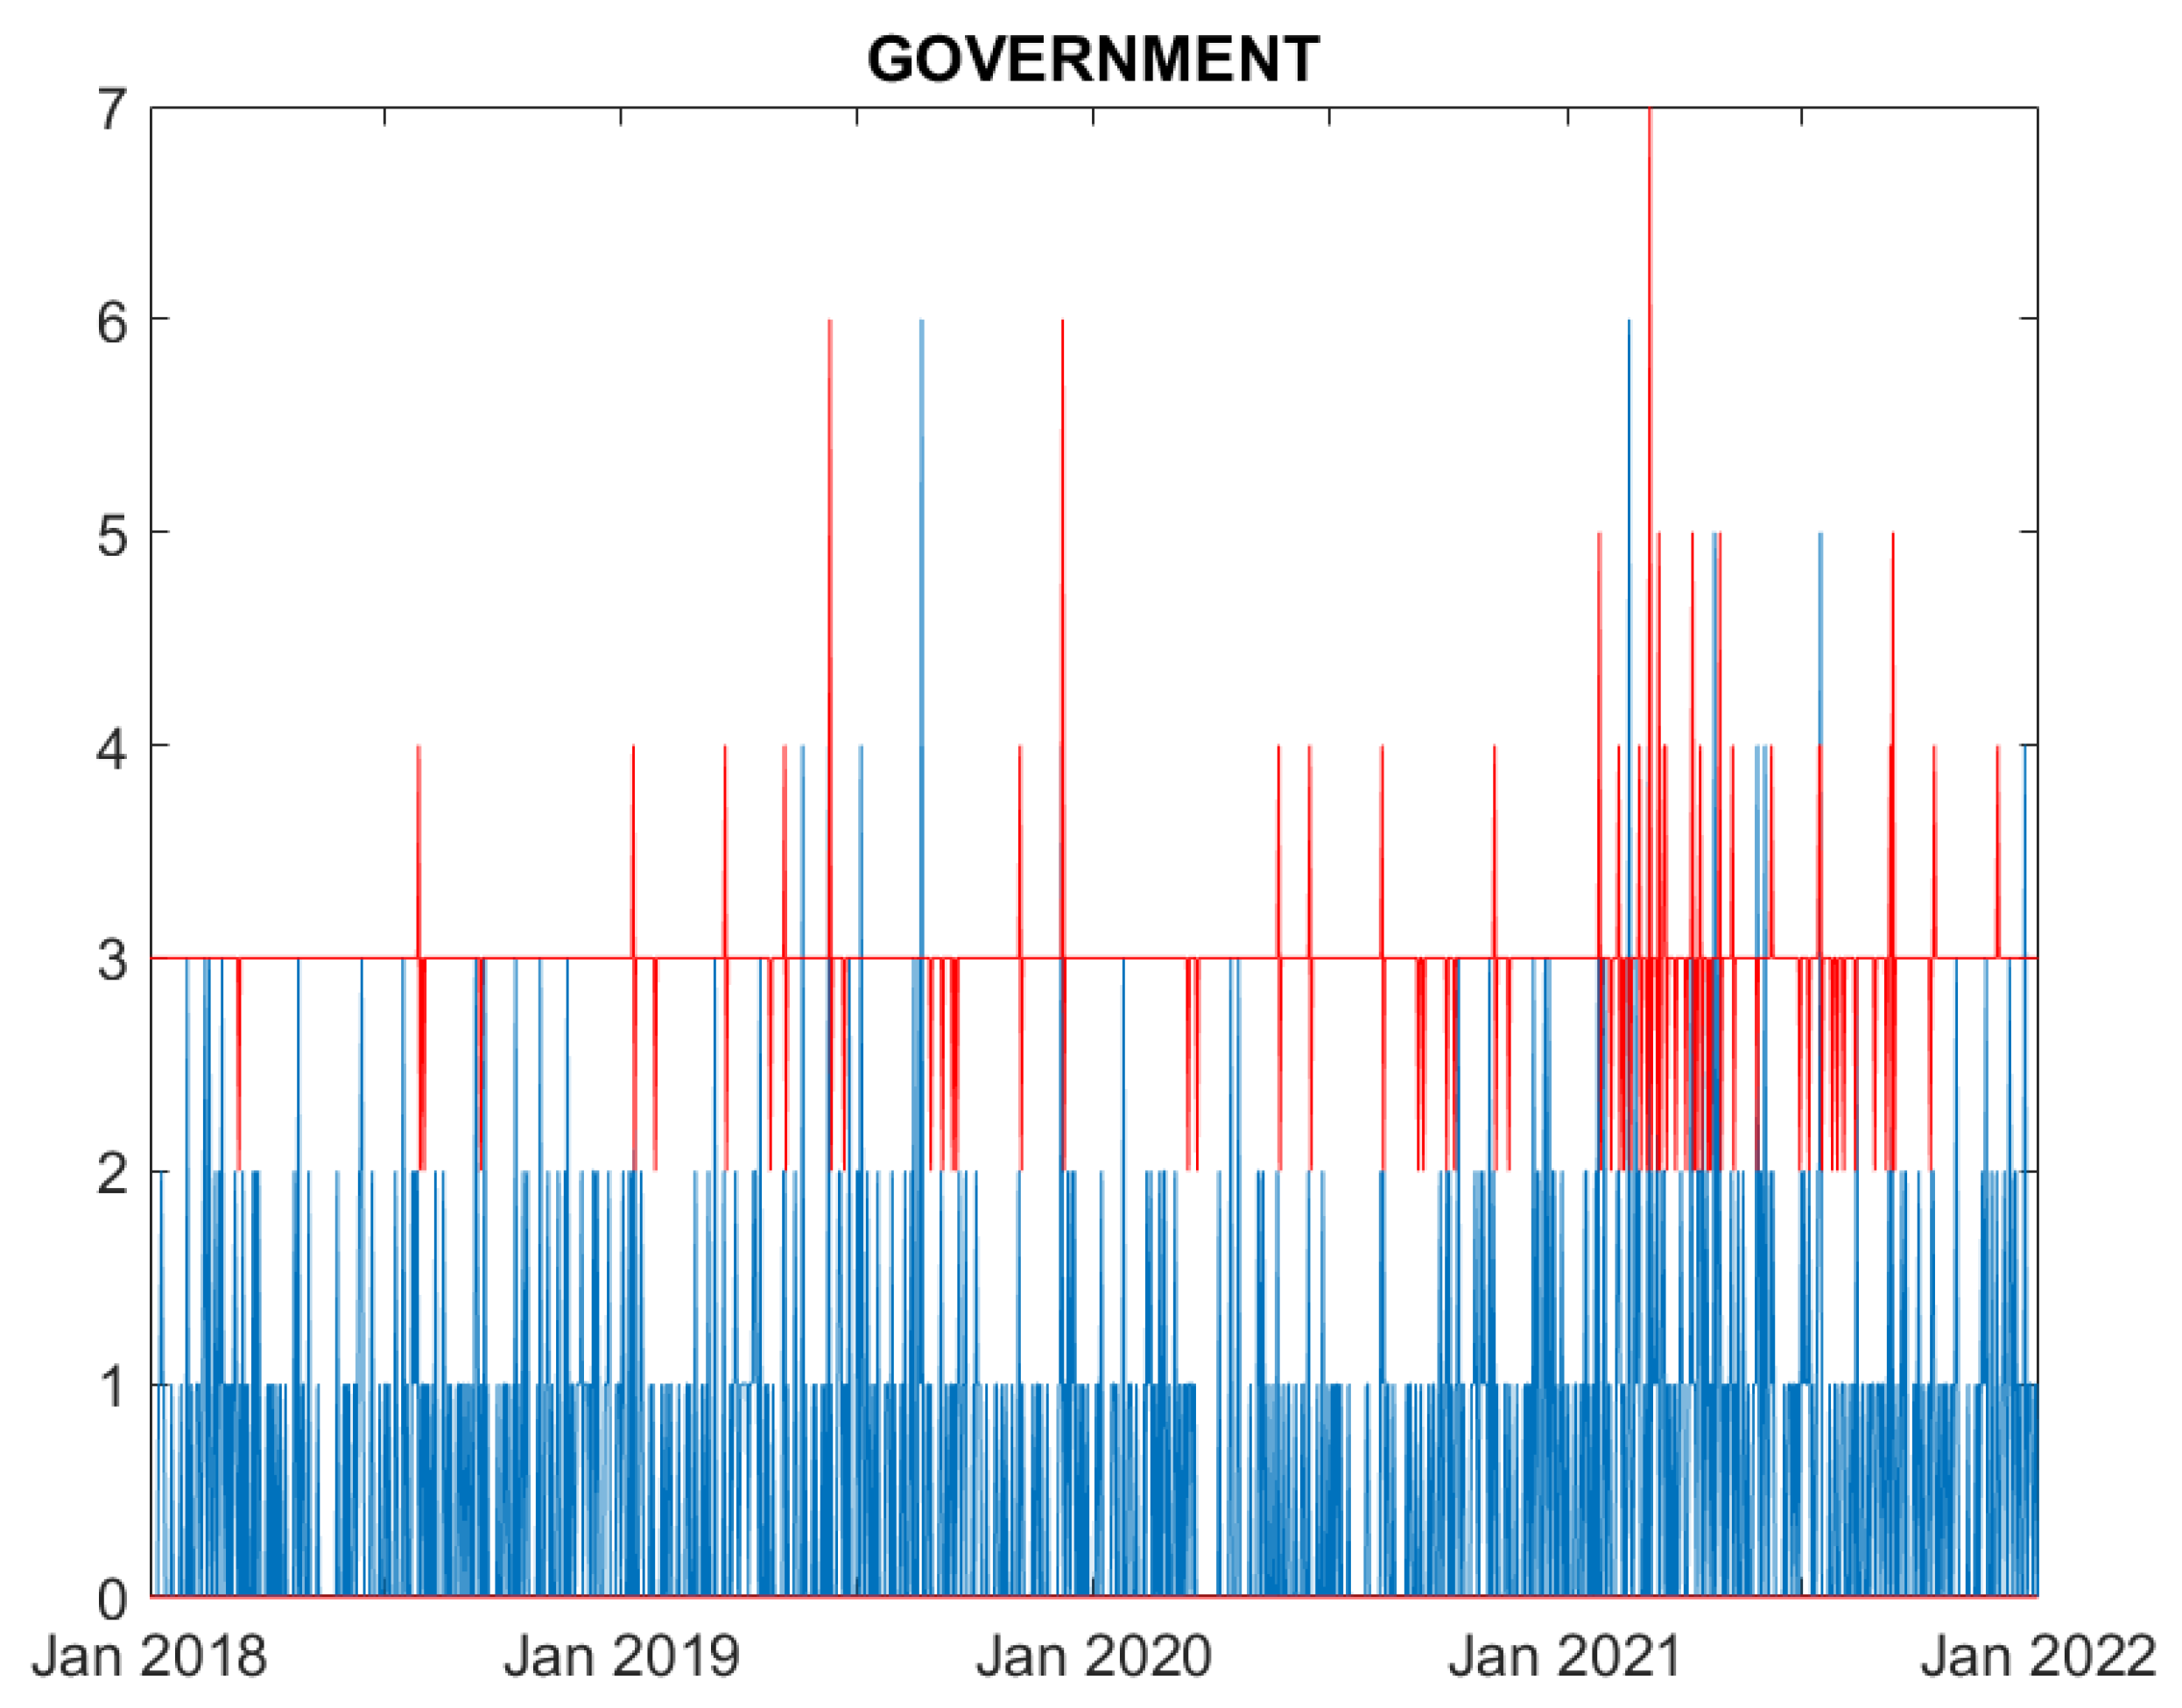
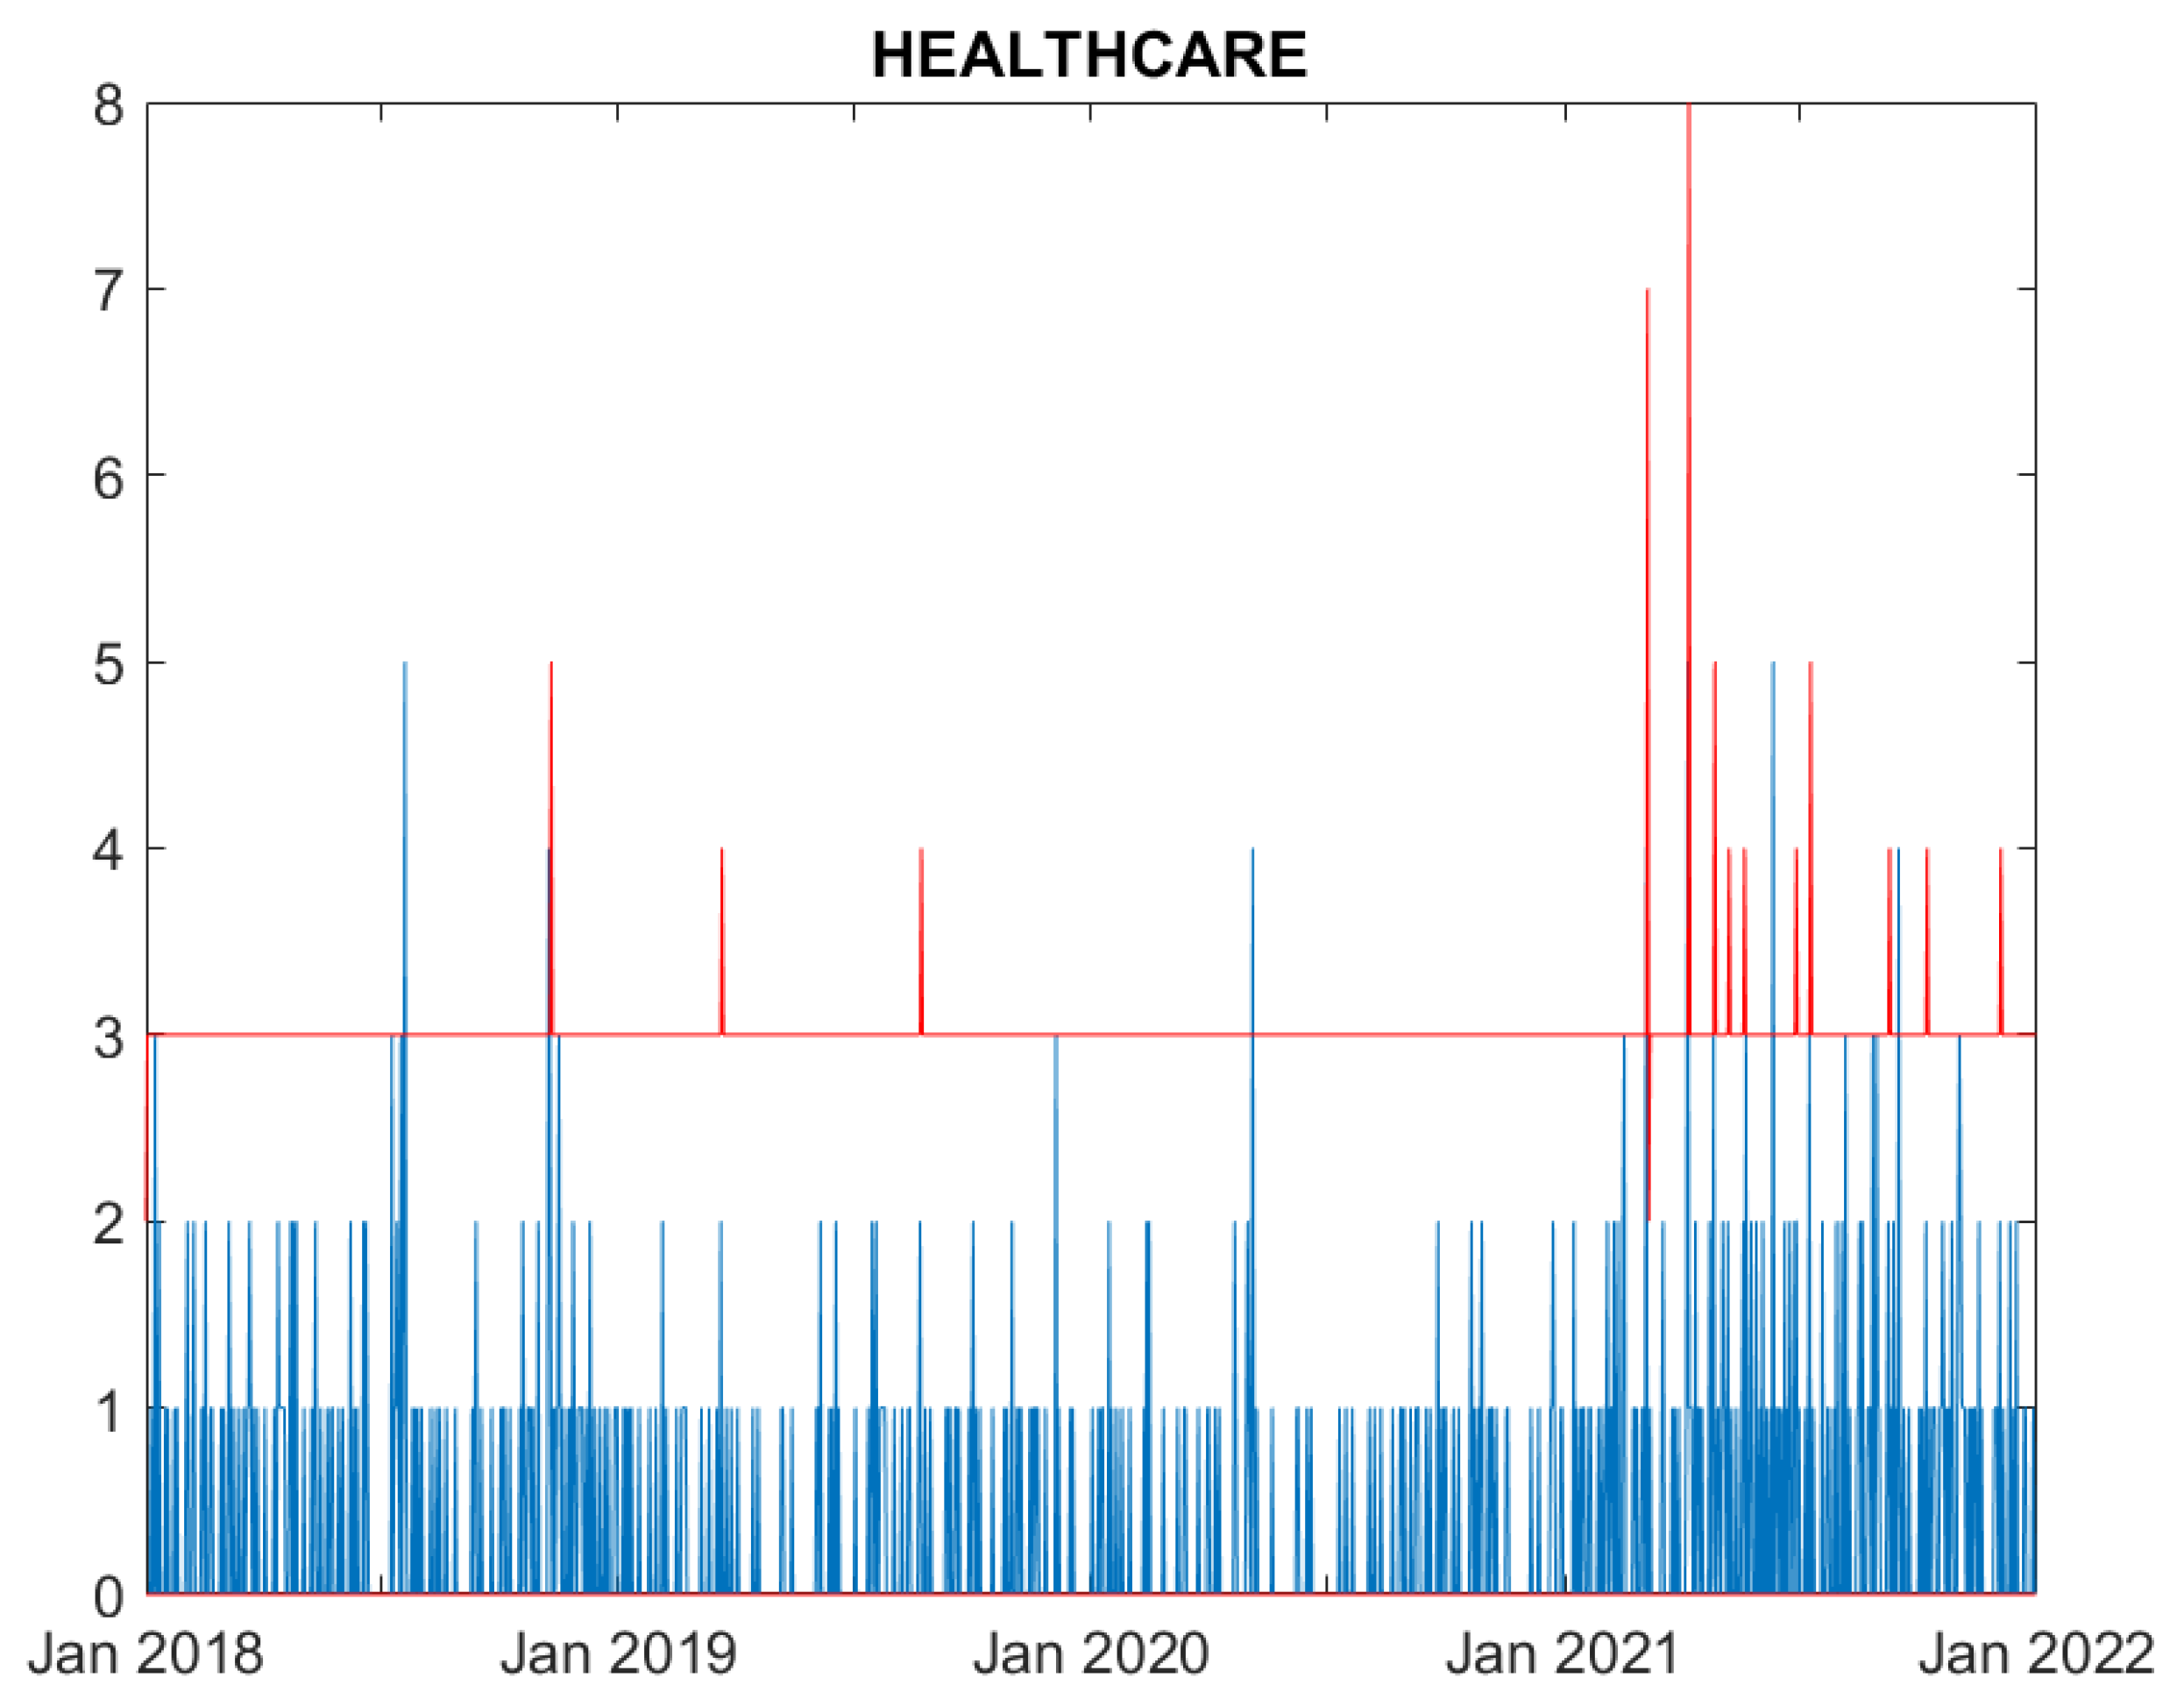
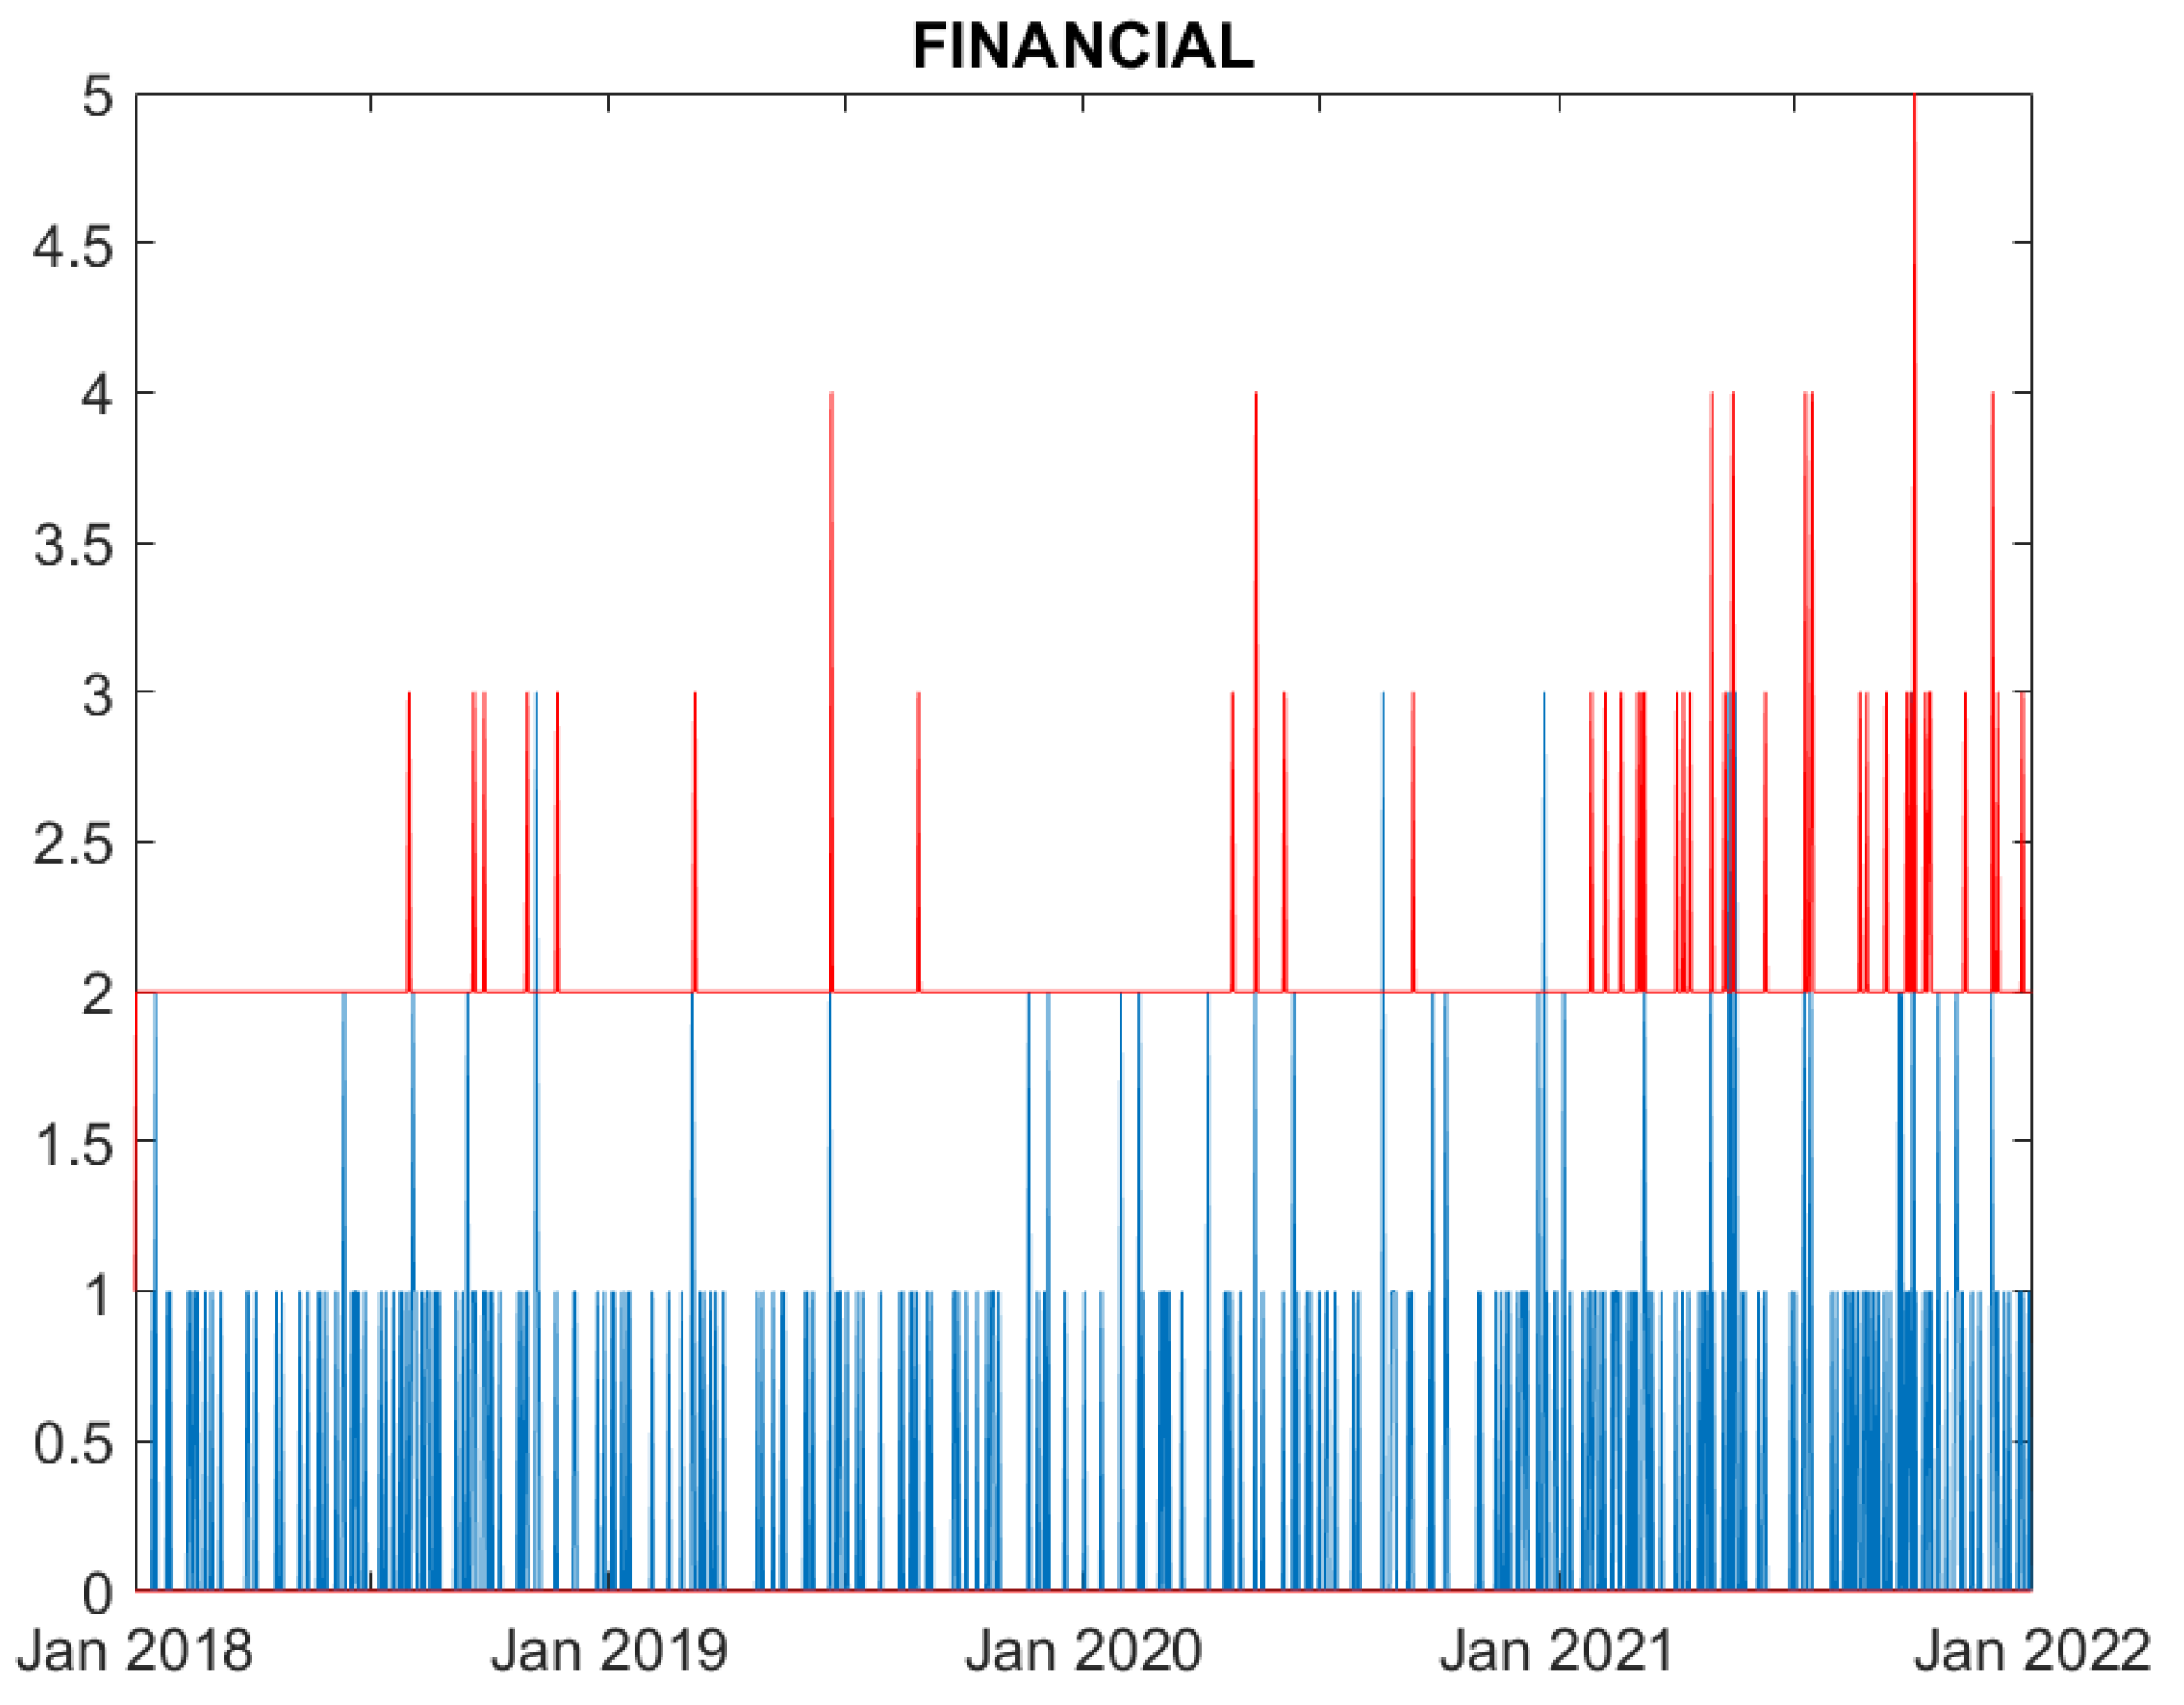
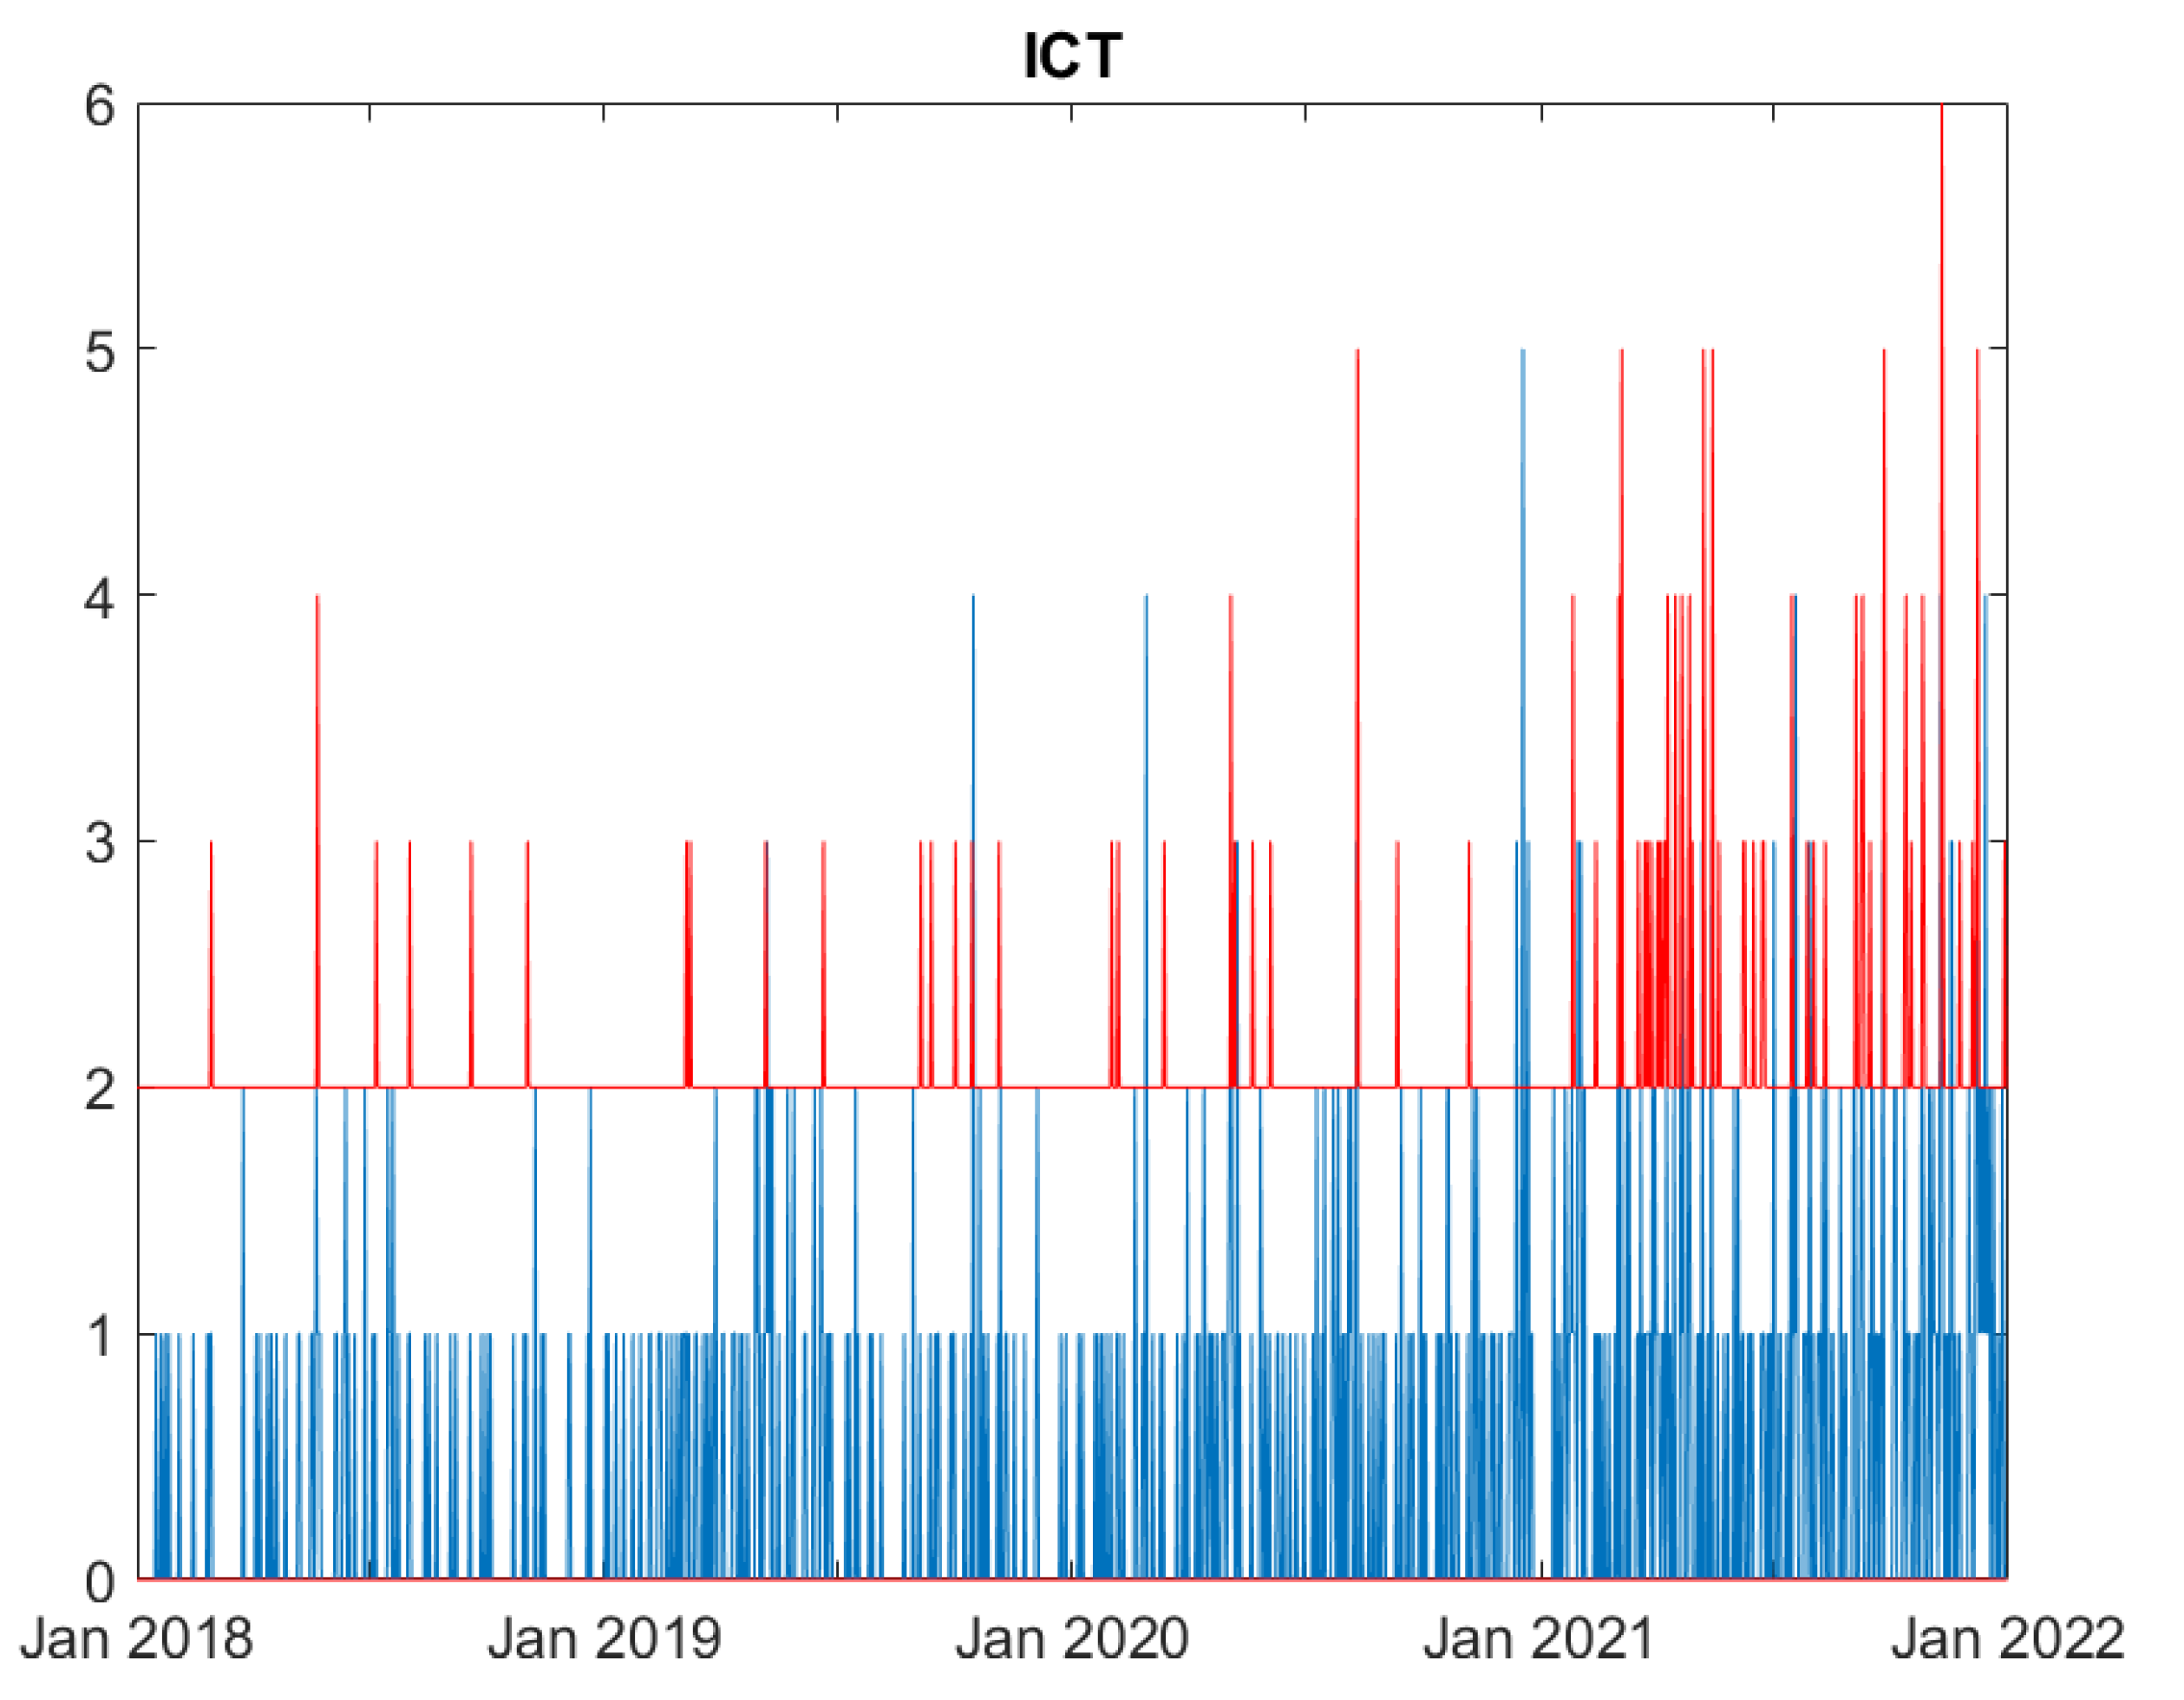
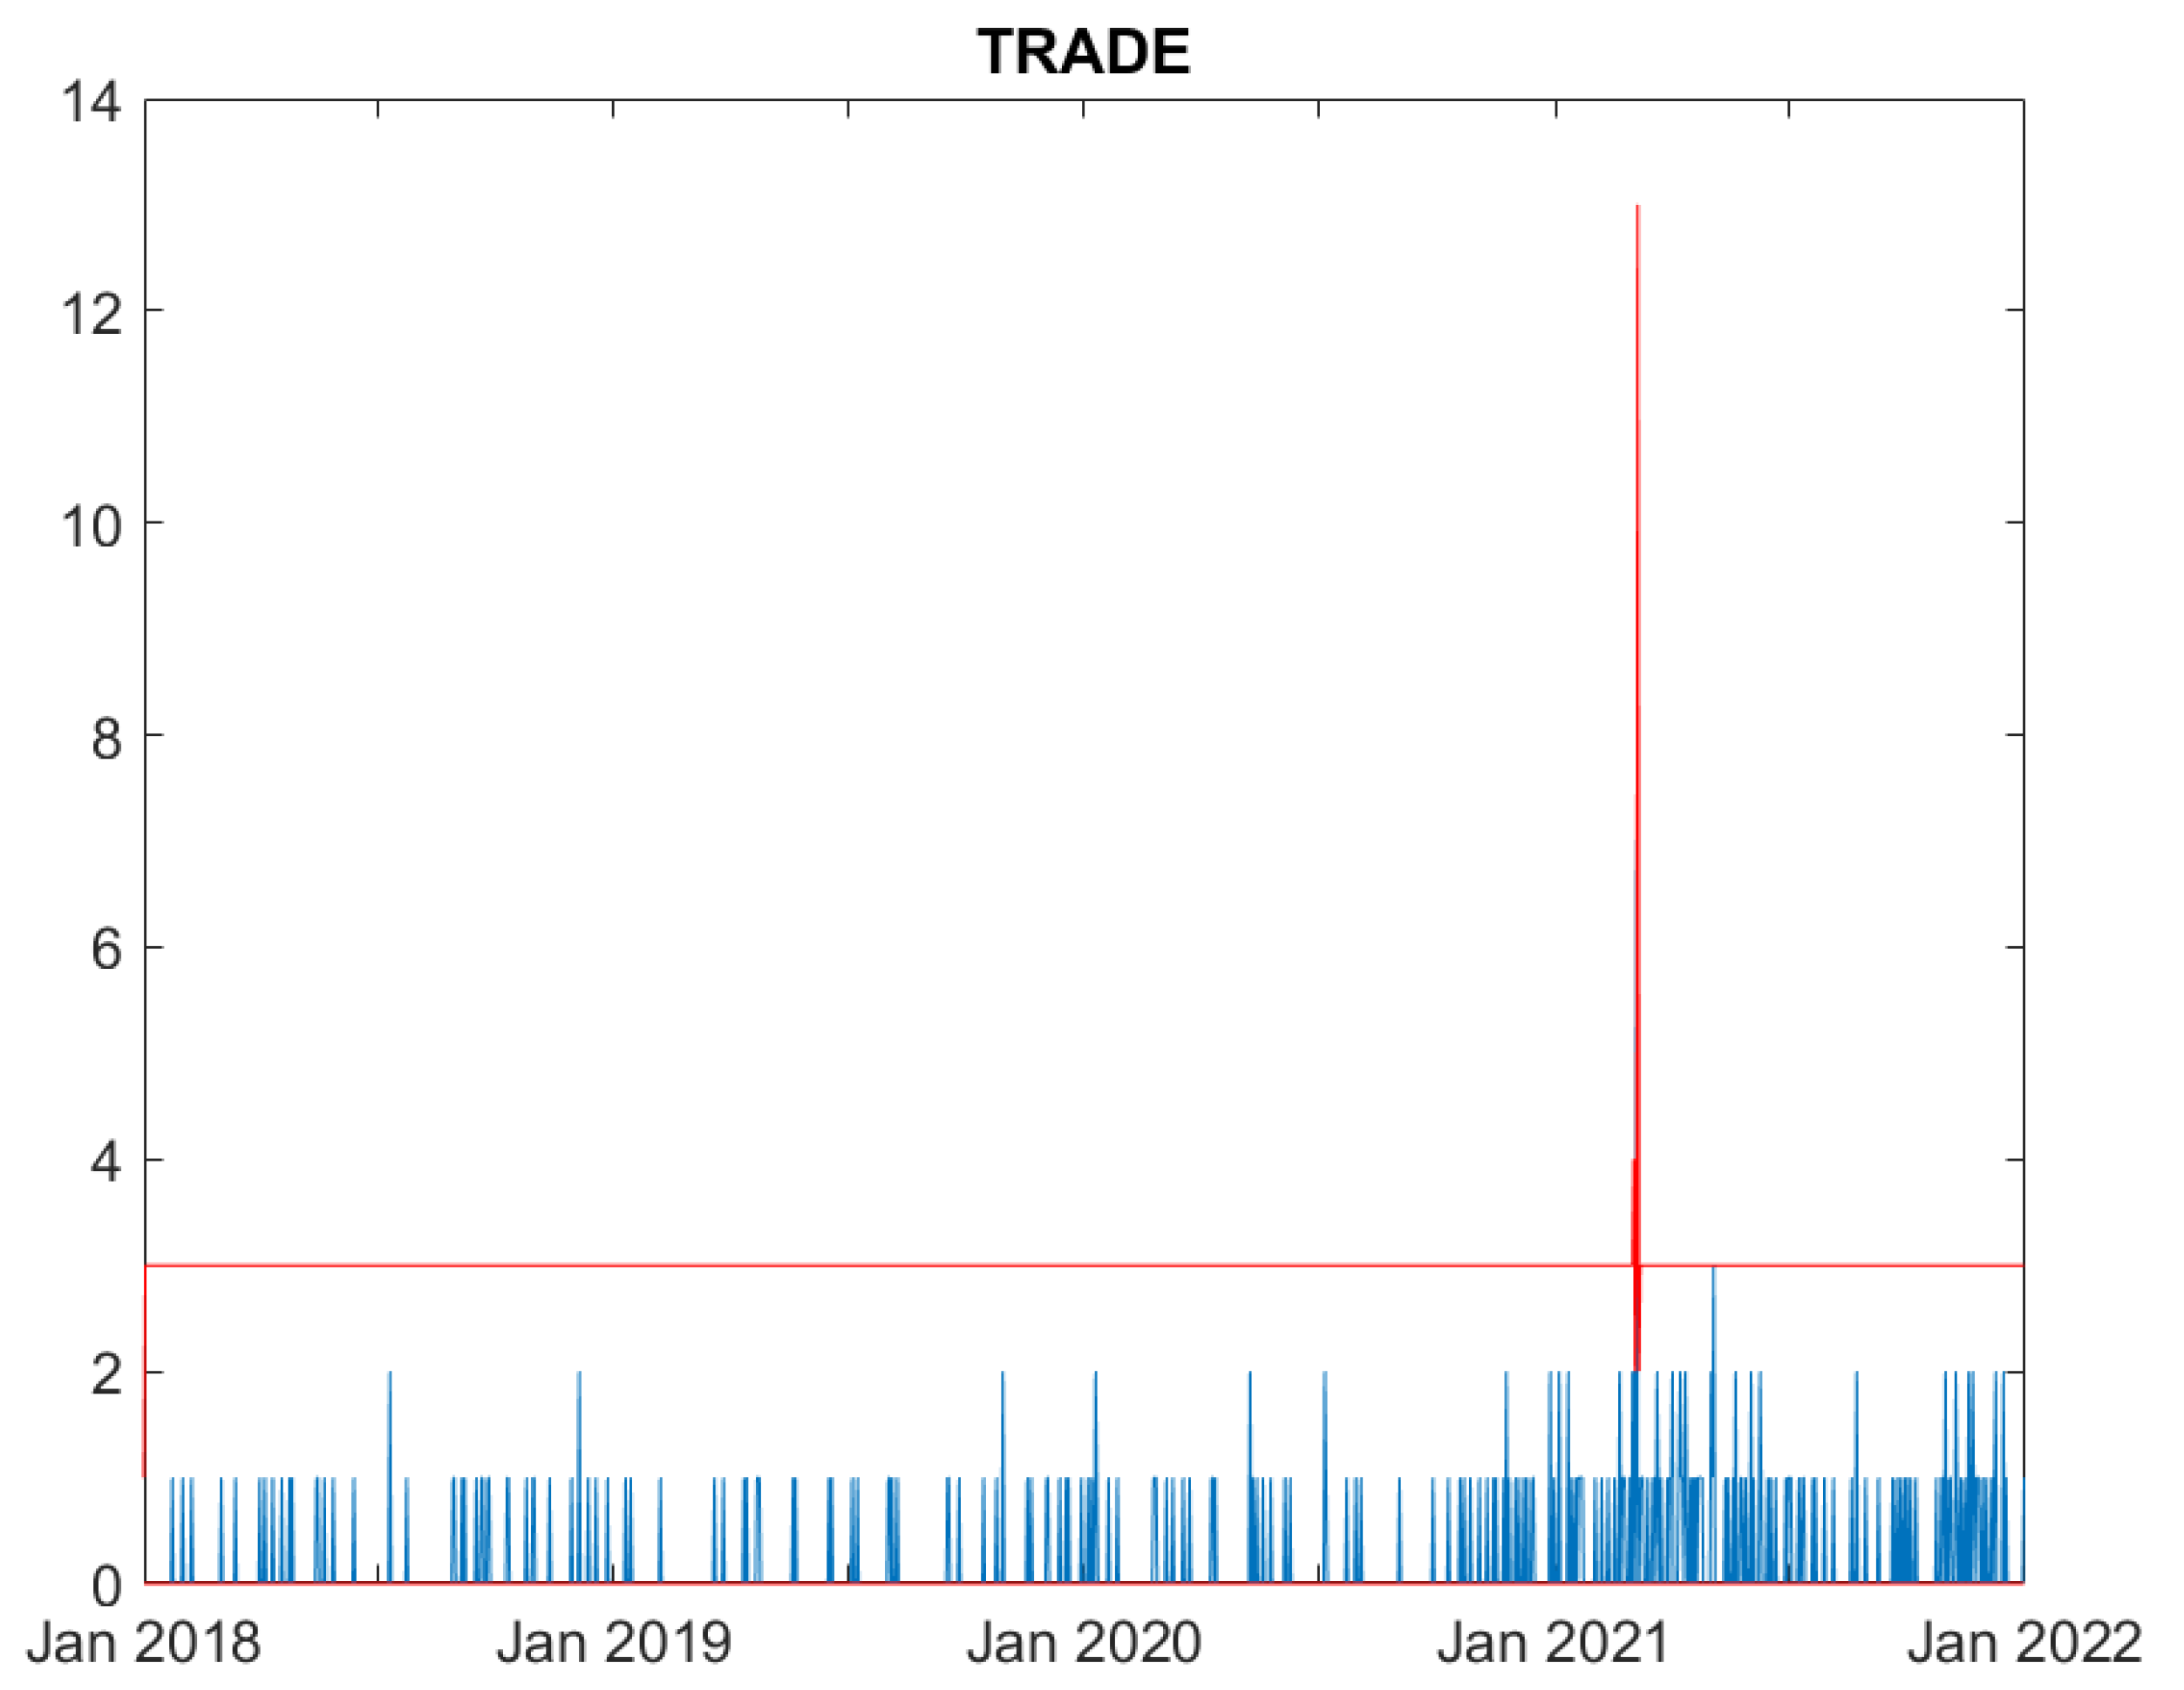
We now evaluate the performance of the proposed model. Figures from
Figure 1 to
Figure 6 compare, for each time series, the observed counts against the 95% confidence bands for the fitted ones.
Figure 1 shows that the model well predicts the actual cyber attacks occurring in the education sector.
Figure 2 indicates that the model well predicts most of the actual cyber attacks occurring in the government sector.
Figure 3 indicates that the model well predicts the actual cyber attacks occurring in the government sector, with the exception of a few cases.
Figure 4 indicates that the model well predicts the actual cyber attacks occurring in the financial sector.
Figure 5 indicates that the model well predicts most of the actual cyber attacks occurring in the ICT sector.
Figure 6 indicates that the model does not predict well the actual cyber attacks occurring in the trade sector, as it constantly overfits the data.
In summary, all Figures indicate that the model well captures the cyber attack count dynamics for five sectors: Education, Government, Healthcare, Financial and ICT. For all these series the fitted series well correspond to the observed ones. Differently, the fit for the Trade sector, characterised by a limited amount of events, is rather poor, and the predictions over estimates the actual losses.
4. Conclusions
Within the context of fintech risk management, this paper has focused on one of the the main risks that arise with the development of financial technologies: cyber risk. The paper has suggested a research direction to measure such risk, so to to manage and mitigate it.
More precisely, the paper has proposed a novel model to measure contagion risk of (extreme) cyber losses. The model is based on a multivariate negative binomial score-driven model for count time series. The use of negative binomial distribution allows to deal with overdispersion, a common feature in count time series of rare events, such as cyber attacks.
The presented model is very suitable to study contagion in financial losses among different industries and markets. In the proposed specification, the interdependence between extreme event counts arises indeed from the effect of shocks in a sector on the probability that new events occur in the others.
The application of the model to daily cyber loss data in the 2018-2021 period reveals high time dependence and significant cross-sector effects.
The study has focused on cyber risk deriving from ordinal loss data. A possible extension would be to consider continuos loss data, when available, as in [
3].
Further research should take into account other types of extreme events, such as climate-change impacts.
We believe that this paper can contribute to encourage the development and the growth of financial technologies, making them sustainable, minimising their possible negative impacts on consumers and investors. This by means of the development of appropriate risk management methods, whose compliance burden can be limited by the technology itself.
A strict collaboration and open discussion between academics, fintech experts and regulators can help move in this direction, developing fintech risk management models that, while limiting the negative impact of disrupting technologies, encourage their development.
Author Contributions
Conceptualization, A.A. and P.G.; methodology, A.A:; software, A.A.; validation, P.G.; formal analysis, A.A.; investigation, A.A.; resources, P.G.; data curation, A.A.; writing—original draft preparation, A.A.; writing—review and editing, P.G.; visualization, P.G.; supervision, P.G.; project administration, P.G.; funding acquisition, P.G.
Funding
This research was funded by European Commission PERISCOPE project grant number 101016233.
Acknowledgments
The paper is the result of a close collaboration between the two authors. Both authors declare not to have any conflicts of interest. The authors would like to thank Sofia Scozzari, CEO and founder of Hackmanack, for having provided the data..
Conflicts of Interest
The authors declare no conflict of interest.
References
- Adrian, T.; Brunnermeier, M.K. CoVaR. The American Economic Review 2016, 106, 1705–1741. [Google Scholar]
- Ahelegbey, D.; Billio, M.; Casarin, R. Bayesian graphical models for structural vector autoregressive models. Journal of Applied Econometrics 2016, 31, 357–386. [Google Scholar] [CrossRef]
- Aldasoro, I.; Gambacorta, L.; Giudici, P.; Leach, T. The drivers of cyber risk. Journal of financial stability 2022, 60, 100989. [Google Scholar]
- Billio, M.; Getmansky, M.; Lo, W.L.; Pelizzon, L. Econometric measures of connectedness and systemic risk in the finance and insurance sectors. Journal of Financial Economics 2012, 104, 535–559. [Google Scholar] [CrossRef]
- Creal, D.; Koopman, S.J.; Lucas, A. Generalized autoregressive score models with applications. Journal of Applied Econometrics 2013, 28, 777–795. [Google Scholar] [CrossRef]
- Diebold, F.; Yilmaz, K. On the Network Topology of Variance Decompositions: Measuring the Connectedness of Financial Firms. Journal of Econometrics 2014, 182, 119–134. [Google Scholar]
- Escribano, A.; Maggi, M. Intersectoral default contagion: A multivariate Poisson autoregression analysis. Economic Modelling 2019, 82, 376–400. [Google Scholar] [CrossRef]
- Giudici, P.; Raffinetti, E. Explainable AI methods in cyber risk management. Quality and Reliability Engineering International 2021, 1–9. [Google Scholar]
- Harvey, A.C. Dynamic Models for Volatility and Heavy Tails: With Applications to Financial and Economic Time Series; Cambridge University Press: New York, NY, USA, 2013. [Google Scholar]
- Heinen, A.; Rengifo, E. Multivariate autoregressive modeling of time series count data using copulas. Journal of Empirical Finance 2007, 14, 564–583. [Google Scholar] [CrossRef]
- Lando, D.; Nielsen, M.S. Correlation in corporate defaults: Contagion or conditional independence? Journal of Financial Intermediation 2010, 19, 355–372. [Google Scholar]
- Minoiu, C.; Reyes, J.A. A Network Analysis of Global Banking: 1978–2010. Journal of Financial Stability 2013, 9, 168–184. [Google Scholar] [CrossRef]
- Kopp, E. , Kaffenberger, L. Wilson, C: Cyber Risk, Market Failures, and Financial Stability, IMFWorking Paper, WP/17/185. 2017; 1–35. [Google Scholar]
|
Disclaimer/Publisher’s Note: The statements, opinions and data contained in all publications are solely those of the individual author(s) and contributor(s) and not of MDPI and/or the editor(s). MDPI and/or the editor(s) disclaim responsibility for any injury to people or property resulting from any ideas, methods, instructions or products referred to in the content. |
© 2023 by the authors. Licensee MDPI, Basel, Switzerland. This article is an open access article distributed under the terms and conditions of the Creative Commons Attribution (CC BY) license (http://creativecommons.org/licenses/by/4.0/).
