Submitted:
13 August 2023
Posted:
14 August 2023
You are already at the latest version
Abstract
Keywords:
1. Introduction
2. Results and Discussion
2.1. Molecular Geometries in the Monomer form of 1a and 2a
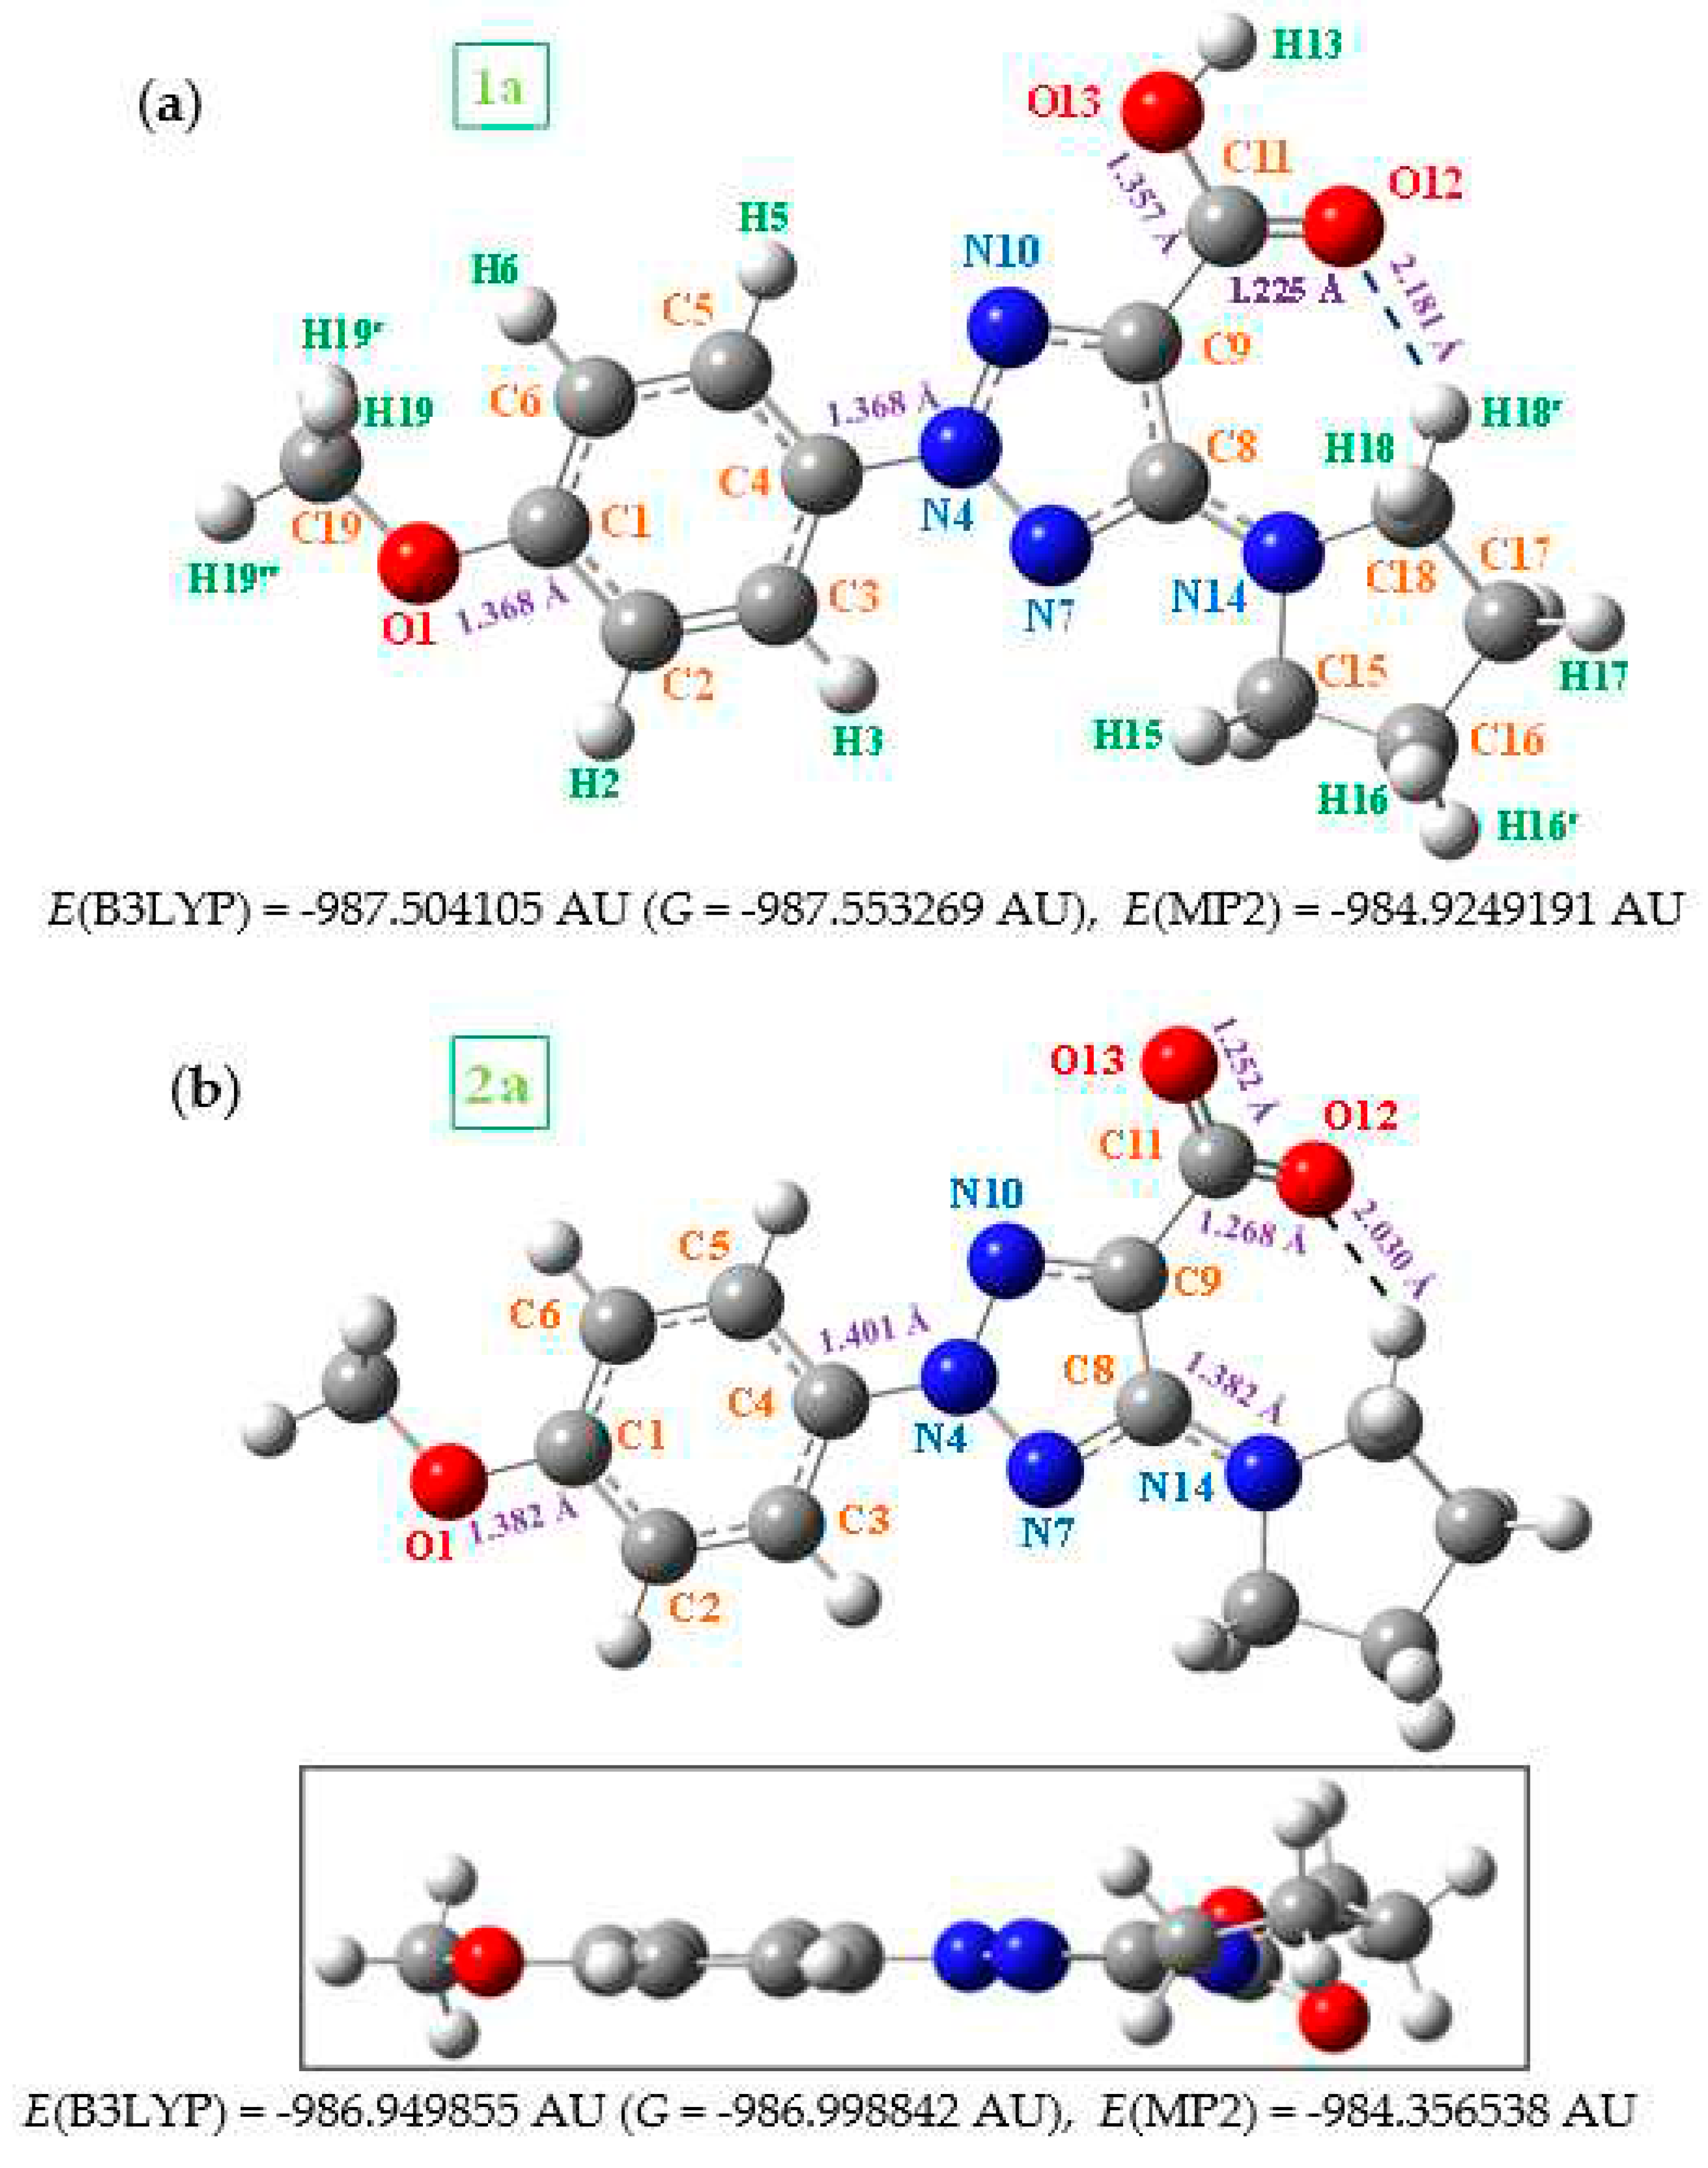
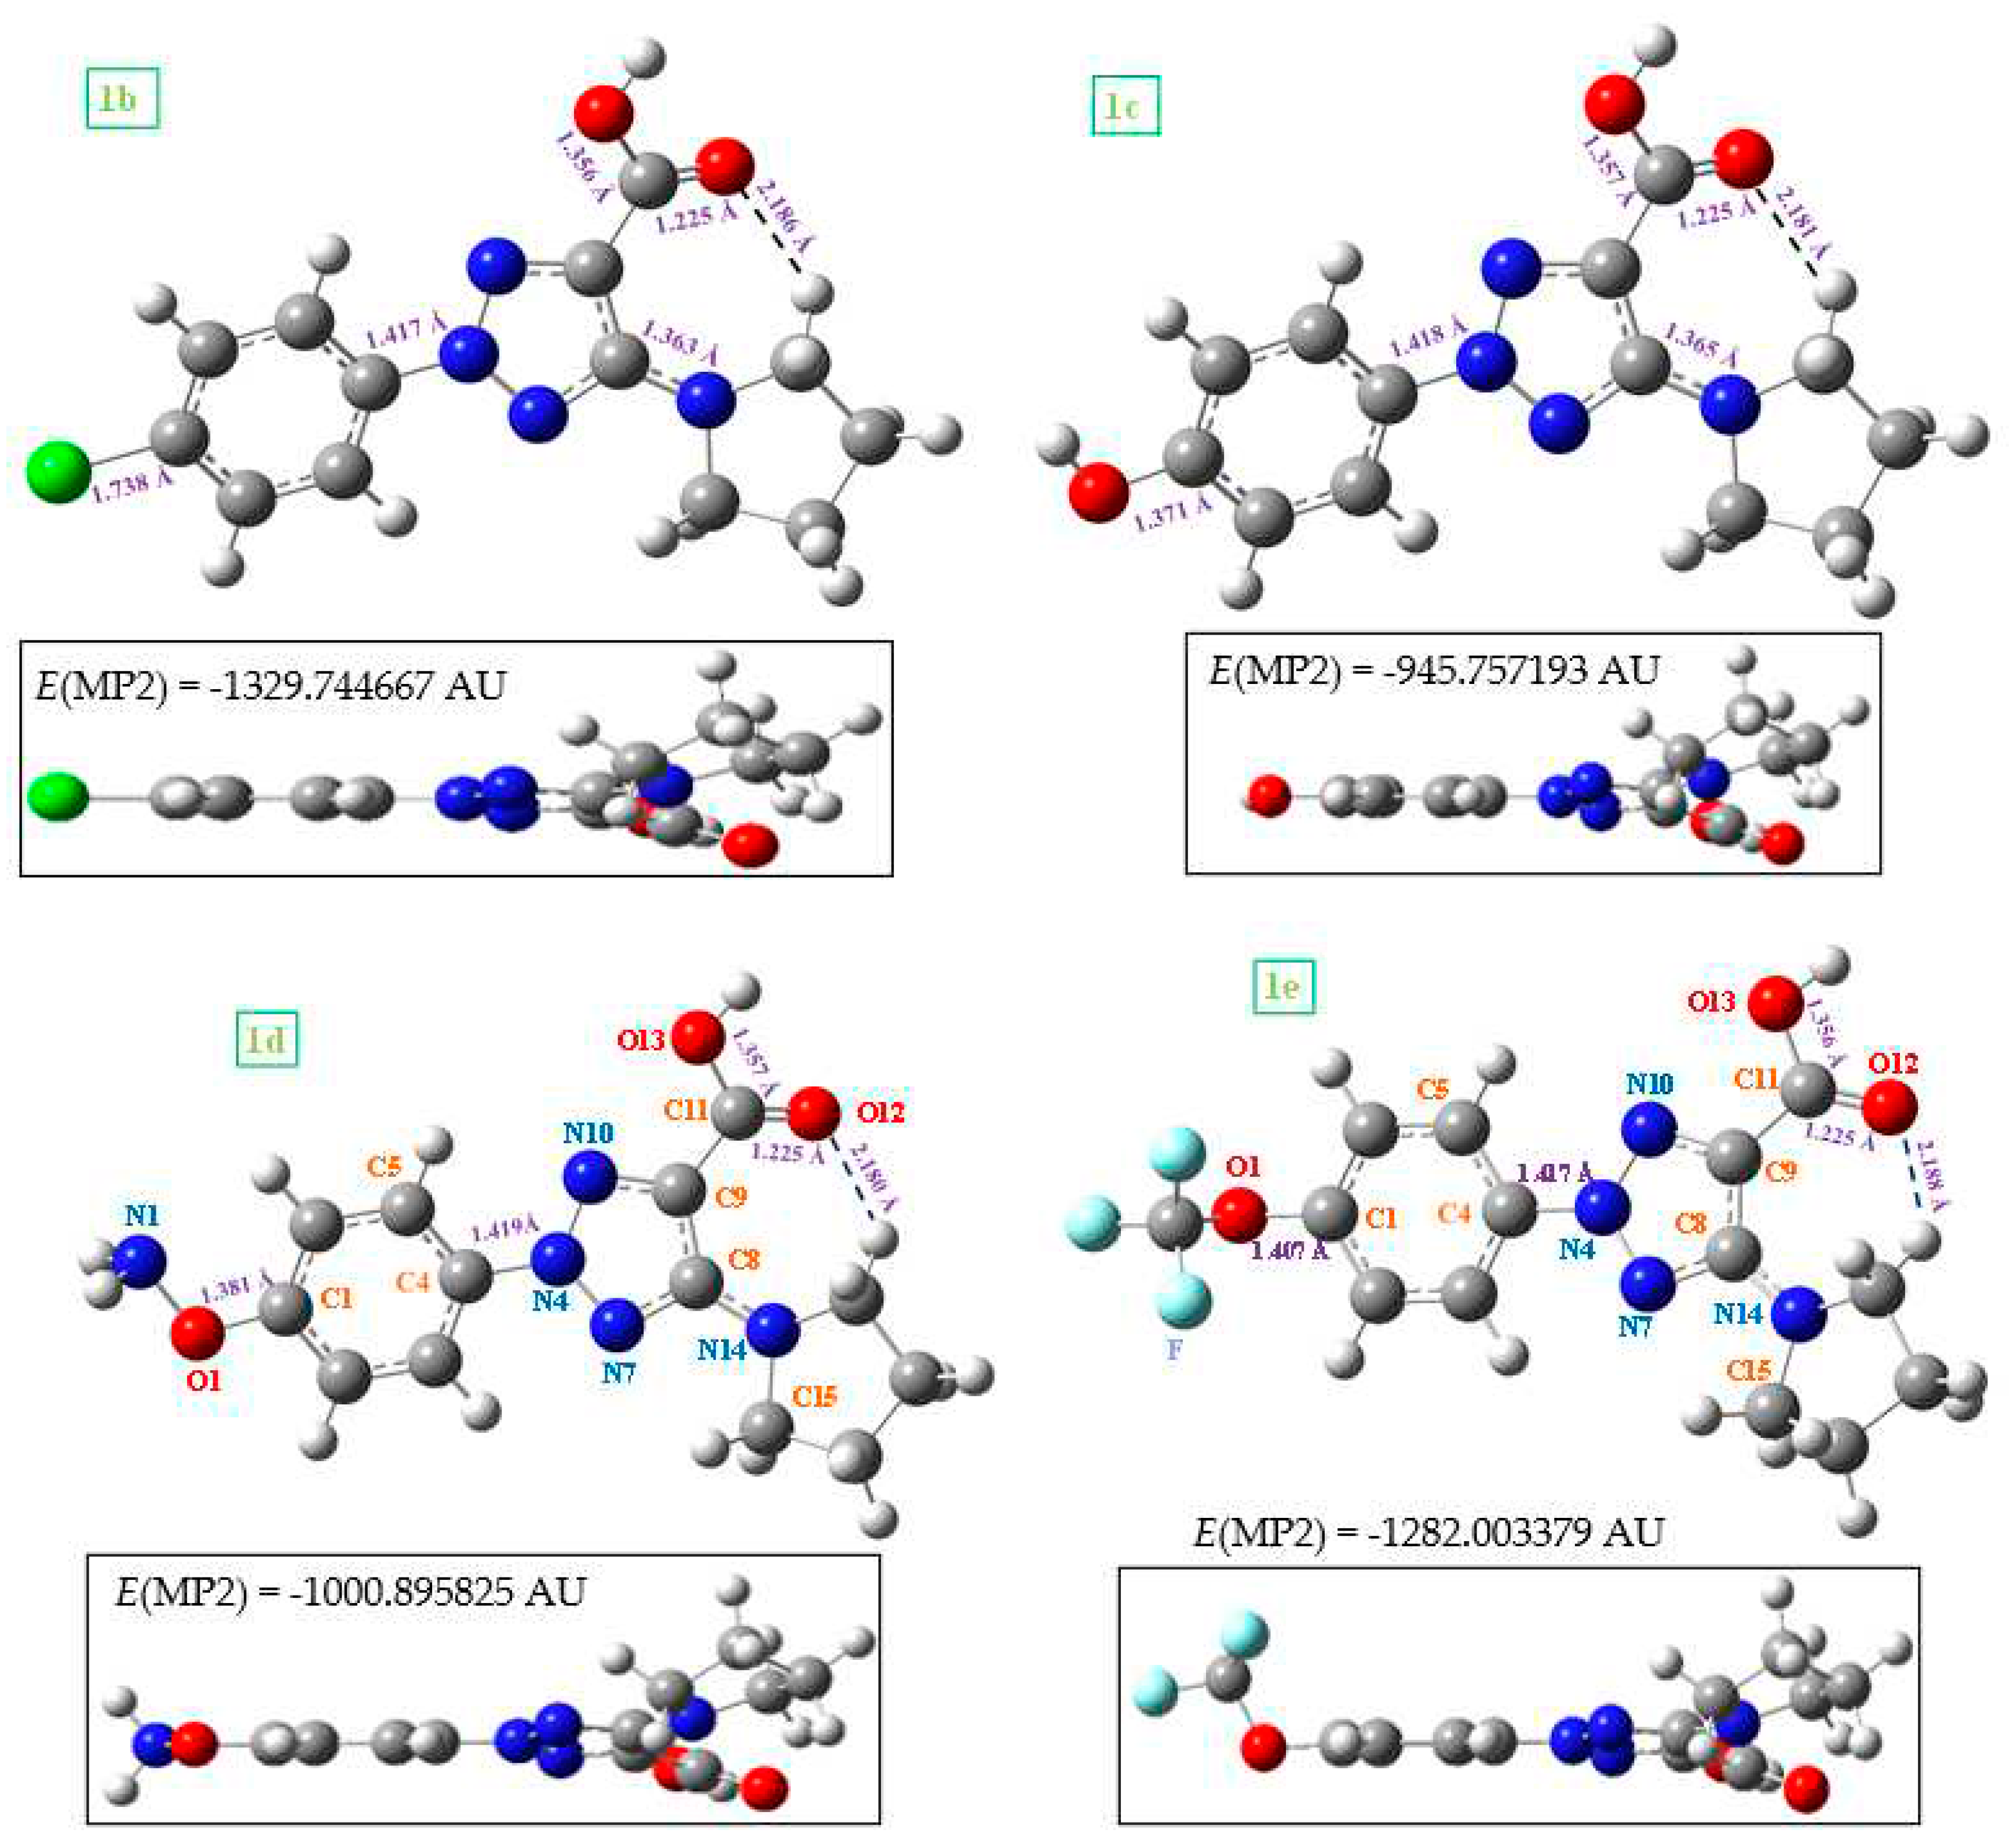
| Parameters | -OCH3 | -CL | -OH | -ONH2 | -OCF3 | |||
|---|---|---|---|---|---|---|---|---|
| B3LYP | MP2 | MP2 | MP2 | MP2 | MP2 | |||
| 1a | 2a | 1a | 2a | 1b | 1c | 1d | 1e | |
| r(C4-N4) r(N4-N7) r(N4-N10) r(C8-C9) r(C9-N10) r(C9-C11) O12…H18 ∠(C4-N4-N10) ∠N-N-N) ∠(N10-C9-C11) ∠(C9-C8-N14) ∠(C9-C11=O12) ∠(C9-C11-O13) ∠(O=C=O) ∠(C5-C4-N4-N10) ∠(N4-N10-C9-C11) ∠(N10-N4-N7-C8) ∠(N10-C9-C=O12) ∠(N10-C9-C-O13) ∠(C8-C9-C=O12) ∠(C11-C9-C8-N14) ∠(C9-C8-N14-C18) ∠(C8-N14-C15-C16) ∠(N14-C15-C16-C17) |
1.421 1.349 1.311 1.440 1.347 1.465 2.152 122.5 115.9 119.7 133.2 126.1 112.4 121.4 -1.6 175.6 -0.4 -165.9 13.0 9.6 4.8 19.7 -163.0 -21.5 |
1.398 1.357 1.343 1.448 1.329 1.549 1.980 122.7 115.0 121.0 131.0 113.9 115.7 130.3 -1.1 175.3 -1.1 -145.7 32.8 29.1 4.4 22.2 -169.6 -14.0 |
1.418 1.340 1.334 1.422 1.358 1.466 2.181 121.7 116.7 119.2 132.6 125.7 111.9 122.4 -14.2 173.6 -0.9 -157.1 21.9 15.0 8.0 26.4 -151.8 -22.9 |
1.401 1.348 1.350 1.427 1.350 1.541 2.030 122.0 116.1 120.7 131.0 113.6 115.3 131.0 -3.0 176.1 -1.4 -149.3 29.8 26.5 2.5 35.6 -163.7 -5.1 |
1.417 1.340 1.334 1.423 1.357 1.467 2.186 121.7 116.8 119.2 132.7 125.6 111.8 122.6 -10.3 173.7 -0.8 -156.3 22.6 16.0 8.0 24.9 -152.0 -23.6 |
1.418 1.340 1.334 1.422 1.358 1.466 2.181 121.7 116.7 119.2 132.6 125.7 111.9 122.4 -13.7 173.6 -0.9 -157.1 21.9 15.0 8.0 26.4 -151.8 -22.9 |
1.419 1.340 1.334 1.422 1.358 1.466 2.180 121.8 116.7 119.3 132.6 125.7 111.9 122.4 -14.9 173.6 -0.9 -157.3 21.7 14.7 8.1 27.0 -151.7 -22.6 |
1.417 1.340 1.334 1.424 1.356 1.468 2.188 121.7 116.8 119.2 132.7 125.6 111.8 122.6 -10.7 173.7 -0.8 -156.1 22.9 16.4 8.0 24.4 -152.0 -23.8 |
| -OCH3 | -CL | -OH | -ONH2 | -OCF3 | ||
|---|---|---|---|---|---|---|
| atom | 1a | 2a | 1b | 1c | 1d | 1e |
| O1 C1 C4 N4 N7 C8 C9 N10 C11 =O12 O13 N14 C18 H18 |
-0.606 0.378 0.117 0.004 -0.380 0.458 -0.099 -0.188 0.979 -0.724 -0.776 -0.561 -0.211 0.263 |
-0.615 0.332 0.167 -0.064 -0.398 0.409 0.019 -0.240 0.956 -0.889 -0.843 -0.558 -0.219 0.297 |
-0.012* -0.052 0.160 -0.005 -0.381 0.462 -0.091 -0.183 0.979 -0.720 -0.775 -0.560 -0.211 0.263 |
-0.756 0.385 0.115 0.004 -0.380 0.458 -0.099 -0.188 0.979 -0.724 -0.776 -0.561 -0.211 0.263 |
-0.472 0.368 0.117 0.005 -0.380 0.457 -0.101 -0.185 0.979 -0.725 -0.776 -0.561 -0.211 0.263 |
-0.651 0.288 0.163 -0.007 -0.381 0.462 -0.089 -0.182 0.978 -0.719 -0.775 -0.560 -0.211 0.263 |
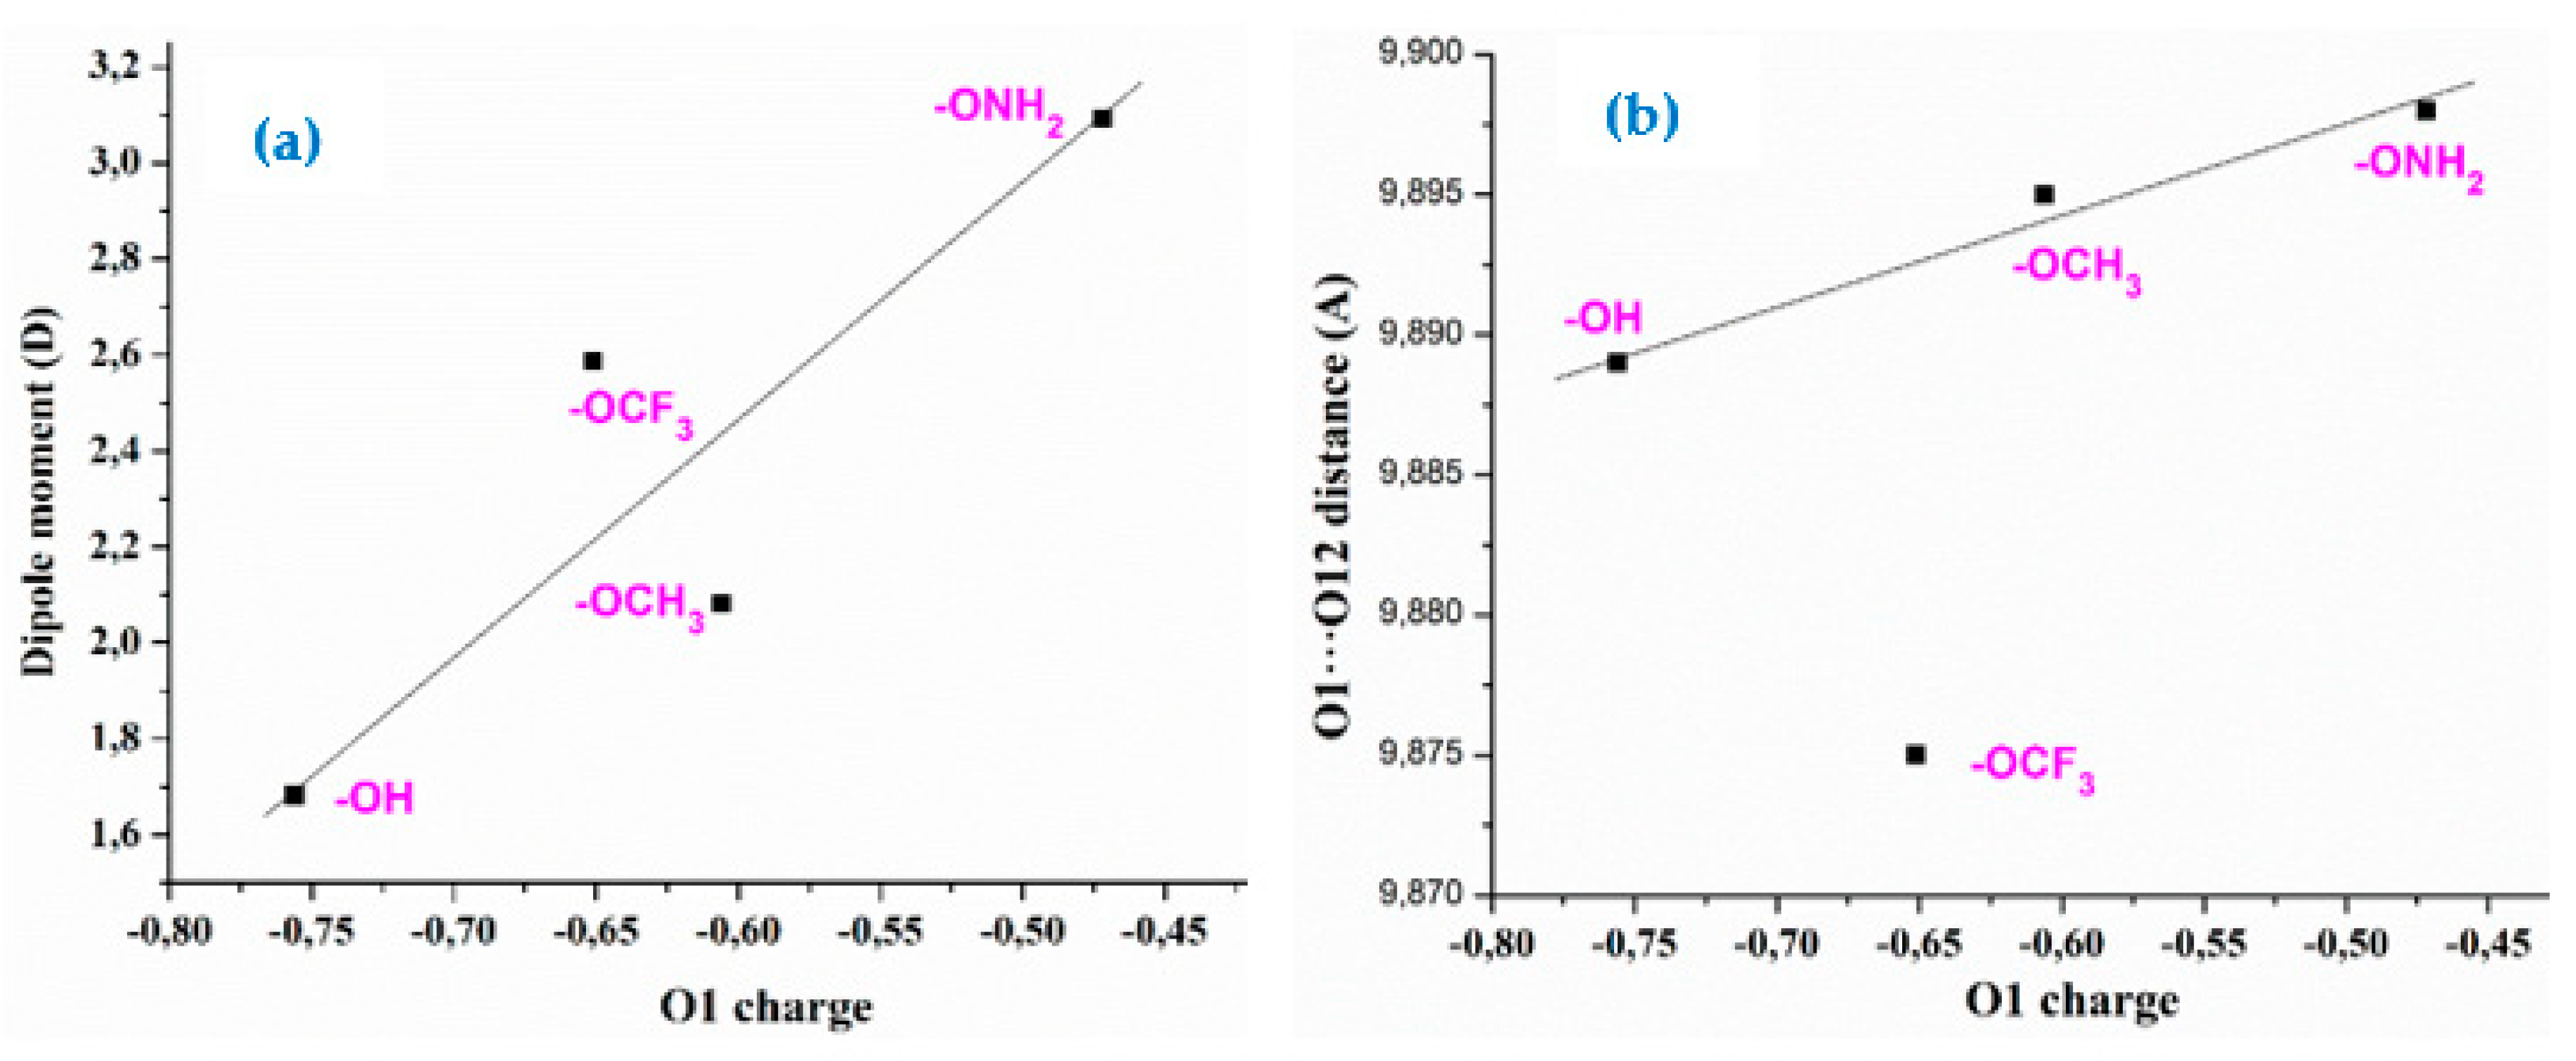
2.2. Relationships Stablished between the Molecular Parameters
2.3. Molecular Geometries in the Dimer Forms
2.4. Molecular Properties
2.5. Scaling the Wavenumbers
2.6. Vibrational Analysis of 1a and 2a
2.6.1. The Carboxylic COOH Group Modes in Molecule 1a
2.6.2. The Carboxylate COO Group Modes in 2a
2.6.3. The Triazole Ring Modes
2.6.4. The Aryl Ring Modes
2.6.5. The Methoxy OCH3 Modes
3. Experimental Details
4. Computational Details
5. Summary and Conclusions
- (1)
- A conformational study at the MP2 level was carried out in the molecules under study. By rotation on the C-O1 bond length the conformers differ less than 1 kJ/mol, while by rotation on the C9-C11 bond it is about 10 kJ/mol. This feature means a large flexibility of the substituents bonded to the triazole ring and variability of its spatial arrangements.
- (2)
- The ionization of neutral carboxylic acid and formation of anionic form demonstrated larger effect on the triazole ring structure and its charges than the electronic nature of different substituents on the aryl ring.
- (3)
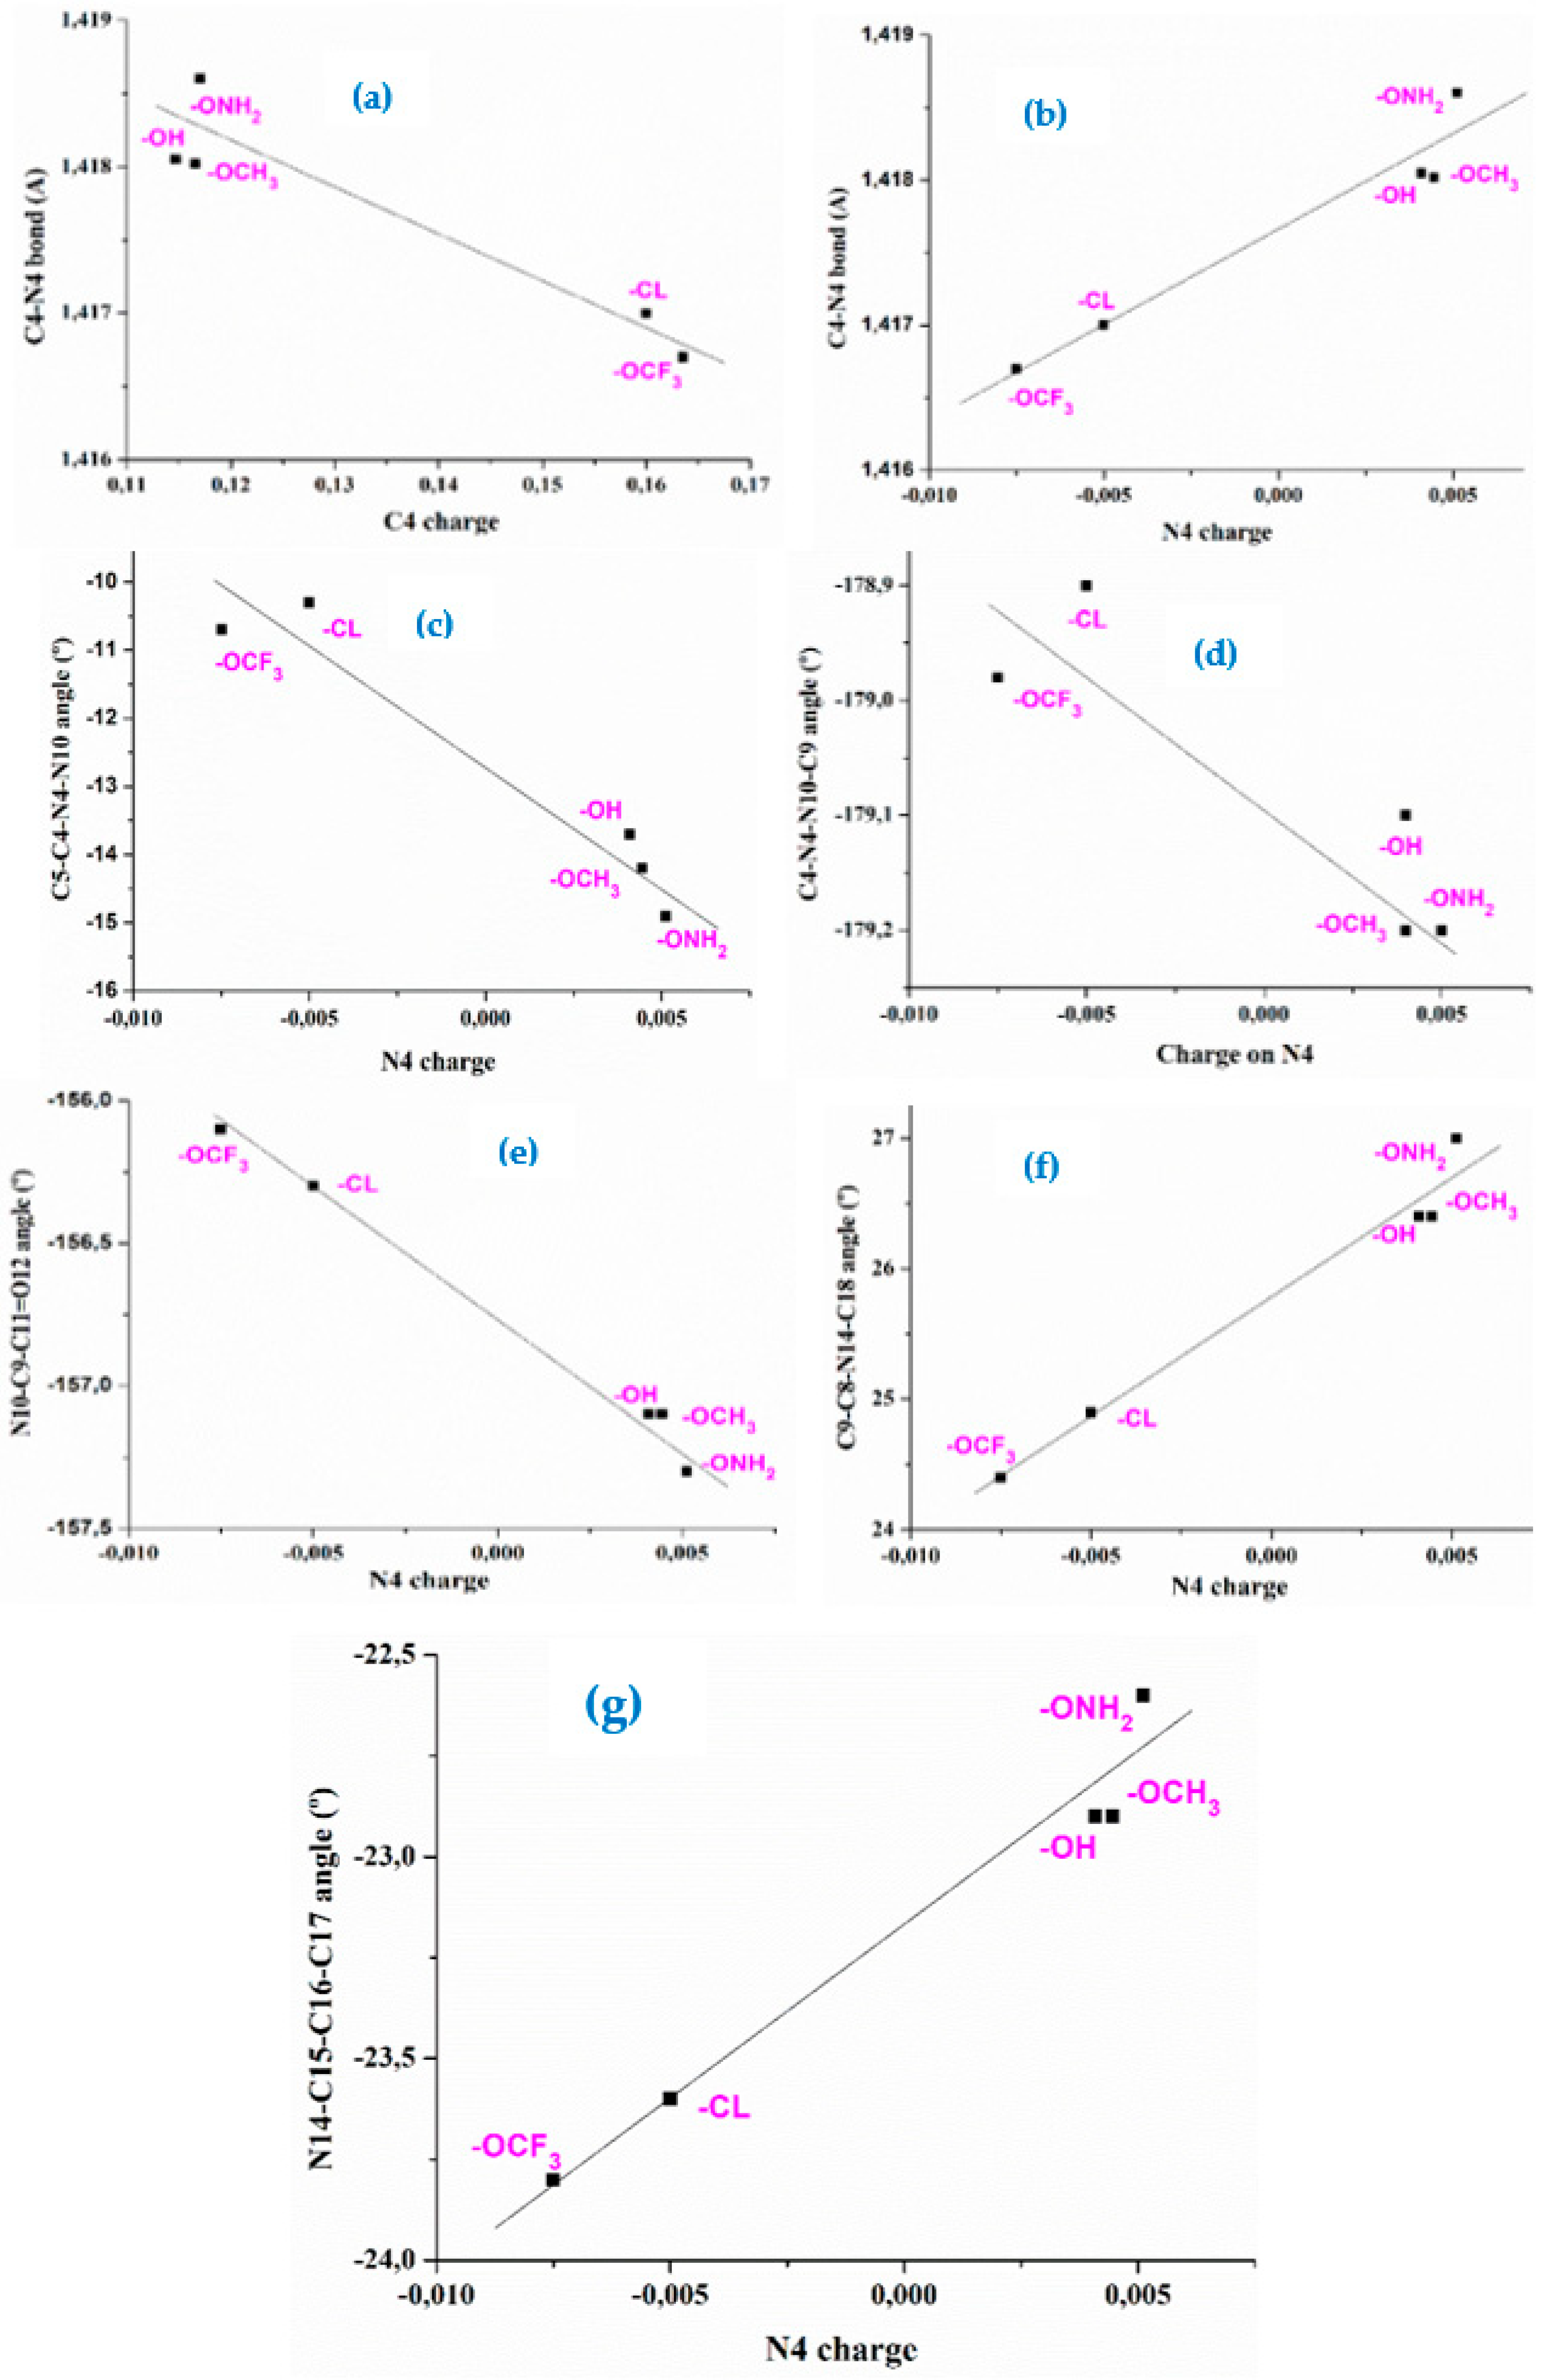
- The effect of five substituents in para-position of the aryl ring on the molecular structure of the triazole and on its atomic charge distribution was determined and several relationships were stablished. Therefore, an increment in the positive N4 charge is linear related to a decrease of both, the aryl ring and the carboxylic group rotation respect to the triazole ring, and by contrast, an increment in the pyrrolidine ring rotation.
- (4)
- The FT-IR and FT-Raman spectra in the solid state of 1a and 2a were recorded, and an accurate assignment of all bands observed was carried out for the first time. For this task the calculated wavenumbers were improved by two main scaling procedures, leading the PSE to the best results, with errors less than 3%. The scaled wavenumbers were slightly worse using the LSE procedure than the TLSE.
- (5)
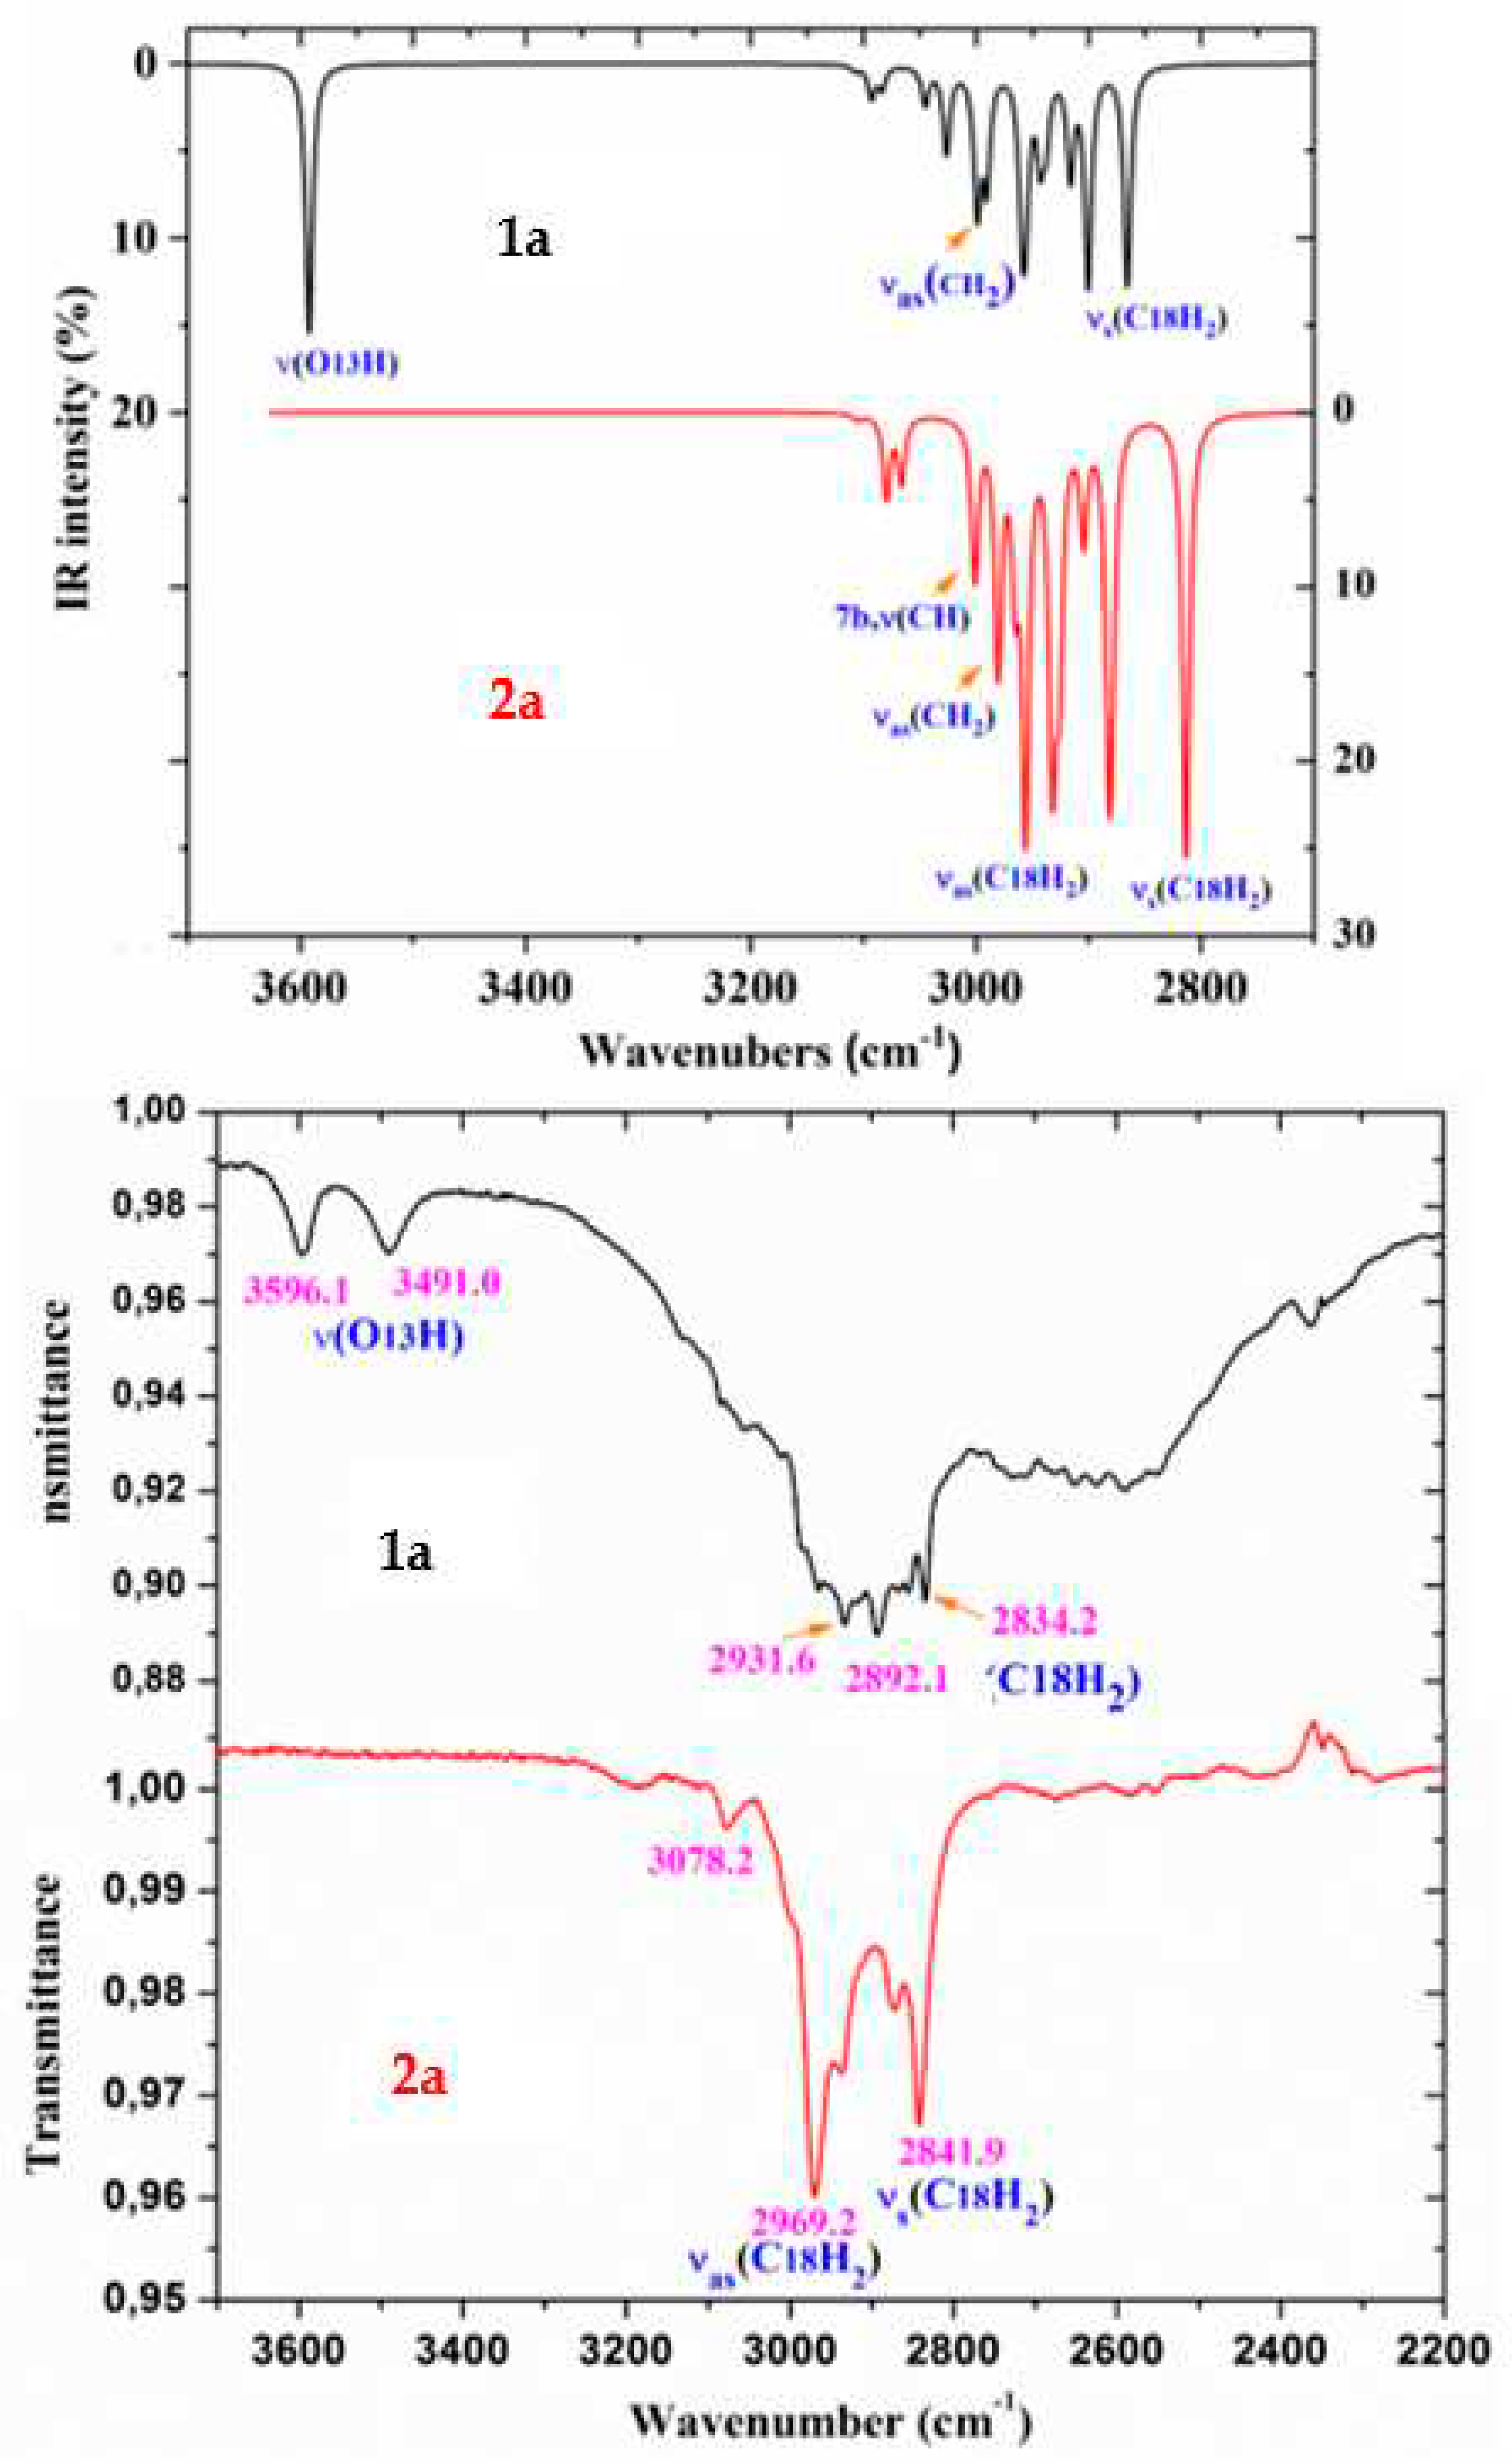
- The scaled wavenumbers in the acid 1a dimer and staking forms of triazole 2a were in better accordance to the experimental bands than those with monomer, which confirms our simplified optimized system for the crystal unit cell of the solid state.
- (6)
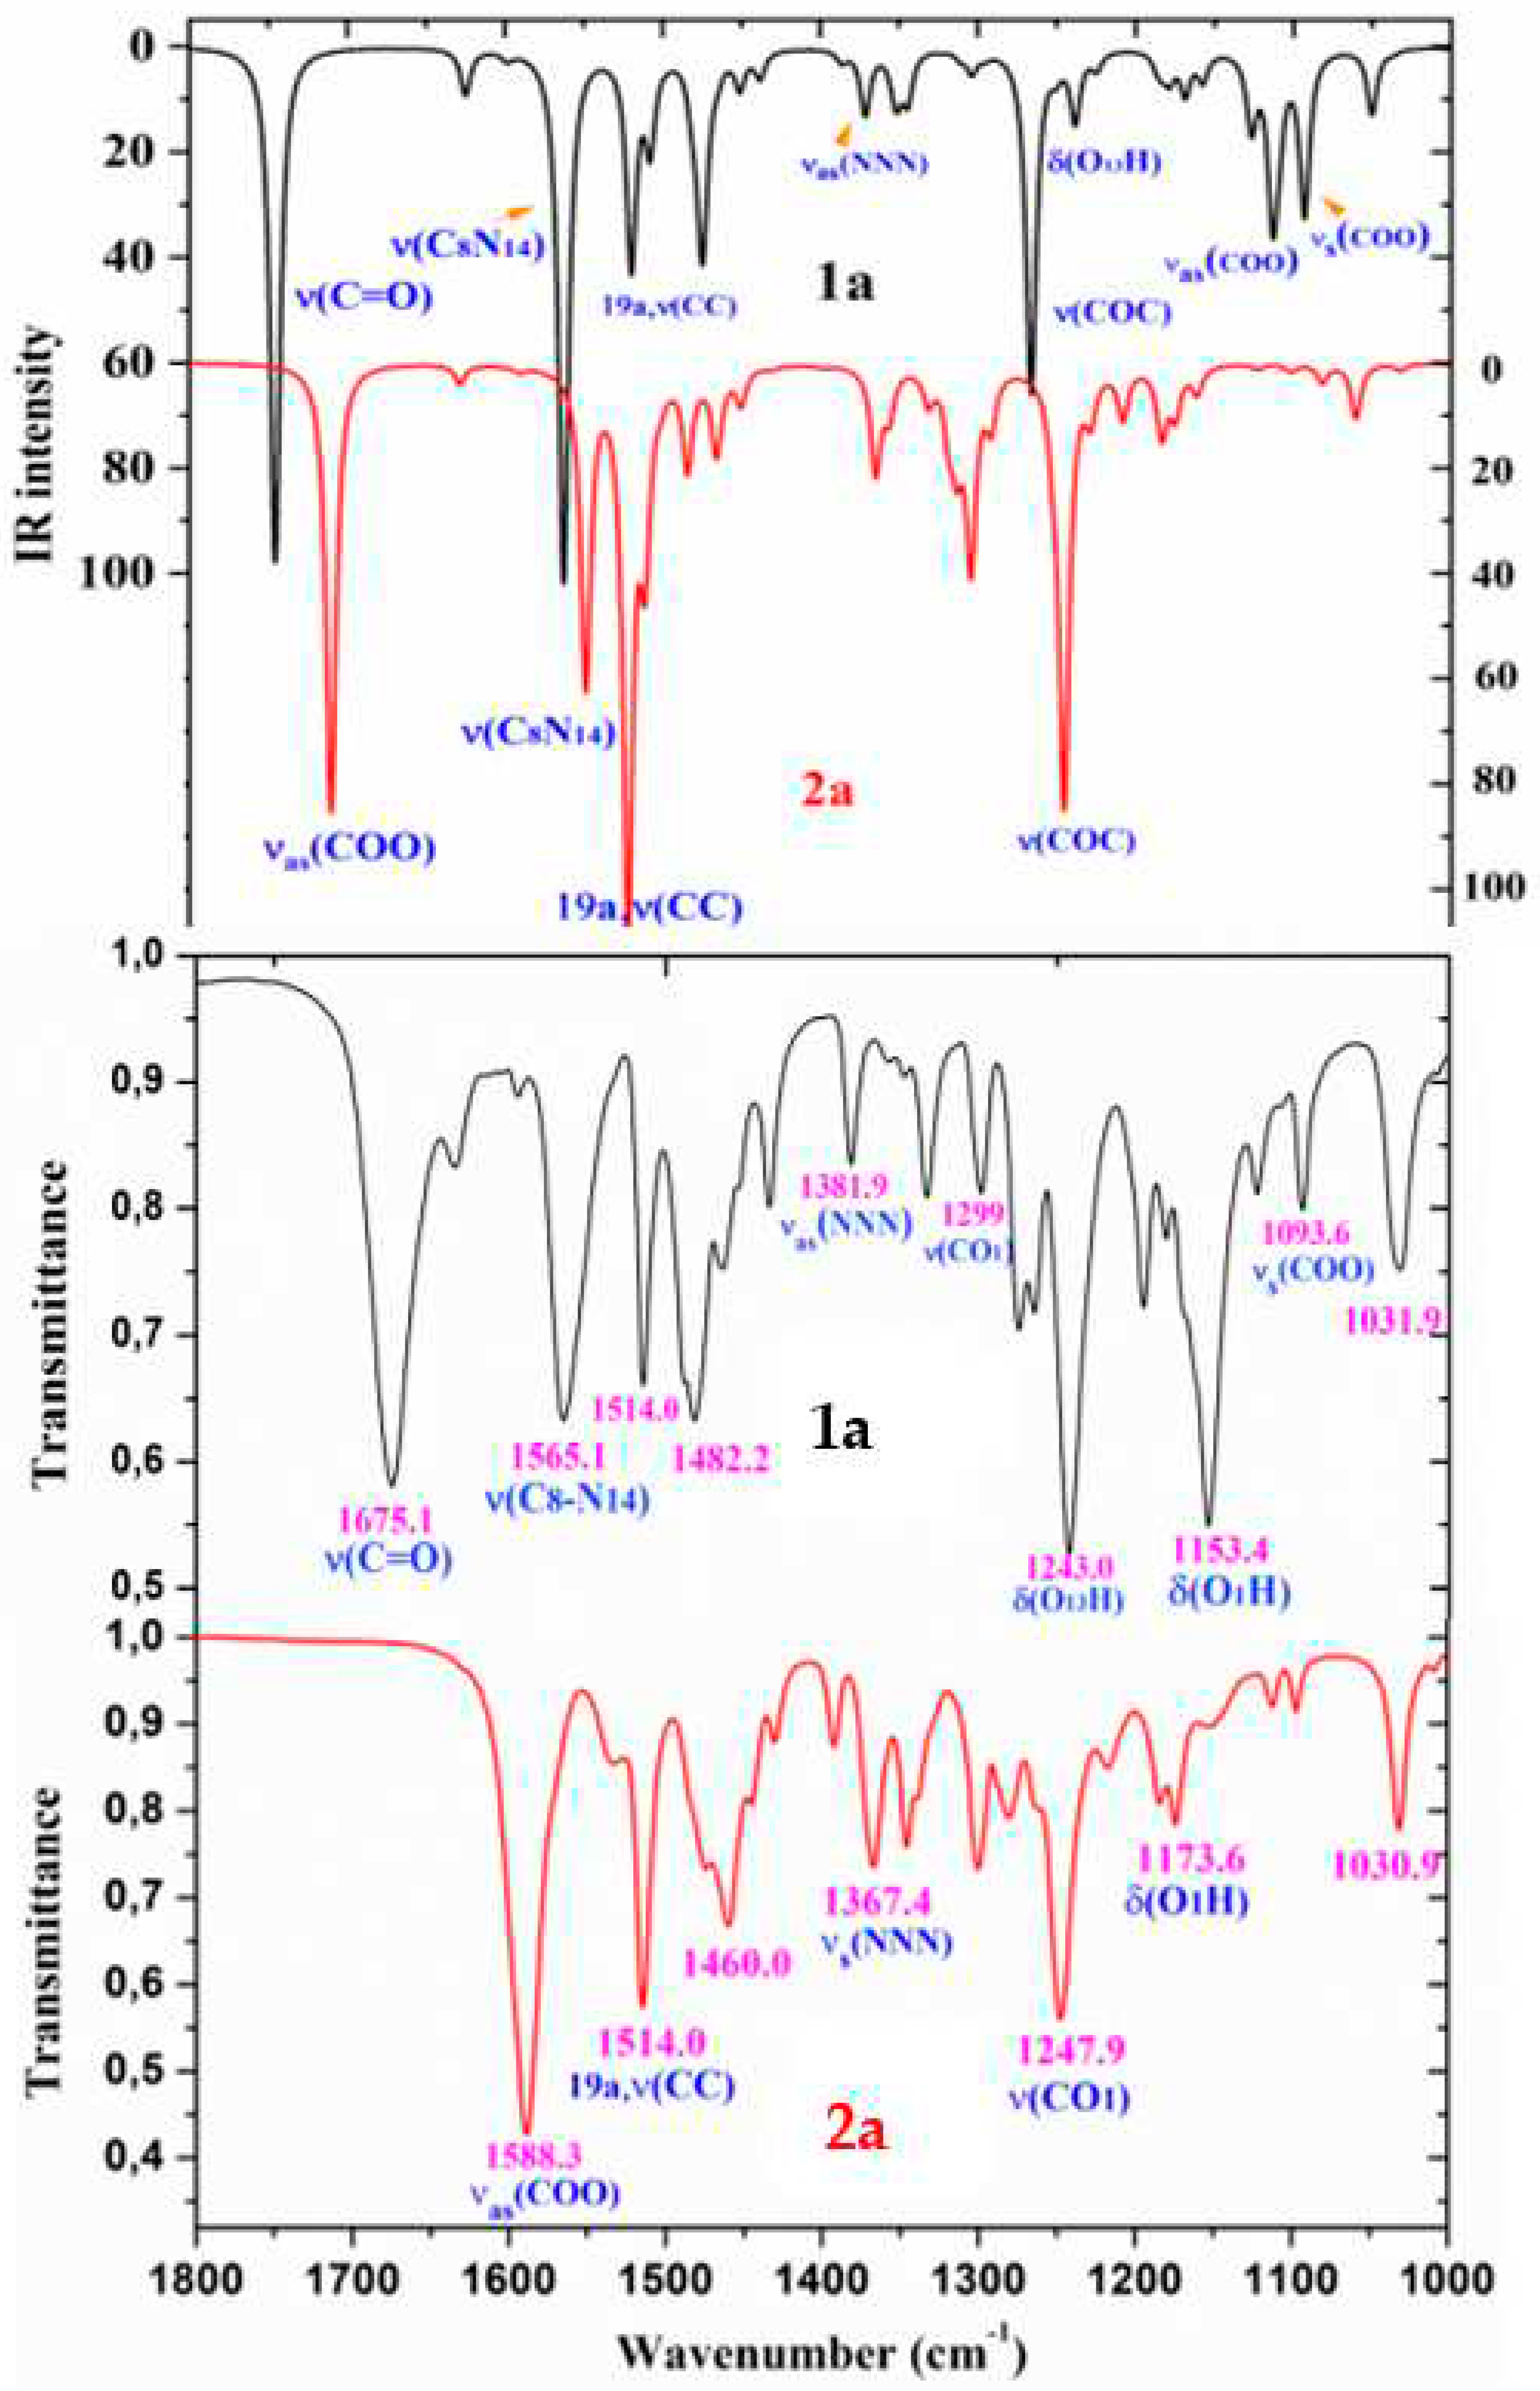
- In the experimental IR spectrum of 1a appears weak bands at 3596.1 and 3491.0 cm-1 that can be only assigned to ν(O-H) in free COOH groups. The large red-shift of the ν(C=O) mode to 1675.1 cm-1 indicates that strong H-bonds in dimer form appear in the solid state through this group. These features mean that in the solid state free and H-bonded COOH groups exist simultaneously.
- (7)
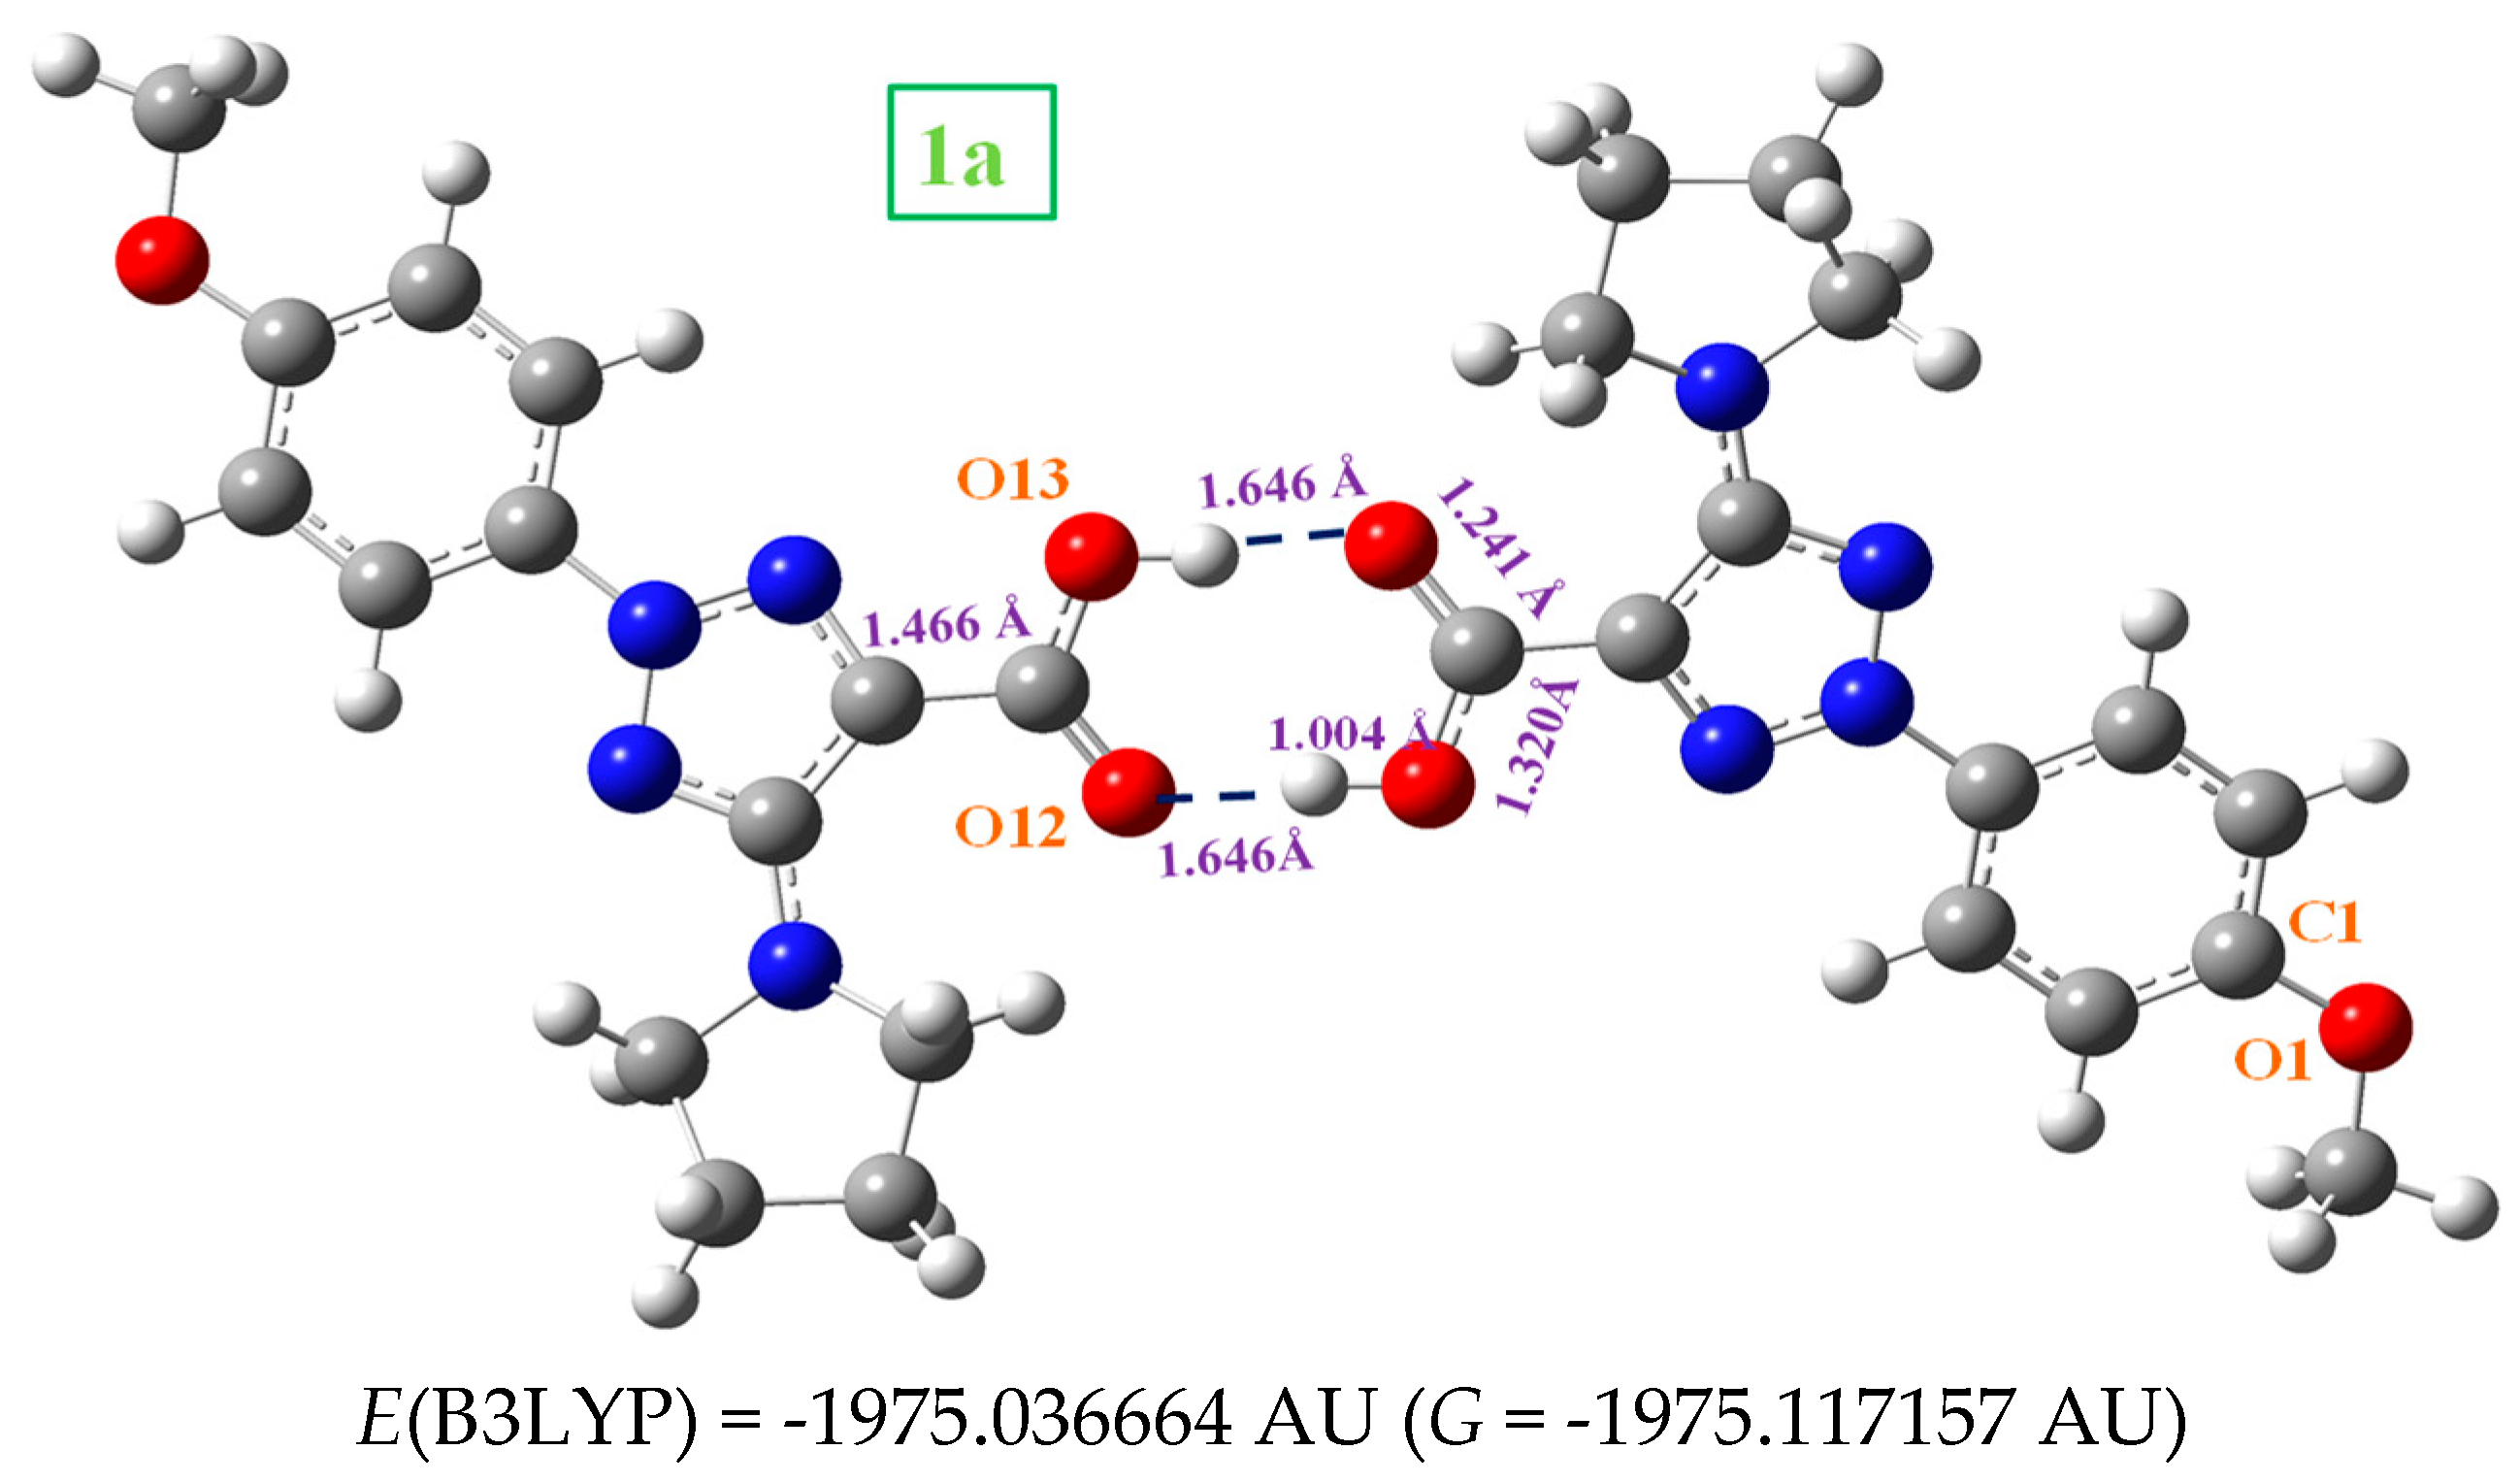
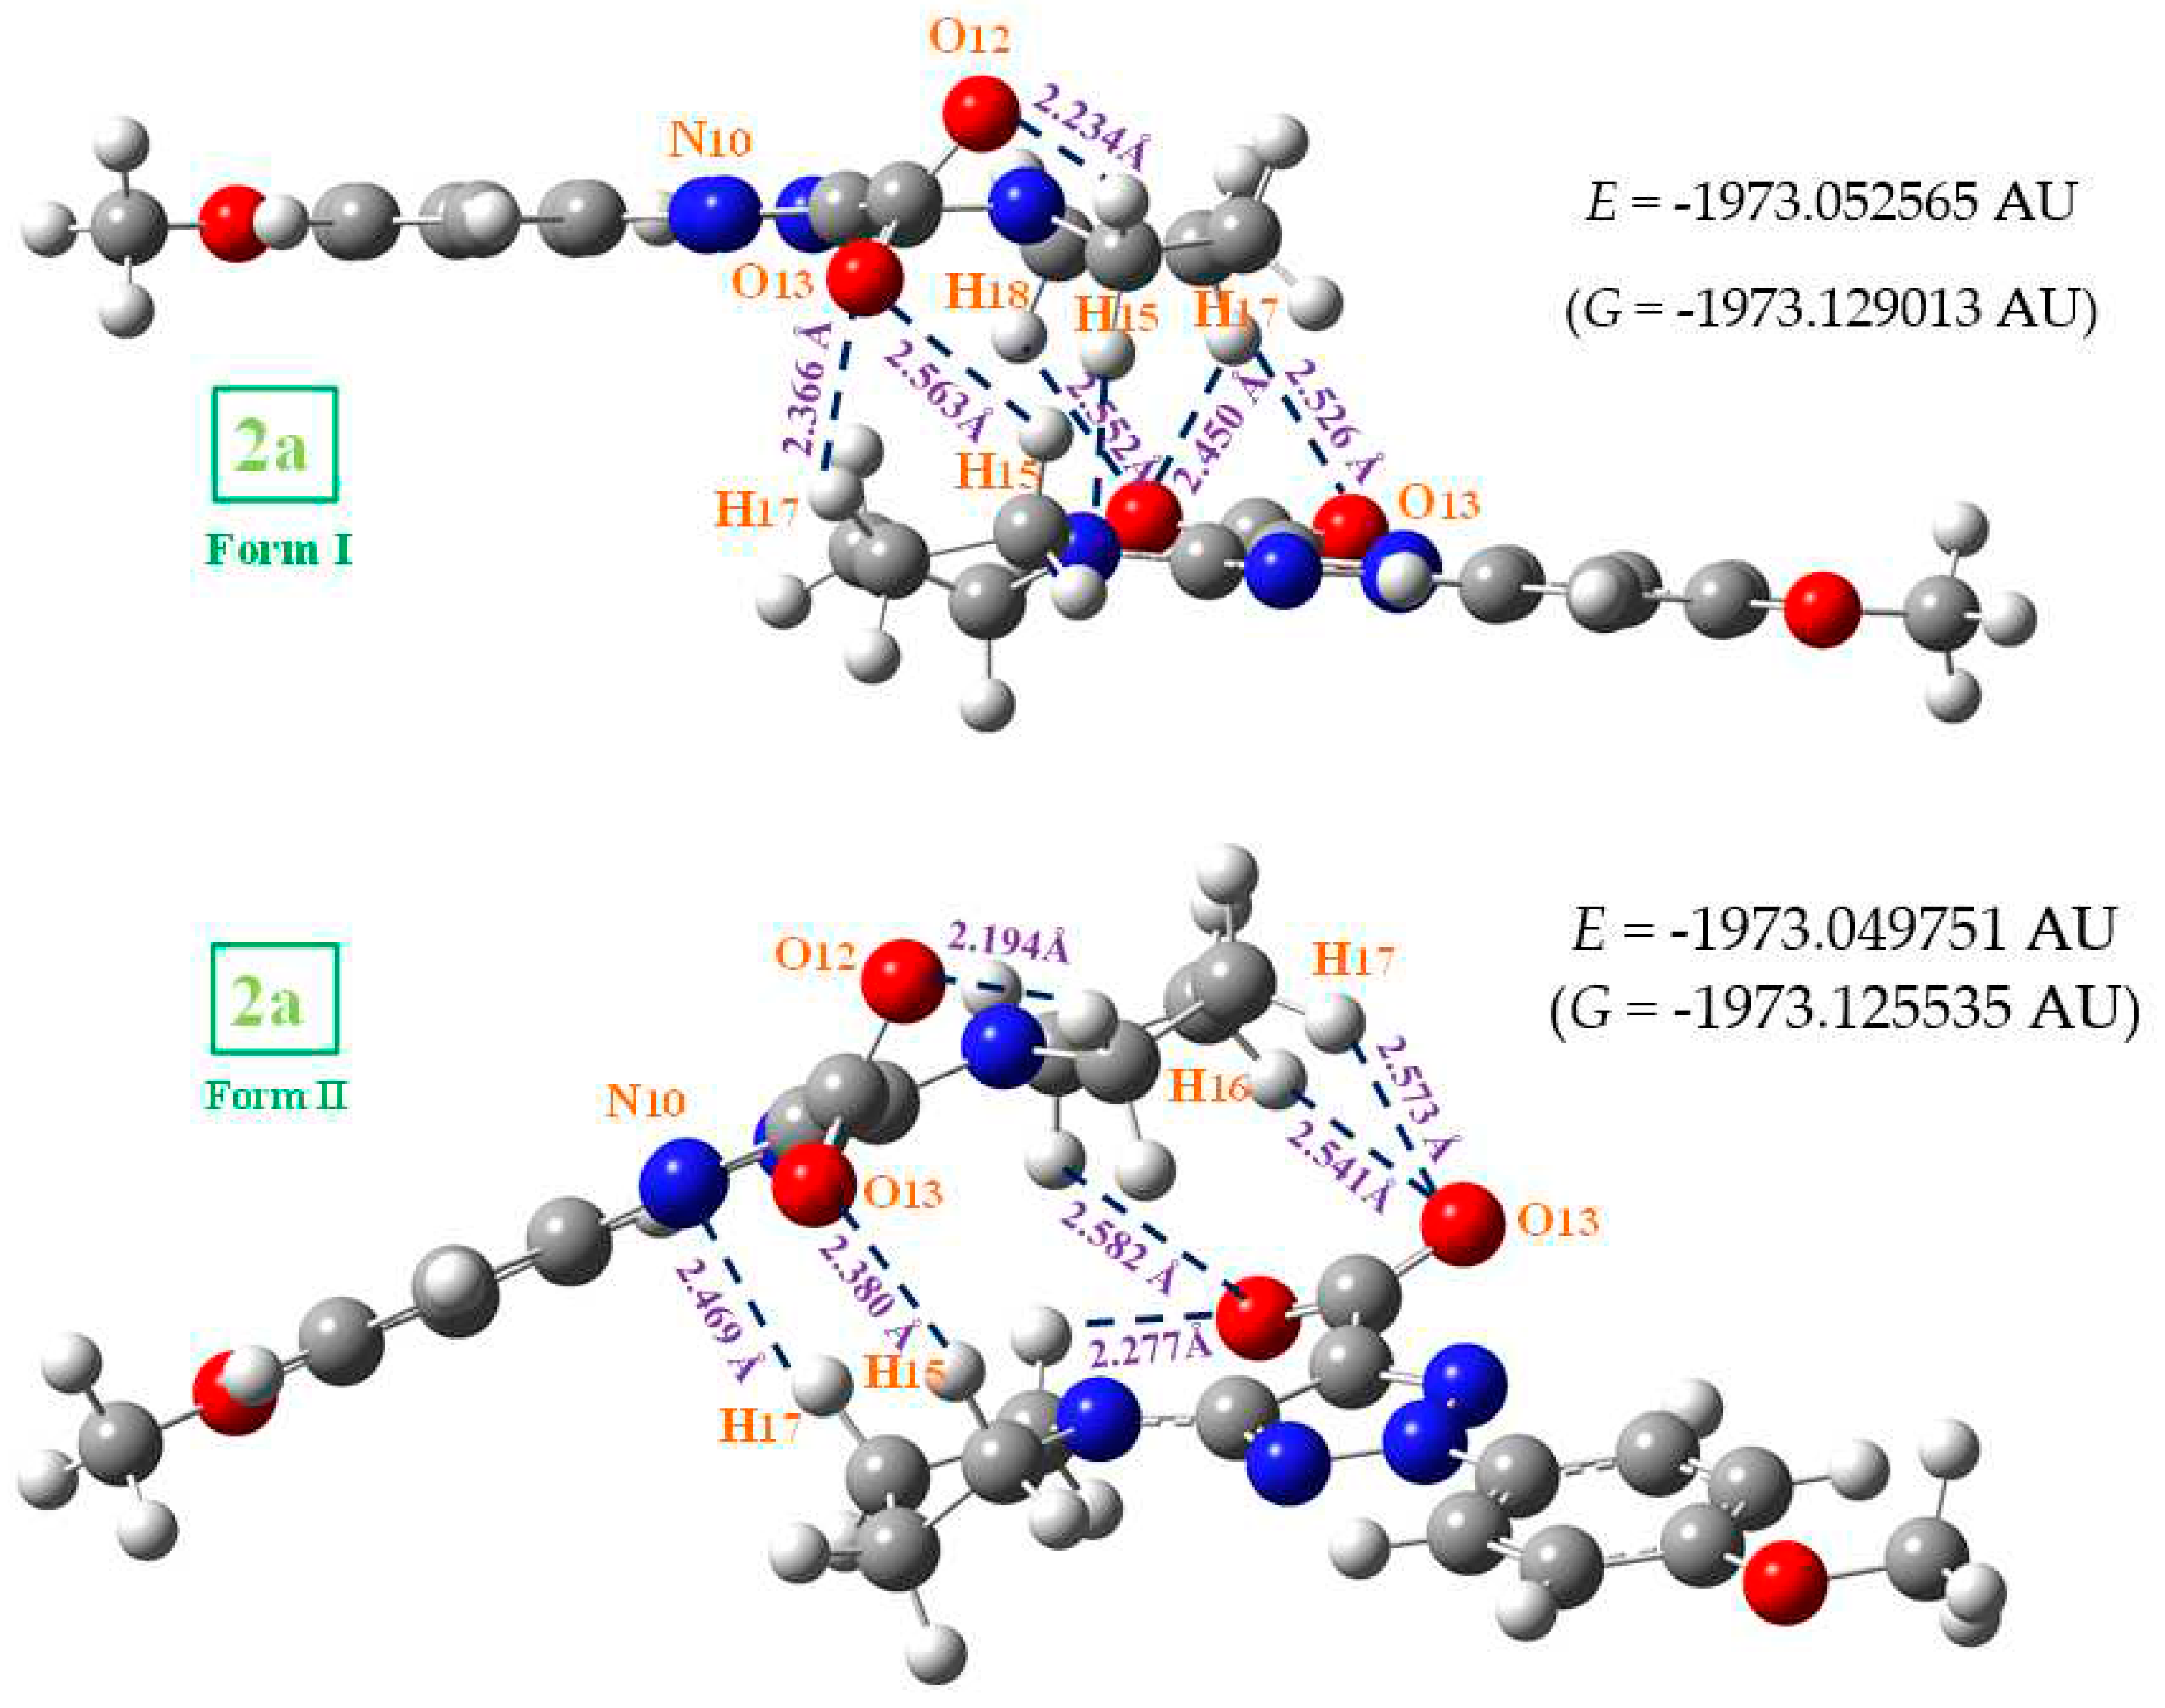
- A cyclic dimer form through the carboxylic –COOH group was optimized in 1a, while several staking forms were determined in 2a. A comparison of the scaled and experimental wavenumbers confirms these features for the solid state, with free and H-bonded COOH groups in 1a, and staking forms in 2a.
- (8)
- The experimental values in the solid state of 1a also indicate that the –COOH group in cyclic dimer form, in addition it interacts slightly with the neighbor dimer forms present in staking form in the solid state crystal.
Supplementary Materials
Funding
Declaration of interests
References
- Mahboob Alam, M. 1,2,3-Triazole hybrids as anticancer agents: A review. Archiv der Pharmazie, 2022, 355(1), 2100158. [CrossRef]
- Slavova, K.I.; Todorov, L.T.; Belskaya, N.P.; Alcolea Palafox, M.; Kostova. I.P. Developments in the Application of 1,2,3-Triazoles in Cancer Treatment. Recent Patents Anti-Cancer Drug Discov. 2020, 15, 92-112. [CrossRef]
- Safronov, N.E.; Kostova, I.P.; Alcolea Palafox, M.; Belskaya, N.P. Combined NMR Spectroscopy and Quantum-Chemical Calculations in Fluorescent 1,2,3-Triazole-4-Carboxylic Acids Fine Structures Analysis. Int. J. Mol. Sci. 2023, 24, 8947-8966. [CrossRef]
- Hrimla, M.; Oubella, A.; Laamari, Y.; Lahoucine, B.; Ghaleb, A.; Ait Itto, M.Y.; Auhmani, A.; Morjani, H.; Julve, M.; Stiriba, S.-E. Click Synthesis, Anticancer Activity, and Molecular Docking Investigation of some Functional 1,2,3-triazole Derivatives. Biointerface Res. Appl. Chem. 2021, 12(6), 7633-7667. [CrossRef]
- Alcolea Palafox, M.; Núñez, J.L.; Gil, M. Theoretical Quantum Chemical Study of Benzoic Acid: Geometrical Parameters and Vibrational Wavenumbers. Int. J. Quantum Chem. 2002, 89(1), 1-24. [CrossRef]
- Jeffrey, G.A.; Saenger, W. Hydrogen bonding in biological structures. Springer-Verlag, Berlin, 1991; Chapter 5.
- Alcolea Palafox, M. Effect of the Sulphur Atom on S2 and S4 Positions of the Uracil Ring in different DNA:RNA Hybrid Microhelixes with three Nucleotide Base Pairs. Biopolym. 2019, 110(3), 1-25, e23247. [CrossRef]
- Alcolea Palafox, M.; Iza, N.; Gil, M. The hydration effect on the uracil frequencies: an experimental and quantum chemical study. J. Mol. Struct. (Theochem) 2002, 585 (1-3), 69-92. [CrossRef]
- Alcolea Palafox, M. Scaling factors for the prediction of vibrational spectra. I. Benzene molecule. Int. J. Quantum Chem. 2000, 77, 661-684. [CrossRef]
- Alcolea Palafox, M. DFT computations on vibrational spectra: Scaling procedures to improve the wavenumbers. In Density Functional Theory: Advances in Applications (Book). Ramasami, P. (Ed.). Walter de Gruyter, Inc., Boston, USA, 2019; chapter 10, pp. 147-191.
- Sanchez de la Blanca, E.; Núñez, J. L.; Martinez, P. An. Quim Ser A, 1986, 82(3), 480.
- Alcolea Palafox, M.; Gil, M.; Núñez, J.L. Spectroscopy of p-methoxybenzoic acid: An AM1 and ab initio study. Appl. Spectrosc. 1994, 48(1), 27-36. [CrossRef]
- Reva, I.D.; Stepanian, S.G. An infrared study on matrix-isolated benzoic acid. J. Mol. Struct. 1995, 349, 337-340. [CrossRef]
- Stepanian, S.G.; Reva, I.D.; Radchenko, E.D.; Sheina, G.G. Infrared spectra of benzoic acid monomers and dimers in argon matrix. Vibrat. Spectrosc. 1996, 11(2), 123-133. [CrossRef]
- Socrates, G. Infrared and Raman characteristic group frequencies, 3rd ed; Wiley, NewYork, 2001.
- George, S. Infrared and Raman Characteristic Group Wavenumbers, Tables and Charts, 3rd ed, Wiley: Chichester, U.K, 2001.
- 17. Varsányi G, Assignment for Vibrational Spectra of Seven Hundred Benzene derivatives, Adam Hilder; London, 1974; Volume 1 and 2.
- Gavlik, K.D.; Lesogorova, S.G.; Sukhorukova, E.S.; Subbotina, J.O.; Slepukhin, P.A.; Benassi, E.; Belskaya, N.P. Synthesis of 2-Aryl-1,2,3-triazoles by Oxidative Cyclization of 2-(Arylazo)ethene-1,1-diamines: A One-Pot Approach. Eur. J. Org. Chem. 2016, 15, 2700-2710. DOI:10.1002/ejoc.201600256. [CrossRef]
- Safronov, N.E.; Fomin, T.O.; Minin, A.S.; Todorov, L.; Kostova, I.; Benassi, E.; Belskaya, N.P. 5-Amino-2-aryl-1,2,3-triazol-4-carboxylic acids: Synthesis, photophysical properties, and application prospects. Dye. Pigm. 2020, 178, 108343. [CrossRef]
- Seminario, J.M.; Politzer, P. (Eds), Modern Density Functional Theory: a tool for chemistry, Elsevier, Amsterdam, volume 2, 1995.
- Alcolea Palafox, M.; Iza, N. Tautomerism of the Natural Thymidine Nucleoside and the Antiviral Analogue D4T. Structure and influence of an Aqueous Environment Using MP2 and DFT Methods. Phys. Chem. Chem. Phys. 2010, 12(4), 881-893. [CrossRef]
- Brovarets’, O.O.; Hovorun, D.M. Prototropic tautomerism and basic molecular principles of hypoxanthine mutagenicity: an exhaustive quantum-chemical analysis. J. Biomol. Struct. Dyn. 2013, 31(8), 913-936. [CrossRef]
- Alcolea Palafox, M.; Nielsen, O.F.; Lang, K.; Garg, P.; Rastogi, V.K. Geometry and vibrational spectra of 5-substituted uracils. Asian Chem. Letts. 2004, 8(1), 81-93.
- Rastogi, V.K.; Alcolea Palafox, M. Vibrational spectra, Tautomerism and Thermodynamics of anticarcinogenic Drug: 5-Fluorouracil. Spectrochim. Acta Part A: Mol. Biomol. Spectrosc. 2011, 79(5), 970-977. [CrossRef]
- Carpenter, J.E.; Weinhold, F. Analysis of the geometry of the hydroxymethyl radical by the “different hybrids for different spins” natural bond orbital procedure. J. Mol. Struct. (Theochem) 1988, 169, 41-62. [CrossRef]
- Szafran, M.; Ostrowska, K.; Katrusiak, A.; Dega-Szafran, Z. Spectral and structural studies of dimethylphenyl betaine hydrate. Spectrochim. Acta Part A: Mol. Biomol. Spectrosc. 2014, 128, 844-851. [CrossRef]
- Arjunan, V.; Devi, L.; Subbalakshmi, R.; Rani, T.; Mohan, S. Synthesis, vibrational, NMR, quantum chemical and structure-activity relation studies of 2-hydroxy-4- methoxyacetophenone. Spectrochim. Acta Part A: Mol. Biomol. Spectrosc. 2014, 130, 164-177. [CrossRef]
- Rastogi, V.K.; Palafox, M.A.; Mittal, L.; Peica, N.; Kiefer, W.; Lang, K.; Ojha, S. P. FTIR and FT-Raman spectra and density functional computations of the vibrational spectra, molecular geometry and atomic charges of the biomolecule: 5-Bromouracil. J. Raman Spectrosc. 2007, 38(10), 1227-1241. [CrossRef]
- Ponomareva, A.G.; Yurenko, Y.P.; Zhurakivsky, R.O.; van Mourik, T.; Hovorun, D.M. Complete conformational space of the potential HIV-1 reverse transcriptase inhibitors d4U and d4C. A quantum chemical study. Phys. Chem. Chem. Phys. 2012, 14, 6787-6795. [CrossRef]
- Shishkin, O.V.; Gorg, L.; Zhikol, O.A.; Leszczynski, J. Conformational Analysis of Canonical 2-Deoxyribonucleotides. 2. Purine Nucleotides. J. Biomol. Struct. Dyn. 2004, 22, 227-243. [CrossRef]
- Brovarets’, O.O.; Hovorun, D.M. Can tautomerization of the A·T Watson–Crick base pair via double proton transfer provoke point mutations during DNA replication? A comprehensive QM and QTAIM analysis. J. Biomol. Struct. Dyn. 2014, 32, 127-154. [CrossRef]
- Alcolea Palafox, M. Molecular structure differences between the antiviral Nucleoside Analogue 5-iodo-2´-deoxyuridine and the natural nucleoside 2´-deoxythymidine using MP2 and DFT methods: Conformational analysis, crystal simulations, DNA pairs and possible behaviour. J. Biomol. Struct. Dyn. 2014, 32(5), 831-851. [CrossRef]
- Alcolea Palafox, M.; Posada-Moreno, P.; Villarino-Marín, A. L.; Martinez-Rincon, C.; Ortuño-Soriano, I.; Zaragoza-García, I. DFT Calculation of four new potential agents muscarinic of bispyridinium type: structure, synthesis, biological activity, hydration, and relations with the potents W84 and DUO-3O. J. Computer-Aided Mol. Design 2011, 25(2), 145-161. [CrossRef]
- Zhao, Y.; Truhlar, D. G. Applications and validations of the Minnesota density functionals. Chem. Phys. Lett. 2011, 502(1-3), 1-13. [CrossRef]
- Frisch, M.J.; Trucks, G.W.; Schlegel, H.B.; Scuseria, G.E.; Robb, M.A.; Cheeseman, J.R.; Scalmani, G.; Barone, V.; Petersson, G.A.; Nakatsuji, H.; et al. Gaussian 16, Revision C.01; Gaussian, Inc.: Wallingford, CT, USA, 2019.

| Form | Molecular properties | 1a | 2a |
|---|---|---|---|
| monomer | Rotational constants: A (GHz) B C |
0.616 0.142 0.116 |
0.647 0.140 0.116 |
| Cv (cal/mol·K) S (cal/mol·K) |
70.04 144.58 |
69.04 144.01 |
|
| Dipole moment (Debye) | 1.632 | 12.775 | |
| dimer | Rotational constants: A (GHz) B C |
0.114 0.024 0.021 |
(0.169) (0.034) (0.032) |
| Cv (cal/mol·K) S (cal/mol·K) |
143.7 252.9 |
(141.8) (241.5) |
|
| Dipole moment (Debye) | 0.751 | (9.734) |
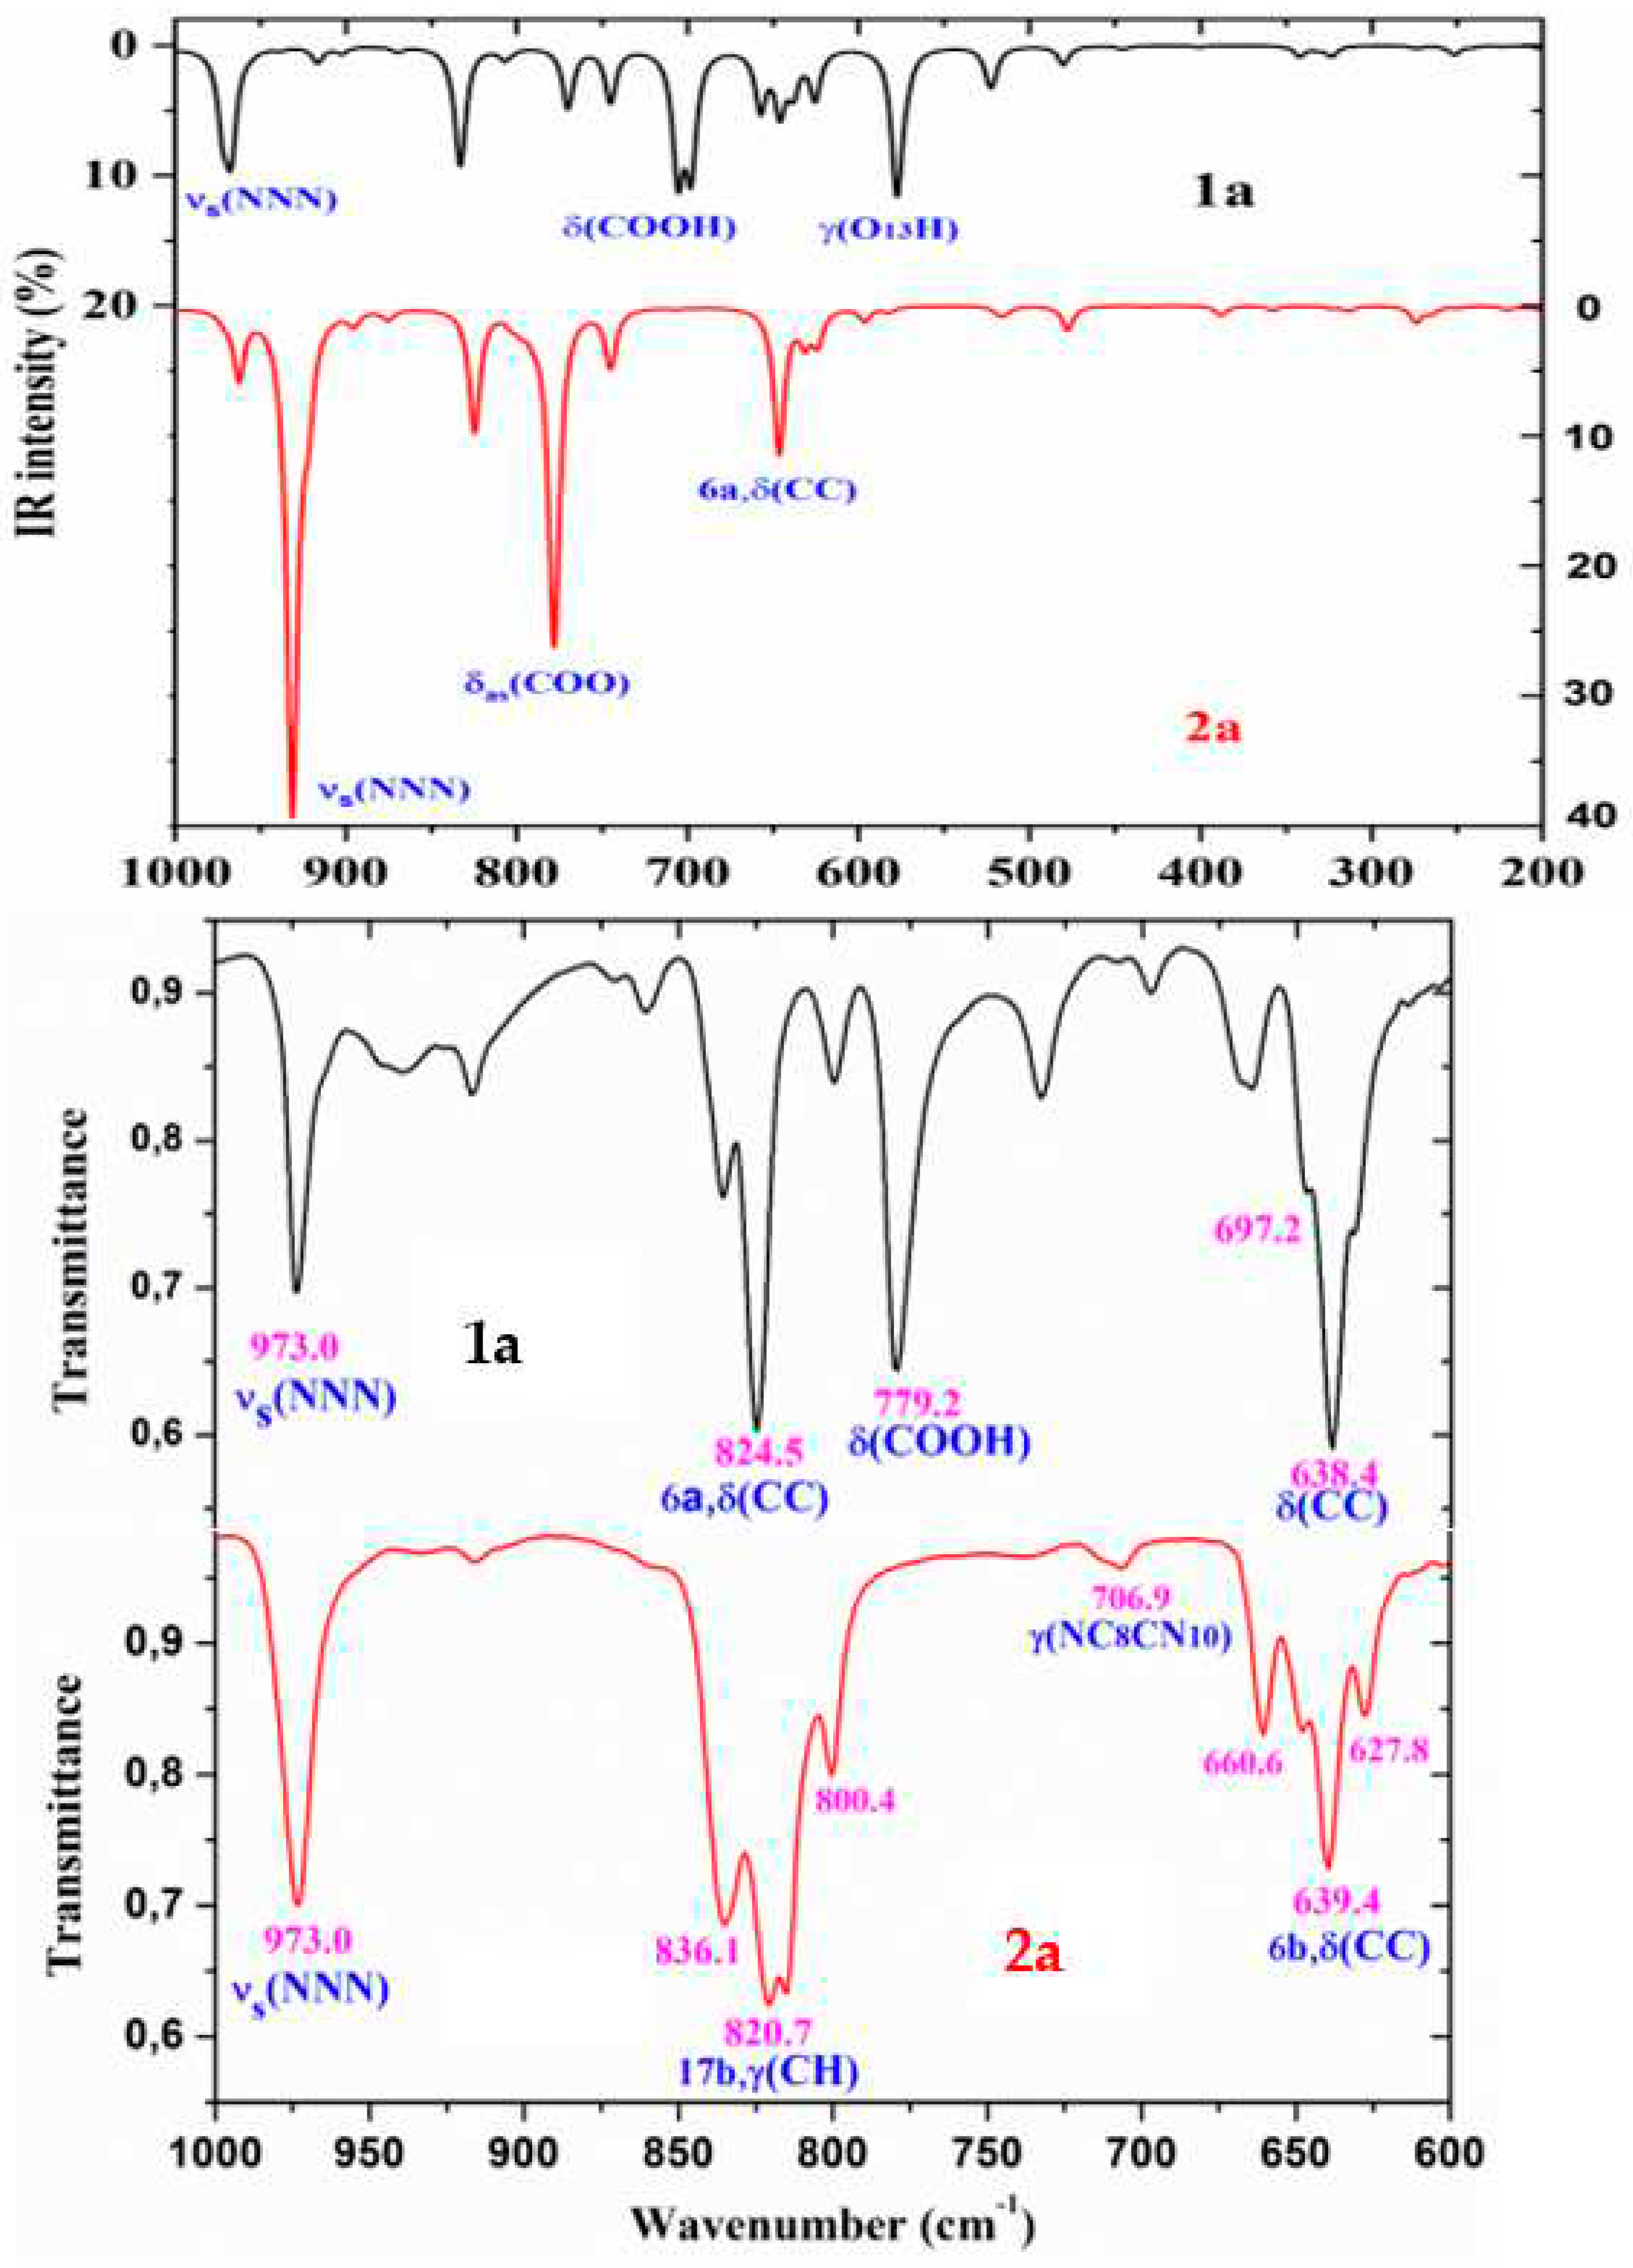
| νcal 1a |
TLSE | PSE | A | S | Experimental 1a | Characterization of 1a | |
|---|---|---|---|---|---|---|---|
| νscal | νscal | IR | Raman | ||||
| 1670 1643 1605 1561 1515 1513 1476 1422 1407 1389 1298 1282 1269 1215 1207 1154 1075 995 990 825 672 652 640 591 |
1618 1592 1556 1514 1470 1468 1433 1382 1368 1351 1264 1249 1236 1185 1177 1127 1052 980 975 810 657 637 625 576 |
1625 1599 1562 1520 1476 1474 1438 1386 1372 1354 1266 1251 1238 1186 1178 1127 1050 973 968 807 657 638 626 578 |
9 2 100 40 22 17 5 2 12 2 64 3 13 3 5 14 12 5 7 1 4 3 4 11 |
100 6 17 48 6 10 1 57 46 0 0 2 2 0 1 0 0 9 11 0 0 1 1 1 |
1634.6 w 1594.0 vw 1565.1 vs 1514.0 vs 1482.2 vs 1463.9 s 1434.0 m 1381.9 m 1357.8 vw 1274.9 s 1265.2 s 1243.1 vs 1194.8 s 1153.4 vs 973.0 s 824.5vs 664.4 m 638.4 vs 614.3 vvw |
1615.2 vs 1594.0 m 1561.2 m 1511.1 s 1485.1 w 1472.5 w 1420.5 m 1383.8 s 1362.6 vw 1357.8 vw 1262.0 m 1246.9 w 1243.0 w 1201.6 vw 1175.5 sh 1140.8 w 972.1 s 965.3 m 813.0 w 662.5 vw 639.2 m 631.7 m 570.9 w |
8a, ν(C=C) (96) 8b, ν(C=C) (97) ν(C8-N14) (65) + νs(N7CC) (20) 19a, ν(CC)(87) + δs(CH) in pyrrolidine (11) δs(C-H) out-of-phase pyrrolidine (83) δs(C-H) out-of-phase pyrrolidine (75) 19b, ν(CC,CH) in aryl (72) νs(NNN)(35) + νs(C4N) (28) + ν(COO)(25) ν(C4N) (28) + ν(NNN)(22) + δ(COO) (18) ν(C9N)(32) + δ(COO)(25) + δs(pyrrolidine) (23) ν(C-O1)(65) + 14, ν(CC) in aryl (22) γas(C-H) in pyrrolidine (78) ν(NN)(53) + γas(C-H) in pyrrolidine (33) γas(C-H) in pyrrolidine (88) γas(C-H) in pyrrolidine (82) + δ(O13H) (14) νs(COOH)(45) + δas(CH) in pyrrolidine (42) ν(O1-CH3) (83) νas(NNN)(42)+δ(CN14)(24)+ γ(CC) pyrrolid(22) νs(NNN)(38) + 12, δ(CC)(34) + δ(CC,CN)(24) 10a, γ(C-H) in aryl (97) γs(triazole) (78) + γ(O13-H) (15) 6b, δ(CC) (42) + δ(triazole) (24) Γ(triazole)(34) + 6b, δ(CC) in aryl (33) γ(O13-H) (81) |
| νcal 2a |
TLSE | PSE | A | S | Experimental 2a | Characterization of 2a | |
| νscal | νscal | IR | Raman | ||||
| 1674 1634 1591 1563 1514 1505 1435 1400 1391 1276 1213 1203 1085 994 953 722 638 610 |
1622 1583 1543 1516 1469 1461 1394 1361 1352 1243 1183 1174 1061 975 936 716 636 610 |
1629 1590 1549 1522 1475 1466 1399 1365 1356 1245 1184 1174 1060 972 932 706 624 597 |
3 1 58 100 1 15 0 19 8 79 8 8 10 1 32 0 2 1 |
100 2 12 23 2 13 20 7 0 1 0 1 4 2 6 0 0 0 |
1588.3 vs 1533.3 w 1514.0 vs 1474.5 m 1460.0 s 1392.5 w 1367.4 m 1346.2 m 1247.9 vs 1184.2 m 1173.6 m 973.0 m 933.4 vvw 706.9 vw 627.8 w 613.3 vvw |
1610.4 vs 1592.1 m 1535.2 w 1515.9 vs 1476.4 m 1466.7 m 1393.4 vs 1372.2 vs 1356.8 w 1251.7 vw 1175.5 m 1063.7 w 975.0 vs 927.7 vw 707.9 w 627.8 w 607.6 w |
8a, ν(C=C) (95) 8b, ν(C=C) (89) ν(C8-N14) (72) + νs(N7CC) (15) 19a, ν(CC) (76) + δs(CH) in pyrrolidine (18) δs(C-H) out-of-phase in pyrrolidine (92) νs(C8C9N)(62) + δs(CH2) (16) + ν(NN)(15) ν(C4N)(41) + ν(NNN)(25) + 19a, ν(CC)(15) γs(C-H) in-phase in pyrrolidine (87) νs(NNN)(38)+ γs(C-H)pyrrolidine(30)+ν(C8C)(25) 7a,ν(COC)(62) + δ(CH) aryl (25) +γas(CH3) (11) δ(triazole)(73) + γ (CC,CN) in pyrrolidine (16) γas(C-H) in pyrrolidine (68) + δ(triazole) (15) νas(COC)(62) + 15, δ(CH)(17) + γs(CH3)(15) νas(NNN)(32) + δ(CN14)(29)+ δ(CC) pyrrolidi(25) νs(NNN)(44) + ν(C8C)(20) + 10b, γ (CH)(18) γ (NC8CN10) (53) + γs(COO) (38) Γ(triazole) (38) + δ(CC) in aryl (25) γs(NNN) (55) + γ (COO) (18) |
| Group | Mode | A | S | TLSE | PSE | IR | Raman | Characterization | |
|---|---|---|---|---|---|---|---|---|---|
| νcal | νscal | νscal | |||||||
| COOH | ν(O-H) δ(O-H) γ(O-H) |
3762 3161 1269 591 |
15 100 13 11 |
17 0 2 1 |
3607 3035 1236 576 |
3592 3035 1238 578 |
3596.1 w 3491.0 w 1243.1 vs |
3504.2 vw 1243.0 w 570.9 w |
ν(O-H) (100) Dimer: ν(O-H) out-of-phase δ(O-H)(52) + ν(CN)(25) + γas(CH) pyrrolidine (16) γ(O-H) (81) |
| ν(C=O) | 1743 1702 |
80 0 |
0 70 |
1687 1648 |
1695 1655 |
1675.1 vs |
1643.2 m |
Dimer: ν(C=O) out-of-phase Dimer: ν(C=O) in-phase |
|
| ν(C-O) | 1140 1119 |
29 30 |
0 3 |
1114 1094 |
1113 1093 |
1122.5 m 1093.6 m |
1120.6 w 1096.5 w |
νas(COO)(33) + νs(NNN)(31) + 15, δ(CH)(28) νs(COO) (45) + δ(NNN) (38) |
|
| δ(C=O) |
714 796 777 |
9 15 0 |
0 0 8 |
699 782 763 |
699 780 761 |
697.2 w 779.2 vs |
696.3 w 768.0 m |
δ(COOH) (46) + γ(triazole) (38) Dimer: δ(COOH) out-of-phase + ν(CC) Dimer: δ(COOH) in-phase |
|
| γ(C=O) | 721 | 9 | 1 | 706 | 705 | 707.8 vvw | 705.9 w | γ(COOH)(62) + γ(NC8C)(21) + γ (CN14)(16) | |
| COO | νas νs δas γs |
1759 1337 795 808 |
83 35 25 1 |
2 4 1 1 |
1702 1301 786 798 |
1710 1304 778 790 |
1588.3 vs 1299.9 m |
1629.7 vw 1307.6 vw 774.4 w 783.1 vw |
νas(COO) (96) νs(COO)(34)+ν(triazole)(32)+ γ(CH)pyrrolidine (18) δas(COO) (58) + δas(C-H) in pyrrolidine (15) γs(CCOO)(55) + γ(C8C)(30) + 6a, δ(CC) (27) |
Disclaimer/Publisher’s Note: The statements, opinions and data contained in all publications are solely those of the individual author(s) and contributor(s) and not of MDPI and/or the editor(s). MDPI and/or the editor(s) disclaim responsibility for any injury to people or property resulting from any ideas, methods, instructions or products referred to in the content. |
© 2023 by the authors. Licensee MDPI, Basel, Switzerland. This article is an open access article distributed under the terms and conditions of the Creative Commons Attribution (CC BY) license (http://creativecommons.org/licenses/by/4.0/).


