1. Introduction
Chemotherapy drugs developed for cancer treatment often result in numerous side effects [
1,
2], mainly due to high dosage and low specificity [
3,
4]. Utilizing nanocarriers for targeted delivery [
5,
6,
7], improving bio-distribution [
8], and increasing effectiveness durability are potential solutions to reduce side effects and enhance the efficiency of anti-cancer drugs [
9,
10]. Biocompatible and biodegradable polymers, such as PCL-PEG, are promising candidates for targeted cancer chemotherapy delivery owing to their solubility, cost-effectiveness, biocompatibility, and bio-viability [
11,
12]. In a study on ovarian cancer cells, it was observed that the PCL-PEG nanocarrier enhances the apoptotic potential of Rutin in these cancer cells [
13]. Similarly, research focused on colorectal cancer cells found that the modified PCL-PEG NPs enhanced the effectiveness of Docetaxel in suppressing colorectal cancer cell growth through controlled release and improved cellular uptake [
14]. Additionally, in a study involving cells derived from glioblastoma, the PCL-PEG nanopolymer was shown to enhance the targeted delivery of 5-Iodo-2′-deoxyuridine [
15].
Cur, a naturally occurring compound derived from plants, has been extensively studied for its potential anticancer properties [
16]. This diarylheptanoid is sourced from the Curcuma longa species [
17]. Despite the many efforts made so far, this compound has many limitations in targeting cancer [
18,
19]. This is attributed to factors such as its poor solubility and bioavailability [
20,
21,
22]. Some studies have also indicated the cytotoxicity of curcumin on normal cells, so a targeted delivery platform can improve its pharmacodynamic behavior [
23,
24]. Using nanocarriers is a viable avenue for overcoming the limitations of Cur [
25]. Additionally, functionalizing nanocarriers [
26] presents another accessible approach to enhance the effectiveness of Cur against cancer cells [
27].
Peptides are highly sought-after compounds for the functionalization of nanocarriers due to their favorable characteristics [
28]. These biomolecules possess a strong binding affinity for their target receptors and can be produced at a low cost, making them suitable for therapeutic applications [
29]. The peptide A6 (AC-KPSSPPEE-NH2), derived from the urokinase protein, has undergone extensive evaluation and validation for its anti-invasive effects in numerous studies [
30,
31]. This peptide shares homology with a segment of the CD44 cell surface protein, identified as the A6 receptor [
32]. Aside from its direct role in inhibiting tumor tissue invasion and angiogenesis [
33], the peptide has also been utilized for the functionalization of nanocarriers to target cancer cells, given that CD44 is overexpressed in many cancers [
34]. In a study that was conducted to target multiple myeloma, it was found that loading Carfilzomib in nanomicelle functionalized with A6 improves the performance of this drug and reduces its side effects [
35]. In a separate study focusing on the targeted delivery of Epirubicin in multiple myeloma, A6-functionalized nanocarriers were also found to significantly improve the drug's effectiveness [
32].
The primary objective of this investigation was to develop PCL-PEG nanopolymers functionalized with A6 for the targeted delivery of Cur to MDA-MB-231 cells, aiming to reduce side effects and enhance effectiveness. Here, following the synthesis and characterization of polymeric NPs, various assessments including MTT assay, RT-qPCR, and invasion assay were conducted to evaluate the efficacy of the designed system in targeting breast cancer cells.
2. Materials and Methods
2.1. Materials
The A6 peptide was synthesized at the Peptide Chemistry Research Institute, K. N. Toosi University of Technology, Tehran, Iran, and subsequently purified using HPLC to ensure a purity of ≥ 99%. Various materials used in the study, including polyethylene glycol (4kDa), ε-Caprolactone, MTT, polyvinyl alcohol (PVA), Cur, dichloromethane (DCM), Sn(Oct)2, DMSO, NHS, EDC, and Diethyl ether, were procured from Sigma-Aldrich (St. Louis, MO, USA). The non-turmeric human breast epithelial cells (MCF-10A) and human breast cancer cells (MDA-MB-231) were sourced from the Pasteur Institute (Tehran, Iran), while Fetal Bovine Serum (FBS), trypsin, and Dulbecco's Modified Eagle Medium (DMEM)/high-glucose were obtained from Bioidea (Tehran, Iran) and DNAbiotech (Tehran, Iran).
2.2. Polymer Preparation and Peptide Conjugation
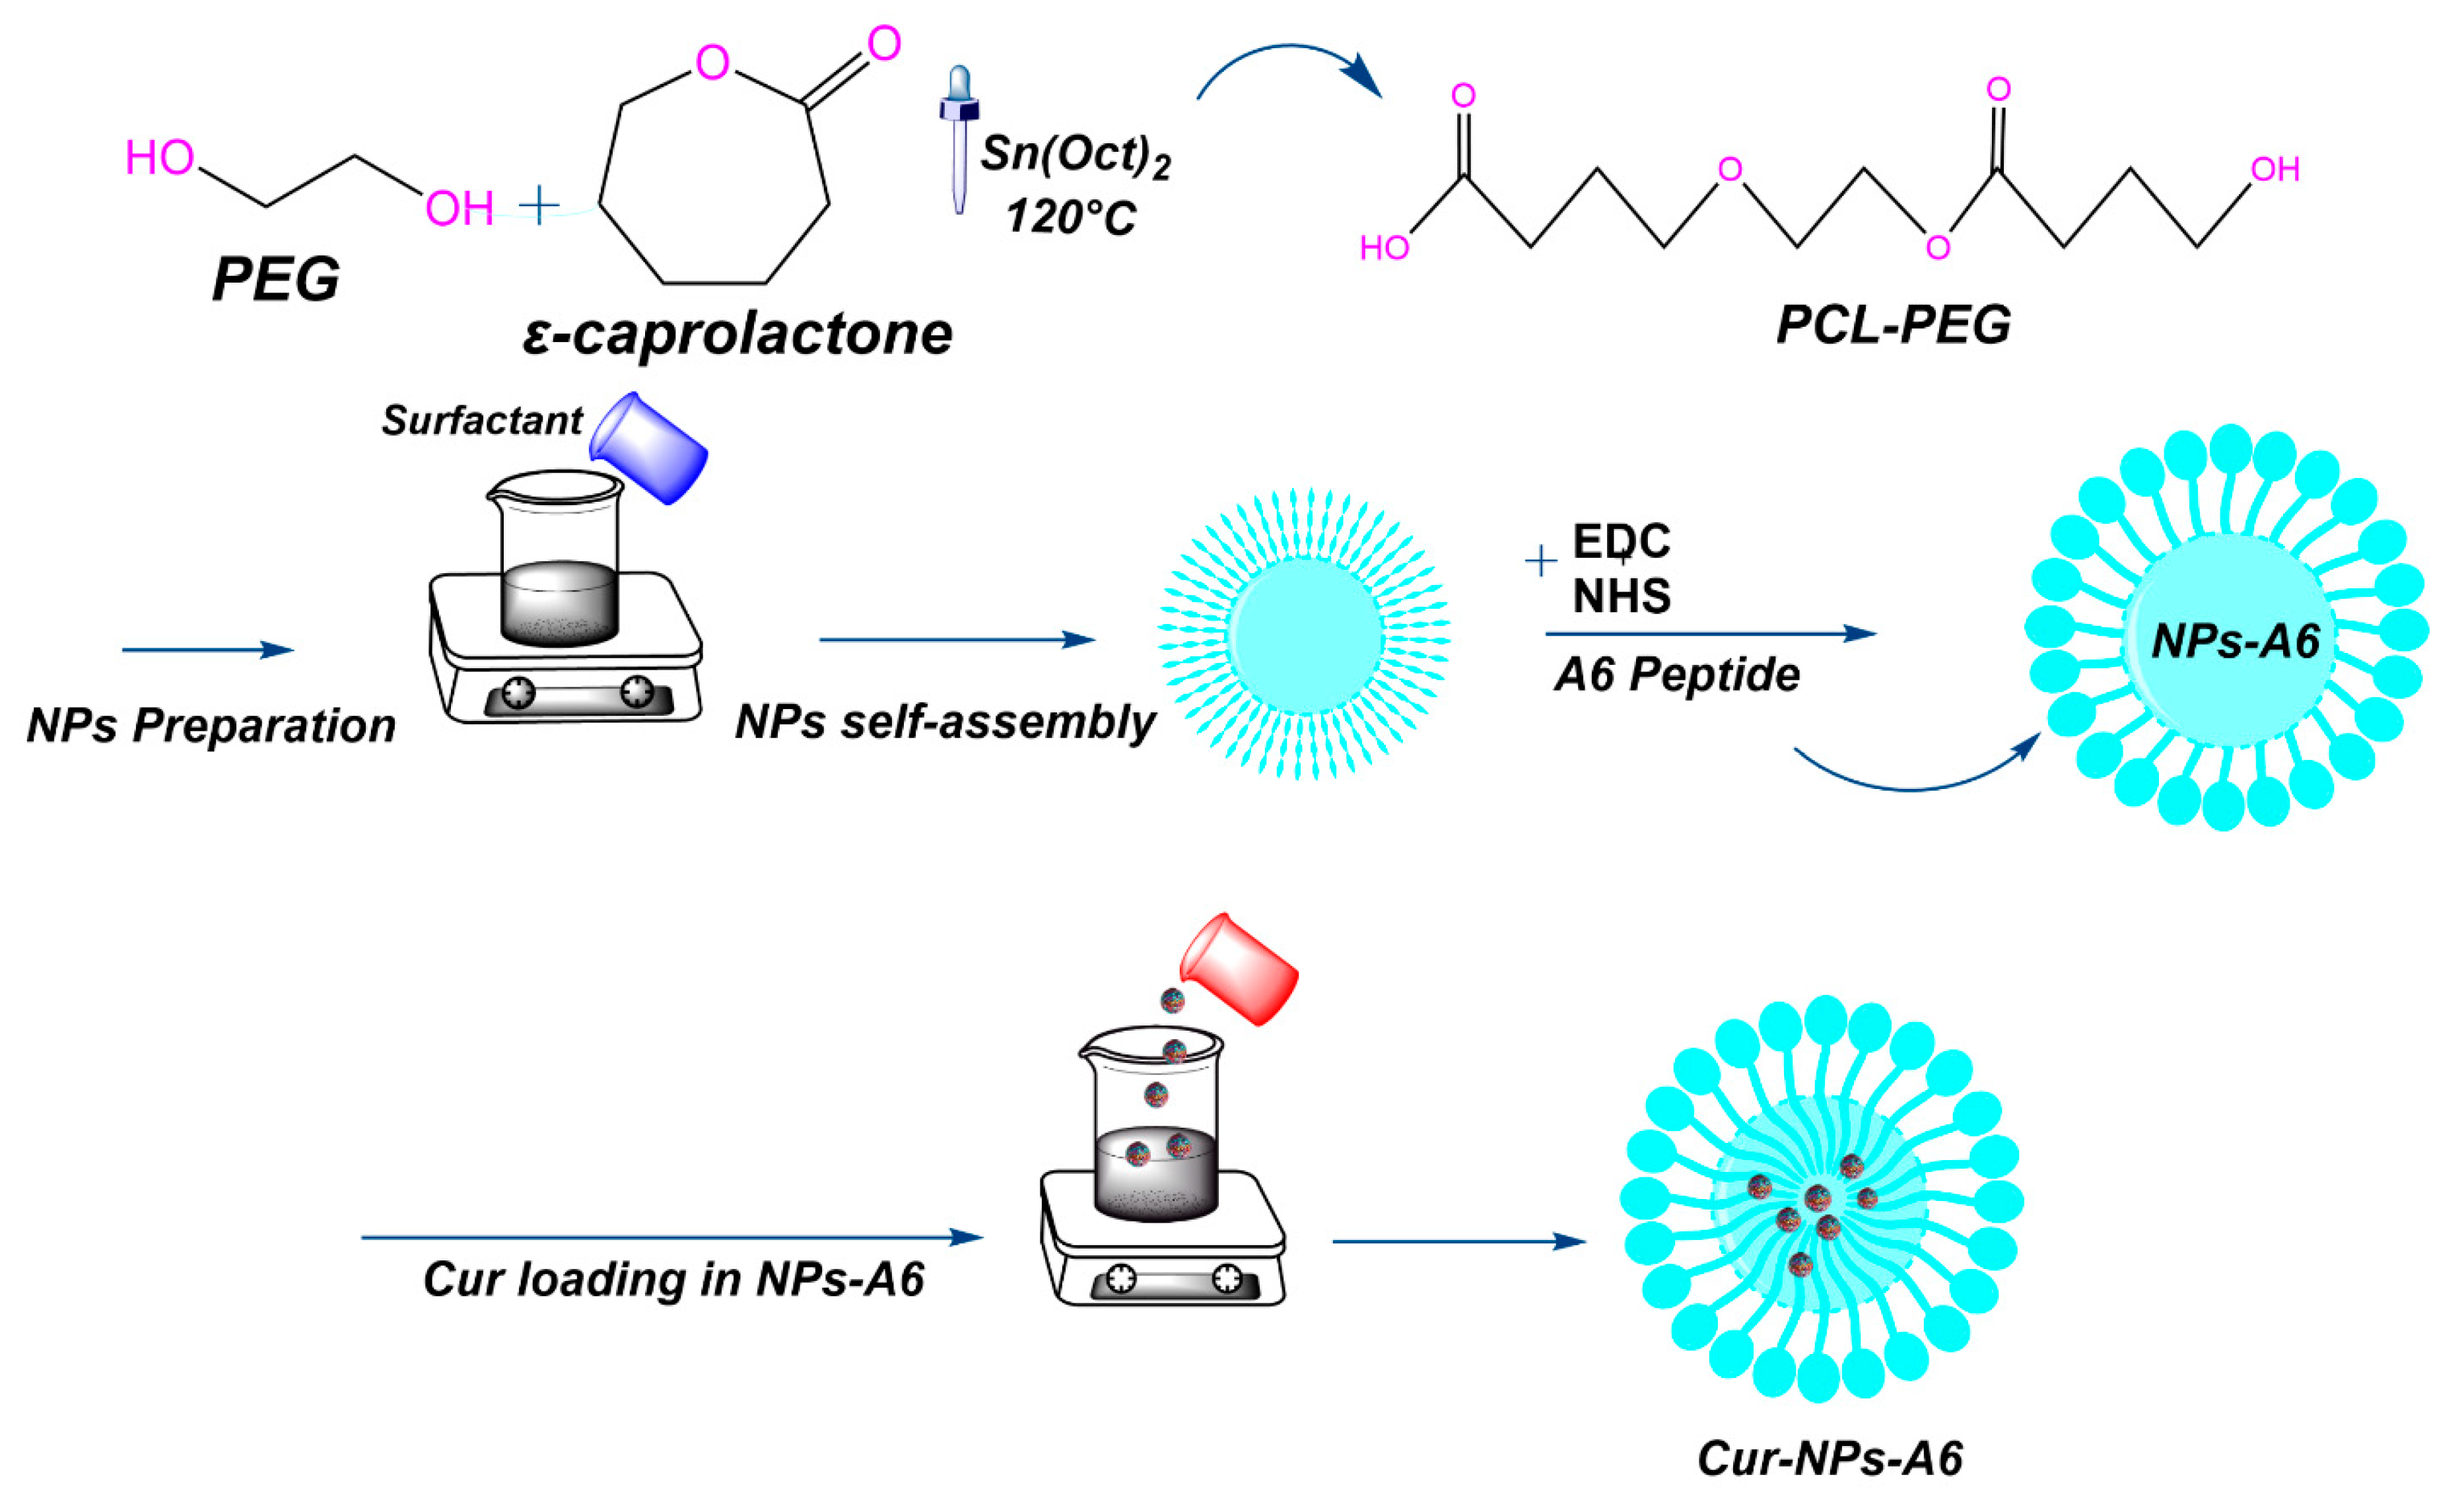
To prepare the PCL-PEG copolymer, a dry three-necked flask was employed. Initially, 1 g of PEG was added to the flask as an initiator and heated at 120°C under vacuum for 3h to remove any moisture. Subsequently, 2 g of ε-caprolactone (ε-CL) and 0.006 mmol of Sn(Oct)2 as a catalyst in 20 ml of DCM were introduced into the flask under a nitrogen atmosphere. The polymerization reaction was then conducted at 120°C with vigorous stirring for 14h. After the reaction, the resulting copolymer was cooled to room temperature, dissolved in chloroform, and precipitated by adding cold diethyl ether. The copolymer was further purified by centrifugation with distilled water at 8000 rpm three times and subsequently dried under vacuum at room temperature for 24h. To ensure complete removal of any residual solvent and achieve optimal dryness, the synthesized polymer was subjected to an additional purification step involving a 48h lyophilization process. This comprehensive purification ensured the high purity and stability of the final copolymer product. Fourier Transform Infrared spectroscopy (FT-IR) using Nicolet 550 A (Thermo Fisher Scientific, Waltham, MA, USA) was conducted to examine the functional groups present in the PCL-PEG. Additionally, Proton Nuclear Magnetic Resonance Spectroscopy (1H-NMR) spectroscopy in CDCl3 at 400 MHz using Bruker Ac 500 (Ettlingen, Germany) provided insights into the molecular composition and configuration of the copolymer.
Subsequently, the A6-conjugated PCL-PEG was synthesized through a series of steps (
Figure 1). First, 1 g of PCL-PEG copolymer was dissolved in 30 ml of DCM. Then, a coupling agent, EDC (0.1 g), and a catalyst, NHS (0.01 g), were added to activate the carboxyl group of the PCL-PEG copolymer. The mixture was stirred at room temperature for 3h. Meanwhile, 0.03 g of A6 peptide was dissolved in 10 ml of phosphate-buffered saline (PBS). After activation, the PCL-PEG solution was combined with the peptide solution and stirred for 5h at room temperature. The resulting A6-conjugated PCL-PEG copolymer was purified and then subjected to a 48h lyophilization process to ensure complete dryness. The final product, NPs-A6, was characterized using FT-IR and
1H-NMR techniques to confirm the successful conjugation of the peptide [
36,
37,
38,
39].
2.3. NPs Preparation
The single emulsion method was employed to fabricate NPs. Initially, 5 mg of PCL-PEG and PCL-PEG-A6 were dissolved in 5 ml of DCM. Subsequently, to create a water-in-oil emulsion, PVA (3% w/v in 1 ml of water) was introduced into the organic phase and emulsified using a sonicator probe at 10 W for 1 min. The resulting emulsion was then agitated at room temperature to facilitate the evaporation of the organic phase. The remaining solution underwent centrifugation at 8000 rpm for 40 min, followed by a 24h freeze-drying process to eliminate residual solvents [
40].
2.4. Nanoparticle Characterization
In the assessment of NPs, size and shape represent crucial parameters [
41]. NPs have different properties and applications depending on their size distribution and organic ligands. Here, the surface chemistry and size distribution were measured by techniques such as Dynamic Light Scattering (DLS; Malvern Zeta sizer 3000HS, Malvern, Worcestershire, UK), scanning electron microscope (SEM, JSM-5600LV, Jeol, Tokyo, Japan), Zeta potential (Malvern Zeta sizer 3000HS, Malvern, UK), and contact angle (SDC100, Minder Hightech, China).
2.5. Preparation of Cur-Loaded NPs
The Cur-loaded NPs (Cur-NPs) were prepared using a single emulsion method. Specifically, 11 mg of Cur was dissolved in 5 mL of DCM. This Cur solution was gradually added drop-wise into 20 mL of DCM containing 100 mg of PCL-PEG copolymer, maintaining a PCL-PEG to Cur weight ratio of about 10:1. This process was also repeated for PCL-PEG-A6. The mixture was stirred for 3 min to ensure proper mixing. Following this, 3 mL of a 3.2% w/v PVA surfactant solution was added drop-wise into the reaction vessel, facilitating the formation of a Water-Oil emulsion. The mixture was then stirred for an additional 15 min to stabilize the emulsion. To isolate the NPs, the resulting Cur-NPs were centrifuged at 10,000 rpm for 15 min. The NPs were then washed three times with deionized water to remove any unreacted materials or surfactant residues. Finally, the purified Cur-NPs underwent a lyophilization process to remove any remaining solvent, yielding dry NP powder suitable for further characterization and application [
42,
43,
44].
2.6. DL% and EE% Methodology
Cur was encapsulated during self-assembly into NPs within the hydrophobic cores. To assess the amount of DL% and EE% in the NPs, a standard curve of Cur concentration at 425 nm intensity was constructed based on the peak at various concentrations of Cur [
45]. To determine DL% and EE% of Cur-NPs and Cur-NPs-A6, 5 mg of the Cur was dissolved in solvent (ethanol: water, 20:80 v/v) containing NPs. Then, the samples were centrifuged at 8000 rpm for 20 min, and the concentration of Cur in the supernatant of each sample was measured via UV-Vis Spectrometer (S-2150, UNICO, USA). Afterward, each intensity was correlated to the desired concentration using the standard curve. The EE% was calculated using the formula (1) [
46]:
Also, the DL% was calculated using formula (2) [
47]:
2.7. In Vitro Release Study
The release behavior of Cur delivery systems was studied using diffusion through a dialysis bag with a molecular weight cutoff of 12 kDa. To establish a sink condition, Cur-NPs and Cur-NPs-A6 were placed in a dialysis bag in a receiver compartment containing a solution of PBS and ETOH (70:30%) at pH 7.4 aimed to mimic physiological conditions [
5,
40]. The sink condition was maintained using an incubator shaker (Taitec, BR-42FL, Japan) at 100 rpm and 37°C. Additionally, the receiver solvent was refreshed at specified intervals (0.5, 1, 2, and 100h) after the samples were withdrawn. The Cur value released at 425 nm was determined using a UV/Vis spectrophotometer and the calculated standard curve from the previous section.
2.8. Cell Culture
The breast cancer cell line MDA-MB-231 and the non-cancerous epithelial cell line MCF-10A were cultured in DMEM supplemented with 1% penicillin/streptomycin and 10% FBS. The MDA-MB-231 cell line was selected for this study because it expresses CD44 significantly [
48]. The cell cultures were allowed to proliferate at 95% humidity, 37°C, and 5% CO
2 to evaluate the response of the designed systems to the studied cells [
31].
2.9. Cell Cytotoxicity Assay Methodology
To assess the impact of free Cur, Cur-NPs, and Cur-NPs-A6 on MDA-MB-231 and MCF-10A cells, the MTT assay was utilized. Initially, the cells were seeded in 96-well plates at a density of 7 × 10
3 cells per well and incubated for 24h to allow for cell attachment and growth. Following this incubation period, the cells were treated with varying concentrations (0-60 µM) of free Cur, Cur-NPs, and Cur-NPs-A6 for 48h. Given Cur poor solubility in water, a stock solution was prepared in a PBS: ETOH mixture (98:2%), ensuring that the final ethanol concentration did not exhibit cytotoxic effects on the cell lines. Following treatment, the culture media was aspirated, and 20 µl of MTT solution (5 mg/ml) was added to each well [
49]. After a 4h incubation period, the formazan crystals were dissolved in DMSO (60 µl), and the optical density was measured at 570 nm with a 650 nm reference using a microplate reader (ELISA Reader, MPRNM96, Latvia) [
31]. This absorbance directly correlates with the number of viable cells, thus enabling the assessment of cytotoxic effects induced by the different Cur formulations on studied cells. Finally, cell cytotoxicity was calculated using equation (3) [
5]:
2.10. Gene Expression Analysis
To assess the expression of target genes, MDA-MB-231 cells were cultured in 6-well plates at a density of 5 × 10
5 cells per well and treated with Cur, Cur-NPs, and Cur-NPs-A6 at the IC
50 concentration for 48h. The RNA was extracted using Trizol reagent, and its quality was assessed through agarose gel electrophoresis [
50]. Following the manufacturer's instructions, cDNA was synthesized from the RNA using a cDNA synthesis kit. The amplification of cDNA was performed using Amplicon SYBR Green master mix with a specific protocol of 40 cycles. The housekeeping gene Glyceraldehyde-3 phosphate dehydrogenase (GAPDH) was utilized for data normalization, and the relative expression of the target genes was calculated using the 2
-ΔΔCt method [
51,
52,
53]. The primer sequences for target gene amplification can be found in
Table 1 [
31].
2.11. Invasion Assay
The invasion assay is a laboratory technique utilized to assess the invasive potential of cells [
54]. To set up the transwell (SPL Life Sciences Co., Ltd. Pochon, Kyonggi-do, South Korea), PC inserts with 8 µm porous membranes were inserted into a 24-well plate. Subsequently, the PC membranes were coated with 50 µl of Matrigel in each well (Corning, Life Sciences Corp., NY, USA). Following this, 5 × 10
4 cells were seeded in the upper chamber in a culture medium (180 µl) without FBS to induce invasion under starvation conditions. The lower chamber was filled with 600 µl of DMEM containing 10% FBS (without penicillin/streptomycin) [
31]. In this stage, PBS-treated cells were used as the control, while the other groups were treated with Cur, Cur-NPs, and Cur-NPs-A6 at their respective IC
50 values (for 48h).
2.12. Statistical Analysis
The statistical analyses were conducted using the Social Sciences software (SPSS Inc, version 21, Chicago, IL). The one-way analysis of variance (ANOVA) was utilized for multiple comparisons, followed by Bonferroni correction [
55], to assess differences between groups (P ≤ 0.05).
3. Result
3.1. Characterization of NPs and NPs-A6
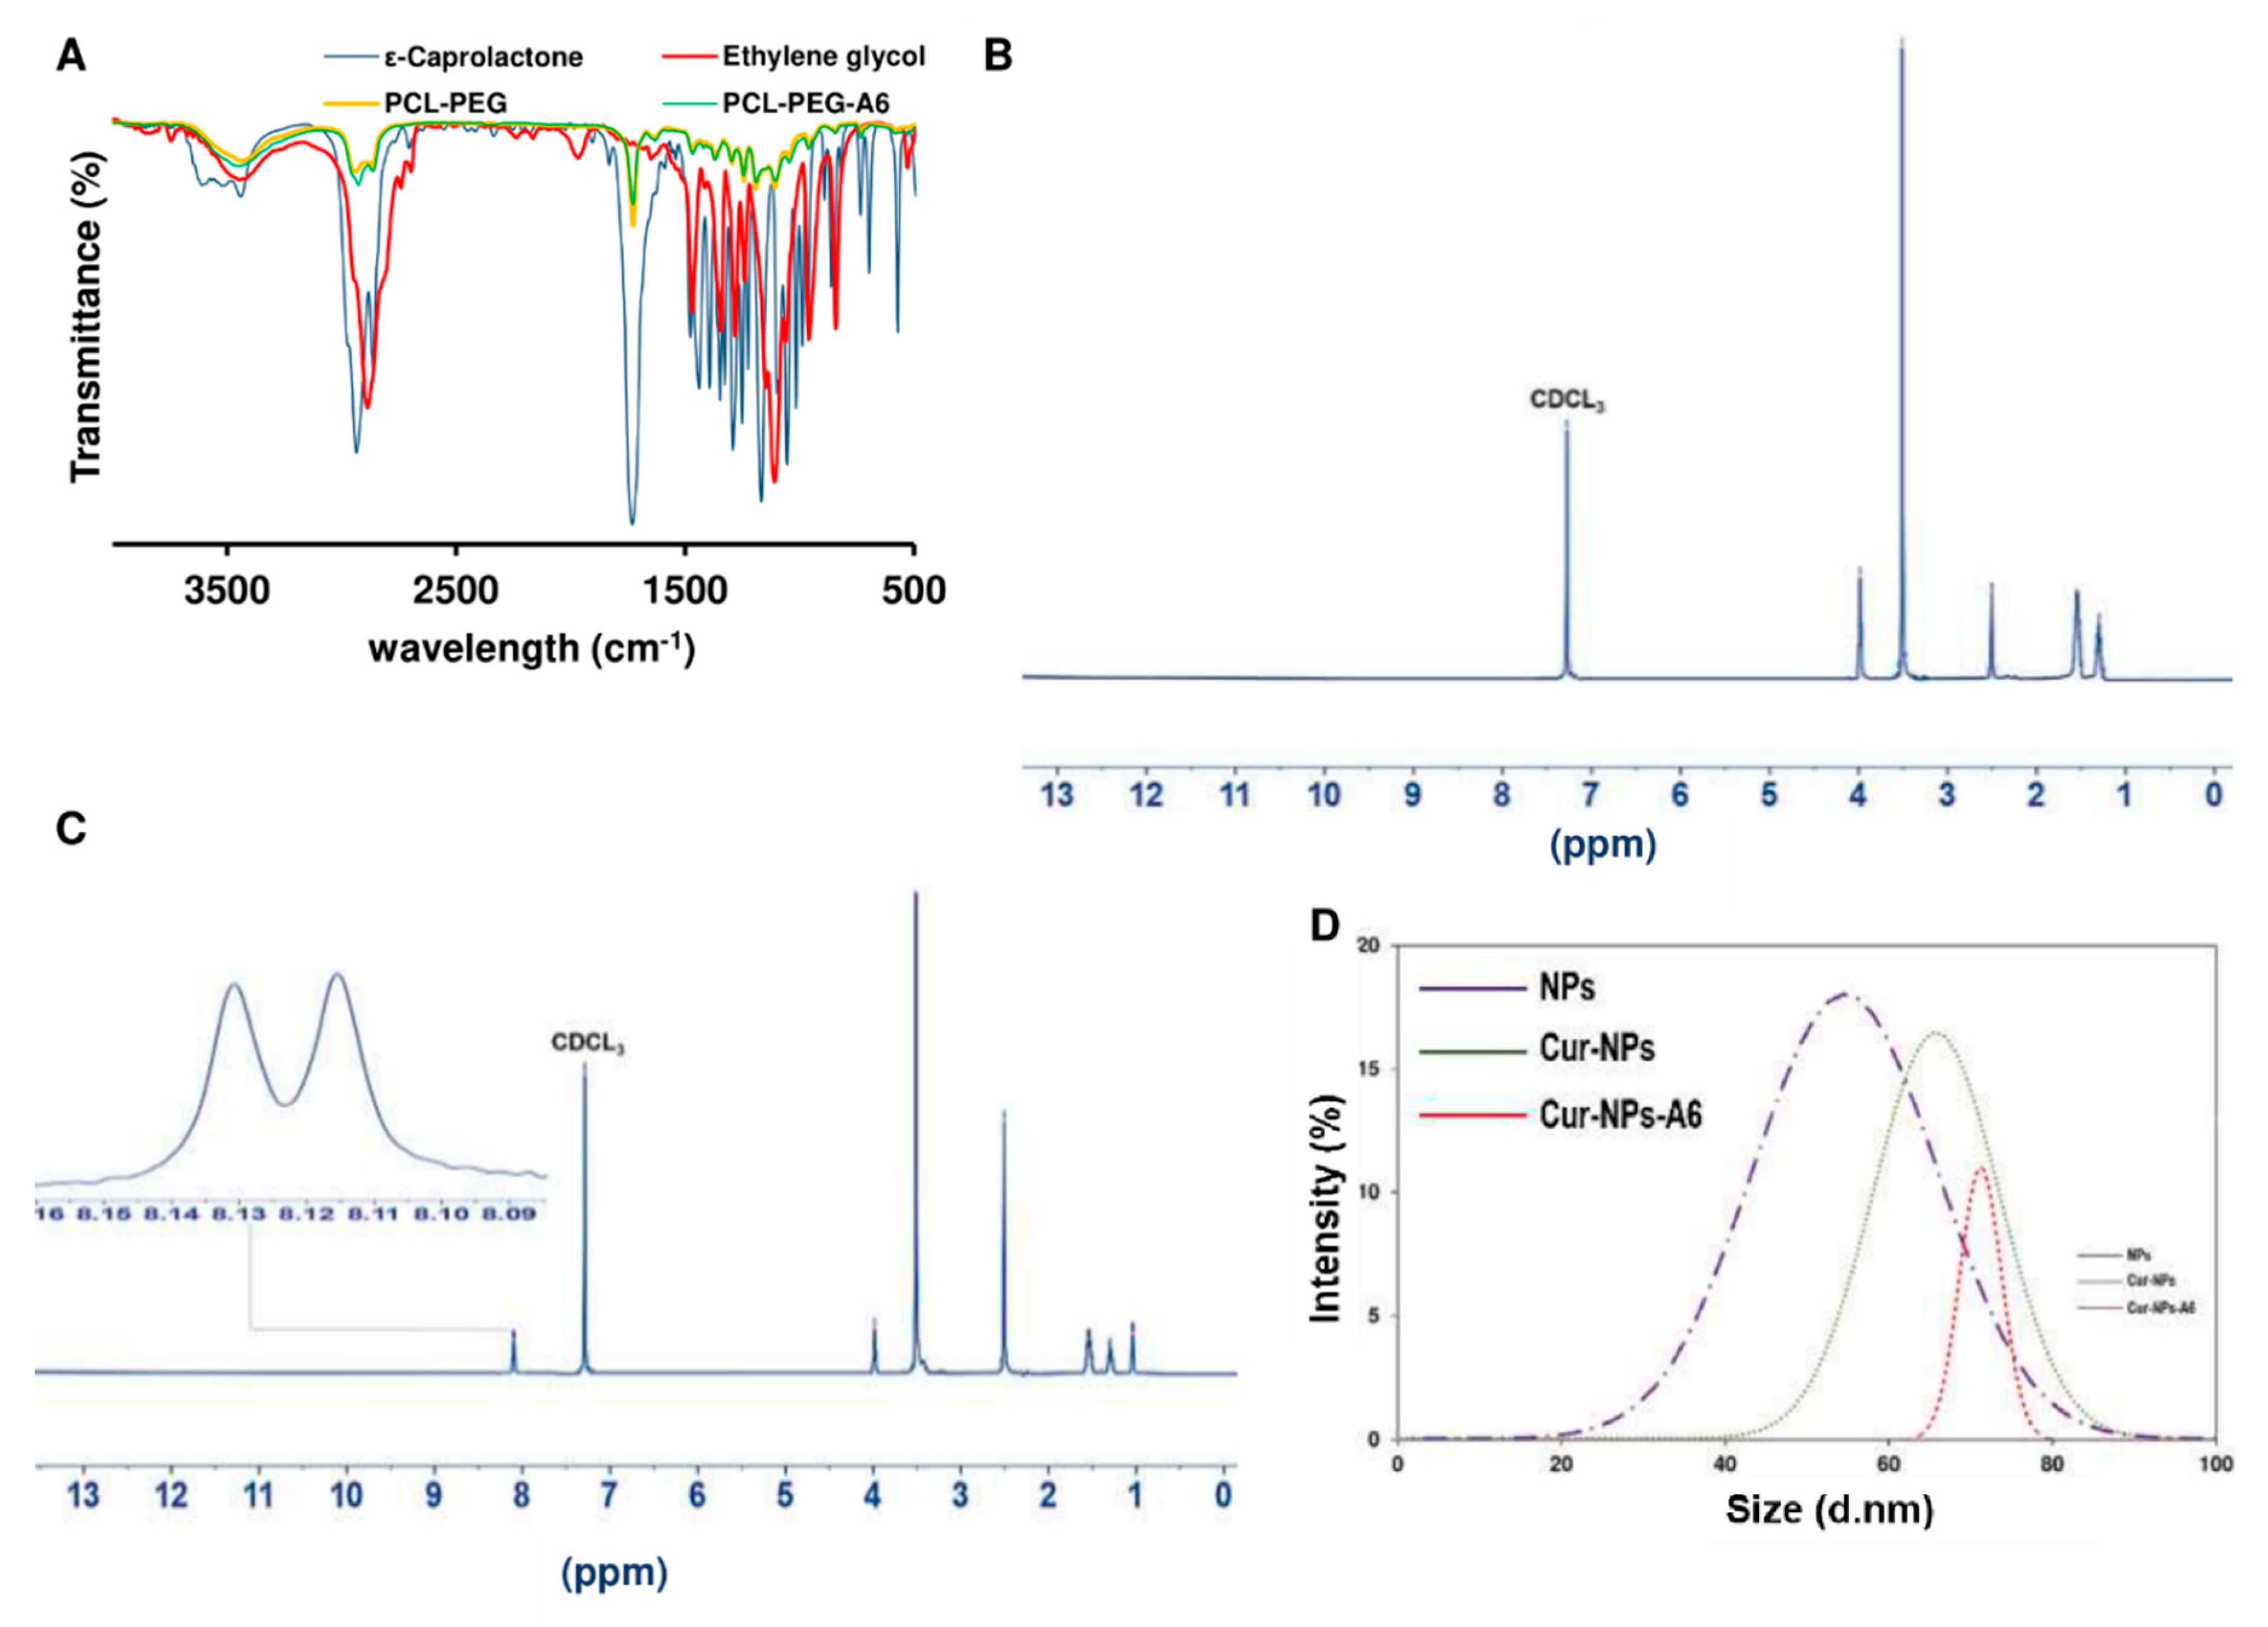
The FT-IR spectrum of ε-Caprolactone (
Figure 2A) revealed the molecule's functional groups and overall structure. Characteristic peaks in the FT-IR spectrum of caprolactone included a strong peak at approximately 1720 cm
-1, corresponding to the stretching vibration of the carbonyl (C=O) group in the lactone ring. Additionally, a peak around 810 cm
-1 indicated the presence of the C-H bond in the lactone ring, while another peak around 1450 cm
-1 represented the bending vibration of the C-H bond in the lactone ring. Similarly, the FT-IR spectrum of ethylene glycol displayed characteristic peaks, such as a broad peak centered around 3400 cm
-1, corresponding to the stretching vibration of the hydroxyl (OH) group. Another peak at around 2900 cm
-1 indicated the stretching vibration of the C-H bond, while a peak around 1450 cm
-1 demonstrated the bending vibration of the C-H bond. Additionally, a peak at around 1100 cm
-1 corresponded to the stretching vibration of the C-O bond.
Furthermore, the FT-IR spectrum of PCL-PEG provided insights into the functional groups present in the copolymer and the degree of interaction between PCL and PEG. A broad peak centered around 3400 cm
-1 was observed, corresponding to the stretching vibration of OH groups in PCL and PEG. Additionally, a peak at around 2940 cm
-1 indicated the stretching vibration of aliphatic CH groups in the PCL-PEG copolymer. A peak at approximately 1720 cm
-1 indicated the stretching vibration of C=O groups in the PCL-PEG copolymer. Additionally, a peak at around 1100 cm
-1 corresponded to the stretching vibration of ether (C-O-C) linkages in PCL and PEG, while the peak at approximately 1180 cm
-1 corresponded to the stretching vibration of the C-O bond in the PCL-PEG copolymer [
56]. The presence of peaks at both 1100 cm
-1 and 2940 cm
-1 suggested a well-mixed composition of PEG and PCL in the copolymer, with no significant phase separation. After the A6 peptide was conjugated to NPs, the FT-IR spectrum depicted a prominent peak at around 1725 cm
-1, indicating the presence of a carbocyclic acid group, attributed to the coupling of the bond between the carboxyl of the PCL-PEG and the amine group of the A6 peptide.
Furthermore, the
1H-NMR spectrum of PCL-PEG provided additional details regarding the chemical structure of the copolymer and the distribution of its constituent monomers, PCL and PEG (
Figure 2B). The characteristic peaks corresponding to the PEG block were confirmed at the chemical shifts of -OCH
2CH
2OCH
3 at 3.36 ppm, -OCH
2CH
2OCH
3 at 3.63 ppm, and -OCH
2CH
2OCH
3 at 4.04 ppm. Additionally, the identifiable peaks associated with the PCL block were observed at -COOCH
2CH
2CH
2CH
2CH
2- at 2.29 ppm, -COOCH
2CH
2CH
2CH
2CH
2- at 1.64 ppm, -COOCH
2CH
2CH
2CH
2CH
2- at 1.37 ppm, and -COOCH
2CH
2CH
2CH
2CH
2- at 4.04 ppm [
57]. When the A6 peptide conjugated to NPs, the
1H-NMR showed peaks around 0.8-1 and 8.2 ppm that confirmed the conjugation was successful (
Figure 2C).
Additionally, the size distribution (
Figure 2D) and zeta potential of the formulations were analyzed. The DLS analysis revealed that all the synthesized formulations were within the nano range. The results indicated that the incorporation of Cur into the polymer chain resulted in an enlargement of the spherical NPs. Initially, the NPs displayed a zeta potential of approximately -32.7 mV. However, after the loading of Cur and the conjugation of the peptide, the zeta potential of the structures decreased, as detailed in
Table 2.
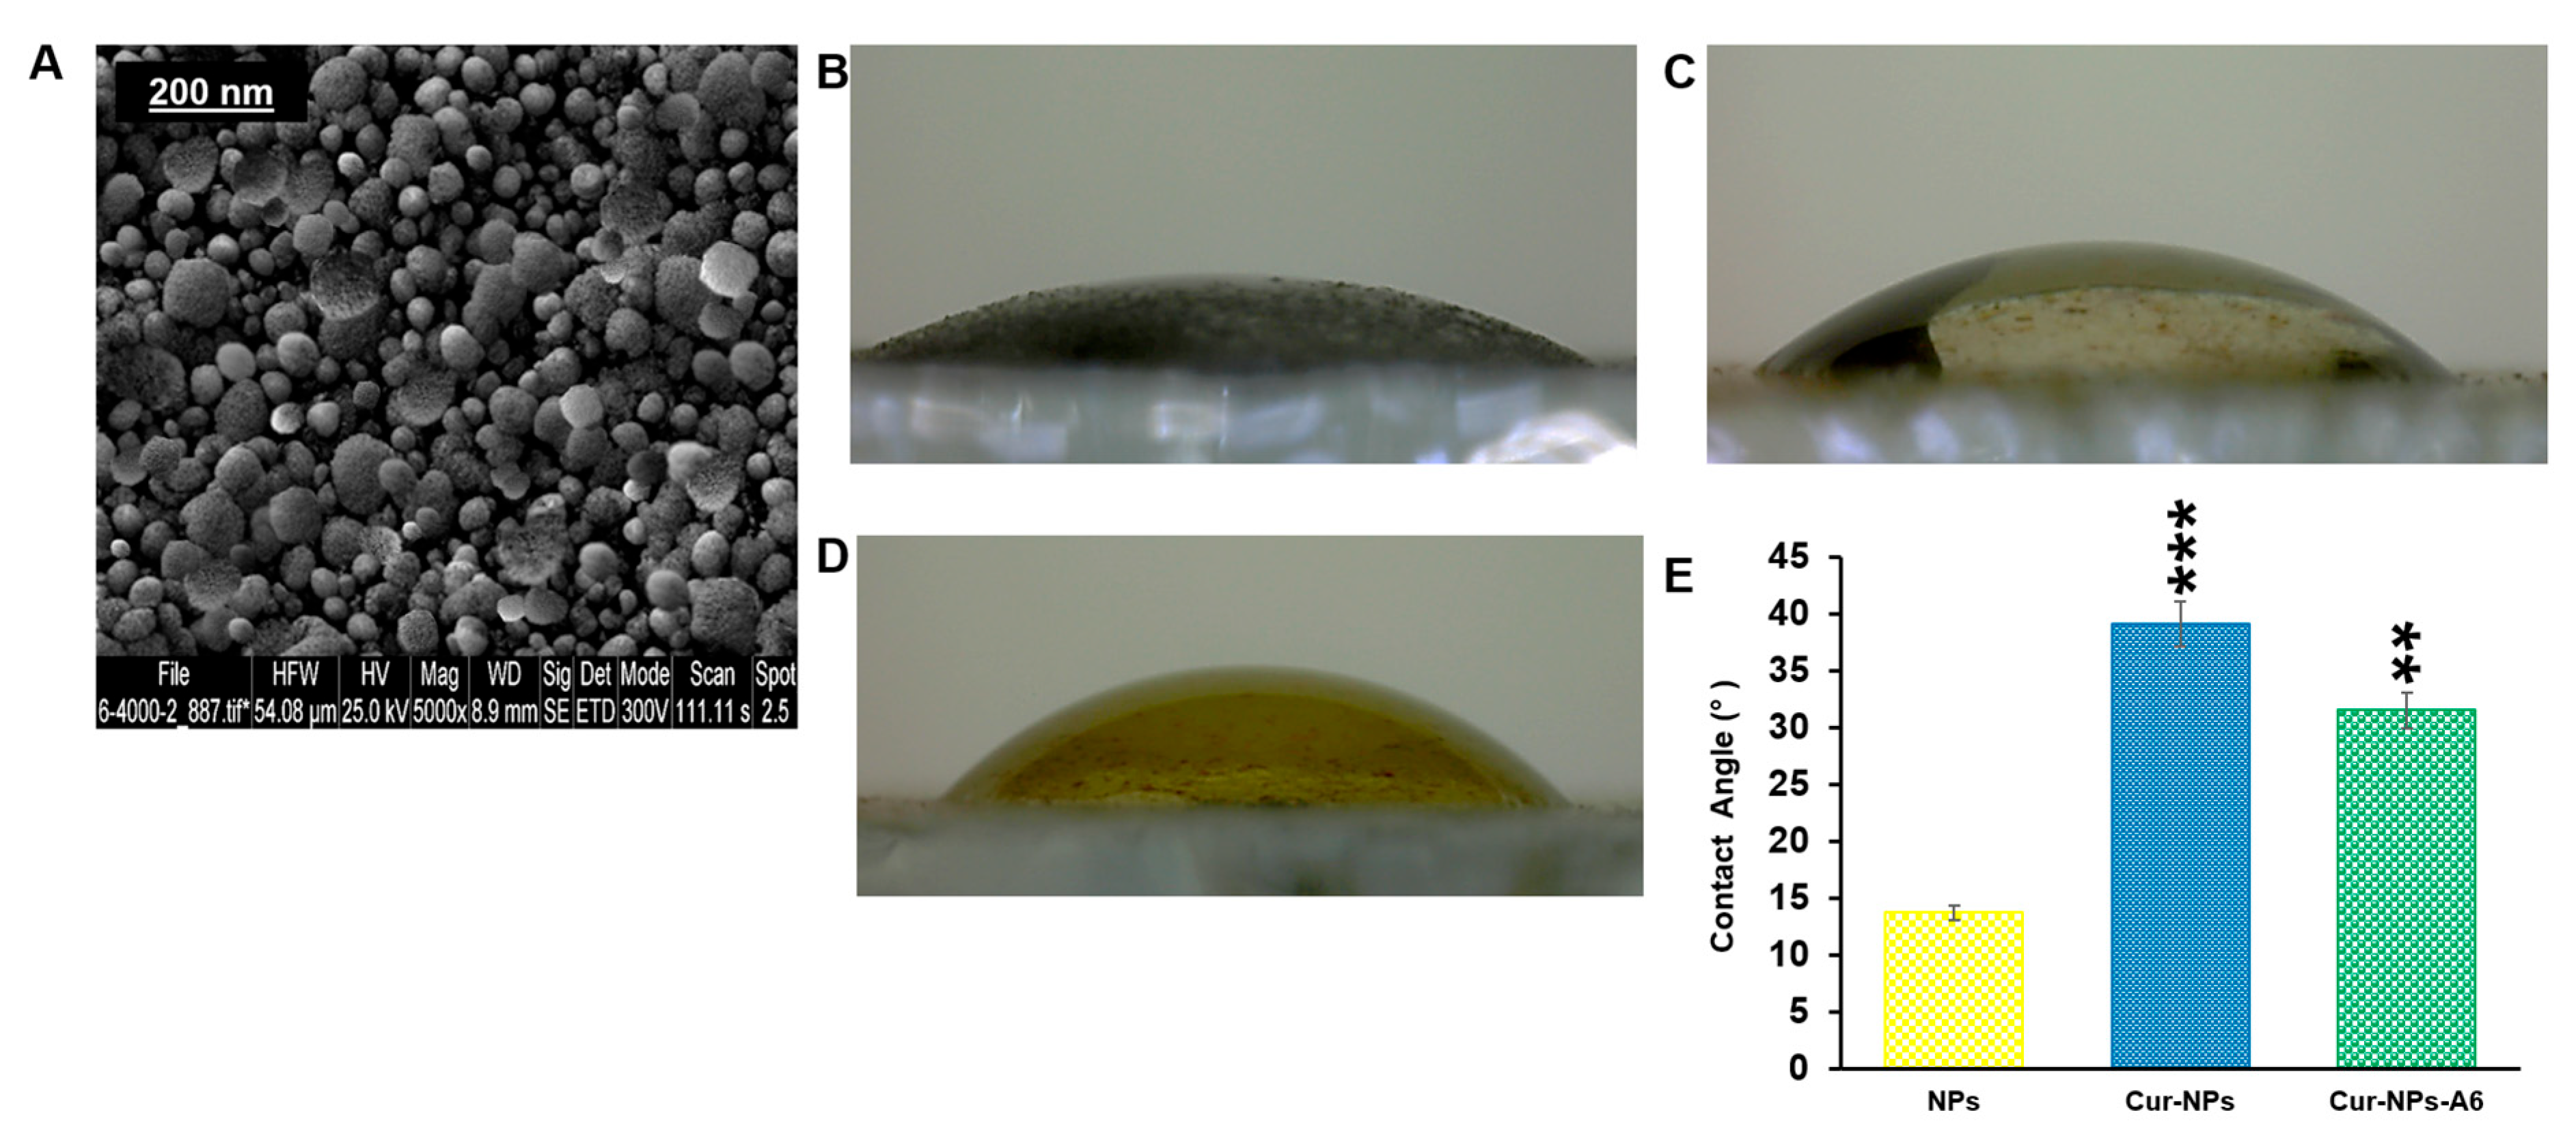
In addition, the surface morphology of these NPs was assessed using a SEM (
Figure 3A). Based on the SEM images, it was observed that the NPs exhibited a spherical morphology.
The hydrophilicity of surfaces was another crucial aspect of targeted delivery systems that was evaluated for the designed NPs. As depicted in
Figure 3(B–E), the contact angles for the samples were measured as 13.72° for NPs, 39.14° for Cur-NPs, and 31.53° for Cur-NPs-A6. It was also observed that hydrophilicity decreases when Cur is loaded into the core of the NPs.
3.2. DL% and EE% Findings
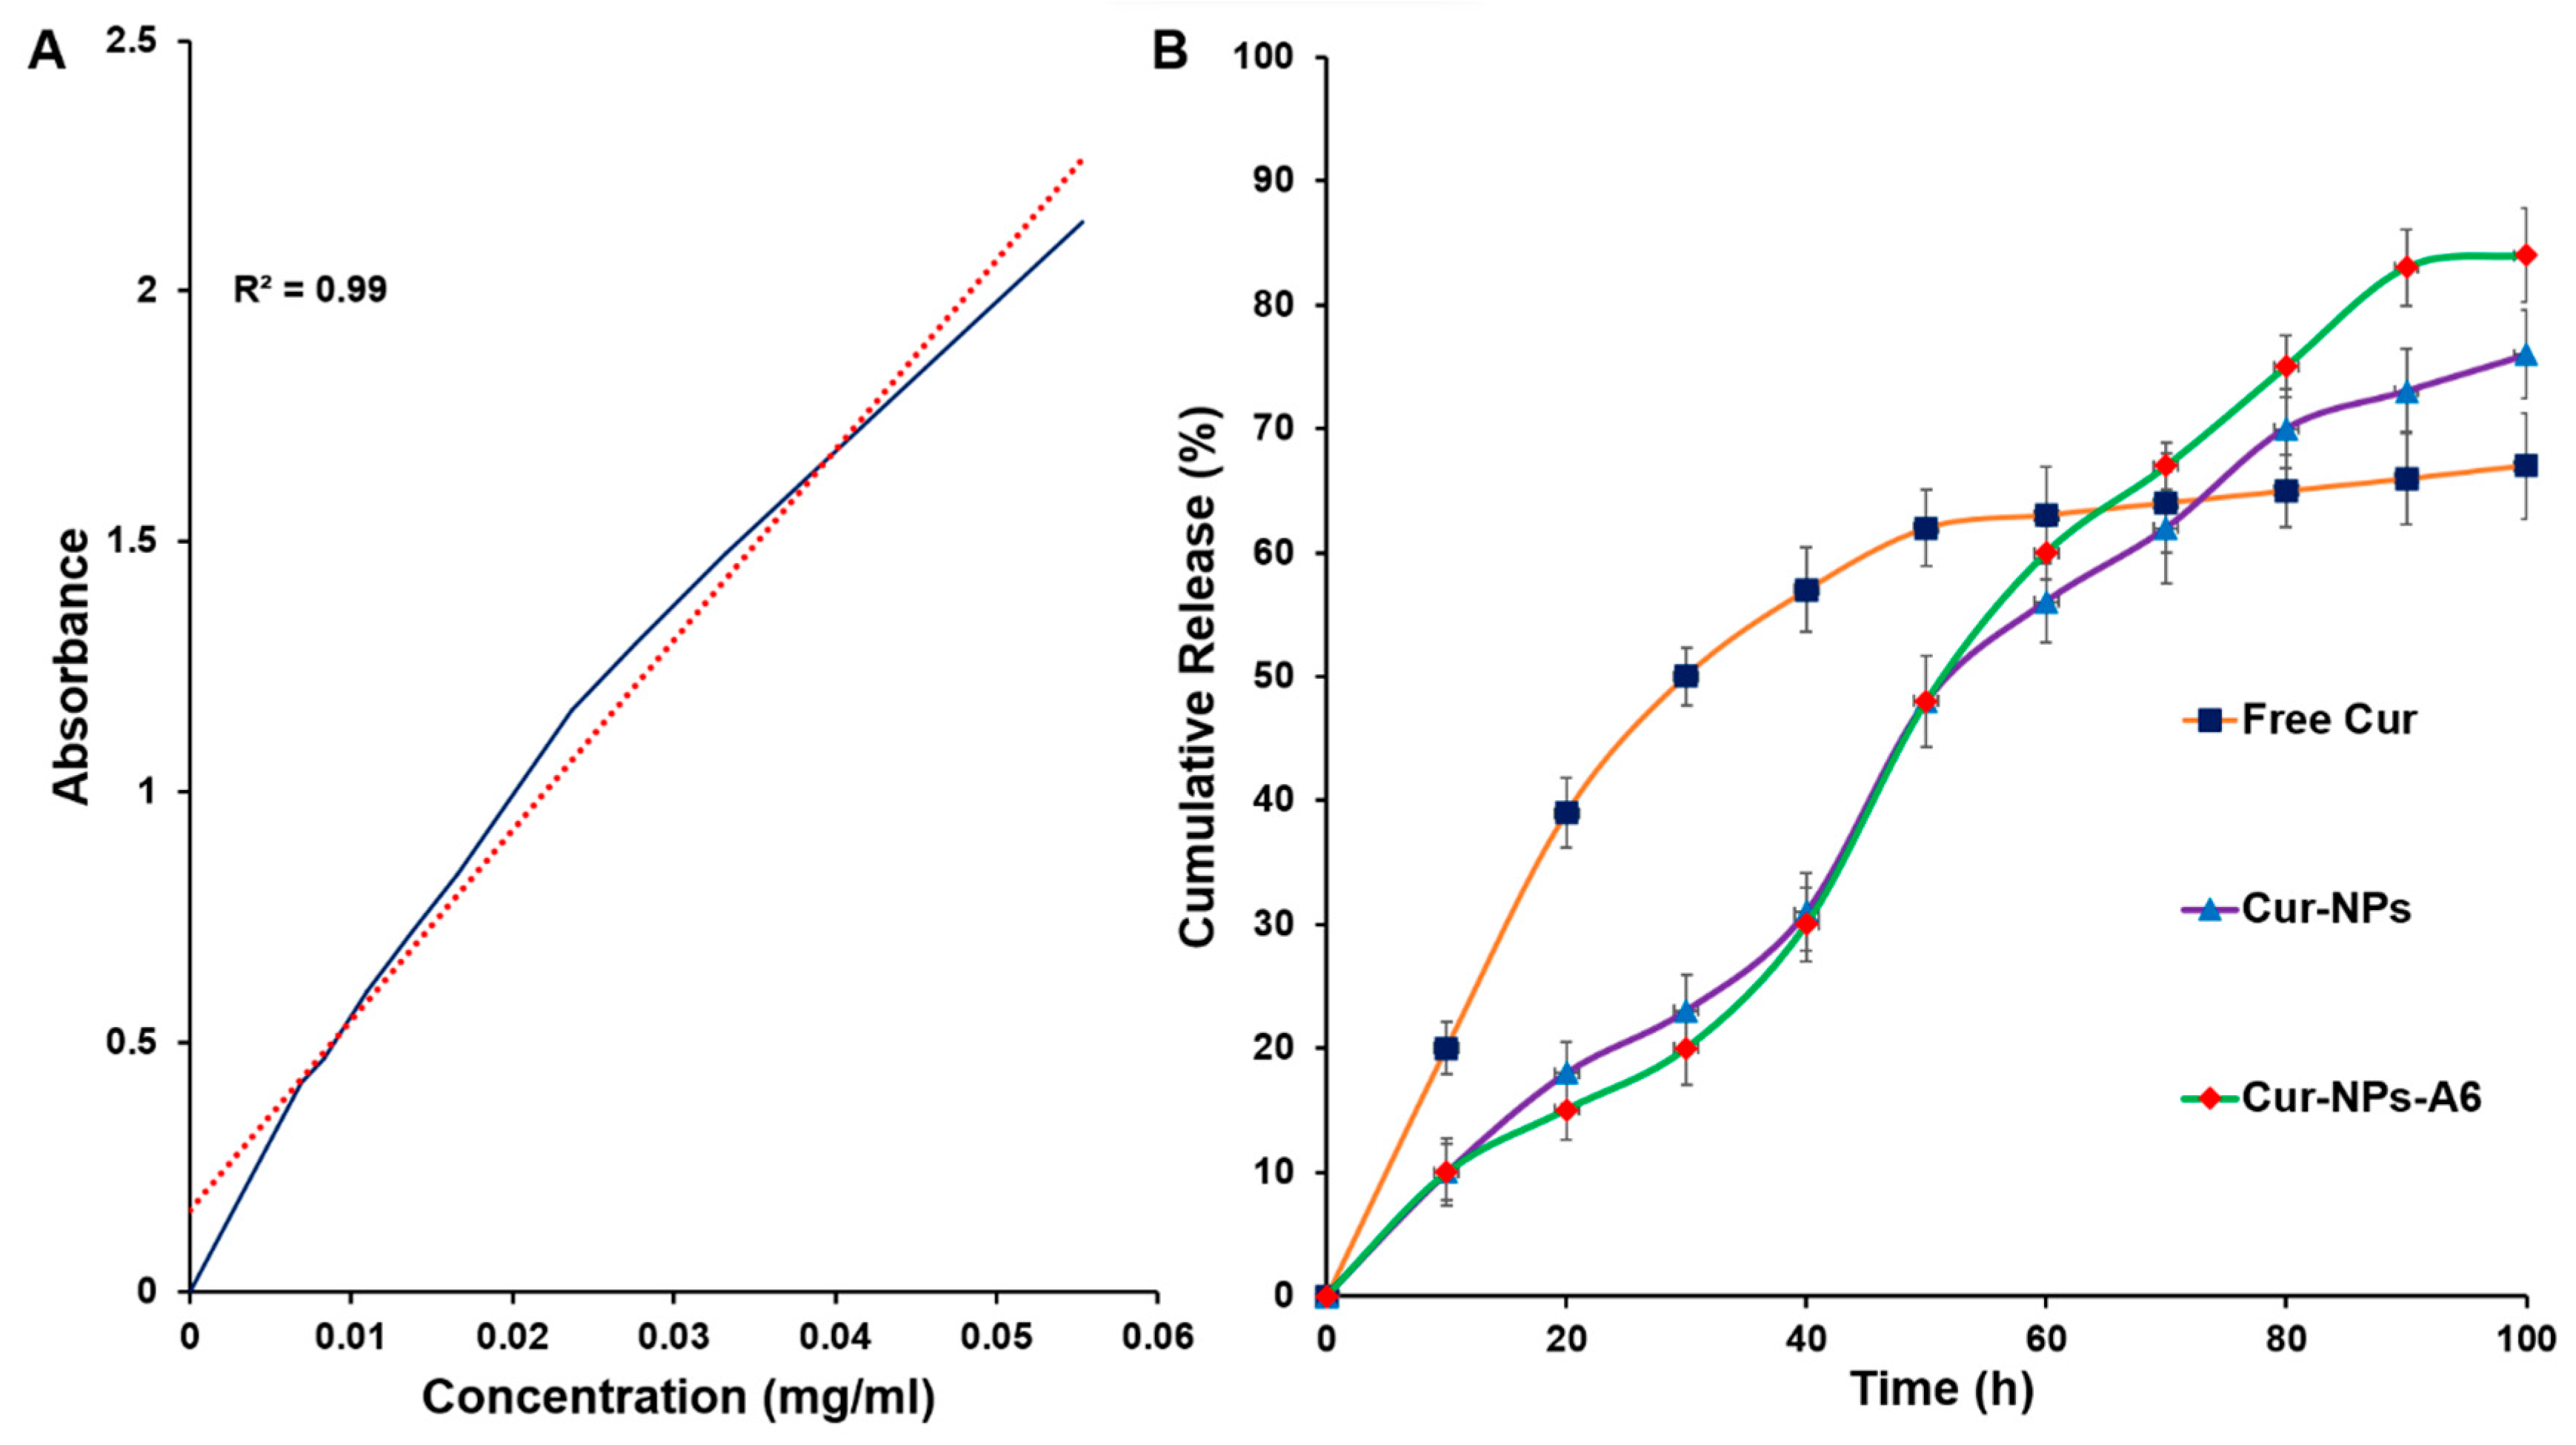
The standard curve exhibited a linear regression with an R
2 ≅ 0.99 in the range of 0–0.06 mg/ml (
Figure 4A). The DL% yield of Cur-NPs and Cur-NPs-A6 was 15.6 ± 1.2% and 16.7 ± 0.9%, respectively. Additionally, the EE% of Cur-NPs was approximately 92 ± 1.1%, while that of Cur-NPs-A6 was 93 ± 0.89%. These results demonstrate a substantial improvement in the solubility of Cur through the designed NPs.
3.3. Drug Release Profile
To examine the impact of NPs on the controlled release of Cur, an
in vitro release study was conducted using the UV spectroscopy method in a pH 7.4 solution (
Figure 4B). The study compared the release profiles of free Cur, Cur-NPs, and Cur-NPs-A6 in a PBS solution. Various models, including zero order, first order, Higuchi, and Korsmeyer-Peppas, were utilized for model fitting. The findings revealed that the Cur-NPs system exhibited a release rate of approximately 75.1 ± 0.22% over 100h, without a significant burst release. In contrast, the free Cur system displayed a burst release, with more than 40% of Cur released in the initial 24h. Additionally, the Cur-NPs-A6 system demonstrated an improved release profile compared to Cur-NPs, releasing approximately 83.1 ± 0.12%. These findings indicated that the targeted delivery systems demonstrated desirable characteristics of the NPs, including slow and controlled release.
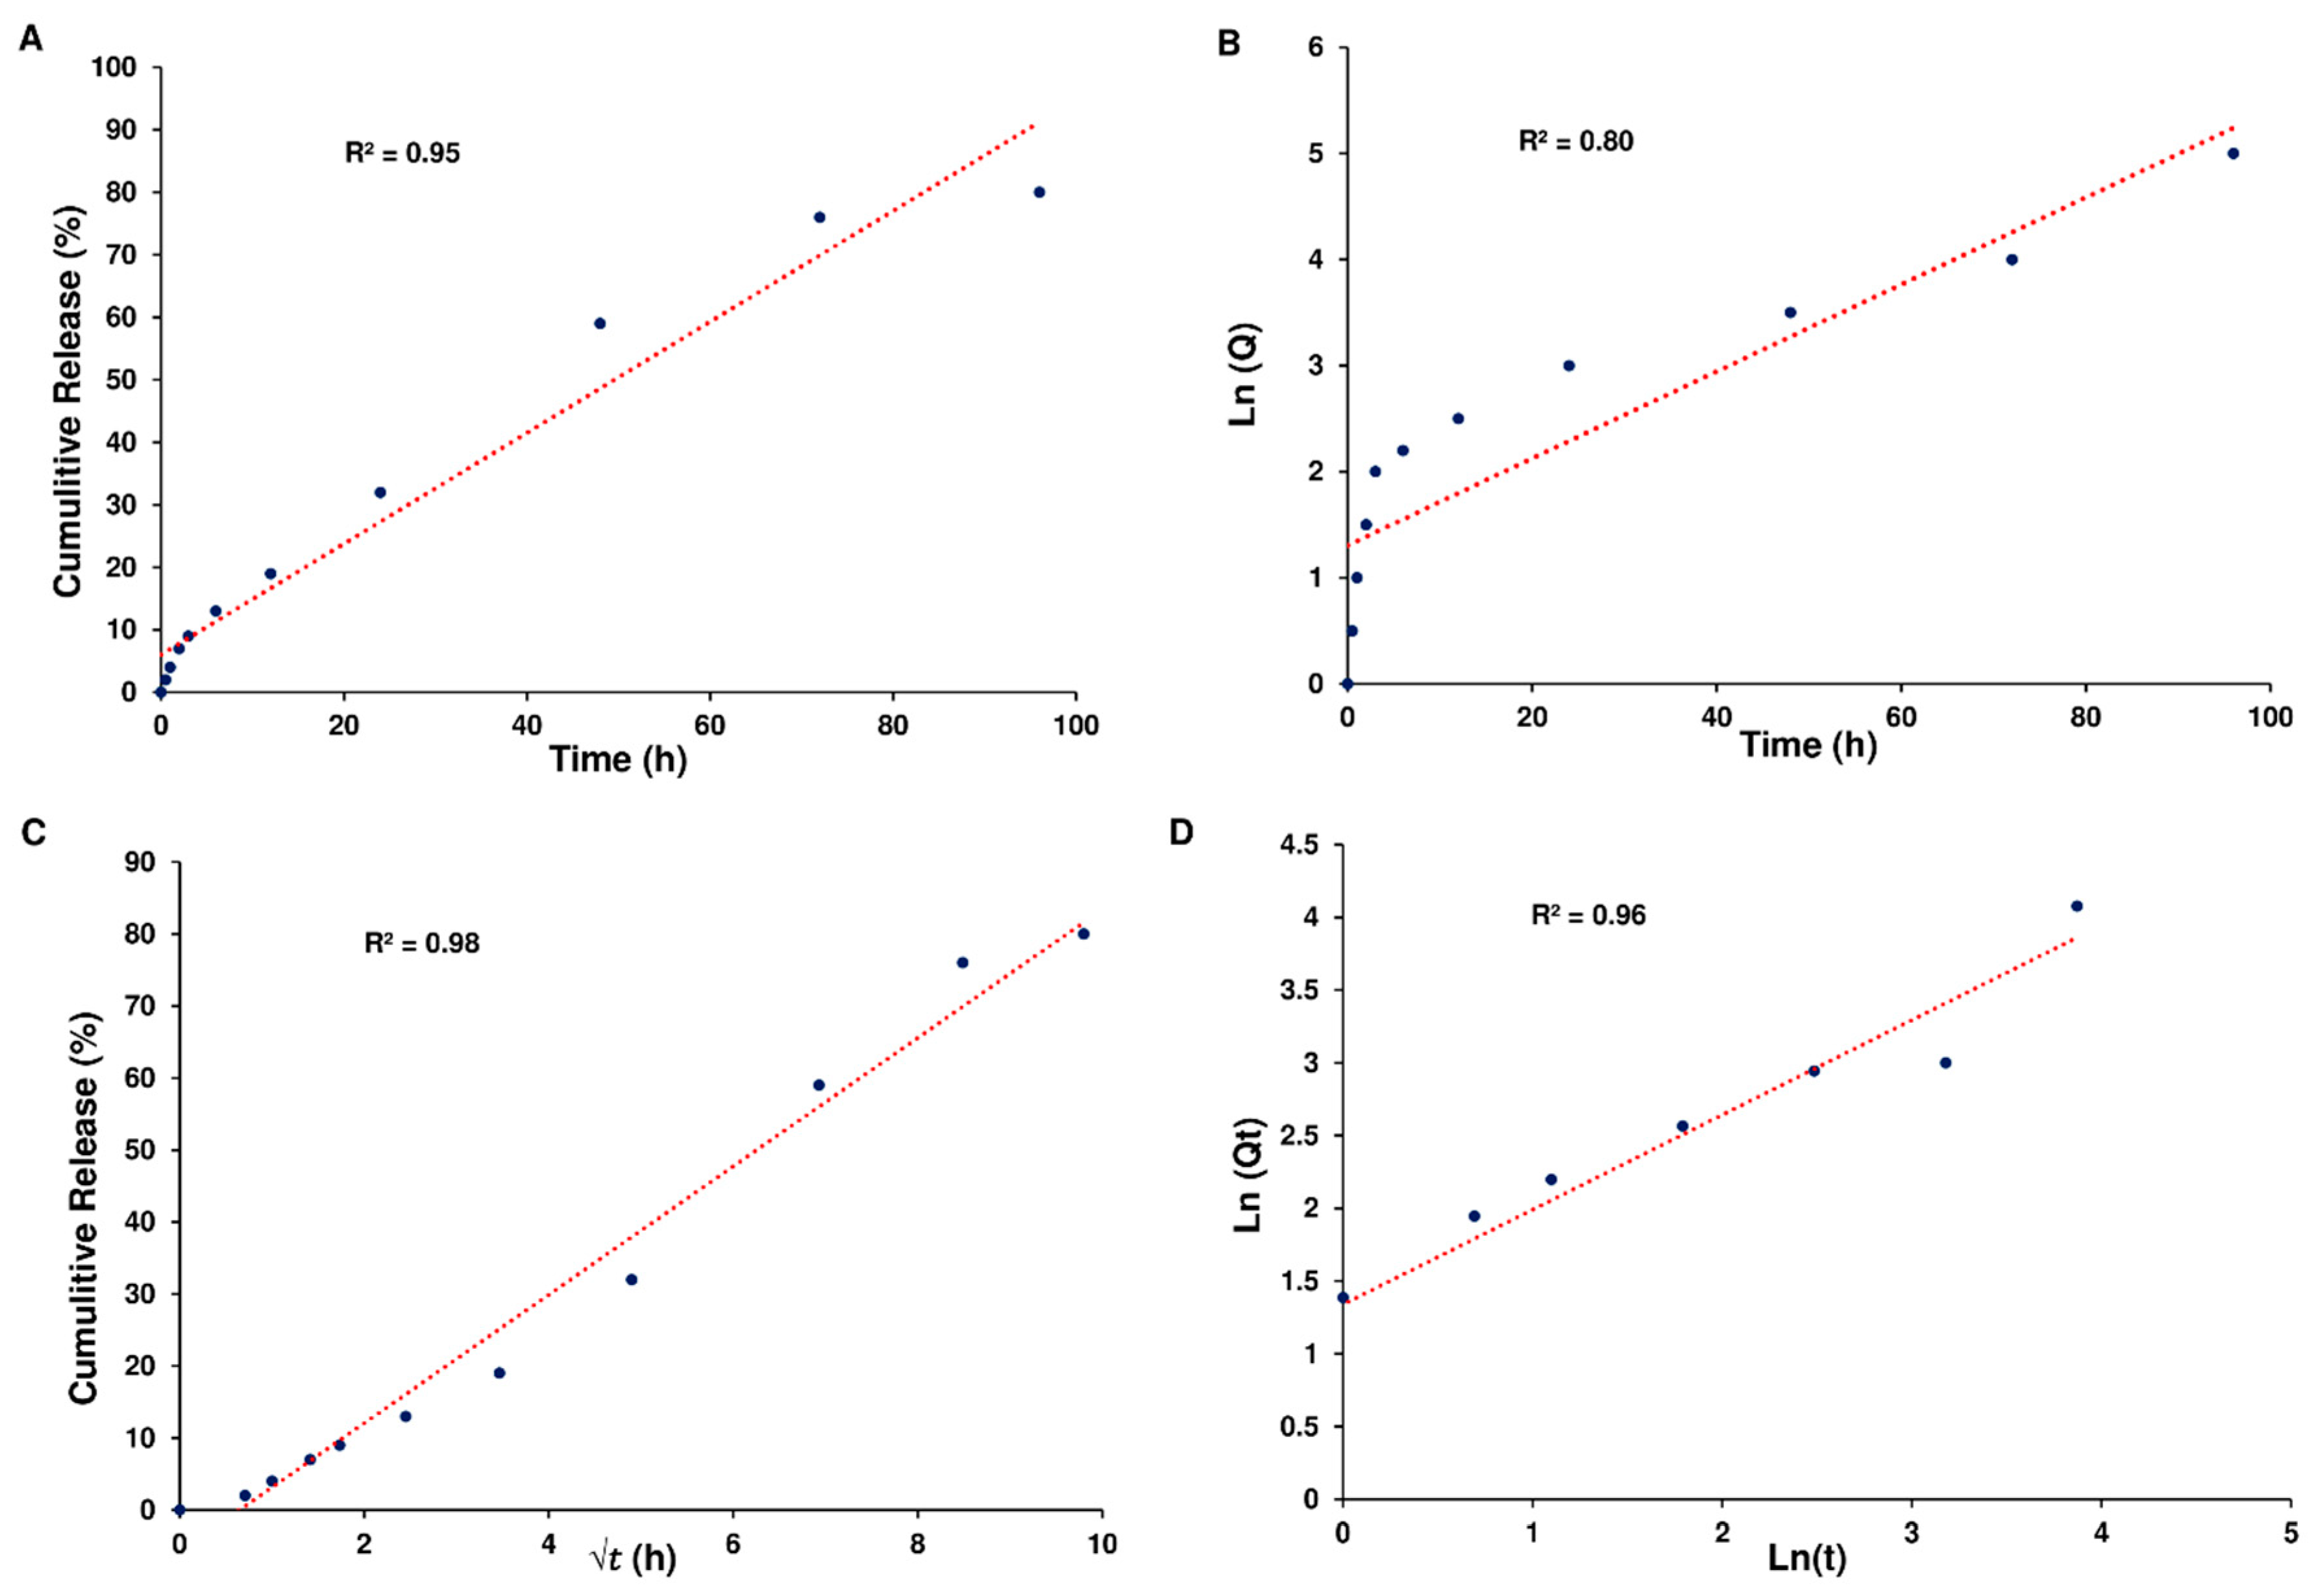
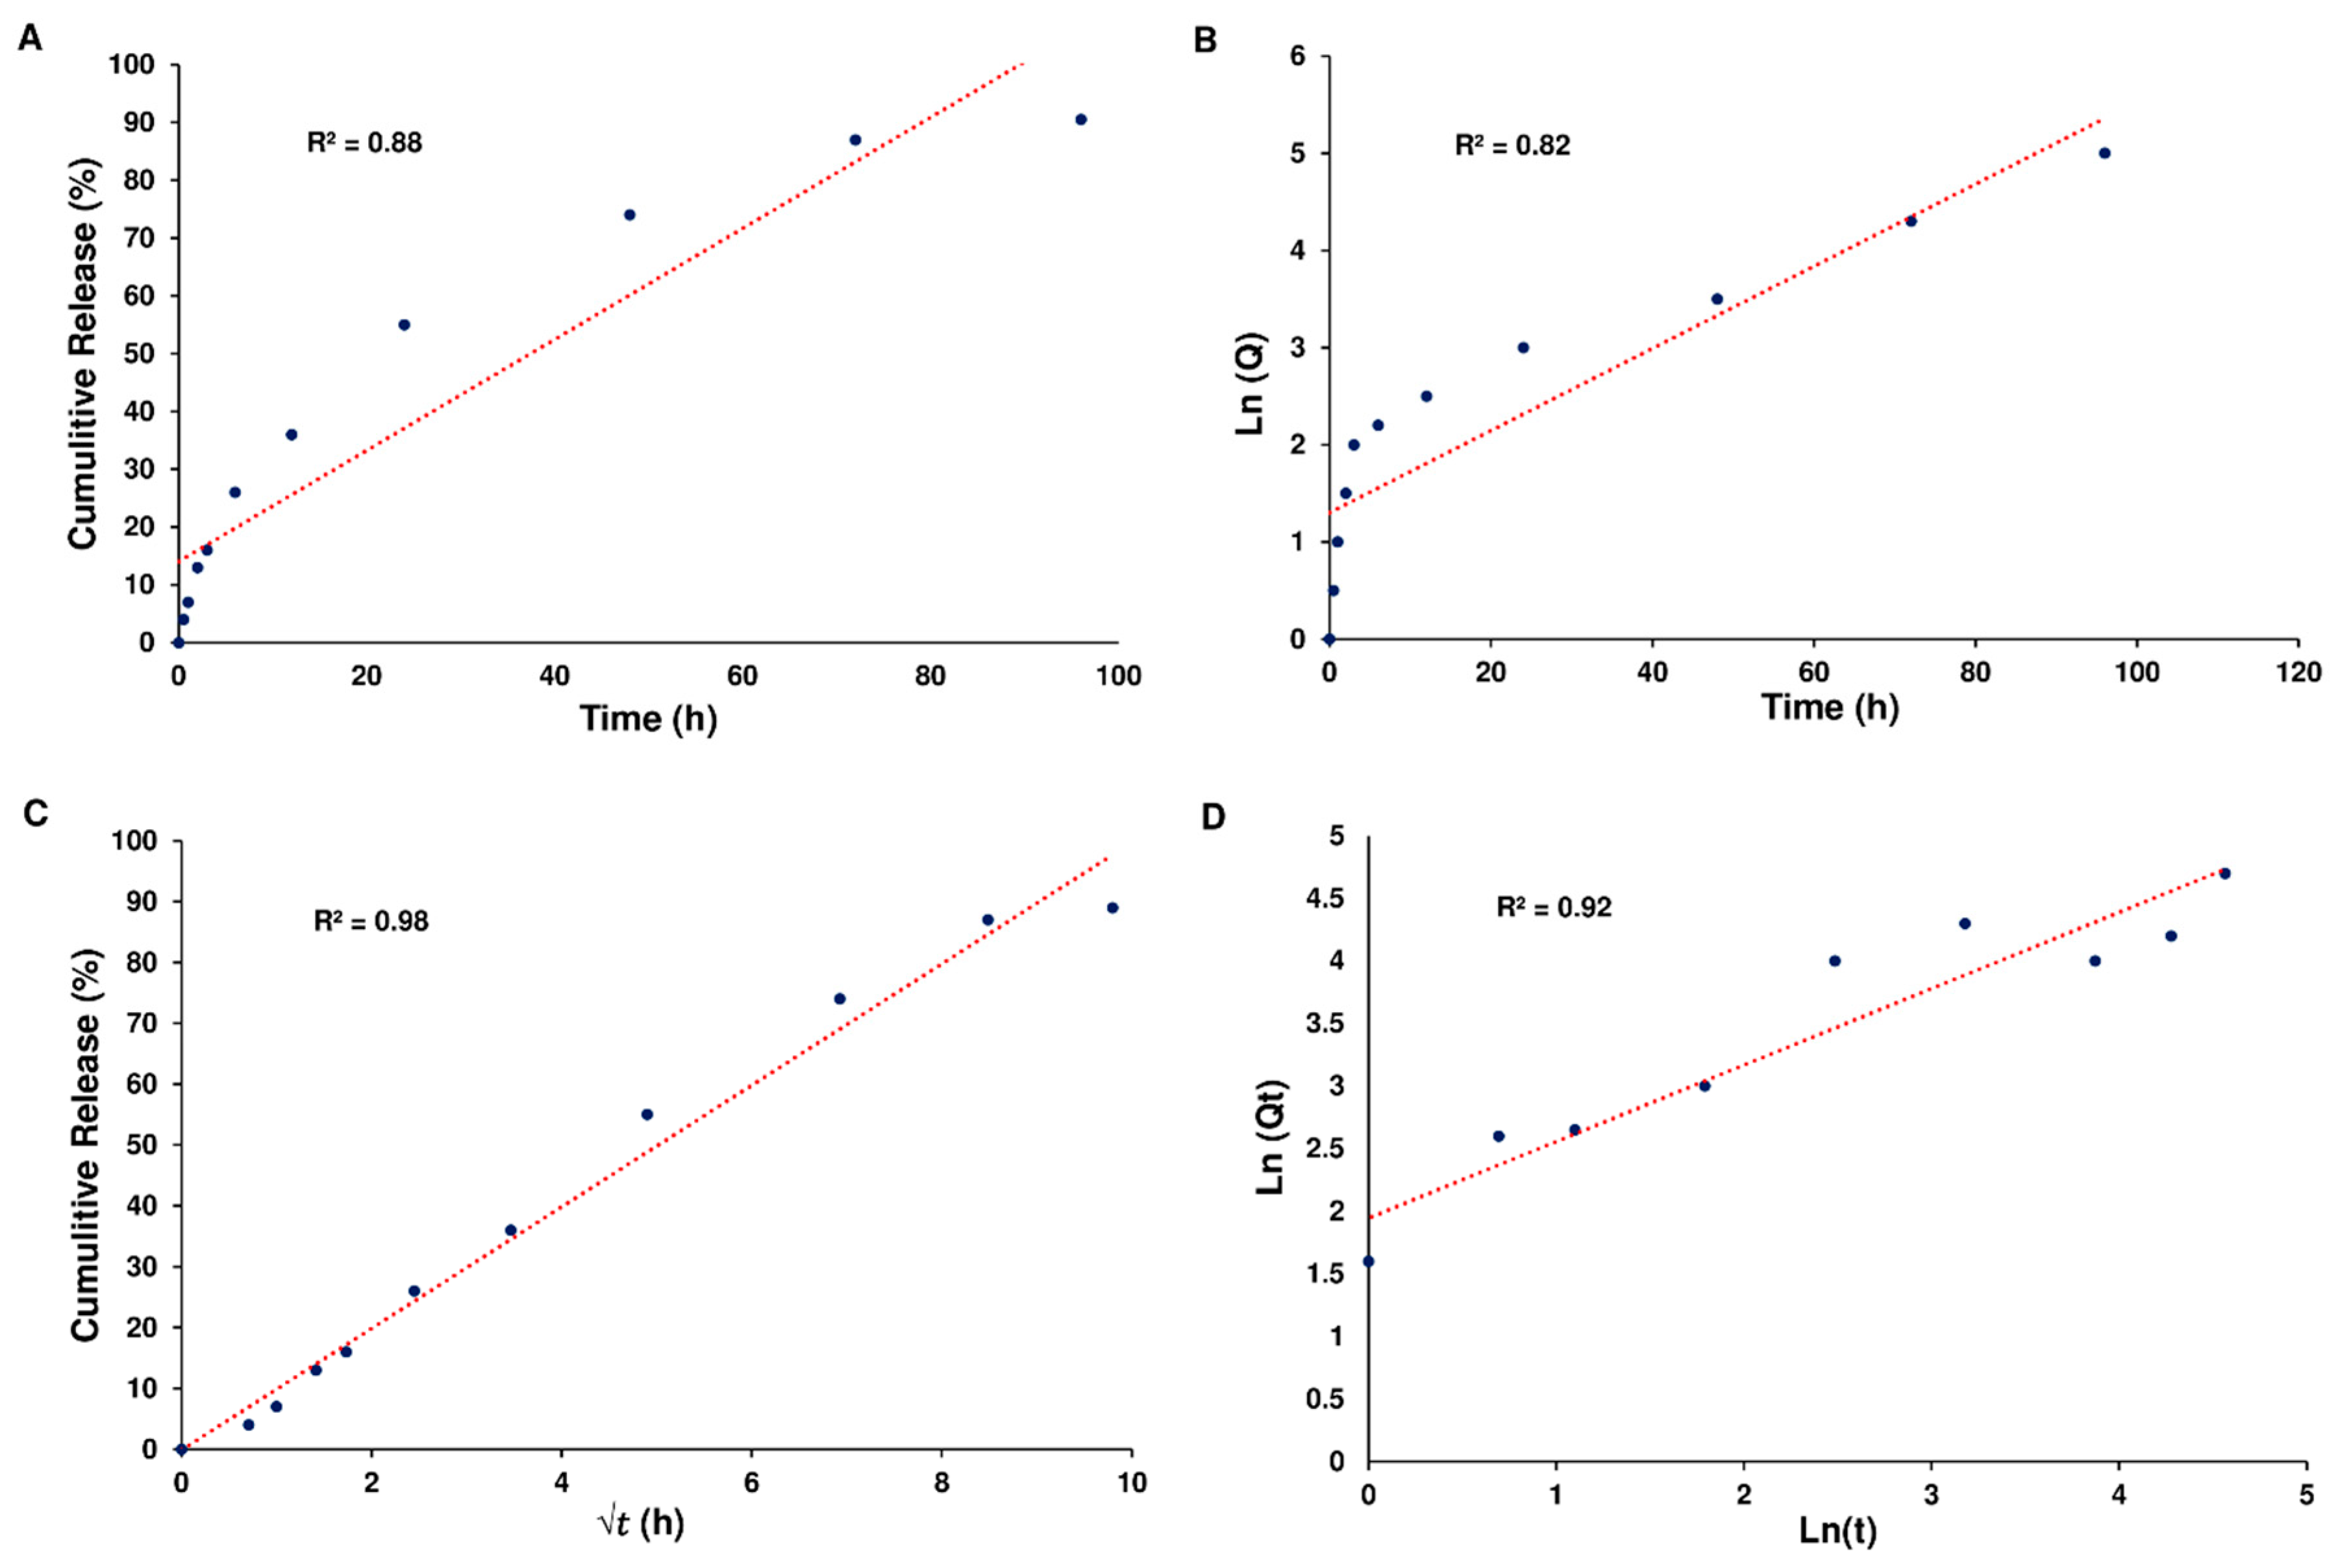
Based on the data, it seems that the release of Cur from Cur-NPs and Cur-NPs-A6 followed the Higuchi model. The cumulative percentage of Cur release over time exhibited a strong fit to the Higuchi model, as evidenced by high R
2 coefficient values of 0.98 for Cur-NPs (
Figure 5).
Furthermore, the Higuchi model effectively represented the cumulative percentage of Cur release over time for Cur-NPs-A6, demonstrating a notable R
2 coefficient value of 0.98 (
Figure 6).
3.4. MTT Assay
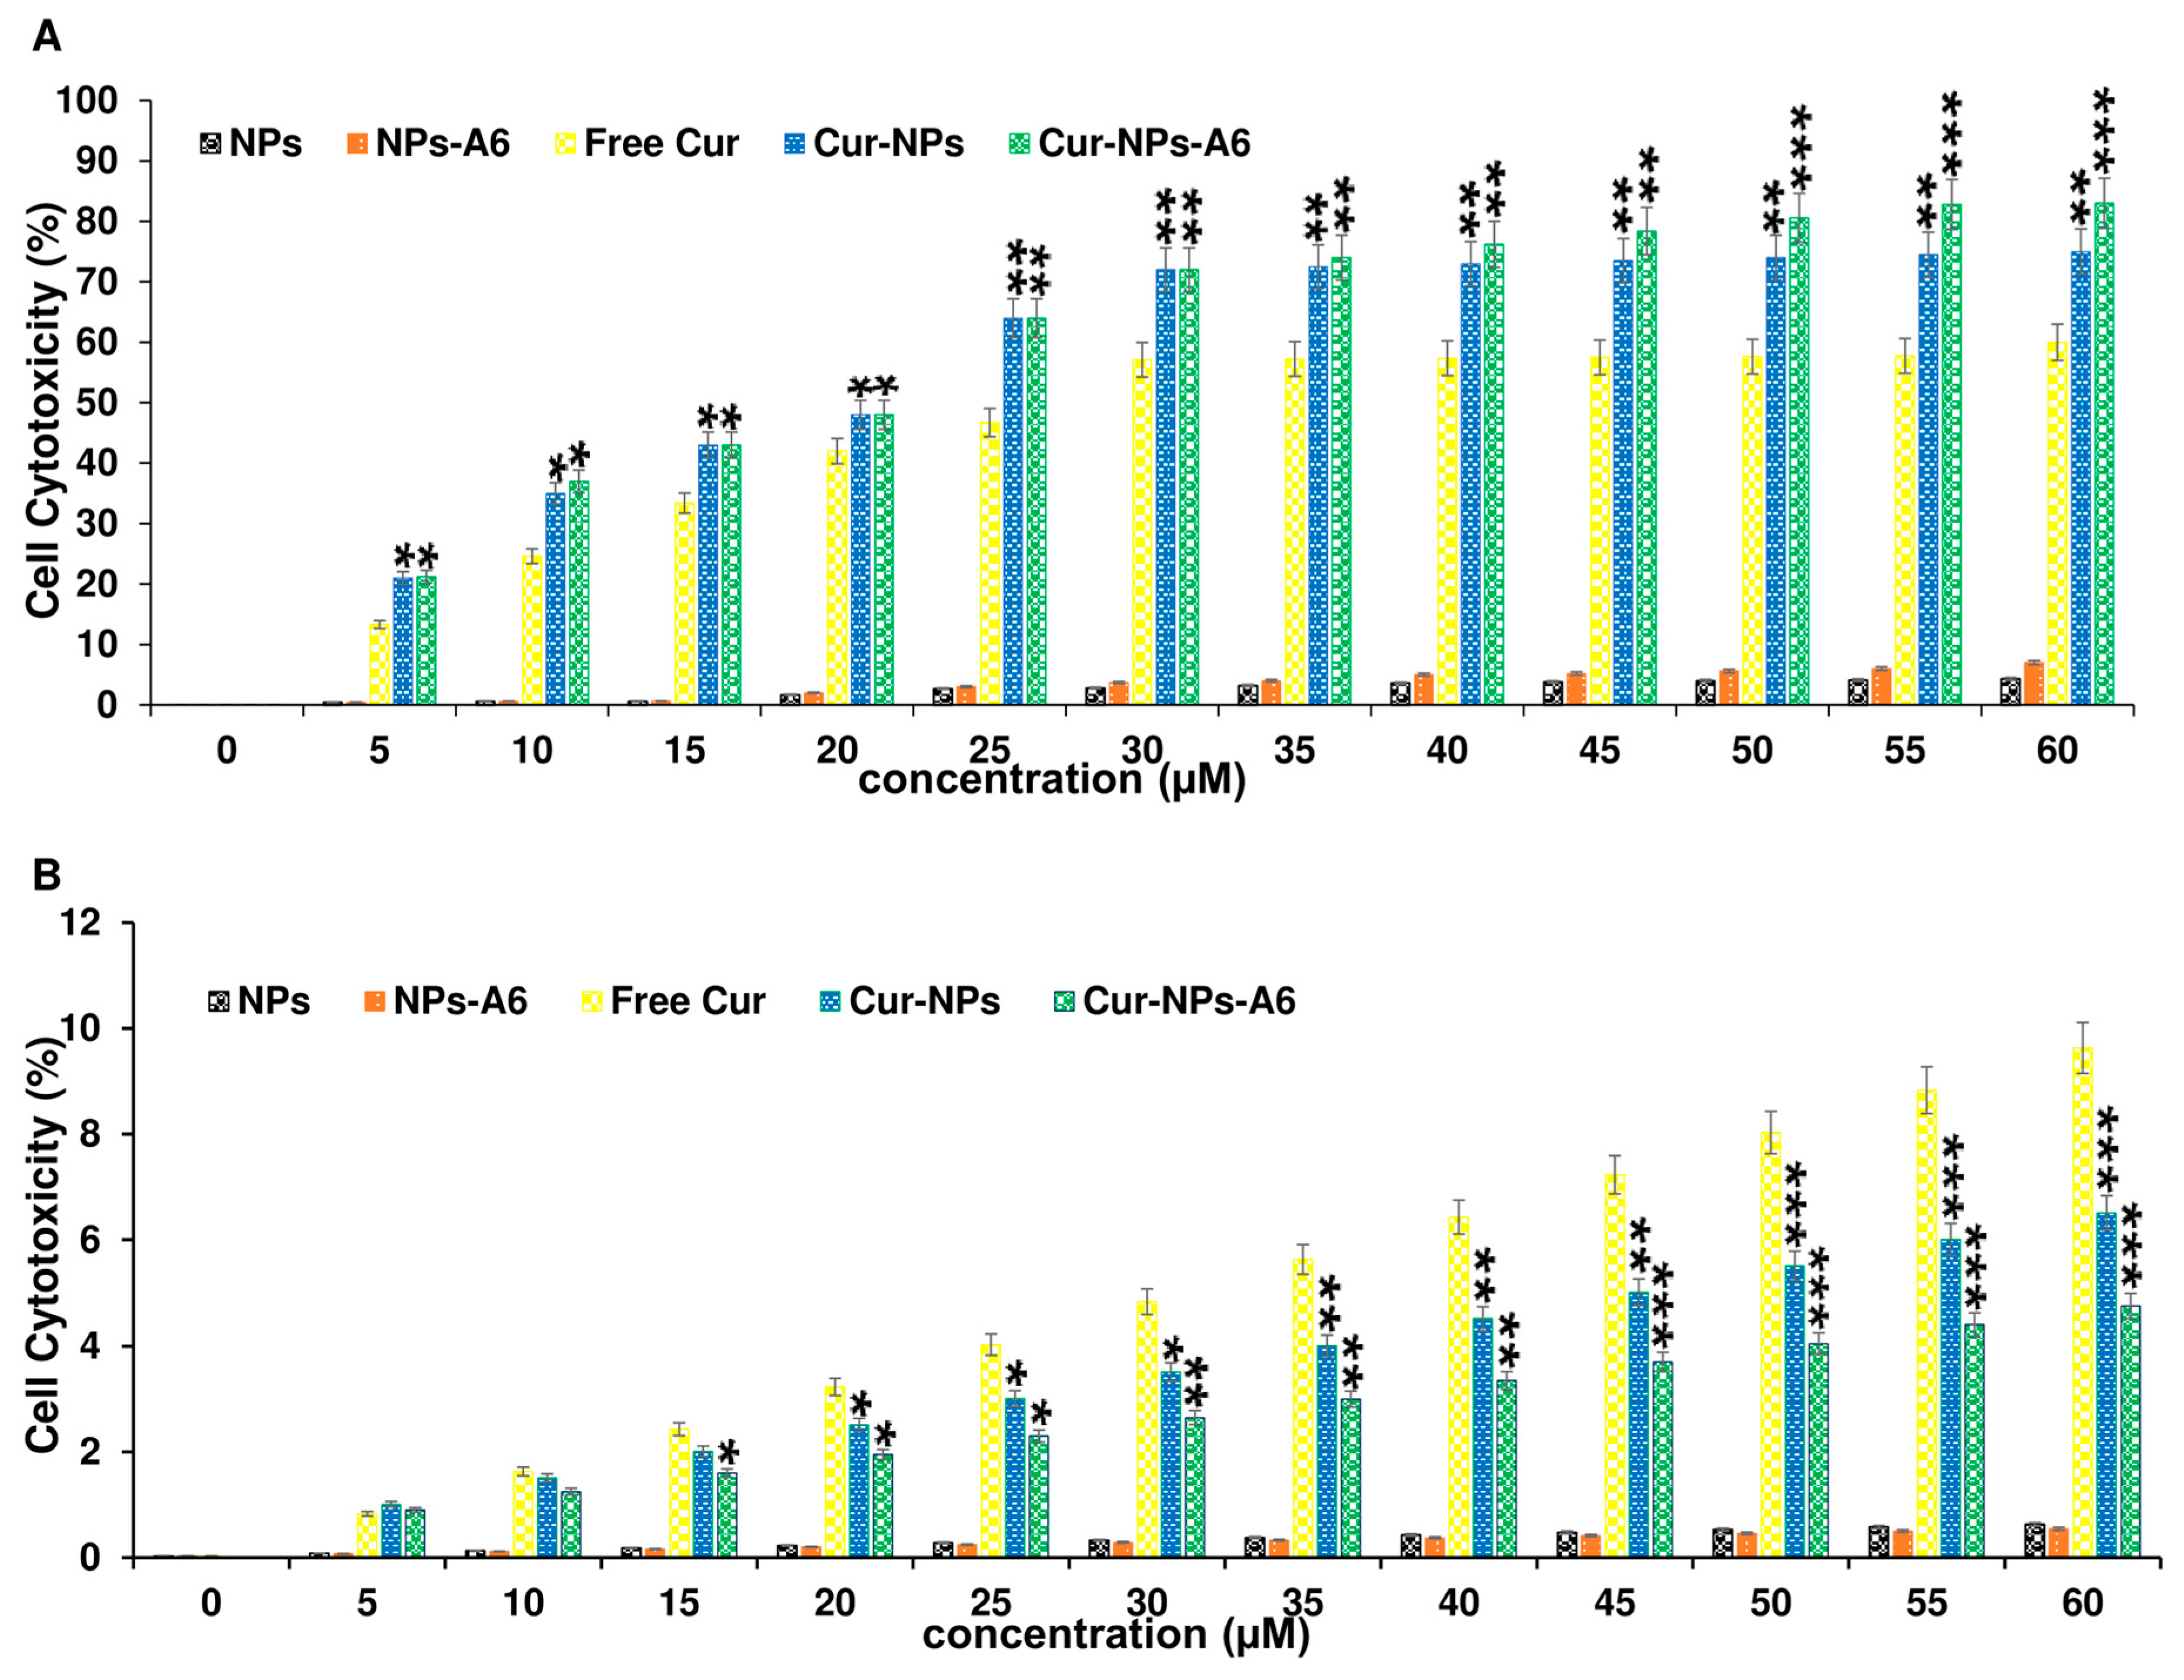
To evaluate the cytotoxicity profiles of the designed delivery systems, MTT assays were conducted on the MD-MBA-231 and the MCF-10A cells for 48h. Free Cur, Cur-NPs, and Cur-NPs-A6 were tested at various concentrations ranging from 0 to 60 µM. As depicted in
Figure 7A, both Cur-NPs and Cur-NPs-A6 exhibited a dose-dependent cytotoxic effect on MD-MBA-231 cells, demonstrating 75.2 ± 3.83% and 82.9 ± 4.09% cytotoxicity, respectively, at 60 μM. Conversely, Free Cur induced higher levels of cytotoxicity on MCF-10A cells with increasing dosages after 48h of incubation (
Figure 7). However, Cur-NPs-A6 showed minimal cytotoxicity on MCF-10A cells, suggesting a reduction in the non-specific toxicity associated with Cur. Additionally, the half-maximal IC
50 values for free Cur, Cur-NPs, and Cur-NPs-A6 for cancerous cells were determined to be 27.8 ± 1.93, 22.4 ± 1.85, and 21.3 ± 1.57 µM, respectively.
3.5. Gene Expression Analysis
Cur impacts various biological pathways [
58,
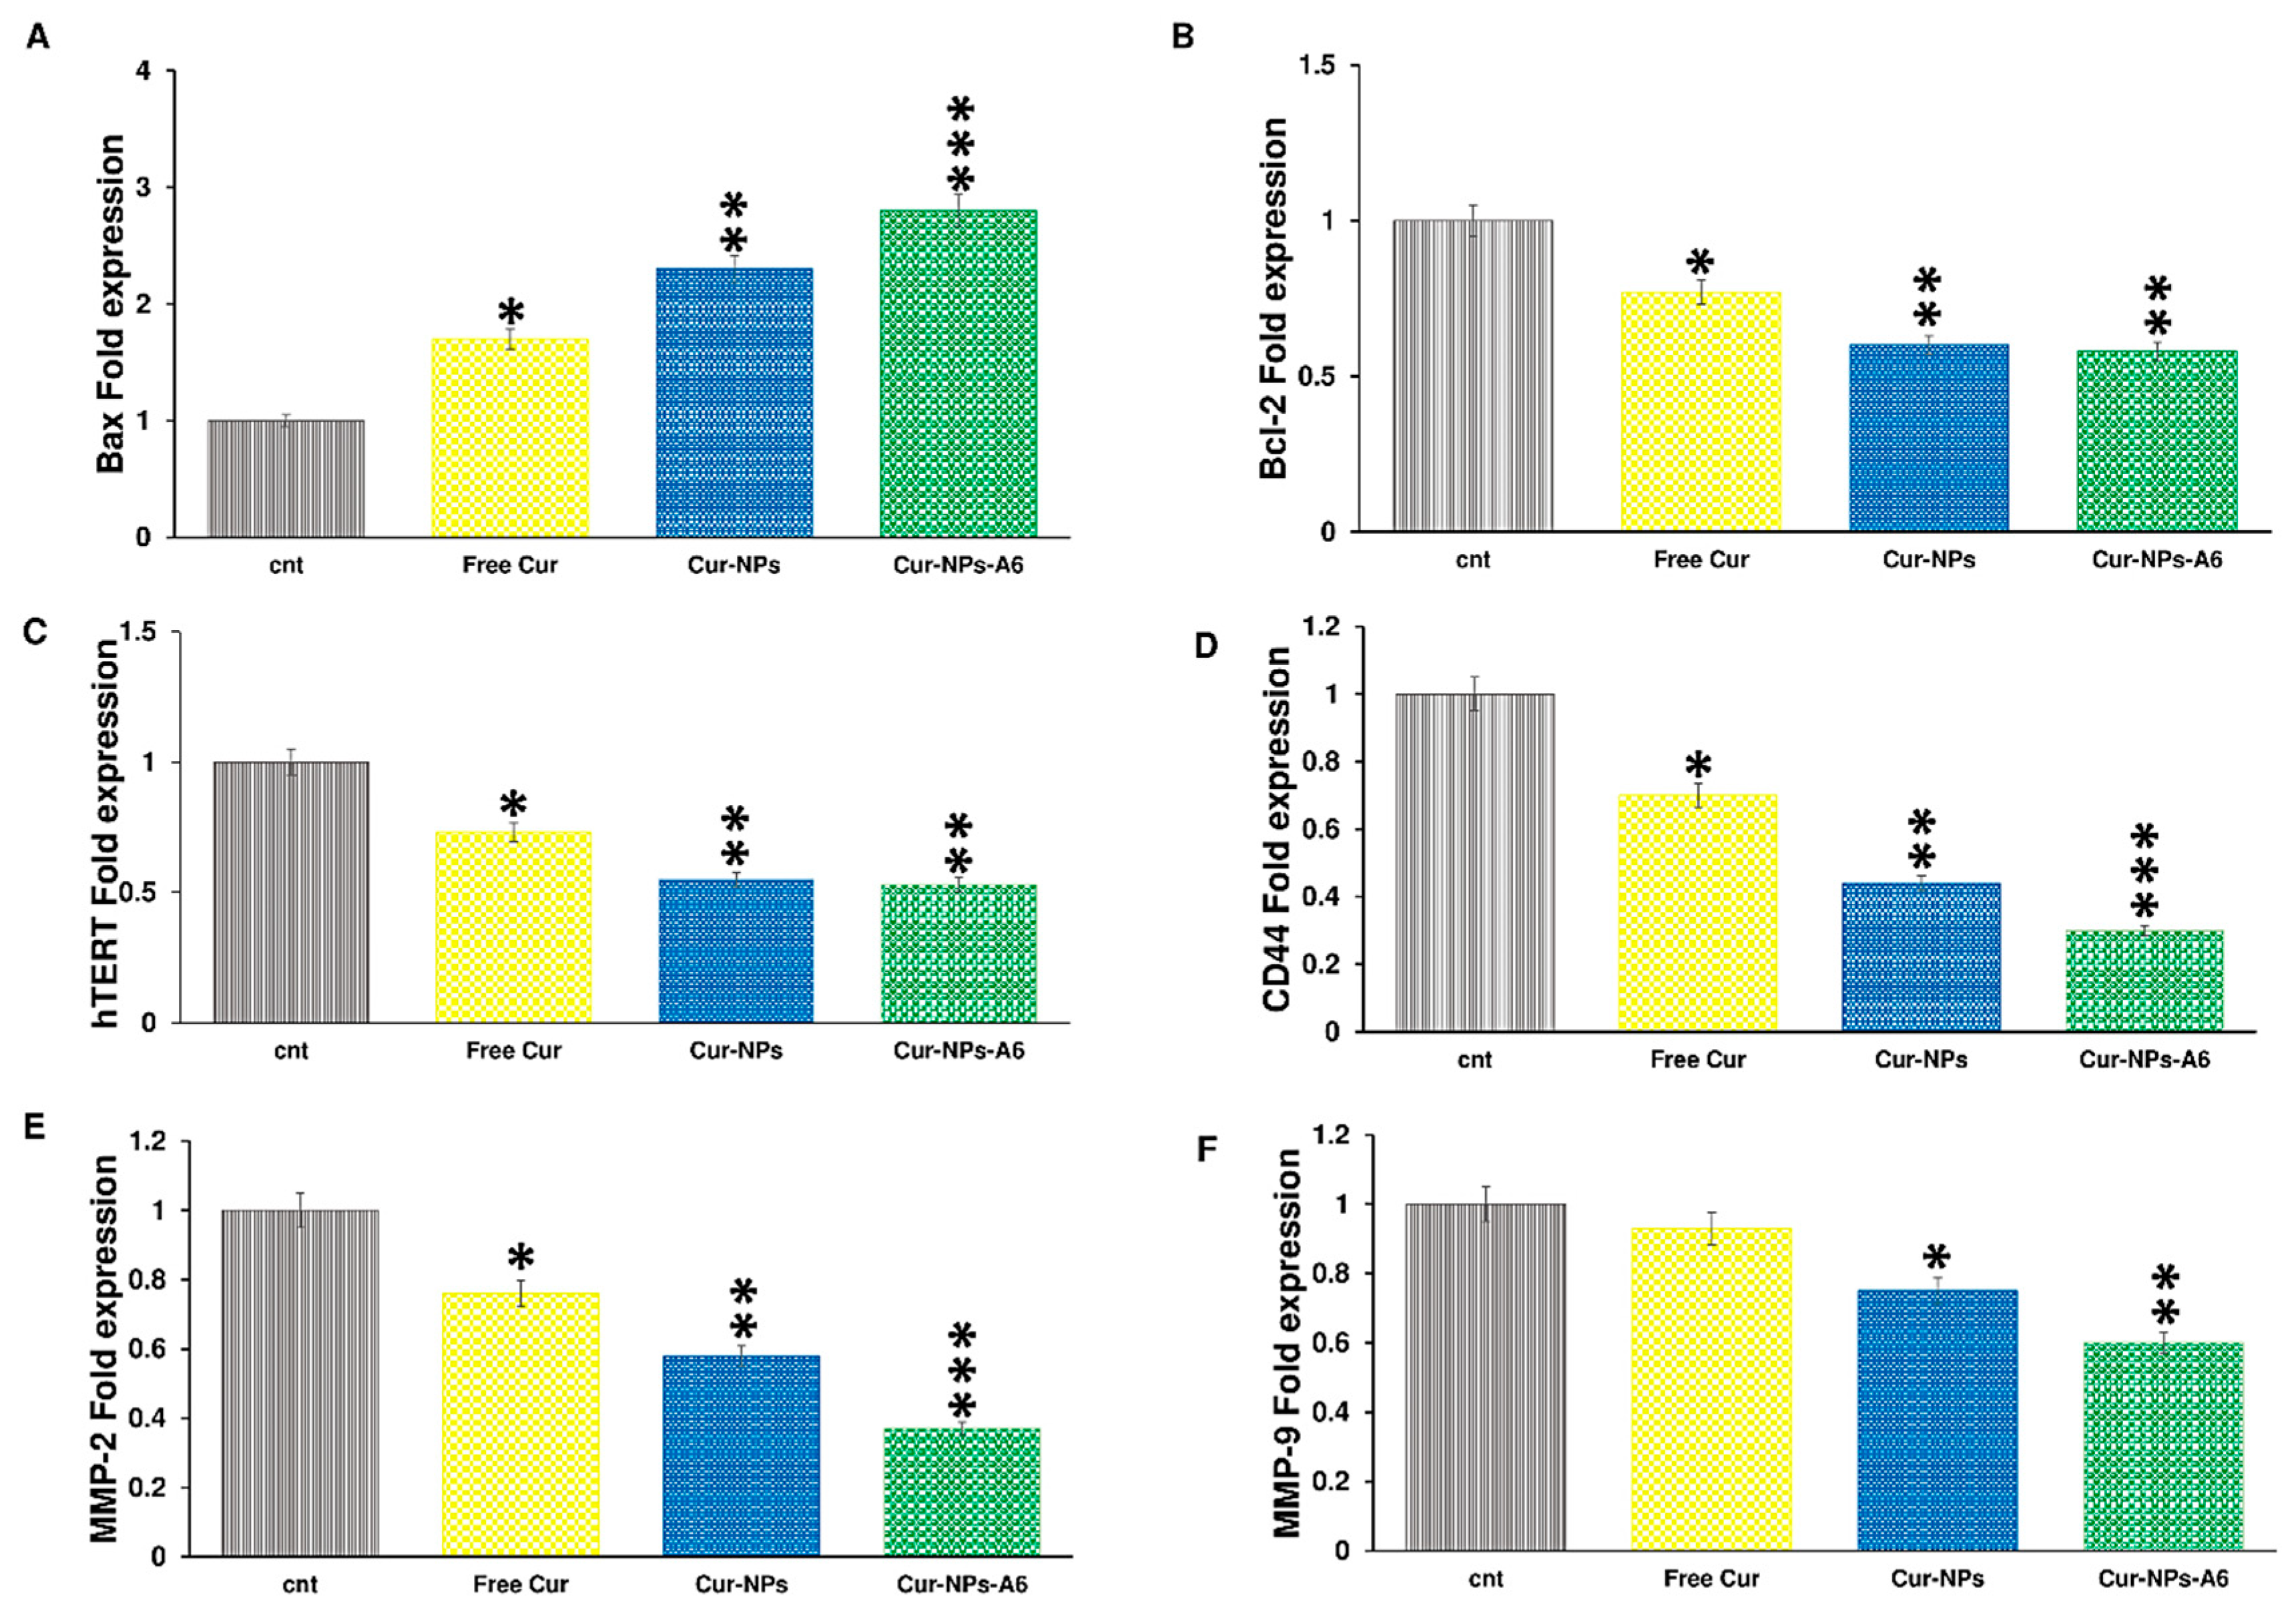
59]. The illustration in
Figure 8 depicts the influence of delivery systems containing Cur on gene expression after 48h of treatment. The fold expression of Bax was increased to 1.7, 2.3, and 2.8 by free Cur, Cur-NPs, and Cur-NPs-A6, respectively. Meanwhile, the fold change of Bcl-2 for free Cur, Cur-NPs, and Cur-NPs-A6 were 0.77, 0.6, and 0.58, respectively. The fold change in hTERT expression was observed to be 0.73, 0.55, and 0.53 for free Cur, Cur-NPs, and Cur-NPs-A6. Furthermore, free Cur and designed NPs demonstrated negative effects on the expression of MMP-2, MMP-9, and CD44. Notably, Cur-NPs-A6 significantly reduced CD44 expression to 0.3, while the fold change of Cur-NPs and free Cur were 0.44 and 0.7, respectively. Compared to control cells, the designed carriers showed reductions in MMP-2 and MMP-9 expression, with Cur-NPs-A6 exhibiting the most significant decrease in expression levels. The expression of MMP-2 was 0.37-fold less in the Cur-NPs-A6 group, 0.58-fold less for Cur-NPs, and 0.76-fold less for free Cur-treated cells. For MMP-9, Cur-NPs-A6 reduced its expression to 0.6, Cur-NPs to 0.75, and free Cur to 0.93 compared to control cells.
3.6. Invasion Assay
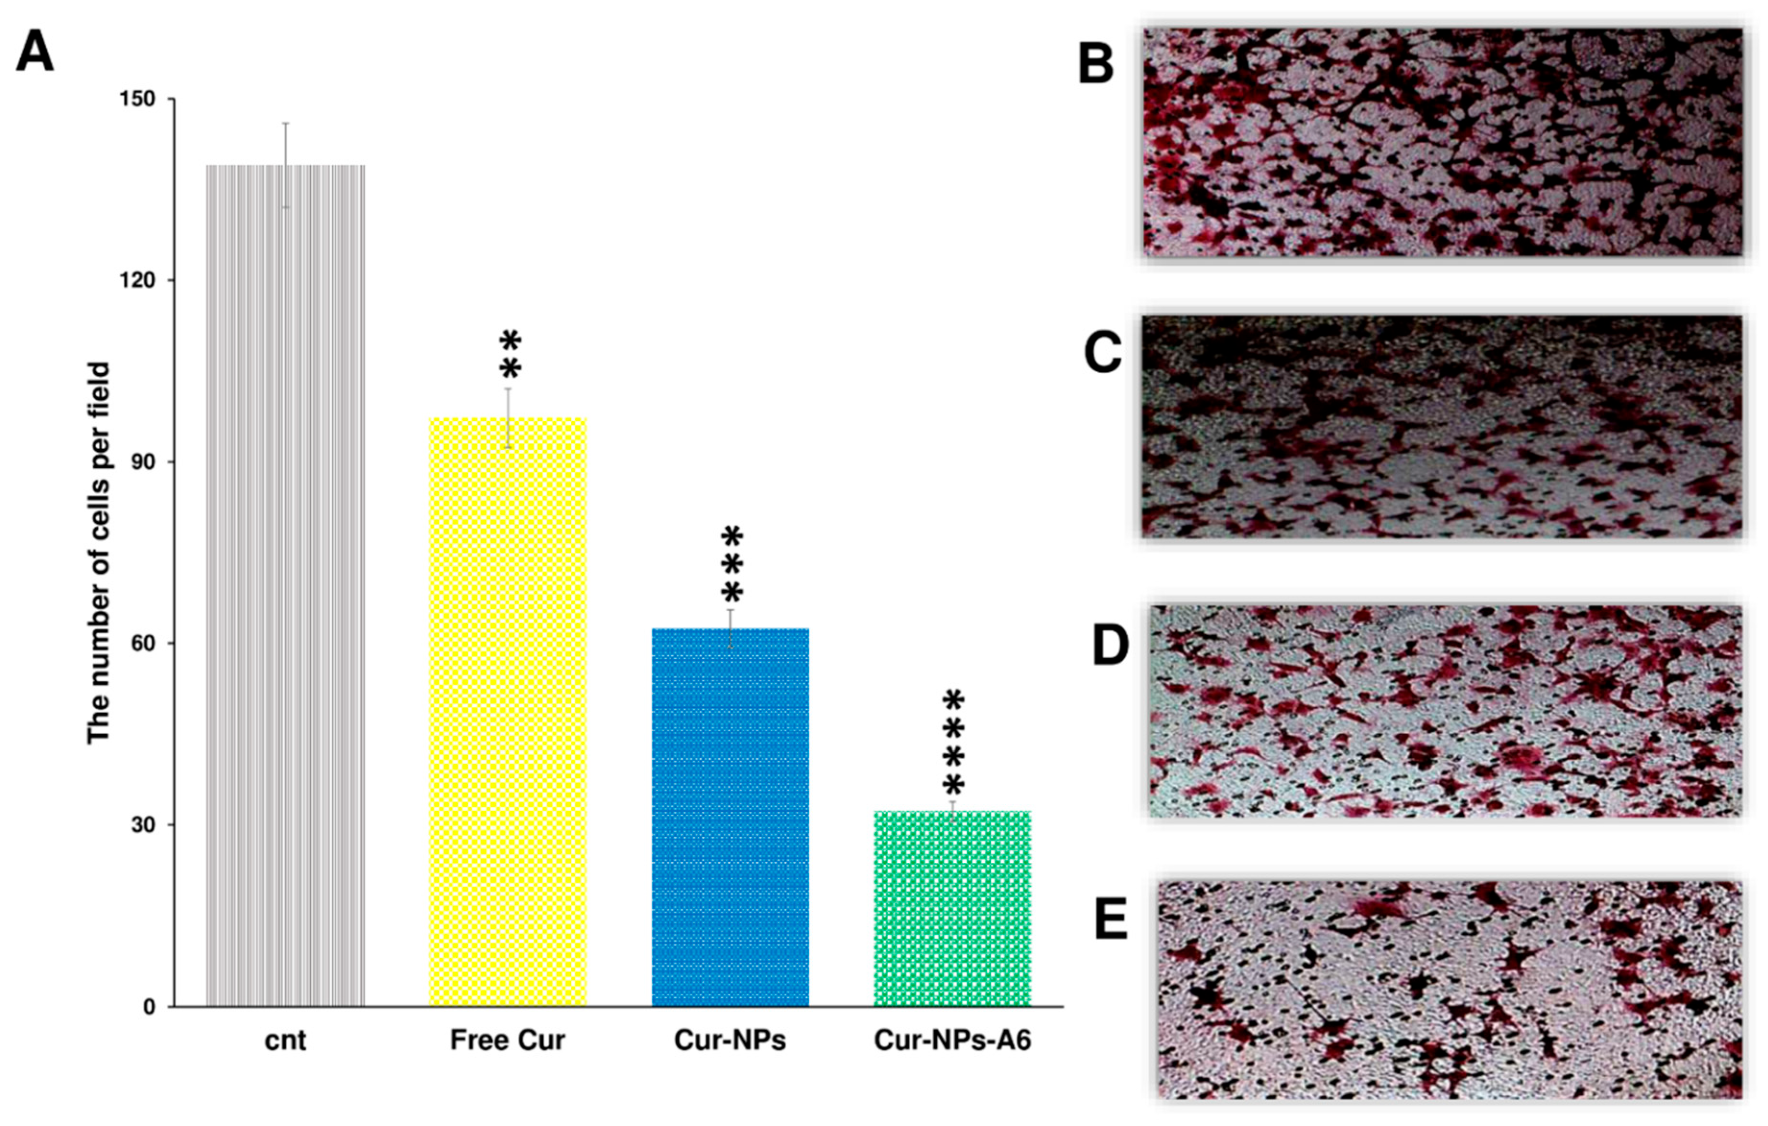
To assess the impact of Cur and NPs on MDA-MB-231 cell invasion, an invasion analysis was conducted (
Figure 9). Seven snapshots were taken from each insert, and the average was calculated for all groups. The results revealed that free Cur, Cur-NPs, and Cur-NPs-A6 all exhibited inhibitory effects on tumor cell invasion, consistent with the gene expression analysis. Notably, the Cur-NPs-A6 group demonstrated the most potent anti-invasion effect compared to the other treated groups. Specifically, the average number of cells observed in the fields were 139.3 ± 5.12 for the control group, 97.2 ± 4.18 for the free Cur group, 62.4 ± 3.15 for the Cur-NPs group, and 32.2 ± 2.82 for the Cur-NPs-A6 group.
4. Discussion
The FT-IR and ¹H-NMR spectra confirmed the successful synthesis of the polymers and the peptide conjugation [
60]. Also, the SEM analysis provided evidence of successful NP preparation; the images revealed well-formed, spherical NPs. This observation suggests that the synthesis process successfully produced particles with the desired shape. [
61]. As evidenced by the Zeta results, initially, the NPs exhibited a negative charge. However, upon incorporating Cur and peptide into the system, the polarity of the Cur-NPs and Cur-NPs-A6 decreased. This decrease in polarity can be attributed to the non-polar characteristics of Cur and the electrostatic features of the peptide, contributing to the formation of a less polar surface [
62]. Moreover, the contact angle analysis confirmed the NPs' polarity. Upon incorporating the peptide into the system, the angle increased to 31.53°, but it was remained within the hydrophilic range. This indicates that both NPs and NPs-A6 act as hydrophilic carriers, potentially enhancing the distribution of Cur in aqueous environments such as blood [
63,
64].
Given that Cur is a hydrophobic anticancer compound, its loading and release in a PBS solution were anticipated to be suboptimal [
63]. As a result, a stock solution containing ethanol was used to examine the DL% and EE%. The data revealed a significant loading rate of Cur in the NPs. When the NPs were conjugated with the A6 peptide, the loading rate increased further, likely due to hydrogen bond formation between Cur and the NP-A6 surface. This improvement in DL% and EE% of Cur in the designed NPs could be one of the factors contributing to their better efficacy on the studied cells. Moreover, the release profile of NPs followed the Higuchi law [
65], suggesting that diffusion predominantly governs the release of Cur [
66]. Actually by confining Cur within the hydrophobic core of the NPs, a more moderated and gradual release can be achieved [
67]. Typically, free Cur delivery systems display a two-phase release graph characterized by a burst release phase, followed by a slow and sustained release phase [
68,
69]. In our investigation, a similar condition was observed, but the designed NPs exhibited a linear increase in Cur release over four days, with no burst release observed. Additionally, the rate of Cur diffusion was greater than the rate of solvent transport. Sustained release is critical for delivery and improving side effects, so it can be expected that the designed system, by controlling the release of Cur, would decrease its undesirable effects on normal cells.
Given that the cytotoxicity of anticancer treatments is crucial for their further biomedical applications, MTT assay was carried out. Cytotoxicity experiments were conducted on the MCF-10A and MDA-MB-231 cell lines to confirm the improved specific targeting of Cur using the novel NPs due to the different CD44 expression levels in these cells. Free Cur, Cur-NPs, and Cur-NPs-A6 revealed significant differences in the MTT assay. According to the results depicted in
Figure 7, MCF-10A cells exhibited a dose-dependent cytotoxicity effect when treated with free Cur 48h. In contrast, minimal cytotoxicity was observed in MCF-10A cell lines treated with Cur-NPs and Cur-NPs-A6. Although the designed system has a similar effect on MCF-10A cells at high concentrations, A6-functionalized NPs exhibit lower cytotoxicity at low and middle concentrations. This may be related to the level and pattern of CD44 expression in this cell line [
70]. Additionally, Cur-NPs, and particularly Cur-NPs-A6, demonstrated stronger cytotoxicity against MDA-MB-231 cancer cells compared to free Cur. In contrast to the MCF-10A results, Cur-NPs-A6 exhibited higher toxicity against MDA-MB-231 cells at elevated doses compared to Cur-NPs, likely due to the high CD44 expression on the surface of MDA-MB-231 cells [
71]. This increased toxicity might result from the saturation of non-specific cell membrane trafficking pathways, leaving the A6-CD44 interaction as the primary mechanism for polymer internalization. While NPs improve cell penetration, NPs-A6, with their higher specificity for these cells and enhanced drug release, further increase both Cur penetration and its effects on the cells. Overall, the results of this study reveal that the designed systems, by controlling release and improving specific targeting, can enhance Cur's efficacy while reducing its side effects [
72].
In this study, the expression of genes related to apoptosis and cell invasion were examined. The presence of free Cur led to an increase in Bax expression, but this increase was more significant in the groups treated with Cur-NP and Cur-NP-A6. This increase could be attributed to improved membrane penetration and the gradual release of Cur from the NPs, resulting in a more prolonged effect on the studied cells [
73]. On the other hand, the designed systems showed a higher reduction in Bcl-2 and hTERT expression compared to free Cur. Considering that Cur-NPs-A6 and Cur-NPs have similar effects on Bcl-2 and hTERT expression, and differ only in their impact on Bax expression, the improved toxicity profile of Cur-NPs-A6 in cytotoxicity assays reflects the complexity of apoptosis pathways. This suggests that other intrinsic and extrinsic apoptosis-related genes may be involved in the apoptosis triggered by A6-functionalized NPs. Therefore, further studies are needed to explore this in more detail. Additionally, the suppression of MMP-2, MMP-9, and CD44 expression was greater in the Cur-NPs and Cur-NPs-A6 groups than in the free Cur group. Compared to the Cur-NPs group, Cur-NPs-A6 offers several advantages, including an improved release profile and a higher affinity of A6 for CD44, which leads to greater bioavailability and more specific interactions with target cells. Overall, since Bax, Bcl-2, and hTERT play crucial roles in apoptosis induction [
74], and CD44, MMP-2, and MMP-9 are associated with invasion and metastasis [
75], it is expected that the designed systems will act as effective carriers, enhancing the anticancer effects of Cur.
5. Conclusions
In conclusion, this study underscores the potential of using PCL-PEG nanocarriers functionalized with A6 peptides for the targeted delivery of Cur to MDA-MB-231 cells. By employing such a delivery system, significant enhancements in the solubility, bioavailability, and therapeutic efficacy of Cur were achieved, as evidenced by the results from various assays and characterization techniques. The incorporation of Cur into the polymer matrix not only facilitated a controlled and sustained release profile but also mitigated the initial burst release commonly observed with free Cur. Furthermore, the functionalization with A6 peptides enhanced the specificity of the nanocarriers towards cancer cells, thereby improving the therapeutic index and reducing potential side effects. The MTT assay demonstrated that Cur-NPs and Cur-NPs-A6 exhibited a dose-dependent cytotoxic effect on MDA-MB-231 cells, while having minimal impact on MCF-10A cells, indicating a favorable safety profile.
The gene expression analysis and invasion assays provided additional insights into the mechanisms through which these nanocarriers exert their anticancer effects, highlighting the ability of Cur-NPs-A6 to downregulate key oncogenic pathways and inhibit invasive behaviors in cancer cells. These findings collectively suggest that the developed PCL-PEG-A6 nanocarrier system holds promise as an effective and safer alternative for breast cancer therapy. Overall, the study presents a comprehensive approach to addressing the limitations of conventional chemotherapy by leveraging the advantages of nanotechnology and targeted delivery. Future research should focus on further optimizing the nanocarrier formulations, exploring their efficacy in in vivo models, and evaluating their potential for clinical applications.
Author Contributions
Conceptualization: N.R. and M.M.G.; methodology: N.R. and H.N.; software: N.R., M.M.G., and H.N.; validation: A.M. and P.T.; formal analysis: A.G. and H.N.; investigation: N.R., A.G., H.N., Z.S.R., A.M., P.T., and M.M.G.; data curation: N.R., A.G., H.N., Z.S.R., A.M., A.N., and M.M.G.; writing—original draft preparation: N.R., A.G., and H.N.; writing—review and editing: N.R., A.G., H.N., M.M.G., P.T., and V.N.U.; visualization: A.G.; supervision: N.R. and M.M.G. All authors have read and agreed to the published version of the manuscript.
Data Availability Statement
The authors confirm that the data supporting the findings of this study are available within the article.
Acknowledgments
This work is dedicated to Professor Maryam Mirzakhani.
Conflict of interest
There are no conflicts of interest to declare.
References
- Anand, U., et al., Cancer chemotherapy and beyond: Current status, drug candidates, associated risks and progress in targeted therapeutics. Genes & Diseases, 2023. 10(4): p. 1367-1401.
- Zaer, M., et al., Doxorubicin-loaded Niosomes functionalized with gelatine and alginate as pH-responsive drug delivery system: A 3D printing approach. International Journal of Biological Macromolecules, 2023. 253: p. 126808.
- Nurgali, K., R.T. Jagoe, and R. Abalo, Editorial: Adverse Effects of Cancer Chemotherapy: Anything New to Improve Tolerance and Reduce Sequelae? Front Pharmacol, 2018. 9: p. 245.
- Feliu, J., et al., Can we avoid the toxicity of chemotherapy in elderly cancer patients? Crit Rev Oncol Hematol, 2018. 131: p. 16-23.
- Rostami, N., et al., Synthesis and Characterization of Folic Acid-Functionalized DPLA-co-PEG Nanomicelles for the Targeted Delivery of Letrozole. ACS Applied Bio Materials, 2023. 6(5): p. 1806-1815. [CrossRef]
- Rostami, N., et al., Exploring Advanced CRISPR Delivery Technologies for Therapeutic Genome Editing. Small Science. n/a(n/a): p. 2400192. [CrossRef]
- Sun, L., et al., Smart nanoparticles for cancer therapy. Signal Transduction and Targeted Therapy, 2023. 8(1): p. 418.
- Edis, Z., et al., Nanocarriers-Mediated Drug Delivery Systems for Anticancer Agents: An Overview and Perspectives. Int J Nanomedicine, 2021. 16: p. 1313-1330.
- Ciuca, M.D. and R.C. Racovita, Curcumin: Overview of Extraction Methods, Health Benefits, and Encapsulation and Delivery Using Microemulsions and Nanoemulsions. Int J Mol Sci, 2023. 24(10). [CrossRef]
- Rostami, N. and R. Davarnejad, Characterization of folic acid-functionalized PLA-PEG nanomicelle to deliver Letrozole: A nanoinformatics study. IET Nanobiotechnol, 2022. 16(4): p. 103-114. [CrossRef]
- Behl, A., et al., Biodegradable PEG-PCL Nanoparticles for Co-delivery of MUC1 Inhibitor and Doxorubicin for the Confinement of Triple-Negative Breast Cancer. J Polym Environ, 2023. 31(3): p. 999-1018. [CrossRef]
- Luo, D., et al., MPEG-PCL Nanomicelles Platform for Synergistic Metformin and Chrysin Delivery to Breast Cancer in Mice. Anticancer Agents Med Chem, 2022. 22(2): p. 280-293. [CrossRef]
- Firouzai-Amandi, A., et al., Development, Characterization, and In Vitro Evaluation of Cytotoxic Activity of Rutin Loaded PCL-PEG Nanoparticles Against Skov3 Ovarian Cancer Cell. Asian Pac J Cancer Prev, 2022. 23(6): p. 1951-1957. [CrossRef]
- Ni, R., et al., Dual-modified PCL-PEG nanoparticles for improved targeting and therapeutic efficacy of docetaxel against colorectal cancer. Pharm Dev Technol, 2021. 26(8): p. 910-921.
- Rezaie, P., et al., Evaluation of combined effect of hyperthermia and ionizing radiation on cytotoxic damages induced by IUdR-loaded PCL-PEG-coated magnetic nanoparticles in spheroid culture of U87MG glioblastoma cell line. Int J Radiat Biol, 2018. 94(11): p. 1027-1037.
- Tomeh, M.A., R. Hadianamrei, and X. Zhao, A Review of Curcumin and Its Derivatives as Anticancer Agents. Int J Mol Sci, 2019. 20(5). [CrossRef]
- Hsu, K.Y., C.T. Ho, and M.H. Pan, The therapeutic potential of curcumin and its related substances in turmeric: From raw material selection to application strategies. J Food Drug Anal, 2023. 31(2): p. 194-211. [CrossRef]
- de Waure, C., et al., Exploring the Contribution of Curcumin to Cancer Therapy: A Systematic Review of Randomized Controlled Trials. Pharmaceutics, 2023. 15(4).
- Wang, W., et al., Curcumin in cancer therapy: Exploring molecular mechanisms and overcoming clinical challenges. Cancer Letters, 2023. 570: p. 216332. [CrossRef]
- Mohebian, Z., M. Babazadeh, and N. Zarghami, In Vitro Efficacy of Curcumin-Loaded Amine-Functionalized Mesoporous Silica Nanoparticles against MCF-7 Breast Cancer Cells. Adv Pharm Bull, 2023. 13(2): p. 317-327. [CrossRef]
- Santhamoorthy, M., et al., k-Carrageenan based magnetic@polyelectrolyte complex composite hydrogel for pH and temperature-responsive curcumin delivery. Int J Biol Macromol, 2023. 244: p. 125467. [CrossRef]
- Wang, X., et al., Curcumin induces apoptosis in human hepatocellular carcinoma cells by decreasing the expression of STAT3/VEGF/HIF-1alpha signaling. Open Life Sci, 2023. 18(1): p. 20220618. [CrossRef]
- Do, X.-H., et al., Differential Cytotoxicity of Curcumin-Loaded Micelles on Human Tumor and Stromal Cells. International Journal of Molecular Sciences, 2022. 23(20): p. 12362. [CrossRef]
- Jambhrunkar, S., et al., Mesoporous silica nanoparticles enhance the cytotoxicity of curcumin. RSC Advances, 2014. 4(2): p. 709-712. [CrossRef]
- Moballegh Nasery, M., et al., Curcumin Delivery Mediated by Bio-Based Nanoparticles: A Review. Molecules, 2020. 25(3). [CrossRef]
- Asemaneh, H.R., et al., Functionalized Graphene Oxide/Polyacrylonitrile Nanofibrous Composite: Pb2+ and Cd2+ Cations Adsorption. International Journal of Engineering, 2020. 33(6): p. 1048-1053. [CrossRef]
- Hussain, A., et al., Application of curcumin nanoformulations to target folic acid receptor in cancer: Recent trends and advances. Environ Res, 2023: p. 116476. [CrossRef]
- Li, X., et al., The Peptide Functionalized Inorganic Nanoparticles for Cancer-Related Bioanalytical and Biomedical Applications. Molecules, 2021. 26(11). [CrossRef]
- Sharma, R., et al., Functionalized Peptide-Based Nanoparticles for Targeted Cancer Nanotherapeutics: A State-of-the-Art Review. ACS Omega, 2022. 7(41): p. 36092-36107. [CrossRef]
- Gu, W., et al., A6 peptide-tagged, ultra-small and reduction-sensitive polymersomal vincristine sulfate as a smart and specific treatment for CD44+ acute myeloid leukemia. J Control Release, 2021. 329: p. 706-716. [CrossRef]
- Gomari, M.M., et al., Rational peptide design for targeting cancer cell invasion. Proteins: Structure, Function, and Bioinformatics, 2024. 92(1): p. 76-95. [CrossRef]
- Gu, W., et al., CD44-Specific A6 Short Peptide Boosts Targetability and Anticancer Efficacy of Polymersomal Epirubicin to Orthotopic Human Multiple Myeloma. Adv Mater, 2019. 31(46): p. e1904742. [CrossRef]
- Koh, H.J., et al., Intraocular properties of urokinase-derived antiangiogenic A6 peptide in rabbits. J Ocul Pharmacol Ther, 2004. 20(5): p. 439-49.
- Piotrowicz, R.S., et al., A6 peptide activates CD44 adhesive activity, induces FAK and MEK phosphorylation, and inhibits the migration and metastasis of CD44-expressing cells. Mol Cancer Ther, 2011. 10(11): p. 2072-82. [CrossRef]
- Zhang, C., et al., A6 Peptide-Tagged Core-Disulfide-Cross-Linked Micelles for Targeted Delivery of Proteasome Inhibitor Carfilzomib to Multiple Myeloma In Vivo. Biomacromolecules, 2020. 21(6): p. 2049-2059. [CrossRef]
- Manjili, H.K., et al., Poly(caprolactone)–poly(ethylene glycol)–poly(caprolactone) (PCL–PEG–PCL) nanoparticles: a valuable and efficient system for in vitro and in vivo delivery of curcumin. RSC Advances, 2016. 6(17): p. 14403-14415.
- Wu, K., L. Yu, and J. Ding, Synthesis of PCL–PEG–PCL Triblock Copolymer via Organocatalytic Ring-Opening Polymerization and Its Application as an Injectable Hydrogel—An Interdisciplinary Learning Trial. Journal of Chemical Education, 2020. 97(11): p. 4158-4165. [CrossRef]
- Kulhari, H., et al., Peptide conjugated polymeric nanoparticles as a carrier for targeted delivery of docetaxel. Colloids and Surfaces B: Biointerfaces, 2014. 117: p. 166-173. [CrossRef]
- Chandrasiri, I., et al., Reproducible and controlled peptide functionalization of polymeric nanoparticles. Frontiers in Biomaterials Science, 2022. 1. [CrossRef]
- Rostami, N., et al., Design, Synthesis, and Comparison of PLA-PEG-PLA and PEG-PLA-PEG Copolymers for Curcumin Delivery to Cancer Cells. Polymers, 2023. 15(14): p. 3133. [CrossRef]
- Patra, J.K., et al., Nano based drug delivery systems: recent developments and future prospects. Journal of Nanobiotechnology, 2018. 16(1): p. 71. [CrossRef]
- Nosrati, H., et al., Synthesis, characterization, and kinetic release study of methotrexate loaded mPEG–PCL polymersomes for inhibition of MCF-7 breast cancer cell line. Pharmaceutical Development and Technology, 2019. 24(1): p. 89-98.
- Phan, Q.T., et al., Characteristics and cytotoxicity of folate-modified curcumin-loaded PLA-PEG micellar nano systems with various PLA:PEG ratios. Int J Pharm, 2016. 507(1-2): p. 32-40. [CrossRef]
- Samrot, A.V., et al., Synthesis of curcumin loaded polymeric nanoparticles from crab shell derived chitosan for drug delivery. Informatics in Medicine Unlocked, 2018. 10: p. 159-182. [CrossRef]
- Zatorska-Płachta, M., et al., Encapsulation of Curcumin in Polystyrene-Based Nanoparticles—Drug Loading Capacity and Cytotoxicity. ACS Omega, 2021. 6(18): p. 12168-12178. [CrossRef]
- Liu, Y., et al., Development of High-Drug-Loading Nanoparticles. Chempluschem, 2020. 85(9): p. 2143-2157.
- Chen, K., et al., Preparation and Characterization of Size-Controlled Nanoparticles for High-Loading λ-Cyhalothrin Delivery through Flash Nanoprecipitation. Journal of Agricultural and Food Chemistry, 2018. 66(31): p. 8246-8252. [CrossRef]
- Chang, G., et al., CD44 targets Na(+)/H(+) exchanger 1 to mediate MDA-MB-231 cells' metastasis via the regulation of ERK1/2. Br J Cancer, 2014. 110(4): p. 916-27.
- Khosropanah, M.H., et al., Analysis of the Antiproliferative Effects of Curcumin and Nanocurcumin in MDA-MB231 as a Breast Cancer Cell Line. Iran J Pharm Res, 2016. 15(1): p. 231-9.
- Rio, D.C., et al., Purification of RNA using TRIzol (TRI reagent). Cold Spring Harb Protoc, 2010. 2010(6): p. pdb.prot5439. [CrossRef]
- Khanna, P., K.L. Johnson, and J.L. Maron, Optimal reference genes for RT-qPCR normalization in the newborn. Biotech Histochem, 2017. 92(7): p. 459-466.
- Bustin, S.A., et al., Quantitative real-time RT-PCR--a perspective. J Mol Endocrinol, 2005. 34(3): p. 597-601.
- Pfaffl, M.W., A new mathematical model for relative quantification in real-time RT-PCR. Nucleic Acids Res, 2001. 29(9): p. e45. [CrossRef]
- Pijuan, J., et al., In vitro Cell Migration, Invasion, and Adhesion Assays: From Cell Imaging to Data Analysis. Front Cell Dev Biol, 2019. 7: p. 107. [CrossRef]
- Ranstam, J., Hypothesis-generating and confirmatory studies, Bonferroni correction, and pre-specification of trial endpoints. Acta orthopaedica, 2019. 90(4): p. 297-297. [CrossRef]
- Manjili, H.K., et al., In vitro and in vivo delivery of artemisinin loaded PCL-PEG-PCL micelles and its pharmacokinetic study. Artif Cells Nanomed Biotechnol, 2018. 46(5): p. 926-936.
- Khanmohammadi, M.R., et al., Methoxy poly(ethylene glycol)-block-polycaprolactone copolymer: formulation and optimization by experimental design; determination of diblock molar mass by multivariate regression analysis of 1H NMR spectra. Analytical Methods, 2013. 5(11): p. 2840-2847. [CrossRef]
- Araveti, P.B. and A. Srivastava, Curcumin induced oxidative stress causes autophagy and apoptosis in bovine leucocytes transformed by Theileria annulata. Cell Death Discovery, 2019. 5(1): p. 100. [CrossRef]
- Wang, J.B., et al., Curcumin induces apoptosis through the mitochondria-mediated apoptotic pathway in HT-29 cells. J Zhejiang Univ Sci B, 2009. 10(2): p. 93-102. [CrossRef]
- Rozenberg, M., et al., Spectroscopic FTIR and NMR study of the interactions of sugars with proteins. Spectrochimica Acta Part A: Molecular and Biomolecular Spectroscopy, 2019. 222: p. 116861. [CrossRef]
- Yao, Y., et al., Nanoparticle-Based Drug Delivery in Cancer Therapy and Its Role in Overcoming Drug Resistance. Front Mol Biosci, 2020. 7: p. 193. [CrossRef]
- Freire, J.M., et al., Using zeta-potential measurements to quantify peptide partition to lipid membranes. Eur Biophys J, 2011. 40(4): p. 481-7. [CrossRef]
- Moyano, D.F., et al., Nanoparticle Hydrophobicity Dictates Immune Response. Journal of the American Chemical Society, 2012. 134(9): p. 3965-3967. [CrossRef]
- Maestro, A., et al., Contact angle of micro- and nanoparticles at fluid interfaces. Current Opinion in Colloid & Interface Science, 2014. 19(4): p. 355-367. [CrossRef]
- Siepmann, J. and N.A. Peppas, Higuchi equation: derivation, applications, use and misuse. Int J Pharm, 2011. 418(1): p. 6-12. [CrossRef]
- Weng, J., H.H.Y. Tong, and S.F. Chow, In Vitro Release Study of the Polymeric Drug Nanoparticles: Development and Validation of a Novel Method. Pharmaceutics, 2020. 12(8). [CrossRef]
- Bhawana, et al., Curcumin Nanoparticles: Preparation, Characterization, and Antimicrobial Study. Journal of Agricultural and Food Chemistry, 2011. 59(5): p. 2056-2061.
- Huang, Y., et al., Curcumin encapsulated zein/caseinate-alginate nanoparticles: Release and antioxidant activity under in vitro simulated gastrointestinal digestion. Current Research in Food Science, 2023. 6: p. 100463. [CrossRef]
- Luss, A.L., et al., Toxicity Evaluation and Controlled-Release of Curcumin-Loaded Amphiphilic Poly-N-vinylpyrrolidone Nanoparticles: In Vitro and In Vivo Models. Pharmaceutics, 2024. 16(1): p. 8. [CrossRef]
- Agus, D.B., et al., A physical sciences network characterization of non-tumorigenic and metastatic cells. Scientific Reports, 2013. 3(1): p. 1449. [CrossRef]
- Sheridan, C., et al., CD44+/CD24- breast cancer cells exhibit enhanced invasive properties: an early step necessary for metastasis. Breast Cancer Res, 2006. 8(5): p. R59.
- Liu, D. and Z. Chen, The effect of curcumin on breast cancer cells. J Breast Cancer, 2013. 16(2): p. 133-7. [CrossRef]
- Shishodia, S., Molecular mechanisms of curcumin action: gene expression. Biofactors, 2013. 39(1): p. 37-55. [CrossRef]
- Elmore, S., Apoptosis: a review of programmed cell death. Toxicol Pathol, 2007. 35(4): p. 495-516. [CrossRef]
- Chen, C., et al., The biology and role of CD44 in cancer progression: therapeutic implications. J Hematol Oncol, 2018. 11(1): p. 64. [CrossRef]
Figure 1.
Schematic representation of the PCL-PEG and PCL-PEG-A6 preparation steps.
Figure 1.
Schematic representation of the PCL-PEG and PCL-PEG-A6 preparation steps.
Figure 2.
Characterization of systems. Transmittance FT-IR spectra of ε-Caprolactone, Ethylene glycol, PCL-PEG, and PCL-PEG-A6 (A), 1H-NMR spectrum of PCL-PEG (B) and PCL-PEG-A6 (C) in CDCl3, and Average particle size diameter (D).
Figure 2.
Characterization of systems. Transmittance FT-IR spectra of ε-Caprolactone, Ethylene glycol, PCL-PEG, and PCL-PEG-A6 (A), 1H-NMR spectrum of PCL-PEG (B) and PCL-PEG-A6 (C) in CDCl3, and Average particle size diameter (D).
Figure 3.
SEM of NPs (A); representation of contact Angle of NPs (B), Cur-NPs (C), and Cur-NPs-A6 (D). The values represent the mean ± SD, and the data were analyzed using one-way ANOVA (n = 3, **p< 0.01, ***p< 0.001) (E).
Figure 3.
SEM of NPs (A); representation of contact Angle of NPs (B), Cur-NPs (C), and Cur-NPs-A6 (D). The values represent the mean ± SD, and the data were analyzed using one-way ANOVA (n = 3, **p< 0.01, ***p< 0.001) (E).
Figure 4.
Standard curve of Cur (A), In vitro cumulative release of free Cur, Cur-NPs, and Cur-NPs-A6 in PBS (pH 7.4) at 37°C (B).
Figure 4.
Standard curve of Cur (A), In vitro cumulative release of free Cur, Cur-NPs, and Cur-NPs-A6 in PBS (pH 7.4) at 37°C (B).
Figure 5.
Kinetics of Cur release. Zero-order kinetics (A), First-order kinetics (B), Higuchi model (C), and Peppas and Korsmeyer model (D) for Cur-NPs.
Figure 5.
Kinetics of Cur release. Zero-order kinetics (A), First-order kinetics (B), Higuchi model (C), and Peppas and Korsmeyer model (D) for Cur-NPs.
Figure 6.
Kinetics of Cur release. Zero-order kinetics (A), First-order kinetics (B), Higuchi model (C), and Peppas and Korsmeyer model (D) for Cur-NPs-A6.
Figure 6.
Kinetics of Cur release. Zero-order kinetics (A), First-order kinetics (B), Higuchi model (C), and Peppas and Korsmeyer model (D) for Cur-NPs-A6.
Figure 7.
Evaluating the cytotoxic effect of NPs, NPs-A6, free Cur, Cur-NPs, and Cur-NPs-A6 at various Cur concentrations against MDA-MB-231 (A) and MCF-10A (B) cells after 48h. The values represent the mean ± SD, and the data were analyzed using one-way ANOVA (n=3, *p<0.05, **p<0.01, ***p<0.001).
Figure 7.
Evaluating the cytotoxic effect of NPs, NPs-A6, free Cur, Cur-NPs, and Cur-NPs-A6 at various Cur concentrations against MDA-MB-231 (A) and MCF-10A (B) cells after 48h. The values represent the mean ± SD, and the data were analyzed using one-way ANOVA (n=3, *p<0.05, **p<0.01, ***p<0.001).
Figure 8.
Quantification of changes in gene expression after treatment with free Cur and designed systems over a 48h time interval: (A) Bax, (B) Bcl-2, (C) hTERT, (D) CD44, (E) MMP-2, and (F) MMP-9. Results represent the means ± SD of three independent experiments (n=3, *p<0.05, **p<0.01, ***p<0.001).
Figure 9.
The number of cells invaded per field for the studied group after 48h (A). Representation of the invasion field captured for Control (B), Free Cur group (C), Cur-NPs group (D), and Cur-NPs-A6 group (E). The results represent the means ± SD of three different experiments (n=3, **p<0.01, ***p<0.001, ****p<0.0001).
Table 1.
Designed primers for target genes.
Table 1.
Designed primers for target genes.
| Gene name |
Primer sequence |
Strand |
Product size |
GAPDH |
TGGAAGGACTCATGACCACA |
Plus |
119 |
| AGAGGCAGGGATGATGTTCT |
Minus |
Bcl-2 |
TGGGATCGTTGCCTTATGCA |
Plus |
101 |
| GTCTACTTCCTCTGTGATGTTGT |
Minus |
hTERT |
GTCTACTTCCTCTGTGATGTTGT |
Plus |
128 |
| CCGGCATCTGAACAAAAGCC |
Minus |
BAX |
AAACTGGTGCTCAAGGCCC |
Plus |
81 |
| AGAGGCAGGGATGATGTTCT |
Minus |
MMP-2 |
TGGATACCCCTTTGACGGTAAG |
Plus |
137 |
| CATACTTCACACGGACCACTTG |
Minus |
MMP-9 |
GATGCCTGCAACGTGAACAT |
Plus |
88 |
| AGAATCGCCAGTACTTCCCATC |
Minus |
CD44 |
GCTTCAATGCTTCAGCTCCA |
Plus |
71 |
| TCCATCAAAGGCATTGGGCA |
Minus |
Table 2.
Size, PDI, and Zeta Potential for studied systems.
Table 2.
Size, PDI, and Zeta Potential for studied systems.
| Parameter |
NPs |
Cur-NPs |
Cur-NPs-A6 |
| Average size (nm) |
54.3 |
67.6 |
76.4 |
| PDI |
0.32 |
0.34 |
0.39 |
| Zeta Potential (mV) |
-32.7 |
-12.6 |
-13.8 |
|
Disclaimer/Publisher’s Note: The statements, opinions and data contained in all publications are solely those of the individual author(s) and contributor(s) and not of MDPI and/or the editor(s). MDPI and/or the editor(s) disclaim responsibility for any injury to people or property resulting from any ideas, methods, instructions or products referred to in the content. |
© 2024 by the authors. Licensee MDPI, Basel, Switzerland. This article is an open access article distributed under the terms and conditions of the Creative Commons Attribution (CC BY) license (http://creativecommons.org/licenses/by/4.0/).
