Preprint
Article

A Shortcut From Genome to Drug: The Employment of Bioinformatic Tools to Find New Targets for Gastric Cancer Treatment

Altmetrics

Downloads

106

Views

51

Comments

0

A peer-reviewed article of this preprint also exists.

Submitted:

14 August 2023

Posted:

15 August 2023

You are already at the latest version

Alerts
Abstract
Gastric cancer (GC) is a highly heterogeneous, complex disease and the fifth most common cancer worldwide (about one million cases and 784 000 deaths worldwide in 2018). CG is lately diagnosed and guarantees a poor prognosis for GC (the 5-year survival rate is less than 20%, but in early detection can reach 90%). This study evaluated the transcriptional profile in tumor gastric samples to find genes highly expressed during tumor establishment and use the related proteins as targets to find new anticancer molecules. Data was collected at Gene Expression Omnibus (GEO) bank to obtain 3 dataset matrices that analyze gastric tumor tissue versus normal gastric tissue, performed microarray using GPL570 platform, and from different sources. The genes found in silico analysis were confirmed in several lines of GC cells by RT-qPCR. The protein data bank was used to find the correspondent proteins. Then a structural-based virtual screening was done to find molecules, and docking analysis was done using the DockThor server. Our results of transcriptomic analysis, together with RT-qPCR, confirm the high expression of the genes AJUBA, FBXL13, CCDC69, CD80 and NOLC1 in GC lines. Based on that, the correspondent proteins were used in SBVS analysis. Five molecules, one each target, MCULE-2386589557-0-6, MCULE-7343047040-0-1, MCULE-5230409338-0-3, MCULE-9178344200-0-1 and MCULE -5881513100-0-29. All molecules have favorable pharmacokinetic, pharmacodynamic and toxicological properties. Molecular docking analysis revealed that the molecules interact with proteins in critical sites for their activity. Using a virtual screening approach, a molecular docking study was performed for proteins encoded by genes that play important roles in cellular functions for carcinogenesis. Combining a systematic collection of public microarray data with a comparative meta-profiling, RT-qPCR, SBVS, and molecular docking analysis provided a suitable approach to find genes involved in GC and work the correspondent protein to strive for new molecules with anticancer properties.
Keywords: 
Subject: Biology and Life Sciences  -   Biochemistry and Molecular Biology

1. Introduction

Gastric cancer (GC) is a complex and multifactorial disease caused by genetic, epigenetic, and environmental influences [1]. Although a worldwide decline in incidence and mortality rates has been observed in recent decades, GC still constitutes a significant burden and significantly impacts populations in developing countries. Current statistics reveal that GC is the third most common malignancy and the fourth leading cause of cancer-related mortality worldwide, accounting for more than 768,000 deaths in 2020 [2,3]. The National Cancer Institute (INCA) estimates for Brazil 13,340 new cases of GC in men and 8,140 in women in the three years from 2023 to 2025. These values correspond to an estimated risk of 12.63 new cases per 100,000 men and 7.36 per 100,000 women [4].
Most gastric cancers are adenocarcinomas. According to Lauren’s classification, these represent more than 95% of all gastric malignancies and can be subdivided into intestinal and diffuse types. This classification is based on the histology of the tumor [5]. The intestinal type consists of differentiated cancer with a tendency to form glands. It progresses mainly through successive changes in the normal gastric mucosa, leading to acute and chronic gastritis, atrophic gastritis, intestinal metaplasia, dysplasia and a gastric tumor [5].
The standard treatment for gastric cancer is based on the triad: surgery, chemotherapy and radiotherapy. Surgical resection is considered the primary method of treatment at an early stage and the only potentially curative approach in treating gastric cancer. However, recurrence is frequently observed in many patients, even after resection. Faced with this problem, a study of 206 patients with gastric cancer revealed that patients in stages II and III had better survival rates with adjuvant chemotherapy than surgery alone [6]. Over two decades ago, Phase II clinical studies have shown that neoadjuvant chemotherapy can increase tumor resection success rate by 72 to 87% [7,8].
Various chemotherapeutic drugs and therapeutic schemes are approved for the pharmacological treatment of gastric cancer. Some of these therapeutic schemes are well described in the literature: the FLOT scheme (5-fluorouracil, Leucovorin, Oxaliplatin and Taxane), the ECF scheme (epirubicin, cisplatin and fluorouracil), FOLFOX (5-fluorouracil, leucovorin and oxaliplatin), infusional cisplatin (CF) and single-drug regimen with irinotecan [9,10].
Nowadays, two problems related to drugs for GC need to be solved: 1) the high toxicity of drugs to patients; and 2) the resistance of GC cells to these drugs. At that point, bioinformatics was raised as a powerful tool to identify new targets or new molecules for a target. Over the last few years, bioinformatics has supported researchers worldwide to rapidly find molecules and targets that could be applied to cancer. For example, Miller et al. [11] performed a structure-based virtual screening (SBVS) to find new molecules against the proteosome of pancreatic cancer cells. In the study, the authors analyzed 380,000 compounds against one proteasome subunit. After SBVS analysis, out of 288 compounds tested in vitro, 1 was selected for experiments analysis [11]. This case is an example of how bioinformatics could rapidly help drug discovery.
Another study by Rohr et al. [12] developed a pipeline employing R package scripts to analyze data from transcriptional analysis from micro-array from pre- and post-malignant colorectal cancer. Using the pipeline developed was possible to analyze a merged dataset containing 231 normal, 132 adenomas, and 342 colon cancer tissue samples across twelve independent studies analyzed by micro-array deposited in the Gene Expression Omnibus (GEO) [12]. The analysis was done to understand the genes involved in the disease severity, progression, and new targets for treating colorectal cancer. Both studies employed bioinformatics to find new targets and molecules that could be useful in cancer treatment, corroborating bioinformatics applications in clinics.
The present study aimed to identify new potential targets involved in GC establishment in samples collected from different populations worldwide using bioinformatics tools. First, an R code script was employed to analyze the micro-array metadata from healthy patients and with GC downloaded from GEO searching for new genes involved in GC establishment. Compounds can interact with the proteins encoded by overexpressed genes (AJUBA, CD80), hypoexpressed (FBXL13 and CCDC69) and the main gene involved with the Hallmark E2F targets (NOLC1) in gastric cancer cell lines from the 601 samples analyzed, by blocking or modulating the site (orthosteric or allosteric) of these targets.

2. Methodology

2.1. Selection of Microarray Transcriptome Studies

To minimize the number and impact of batch effects, MIAME (Minimum Information About a Microarray Experiment) compliant microarray studies were selected based on predefined inclusion criteria: 1) a collection of human tissue samples; 2) use of the GPL570 platform (Affymetrix Human Genome U133 Plus 2.0 array) for matching probe sets (Supplementary Table 1); and 3) includes samples from gastric cancer (tumor) and healthy tissue (normal). In total, 3 independent studies were chosen from an initial list of 156 to construct the meta-data.
Table 1. Top 10 up-and down-regulated genes in gastric tumor.
Differentially Expressed Genes
Upregulated Downregulated
Gene Symbol LogFC t Adjusted p-value Gene Symbol LogFC t Adjusted p-value
AJUBA 1.44E+14 7.80 7.78E-13 FBXL13 -1.56E+14 -11.18 2.01E-24
GPNMB 1.11E+14 6.20 1.53E-08 PDILT -1.14+14 -9.20 2.98E-17
CD80 1.09E+14 7.84 5.74E-13 CCDC69 -1.28E+14 -6.83 3.98E-10
ANLN 1.06+14 4.82 1.61E-05 PDZK1IP1 -1.24E+14 -4.03 4.02E-04
ADGRG7 1.06E+14 4.75 2.22E-05 SCIN -1.23E+14 -7.05 1.02E-10
BICD1 1.04E+14 6.47 3.44E-09 ITIH5 -1.21E+14 -7.66 1.98E-12
KNL1 9.91E+13 11.01 8.37E-24 NKX2-3 -1.20E+14 -8.46 7.58E-15
ABCD3 9.71E+13 5.89 8.40E-08 ITGB1 -1.17E+14 -4.27 1.59E-04
CENPL 9.54E+13 5.85 1.03E-07 SIGLEC11 1.16E+14 -13.16 1.33E-32
PGTS2 9.26E+13 4.60 4.17E-05 PTCHD1 -1.13E+14 -7.52 5.07E-12
Legend: LogFC: fold change in logarithmic scale; t: Student’s t-statistic; P.Value: p-value; Adj.P.Val.: adjusted P value.

2.2. Data Acquisition and Processing

Data acquisition and processing were performed in the R studio (v 4.1.3). Raw data were downloaded from the GEO database (https://www.ncbi.nlm.nih.gov/geo/) using the getGEOSuppFiles function of the GEOquery package (version 2.58.0) and the method described by Rorh et al. [12]. The individual. cel format files for each study were unpacked using the R untar function and loaded using the ReadAffy function of the affy package (version 1.68.0). Subsequently, the data were corrected and log-transformed by the frozen Robust Multiarray Averaging (fRMA) method using the fRMA package (version 1.42.0). Compared to traditional RMA, fRMA uses pre-calculated probe drifts to normalize the raw microarray data and has been shown to outperform RMA when preprocessing individual data sets for pooled analyses [12].

2.3. Meta-Data Construction

The construction of the meta-data followed the script described and validated by Rohr and colleagues [12]. Following fRMA normalization, the matrices of individual datasets were merged by combining the microarray probes. The batch effect among studies was identified by the Uniform Manifold Approximation and Projection (UMAP) method using the umap package (version 0.2.7.0) and removed using the original ComBat parametric iteration within the SVA package (version 3.38.0). UMAP was used over traditional principal component analysis (PCA) to identify batch effects due to its ability to represent local relationships better while preserving the global structure [12]. The ComBat function was chosen due to its flexibility, reliability, and ability to define covariates of interest.
Next, probes with an expression variation in the 75th percentile were filtered from the Meta-dataset using the gene-filter function in the oligo package (version 1.54.1). Finally, the maximum average expression using the hgu133plus2 collapsed redundant probes to their corresponding human gene symbol.db package (version 3.2.3). The constructed metadata contains 601 samples, including 152 Tumor and 449 Normal patients from 3 independent studies.
Differential expression (DE) analysis for Tumor versus Normal comparison was performed using the limma package. Specifically, DE analysis was performed independently on 25% of the most variable genes between each group. Genes were considered DE if q-value of |LogFC| ≥ 1.0 and False Discovery Rate (FDR) < 0.01.

2.4. Gene Set Enrichment Analysis (GSEA)

The significantly enriched Tumor and Normal phenotype gene sets were identified using Gene Set Enrichment Analysis (GSEA, gsea-msigdb.org). The H collection (hallmark gene set) available in the Molecular Signatures Database (MSigDB) 3.0 was chosen to perform the enrichment analysis [13]. The default parameters defined by Subramanian et al. [14] were used in this analysis. One hundred permutations determined the significance of the GSEA analysis, corrected p-value < 0.05, and the False Discovery Rate (FDR) <0.25. GraphPad Prism™ software was also used to represent individual genes’ enrichment scores and signal-to-noise values.

2.5. Survival Analysis

The Kaplan-Meier plotter database (https://kmplot.com/analysis/) was used to compare the expression profiles of the gene of interest in normal and tumor gastric tissue, classifying them as high or low/medium expression, which was then correlated with the probability of patient survival [15]. This tool can evaluate the correlation between the expression of all genes (mRNA, miRNA, protein) and survival in more than thirty thousand samples of different types of tumors.

2.6. Primer Designer

The Thermofisher trading platform (https://apps.thermofisher.com/apps/oligoperfect/#!/design) was chosen to design the perfect primers for Polymerase Chain Reaction (PCR). For this, the mRNA codes had to be obtained from the NCBI databases (https://www.ncbi.nlm.nih.gov/), providing the nucleotide sequence for all transcript variants of interest (Supplementary Table 2). The primer sequence was provided by the OligoAnalyzer™ Tool at Integrated DNA Technologies.
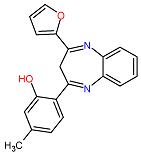
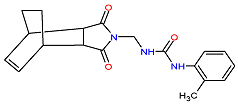
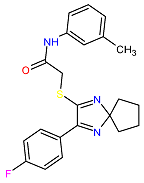
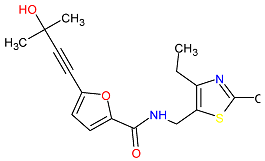
Table 2. The five main compounds’ formula. chemical structure and molecular weight were virtually tested against the protein targets AJUBA. FBXL13. CCDC69. CD80 and NOLC1. ACD/ChemSketch (version 2020.2.1) was used to draw the 2D chemical structures of the compounds.
Ligand-ID Target Chemical formula Mol. Wt. 2D-Structure
1. MCULE-2386589557-0-6 AJUBA C20H16N2O2 316.352 Preprints 82383 i001
2. MCULE-7343047040-0-1 FBXL13 C19H21N3O3 339.388 Preprints 82383 i002
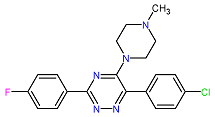
3. MCULE-5230409338-0-3 CCDC69 C22H22FN3OS 395.495 Preprints 82383 i003
4. MCULE-9178344200-0-1 CD80 C17H20N2O3S 332.419 Preprints 82383 i004
5. MCULE-5881513100-0-29 NOLC1 C20H19ClFN5 383.848 Preprints 82383 i005

2.7. Cell Culture

The gastric cancer cell line AGP-01 was obtained from the malignant ascitic fluid of primary metastatic intestinal-type tumors. While the ACP-02 and ACP-03 cell lines were established from primary diffuse-type and primary intestinal-type tumors from Brazilian patients, respectively. The AGS cell line was obtained from gastric adenocarcinoma tumors of a Caucasian patient [16,17]. The non-malignant gastric cell lineage, MNP-01, was previously established from normal gastric mucosa and was used as a cell type-specific control [18]. All cells were cultured in Dulbecco’s modified Eagle’s medium (DMEM; Gibco®), supplemented with 10% (v/v) fetal bovine serum (Gibco®), 1% (v/v) penicillin (100 U mL-1) and streptomycin (100 mg mL-1) (Invitrogen®), in a humidified atmosphere with 5% CO2 at 37 °C. Cell confluence was observed under a conventional microscope.

2.8. Gene Expression by qRT-PCR

2.8.1. RNA Extraction

Total mRNA from gastric cell lines and tissue specimens were extracted by TRIzol™ reagent (Invitrogen, USA) as per the manufacturer’s guidelines. Quantification was performed in a spectrophotometer (NanoDrop®, Thermo Scientific) and mRNA was stored at −80 °C until conversion into cDNA.

2.8.2. Conversion of mRNA to cDNA

The mRNA was converted to cDNA using the High-Capacity cDNA Reverse Transcriptase® kit (Thermo Scientific, USA). The conversion reactions were carried out in a thermocycler (Verity®, Thermo Scientific).

2.8.3. Real-Time Quantitative PCR (qRT-PCR)

Gene expression was determined by qRT-PCR using PowerUp SYBR® Master Mix (Life Technologies, USA) on a QuantStudio5 Real-Time PCR system (Applied Biosystems®). The primer efficiency was determined for all described genes. The relative expression levels of the PDILT, GPNMB, IL13RA, CCDC69, AJUBA, NOLC1, CD80, KNL1, and FBXL13 genes were normalized and determined using the ACTB gene as an endogenous control. Calculations were performed using the 2-∆∆CT method. The requirements proposed in the Minimum Information for Publication of Quantitative Real-Time PCR Experiments - MIQE Guidelines were followed [19].
2.9. 3D Structures Obtention
The 3D structures of the proteins were obtained from the AlphaFold Protein Structure Database (https://alphafold.com/), an artificial intelligence (AI) system developed by DeepMind and EMBL-EBI that predicts with high precision the 3D structure of proteins from an amino acid sequence. The predictions of the 3D structures related to the AJUBA, FBXL13, CCDC69, CD80 and NOLC1 genes were available in this database free of charge and with open access [20,21].
The organism filter was applied to choose the structure for each protein, selecting the Homo sapiens option. Per-residue confidence score (pLDDT) and FASTA amino acid sequences coverage analysis were considered. The PyMOL Molecular Graphics System (version 2.5.4, Schrödinger, LLC) [22] was employed to analyze the 3D structures of proteins. The 3D structures of the AJUBA, FBXL13, CCDC69, CD80 and NOLC1 proteins downloaded from the AlphaFold Protein Structure Database (https://alphafold.com/) have, respectively, the following Uniprot codes: Q96IF1, A0A0A0MRW5, A6NI79, P33681 and Q96J17 [20,21].

2.10. Virtual Screening

To identify inhibitors of CCDC69, AJUBA, NOLC1, CD80, and FBXL13 proteins, a structure-based virtual screening (SBVS) analysis was performed on the Mcule online platform (https://mcule.com/dashboard/). Mcule is a platform that provides information technology (IT) infrastructure containing drug discovery tools, a high-quality compound database, pharmacokinetic and toxicological prediction tools, and commercialization services for approximately 100+ million compounds [23,24].
On this platform, virtual screening workflows can be created consisting of a set of filters and calculations. Filters can remove compounds unlikely to bind to study targets or have undesirable properties. The calculations, in turn, rank the best candidates concerning the binding affinity between the protein and ligand complex. Additionally, it is possible to perform Hit Identification analyses, and then the Structure-Based Virtual Screen option was selected, generating the Workflow. In the collection, Mcule Purchasable (Full) was selected, aiming to guarantee that the evaluated molecules would be available for commercialization. In the basic properties filter, only the RO5 violations filter was changed, with a first analysis being performed with the maximum value for violations equal to 0 (RO5 violations 0) and, later, a second analysis with the maximum value of one 1 violation of Lipinski’s rules (RO5 violations 1) for each target. The other default settings preserved, such as sampling and diversity filters, were used to randomly select several different chemical structures with a maximum value of 10 rotating bonds, 5 chiral centers and 0 or 1 violation of Lipinski’s rule of five.
Lipinski’s rule of five allows a prediction of the oral bioavailability profile for new molecules. In this rule, it is established that for a compound to be a good drug candidate, it must present multiple values of 5 for 4 parameters, namely: 1) log P greater than or equal to 5; 2) molecular mass less than or equal to 500; 3) hydrogen bond acceptors less than or equal to 10; 4) hydrogen bond donors less than or equal to 5. It is defined that a molecule may present only 1 violation of one of these parameters to be a promising drug candidate [25,26].
In summary, using the Mcule platform, it was possible to identify compounds that bind to the active or allosteric site of the targets under study, obtain results on the binding affinity between the protein-ligand complex (docking scores), analysis of the toxicity of compounds from their chemical structure.

2.11. In Silico Toxicity Prediction

The top ten compounds with minimum target binding energy were selected in each virtual screening analysis performed in Mcule for the target proteins CCDC69, AJUBA, NOLC1, CD80 and FBXL13. Toxicological parameters were estimated for these compounds using Mcule and ProTox-II.
On the Mcule platform, it is only possible to predict the toxicity of molecules contained in its compound database. This in silico prediction is based on the search for substructures commonly found in toxic and promiscuous ligands. This way, when a molecule is classified as toxic, the responsible fragment is flagged and identified [23]. All molecules analyzed in this tool were also evaluated in the ProTox-II server.
ProTox-II, freely available from https://tox-new.charite.de/protox_II/, is a web server for in silico toxicity prediction incorporating molecular similarity, pharmacophores, fragment propensities and machine learning models for the prediction of toxicity endpoints, specifically: acute toxicity, hepatotoxicity, cytotoxicity, carcinogenicity, mutagenicity, immunotoxicity, pathways of adverse outcomes (Tox21) and toxicity targets. It is worth mentioning that the predictive models of this server are built based on data from in vitro trials and in vivo cases [27].
For evaluating the toxicity profile in ProTox-II, the SMILE code was used as an input file for the construction of the two-dimensional chemical structure of the chemical products. Acute oral toxicity was determined using the toxicity class. Only compounds that showed prediction for toxicity class equal to or greater than IV and no prediction for toxicity endpoint models were selected for the next step.

2.12. Prediction of ADME Parameters

To evaluate pharmacokinetic parameters, the SwissADME tool was used. The SwissADME tool assesses the pharmacokinetics and structural similarity between molecules. This tool also allows for calculating physicochemical descriptors. It provides access to robust and fast predictive models for physicochemical properties, similarity to drugs and compatibility with medicinal chemistry [28,29].

2.13. Molecular Docking (MD) Assays

Chemicals obtained after each virtual screening (RO5 violations 0 and RO5 violations 1) that showed favorable toxicological properties in the in-silico toxicity prediction step were filtered and virtually tested for binding potential against study targets using the DockThor server. This server presents a methodology using flexible ligands and rigid receptors through a genetic algorithm and the MMFF94s molecular force field to predict the score of each pose [30,31].
For each analysis, the 3D structure of the protein was loaded as a PDB file into the docking platform. In the protein preparation step, the internal program PdbThorBox automatically parameterizes the protein atoms according to the atomic type and partial charges of the MMFF94 force field, adding polar hydrogen atoms when necessary, reconstructing missing atoms from residual side chains, and adjusting the protonation state. In the ligand preparation step, the internal MMFFLigand program parameterizes the atoms according to the atomic type and partial charges of the MMFF94s force field, adding polar hydrogen atoms if required by the user.
In the docking step, to find the protein cavities and the site of interaction between the molecules, blind docking was performed, an option called Blind Docking. This option generates a grid box centered on the protein coordinate center with a size that covers the entire receptor. The prediction of affinity and total energy of the protein-ligand complexes is performed by the internal program DockTScore. At the end of the molecular docking assay, the final output compounds were ranked based on their minimum target binding energy. The PyMOL Molecular Graphics System (version 2.5.4, Schrödinger, LLC) [22] and BIOVIA Discovery Studio Visualizer (version 21.1.0.20298) tools were used to analyze the docking conformation of the protein-ligand complex and the types of connection involved.

2.14. Protein-Protein Interaction Network

To identify the protein interaction network of the AJUBA, FBXL13, CCDC69, CD80 and NOLC1 proteins, the STRING tool (version 11.5) was used. The STRING resource is available online at https://string-db.org/. The results obtained using this tool enabled the selection of protein complexes that later served as controls for the molecular docking (MD) assay.

2.15. Re-Docking

For the re-docking process, it was necessary, initially, to select a protein-protein complex from the interaction network provided by the STRING tool. Priority was given to choosing known complexes with comfort from curated databases and experimentally determined. Therefore, molecular docking experiments were performed using the ClusPro 2.0 server (https://cluspro.org), the best-performing server currently available for the CAPRI challenge [32]. The GPU option was selected because it uses more specific computer graphics units from the Massachusetts Green High-Performance Computing Center (MGHPC). The best complexes generated by molecular docking studies were analyzed regarding interface energy and interaction between residues. This analysis sought to evaluate and understand how the proteins interact with each other, observing the predominant interaction pose and the minimum energy value.

3. Results

3.1. Differentially Gene Wxpression in Gastric Tumor Meta-Dataset

We constructed a meta-dataset for transcriptome analysis to assess the gene expression profile of gastric cancer tissue versus normal gastric tissue. After batch correction among datasets (Figure 1A), the differentially expressed genes were demonstrated in a volcano plot, representing the significance of adjusted p-value and Fold-Change (Figure 1B). Thus, the top ten genes with the highest and lowest values of Fold Change (log) were organized, whose p-values were significant (P <0.05), as shown in Table 1. The highest gene expression levels in the gastric tumor dataset were observed for AJUBA (1.44E+14), GPNMB (1.11E+14), and CD80 (1.09E+14). Otherwise, the lowest expression levels were observed for FBXL13 (-1.56E+14), PDILT (-1.41E+14), and CCDC69 (-1.28E+14) genes.

3.2. Gastric Tumor Group Involved in Multiple Cancer Progression Pathways

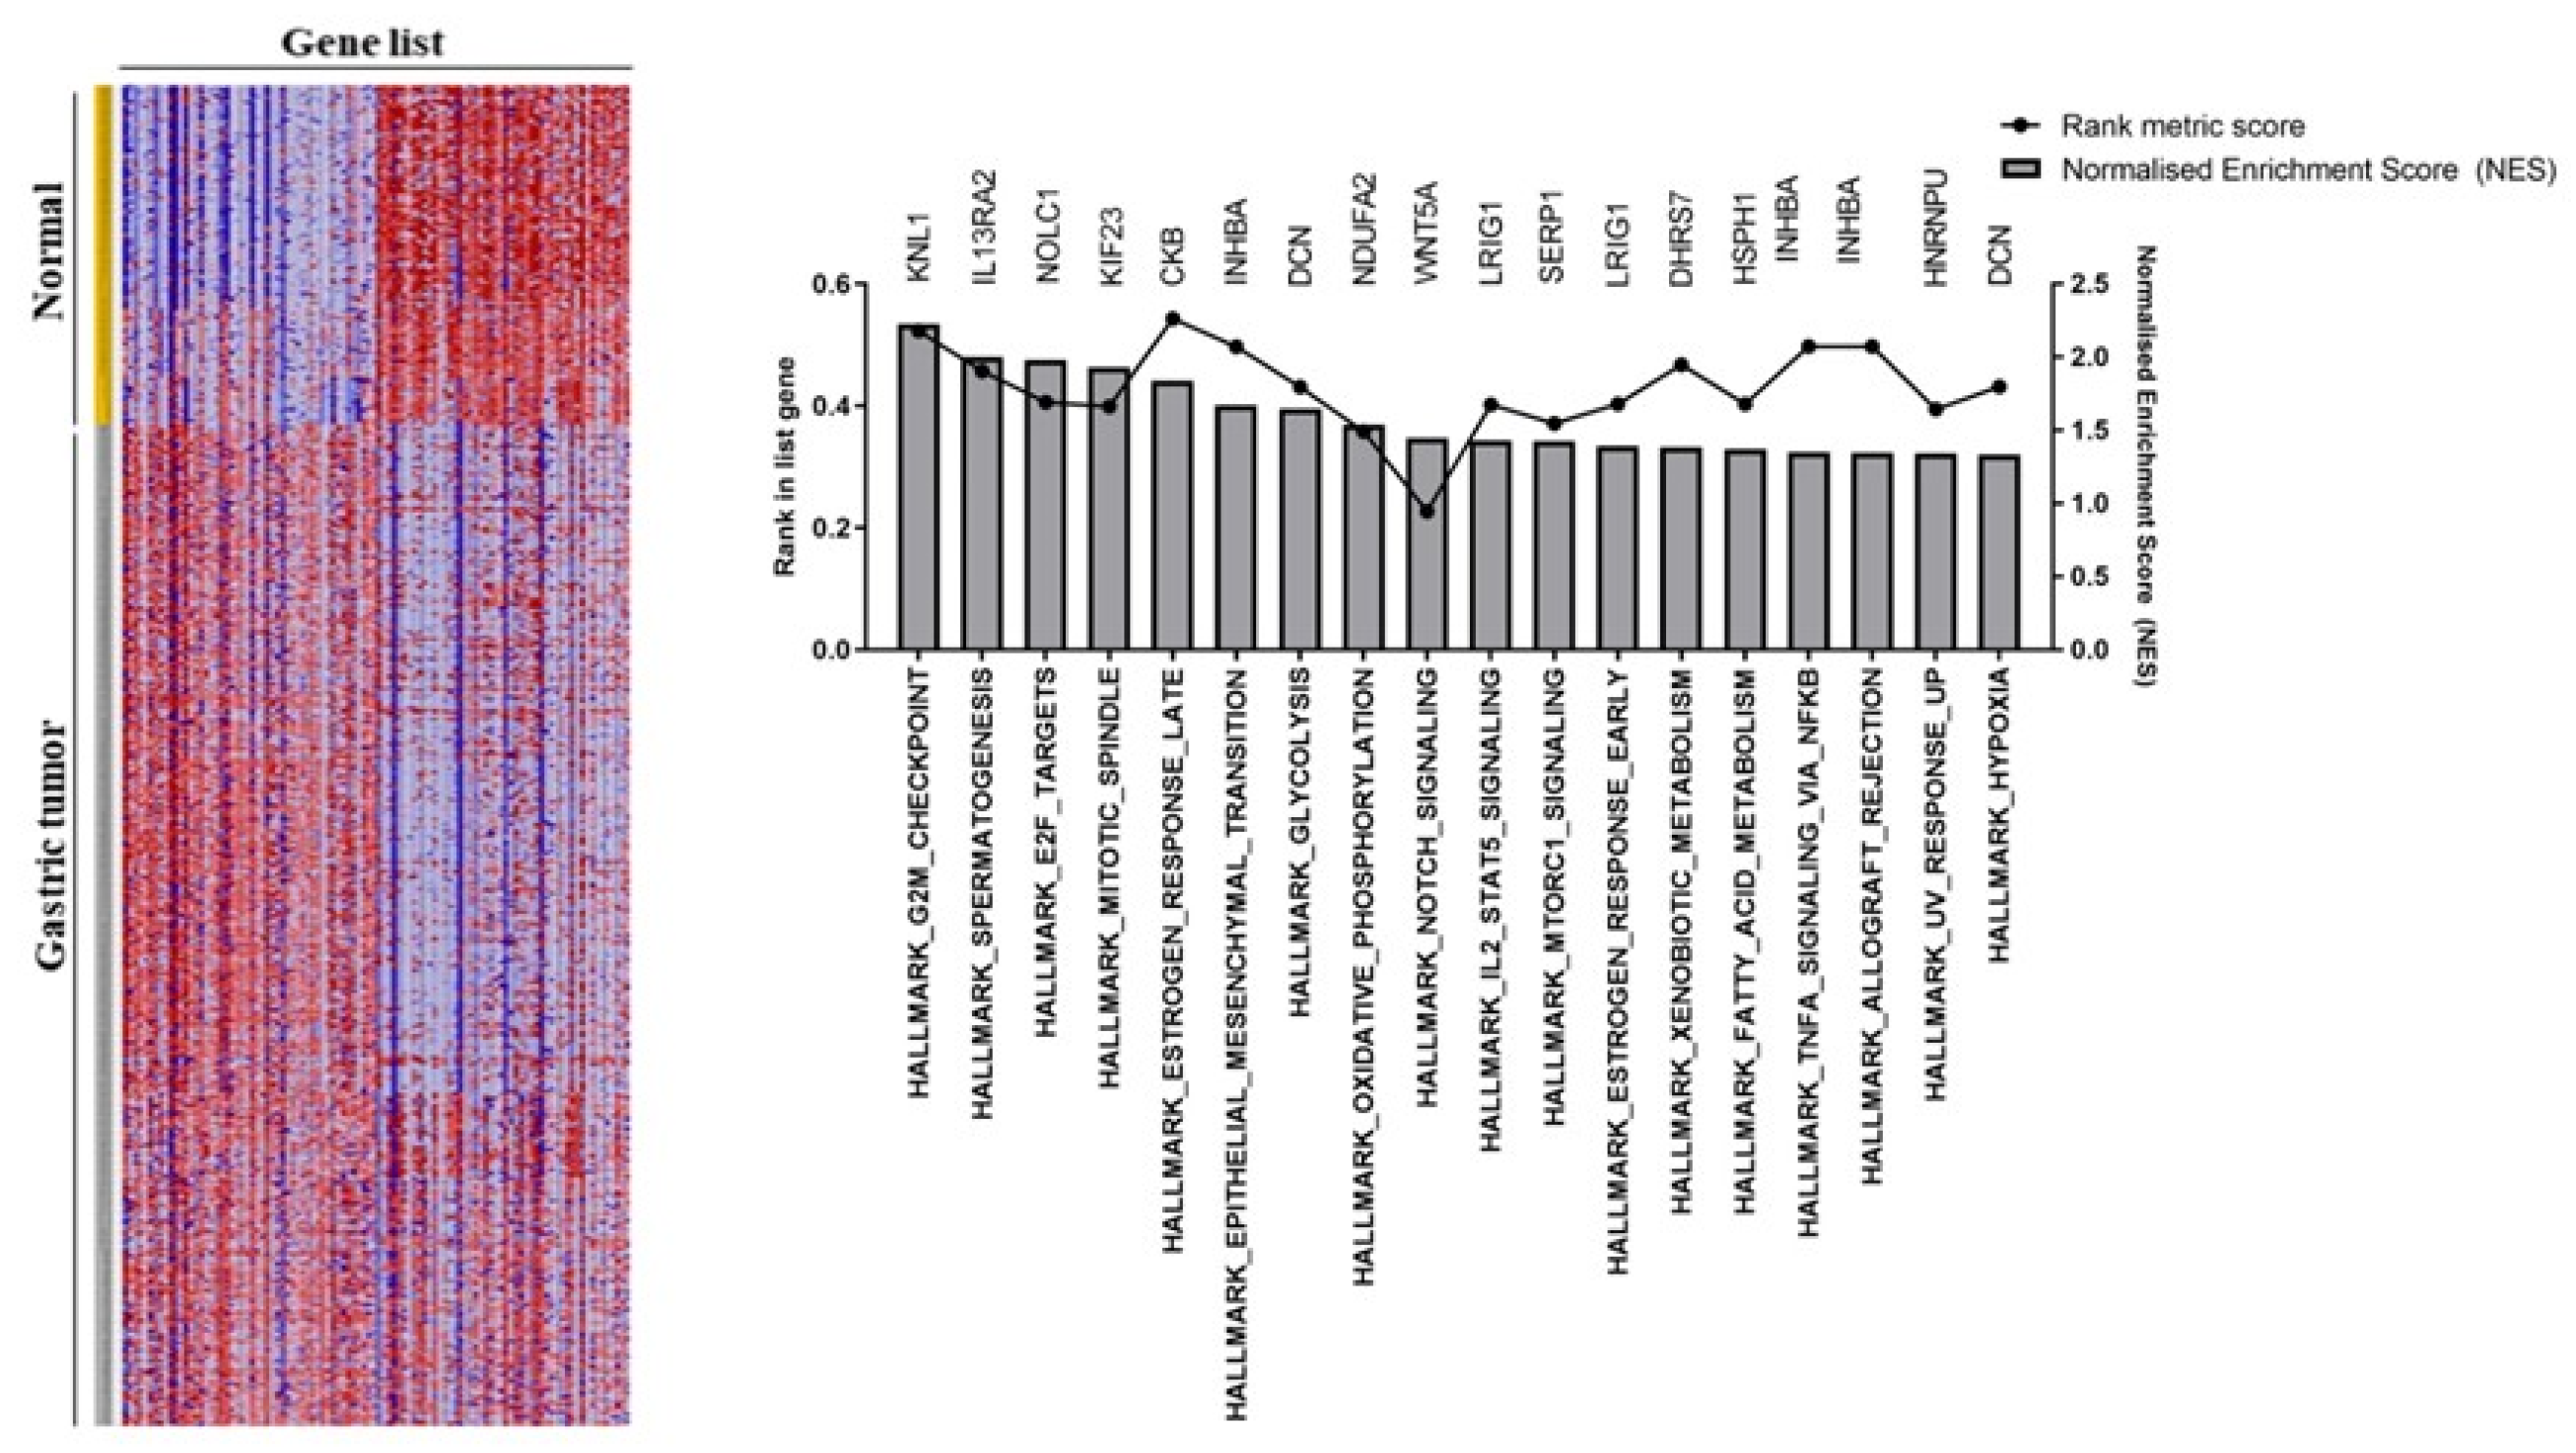
In addition to the analysis with R Studio (Table 1), the GSEA platform was also used to determine gene enrichment in gastric tumor samples [14]. For this, the GSEA provided graphs with the specifications of the 18 main hallmarks in the tumor and normal samples. GSEA assessed the functional differences by comparing gastric tumors versus normal gastric tissue groups. For instance, gastric tumors were positively correlated with several cancer hallmarks (Figure 2). The most enriched pathways were G2M checkpoint (NES = 2.22, p = 0.00001), spermatogenesis (NES = 2.00, p = 0.00001), E2F targets (NES = 2.05, p = 0.00001). Therefore, an intensive regulatory role was observed for the development and progression of gastric tumors, exhibiting significant changes in pathways.

3.3. Prognostic Value of Differentially Expressed Genes Involved in Gastric Cancer Progression

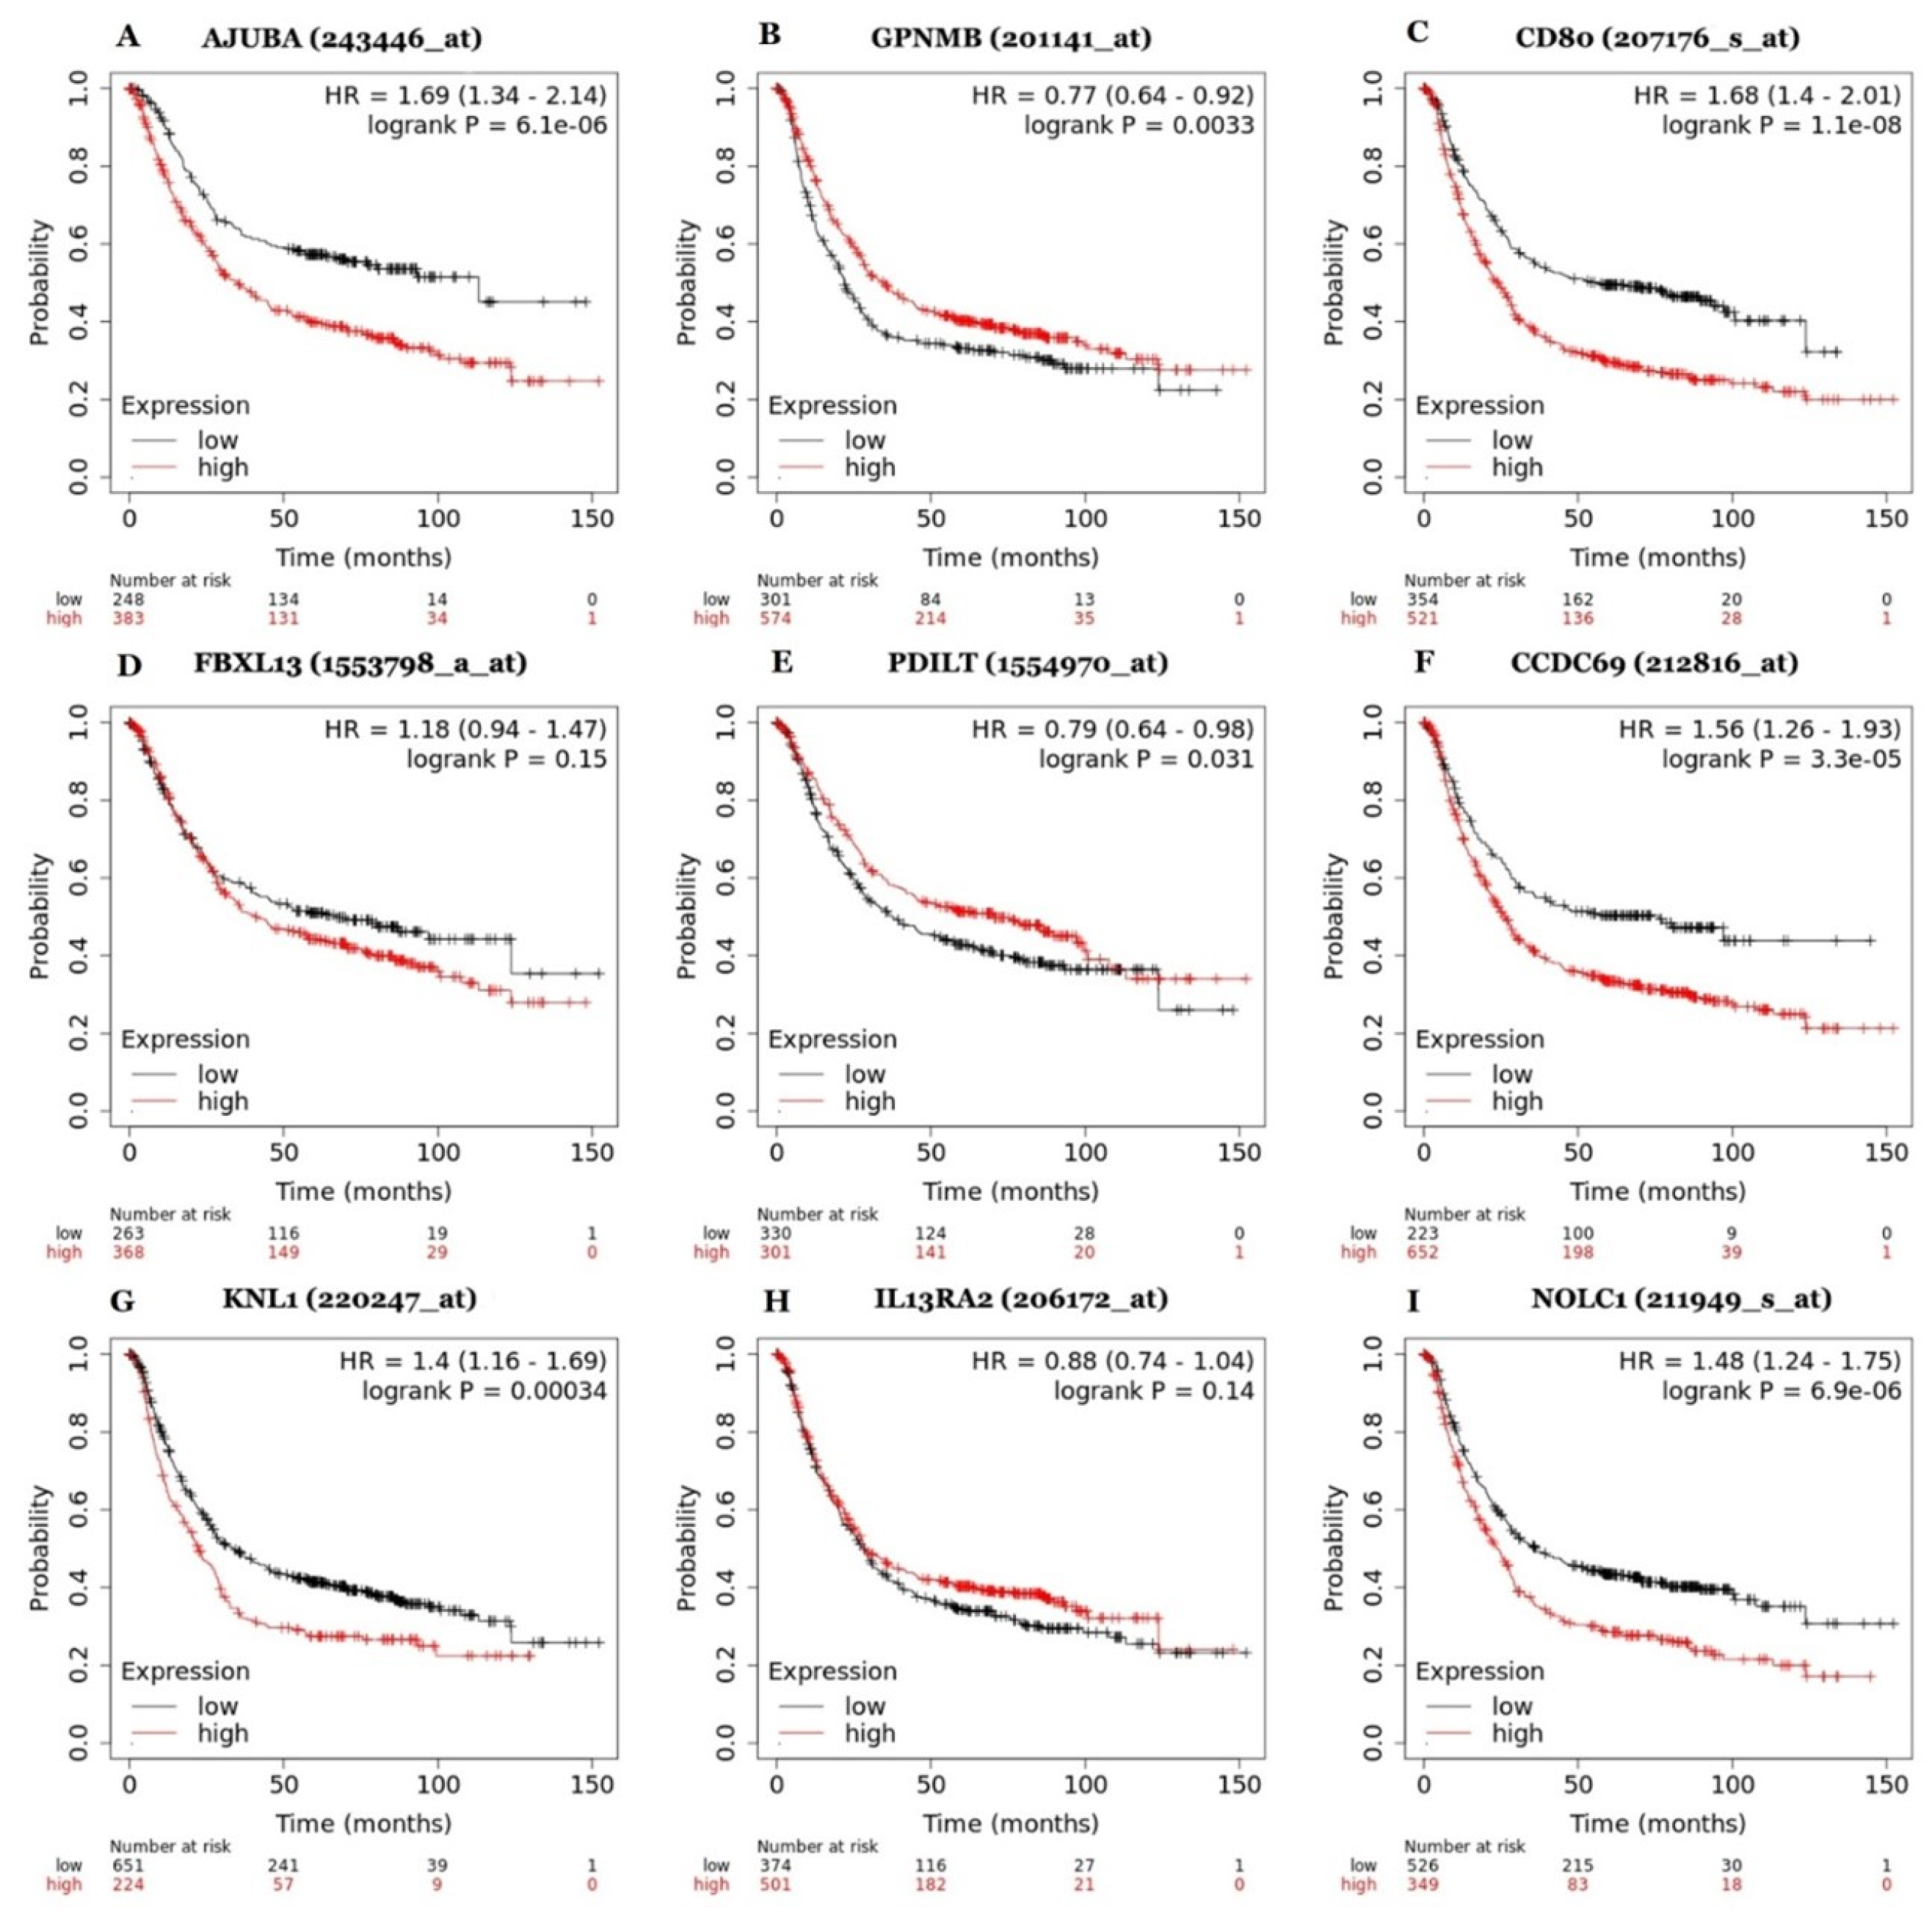
To evaluate whether the most relevant genes were associated with poor survival in gastric cancer patients, we performed a Kaplan-Meier analysis with the 3 highest and lowest expressed genes from limma analysis and with the 3 highest enriched genes from GSEA analysis (Figure 3). Interestingly, seven genes had their expression levels significantly correlated to gastric cancer patient survival. High expression of AJUBA (p-value = 6.1e-06), CD80 (p-value = 1.1e-08), CCDC69 (p-value = 3.3e-05), KNL1 (p-value = 0.00034), and NOLC1 (p-value = 6.9e-06), and low expression of GPNMB (p-value = 0.0033) and PDILT (p-value = 0.031), were significantly correlated with poor prognosis in gastric cancer patients. These genes were tabulated for a subsequent selection of genes with better potential for further research to 1) have their primers designed and, subsequently, 2) be subjected to a PCR (Polymerase Chain Reaction) for validation in gastric cancer cell line model.

3.4. Validation of Relevant Genes in Gastric Tumor Cell Lines Compared to Normal Gastric Cell Lines

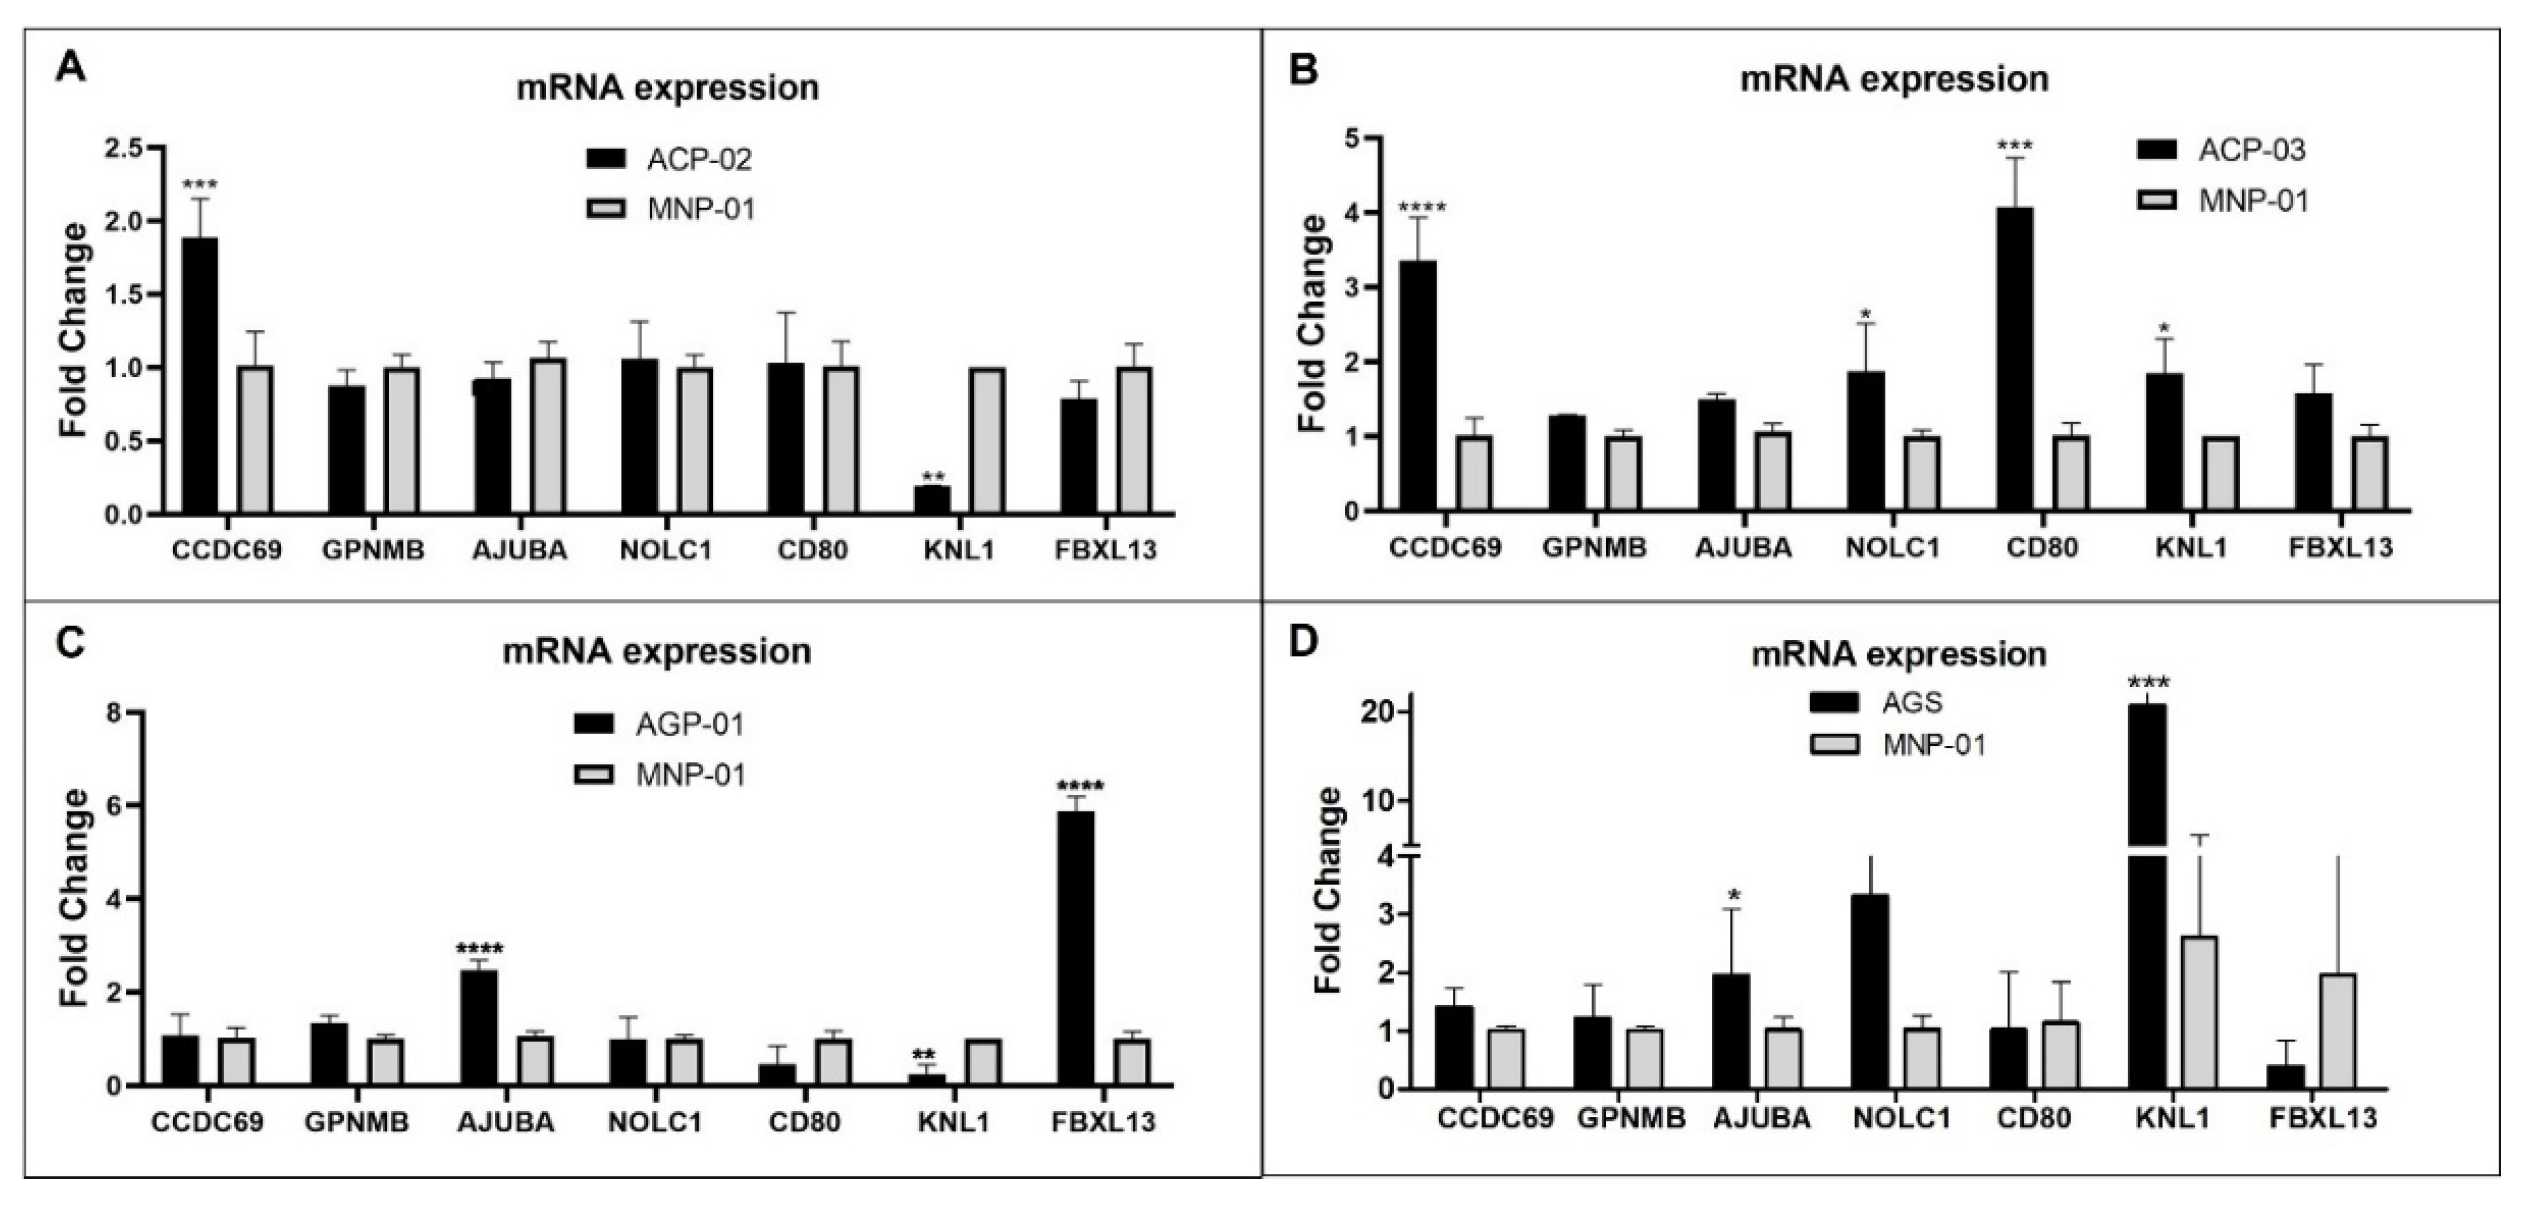
To validate and evaluate how these selected genes are expressed in gastric cancer in vitro model, we compare the relative gene expression levels of gastric cancer cell lines (ACP-02, ACP-03, AGP-01, and AGS) and non-malignant gastric cell lines (MNP-01). The results showed a significant increase in the mRNA level of CCDC69 and a reduction of KNL1 gene expression in ACP-02 cells compared to MNP-01 (Figure 4A). In the case of ACP-03, CCDC69, NOLC1, CD80, KNL1 were overexpressed when compared to MNP-01 (Figure 4B). For AGP-01 cell line, AJUBA and FBXL13 in AGP-01 presented an increase expression compared to MNP-01. In contrast, KNL1 presented a reduced expression (Figure 4C). For the AGS cell line, AJUBA and KNL1 genes presented higher expression related to MNP-01 (Figure 4D).

3.5. In Silico High-Throughput Virtual Screening

Using a structure-based approach to drug screening, an extensive collection of small molecules was investigated for their potential to interact with a designated target protein. In this investigation, a screening process involving 10,000 ligands from the MCULE library was conducted. The selection of target proteins was guided by overexpression data obtained from gastric cancer cell lines, specifically focusing on genes such as AJUBA, FBXL13, CCDC69, CD80, and NOLC1. Through virtual screening, the top 100 ligands were initially identified and subsequently refined to the top 10 based on VINA scores (Supplementary Tables 3, 4, 5, 6, and 7). These chosen ligands were further evaluated. Considering their favorable interaction energies and toxicological characteristics, the molecules found have their suitability for subsequent analysis assessed.

3.6. Molecular Docking (MD) Validation

The in-silico evaluation of the best hits at the end of each virtual screening, selecting a compound with the best prediction of pharmacological parameters for each protein target studied, was possible. The molecules were designated with Mcule IDs as MCULE-2386589557-0-6, MCULE-7343047040-0-1, MCULE-5230409338-0-3, MCULE-9178344200-0-1, and MCULE-5881513100-0-29. The best molecules were chosen based on 1) the best pose of interaction (a site important for protein activity), 2) number of interactions, 3) distance of bonds, and 4) toxicity. The formula, chemical structure and molecular weight of these chosen compounds are shown in Table 2.
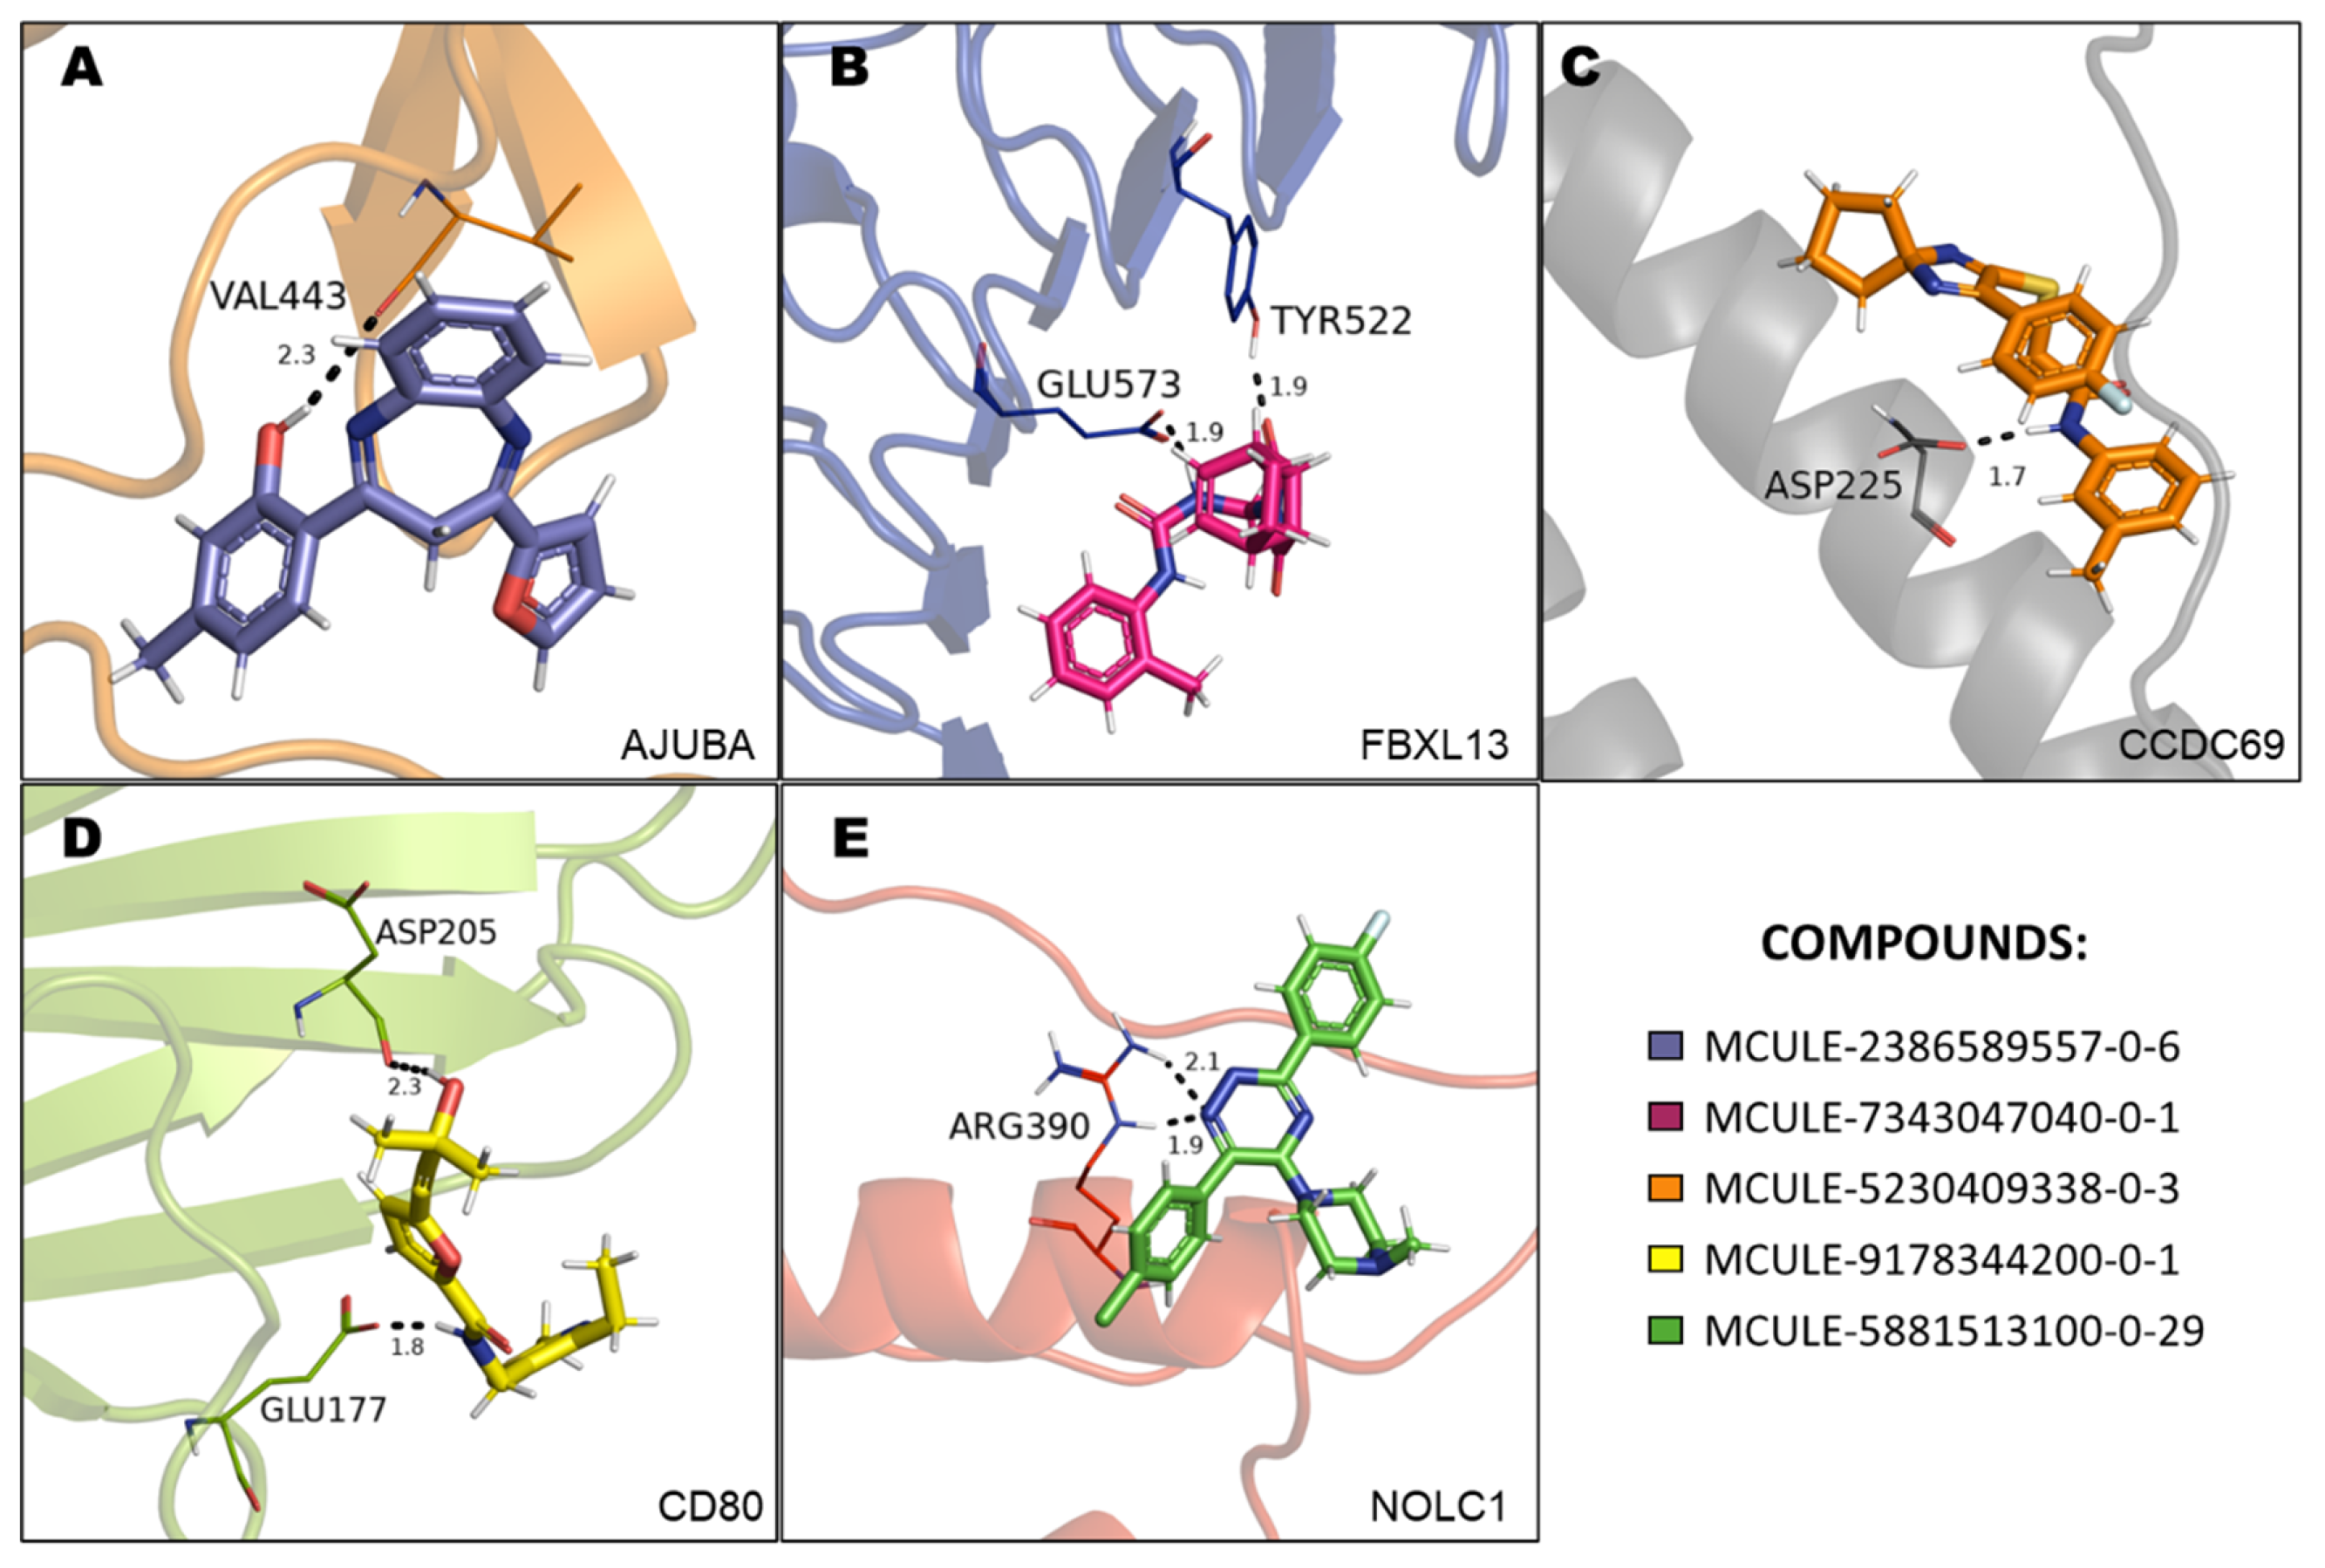
Molecular docking analyses revealed that the compound MCULE-2386589557-0-6 presented a polar bond interaction with the Val443 and two pi-alkyl interactions with Leu235 and Pro232 residues of the AJUBA (Figure 5A, Supplementary Figure 2). MCULE-7343047040-0-1 formed two polar bonds with the catalytic residues Glu573 and Tyr522 of the FBXL13 protein (Figure 5B, Supplementary Figure 3). The compound MCULE-5230409338-0-3, in turn, formed a polar bond with the Asp225 residues and one PI-Sigma interaction with Val228 and Alkyl interaction Arg229 residues of the protein CCDC69 (Figure 5C, Supplementary Figure 4). MCULE-9178344200-0-1 formed two polar bonds with the Glu177 and Asp205 residues, one Alkyl with Ile185 and one Pi-Alkyl Leu182 with the CD80 protein (Figure 5D, Supplementary Figure 5). Regarding the compound MCULE-5881513100-0-29 and NOLC1 protein, a polar interaction with Arg390 and a Pi-cation interaction with the residue Lys387 (Figure 5E, Supplementary Figure 6) were identified.
Concerning docking scores for the best poses, Table 3 shows the minimum binding energy for each receptor-ligand complex evaluated and the prediction results regarding the toxicity parameters: LD50 value and acute oral toxicity, determined by the middle of the toxicity class. All 5 selected compounds show prediction for toxicity class equal to or greater than IV and no prediction for toxicity endpoint models. It is essential to consider that on the toxicity scale, class I represents the compounds most likely to manifest acute oral toxicity and class VI represents the compounds with higher safety scores.
Table 3. Result of docking scores. using DockThor and Mcule software; toxicity analysis. using the ProTox-II tool.
Protein-Ligand Complex Docking Score Predicted Toxicity
Ligand-ID Target DockThor Mcule LD50 Class
MCULE-2386589557-0-6 AJUBA -8.4 -7.3 2500mg/kg V
MCULE-7343047040-0-1 FBXL13 -7.4 -8.3 5400mg/kg VI
MCULE-5230409338-0-3 CCDC69 -7.133 -5.6 1000mg/kg IV
MCULE-9178344200-0-1 CD80 -7.773 -5.6 600mg/kg IV
MCULE-5881513100-0-29 NOLC1 -7.260 -7.5 640mg/kg IV

3.7. In Silico Pharmacokinetics Prediction

Table 4 indicates the results related to the ADME in silico parameters of the five selected compounds: MCULE-2386589557-0-6, MCULE-7343047040-0-1, MCULE-5230409338-0-3, MCULE-9178344200-0-1 and MCULE -5881513100-0-29. Pharmacokinetic data were obtained from the SwissADME platform, and information on molecular weight (PM), topological polar surface area (TPSA), lipophilicity coefficient (cLogP), solubility in aqueous media (LogS), gastrointestinal absorption (AGi ), penetration of the blood-brain barrier (BBB), and data on P-glycoprotein (P-Gp) substrates.
As shown in Table 4, the compound with the highest coefficient of lipophilicity is MCULE-5230409338-0-3 (cLogP= 4.52). Consequently, this compound has a lower solubility value in aqueous media (LogS= -5.04). Furthermore, this compound exhibits a molecular weight (395.49 Da) than the other studied compounds. All analyzed compounds presented satisfactory TPSA. This parameter is used in medicinal chemistry to relate the ability of a molecule to permeate cells and physiological barriers [29]. These data comprise the basis for discussing its possible pharmacokinetic properties and the analysis of experimental assays since drug transport is required to reach the site of pharmacological action.
All compounds analyzed showed high absorption via the gastrointestinal tract (Table 4). Regarding penetration through the blood-brain barrier, only compounds (1) MCULE-2386589557-0-6 and (5) MCULE-5881513100-0-29 showed permeability capacity. The compounds (2) MCULE-7343047040-0-1 and (5) MCULE-5881513100-0-29 were classified as P-glycoprotein substrates (P-Gp). Expressed in cell membranes, P-Gp acts as an efflux pump of some substances, especially xenobiotics, from the interior of cells.
Table 6. In silico prediction of ADME properties of compounds (1) MCULE-2386589557-0-6. (2) MCULE-7343047040-0-1. (3) MCULE-5230409338-0-3. (4) MCULE-9178344200 -0-1 and (5) MCULE-5881513100-0-29. estimated by SwissADME software.
ADME Properties (1) (2) (3) (4) (5)
Molecular weight 316.35 339.39 395.49 332.42 383.85
TPSA 58.09 78.51 79.12 103.60 45.15
cLogP 3.81 2.05 4.52 2.73 3.72
LogS -4.75 -3.38 -5.04 -3.49 -4.73
GI absorption High High High High High
BBB permeant Yes No No No Yes
P-gp substrate No Yes No No Yes

3.8. Protein-Protein Interaction Network

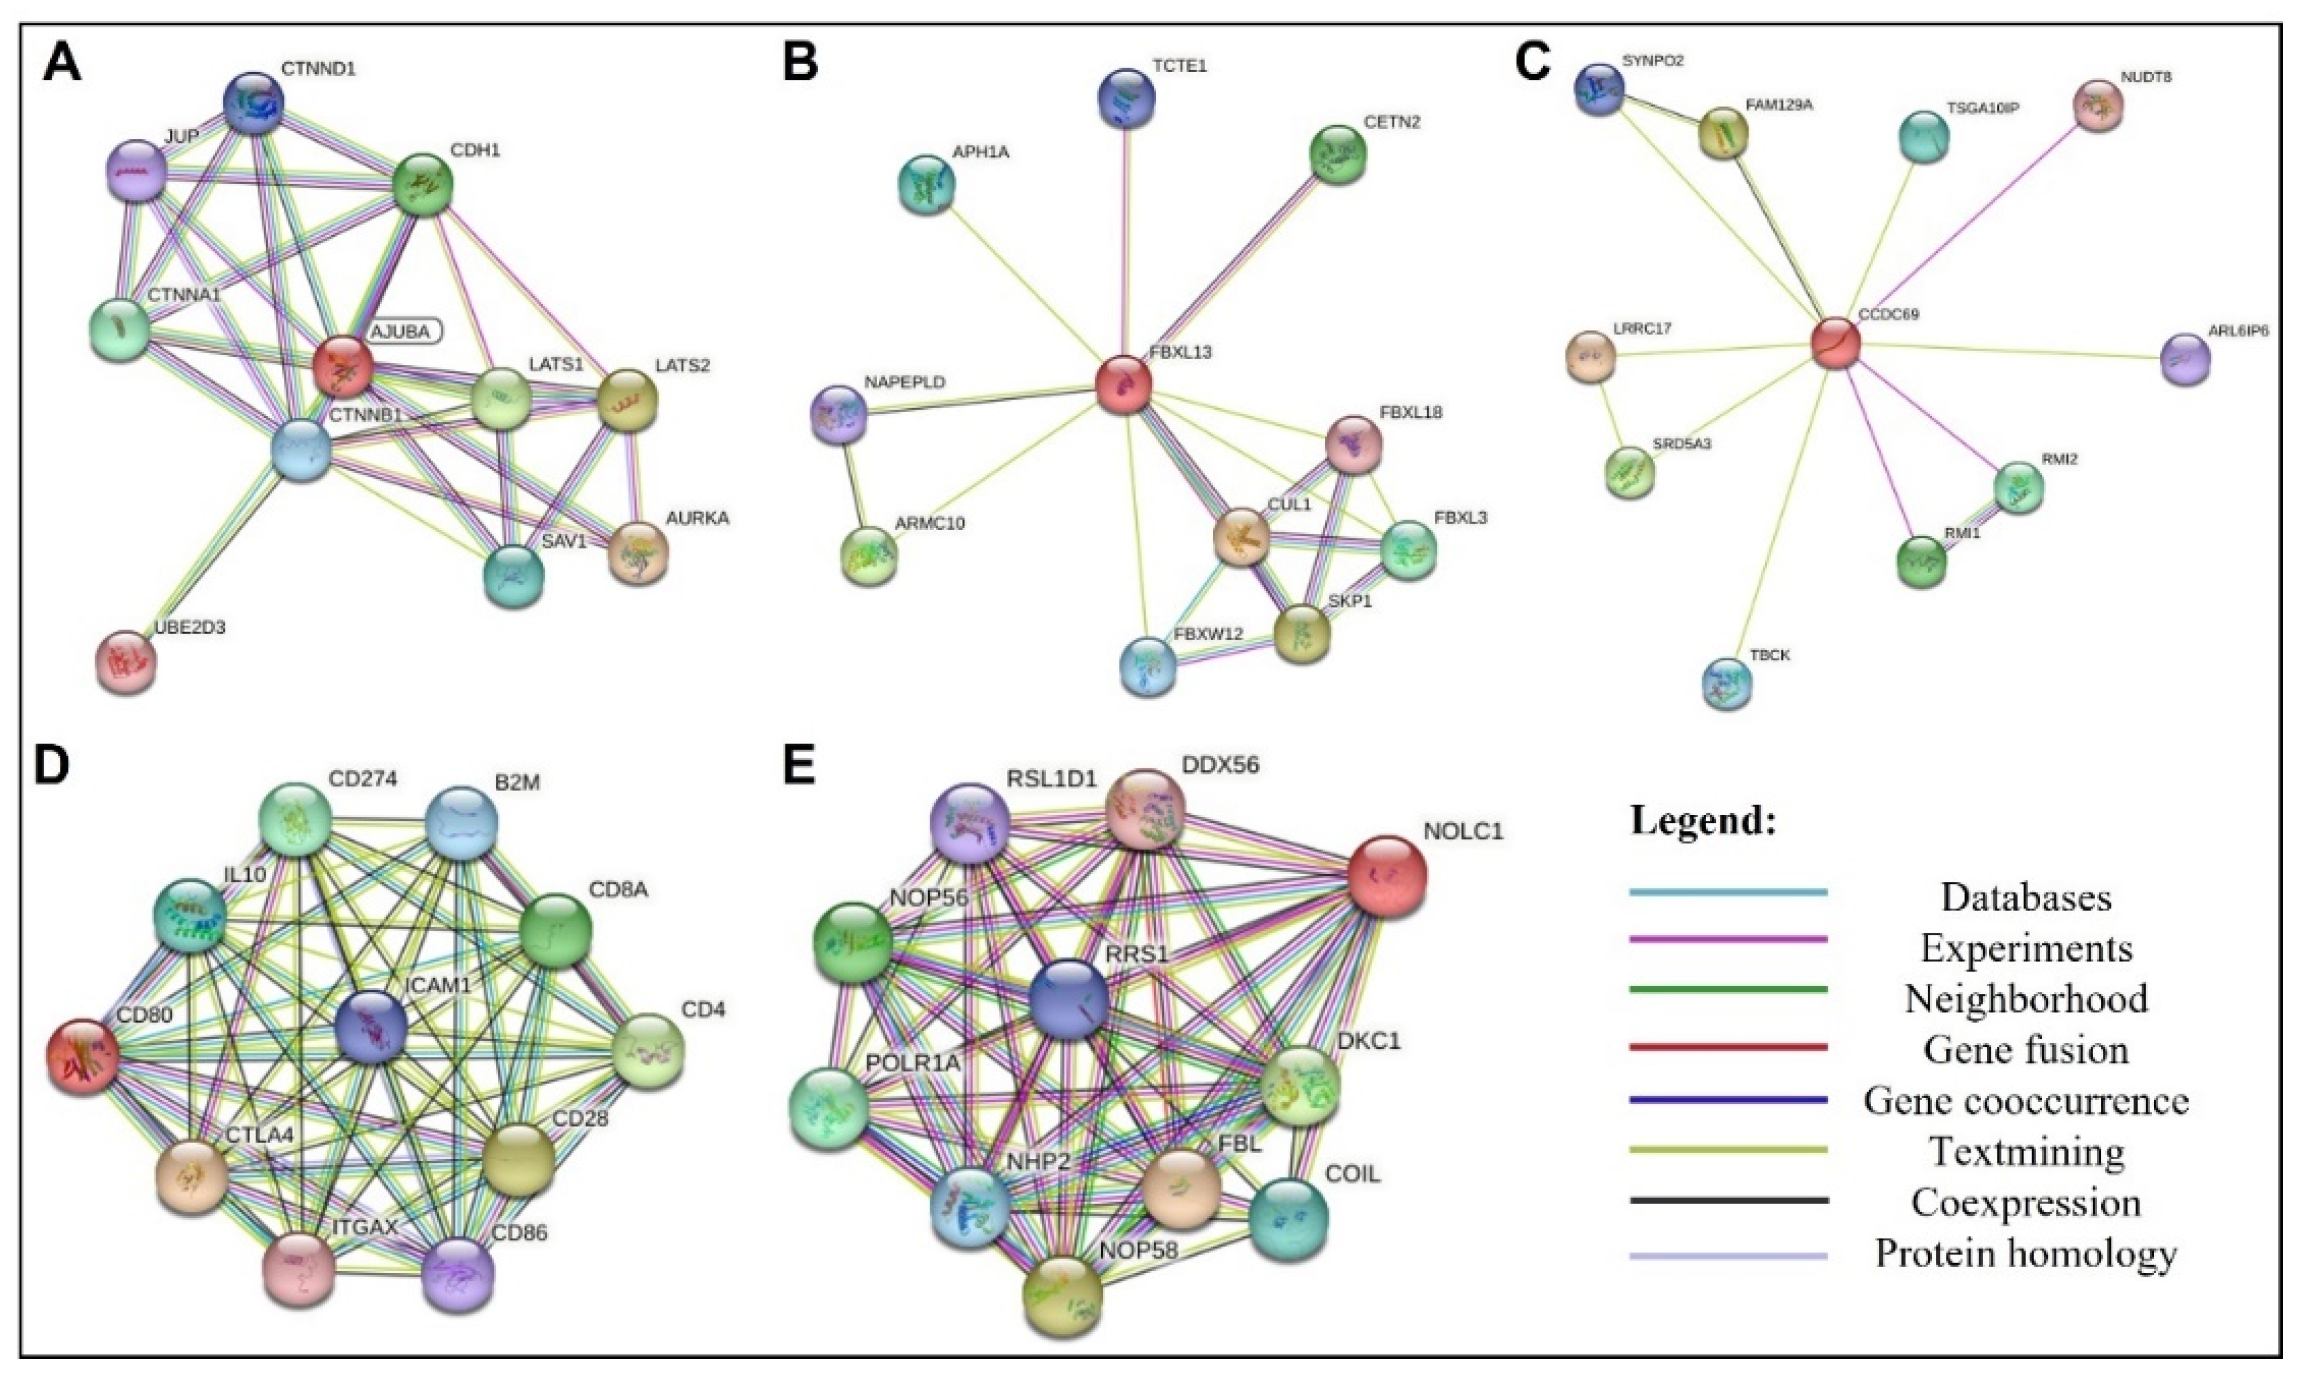
Analyzing the network of protein interactions made it possible to evaluate the existing protein-protein interactions network for each target in this study (Figure 6), and somehow, the molecules chosen are interfering with those pathways (Figure 7). These analyses enabled the selection of protein complexes that later served as controls for the molecular docking assay. The selected complexes were AJUBA and CTNNB1; FBXL13 and SKP1; CCDC69 and NUDT8; CD80 and CTLA4; NOLC1 and NHP2.
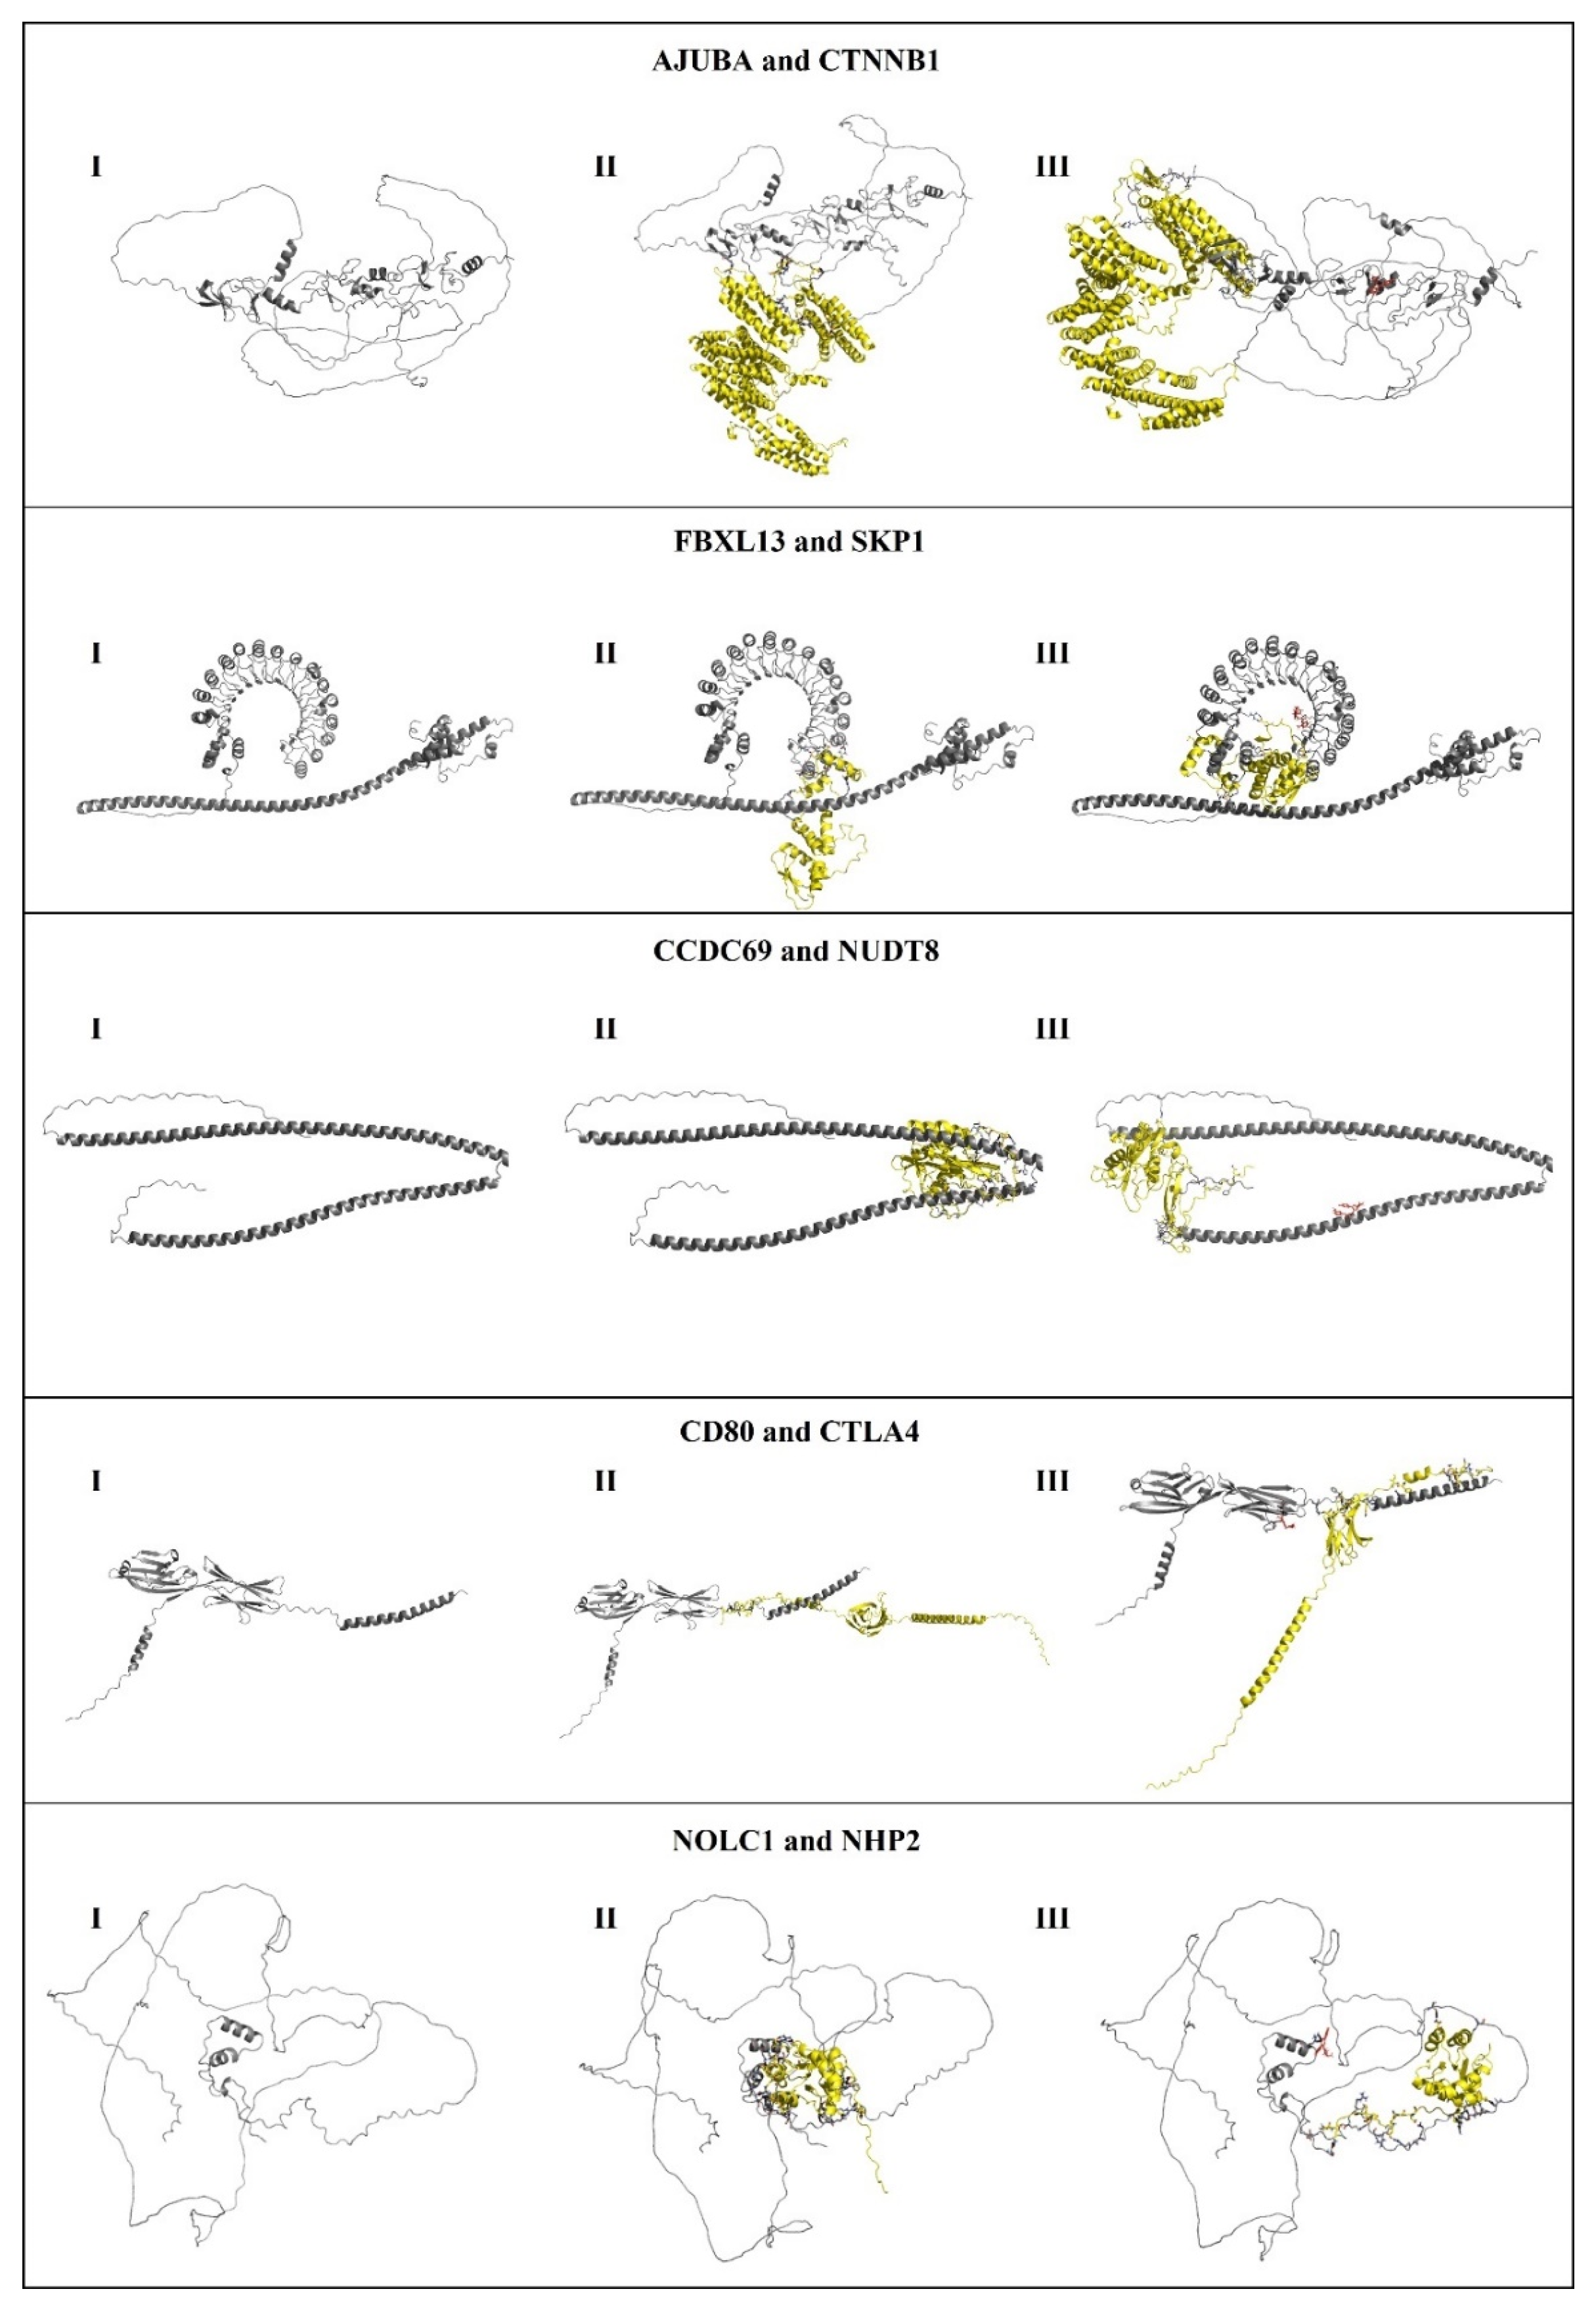
Thus, the molecular docking protocol was validated through re-docking, including target proteins, proteins that endogenously interact with the study targets and MCULE compounds selected from virtual screening. In this test, it was possible to visualize that the interaction site between the protein and the endogenous ligand is altered when the MCULE compounds are anchored to the target proteins. The re-docking results are shown in Figure 7.

4. Discussion

Despite advances in science and the various therapeutic options currently available for controlling gastric cancer, the prognosis of patients affected by it remains unfavorable. In this context, chemotherapy resistance and the serious adverse effects of conventional pharmacological treatments represent a major obstacle to the successful treatment of gastric cancer.
Drug resistance is a phenomenon that results from a variety of pharmacokinetic and molecular changes. It refers to the ability of microorganisms or cancer cells to resist the effects of a normally effective drug against them. Although many types of cancer are initially susceptible to chemotherapy, with prolonged use, the development of resistance to chemotherapy drugs is observed through different mechanisms, such as inactivation or reduction of drug activation; changing drug targets; drug efflux; DNA damage, repair and metabolic changes; inhibition of cell death; epithelial-mesenchymal transition and metastasis; heterogeneity of cancer cells; and epigenetic modifications, with the possibility of combining any of these mechanisms [33].
As a new type of approach, targeted therapies play an important role in the treatment of gastric cancer by interfering with gene expression or target proteins that play or regulate critical roles in tumor growth or progression, providing greater selectivity, efficacy and reduction of toxicity to the new generation of chemotherapy drugs for the treatment of cancer [34]. Genomic and genetic studies provide valuable information about genomic changes in tumor samples compared to normal tissue samples. These studies provide important tools for understanding key information about tumor initiation, progression, and metastasis [35]. In the present study, evaluating the transcriptional profile in gastric tumor samples is a strong strategy for identifying new molecular targets.
In searching for drug targets and discovering new drug candidates, computer-aided drug design (CADD) methodologies stand out as a powerful and promising technology for faster, cheaper and more effective drug design in drug research [36]. Furthermore, they provide an absolute starting point for drug target discovery. Faced with the high cost and time required for research and development of drugs in the oncology area, computational models represent an efficient alternative since they are capable of predicting physical-chemical, pharmacokinetic, pharmacodynamic and toxicological parameters from a given molecular structure, as well as optimizing the in vitro test step [36].
The results obtained so far in obtaining new drugs through in silico studies are notorious. For example, there is the development of the drug captopril, the first angiotensin-converting enzyme (ACE) inhibitor and one of the first successful drugs using computational tools to optimize drug planning in the 1980s [37]. Following this study, structure-based drug development exhibited a significant impact on drug design with an increasing number of applications and a rapid growth of computational tools for drug discovery, including anticancer therapies, was observed.
Structure-based virtual screening (SBVS) is a robust technique that allows rapid identification of biologically active compounds, providing an efficient and cost-effective alternative to high-throughput experimental screenings. This technique allows the prediction of the best mode of interaction between two molecules to form a stable complex. It uses scoring functions to estimate the strength of non-covalent interaction between a ligand and molecular target. Different successful examples of SBVS application are reported in the literature, evidencing its versatility, high performance and great utility in drug discovery programs. In this study, the SBVS technique enabled the identification of synthetic molecules with great potential to inhibit target proteins relevant to carcinogenesis and the establishment of gastric cancer. The ligands with the best classification, considering the minimum binding energy to the target, had their ADMET properties evaluated and underwent a molecular docking validation protocol.
Analyzing ADMET properties is an important step in drug design development. It refers to the processes of absorption (A), distribution (D), metabolism (M), excretion (E) and toxicity (T) still in the early stages of the drug discovery process. This step drastically reduces the fraction of failure related to pharmacokinetics in the clinical phases and the toxic effects associated with drugs [28].
Faced with the need to develop new therapeutic options to improve the effectiveness of gastric cancer treatment and patient survival statistics, targeted therapies stand out as instruments with great potential for therapeutic success. In this context, the present study points to the AJUBA, FBXL13, CCDC69, CD80 and NOLC1 proteins as potential candidates for targeted therapy in the treatment of GC.
The AJUBA protein has been implicated in the development of several human cancers. It is known that this protein participates in the assembly of countless protein complexes and is involved in several cellular biological processes, such as the repression of gene transcription, cell-cell adhesion, mitosis, differentiation, proliferation and cell migration [38]. Previous studies have shown that the AJUBA protein promotes colorectal cancer cell growth by suppressing the JAK1/STAT1/IFIT2 network and activating N-cadherin expression through interaction with Twist in colorectal cancer cells [39,40]. However, its expression pattern and biological significance in gastric cancer are still not fully elucidated.
In the present study, analysis of the micro-array metadata revealed that AJUBA gene expression was higher in gastric cancer samples than in normal tissues. By comparing the relative expression level by qRT-PCR of this gene in samples of gastric tumor cell lines (ACP-02, ACP-03, AGP-01 and AGS) and normal gastric cells (MNP-01), the results confirmed a significant increase in AJUBA gene expression level in AGP-01 and AGS cell lines. Data from the survival analysis obtained using the Kaplan-Meier plotter database revealed that the increase in AJUBA expression is closely associated with a reduction in the overall survival rates of patients affected by GC.
Dommann et al. [41] developed a study that analyzed the transcriptome of SW480 human colon cancer cell lines by RNA sequencing and confirmed the sequencing data with biological assays. In this analysis, it was possible to conclude that cells devoid of AJUBA were less proliferative, more sensitive to irradiation, migrated less and were less efficient in forming colonies. Furthermore, loss of AJUBA expression decreased tumor burden in a murine model of colorectal metastasis to the liver [41].
From these data, it is assumed that the inhibition of the AJUBA protein in patients with gastric cancer can reproduce the phenomena observed in the work of Dommann et al. [41]. Thus, compounds that inhibit this target may represent a new therapeutic alternative for GC.
The FBXL13 protein (F-box and leucine-rich repeat protein 13) is a member of the F-box family and substrate recognition component of the SCF-like ubiquitin ligase E3 complex (SKP1-CUL1-F-box), acting as a protein-ubiquitin ligase.
A study by Fung et al. [42] characterized FBXL13 as a microtubule activity regulator and highlighted its role in promoting cell motility with potential tumor-promoting implications. Among the results shown, it was verified that FBXL13 interacts with the centrosome proteins Centrin-3, Centrin-152 and CEP192, the latter being a key factor in the initiation process of centrosome duplication and the control of centrosome microtubule nucleation [42]. Data from this study indicate that the ubiquitylation of CEP192 by FBXL13 is relevant to regulate the formation of centrosome microtubule arrays and the migration of cancer cells [42]. Being observed that the lack of centrosome microtubule arrays induced by FBXL13 overexpression facilitates cell migration. Meanwhile, FBXL13 depletion induces the accumulation of CEP192, promoting the formation of microtubule arrays in centrosomes, which, in turn, hinders cell migration [42]. Given this, it is understood that the increased expression of the FBXL13 gene may be decisive for the aberrant centrosome organization of cancer cells by promoting changes in the nucleation capacity of microtubules and, consequently, allowing tumor cells to present an increased capacity for proliferation and invasion.
Expression data from the Cancer Cell Line Encyclopedia reveal amplification of FBXL13 in many cancer cell lines, many of which originate from breast cancers, glioblastomas, and lung cancer [43]. Furthermore, an online repository of cancer patient cohorts showed that FBXL13 is frequently amplified in solid tumors such as non-epithelial prostate cancer (20%), breast cancer (20%), esophageal cancer (10%) and head and neck cancer (10%) (cBioPortal) [43].
In a CRISPR/Cas9 screening performed by Hart et al. [44], it was seen that the FBXL13 knockout reduced proliferation in a patient-derived glioblastoma cell line, with centrosome microtubule dysregulation being implicated as the cause of oncogenic aberrations [45]. In microtubule-dependent processes, it has been shown that dysregulation of centrosome microtubules causes oncogenic aberrations. Among the signs of malignant transformation, cell-cell adhesion loss and cell polarization were observed [46].
In an assay carried out in the present study by detection by real-time PCR (qRT-PCR), the expression of the FBXL13 gene in AGP-01 cells (intestinal-type metastatic tumor lineage) was notably higher compared to normal gastric cells (MNP-01). The described results reinforce the need to search for compounds capable of interacting with the protein encoded by the FBXL13 gene as a therapeutic alternative, as well as to understand more deeply the function of the F-box protein family in tumors, which may provide new insights into the role of centrosomes in cancer motility, invasion, and metastasis.
The CCDC69 protein, a coil domain-containing protein (CCDC) family member, regulates cell cycle progression and mediates apoptosis following DNA damage in eukaryotic cells. Recent studies have shown that CCDC proteins are closely related to various tumors, such as lung cancer and pancreatic ductal adenocarcinoma. Results of studies developed by Pal et al. [47] indicate that CCDC69 acts as a framework to regulate the recruitment of midzone components and the assembly of central spindles, with the formation of the central spindle being essential for cytoplasmic division (cytokinesis) in animal cells [47]. RNA interference (RNAi)-mediated knockdown of CCDC69 protein led to the formation of aberrant central spindles and disrupted the localization of midzone components such as aurora B kinase, cytokinesis protein regulator 1 (PRC1), MgcRacGAP/HsCYK -4 and polo-like kinase 1 (Plk1) in the central spindle [47].
Until now, expression characteristics and mechanisms of the CCDC69 gene in patients with gastric cancer have not been well described in the literature. The results of our study demonstrated, in the analysis of the micro-array metadata, that gene expression was lower in samples of gastric cancer tumors than in normal tissues. Real-time PCR detection revealed a significant increase in the expression level of the CCDC69 gene in ACP-02 and ACP-03 cells. Survival analysis data obtained using the Kaplan-Meier plotter database revealed that increased expression of CCDC69 is associated with reduced overall survival rates of patients affected by GC.
Similar results were observed in a survey by Yi et al. [48], in which CCDC69 was identified as a potential biomarker to predict the prognosis of breast cancer (BC). This study evaluated the relationship between CCDC69 expression levels in breast cancer (BC) samples and their tumor clinical characteristics. For this purpose, RNA-seq information on CB samples from the TCGA database was used. The results showed that CCDC69 expression was significantly lower in cancer samples than in normal tissues. Furthermore, low expression of CCDC69 was associated with poor overall survival based on the Affymetrix microarray in the Kaplan-Meier plotter database [48].
CD80 plays an important role in T cell activation, exerting a dual effect on tumor immunity: it binds to CD28 to provide a costimulatory signal for T cell activation, and it binds to CTLA-4, resulting in an immunosuppressive effect. It is understood that the binding of CD80 with CTLA-4, a receptor that acts as an important negative regulator of T-cell responses, is favorable to carcinogenesis. Because, commonly, cancer cells use the immunosuppressive function of regulatory T cells to avoid immunological attacks [49,50,51].
Based on this understanding, a monoclonal antibody against CTLA-4 (ipilimumab) was approved by the FDA (Food and Drug Administration) for the treatment of melanoma [52]. Ipilimumab blocks the co-inhibitory signal induced by CTLA-4 binding with CD80 to enable CTL-mediated antitumor immunity [51].
Considering the positive results of blockade of the co-inhibitory signal induced by the binding of CTLA-4 with CD80 for patients with melanoma, it is believed that it is important to obtain a greater understanding of expression data and the function of CD80 in gastric cancer, as well as to characterize the existing molecular interaction between CTLA-4 and CD80 proteins.
The analysis of the protein interactions network developed in the present study using the STRING v11.5 tool made it possible to evaluate the protein-protein interactions network. Among the results of our study, it was revealed through a molecular docking assay that the molecular binding between the CTLA-4 and CD80 proteins is altered after the anchoring of the MCULE-9178344200-0-1 compound to the CD80 protein (Figure 6). Alteration of the molecular binding between the two proteins may result in the functional change of this interaction and, consequently, promote the blockade of the co-inhibitory signal induced by the binding of CTLA-4 with CD80.
Concerning CD80 expression and function data in gastric cancer, the results of our study revealed an increase in the expression level of the CD80 gene in samples of gastric cancer tumors to normal tissues in the micro-array metadata analysis, as well as in real-time PCR detection, which revealed a significant increase in the expression level of the CD80 gene in the ACP-03 cell line. Survival analysis data obtained using the Kaplan-Meier plotter database revealed that increased CD80 expression is associated with reduced overall survival rates of patients affected by GC. These results show the protein and the CD80 gene as potential successful therapeutic targets for the control of GC.
On the other hand, in a study by Feng et al. [51], the determination of CD80 mRNA levels in gastric adenocarcinoma tissues and adjacent normal tissues by RT-qPCR was performed. As a result, it was seen that CD80 is down-regulated in gastric cancer tissues in 15 out of 20 patients compared to normal gastric tissue. Specifically, 70% of gastric tumor tissues demonstrated reduced CD80 expression [51]. Thus, it is important to consider that the CD80 gene is differentially expressed in gastric adenocarcinoma cell lines.
The NOLC1 protein (nucleolar and coiled-body phosphoprotein 1) is responsible for various cellular life activities, including ribosome biosynthesis, DNA replication, transcription regulation, RNA processing, cell cycle regulation, apoptosis, and cell regeneration [53]. Our results demonstrated that gene expression was higher in samples of gastric cancer tumors than in normal tissues (Figure 2), which was confirmed by RT-qPCR for the GC cell lines ACP-03 and AGS (Figure 4). Data obtained using the Kaplan-Meier plotter database revealed that patients affected by GC with overexpression of NOLC1 have shorter overall survival than those with low expression of NOLC1 (Figure 3). Additionally, the gene enrichment analysis suggests the participation of the NOLC1 gene as an important regulator for the development and progression of gastric tumors.
In a study carried out by Kong et al. [54], the role of NOLC1 in esophageal cancer (ESCA) was determined, as well as its gene expression in ESCA tissues and cell lines evaluated by qRT-PCR, immunohistochemistry or western blot. Among the results, overexpression of NOLC1 was observed in ESCA tissues and ESCA cell lines (EC9706, Eca109, TE-13, Kyse170, T.TN) compared to adjacent normal tissues and normal esophageal cell lines. NOLC1 overexpression was markedly associated with larger tumor size, lymph node metastases, and advanced TNM stage.
The results of the correlation between NOLC1 gene expression and overall survival by Kaplan Meier plotter for patients with esophageal cancer coincided with the data obtained for patients with gastric cancer, evaluated in our study. So NOLC1 overexpression was also associated with reduced overall survival rates for patients with ESCA. NOLC1 knockdown, in turn, inhibited proliferation, migration, invasion and cyclin B1 expression and promoted apoptosis and cleaved-caspase-3 expression of two ESCA cell lines [54]. The in-depth study of data on NOLC1 gene expression and its role in carcinogenesis shows that the protein encoded by this gene is a promising therapeutic target.
Cell life is a result of the interaction and coordinated activity of many proteins working at the same time. Different proteins from different pathways work together to provide a meaningful biological process essential to cell development [54,55,56]. In cancer, protein-protein interaction is essential to form complexes allowing uncontrolled cellular division, development, growth, and tumor promotion. Recently, cancer, neurodegenerative diseases and even infections have been attributed as a result of aberrant protein-protein interactions [56]. In cancer, aberrant proteins interact with other proteins, establishing the initial stages of cancer [55,56]. Based on that, protein-protein interaction analysis has become an alternative target for developing new anticancer compounds [55]. Based on that, a protein-protein interaction analysis of the targets used in this study was performed (Figure 6). The protein-protein interaction analysis revealed that all targets involved in this work are pivotal in their pathways.
For example, the AJUBA proteins revealed an interaction with the proteins CTNNB1 and β-catenin (Figure 6A). The CTNNB1 regulates cellular adhesion and gene transcription during the mitotic fuse establishment [57]. The β-catenin is a component of the centrosome during the interphase [57]. Bahmanyar et al. [57] suggested that aberrant interactions between AJUBA protein and CTNNB1 and β-catenin led to uncontrolled cellular division and, thus, cancer development. Our results revealed that the molecule MCULE-2386589557-0-6 interacts with the AJUBA leading to a misplaced interaction between AJUBA and CTNNB1, interfering in this pathway and probably preventing their role in cancer establishment.

5. Conclusions

Although tumor markers for different types of cancer have been rapidly discovered in recent years, there is still a lack of specific and sensitive tumor markers for GC management. Combining a systematic collection of public microarray data with a comparative meta-profile approach provided a suitable platform for concluding. This activation of pathways shows that these genes are important in carcinogenesis and are probably the result of the convergence of several transforming processes in various cellular contexts. Furthermore, the significant overexpression of these genes implies that they may be useful therapeutic targets.
Targeted therapies stand out as instruments with great potential for therapeutic success. Our results point to the AJUBA, FBXL13, CCDC69, CD80 and NOLC1 proteins as candidates for targeted therapy in the treatment of GC. Using a virtual screening approach, a molecular docking study was performed for proteins encoded by genes that play important roles in cellular functions for carcinogenesis.
This study contributed to identifying five compounds with favorable pharmacokinetic, pharmacodynamic and toxicological properties, which showed promising results in the molecular docking assay against protein targets, providing information that may help these compounds become a potential chemotherapeutic in the clinical therapy of GC. Additional in vivo or in vitro studies may be required to confirm the anticancer activity of these compounds.

Funding

This work was supported by the National Council for Scientific and Technological Development (CNPq) for a research grant to Rommel Mario Rodrigues (403493/2021-8), for a research productivity grant to Raquel Carvalho Montenegro (305459/2019-8), Pedro Filho Noronha Souza (305003/2022-4), Felipe Pantoja Mesquita thanks for providing the postdoctoral grant (PDJ program – number 151388/2022-9). Raquel Carvalho Montenegro also thanks Red Latinoamericana de Implementación y Validación de guias clínicas Farmacogenomicas (RELIVAF) for supporting this work. The APC was funded by Pró-Reitoria de Pesquisa e Pós-Graduação (PROPESP) from the Federal University of Pará (UFPA). We also thank the office of Coordination for the Improvement of Higher Education Personnel (CAPES).

Acknowledgments

The authors thank the Brazilian Agencies CNPq, CAPES, FUNCAP and the Federal University of Ceara for fellowships and financial support. The authors thank the multiuser unit of the Drug Research and Development Center (NPDM) of the Federal University of Ceara for technical support.

Declaration of Competing Interests

The authors declare no conflict of interest.

References

  1. Smyth, E.C.; Nilsson, M.; Grabsch, H.I.; van Grieken, N.C.; Lordick, F. Gastric Cancer. Lancet 2020, 396, 635–648. [Google Scholar] [CrossRef] [PubMed]
  2. Sung, H.; Ferlay, J.; Siegel, R.L.; Laversanne, M.; Soerjomataram, I.; Jemal, A.; Bray, F. Global Cancer Statistics 2020: GLOBOCAN Estimates of Incidence and Mortality Worldwide for 36 Cancers in 185 Countries. CA. Cancer J. Clin. 2021, 71, 209–249. [Google Scholar] [CrossRef] [PubMed]
  3. Liu, Y.; Ao, X.; Wang, Y.; Li, X.; Wang, J. Long Non-Coding RNA in Gastric Cancer: Mechanisms and Clinical Implications for Drug Resistance. Front. Oncol. 2022, 12, 1–15. [Google Scholar] [CrossRef] [PubMed]
  4. INCA. Estimativa 2023 : Incidência de Câncer No Brasil / Instituto Nacional de Câncer; 2022; ISBN 9786588517093. [Google Scholar]
  5. LAUREN, P. THE TWO HISTOLOGICAL MAIN TYPES OF GASTRIC CARCINOMA: DIFFUSE AND SO-CALLED INTESTINAL-TYPE CARCINOMA. AN ATTEMPT AT A HISTO-CLINICAL CLASSIFICATION. Acta Pathol. Microbiol. Scand. 1965, 64, 31–49. [Google Scholar] [CrossRef] [PubMed]
  6. Sasako, M.; Sakuramoto, S.; Katai, H.; Kinoshita, T.; Furukawa, H.; Yamaguchi, T.; Nashimoto, A.; Fujii, M.; Nakajima, T.; Ohashi, Y. Five-Year Outcomes of a Randomized Phase III Trial Comparing Adjuvant Chemotherapy with S-1 versus Surgery Alone in Stage II or III Gastric Cancer. J. Clin. Oncol. 2011, 29, 4387–4393. [Google Scholar] [CrossRef]
  7. Leichman, L.; Silberman, H.; Leichman, C.G.; Spears, C.P.; Ray, M.; Muggia, F.M.; Kiyabu, M.; Radin, R.; Laine, L.; Stain, S.; et al. Preoperative Systemic Chemotherapy Followed by Adjuvant Postoperative Intraperitoneal Therapy for Gastric Cancer: A University of Southern California Pilot Program. J. Clin. Oncol. 1992, 10, 1933–1942. [Google Scholar] [CrossRef]
  8. Ajani, J.A.; Mansfield, P.F.; Lynch, P.M.; Pisters, P.W.; Feig, B.; Dumas, P.; Evans, D.B.; Raijman, I.; Hargraves, K.; Curley, S.; et al. Enhanced Staging and All Chemotherapy Preoperatively in Patients with Potentially Resectable Gastric Carcinoma. J. Clin. Oncol. 1999, 17, 2403–2411. [Google Scholar] [CrossRef]
  9. Guan, W.L.; He, Y.; Xu, R.H. Gastric Cancer Treatment: Recent Progress and Future Perspectives. J. Hematol. Oncol. 2023 161 2023, 16, 1–28. [Google Scholar] [CrossRef]
  10. Joshi, S.S.; Badgwell, B.D. Current Treatment and Recent Progress in Gastric Cancer. CA. Cancer J. Clin. 2021, 71, 264–279. [Google Scholar] [CrossRef]
  11. Miller, Z.; Kim, K.S.; Lee, D.M.; Kasam, V.; Baek, S.E.; Lee, K.H.; Zhang, Y.Y.; Ao, L.; Carmony, K.; Lee, N.R.; et al. Proteasome Inhibitors with Pyrazole Scaffolds from Structure-Based Virtual Screening. J. Med. Chem. 2015, 58, 2036–2041. [Google Scholar] [CrossRef]
  12. Rohr, M.; Beardsley, J.; Nakkina, S.P.; Zhu, X.; Aljabban, J.; Hadley, D.; Altomare, D. A Merged Microarray Meta-Dataset for Transcriptionally Profiling Colorectal Neoplasm Formation and Progression. Sci. data 2021, 8, 214. [Google Scholar] [CrossRef] [PubMed]
  13. Liberzon, A.; Subramanian, A.; Pinchback, R.; Thorvaldsdóttir, H.; Tamayo, P.; Mesirov, J.P. Molecular Signatures Database (MSigDB) 3.0. Bioinformatics 2011, 27, 1739–1740. [Google Scholar] [CrossRef] [PubMed]
  14. Subramanian, A.; Tamayo, P.; Mootha, V.K.; Mukherjee, S.; Ebert, B.L.; Gillette, M.A.; Paulovich, A.; Pomeroy, S.L.; Golub, T.R.; Lander, E.S.; et al. Gene Set Enrichment Analysis: A Knowledge-Based Approach for Interpreting Genome-Wide Expression Profiles. Proc. Natl. Acad. Sci. U. S. A. 2005, 102, 15545–15550. [Google Scholar] [CrossRef] [PubMed]
  15. Győrffy, B. Discovery and Ranking of the Most Robust Prognostic Biomarkers in Serous Ovarian Cancer. GeroScience 2023. [Google Scholar] [CrossRef] [PubMed]
  16. Maués, J.H. da S.; Ribeiro, H.F.; Pinto, G.R.; Lopes, L. de O.; Lamarao, L.M.; Pessoa, C.M.F.; Moreira-Nunes, C. de F.A.; Carvalho, R.M. de; Assumpção, P.P.; Rey, J.A. Gastric Cancer Cell Lines Have Different MYC-Regulated Expression Patterns but Share a Common Core of Altered Genes. Can. J. Gastroenterol. Hepatol. 2018, 2018. [Google Scholar]
  17. Riquelme, I.; Tapia, O.; Espinoza, J.A.; Leal, P.; Buchegger, K.; Sandoval, A.; Bizama, C.; Araya, J.C.; Peek, R.M.; Roa, J.C. The Gene Expression Status of the PI3K/AKT/MTOR Pathway in Gastric Cancer Tissues and Cell Lines. Pathol. Oncol. Res. 2016, 22, 797–805. [Google Scholar] [CrossRef] [PubMed]
  18. Mesquita, F.P.; Lucena da Silva, E.; Souza, P.F.N.; Lima, L.B.; Amaral, J.L.; Zuercher, W.; Albuquerque, L.M.; Rabenhorst, S.H.B.; Moreira-Nunes, C.A.; Amaral de Moraes, M.E.; et al. Kinase Inhibitor Screening Reveals Aurora-a Kinase Is a Potential Therapeutic and Prognostic Biomarker of Gastric Cancer. J. Cell. Biochem. 2021, 122, 1376–1388. [Google Scholar] [CrossRef]
  19. Bustin, S.A.; Beaulieu, J.-F.; Huggett, J.; Jaggi, R.; Kibenge, F.S.B.; Olsvik, P.A.; Penning, L.C.; Toegel, S. MIQE Precis: Practical Implementation of Minimum Standard Guidelines for Fluorescence-Based Quantitative Real-Time PCR Experiments. BMC Mol. Biol. 2010, 11, 1–5. [Google Scholar] [CrossRef]
  20. Varadi, M.; Anyango, S.; Deshpande, M.; Nair, S.; Natassia, C.; Yordanova, G.; Yuan, D.; Stroe, O.; Wood, G.; Laydon, A.; et al. AlphaFold Protein Structure Database: Massively Expanding the Structural Coverage of Protein-Sequence Space with High-Accuracy Models. Nucleic Acids Res. 2022, 50, D439–D444. [Google Scholar] [CrossRef]
  21. Jumper, J.; Evans, R.; Pritzel, A.; Green, T.; Figurnov, M.; Ronneberger, O.; Tunyasuvunakool, K.; Bates, R.; Žídek, A.; Potapenko, A.; et al. Highly Accurate Protein Structure Prediction with AlphaFold. Nature 2021, 596, 583–589. [Google Scholar] [CrossRef]
  22. DeLano, W.L.; Lam, J. PyMOL: A Communications Tool for Computational Models. 2005. [Google Scholar]
  23. Kiss, R.; Sandor, M.; Szalai, F.A. Http://Mcule.Com: A Public Web Service for Drug Discovery. J. Cheminform. 2012, 4, 2012. [Google Scholar] [CrossRef]
  24. Muteeb, G.; Rehman, M.T.; AlAjmi, M.F.; Aatif, M.; Farhan, M.; Shafi, S. Identification of a Potential Inhibitor (MCULE-8777613195-0-12) of New Delhi Metallo-β-Lactamase-1 (NDM-1) Using In Silico and In Vitro Approaches. Molecules 2022, 27. [Google Scholar] [CrossRef]
  25. Lipinski, C.A.; Lombardo, F.; Dominy, B.W.; Feeney, P.J. Experimental and Computational Approaches to Estimate Solubility and Permeability in Drug Discovery and Development Settings. Adv. Drug Deliv. Rev. 2012, 64, 4–17. [Google Scholar] [CrossRef]
  26. Lipinski, C.A. Drug-like Properties and the Causes of Poor Solubility and Poor Permeability. J. Pharmacol. Toxicol. Methods 2000, 44, 235–249. [Google Scholar] [CrossRef] [PubMed]
  27. Banerjee, P.; Eckert, A.O.; Schrey, A.K.; Preissner, R. ProTox-II: A Webserver for the Prediction of Toxicity of Chemicals. Nucleic Acids Res. 2018, 46, W257–W263. [Google Scholar] [CrossRef] [PubMed]
  28. Daina, A.; Zoete, V. A BOILED-Egg To Predict Gastrointestinal Absorption and Brain Penetration of Small Molecules. ChemMedChem 2016, 1117–1121. [Google Scholar] [CrossRef] [PubMed]
  29. Daina, A.; Michielin, O.; Zoete, V. SwissADME: A Free Web Tool to Evaluate Pharmacokinetics, Drug-Likeness and Medicinal Chemistry Friendliness of Small Molecules. Sci. Rep. 2017, 7, 1–13. [Google Scholar] [CrossRef] [PubMed]
  30. De Magalhães, C.S.; Almeida, D.M.; Barbosa, H.J.C.; Dardenne, L.E. A Dynamic Niching Genetic Algorithm Strategy for Docking Highly Flexible Ligands. Inf. Sci. (Ny). 2014, 289, 206–224. [Google Scholar] [CrossRef]
  31. Guedes, I.A.; Barreto, A.M.S.; Marinho, D.; Krempser, E.; Kuenemann, M.A.; Sperandio, O.; Dardenne, L.E.; Miteva, M.A. New Machine Learning and Physics-Based Scoring Functions for Drug Discovery. Sci. Rep. 2021, 11, 1–19. [Google Scholar] [CrossRef]
  32. Inbar, Y.; Schneidman-Duhovny, D.; Halperin, I.; Oron, A.; Nussinov, R.; Wolfson, H.J. Approaching the CAPRI Challenge with an Efficient Geometry-Based Docking. In Proceedings of the Proteins: Structure, Function and Genetics; Proteins, August 1 2005; Vol. 60; pp. 217–223. [Google Scholar]
  33. Housman, G.; Byler, S.; Heerboth, S.; Lapinska, K.; Longacre, M.; Snyder, N.; Sarkar, S. Drug Resistance in Cancer: An Overview. Cancers (Basel). 2014, 6, 1769–1792. [Google Scholar] [CrossRef]
  34. Borriello, A.; Caldarelli, I.; Basile, M.A.; Bencivenga, D.; Tramontano, A.; Perrotta, S.; della Ragione, F.; Oliva, A. The Tyrosine Kinase Inhibitor Dasatinib Induces a Marked Adipogenic Differentiation of Human Multipotent Mesenchymal Stromal Cells. PLoS One 2011, 6. [Google Scholar] [CrossRef] [PubMed]
  35. Yi, Y.; Xu, T.; Tan, Y.; Lv, W.; Zhao, C.; Wu, M.; Wu, Y.; Zhang, Q. CCDC69 Is a Prognostic Marker of Breast Cancer and Correlates with Tumor Immune Cell Infiltration. Front. Surg. 2022, 9, 1–12. [Google Scholar] [CrossRef] [PubMed]
  36. Prieto-Martínez, F.D.; López-López, E.; Eurídice Juárez-Mercado, K.; Medina-Franco, J.L. Computational Drug Design Methods—Current and Future Perspectives. Silico Drug Des. Repurposing Tech. Methodol. 2019, 19–44. [Google Scholar] [CrossRef]
  37. Anthony, L.F.W.; Kanding, B.; Selvan, R. Carbontracker: Tracking and Predicting the Carbon Footprint of Training Deep Learning Models. arXiv Prepr. arXiv2007.03051 2020. [Google Scholar]
  38. Song, Y.; Ye, L.; Tan, Y.; Tong, H.; Lv, Z.; Wan, X.; Li, Y. Therapeutic Exosomes Loaded with SERPINA5 Attenuated Endometrial Cancer Cell Migration via the Integrin Β1/FAK Signaling Pathway. Cell. Oncol. 2022, 45, 861–872. [Google Scholar] [CrossRef] [PubMed]
  39. Wu, H.; Cui, M.; Li, C.; Li, H.; Dai, Y.; Cui, K.; Li, Z. Kaempferol Reverses Aerobic Glycolysis via MiR-339-5p-Mediated PKM Alternative Splicing in Colon Cancer Cells. J. Agric. Food Chem. 2021, 69, 3060–3068. [Google Scholar] [CrossRef] [PubMed]
  40. Jia, H.; Song, L.; Cong, Q.; Wang, J.; Xu, H.; Chu, Y.; Li, Q.; Zhang, Y.; Zou, X.; Zhang, C. The LIM Protein AJUBA Promotes Colorectal Cancer Cell Survival through Suppression of JAK1/STAT1/IFIT2 Network. Oncogene 2017, 36, 2655–2666. [Google Scholar] [CrossRef] [PubMed]
  41. Dommann, N.; Sánchez-Taltavull, D.; Eggs, L.; Birrer, F.; Brodie, T.; Salm, L.; Baier, F.A.; Medova, M.; Humbert, M.; Tschan, M.P. The LIM Protein Ajuba Augments Tumor Metastasis in Colon Cancer. Cancers (Basel). 2020, 12, 1913. [Google Scholar] [CrossRef]
  42. Fung, E.; Richter, C.; Yang, H.; Schäffer, I.; Fischer, R.; Kessler, B.M.; Bassermann, F.; D’Angiolella, V. FBXL 13 Directs the Proteolysis of CEP 192 to Regulate Centrosome Homeostasis and Cell Migration. EMBO Rep. 2018, 19, e44799. [Google Scholar] [CrossRef]
  43. Barretina, J.; Caponigro, G.; Stransky, N.; Venkatesan, K.; Margolin, A.A.; Kim, S.; Wilson, C.J.; Lehár, J.; Kryukov, G. V.; Sonkin, D.; et al. The Cancer Cell Line Encyclopedia Enables Predictive Modelling of Anticancer Drug Sensitivity. Nature 2012, 483, 603–607. [Google Scholar] [CrossRef]
  44. Hart, T.; Chandrashekhar, M.; Aregger, M.; Steinhart, Z.; Brown, K.R.; MacLeod, G.; Mis, M.; Zimmermann, M.; Fradet-Turcotte, A.; Sun, S. High-Resolution CRISPR Screens Reveal Fitness Genes and Genotype-Specific Cancer Liabilities. Cell 2015, 163, 1515–1526. [Google Scholar] [CrossRef] [PubMed]
  45. Hart, T.; Chandrashekhar, M.; Aregger, M.; Steinhart, Z.; Brown, K.R.; MacLeod, G.; Mis, M.; Zimmermann, M.; Fradet-Turcotte, A.; Sun, S.; et al. High-Resolution CRISPR Screens Reveal Fitness Genes and Genotype-Specific Cancer Liabilities. Cell 2015, 163, 1515–1526. [Google Scholar] [CrossRef] [PubMed]
  46. Schnerch, D.; Nigg, E.A. Structural Centrosome Aberrations Favor Proliferation by Abrogating Microtubule-Dependent Tissue Integrity of Breast Epithelial Mammospheres. Oncogene 2016, 35, 2711–2722. [Google Scholar] [CrossRef] [PubMed]
  47. Pal, D.; Wu, D.; Haruta, A.; Matsumura, F.; Wei, Q. Role of a Novel Coiled-Coil Domain-Containing Protein CCDC69 in Regulating Central Spindle Assembly. Cell cycle 2010, 9, 4117–4129. [Google Scholar] [CrossRef] [PubMed]
  48. Yi, Y.; Xu, T.; Tan, Y.; Lv, W.; Zhao, C.; Wu, M.; Wu, Y.; Zhang, Q. CCDC69 Is a Prognostic Marker of Breast Cancer and Correlates with Tumor Immune Cell Infiltration. Front. Surg. 2022, 9, 879921. [Google Scholar] [CrossRef] [PubMed]
  49. Li, J.; Yang, Y.; Inoue, H.; Mori, M.; Akiyoshi, T. The Expression of Costimulatory Molecules CD80 and CD86 in Human Carcinoma Cell Lines: Its Regulation by Interferon Gamma and Interleukin-10. Cancer Immunol. Immunother. 1996, 43, 213–219. [Google Scholar] [CrossRef] [PubMed]
  50. Horn, L.A.; Long, T.M.; Atkinson, R.; Clements, V.; Ostrand-Rosenberg, S. Soluble CD80 Protein Delays Tumor Growth and Promotes Tumor-Infiltrating Lymphocytes. Cancer Immunol. Res. 2018, 6, 59–68. [Google Scholar] [CrossRef] [PubMed]
  51. Feng, X.Y.; Lu, L.; Wang, K.F.; Zhu, B.Y.; Wen, X.Z.; Peng, R.Q.; Ding, Y.; Li, D.D.; Li, J.J.; Li, Y.; et al. Low Expression of CD80 Predicts for Poor Prognosis in Patients with Gastric Adenocarcinoma. Future Oncol. 2019, 15, 473–483. [Google Scholar] [CrossRef]
  52. Peggs, K.S.; Quezada, S.A. Ipilimumab: Attenuation of an Inhibitory Immune Checkpoint Improves Survival in Metastatic Melanoma. Expert Rev. Anticancer Ther. 2010, 10, 1697–1701. [Google Scholar] [CrossRef]
  53. Zhai, F.; Wang, J.; Luo, X.; Ye, M.; Jin, X. Roles of NOLC1 in Cancers and Viral Infection. J. Cancer Res. Clin. Oncol. 2023. [Google Scholar] [CrossRef]
  54. Kong, F.; Shang, Y.; Diao, X.; Huang, J.; Liu, H. Knockdown of NOLC1 Inhibits PI3K-AKT Pathway to Improve the Poor Prognosis of Esophageal Carcinoma. J. Oncol. 2021, 2021. [Google Scholar] [CrossRef]
  55. L. Garner, A.; D. Janda, K. Protein-Protein Interactions and Cancer: Targeting the Central Dogma. Curr. Top. Med. Chem. 2010, 11, 258–280. [Google Scholar] [CrossRef]
  56. Lu, H.; Zhou, Q.; He, J.; Jiang, Z.; Peng, C.; Tong, R.; Shi, J. Recent Advances in the Development of Protein–Protein Interactions Modulators: Mechanisms and Clinical Trials. Signal Transduct. Target. Ther. 2020, 5. [Google Scholar] [CrossRef]
  57. Bahmanyar, S.; Kaplan, D.D.; DeLuca, J.G.; Giddings, T.H.; O’Toole, E.T.; Winey, M.; Salmon, E.D.; Casey, P.J.; Nelson, W.J.; Barth, A.I.M. β-Catenin Is a Nek2 Substrate Involved in Centrosome Separation. Genes Dev. 2008, 22, 91–105. [Google Scholar] [CrossRef]
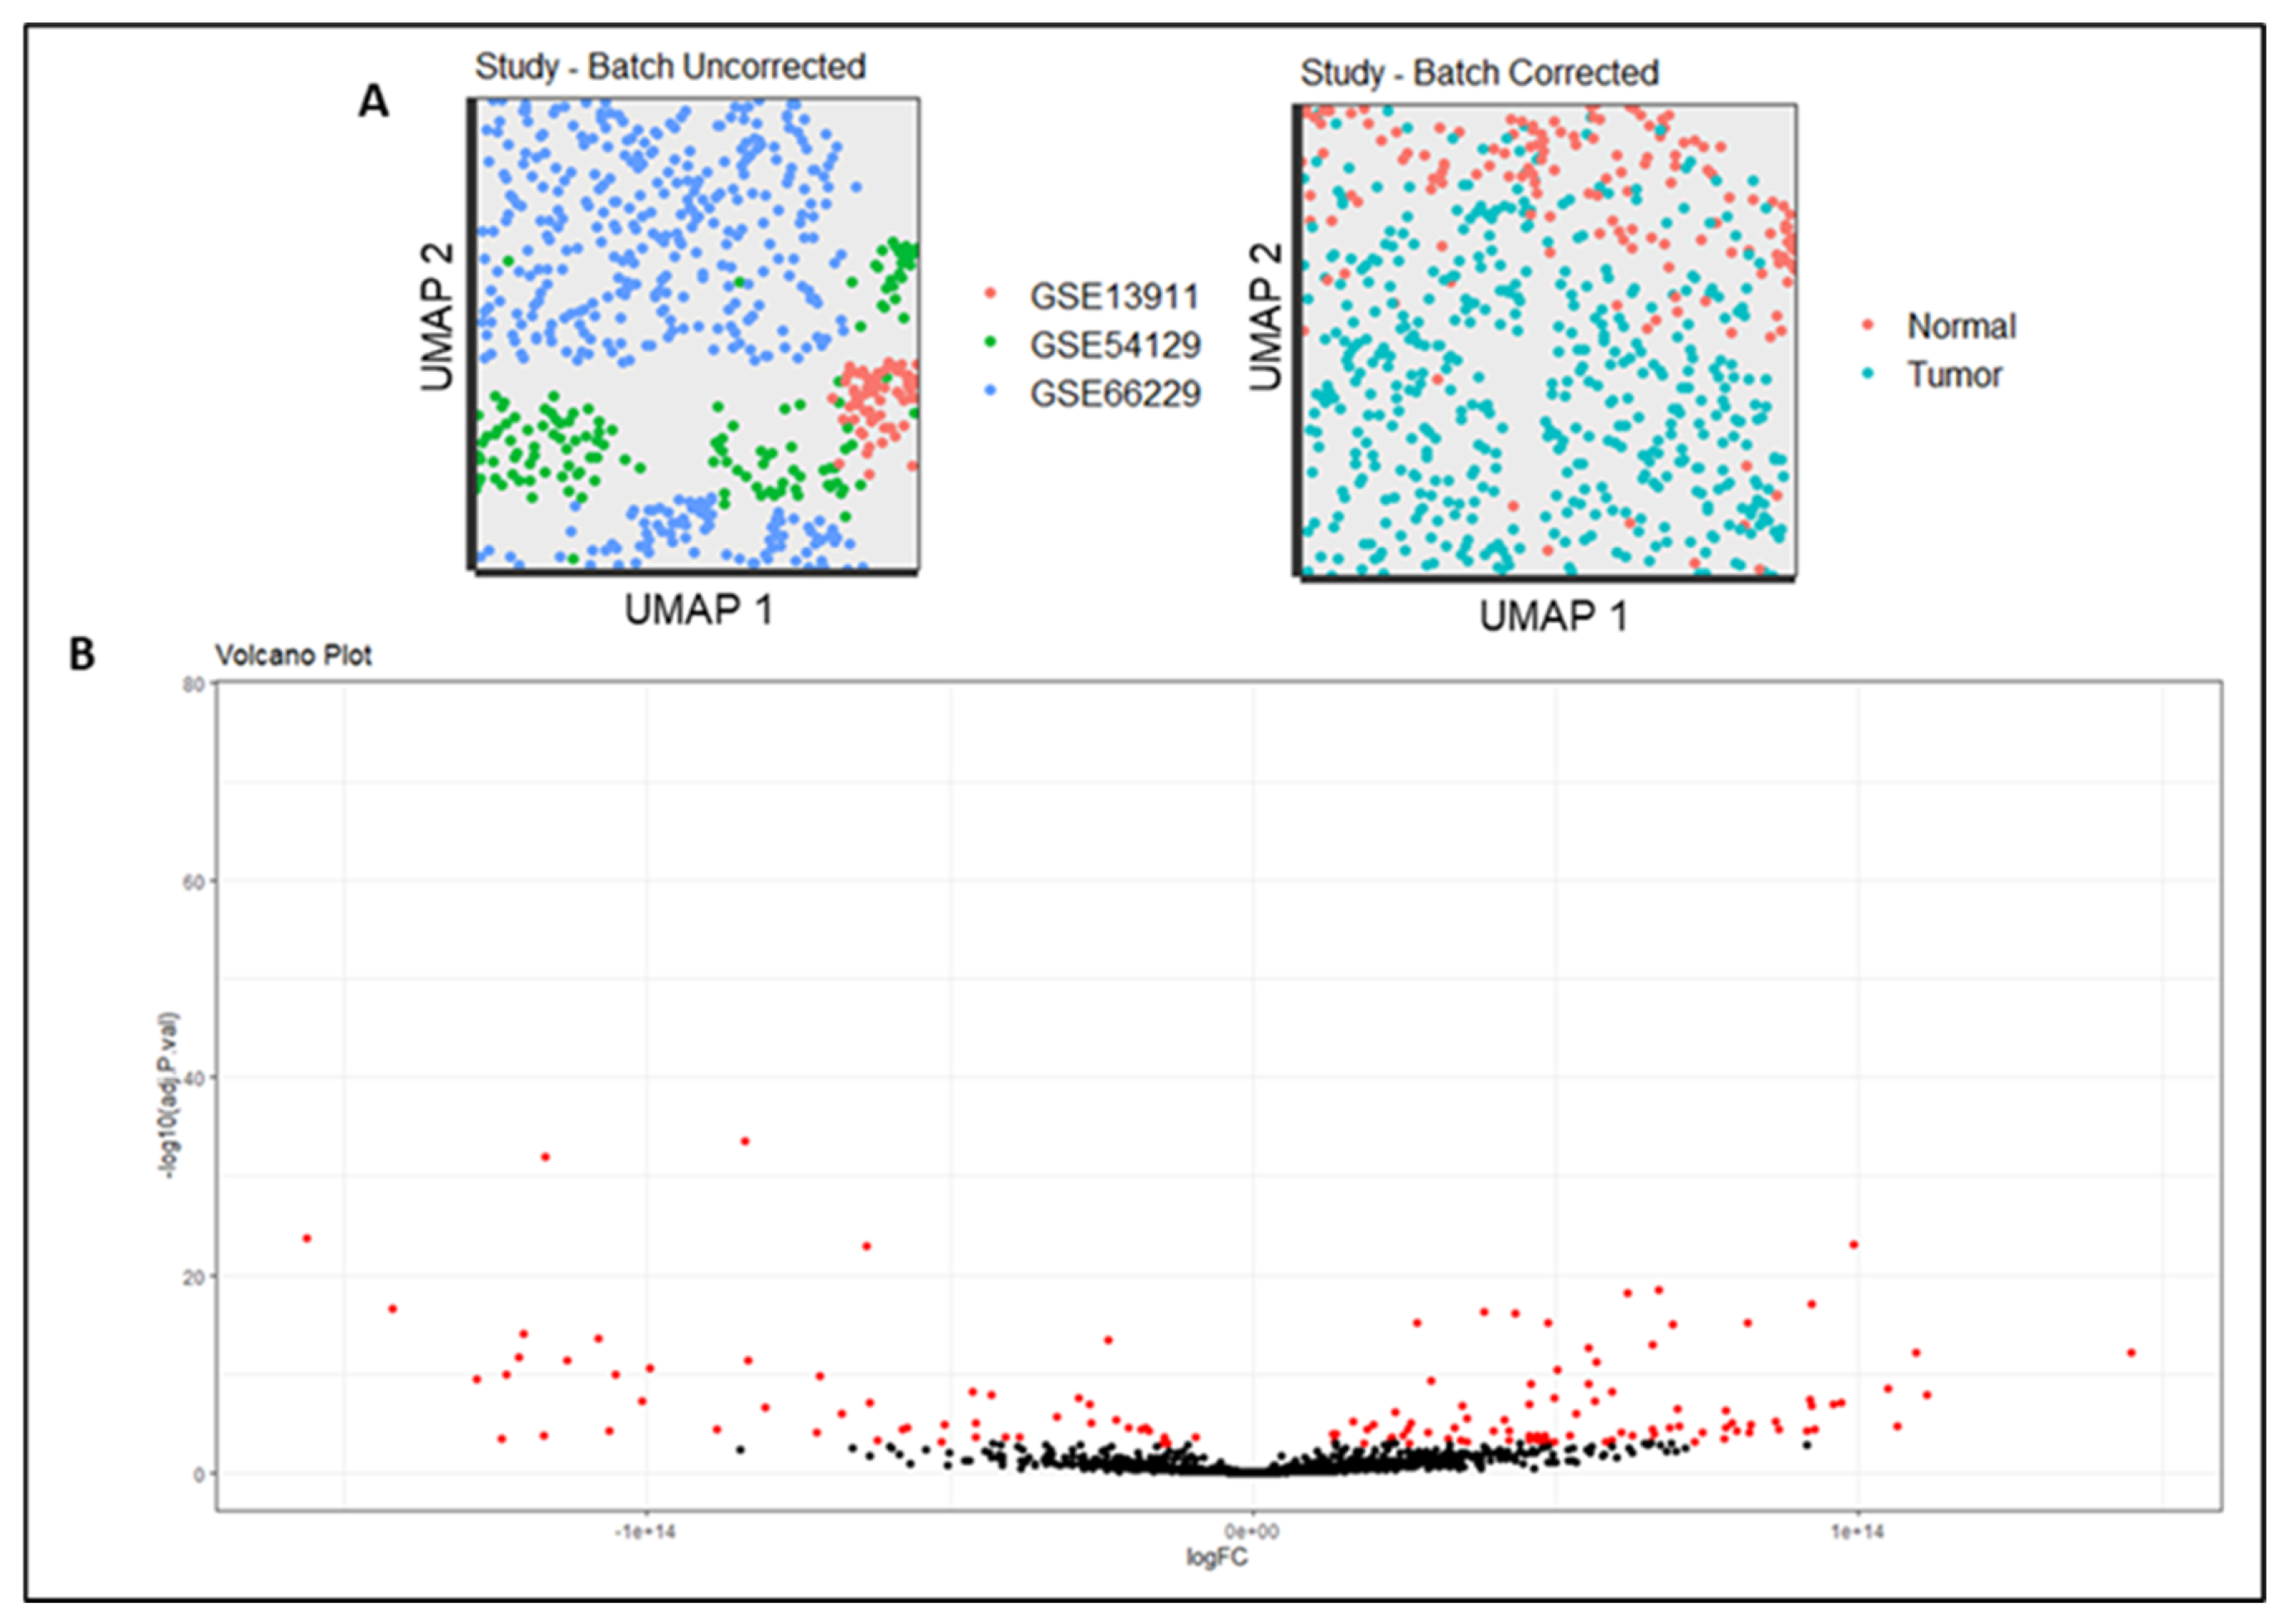
Figure 1. (A) Batch effect corrected among the studies. (B) Volcano plot of differentially expressed genes (DEGS) in gastric tumor. Red dots represent significant expressed genes.
Preprints 82383 g001
Figure 2. Differentially expressed genes found using Gene Set Enrichment Analysis (GSEA).
Preprints 82383 g002
Figure 3. Survival analysis for the genes (A) AJUBA, (B) GPNMB, (C) CD80, (D) FBXL13, (E) PDILT, (F) CCDC69, (G) KNL1, (H) IL13RA2, (I) NOLC1 using Kaplan-Meier Plotter (KM Plotter).
Preprints 82383 g003
Figure 4. Relative expression level of CCDC69, GPNMB, AJUBA, NOLC1, CD80, KNL1, FBXL13 genes in samples of gastric tumor cell lines (ACP-02, ACP-03, AGP-01 and AGS) related to normal gastric cells, MNP-01.
Preprints 82383 g004
Figure 5. 3D structures of FBXL13, AJUBA, CCDC69, CD80 and NOLC1 proteins complexed to selected MCULE compounds. In this representation, the five compounds are in stick format; proteins are represented in cartoon format; while the residues involved in hydrogen bonding are shown in lines format. Hydrogen bonds are represented by black dotted lines and the bond length is expressed in the Angstrom (Å) measurement unit.
Preprints 82383 g005
Figure 6. Graphic representation of the network of protein interactions for proteins A: AJUBA, B: FBXL13, C: CCDC69, D: CD80 and E: NOLC1, identified using STRING v11.5. Each node represents a protein, and each edge represents an interaction. Colored lines between the proteins indicate the various types of interaction evidence.
Preprints 82383 g006
Figure 7. I) Protein; II) interaction between the protein and the endogenous ligand; III) protein, endogenous ligand and MCULE compound.
Preprints 82383 g007
Disclaimer/Publisher’s Note: The statements, opinions and data contained in all publications are solely those of the individual author(s) and contributor(s) and not of MDPI and/or the editor(s). MDPI and/or the editor(s) disclaim responsibility for any injury to people or property resulting from any ideas, methods, instructions or products referred to in the content.
Copyright: This open access article is published under a Creative Commons CC BY 4.0 license, which permit the free download, distribution, and reuse, provided that the author and preprint are cited in any reuse.
Prerpints.org logo

Preprints.org is a free preprint server supported by MDPI in Basel, Switzerland.

Subscribe

© 2024 MDPI (Basel, Switzerland) unless otherwise stated