1. Introduction
SARS-CoV-2, the virus that causes COVID-19 can cause pneumonia, acute respiratory distress syndrome (ARDS) and death [
1,
2]. SARS-CoV-2 infection causes a mild-to-moderate illness in the majority of infected individuals despite direct exposure [
3]; in a subset of individuals, these unremarkable symptoms can suddenly develop into severe disease, requiring hospitalization, oxygen support and/or admission to an intensive care unit (ICU) [
1,
2]. Because SARS-CoV-2 has an unusually long incubation period, ranging from 2 to 14 d, prolonged presence of virus in the respiratory tract, up to a month after initial infection [
3,
4] may explain these sudden turn of events. Development of cytokine storm in a subset of patients with severe COVID-19 illness along with impaired gas-exchange function is thought to result in ARDS, multi-organ failure and death [
5,
6].
Interferon (IFN)-mediated antiviral responses precede pro-inflammatory ones, optimizing host protection and minimizing collateral damage [
7,
8]. Deviations from these balanced responses can be detrimental. After SARS-CoV-2 infection, studies have shown that IFN-λ and type I IFN production are delayed, dampened, and induced in severely ill patients. Thus early, mid, and late immune responses from days after symptoms onset (DFSO) are critical for understanding the immunopathology of COVID-19.
Biological Variables in the IMPACT Cohort
Data from early COVID-19 patients when several early treatments were being tested is highly valuable. The Yale IMPACT cohort is one such study that collected clinical data and biological samples from COVID-19 patients that were hospitalized in early 2020 [
9,
10]. The patient demographics and anthropomorphic features of the IMPACT cohort has been described in the original articles [
9,
10]. However, there are many important biological variables in the IMPACT cohort that were not considered in the data presented in original articles [
9,
10]. First, the patients included in the Yale IMPACT cohort had considerable variability in
days
from
symptoms
onset (DFSO); the range was days 1 to day 47. Second, disease severity score (clinical score) ranged from 1-5 and an important variable to consider. Third, some patients were in ICU when first enrolled whereas others were not. Fourth, the patients fell in to at least 5 different categories of risk factors for COVID-19, whereas many patients ill with COVID-19 did not have these risk factors. Thus, non-ICU COVID-19 patients who also had many of the risk factors as those in ICU, would be a pertinent comparison group in addition to healthy health care workers (HCW).
Fifth, the patients were given at least 4 different treatments for COVID-19 with 132 and 161 of 179 patient datapoints appearing to have received Tocilizumab (Toci) and hydroxychloroquine (HCQ), respectively, regardless of disease severity or underlying risk factors, yet these treatments did not figure into data analysis. Sixth, while it is stated that all patients were tested to be SARS-CoV-2 positive during the initial screen, that data is not provided, making it difficult to evaluate whether the patients were indeed truly ill with COVID-19. It is important to verify that the patients were indeed positive for SARS-CoV-2 as several of the patients (86/179***) had no viral load (missing or zero value,
Supplementary Table S1) in their nasopharyngeal or saliva samples as determined from the raw data Table 41586_2020_2700_MOESM1_ESM provided by the authors. Given the seriousness of the situation at the time of these publications in mid 2020, it is surprising that the patients were not confirmed to be SARS-CoV-2
+ before being included in the analysis as COVID-19 patients.
Based on the above-mentioned rationale, we determined how key variables such as DFSO, risk factors including obesity (BMI ≥ 30), treatments received, treatment counts, clinical score, biological sex, ICU status and outcomes “impacted” the significantly changed immunological signature in confirmed SARS-CoV-2+ patients using non-ICU SARS-CoV-2+ patients as a comparison group. We only included samples with confirmed viral load (either nasopharyngeal (Np) or saliva), and we excluded samples with unavailable or zero measurements for both Np and saliva load. Here, we show that careful analyses using different groups is essential for understanding complex datasets that contain biological variables that cannot be always defined or accounted for. Finally, sex aggregated analysis can be misleading, especially for measures that are significantly changed in opposite directions between males and females.
2. Statistical Methods
IMPACT Yale cohort data (Table 41586_2020_2700_MOESM1_ESM) was used for analysis in this report [
9,
10] using Aseesa’s Stars (
www.aseesa.com) analysis tool as follows:
Correlation Scatter Plots: Samples with a zero value for the query symbol (biological or clinical measure), or with an empty value for the second symbol were excluded from correlations. Linear trendlines, or an nth-degree polynomial trendline if its goodness-of-fit is either 50% greater than, or if it explains at least half of the variance not explained by the (n – 1)th-degree polynomial, were fit to the data. R2, r and p denote goodness-of-fit, Pearson’s correlation coefficient and significance of the correlation, respectively.
Bar Charts and Heat Maps: Bar charts show log2 fold change versus Control, with error bars denoting the standard deviation, and the filled fraction of a bar denoting the percentage of samples with non-zero values. ***, ** and * denote p < 0.001, 0.01 and 0.05 versus Control, respectively, while †††, †† and † denote p versus the preceding test group (one bar above), by Welch’s t-test. The comparison mode Value to Average was used for all relative (change versus) charts, such that the change is calculated by averaging the set of all individual changes versus the control group average , for values included in the test group , with the standard deviation given by . Absolute bar charts show the average and standard deviation for the control group and for all test groups. Labels in parentheses next to symbols show the average in the first control group while labels in bars show the average in the respective test group. Labels next to test group names show the number of samples with non-zero values in the respective group. Additionally, up to five significantly correlated measures are shown in the chart legend, sorted by ascending p-value. Only samples included in the bar chart’s control and test groups with a non-zero value for the query symbol and a non-empty value for the second symbol/metadata characteristic, are included in correlations. Heat maps were generated so that multiple measures could be compared side-by-side. Values shown in heat maps are calculated in the same way as those in bar charts.
Volcano Plots: Values shown in volcano plots are calculated in the same way as those in bar charts. Only symbols with p < 0.1 are included in volcano plots for clarity. The color intensity of points represents the size of the change, with increased symbols drawn in red and decreased symbols in blue. Green lines denote (from top to bottom) p < 0.001, 0.01 and 0.05 by Welch’s t-test.
Principal Component Analyses: For Symbol PCAs, only symbols with p < 0.05 were included, and samples with zero values were excluded. Covariance matrixes were created by standardizing all values for each symbol using
for a sample value
, group average
and standard deviation
, and calculating the covariance between two symbols. For Sample PCAs, the Euclidian distance between two samples was used to construct a distance matrix, with the number of dimensions being equal to the number of included symbols. All symbols (including those with p ≥ 0.05) were included in Sample PCAs. Eigenvalues and eigenvectors were calculated using the gsl_eigen_symmv function from the GNU Scientific Library [
11]. The total dataset variance was calculated by summing the absolute eigenvalue for each symbol; component contributions were calculated by dividing each eigenvalue by the total dataset variance, and the contributions of individual symbols to a component was given by its eigenvector. Donut charts show the primary components necessary to explain at least 90% of the dataset’s variance. PCA biplots show the correlation of each included symbol/sample with Component 1 (x axis) and Component 2 (y axis) as given by the components’ eigenvectors. The color of points in biplots for Symbol PCAs denotes log
2 fold change versus control, calculated in the same way as in bar charts, with increased symbols drawn in red and decreased symbols in blue.
Venn Diagrams: Venn diagrams contrast two test groups, showing the number of exclusive significantly changed symbols in each group (p < 0.05 by Welch’s t test; left/right), and the number of shared significantly changed symbols in the same direction (middle), and in opposite directions (top). Additionally, the most changed exclusive symbols (sorted by ascending p-value, with log2 fold change versus control shown) are shown to the left/right of each test group; shared significantly increased and decreased symbols are shown at the bottom left and bottom right, respectively, symbols that are significantly increased in the first and significantly decreased in the second group shown at the top left, and symbols that are significantly decreased in the first and significantly increased in the second group are shown at the top right.
3. Results
3.1. SARS-CoV-2 Viral Load and Its Correlation with Immunological Measures
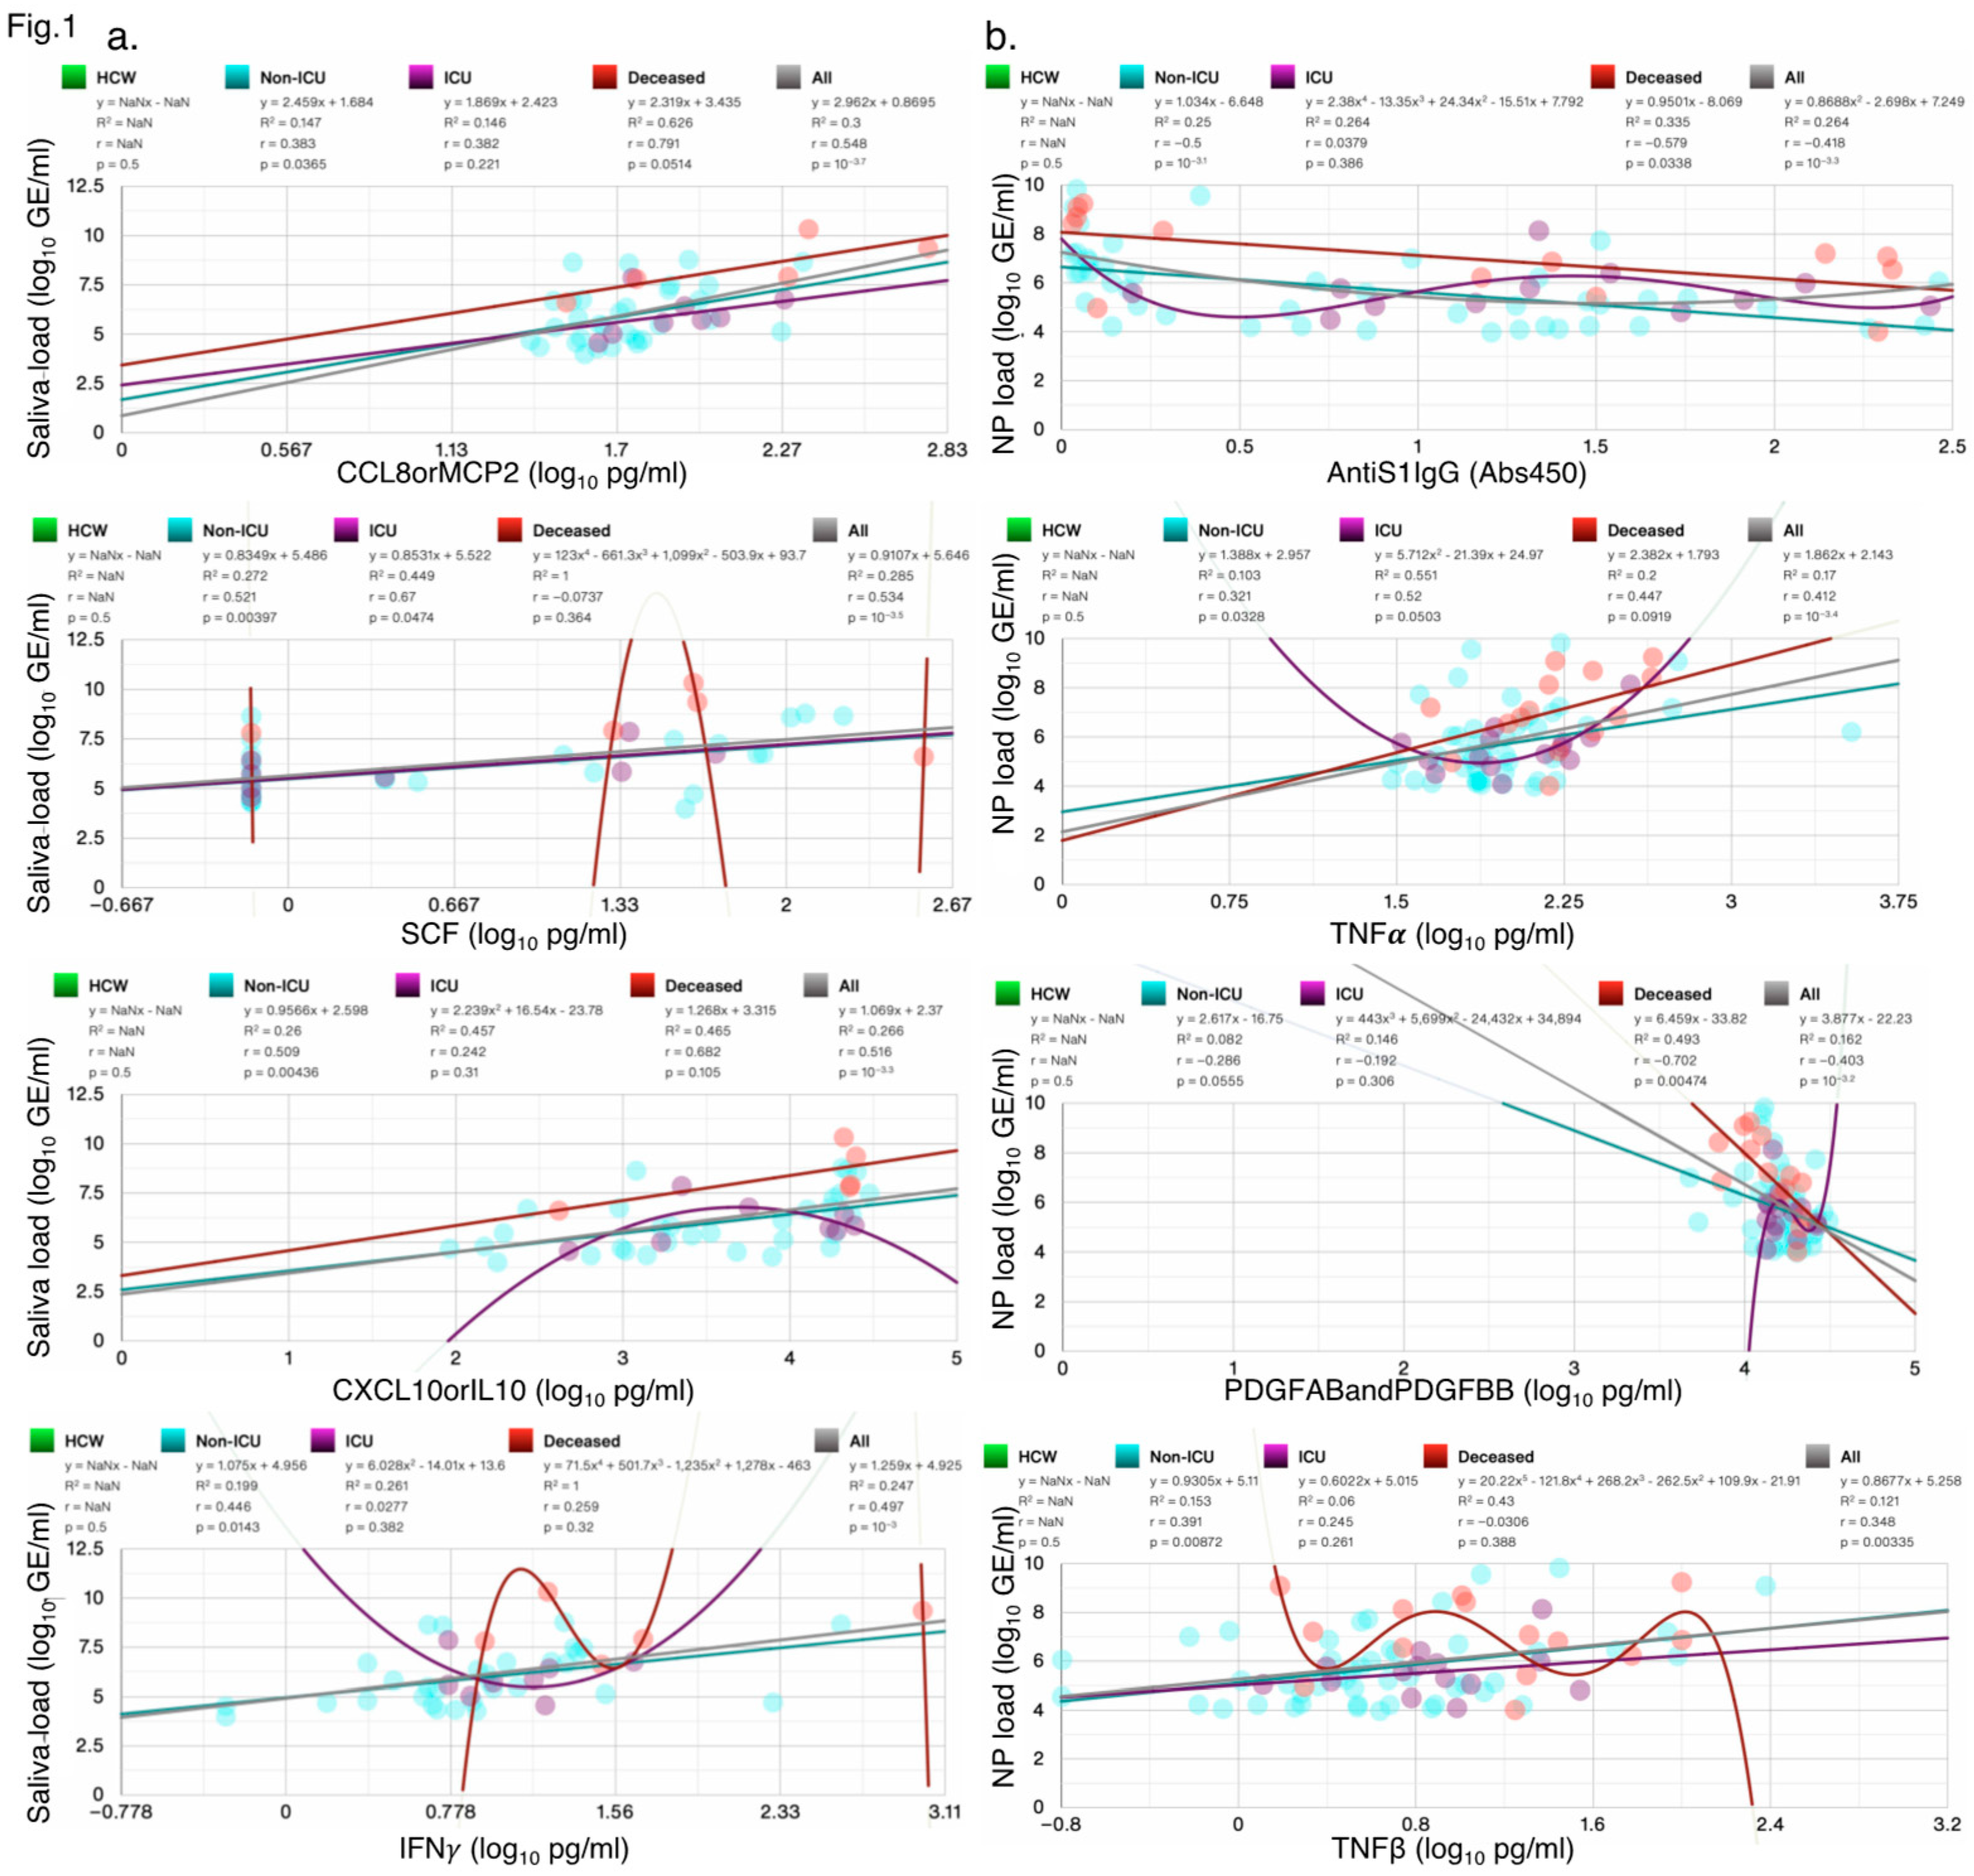
SARS-CoV-2 viral load in saliva or nasopharyngeal swabs as detected by RT-PCR was used to diagnose confirmed COVID-19 cases at the time of hospital admissions and screening, irrespective of symptoms. However, the screen data is not provided or available. In our analysis of the IMPACT cohort, we only included samples with at least one non-zero measurement of SARS-CoV-2 Saliva or NP Load. In the IMPACT cohort, viral load correlated with distinct cytokines/chemokines including IFNγ, TNFα and CCL8orMCP2 (
Figure 1a,b). Top 4 significant correlations each for viral load in saliva and nasopharyngeal swabs are shown in all SARS-CoV-2
+ patients and HCW. Saliva load correlated with CCL8orMCP2 (r=0.548, p=10
-3.7). CCL1 was highly correlated with several chemokines/cytokines including CCL21, CCL8, CCL2, IL10, and IL6 (
Supplementary Figure S1a). Nasopharyngeal (NP) viral load correlated negatively with AntiS1IgG (r=-0.418, p=10
-3.3).
Figure 1.
Scatter plots showing the four measures most significantly correlated with SARS-CoV-2 (a) Saliva load, and (b) Np Load; the goodness-of-fit (R2), Person’s r, and p-values for each test group are shown. Not a Number (NaN) indicates that samples in this group did not contain any values. N/group: HCW: 114; Non-ICU: 60; ICU: 17; Deceased: 16.
3.1.1. Obesity as a Risk Factor for COVID-19 Severity
In the IMPACT cohort, a subset of patients fell into one or more of 5 different categories of risk factors for COVID-19, namely cancer treatment during the past year, chronic heart disease, hypertension, chronic lung diseases, and immunosuppression [
9]. Extreme BMI (
35) correlated with an increased relative risk of mortality [
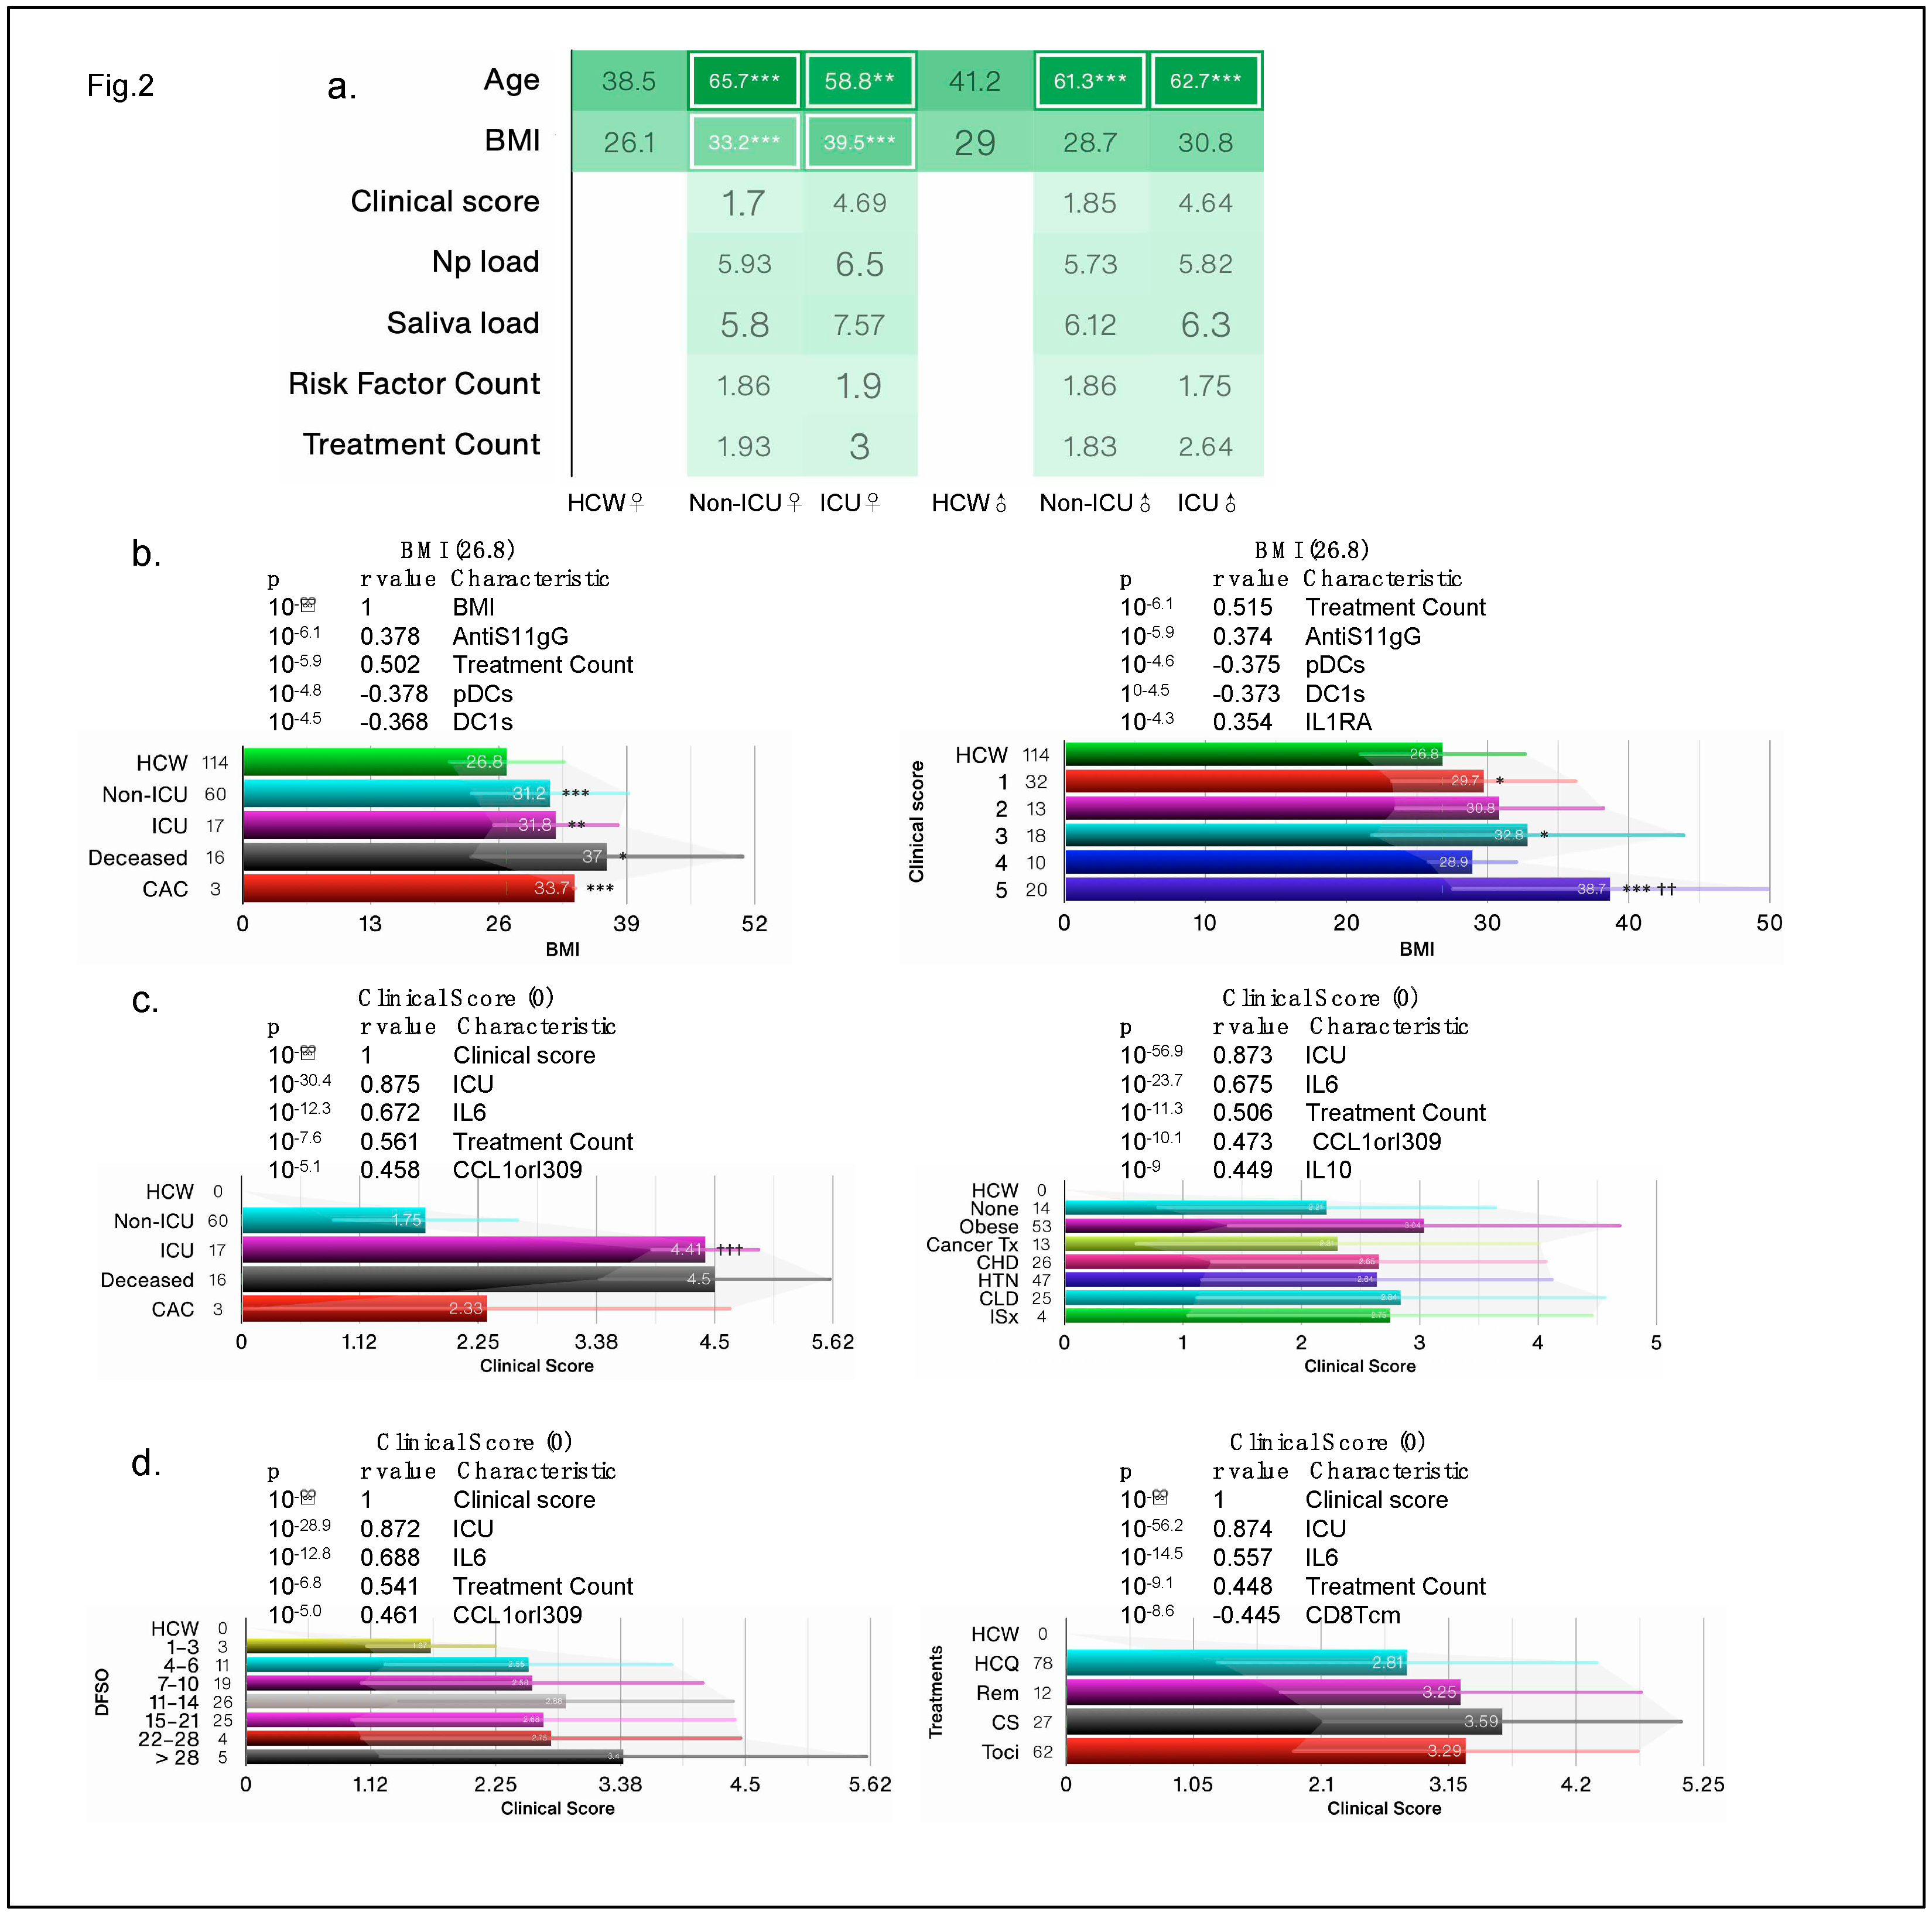
10], yet BMI was not considered as a risk factor, instead the authors adjusted data for BMI and age. Both female and male patients were considerably older than HCW and BMI was significantly higher in female COVID-19 patients than other groups (
Figure 2a). Clinical score is often a predictor of health outcomes and used as a surrogate for disease severity. In our reanalysis, we found that deceased patients and those with a clinical score of 5 had the highest BMI of 37 and 37.8, respectively, whereas HCW had an average BMI of 26.8 (
Figure 2b). Of the 140 reported biological and clinical measures in the IMPACT dataset, BMI correlated most significantly with AntiS1-IgG levels and negatively with dendritic cells (DCs); top 5 most significant correlations are shown (
Figure 2b) and full list of all correlations for all biological and clinical measures can be found in
Supplementary Table S2.
Figure 2.
Obesity is a risk factor for COVID-19. (a) the average clinical score in test groups based on intensive care unit (ICU) admission/outcome, and COVID risk factors segregated by sex. (b-d) Bar charts showing the average BMI and clinical scores in test groups based on ICU admission/outcome, days from COVID-19 symptom onset (DFSO), treatment and risk factors. Cancer treatment (Tx) received in prior year; CHD: chronic heart diseases; HTN: hypertension; CLD: chronic lung diseases; ISx: immunosuppressed patients. HCQ: hydroxychloroquine; Rem: Remdesivir; Cort: high dose of corticosteroid; Toci: Tocilizumab; CAC: COVID-19-associated coagulopathy. N/group in bar charts in (b-d) is shown on the X-axis.
In subsequent analysis, we considered obesity (BMI ≥ 30) as an additional risk factor as we found that obese patients had the worst clinical score, followed by patients with chronic lung disease (
Figure 2c). Immunosuppressed patients did not fare any worse than patients with other risks such as chronic heart disease, prior cancer treatment, or hypertension. Deceased patients and those in ICU had the highest clinical scores (>4.0), whereas non-ICU SARS-CoV-2
+ patients had an average clinical score of 1.75 (
Figure 2c). Patients who were >28 over days from symptoms onset had the worst clinical score and those on corticosteroid treatment also had the worst score (
Figure 2d), suggesting that none of the early treatments were effective. Regardless of risk, treatment, or DFSO, BMI and clinical score correlated with cytokines/chemokines IL6 and CCL1orI309 and with treatment counts. These findings suggest that obesity/BMI should be classified as a major risk factor for COVID-19 health outcomes and should not be adjusted for.
3.1.2. Immunological Profile of COVID-19 Patients in ICU
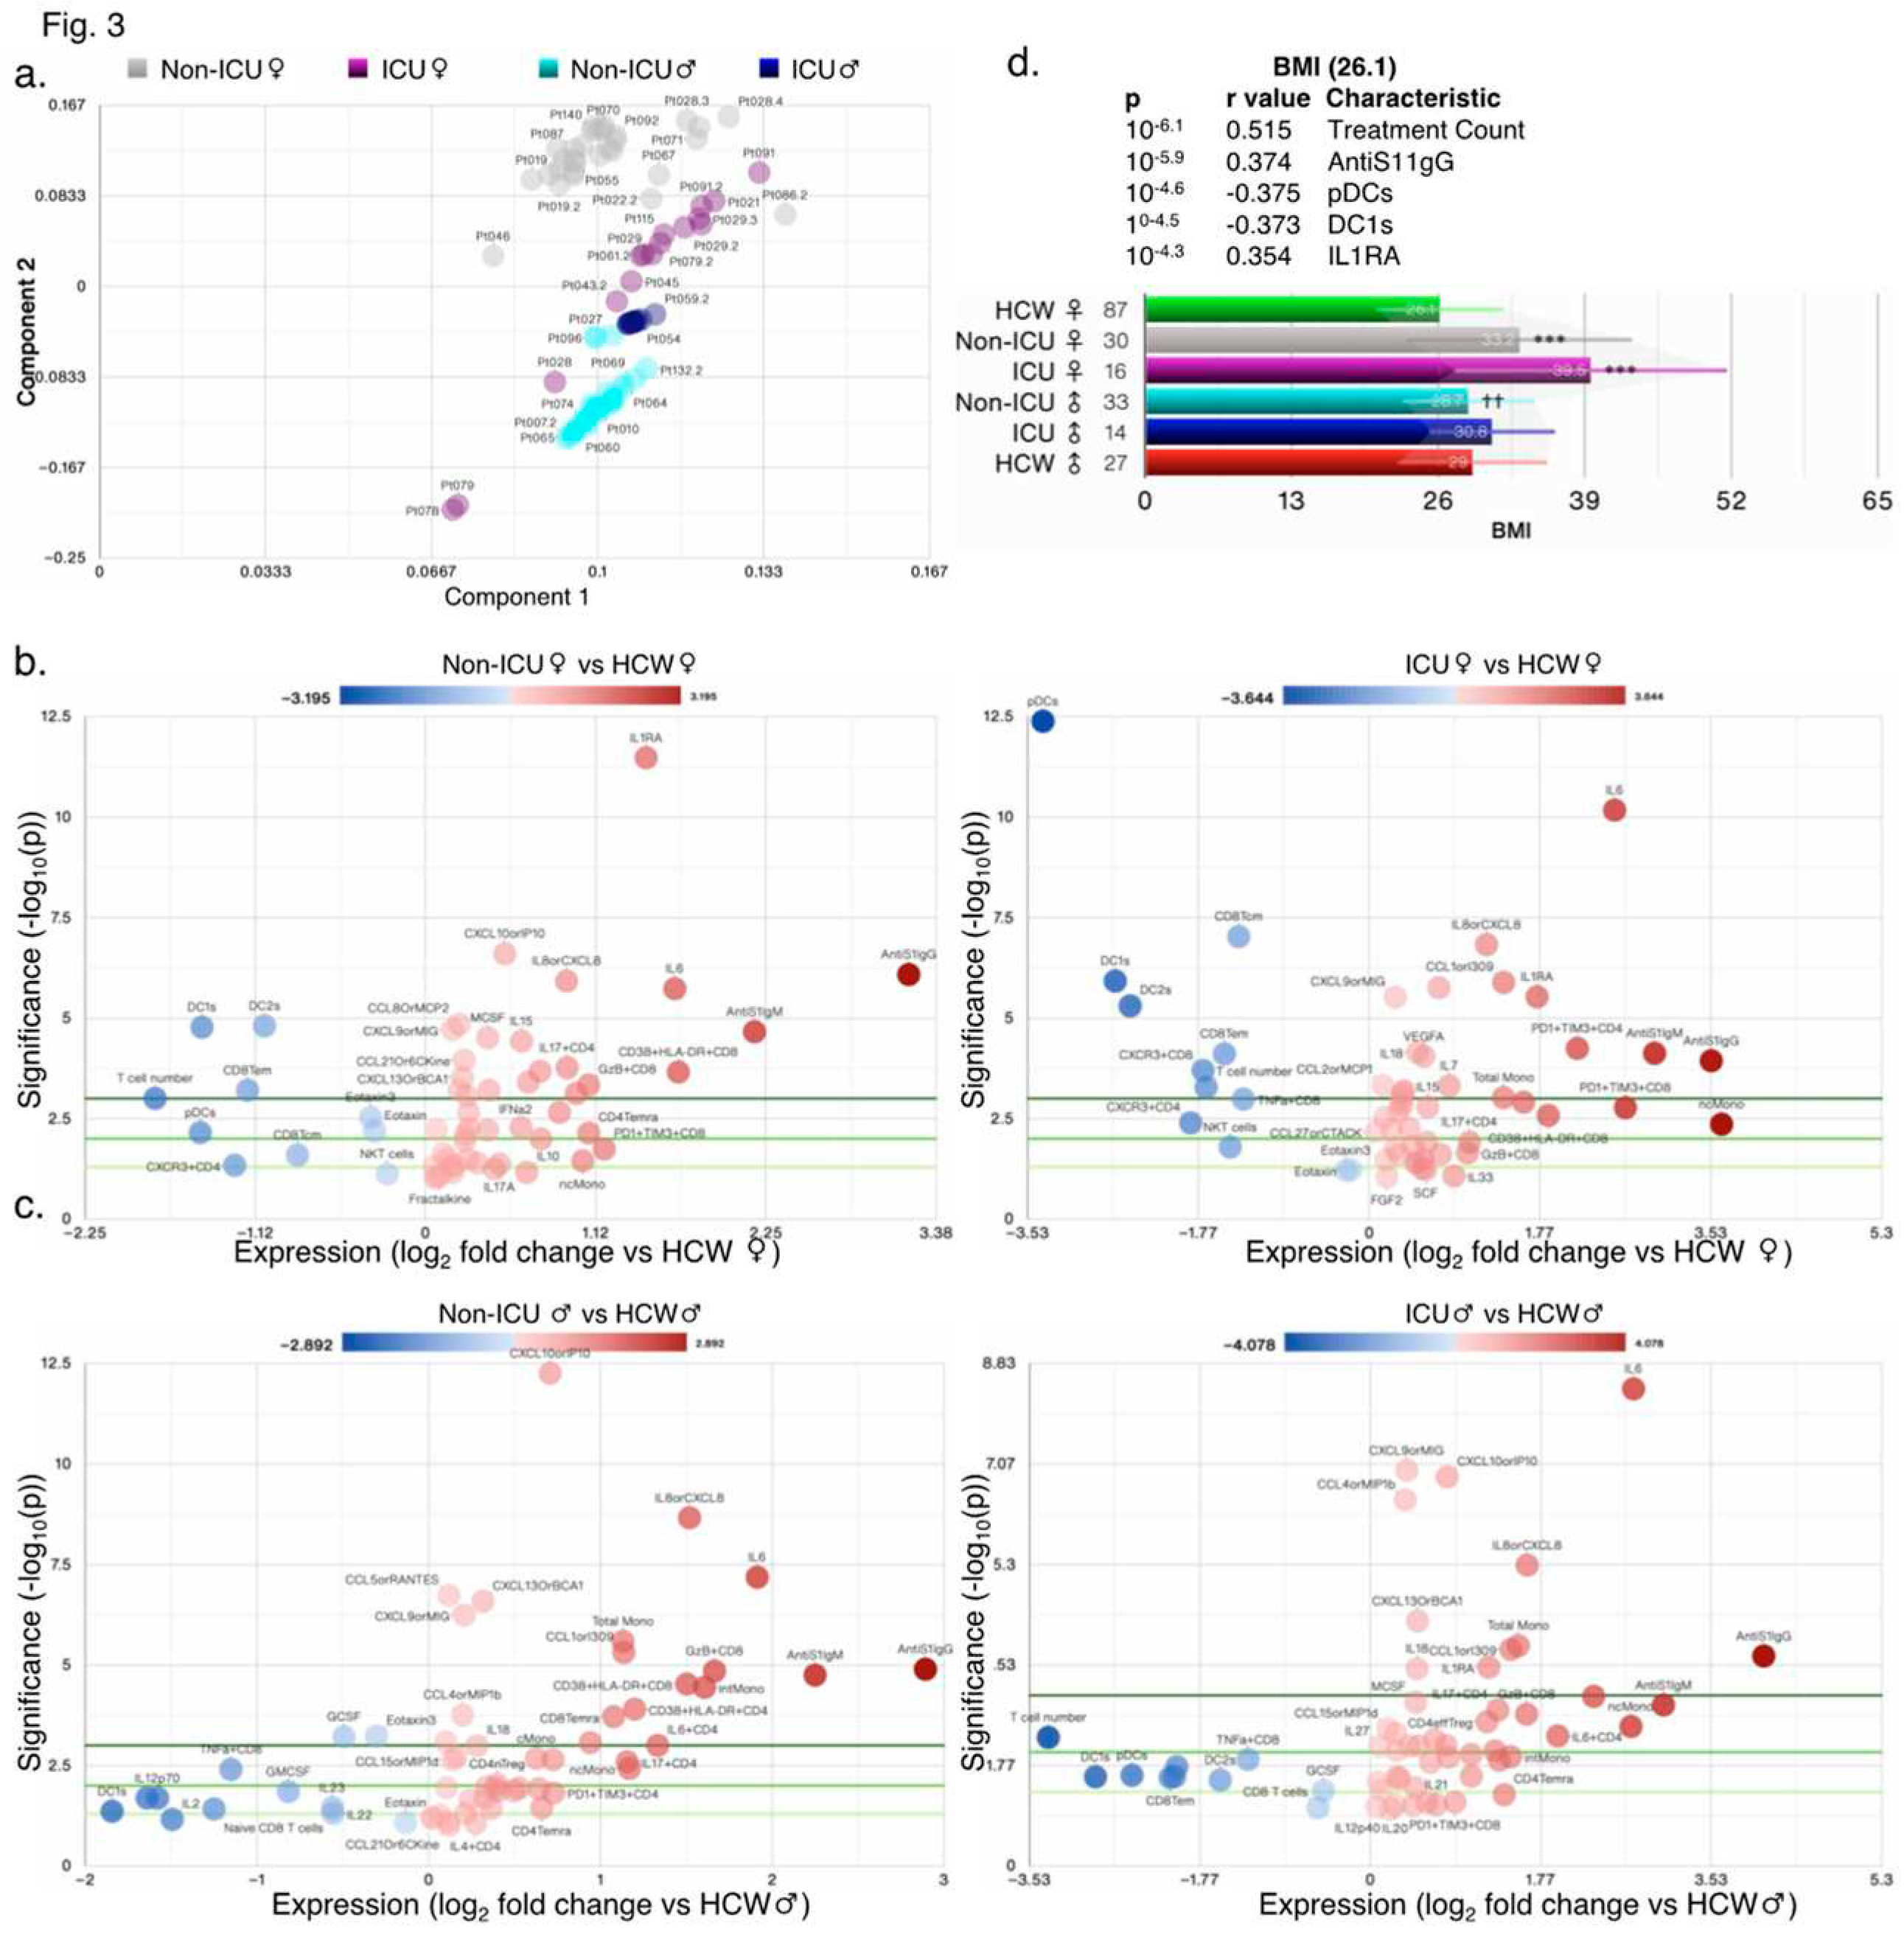
It is expected that individuals infected with SARS-CoV-2 and COVID-19 symptoms will have a hyper activated immune system. Not surprisingly, the original reports found many changes in immune cell numbers, T-cell subsets, and cytokine/chemokine levels in COVID-19 patients compared with healthy HCW controls. Principal component analysis (PCA) revealed that non-ICU and ICU patients compared with HCW fall into distinct populations as also suggested by start differences in clinical scores between ICU and non-ICU patients (
Figure 3a–c and
Figure S2a-g). Female patients in ICU had the highest BMI of 39.5, whereas HCW female had the lowest BMI of 26.1 (
Figure 3d). PCA scatter plots and donut charts for symbols revealed the contribution of the components necessary to explain >90% of the dataset’s variance in individual groups (
Figure S2a-g).
Figure 3.
High variability in ICU and non-ICU patients. (a) PCA biplot showing clustering of samples by principal component analysis (PCA). Volcano plots comparing female (b) and male (c) ICU-admitted (right) and non-ICU (left) COVID-19 patients to healthy controls (HCW) of the same sex. (d) Bar chart showing the average BMI in test groups based on ICU admission and sex.
In patients with coagulopathy, just 2 components were sufficient to explain nearly 100% of the variability (
Figure S2f-g). The top 5 changed measures relative to HCW included T cell number, CD38+HLA-DR+CD8, IL6, pDCs, and DC1 in female non-ICU patients, ncMono, pDCs, PD1+TIM3+CD8, DC1s, and IL6 in female ICU patients, IL6, DC1s, GzB+CD8, T cell numbers and intMono in male non-ICU patients, and T cell number, DC1s, IL6, ncMono, and pDCs in male ICU patients as seen in volcano plots (
Figure S3a-e and Tables S3-5). In combined analysis, non-ICU and ICU patients had ~45% (64/143) and ~37% (53/143) significantly changed measures compared with HCW (
Figure S3f). Of those changed measures, 49 were shared (either ↑ or ↓), 15 were specific to non-ICU and 4 to ICU patients as compared to HCW (
Figure S3f). However, as compared to ICU patients, deceased patients experienced many more changed measures and shared only 11 with ICU patients (
Figure S3g).
3.1.3. Sex Differences and Similarities in Immunological Profile of COVID-19 Patients
To better understand what immunological measures contributed to observed differences in COVID-19 outcomes between female and male patients, we next focused our analysis on non-ICU and ICU patients alone (irrespective of outcome) as they were well-matched for clinical score (
Figure 4a), age, treatment and risk factor counts (
Figure 2a). PCA suggested that female and male patients had sufficient variance to fall into discrete clusters (
Figure 4a). Donut charts show several components that explain >90% variance in female and male patients, respectively, and scatter plots showing measures that contibuted to the first two components (
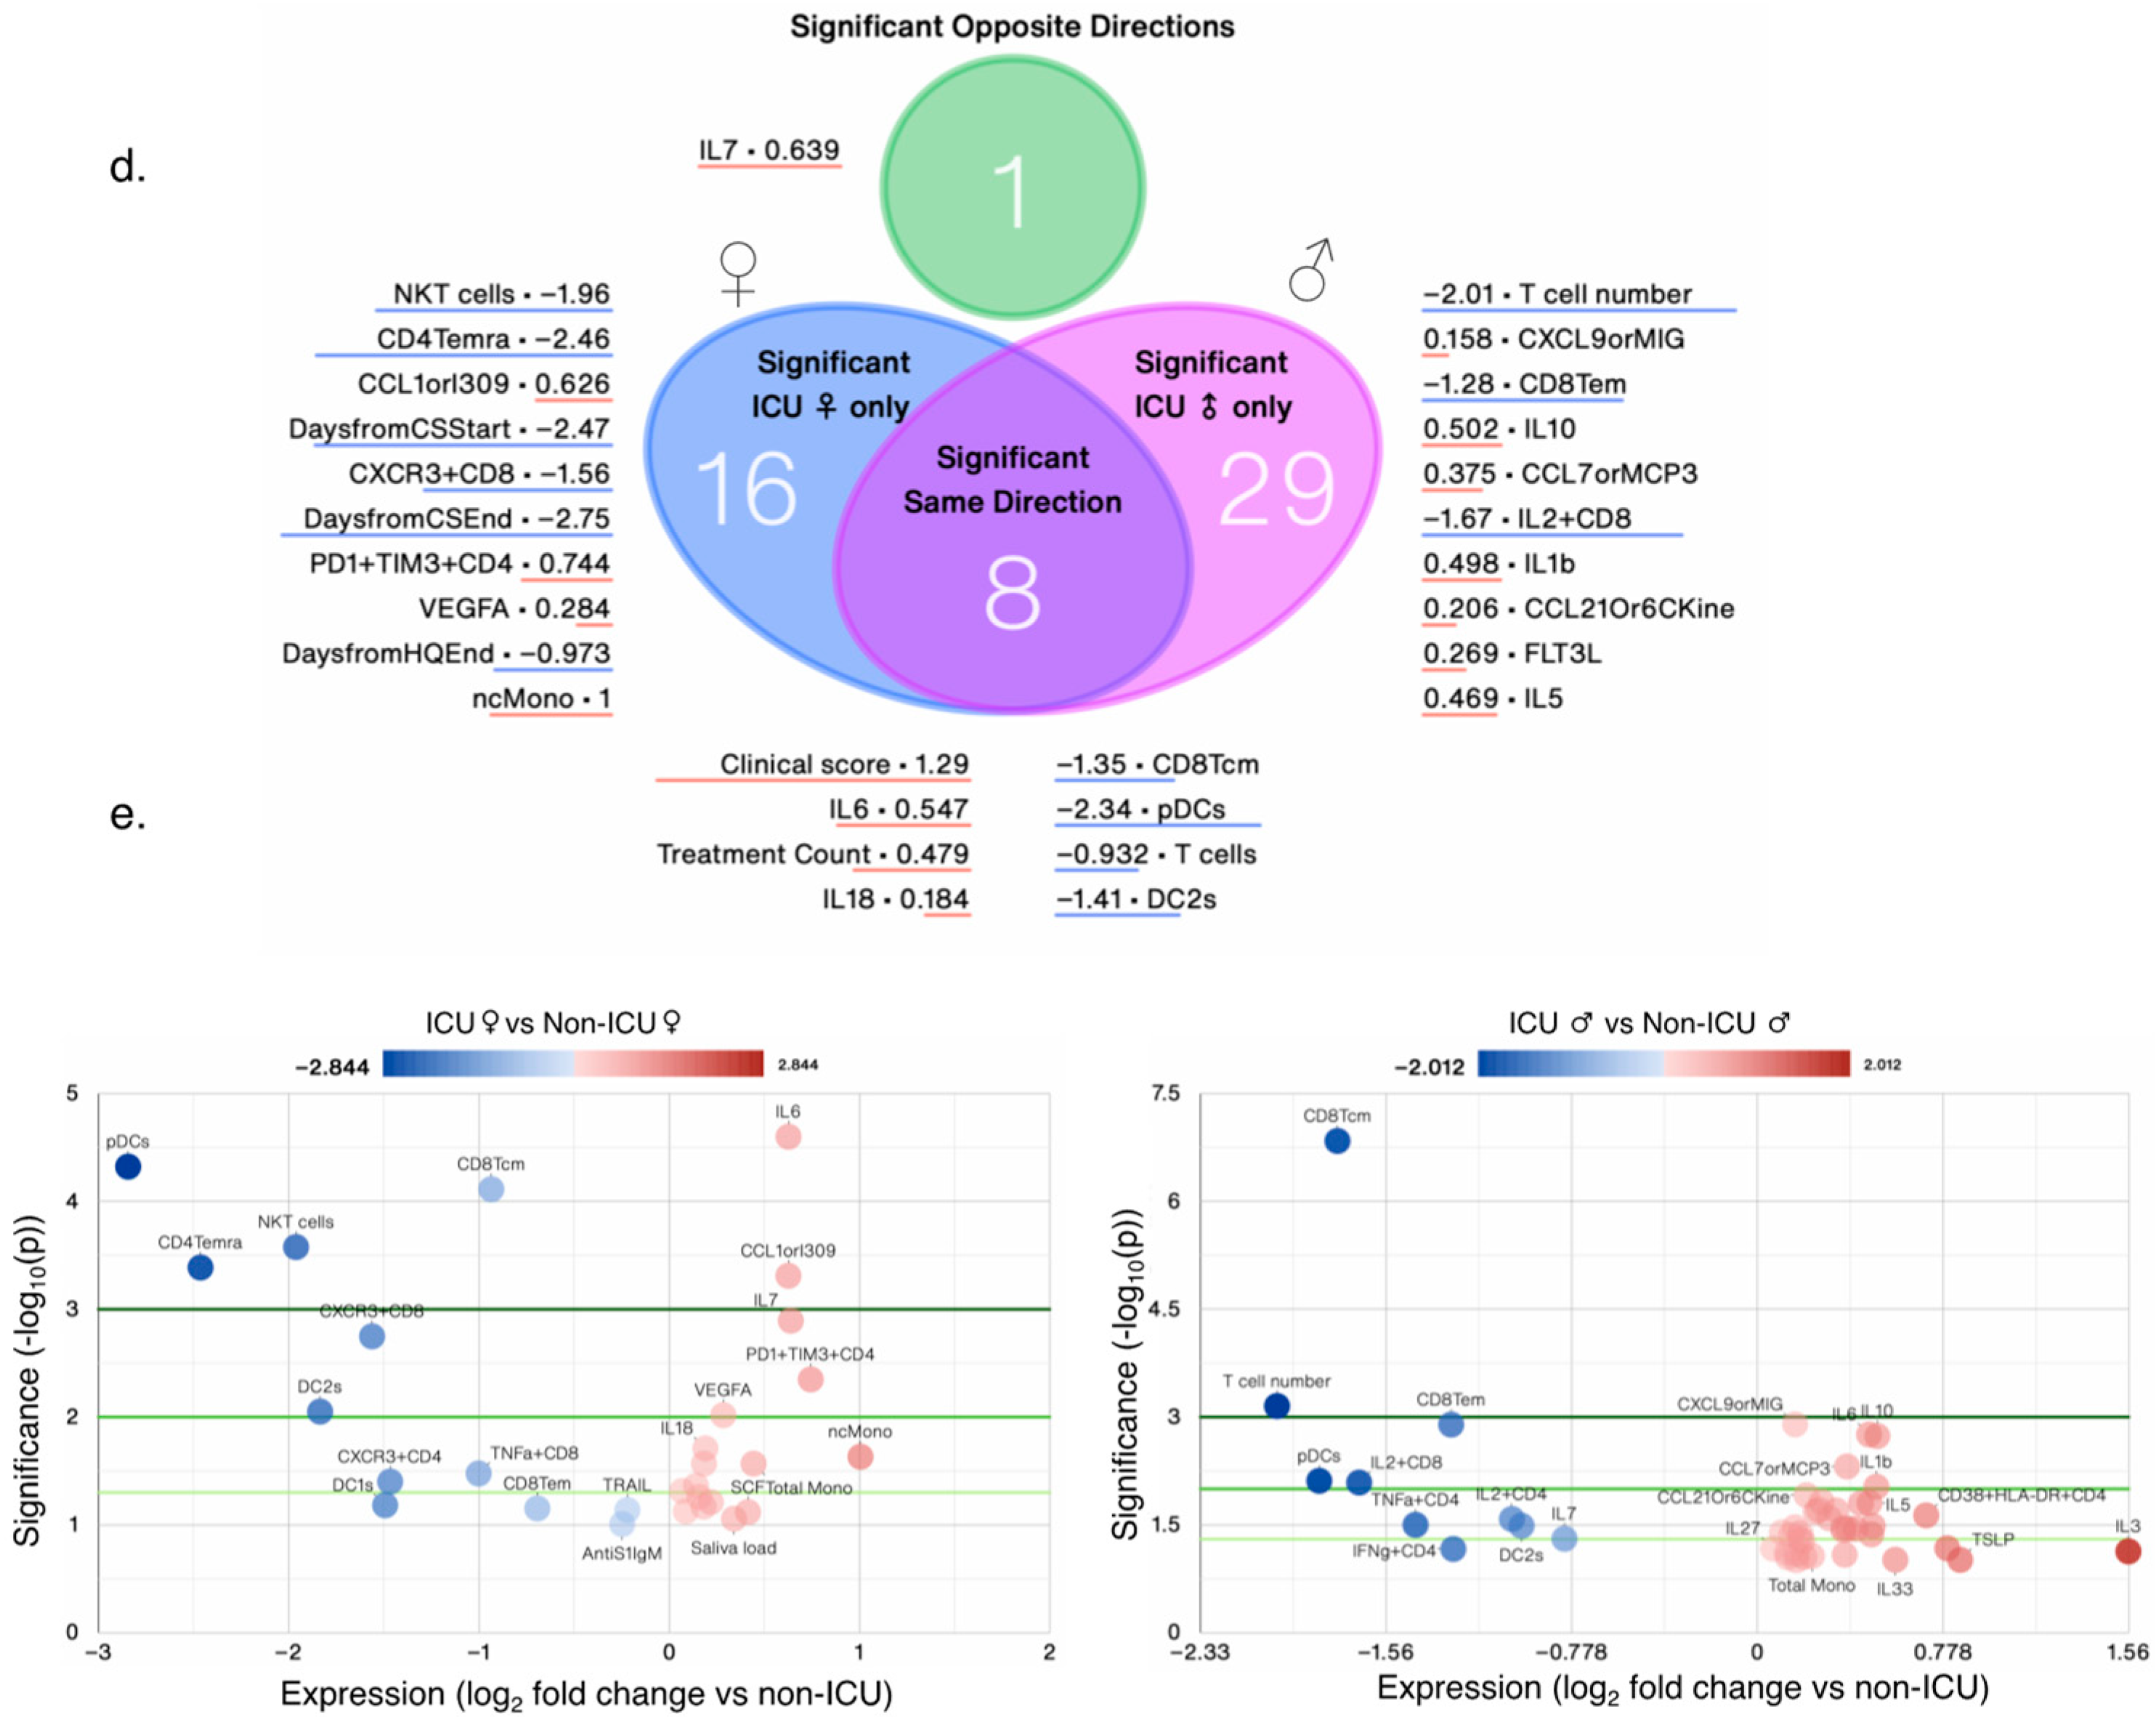
Figure 4b,c). Female ICU patients (n = 16) only had only 25 significantly changed measures, whereas male ICU patients (n = 14) had 38 changed measures compared with non-ICU female and male patients, respectively (
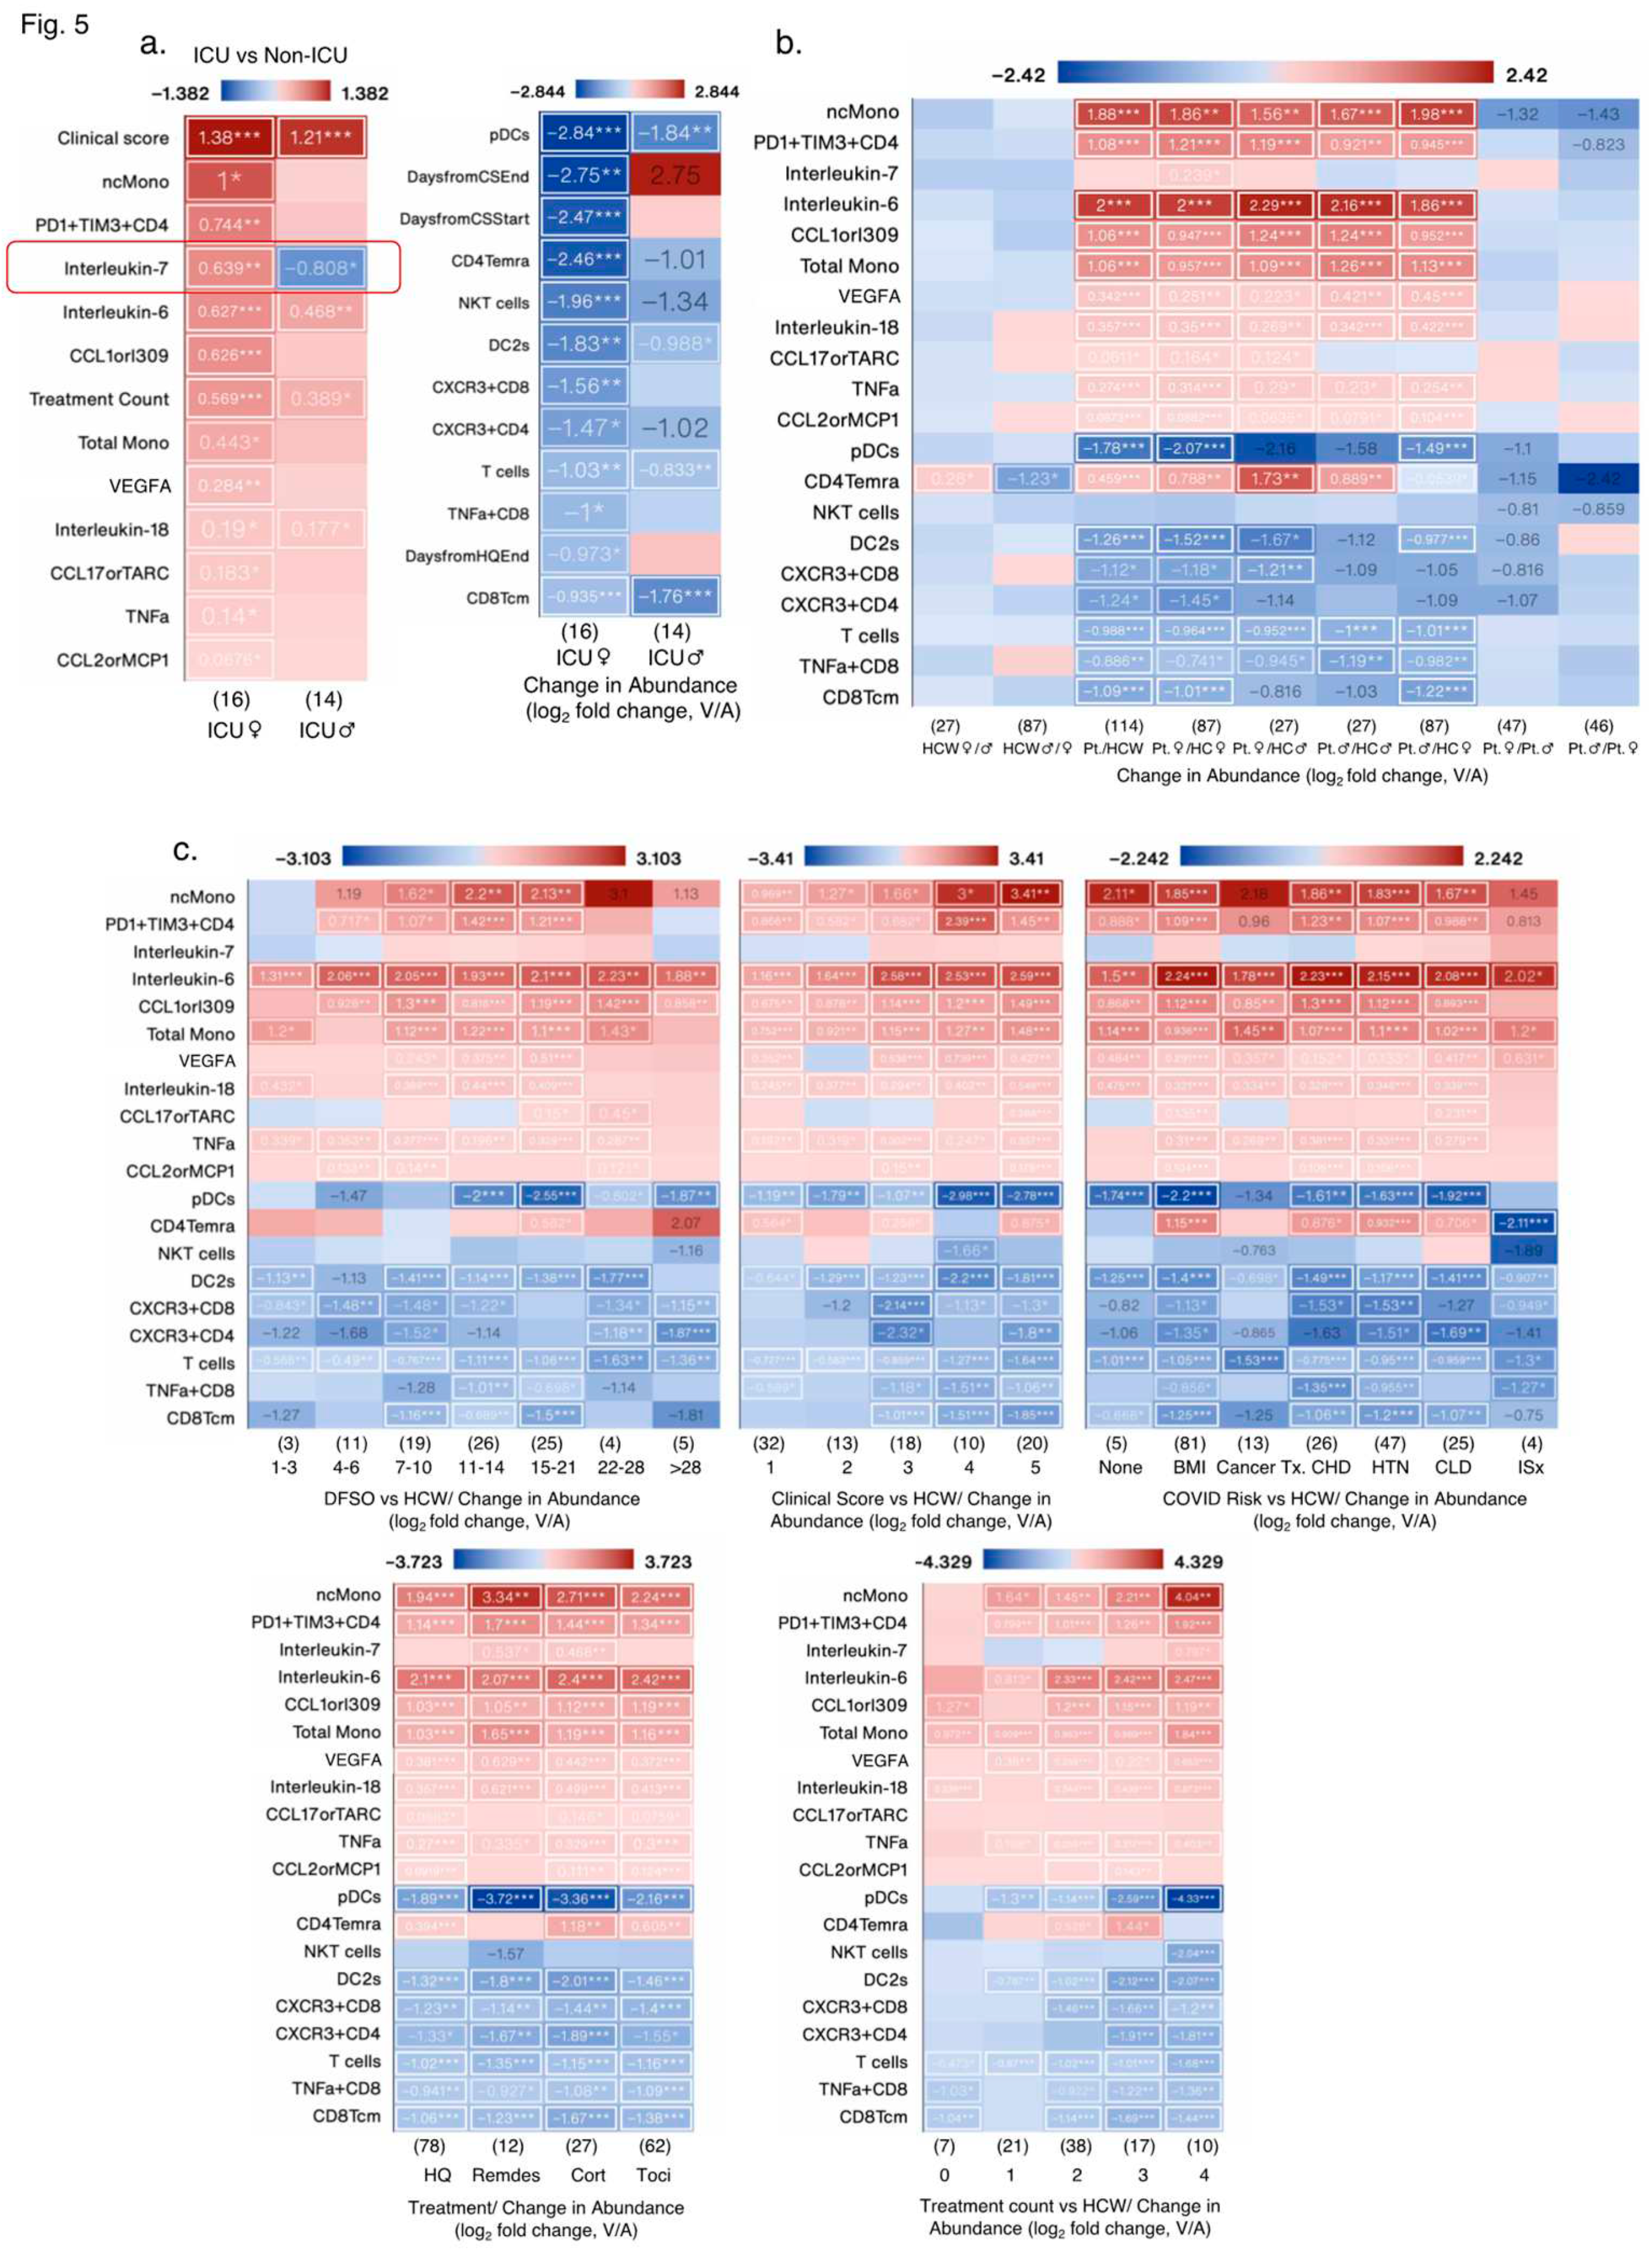
Figure 4d,e). A total of 8 measures were significantly changed in the same direction, whereas 1 measure (IL7) was changed in opposite direction; IL7 levels increased significantly in female ICU patients, but decreased significantly in male ICU patients compared with non-ICU female and male patients, respectively (
Figure 5a). AntiS1IgM and saliva viral load tended to be higher in female ICU versus non-ICU patients, but did not reach statistical significance (
Figure 4e).
Figure 4.
Nuanced immunological profile of male and female COVID-19+ patients. (a) PCA biplot showing clustering of female and male ICU patients by PCA, and bar chart of clinical scores by sex. PCA donut plots showing the primary components necessary to explain at least 90% of the variance in female (b) and male (c) ICU patients, and the the 7 symbols most correlated with each of the first four primary components (left), and PCA biplots for the first two components (right), with the color of points denoting log2 fold change versus non-ICU patients of the same sex. (d) Venn diagram contrasting significantly changed measures between female (left) and male (right) ICU patients each compared to non-ICU patients, and listing the most changed symbols for each Venn diagram segment, sorted by ascending p-value (not shown), with log2 fold change versus non-ICU patients shown. (e) Volcano plots comparing female (left) and male (right) ICU patients to non-ICU patients of the same sex. N/group: HCW♀: 87; Non-ICU♀: 30; ICU♀: 16; Non-ICU♂: 33; ICU♂: 14; HCW♂: 27.

3.1.4. Effect of Biological Variables on Significantly Altered Immunoligical Measures in Female ICU Patients
Of the 13/25 increased measures in female ICU patients versus non-ICU female patients, only 4 measures were also increased in male ICU patients, whereas other measures were not significantly increased (
Figure 5a). Of the 12/25 decreased measures in female ICU patients, 4 measures also decreased in male ICU patients. Treatment start and end days were also different in female and male ICU patients (
Figure 5a). In sex aggregated analysis of the same 25 measures versus HCW, changes in IL7 levels and NKT cells were lost in female patients and CD4Temra cell numbers were signficantly increased in COVID-19
+ patients versus HCW (
Figure 5b), whereas there were no significant sex differences in any measures when ICU and non-ICU patients’ data was analyzed in an aggregated manner (
Figure 5b). Biological variables such as DFSO, clinical score, risk factors (except immunosuppression) and treatments affected levels of almost all measures, but most remained significantly altered as in ICU patients, except for IL7 levels. CD4Temra cell numbers increased at clinical scores of 1, 3, and 5, risk factors such as BMI ≥ 30, chronic heart disease, hypertension, and chronic lung diseases, but were decreased in immunosuppressed patients and those without any of these risks comapred with HCW. Treatment counts of 2 and 3 also significantly increased CD4Temra cell numbers along with individual treatments such as hydroxychloroquin, corticosteroid, and Tocilizumab (
Figure 5c).
Figure 5.
Impact of various biological variables on significantly changed measures in female ICU patients. (a) Heat maps showing measures with the greatest increase (left) and decrease (right) in female ICU patients compared to female non-ICU patients, and the same measures in male ICU patients compared to male non-ICU patients. (b) Heat maps showing the measures from (a) by patient status and sex, and by DFSO, clinical score, COVID-19 risk factors, treatment and treatment count. Numbers in parentheses () denote the number of data points in that group (N). Cancer treatment (Tx) received in prior 1 year; CHD: chronic heart diseases; HTN: hypertension; CLD: chronic lung diseases; ISx: immunosuppressed patients. HQ: hydroxychloroquine; Remdes: Remdesivir; Cort: high dose of corticosteroid; Toci: Tocilizumab. V/A: value-to-average.
3.1.5. Effect of Biological Variables on Significantly Altered Immunoligical Measures in Male ICU Patients
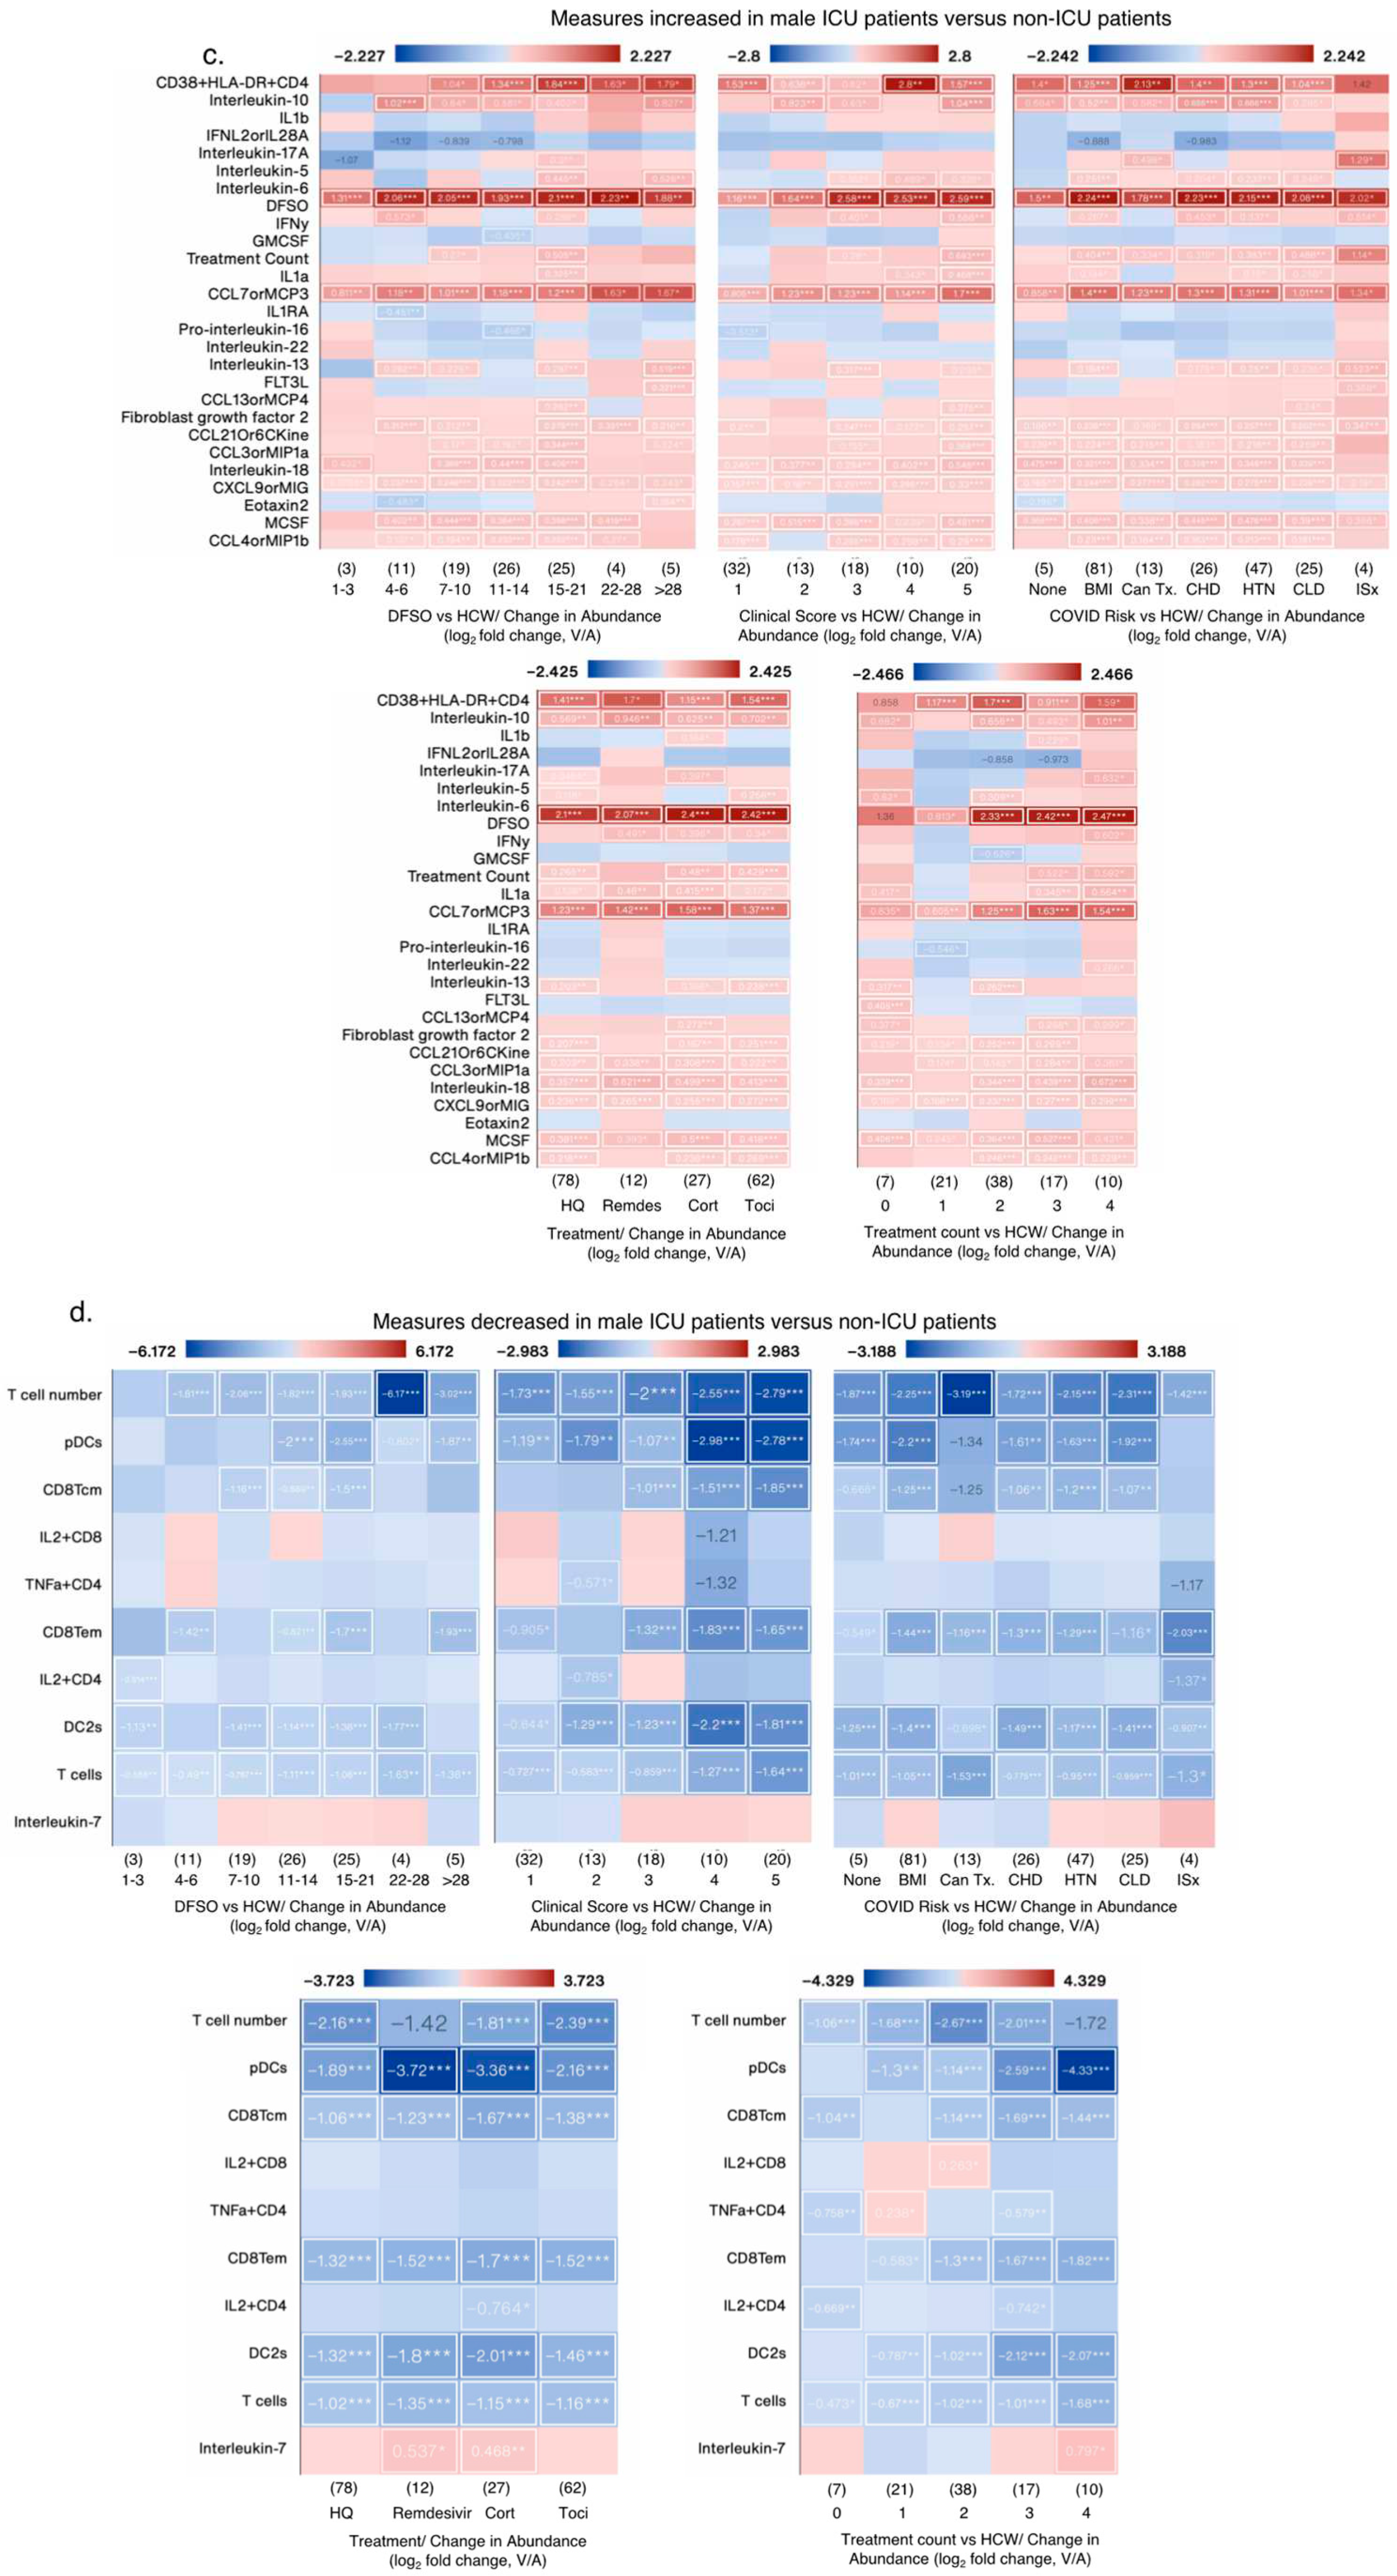
Of the 28/38 increased measures in male ICU patients verus non-ICU male patients, only 4 measures were also increased in female ICU patients, whereas other measures were not significantly increased (
Figure 6a). In fact 13 measures decreased in famle ICU patients such as IL10, IL1β, IFNL2, IL17A, CCL13orMCP4 amongst others but did not reach statistical signficance (
Figure 6a). Of the 10/38 decreased measures in male ICU patients, 4 measures also decreased in female ICU patients and IL7 were increased, as reported earlier. In sex aggregated analysis of the same 38 measures versus HCW, changes in at least 9 measures were lost or appeared to be decreased in male COVID-19
+ patients versus HCW (
Figure 6b), whereas significant sex differences in two measures, namely IL17A and IL16 became evident when ICU and non-ICU patients’ data was analyzed in an aggregated manner, with both cytokines signficantly decreased in female versus male COVID patients (
Figure 6b). Biological variables such as DFSO, clinical score, risk factors and treatments affected levels of almost all measures, with many appeared to decrease in aggregate analysis versus HCW (
Figure 6c). IL7 that was significantly decreased in male ICU patients (
Figure 6a), in combined analysis, its levels was not changed in COVID-19 patients, but its levels were significantly increased in patients treated with Remdesivir and corticosteroids (
Figure 6d).
Figure 6.
Impact of various biological variables on significantly changed measures in male ICU patients. (a-b) Heat maps showing measures with the greatest increase (a) and decrease (b) in male ICU patients compared to male non-ICU patients, and the same measures in female ICU patients compared to male non-ICU patients. (c-d) Heat maps showing the measures from (a and b, respectively) by patient status and sex, and DFSO, clinical score, COVID-19 risk factors, treatment and treatment count. Numbers in parenthesis () denote the number of data point in that group (N). Cancer treatment (Tx) received in prior 1 year; CHD: chronic heart diseases; HTN: hypertension; CLD: chronic lung diseases; ISx: immunosuppressed patients. HQ: hydroxychloroquine; Remdes: Remdesivir; Cort: high dose of corticosteroid; Toci: Tocilizumab. V/A: value-to-average.
3.1.6. Correlation of Key Cytokines and Immune Cell Types with Other Clinical and Immunological Measures
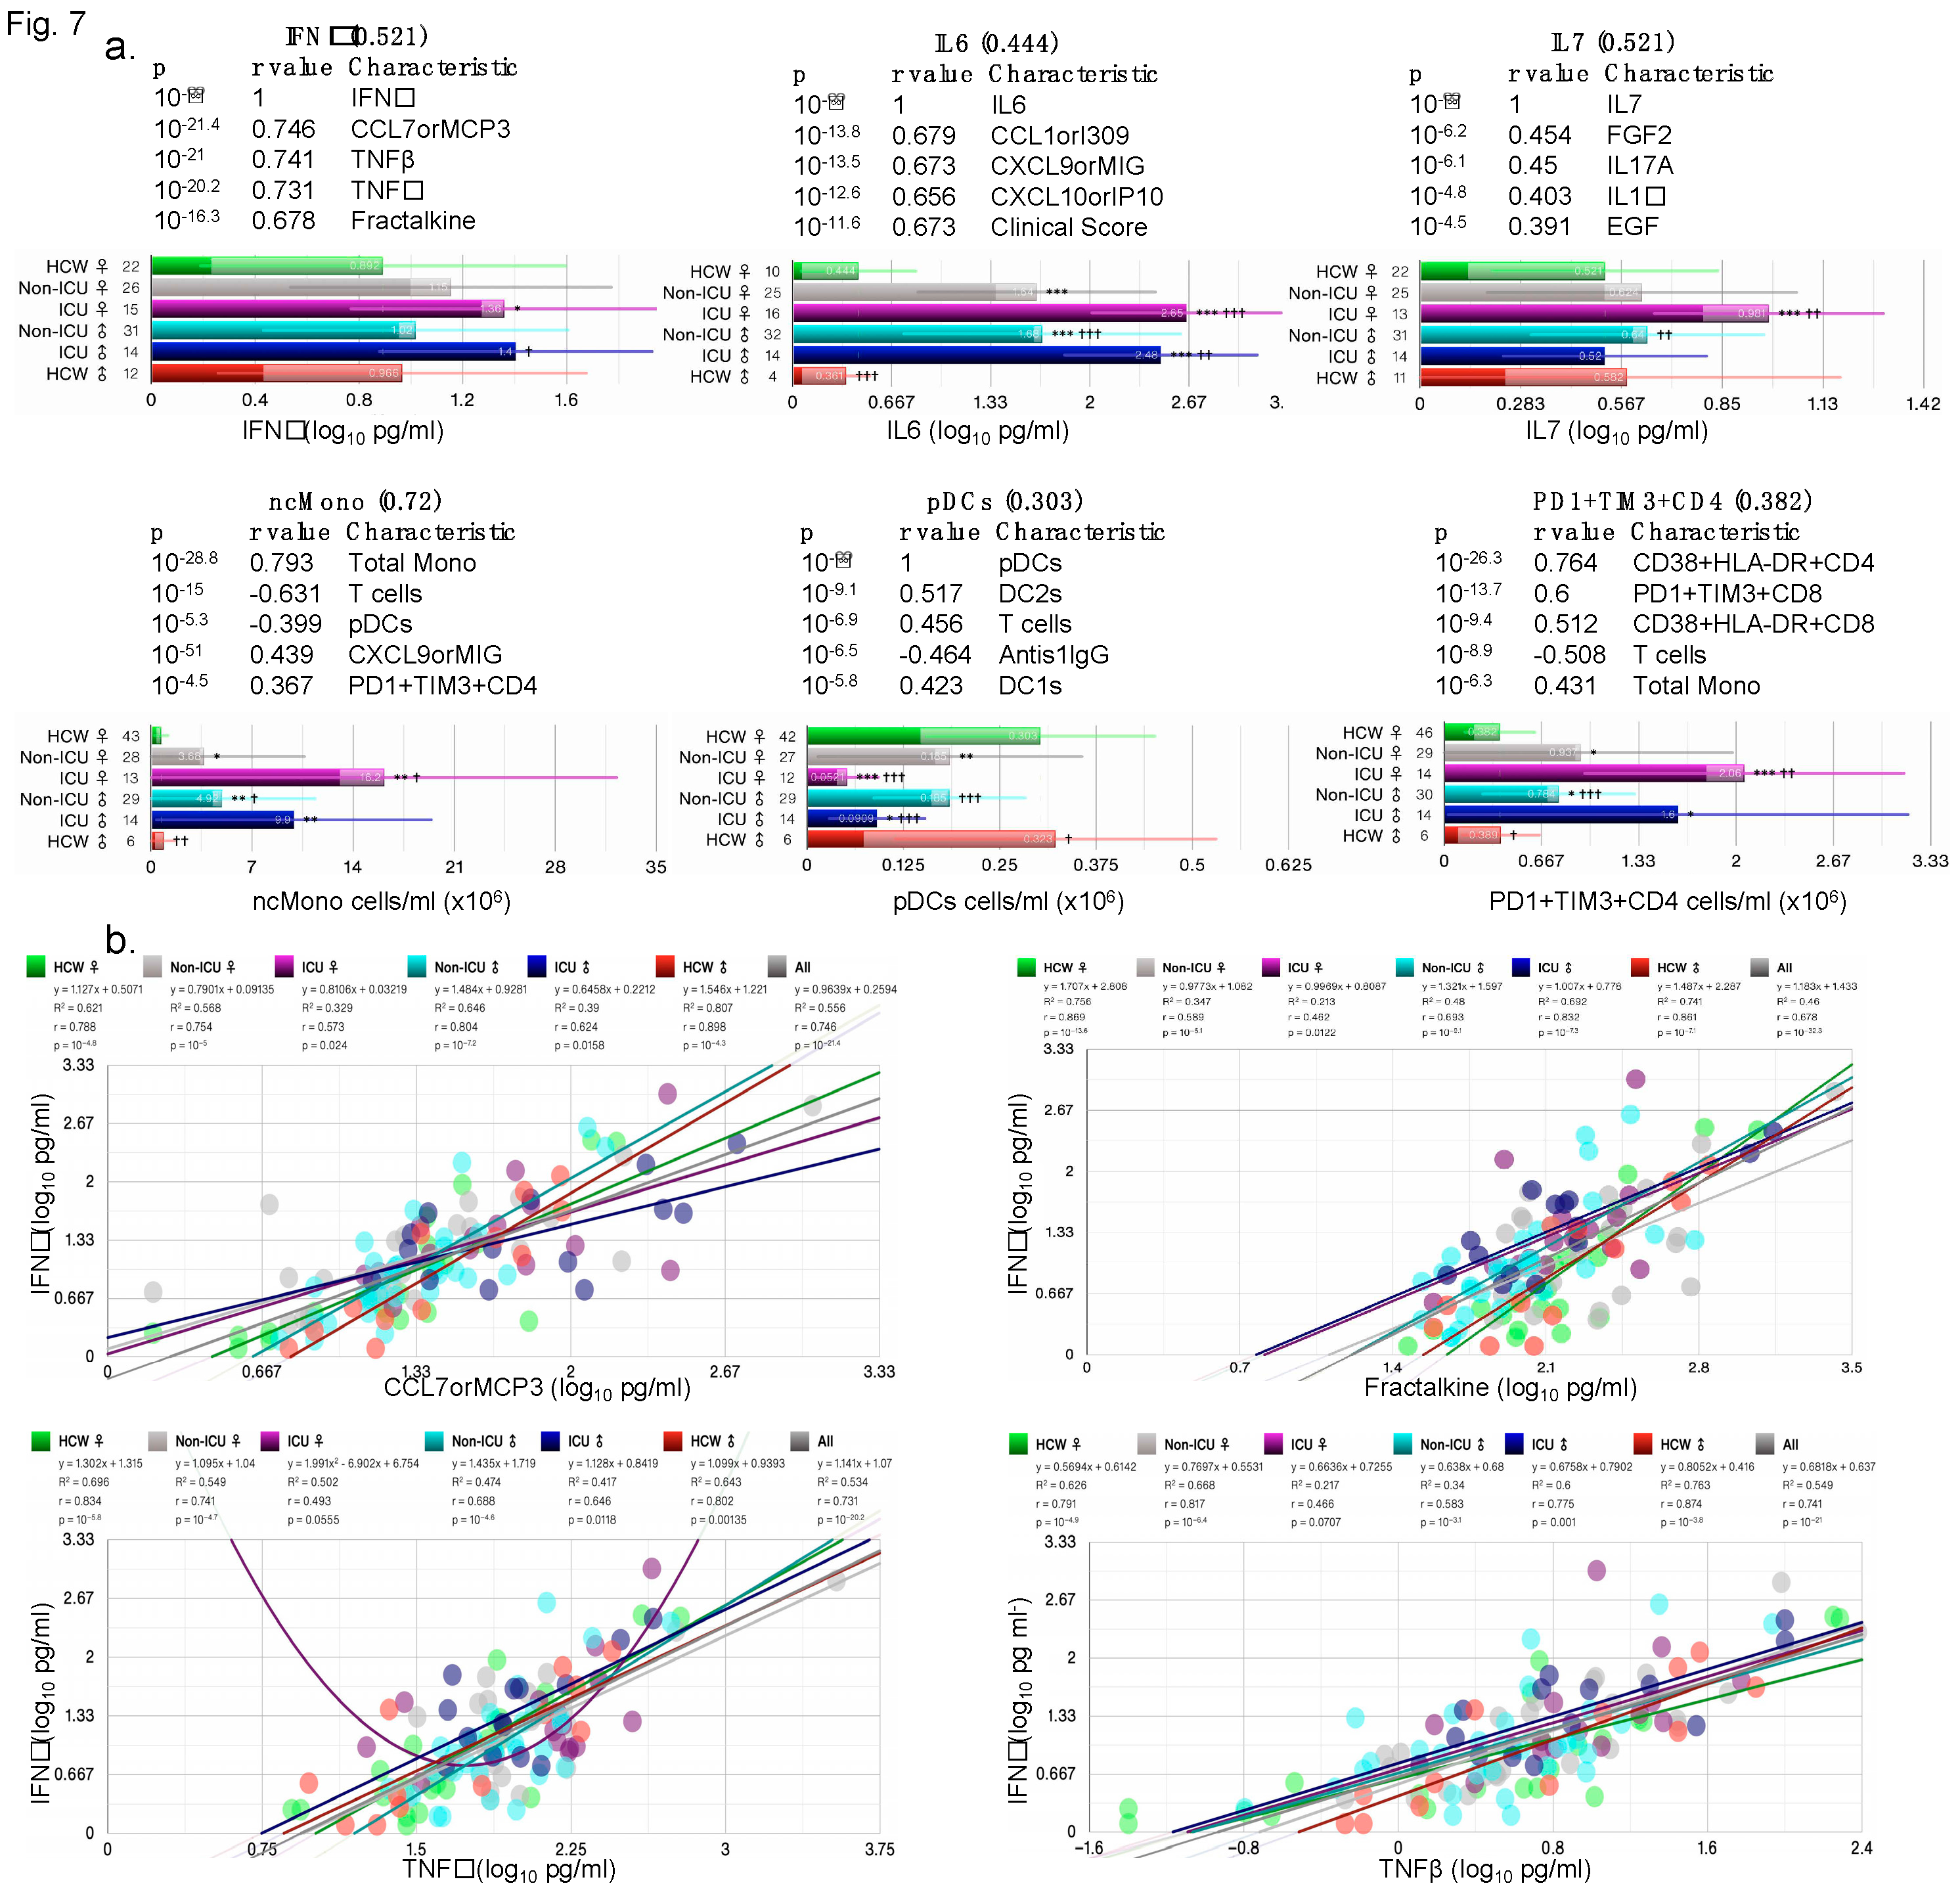
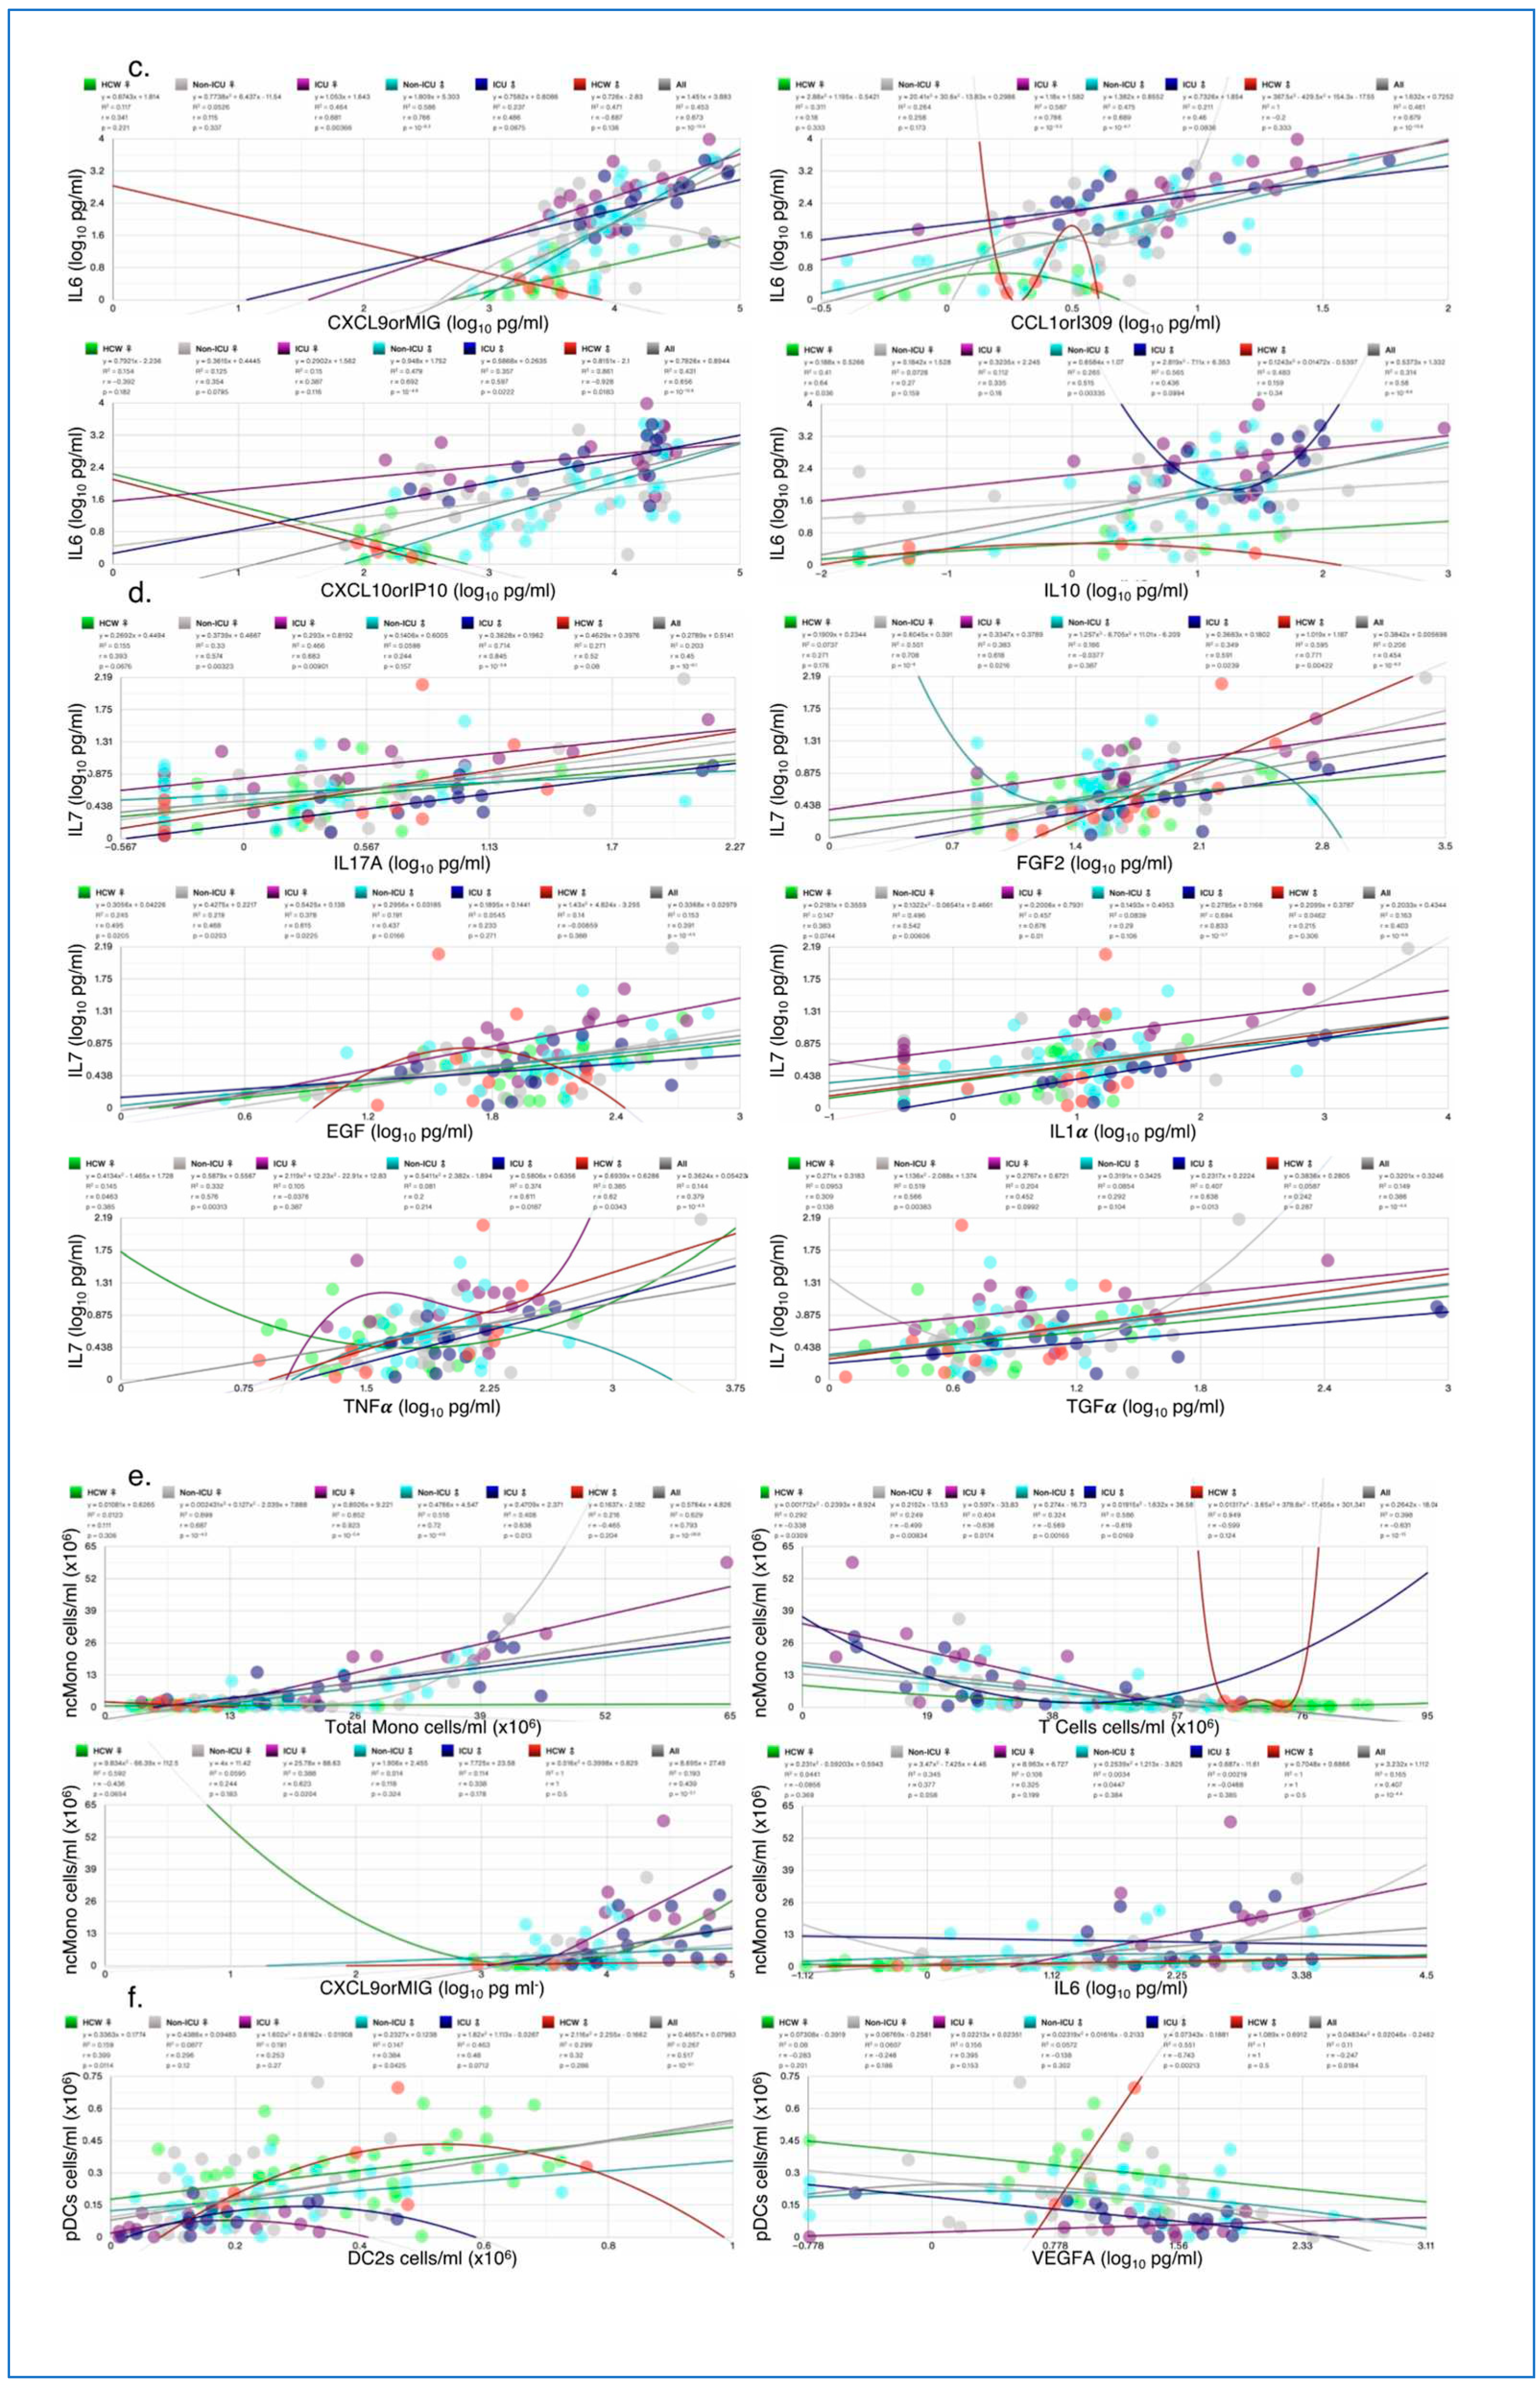
Cytokines such as IFNγ and IL6 are induced early on after viral infection and key components of the “cytokine storm”. Plasmacytoid dendritic cells (pDCs) and monocytes are also key for fighting off infections as they produce several cytokines including IFNs. IFNγ, IL6, PD1+TIM3+CD4, and non-classical monocytes (ncMono) were all increased in ICU female and male patients compared with HCW and non-ICU patients (
Figure 7a), IL7 was only increased in female ICU patients, whereas pDC numbers were highly reduced in ICU female and male patients (
Figure 7a). For each cytokine/cell type, the five most correlated measures (sorted by p) are shown with their respective p-value and Pearson’s r-values in the bar charts. Correlations with clinical measures such as ICU, clinical scores, treatment counts, and antiS1IgG were noted for some measures (
Figure S4). When correlations by ICU status and sex were examined, IFNγ correlation with CCL7orMCP3, TNFβ, TNFα, and fractalkine were lowest in ICU females (
Figure 7b), whereas correaltions in HCW male and female did not differ. IL6 correlated significantly with chemokines CXCL9orMIG, CXCL10orIP10, CXCL1orI309, and with cytokine IL10 in female and male ICU patients, but not always with female non-ICU patients (
Figure 7c). IL7 correlation with top 4 measures included IL17A, EGF, FGF2, and IL1α, but the correlations did not always hold in male non-ICU and non-ICU patients (
Figure 7d).
Figure 7.
Sex differences in correlation with key cytokines/chemokines. (a) Bar charts showing the average abundance of interferon gamma (IFNγ), interleukin-6 (IL6), IL7, nonclassical monocytes (ncMono), plasmacytoid dendritic cells (pDCs) and CD4+ T cells positive for programmed cell death protein 1 (PD-1) and hepatitis A virus cellular receptor 2 (TIM3) (PD1+TIM3+CD4+). Scatter plots for the four measures most significantly correlated with (b) IFNγ, (c) IL6, (d) IL7, (e) ncMono, and (e) pDCs, each showing the goodness-of-fit (R2), Person’s r, and p-values for all test groups. Numbers on X-axis in bar charts in (a) denote the actual number of patients in which the measures were detected. N/group: HCW♀: 87; Non-ICU♀: 30; ICU♀: 16; Non-ICU♂: 33; ICU♂: 14; HCW♂: 27.
4. Discussion
BMI, risk factor count, ICU status, clinical score, treatment count, days from corticosteroid end, and saliva load were variables that differed significantly between ICU and non-ICU patients and contributed to changed measures and health outcomes. IL6 was the most changed measure across many variables, highly increased in deceased and ICU patients, regardless of biological sex, and correlated most with CCL1orI309. Viral load in saliva or nasopharyngeal swabs correlated with distinct cytokines/chemokines including IFNγ, TNFα, CCL8orMCP2 with nasopharyngeal load reaching 41% inverse correlation with AntiS1IgG in all patients. Curiously, some patients with multiple time points were negative for SARS-CoV-2 to start with but became positive while hospitalized and then were negative (0 value for viral load) again. Yet others were positive to start with and became negative or had missing values. This suggests that either these patients were false positives and misclassified as COVID-19 patients, or the tests were incorrect/inconclusive. Anti-S1IgG and IgM levels were barely over the limit of detection in several patients, and it is unclear whether the concentrations detected could be quantified reliably in majority of the patients [
10]. Even patients with high viral load did not necessarily have high anti-S1 titers.
Saliva load correlated with CCL8orMCP2, a chemokine that activates leukocytes and binds with high affinity to the receptor CCR5. CCL8 is known to be a potent inhibitor of HIV1 by competing for binding to CCR5 [
12,
13], which also serves as a co-receptor for HIV1, suggesting one mechanism to fight the invading virus. CCL8 was highly correlated with IL10 and IFNγ. Nasopharyngeal viral load correlated negatively with AntiS1IgG suggesting the expected delay in appearance of viral-specific antibodies after days from infection. Absence of both viral load and AntiS1IgG/IgM in a number of patients supports the notion that they were SARS-CoV-2
− and their inclusion may confound findings. Interestingly, saliva and NP loads correlated with distinct cytokines/chemokines suggesting location-specific activation of immune responses that help fight the invading pathogens.
In the IMPACT cohort, some patients were classified in one or more of 4 different categories of risk factors for COVID-19. The original study reported that extreme BMI (>35) correlated with an increased relative risk of mortality [
10], yet BMI was not considered as a risk factor, instead adjusted for it. Obese patients had the worst clinical score and 75% of COVID-19
- patients who were in ICU had a BMI>30. Average BMI and clinical score for deceased patients who were all in ICU was 37 and 4.5, respectively, arguing that obesity/BMI should be classified as a major risk factor for health outcomes and should not be adjusted for, at least in COVID-19 patients.
The patients were given at least 4 different treatments for COVID-19, and some received multiple treatments, whereas others none. Potent immunomodulators such as tocilizumab and corticosteroids were used, yet their effectiveness in reducing cytokine levels or modulating immune cell numbers in disease severity was not examined in any of the reports [
9,
10,
14]. Our reanalysis suggests that none of the early treatments were effective in reducing levels of key proinflammatory cytokines such as IL6, that are key components of the “cytokine storm”. More importantly, none of the treatments appear to reduce clinical symptoms or health outcomes. Such an analysis would have benefited the community and efforts could have been diverted and focused on other treatments.
IL6 was the most significantly increased and changed cytokine across variables that correlated with clinical score and most increased in deceased male patients, but its levels in deceased female patients did not differ from those in ICU. Many chemokines and cytokines such as CCL1orI309, CCL21, CXCL10, SCF, Fractalkine, IL10 correlated with each other in several groups under various biological variables such as DFSO, clinical score, treatments, and risks, suggesting that these immunological measures should be investigated in greater depth. In female vs male patients’ comparison (Pt.♀/Pt.♂), only BMI and IL16 were significantly different. IL6 was most increased in deceased and ICU patients but levels did not differ in female and male patients. IL6 strongly correlated with IFNλ2 (IFNL2orIL28) and CCL1orI309. SCF and IL2 were most decreased in female CAC patients and correlated inversely with IFNλ2 and FGF2. IFNλ2’s role in immunoprotection is well recognized [
15,
16]. CD8Tem and C8Tcm were the most decreased measures and they correlated strongest in deceased patients (r=0.84, p=10
-11.3). CD8 T cells respond to cognate antigen and individuals in whom these memory CD8 T cells persist long-term are often better protected against invading pathogens including viruses, bacteria, and protozoans [
17].
Days 7–10 are a critical period for switching between recovery or going on to being critically ill [
16]. We next determined how key variables such as DFSO, risk factors including obesity (BMI ≥ 30), treatments received, treatment counts, clinical score, ICU status and outcomes “impacted” the significantly changed immunological signature identified in ICU female and male patients in confirmed SARS-CoV-2
+ patients compared with HCW controls. In male CAC patients, CXCL10orIP10, a CXCR3 ligand was the most significantly changed and CD8Tcm was most changed relative to non-CAC male patients. CXCL10orIP10 is involved in the generation of parasite specific CD8 T cell-mediated immune responses, and CXCL10 expression in the central nervous system regulates antibody-secreting cell accumulation during SARS-CoV-2-induced encephalomyelitis [
18]. Elevated CXCL10orIP10 levels are correlated with COVID-19-related ARDS and neurological complications and is considered a predictive biomarker of COVID-19 severity and disease progression. SCF, an essential hematopoietic cytokine interacts with other cytokines to preserve the viability of hematopoietic stem and progenitor cells. SCF was markedly decreased in female CAC patients along with IL2, IL23, IL16, VEGFA, macrophages, T cells, NKT cells, CD8Tem and several others, whereas total and ncMono, IL6+CD4 and TNFα were increased.
IL10 was differentially changed and increased in DFSO 1-10 in female versus male patients, but decreased as the diseased progressed, however, at similar clinical score, IL10 levels were lower in female versus male patients. IL10 has dual function, and its timing and spatiotemporal expression determines anti- or pro-inflammatory effects. Fractalkine (CX3CL1), a chemokine that alters the leukocyte adhesion mechanism to render their association with proteoglycans and other adhesion molecules irrelevant and modulates extravasation through the vascular wall, was highly correlated with IFNγ. Fractalkine, TNFα, SCF and other cytokines were increased/decreased in patients with risks versus no risk, and in female versus male with risks, except in cancer treatment and immunosuppressed patients. Dendric and NKT cell populations were highly decreased in patients versus HCW. These specific signatures when examined in depth could help understand immune mechanisms and “misfiring” that underlie differential outcomes between the sexes even at identical clinical scores taking risks and other variables into consideration, but not adjusting for them.
Of note, not all measures were detected or quantifiable in all patients. For examples, IL2 was detected in plasma of only ~12% of female and ~26% of male patients, and IFNγ in ~61% of female and ~78% of male patients. Imputed values for missing data can mean that either the patients did not have those measures, or the assay was not sensitive enough. If former, imputed values can be misleading as values under the limit of detection and/or quantification suggests that those cytokines/chemokines were only secreted by a subset of patients depending upon their comorbidities and/or other health status. Decreased numbers of immune cells in plasma could also be due to increased uptake of specific immune cells by tissues such as the lungs or secondary lymphoid organs. A number of measures despite being shared between the sexes, did not necessarily correlate to the same degree in female and male ICU patients. For example, CCL21or6CKine correlated with CCL1, SCF and Fractalkine to a much lesser degree in female as compared with male ICU patients, suggesting nuanced regulation, and signaling that can be easily missed in sex aggregated analysis.
5. Conclusions
In conclusion, several novel findings were missed in the original Articles: first, the immune signature of ICU and CAC patients is strikingly different than that of non-ICU and non-CAC patients, with notable absence of differences in many usual suspects such as IL6, TNF, and CCL5 between non-ICU and ICU patients. Second, none of the treatments, including immunomodulators such as Solu-medrol (corticosteroid) and tocilizumab decreased levels of IL6 or key cytokines/chemokines implicated in cytokine storm, nor did remdesivir or hydroxychloroquine. Third, dendritic (cDC1s, cDC2s, and pDCs) and NKT cells were decreased in all COVID-19 patients regardless of sex, a finding confirmed later [
19]. Fourth, men and women shared many measures that did not differ with sex as a variable but were influenced differentially with variables such as risk factors, clinical score, and treatments. Fifth, overall, male CAC and ICU patients experienced many more changes compared with non-ICU patients. Sixth, patients with obesity as a risk factor had the most changes in all measures and worst outcomes, including mortality, whereas patients who had received prior cancer treatment and who were immunosuppressed experienced the greatest changes in immunological signatures. Taken together, our multi-dimensional analyses revealed many significant findings that were missed in the original Articles. We provide support that sex aggregated analysis, which has been the norm for clinical studies, is often misleading. Most animal studies in the past predominantly used one sex (male) and hence the data were not confounded, but with changes in NIH policy with regards to sex as a biological variable (SABV) [
20], when using both sexes, researchers often perform combined analysis, thereby missing key findings. Similarities and differences should both be reported and are essential for understanding divergent pathways that lead to similar health outcomes.
Supplementary Materials
The following supporting information can be downloaded at the website of this paper posted on Preprints.org, Figure S1–S4: Changed immunological and biological measures in COVID-19 patients; Table S1: SARS-CoV-2 viral load in nasopharyngeal (Np) and saliva samples in IMPACT Cohort patients; Table S2: Correlations between all biological and clinical measures; Tables S3–S5: Significantly changed immunological and biological measures in all SARS-CoV-2+ (COVID-19+), non-ICU, and ICU patients versus HCW.
Author Contributions
Conceptualization, AB; methodology, JDK, AB; software, JDK; validation, JDK, AB; formal analysis, JDK, AB; resources, AB; data curation, JDK, AB; writing—original draft preparation, AB; writing—review and editing, JDK, AB; visualization, JDK, AB; supervision, AB. All authors have read and agreed to the published version of the manuscript.
Funding
This research received no funding.
Institutional Review Board Statement
The study did not require ethical approval.
Data Availability Statement
Conflicts of Interest
The authors are co-founders of Aseesa Inc. and declare no conflict of interest. There was no funding for this study.
References
- Guan, W.J.; Ni, Z.Y.; Hu, Y.; Liang, W.H.; Ou, C.Q.; He, J.X.; Liu, L.; Shan, H.; Lei, C.L.; Hui, D.S.C.; et al. Clinical Characteristics of Coronavirus Disease 2019 in China. N Engl J Med 2020, 382, 1708–1720. [Google Scholar] [CrossRef] [PubMed]
- Huang, C.; Wang, Y.; Li, X.; Ren, L.; Zhao, J.; Hu, Y.; Zhang, L.; Fan, G.; Xu, J.; Gu, X.; et al. Clinical features of patients infected with 2019 novel coronavirus in Wuhan, China. Lancet 2020, 395, 497–506. [Google Scholar] [CrossRef] [PubMed]
- Killingley, B.; Mann, A.J.; Kalinova, M.; Boyers, A.; Goonawardane, N.; Zhou, J.; Lindsell, K.; Hare, S.S.; Brown, J.; Frise, R.; et al. Safety, tolerability and viral kinetics during SARS-CoV-2 human challenge in young adults. Nat Med 2022, 28, 1031–1041. [Google Scholar] [CrossRef] [PubMed]
- Wolfel, R.; Corman, V.M.; Guggemos, W.; Seilmaier, M.; Zange, S.; Muller, M.A.; Niemeyer, D.; Jones, T.C.; Vollmar, P.; Rothe, C.; et al. Virological assessment of hospitalized patients with COVID-2019. Nature 2020, 581, 465–469. [Google Scholar] [CrossRef] [PubMed]
- Mehta, P.; McAuley, D.F.; Brown, M.; Sanchez, E.; Tattersall, R.S.; Manson, J.J.; Hlh Across Speciality Collaboration, U.K. COVID-19: consider cytokine storm syndromes and immunosuppression. Lancet 2020, 395, 1033–1034. [Google Scholar] [CrossRef] [PubMed]
- Wu, C.; Chen, X.; Cai, Y.; Xia, J.; Zhou, X.; Xu, S.; Huang, H.; Zhang, L.; Zhou, X.; Du, C.; et al. Risk Factors Associated With Acute Respiratory Distress Syndrome and Death in Patients With Coronavirus Disease 2019 Pneumonia in Wuhan, China. JAMA Intern Med 2020, 180, 934–943. [Google Scholar] [CrossRef] [PubMed]
- McNab, F.; Mayer-Barber, K.; Sher, A.; Wack, A.; O’Garra, A. Type I interferons in infectious disease. Nat Rev Immunol 2015, 15, 87–103. [Google Scholar] [CrossRef] [PubMed]
- Sen, G.C. Viruses and interferons. Annu Rev Microbiol 2001, 55, 255–281. [Google Scholar] [CrossRef]
- Lucas, C.; Wong, P.; Klein, J.; Castro, T.B.R.; Silva, J.; Sundaram, M.; Ellingson, M.K.; Mao, T.; Oh, J.E.; Israelow, B.; et al. Longitudinal analyses reveal immunological misfiring in severe COVID-19. Nature 2020, 584, 463–469. [Google Scholar] [CrossRef]
- Takahashi, T.; Ellingson, M.K.; Wong, P.; Israelow, B.; Lucas, C.; Klein, J.; Silva, J.; Mao, T.; Oh, J.E.; Tokuyama, M.; et al. Sex differences in immune responses that underlie COVID-19 disease outcomes. Nature 2020, 588, 315–320. [Google Scholar] [CrossRef]
- et al. GNU Scientific Library Reference Manual (3rd Ed.).
- Lopalco, L. CCR5: From Natural Resistance to a New Anti-HIV Strategy. Viruses 2010, 2, 574–600. [Google Scholar] [CrossRef] [PubMed]
- Rom, S.; Rom, I.; Passiatore, G.; Pacifici, M.; Radhakrishnan, S.; Del Valle, L.; Pina-Oviedo, S.; Khalili, K.; Eletto, D.; Peruzzi, F. CCL8/MCP-2 is a target for mir-146a in HIV-1-infected human microglial cells. FASEB J 2010, 24, 2292–2300. [Google Scholar] [CrossRef] [PubMed]
- Shattuck-Heidorn, H.; Danielsen, A.C.; Gompers, A.; Bruch, J.D.; Zhao, H.; Boulicault, M.; Marsella, J.; Richardson, S.S. A finding of sex similarities rather than differences in COVID-19 outcomes. Nature 2021, 597, E7–E9. [Google Scholar] [CrossRef]
- Andreakos, E.; Tsiodras, S. COVID-19: lambda interferon against viral load and hyperinflammation. EMBO Mol Med 2020, 12, e12465. [Google Scholar] [CrossRef] [PubMed]
- Galani, I.E.; Rovina, N.; Lampropoulou, V.; Triantafyllia, V.; Manioudaki, M.; Pavlos, E.; Koukaki, E.; Fragkou, P.C.; Panou, V.; Rapti, V.; et al. Untuned antiviral immunity in COVID-19 revealed by temporal type I/III interferon patterns and flu comparison. Nat Immunol 2021, 22, 32–40. [Google Scholar] [CrossRef] [PubMed]
- Martin, M.D.; Badovinac, V.P. Defining Memory CD8 T Cell. Front Immunol 2018, 9, 2692. [Google Scholar] [CrossRef] [PubMed]
- Gudowska-Sawczuk, M.; Mroczko, B. What Is Currently Known about the Role of CXCL10 in SARS-CoV-2 Infection? Int J Mol Sci 2022, 23. [Google Scholar] [CrossRef] [PubMed]
- Kvedaraite, E.; Hertwig, L.; Sinha, I.; Ponzetta, A.; Hed Myrberg, I.; Lourda, M.; Dzidic, M.; Akber, M.; Klingstrom, J.; Folkesson, E.; et al. Major alterations in the mononuclear phagocyte landscape associated with COVID-19 severity. Proc Natl Acad Sci U S A 2021, 118. [Google Scholar] [CrossRef] [PubMed]
- Bhargava, A.; Arnold, A.P.; Bangasser, D.A.; Denton, K.M.; Gupta, A.; Hilliard Krause, L.M.; Mayer, E.A.; McCarthy, M.; Miller, W.L.; Raznahan, A.; et al. Considering Sex as a Biological Variable in Basic and Clinical Studies: An Endocrine Society Scientific Statement. Endocr Rev 2021, 42, 219–258. [Google Scholar] [CrossRef] [PubMed]
|
Disclaimer/Publisher’s Note: The statements, opinions and data contained in all publications are solely those of the individual author(s) and contributor(s) and not of MDPI and/or the editor(s). MDPI and/or the editor(s) disclaim responsibility for any injury to people or property resulting from any ideas, methods, instructions or products referred to in the content. |
© 2023 by the authors. Licensee MDPI, Basel, Switzerland. This article is an open access article distributed under the terms and conditions of the Creative Commons Attribution (CC BY) license (http://creativecommons.org/licenses/by/4.0/).
