Preprint
Article

Ascophyllum nodosum Extract and Glycine Betaine Preharvest Application in Grapevine: Enhancement of Berry Quality, Phytochemical Content and Antioxidant Properties

Altmetrics

Downloads

107

Views

49

Comments

0

A peer-reviewed article of this preprint also exists.

Submitted:

15 August 2023

Posted:

17 August 2023

You are already at the latest version

Alerts
Abstract
The Douro Demarcated Region (DDR) has peculiar edaphoclimatic characteristics that provide a suitable terroir for premium wine production. As climate change effects continue to emerge, ensuring productivity and quality becomes increasingly important for viticulturists, as those directly determine their profits. Cultural approaches, such as the use of biostimulants, are actively being developed to mitigate abiotic stress. The main objective of this work was to assess the effect of foliar sprays of a seaweed (Ascophyllum nodosum) based extract (ANE) and glycine betaine (GB) on grape berry quality, bioactive compounds, and antioxidant activity. A trial was installed in a commercial vineyard (cv. Touriga Franca) in the Douro Superior (Upper Douro) sub-region of the Douro Demarcated Region. In 2020, a total of three foliar sprayings were performed during the growing season, namely at pea-size, bunch closure, and veraison. There was a positive effect of both biostimulants (ANE and GB) on the physiological and biochemical performance of cv. Touriga Franca exposed to summer stress. In general, the GB 0.2% spraying was the most promising treatment for this grape cultivar, as it increased berry quality, the concentration of bioactive compounds (total phenolics, flavonoids and ortho-diphenols), and the antioxidant activities. These results revealed the efficacy of biostimulants sprayings as sustainable viticultural practice, improving berry quality under summer stress conditions.
Keywords: 
Subject: Biology and Life Sciences  -   Agricultural Science and Agronomy

1. Introduction

Climatic conditions are major factors influencing the quality of grapes and wine. According to OIV [1], between 2020 and 2021, wine production in the EU declined around 8%, which was attributed to the extreme differences in weather conditions throughout the years. Despite this, the European countries Italy, France, and Spain, were the top-three wine-producing countries in 2021, accounting for 47% of the world wine production [1]. However, this production is expected to be affected as the negative impacts of climate change on grapevine physiology, growth, production and berry quality become more prominent [2,3,4]. In order to prevent this, climate change mitigation strategies, such as the use of biostimulants, are increasingly needed [5]. Biostimulants, including Ascophyllum nodosum extracts and glycine betaine, are widely used in grapevines and in many other crops [5,6,7,8,9,10,11,12,13,14]. Brown seaweed extract is amongst the biostimulants most used in agriculture, with those of Ascophyllum nodosum L. being the most studied. These seaweed extracts have been described as being able to improve berry quality by regulating molecular, physiological, and biochemical processes [8,11,12,16,17]. Glycine betaine is also considered one of the most attractive biostimulants for plant stress protection, as it is naturally synthesized, non-toxic, and inexpensive [18]. Moreover, this compound can act as an osmoprotectant, maintaining the cellular osmolarity, protecting the photosynthetic machinery (photosystem II) and thylakoid membranes, alleviating cellular oxidative damage and stabilizing protein structures [18,19].
As climate change threatens worldwide wine production there is a need to understand how mitigation strategies, such as the use of biostimulants, can be effective under field conditions. Therefore, the aim of this study was to evaluate the effect of a seaweed based biostimulant (Ascophyllum nodosum) and glycine betaine on berry quality, bioactive compounds, and antioxidant activity in Vitis vinifera L. cv. Touriga Franca. This is an important grape variety from the Douro Demarcated Region, whose peculiar terroir with warm-temperate climate and dry and hot summers, is being affected by climate change.

2. Materials and Methods

2.1. Plant material and sampling

The trial was installed in a nine-year-old commercial vineyard (41°15'03.3"N 7°06'38.7"W, 160m above sea level), in the Douro Superior (Upper Douro) sub-region of the Douro Demarcated Region, Vila Flor, Portugal. Samples were obtained from the black skinned Vitis vinifera cv. Touriga Franca, in two growing seasons: 2020 and 2021. Touriga Franca is the most cultivated variety in this region (27.3% of the total vineyard area), and the second (8%) in Portugal [20]. The vineyard was drip-irrigated every 15 days between bunch closure and veraison. The climatic characteristics of this region consist of a warm-temperate climate, with dry and hot summers. Monthly temperature and precipitation values were recorded by a weather station located near to the experimental site and are shown in Figure 1.
In 2020 and 2021, three foliar sprayings were performed during the growing seasons, namely at pea size (BBCH 75), bunch closure (BBCH 77) and veraison (BBCH 81) [21]. Foliar applications were carried out during the morning, covering the whole canopy. The treatments tested were A. nodosum seaweed-based extract (SPRINTEX NEW® L) (ANE) at two different concentrations (ANE 0.05% and ANE 0.1%), glycine betaine (Greenstim®) (GB) at two different concentrations (GB 0.1% and GB 0.2%), and control (C, water) (5 treatments x 10 plants x 3 replicates). To all the solutions used in the foliar applications was added a wetting agent (0.1%). At veraison (BBCH 81) and harvest (BBCH 89) [21], 30 berries per treatment and replicate were randomly sampled in the 10 plants for quality analysis. Additionally, berries from 3 different plants per treatment and replicate were collected and immediately frozen in liquid nitrogen. Samples were kept at -80°C and then lyophilized and converted to a fine dried powder (ground with liquid nitrogen) before the laboratorial analysis of bioactive compounds and antioxidant activity.

2.2. Quality assessment of fruits

Biometric parameters (berry weight and dimensions), color, total soluble solids, pH, titratable acidity, and maturity index were determined in 30 fruits from the three replicates of each of the five treatments, sampled at veraison and harvest stages. Fruit weight (g) was determined using an electronic balance and using a digital caliper (0.01mm sensitivity) the height (mm), width (mm), and thickness (mm) were measured. The external fruit color was assessed with a colorimeter (CR-300, Minolta, Japan), previously calibrated using a standard white plate. With the colorimetric coordinates, where L* indicates lightness, a* indicates red (+ a) to green (- a) colors, and b* indicates yellow (+ b) to blue (- b) colors, chroma (C*) value was calculated using the formula C* = (a*2 + b*2)1/2. Measurements were taken from two opposite sides of each fruit. After these analyses, the 30 berries were divided into three groups of ten fruits, which were then macerated with a mortar and pestle to obtain a juice. The total soluble solids (TSS in °Brix) of each berry juice were determined with a portable refractometer (PAL-1, ATAGO, Tokyo, Japan), and pH was measured using a portable pH meter (Hanna instrument, USA). Titratable acidity (TA) (gL−1 tartaric acid) was determined on 10mL of juice diluted in 10mL distilled water by using a manual glass burette with 0.1M NaOH to an endpoint of pH 8.1. The maturity index (MI) was calculated using the formula: MI = TSS*pH2 [22].

2.3. Determination of bioactive compounds

For sample extraction, 950µL of 70% (v/v) methanol were added to 40mg of dry material of each berries sample and mixed thoroughly in a vortex. After that, the mixture was submitted to 70°C for 30 minutes, and finally centrifuged at 13000rpm at 1°C for 15 minutes. These extracts were stored at -20°C and used for the determination of the total phenolics, flavonoids, ortho-diphenols and in antioxidant activity (AA) assays.

2.3.1. Total phenolics

Total phenolics concentration was determined using the Folin–Ciocalteu colorimetric method with some modifications, described by Singleton and Rossi [23]. For that, 20μL of extract was mixed with 100μL of Folin–Ciocalteu reagent (1:10) and 80μL of Na2CO3 (7.5%) in a 96 wells microplate. The microplate was maintained in the dark for 30 minutes and then the absorbance values were obtained at 765nm. Calibration was done using a gallic acid concentration curve and the results were expressed as mg of gallic acid equivalents per g of dry weight (mg GAE g-1 of DW).

2.3.2. Flavonoids

Flavonoids concentration was determined according to the colorimetric method described by Dewanto et al. [24], with some modifications. In a 96 wells microplate was added 100μL of ddH2O, 10μL of NaNO2 (5%) and 25μL of extract. The plate was placed in the dark at room temperature for 5 minutes. Then, 15µL of AlCl3 (10%) was added to each well. The plate was placed again in the dark for 6 minutes. Then, 50μL of NaOH (1M) and 50μL of ddH2O were added and the absorbance was read at 510nm. A calibration curve was prepared with catechin, and the results were expressed as mg of catechin equivalents per g of dry weight (mg CE g-1 of DW).

2.3.3. Ortho-diphenols

The ortho-diphenols content was measured colorimetrically by reading the absorbance at 370nm following the procedure described by Leal et al. and Gouvinhas et al. [25,26]. For that, in a 96 wells microplate, 160μL of extract was mixed with 40μL of sodium molybdate (5% w/v) and the plate was placed in the dark for 15 minutes. For calibration, a gallic acid curve was used and the results were expressed as mg of gallic acid equivalents per g of dry weight (mg GAE g-1 of DW).

2.3.4. Total anthocyanins

The total monomeric anthocyanins (TMA) content was determined according to several authors [27,28,29]. To obtain the extracts, 50mg of berries were added to 5mL of methanol acidified with 1% HCl. The mixture was shaken and placed in the dark at 4°C for 1 hour. It was then centrifuged at 4000rpm for 15 minutes at 4°C, and the supernatant collected. In a microplate, to 50μL of each extract was added 250μL of 0.025M KCl (pH = 1.0) or 250μL of 0.4 M sodium acetate buffer (pH = 4.5). Finally, absorbances of the mixtures with 0.025M KCl and of the mixtures with 0.4 M sodium acetate buffer were read at 510 and 700nm. The concentration of total monomeric anthocyanins was calculated according to the formula: TMA = (A*DF*MW)/(ɛ*C), where, MW is the molecular weight of cyanidin-3-O-glucoside (449 g mol-1); DF is the dilution factor; ε is the molar extinction coefficient of cyanidin-3-O-glucoside (29,600); C is the concentration of extracted volume and A = (A510 – A700)pH1.0 – (A510 – A700)pH4.5. Finally, results were expressed as mg of cyanidin-3-O-glucoside equivalents per gram of dry weight (mg CGE g-1 of DW).

2.4. Antioxidant activity assays

2.4.1. ABTS•+ radical-scavenging activity

To determine the radical-scavenging activity of berries extracts, the discoloration assay ABTS•+ (2,2’-azino-bis (3-ethylbenzothiazoline-6-sulphonic acid)) was used, as described by Re et al. and Stratil et al. [30,31]. For this, the ABTS•+ work solution was prepared using 7mM ABTS mixed with 140mM K2S2O8 in double distilled water. This mixture was then incubated for 12–16 hours in the dark at room temperature and its absorbance adjusted with absolute ethanol to 0.7-0.8 at the wavelength of 734 nm. Following this, 15µL of each berry extract (70% methanol (v/v) for the blank) plus 285µL of the ABTS•+ work solution was mixed and left to stand for 10 minutes in the dark, after which absorbance was read at 734nm. Results were expressed as µmol Trolox µg-1 of DW, according to a Trolox calibration curve.

2.4.2. DPPH radical-scavenging activity

The reduction of the DPPH (2,2-diphenyl-1-picrylhydrazyl) radical was detected by measuring sample absorbance at 517nm, according to several authors [32,33,34]. For this, 15 µL of extract (70% methanol (v/v) for the blank) were mixed with a 285µL methanolic solution containing DPPH radicals (10-5 mol L-1). The mixture was vigorously shaken and left for 30 minutes in the dark. Using a Trolox calibration curve the results were expressed as µmol Trolox µg-1 of DW.

2.4.3. FRAP assay

The FRAP (Ferric Reducing Antioxidant Power) assay used in this study was a modification of the previous method described by Stratil et al. and Benzie and Strain [31,35]. In sum, the FRAP reagent was prepared using 1 volume of an aqueous 10mM solution of TPTZ (2,4,6-Tri(2-pyridyl)-s-triazine) in 40mM HCl mixed with 1 volume of 20mM FeCl3.6H2O and 10 volumes of 300mM acetate buffer, pH 3.6. Then, 25µL of berry extract (70% methanol (v/v) for the blank) were mixed with 275µL of FRAP reagent. The mixture was vigorously shaken and left to stand for 5 minutes in the dark, followed by an absorbance reading at 593nm. Using a Trolox calibration curve, the results were expressed as µmol Trolox µg-1 of DW.

2.5. Statistical analysis

Data were analyzed using SPSS Statistics for Windows (IBM SPSS Statistics for Windows, Version 23.0. Armonk, NY: IBM Corp). Statistical differences between treatments in each phenological stage of each year were evaluated by one-, two- and three-way ANOVA, followed by Tukey multiple range test (P < 0.05). The results were presented as the mean (n=30 for quality assessment of fruits or n=3 for the determination of bioactive compounds) with the respective standard error (SE). A Pearson’s correlation analysis was used to determine the relationship between bioactive compound content and antioxidant activity values.

3. Results

3.1 Effect of biostimulants on berries quality

To assess the influence of the seaweed extract (ANE) and glycine betaine (GB) in berry quality, several parameters were determined, namely fruit biometry (berry weight and dimensions), color, maturity index, and titratable acidity, at the veraison and harvest stages of 2020 and 2021 growing seasons. In general, biometric parameters were affected by treatment (P < 0.001), year (P < 0.001), phenological stage (P < 0.001), by the interaction between treatment and year (P < 0.05 for fruit height and P < 0.001 for the other biometric parameters), by the interaction between treatment and phenological stage P < 0.05 for fruit height, P < 0.01 for weight and thickness, and P < 0.001 for width) and by the interaction between year and phenological stage (P < 0.001), (Table S1). Berries from grapevines sprayed with glycine betaine were heavier and bigger than those of the ANE treatments and the C. In fact, for the veraison and harvest of 2020, treatments with GB 0.2% produced berries with improvements in the four biometric parameters analyzed (weight, height, width, and thickness), when compared to C berries (Table 1); for example, at the veraison of 2020, grapevines treated with GB 0.2% yielded berries with increased weight and dimensions, with these being on average 5% bigger than those of control plants.
At veraison of 2021, no significant differences were verified, except for height, where GB 0.2% presented an improvement of 1.8% in relation to C; the remaining treatments (ANE 0.05%, ANE 0.1%, and GB 0.1%) showed a slight decrease in this parameter. At harvest 2021, GB 0.1% showed improvements to the parameters weight (5.7%), width (4.1%) and thickness (3.1%), and GB 0.2% to height (2.4%), when compared to C.
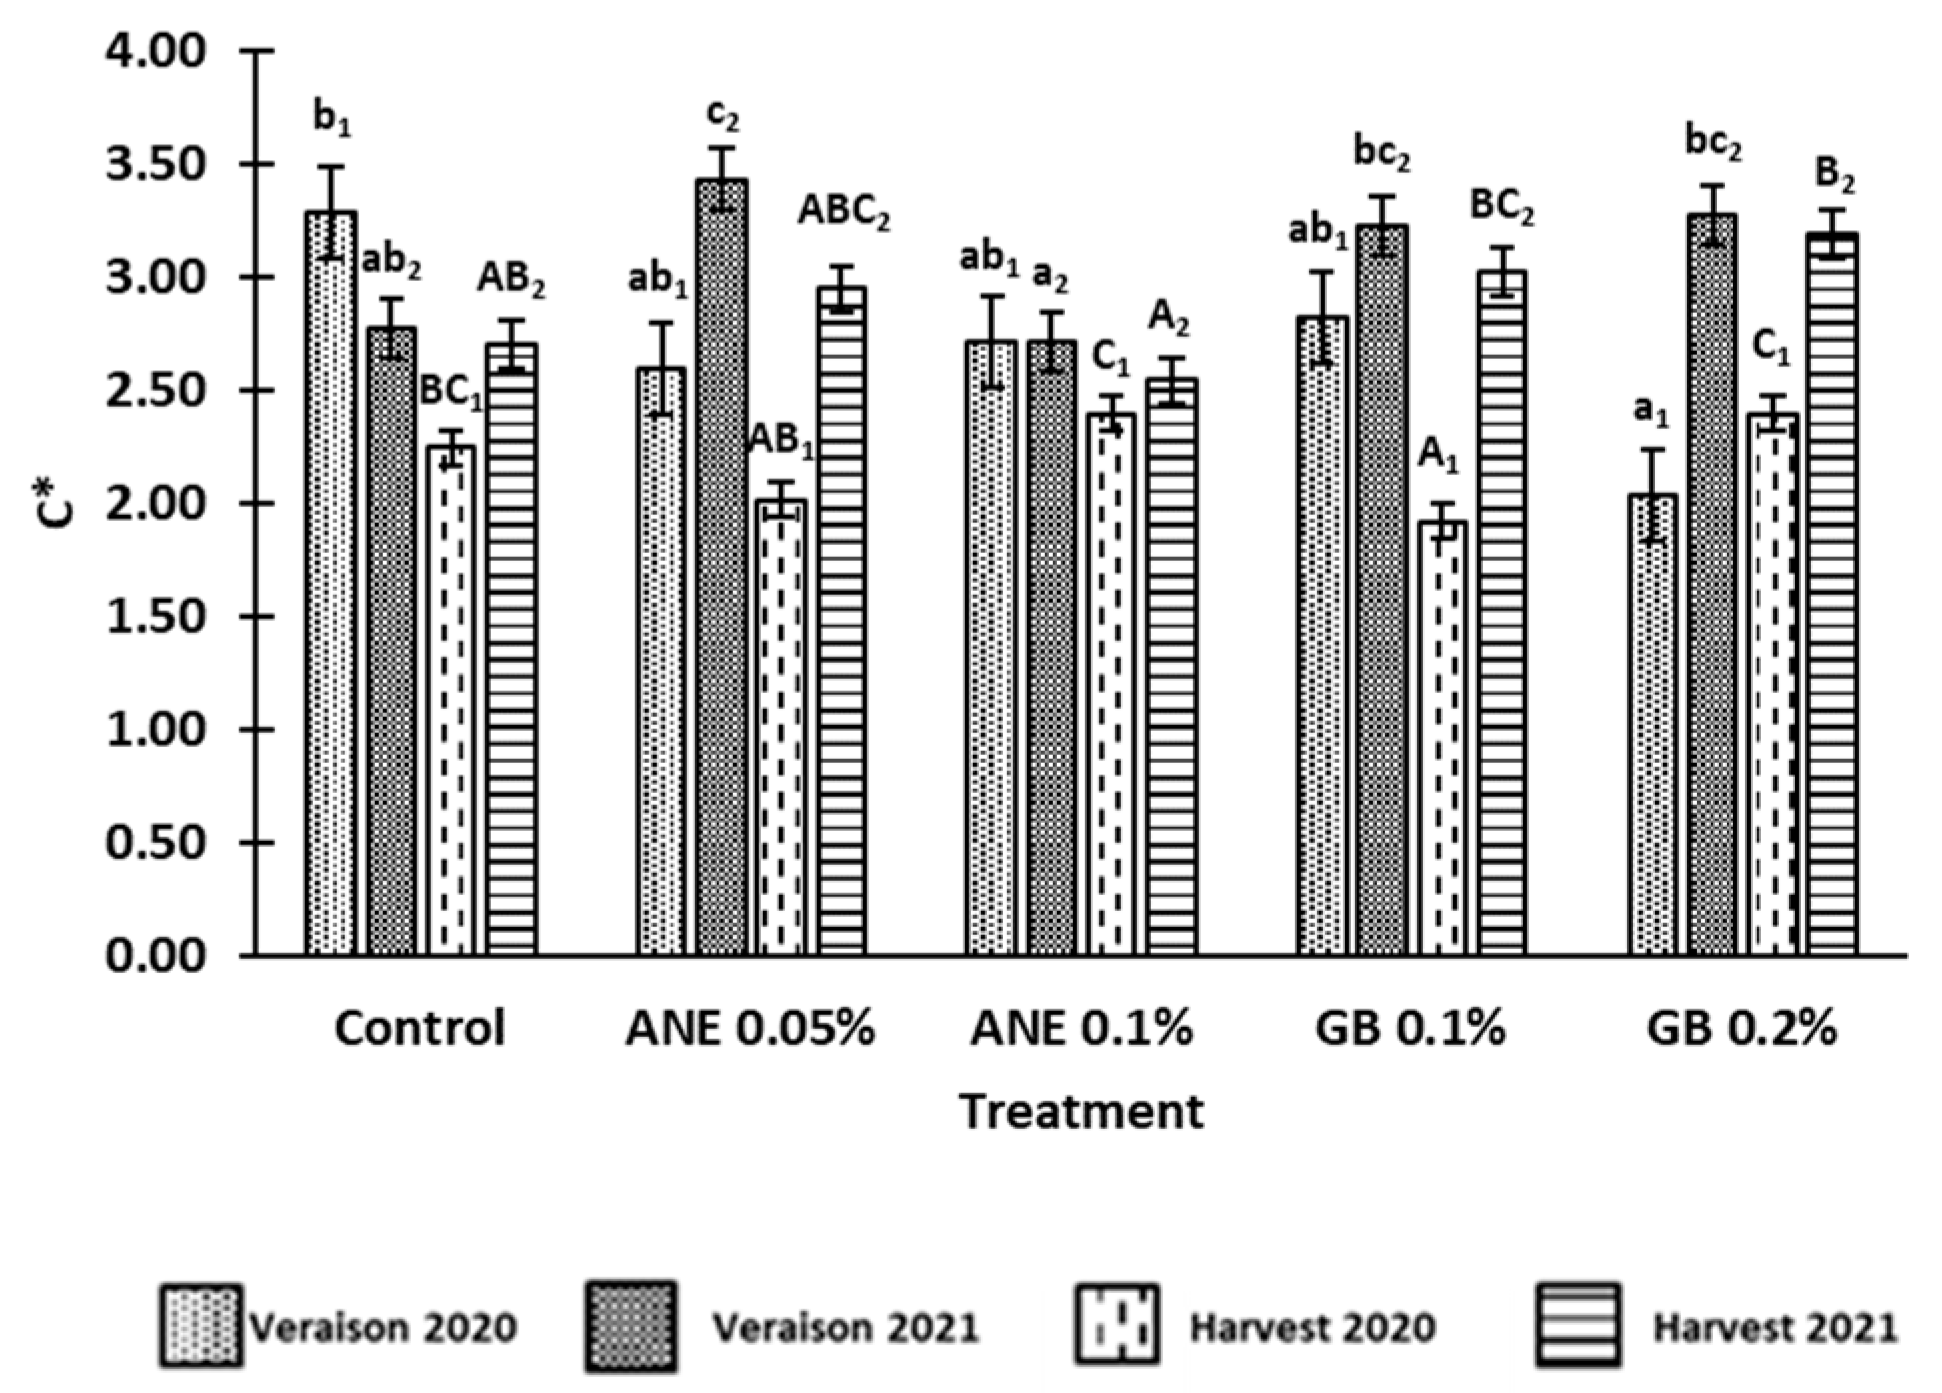
The values for the chroma (C*) of the berries in the two phenological stages and in both years are shown in Figure 2. It was verified that C* was affected by year (P < 0.001), phenological stage (P < 0.001), by the interaction treatment and year (P< 0.001), by the interaction treatment and phenological stage (P< 0.001), by the interaction year and phenological stage (P< 0.05) and by the interaction treatment, year and phenological stage (P< 0.01) (Table S1). In 2020, the lower C* value was observed in the berries treated with GB 0.2% at veraison, and GB 0.1% at harvest. In 2021, berries from ANE 0.1% showed the lower C* value at veraison and harvest. At harvest of both years, berries from GB 0.2% presented the highest C* value when compared to C, with an increase of 15% in 2021.
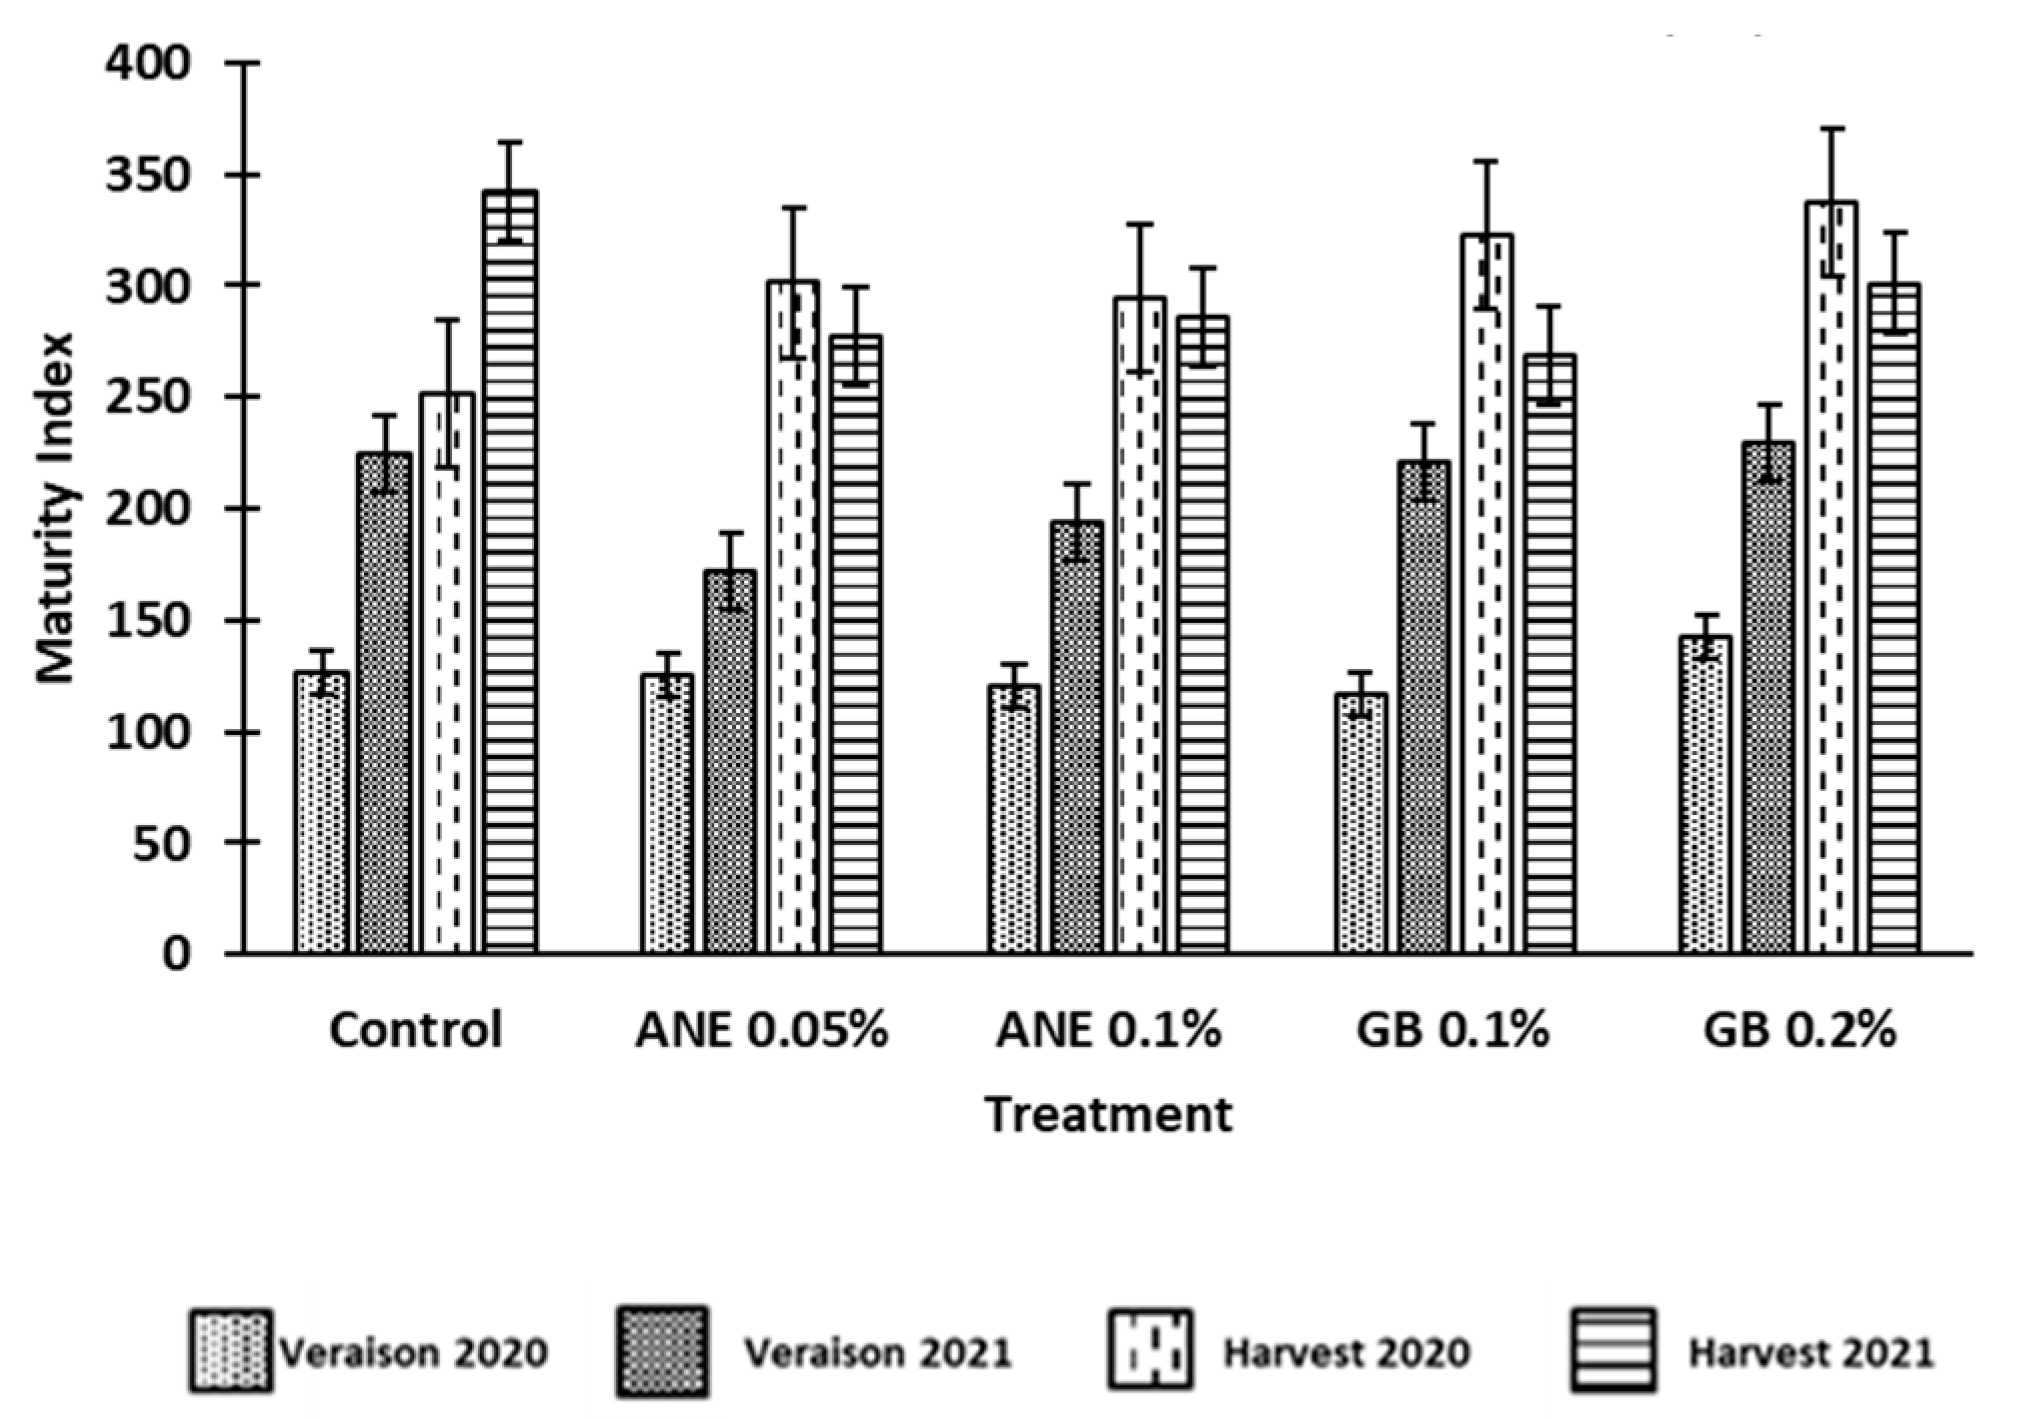
The maturity index (MI) is calculated through the TSS (°Brix) and the pH values, being generally used to determine the optimum ripeness of red wine grapes. In this study, it was verified an increase in MI from veraison to harvest (Figure 3), which is to be expected as the total soluble solids of berries tend to increase in this maturation period. However, no differences between treatments were verified at statistical level (P > 0.05). Consequently, the application of ANE and GB did not affect the maturity index. However, berries from grapevines treated with GB 0.2% showed the highest values of MI in harvest 2020 and in veraison of both years, which could indicate that these grapevines were in a more advanced phenological stage (Figure 3).
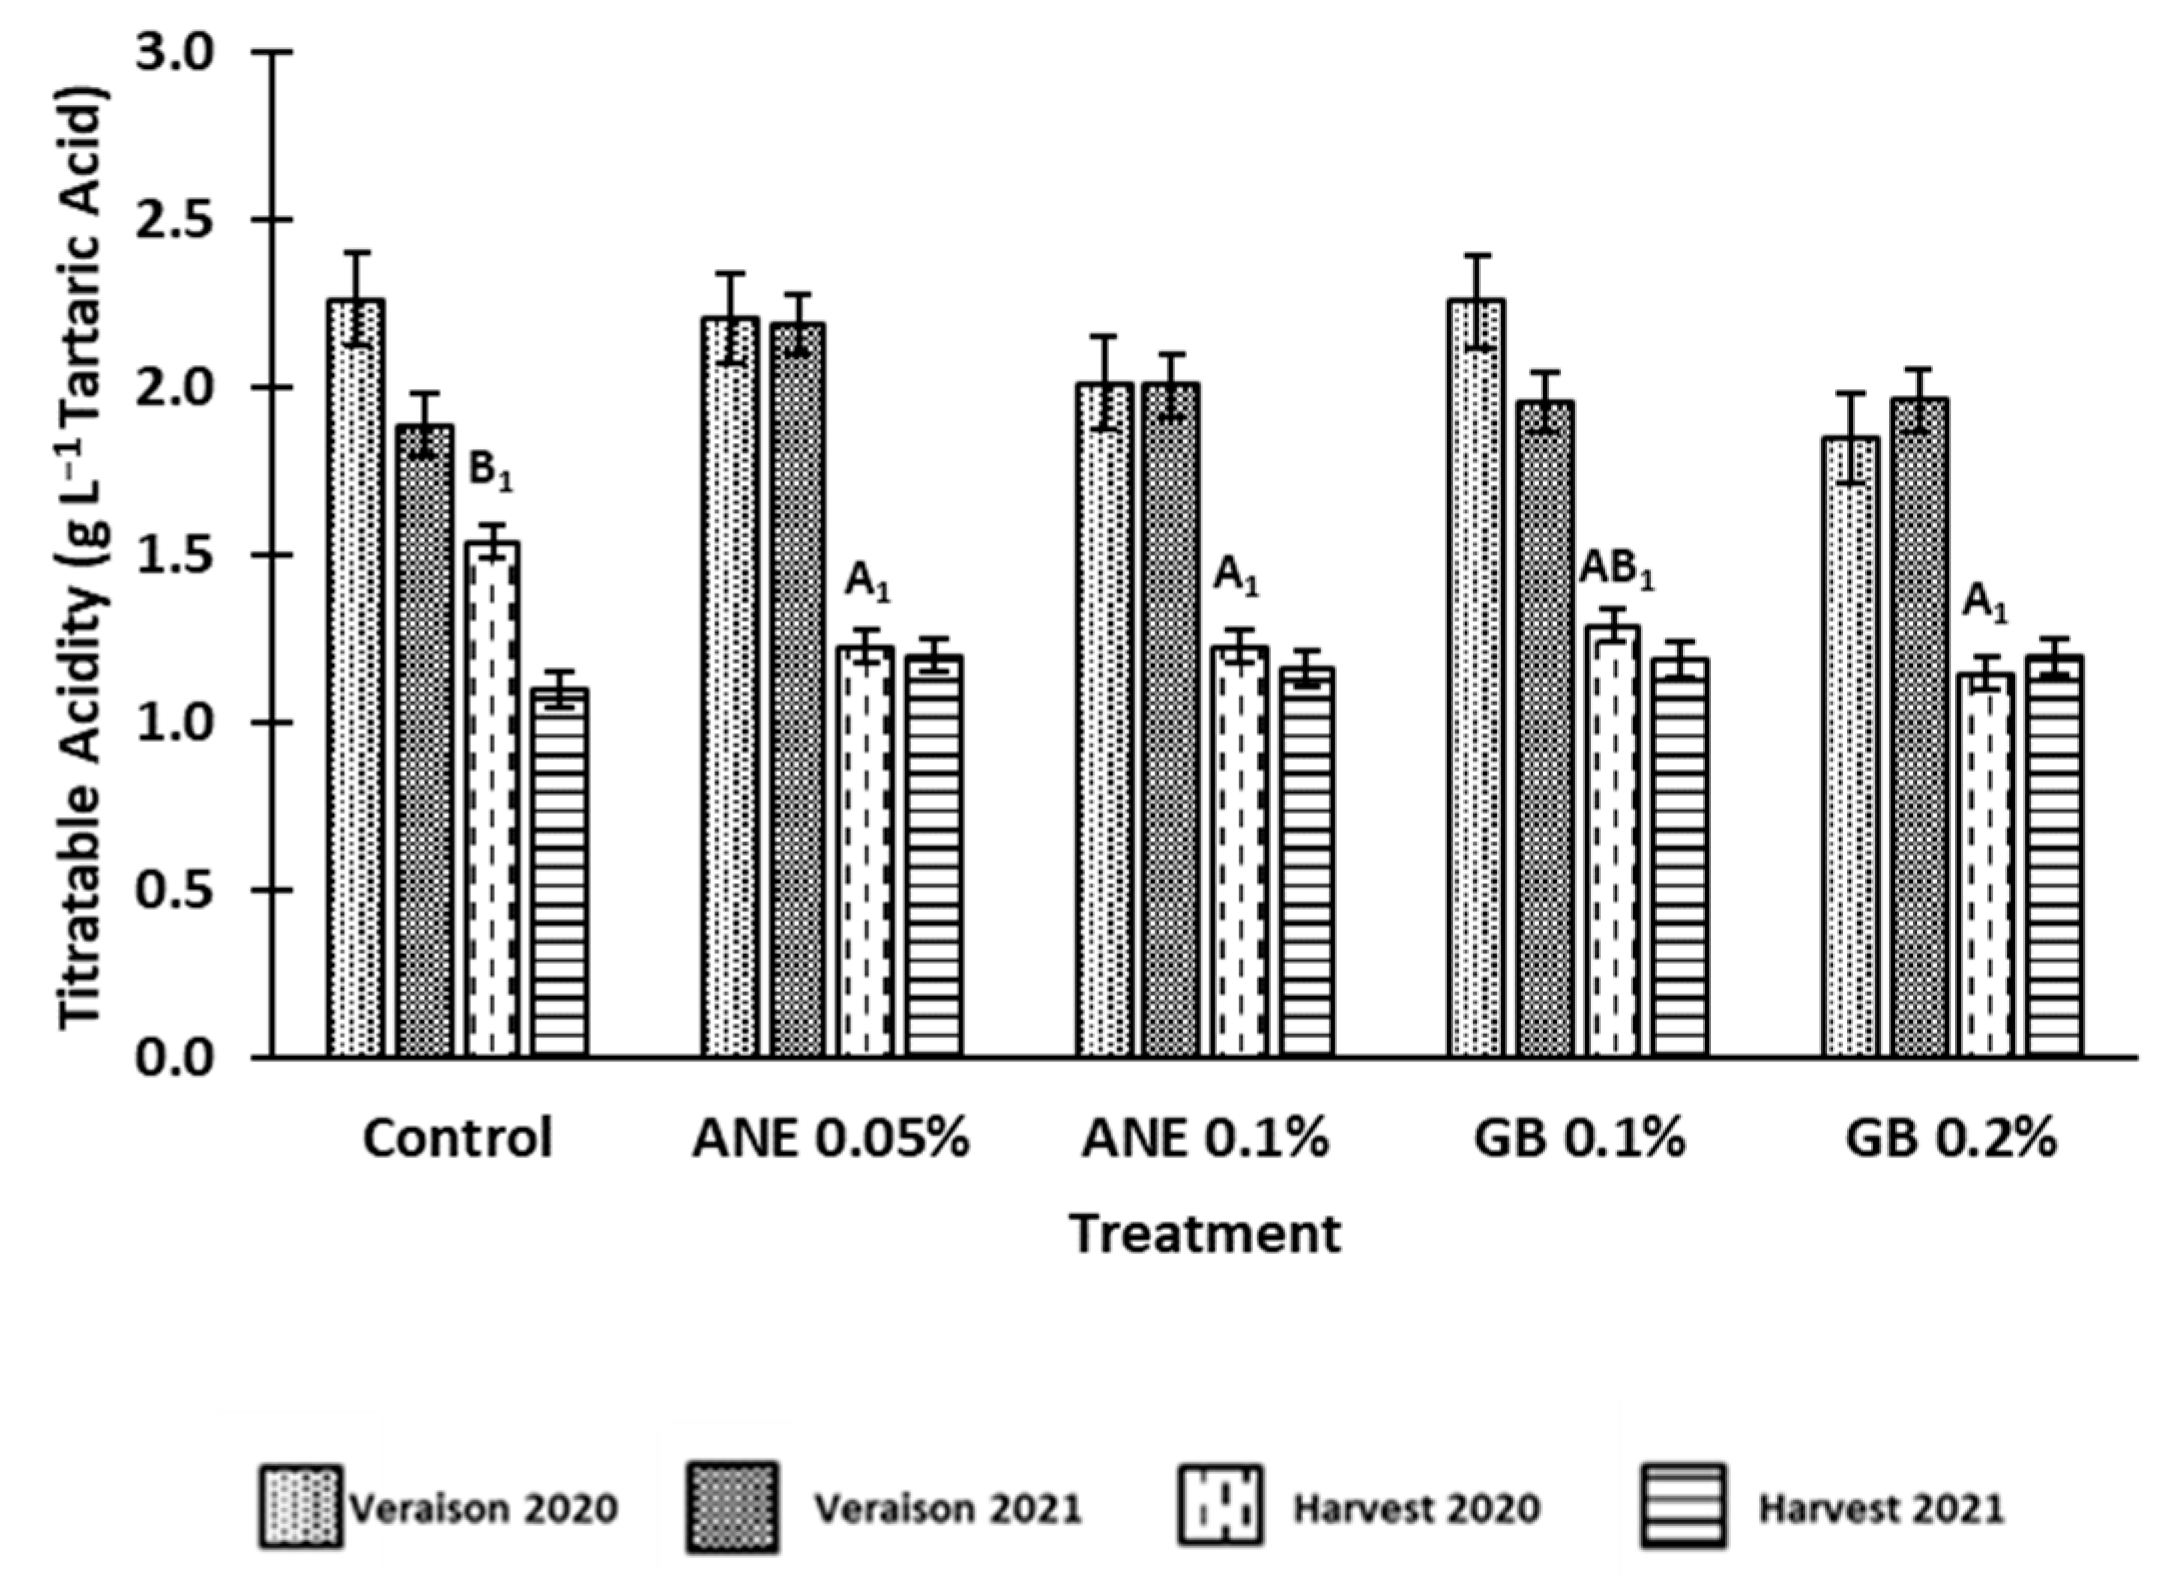
The values for the titratable acidity (TA) of berries are shown in Figure 4. As expected, there was a decrease in TA from veraison to harvest in both years and in all treatments tested. Moreover, it was verified that TA was influenced by year (P < 0.05), phenological stage (P < 0.001) and by the interaction between treatment and year (P < 0.05) (Table S1). In 2020 the values of TA were on average higher on both veraison (2.12g.L-1 Tartaric Acid) and harvest (1.28g.L-1 Tartaric Acid) when compared to 2021, in which values were on average 2.00g.L-1 Tartaric Acid at veraison and 1.17g.L-1 Tartaric Acid at harvest.
Statistically significant differences between treatments (P < 0.05) were only observed for harvest of 2020, where there was a reduction in berry TA for all treatments, but especially in berries of GB 0.2% (about 34% lower compared to the C).

3.2. Effects of biostimulants on berries bioactive compounds

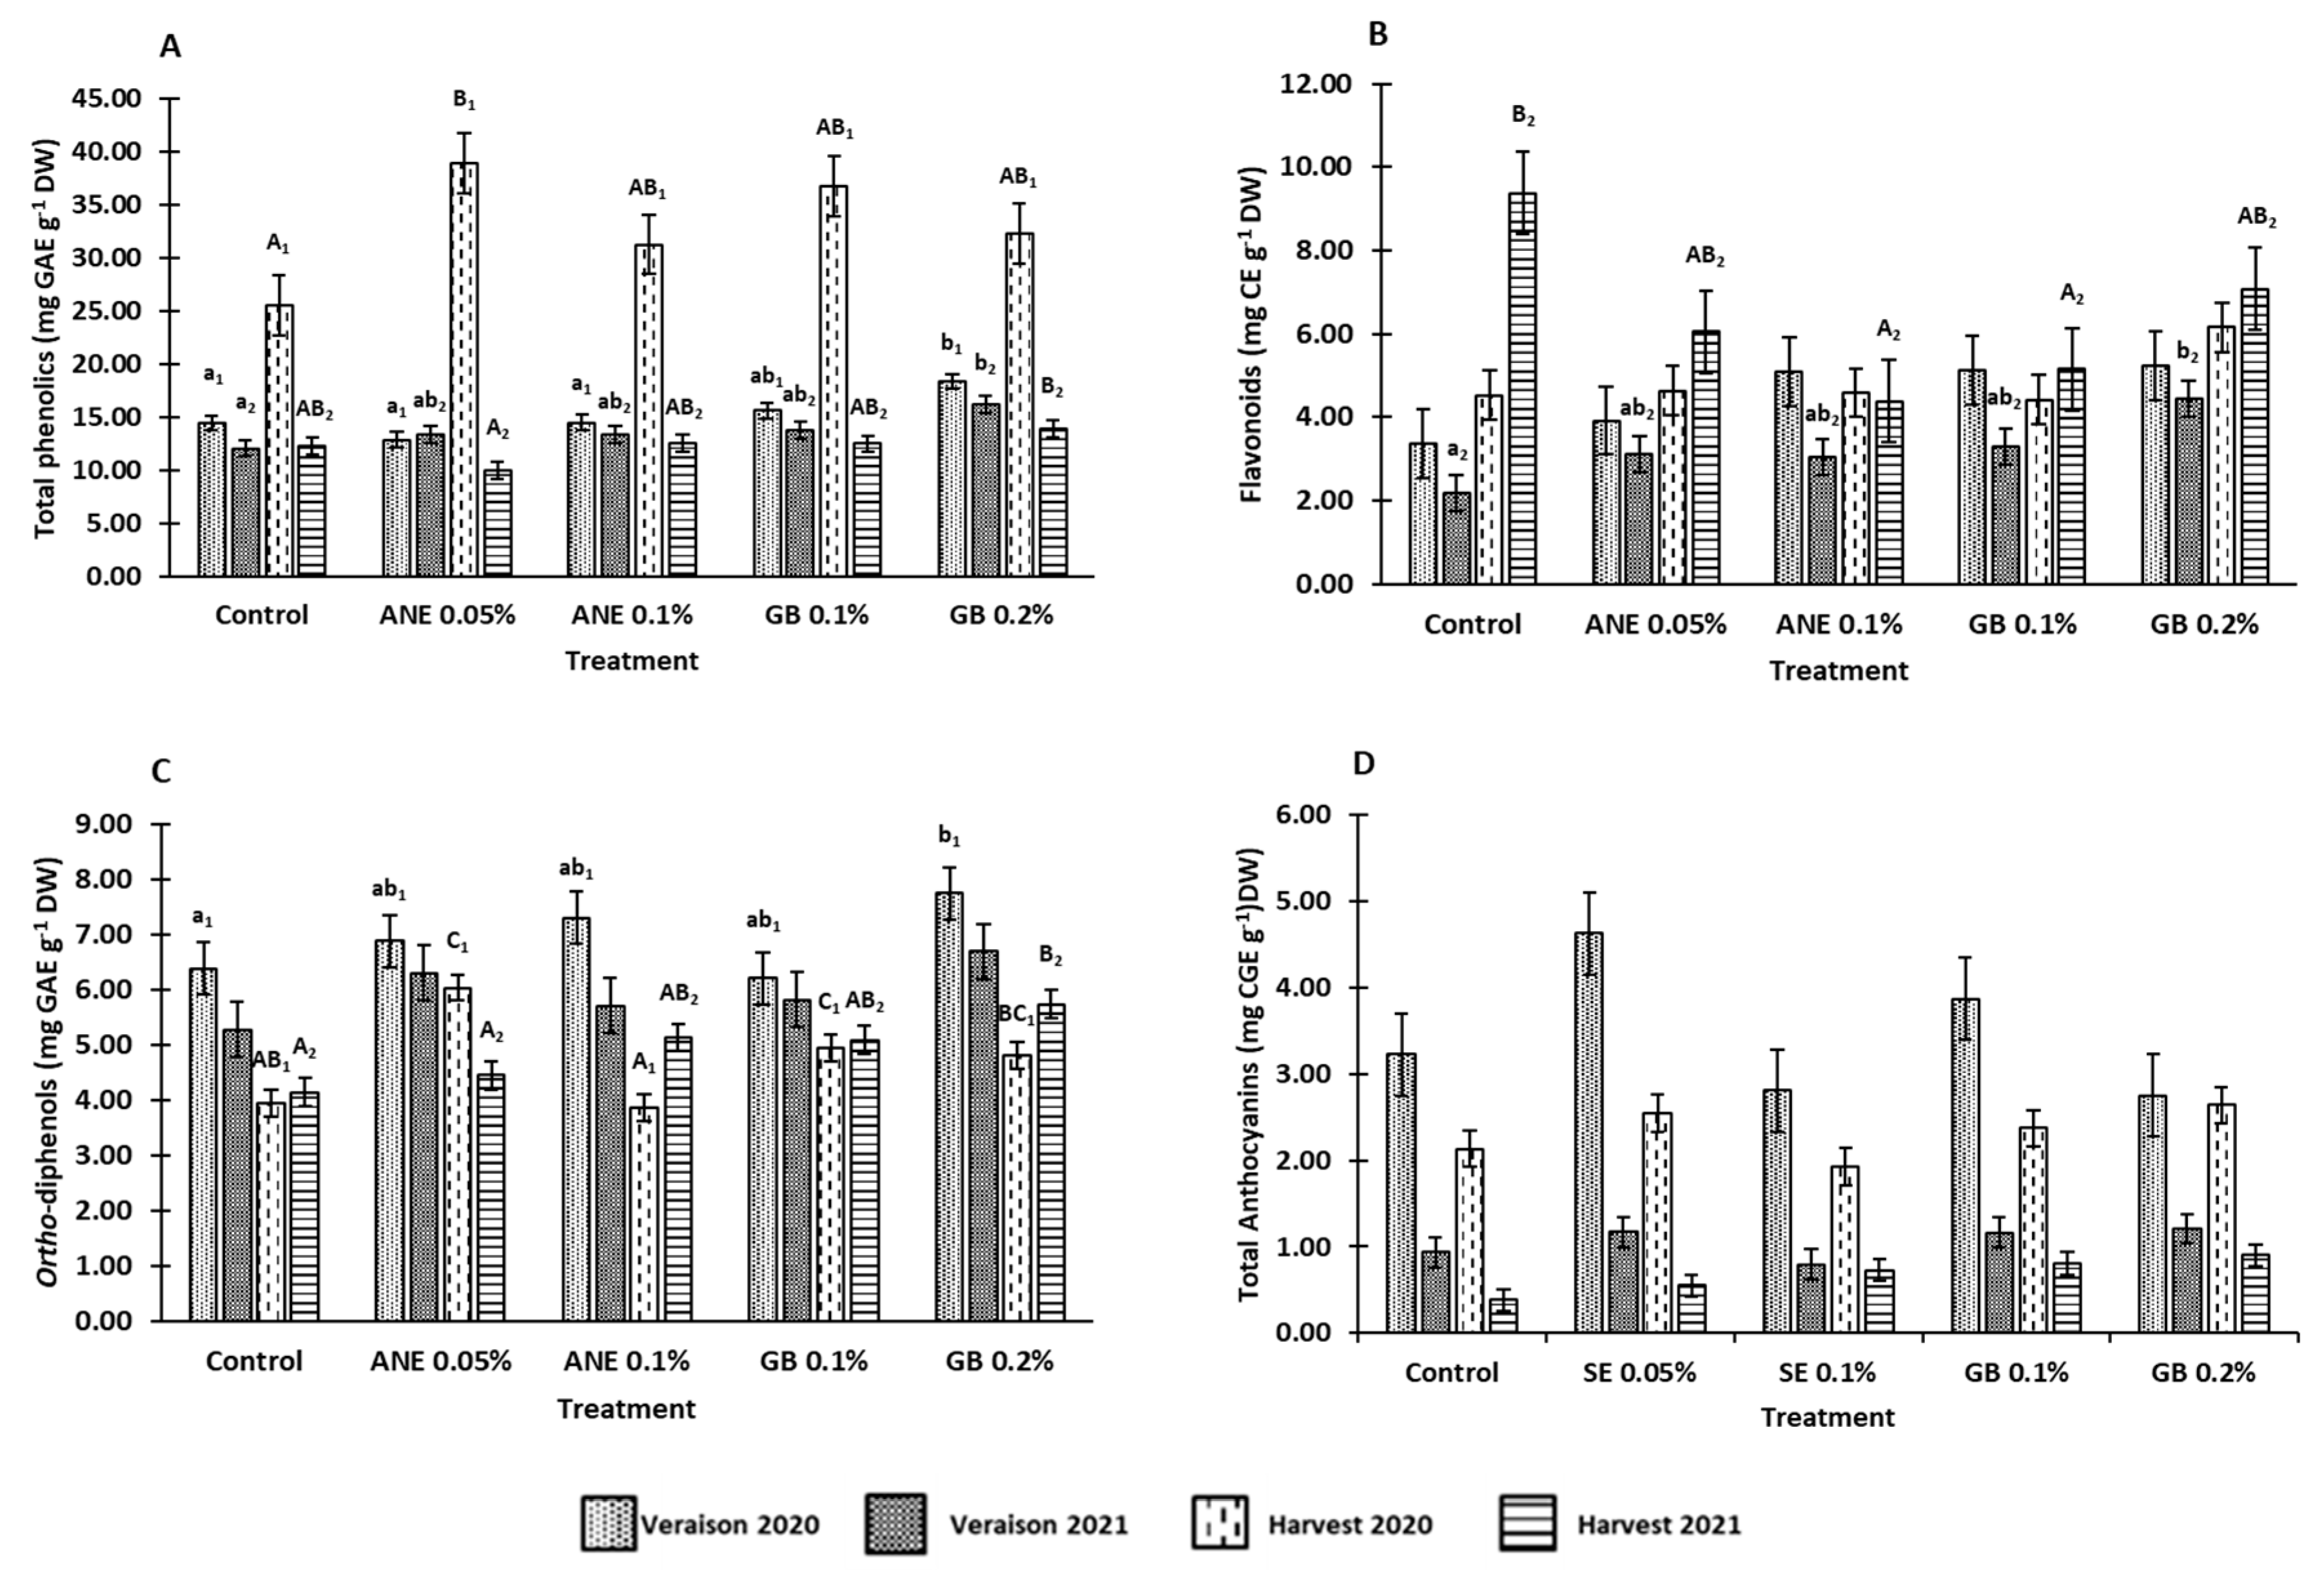
The effect of seaweed extract (ANE 0.05% and ANE 0.1%) and glycine betaine (GB 0.1% and GB 0.2%) on bioactive compound contents was assessed by determination of total phenolics, flavonoids, ortho-diphenols, and total anthocyanins (Figure 5).
It was verified that total phenolics content was affected by treatment (P < 0.001), year (P < 0.001), phenological stage (P < 0.001), interaction between treatment and year (P < 0.05), interaction between year and phenological stage (P < 0.001) and the interaction between treatment, year and phenological stage (P < 0.05) (Table S1). Of all treatments, spraying with GB showed the higher improvement to this parameter (Figure 5A). At veraison of 2020 and 2021, increases of 21% and 26% were observed in the berries treated with GB 0.2%, respectively. Also at harvest 2021, berries sprayed with GB 0.2% showed the greatest increase in total phenolics, with concentration being 12% higher than the C. At harvest 2020 treatments with ANE 0.05% revealed higher increases in the concentration of total phenolics, 34% in comparison to the C, followed by 31% increase with GB 0.1% and 21% in the spraying with GB 0.2%.
Looking at the concentration of flavonoids, was not affected by year (P > 0.05), phenological stage (P > 0.05), interaction between treatment and year (P > 0.05), interaction between year and phenological stage (P > 0.05) and the interaction between treatment, year and phenological stage (P > 0.05), but was affected by treatment (P < 0.05) (Table S1). In veraison and harvest of 2020, no significant differences (P > 0.05) were observed among treatments (Figure 5B), however, the treatment GB 0.2% produced berries with slightly higher flavonoid content compared to the other treatments. In the growing season 2021 opposite trends were observed at veraison and harvest: at veraison 2021, both concentrations of GB and ANE increased the content of flavonoids in the berries when compared to C (GB 0.2% - 51%; GB 0.1% - 33%; ANE 0.05% - 30% and ANE 0.1% - 28%), for harvest both biostimulants decreased the flavonoid concentration, with GB 0.2% (7.08mg g-1) being the treatment with values closer to C (9.37mg g-1).
The content of ortho-diphenols was affected by treatment (P < 0.001), year (P < 0.001), phenological stage (P < 0.001), interaction between year and phenological stage (P < 0.001) and interaction between treatment, year and phenological stage (P < 0.01) (Table S1). Ortho-diphenols contents increased with GB 0.2% application at veraison 2020 and 2021 (18% and 21% increase in relation to C, respectively) and at harvest 2021 (increase of 28% in relation to C) (Figure5C). For harvest 2020, the concentration of ortho-diphenols increased with ANE 0.05% (35%), GB 0.1% (20%), and GB 0.2% (18%), in comparison to C.
The content of total anthocyanins (Figure 5D) was affected by treatment (P < 0.05), year (P < 0.001), phenological stage (P < 0.001) and interaction between year and phenological stage (P < 0.01) (Supplementary Table 1). A high content of total anthocyanins was observed for the year 2020 when compared to 2021 (3.3 and 3.7 times higher at veraison and harvest, respectively). The treatment GB0.2% in general (veraison of both years and harvest 2021) increase the concentration of total anthocyanins when compared to control and the other treatments.

3.3. Influence of biostimulants on antioxidant potential

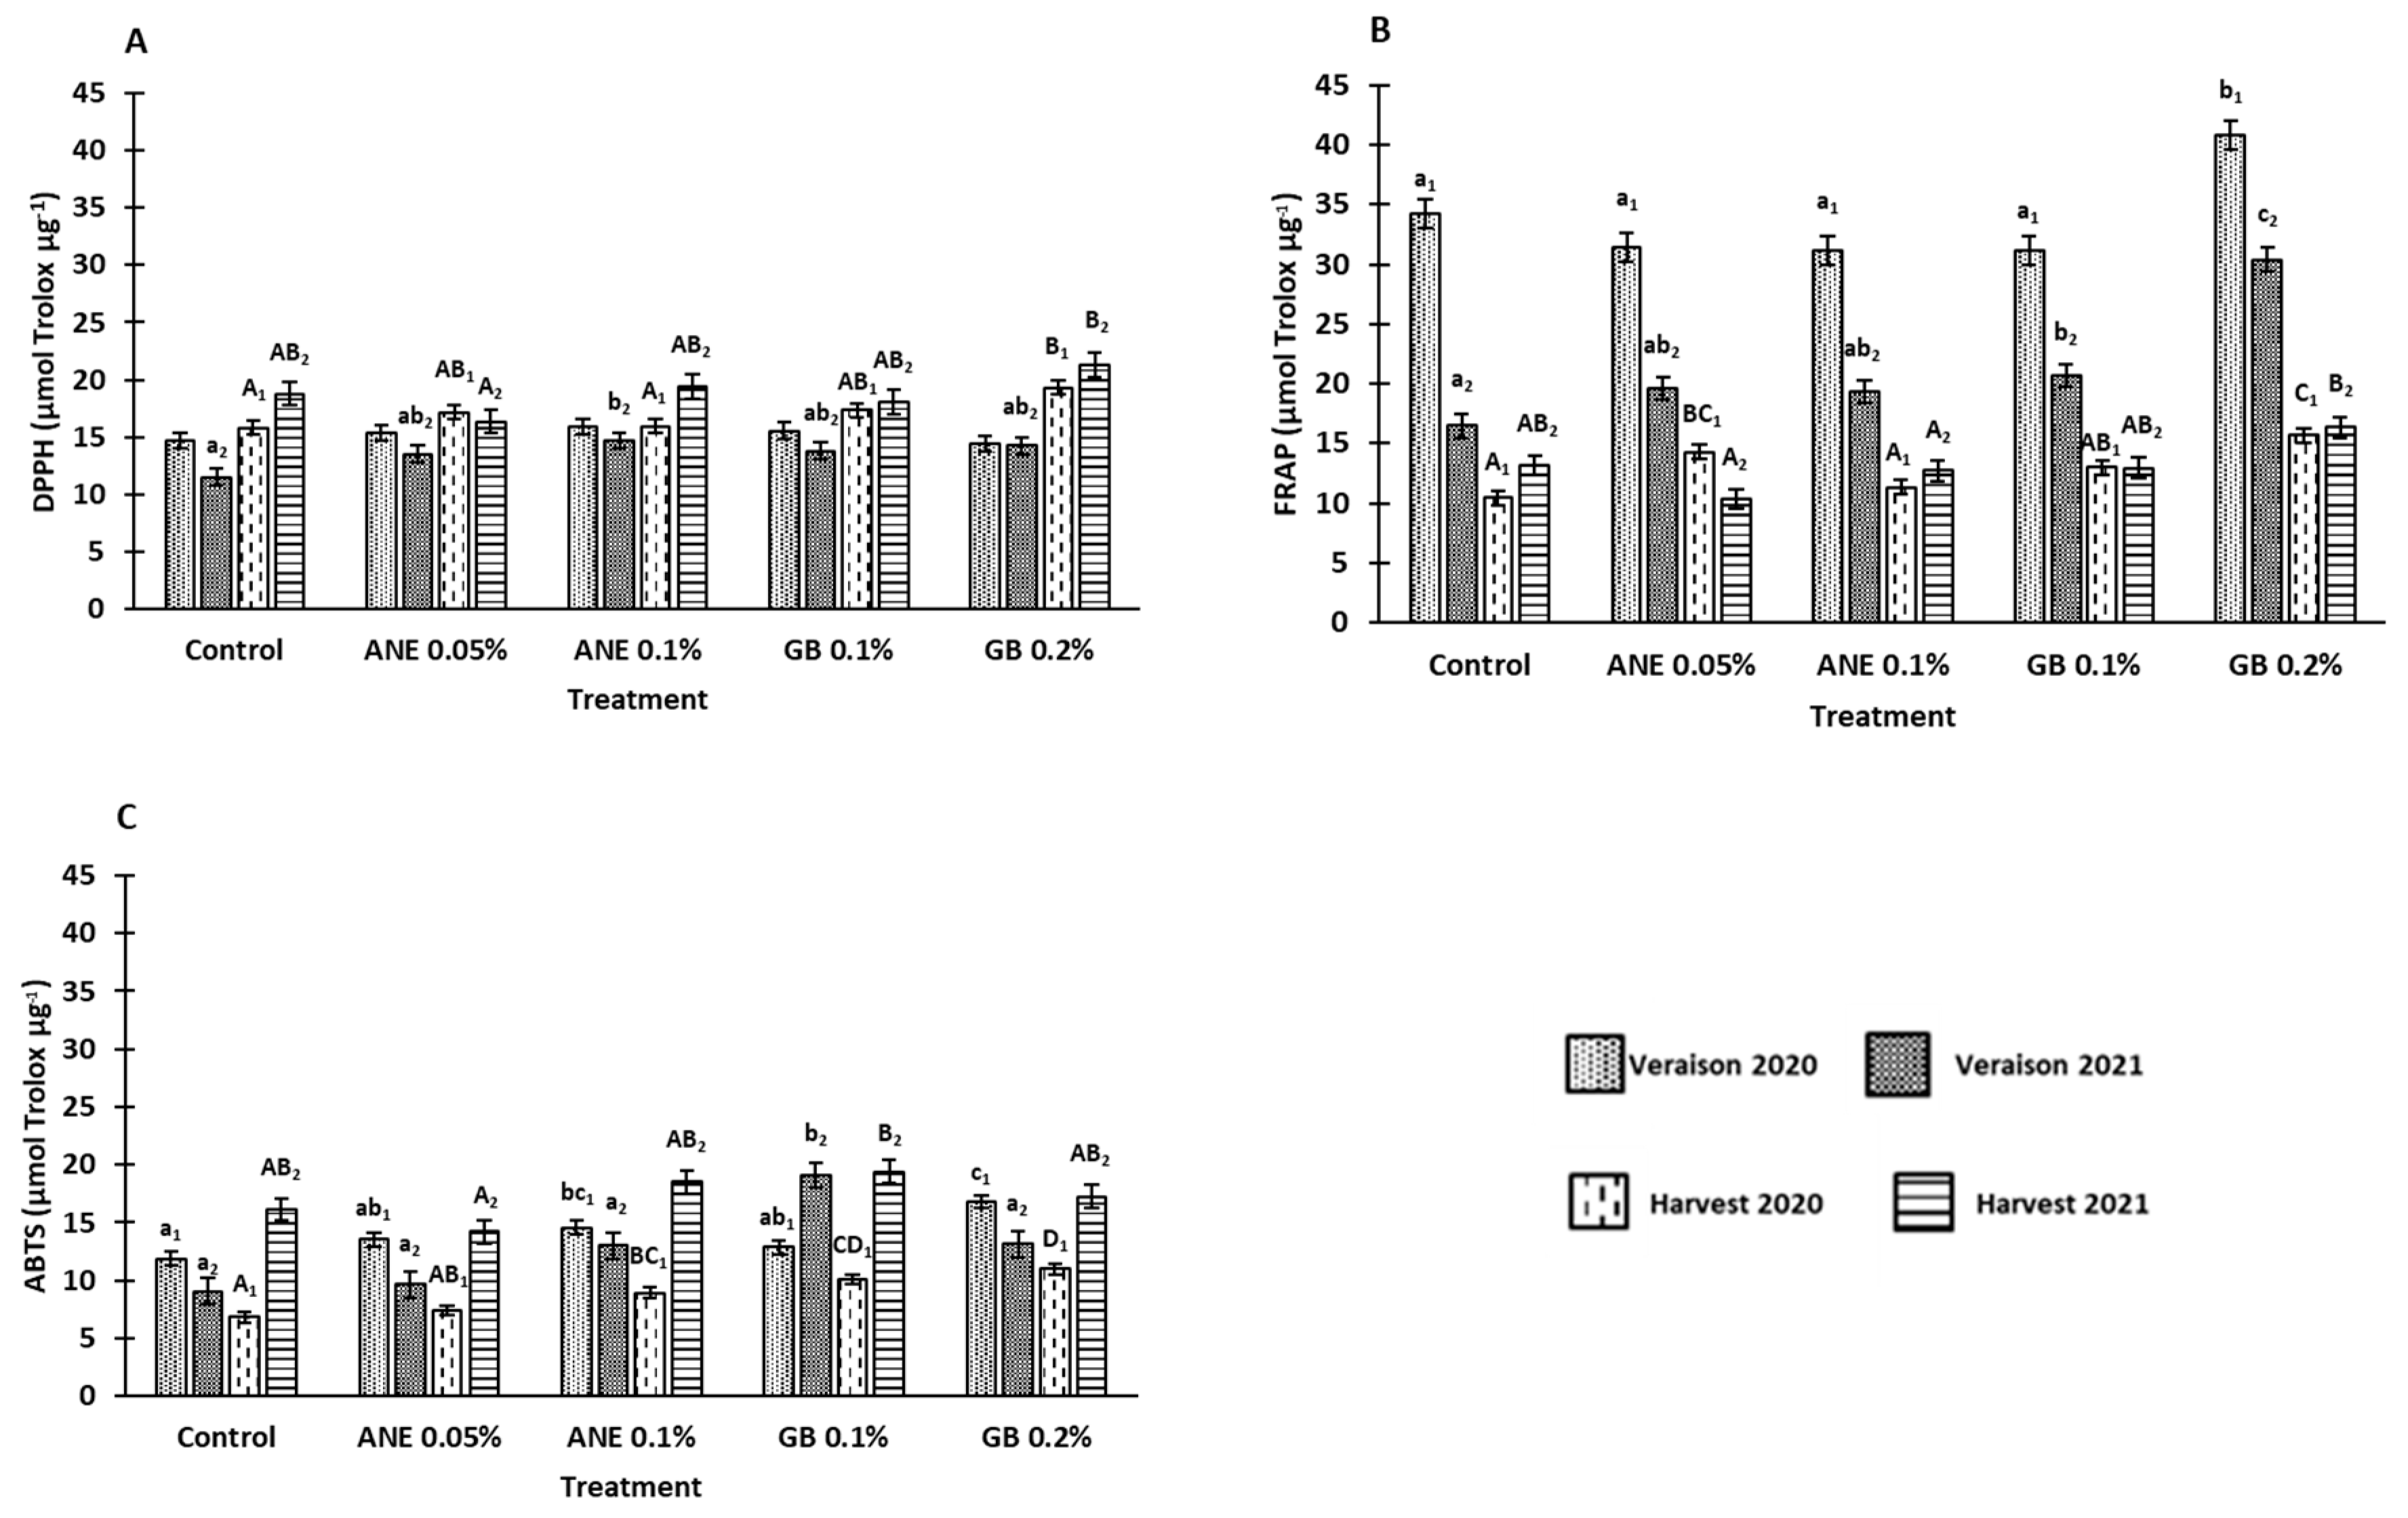
In the methods used to verify the influence of biostimulants treatments in the antioxidant activity (AA) of the berries, the DPPH method was influenced by treatment (P < 0.001), phenological stage (P < 0.001), the interaction between treatment and phenological stage (P < 0.05), and the interaction between year and phenological stage (P < 0.001) (Table S1). The FRAP and ABTS•+ methods showed differences between treatment (P < 0.001), years (P < 0.001) phenological stage (P < 0.01 for ABTS•+ and P < 0.001 for FRAP) and the interaction between year and phenological stage (P < 0.001) (Table S1). Moreover, significant differences (P< 0.05) for the berry’s AA (by FRAP, ABTS•+, and DPPH methods) were found between treatments, at veraison and harvest of both years (except in DPPH at veraison 2020). In general, berries from grapevines treated with GB presented the highest AA (Figure 6). At veraison 2020, berries of GB 0.2% showed an increase in AA (16% for FRAP and 29% for ABTS•+ methods) (Figure 6B and 6C). Furthermore, at veraison 2021, berries of GB 0.2% showed a 46% increase in the analysis by FRAP method, and berries of GB 0.1% revealed an increase of 52% by ABTS•+ method. For harvest 2020 and 2021, the treatment with GB 0.2% increased the AA (by DPPH and FRAP methods) in in comparison to C (18% and 12% for DPPH and 33% and 19% for FRAP, respectively (Figure 6A,B). Analysis of AA by ABTS•+ method on GB 0.2% treated berries also revealed an increase of 38% for harvest 2020 and an increase of 17% on GB 0.1% treatment at harvest 2021 (Figure 6C).

4. Discussion

4.1. Application of biostimulants positively affected berry quality

The foliar application of biostimulants, namely Ascophyllum nodosum extracts and glycine betaine, could be a good strategy to improve grapevine’s resilience to climate change in many wine regions around the world, especially because these products are low-cost and eco-friendly. Several studies with different species have shown that application of ANE and GB can increase the physical and chemical attributes of fruits [8,9,10,11,12,16,36,37,38]. Some studies in grapevine, report that the application of ANE leads to anthocyanins accumulation, increase phenolic, flavonols, and tannins contents [8,11,12,16]. Furthermore, the application of GB in strawberries increased plant growth and yield under deficit irrigation conditions; and in case of cv. Fortuna improved fruit firmness, chroma, and total anthocyanins; and in case of cv. Albion increased total soluble solids and ascorbic acid content [9]. In sweet cherry application of GB with calcium improved visual appearance, and color [10]. In cucumber GB enhances the growth and productivity under drought [37] and in olive increases the production [38].
Berries of grapevines sprayed with GB were bigger and heavier than those of the treatments with ANE and the C (Table 1). Similar results were found in sweet cherry (cvs. Skeena and Sweetheart), where GB sprayings increased fruit weight [10] and improved the caliber in olives [38]. On sunflower GB applications also revealed favorable effects on the weight of the achenes [36]. Adak [9] also revealed an improvement in strawberry plants treated with GB, by increasing crown diameter and fruit weight.
Color is generally considered one of the bases for quality assessment, not only due to its aesthetic role and nutrition value, but also due to the influence that grape pigments have on the wine color [39]. The parameter C* refers to color saturation; with lower C* values being associated with colored berries, while higher C* values are linked to non-colored ones [9,39]. In a previous study of Correia et al. [10], it was verified a decrease in comparison to the control in the C* of cherries treated with GB 0.1%, which was also verified in the grapes of harvest of 2020 using the same spraying concentration (Figure 2). However, GB 0.2% led to an increase in C* compared to the control at harvest of both years. Similar results were previously found in strawberry (cv. Fortuna) using different concentrations of GB [9]. Nonetheless, this increase in C* could also be associated to the fact of these berries treated with GB0.2% presented a higher maturation index (MI) (Figure 3). The optimal values of MI range from 200 to 270 at harvest [22]. However, in the present study, the MI values at harvest were above this range, averaging 300 in 2020 and 295 in 2021 (Figure 3). The MI is significantly influenced by the weather conditions of the growth year, as verified by Rätsep et al. [40] in grapevine cv. Zilga. In fact, we verified that, in this work, the MI was affected by the year (P < 0.01), the phenological stage (P < 0.001) and by the interaction between year and phenological stage (P < 0.001) (Table S1). In the Douro Superior region, the year of 2020 was considered hot and dry. In particular, the month of July was extremely hot and dry (Figure 1), being regarded as the hottest since 1931, according to IPMA, which contributed to the occurrence of grapevine sunburn [41]. On the other hand, 2021 was perceived as a normal and dry year [42] (Figure 1). This phenomenon may explain why the berries of 2020 berries had a higher MI. Although there were no significant differences at the statistical level, it was found an increase in MI at harvest 2020 and veraison of both years when GB 0.2% was applied in comparison to control treatment (Figure 3). Similar effects of GB spraying in the MI have been previously observed by Metwaly et al. [37] in cucumber.
It is known that acidity is influenced by radiation, temperature, and water availability [43]. This might explain why we observed lower acidity in 2021 (Figure 4), considering it was a year with higher temperature and lower precipitation levels (Figure 1).

4.2. Application of biostimulants positively affected berry bioactive compounds and antioxidant activity

It is known that climate conditions are the driving factor influencing grape and wine quality [44,45]. Temperatures are increasing worldwide, and most regions are being increasingly exposed to prolonged water deficit periods [45]. In fact, during the veraison of 2020, the precipitation levels were lower than in veraison 2021 (Figure 1). The average temperature in July of 2020 was 28.8°C [41], while in 2021 it was 24.7°C [42]. The high temperatures along with the low precipitation values influenced the synthesis of bioactive compounds [43,45], leading to the increase verified in the veraison of 2020. This is quite noticeable in the total anthocyanins content in veraison 2020, which was 3.3 times higher than in 2021 (Figure 5D). Regarding the total phenolics, flavonoids, and ortho-diphenols in veraison of 2020, the contents were in average 1.2 times higher than in veraison 2021 (Figure 5). Moreover, a higher total phenolics content was observed in berries sprayed with GB compared with the other treatments and control. These results were consistent with previous studies, namely those of Awad et al. [46] with postharvest application of GB in table grapes cv. El-Bayadi; Khadouri et al. [14] with cowpea under water stress; Shafiq et al. [47] with maize under water stress; and Safwat et al. [48] in basil under salt stress. An opposite effect was verified for ANE 0.05% at veraison 2020 and harvest 2021, where a lower total phenolic content was observed. This same decrease in total phenolics was observed in cv. Merlot after foliar application of Ascophyllum nodosum extract at the lowest tested concentration [12]. At harvest 2020, ANE seemed to improve the total phenolics content, being in agreement with the studies of Frioni et al. [8] in cv. Sangiovese and Cabo et al. [13] in hazelnut. In this study, it was observed an increase in ortho-diphenols content in berries of grapevines with foliar spraying of GB and ANE. Similarly, Cabo et al. [13] also verified an increase in the concentration of ortho-diphenols in hazelnuts after foliar application of ANE. A similar trend for the concentration of total phenols and ortho-diphenols was observed at harvest of 2020, where the treatments with ANE 0.05% revealed increases in the concentration of both in comparison to the C, followed an increase with GB 0.1% and in the spraying with GB 0.2%.
In the case of flavonoids, both biostimulants appeared to increase its concentration at veraison 2021, which is in line with other studies, namely in postharvest treatment of cv. El-Bayadi table grapes with GB [46], in sweet cherry with foliar application of GB [7], in cv. Sangiovese sprayed with ANE [11], and in hazelnuts sprayed with ANE [49].
In general, the foliar application of GB in grapevine tends to increase the concentration of bioactive compounds (total phenolics, flavonoids, and ortho-diphenols), mainly at the veraison stage, with the highest concentration (GB 0.2%) being the most promising for this grape cultivar Touriga Franca.
In similarity to the results obtained for the bioactive compounds, antioxidant activity was also observed to be increased in the berries of grapevines subjected to GB foliar applications (Figure 6). In fact, a positive correlation between bioactive compounds and antioxidant activity was observed in this study, with total phenolics being the parameter with a better correlation with AA (Table S2). Indeed, at veraison 2020, DPPH values were positively correlated with total phenolics (R2 = 0.630; P < 0.01) and flavonoids (R2 = 0.334; P < 0.05); FRAP values were positively correlated with total phenolics (R2 = 0.646; P < 0.01), flavonoids (R2 = 0.374; P < 0.05), and ortho-diphenols (R2 = 0.650; P < 0.01); and ABTS•+ values were positively correlated with total anthocyanins (R2 = 0.395; P < 0.01). At veraison 2021, positive correlations were also observed between DPPH values and total phenolics (R2 = 0.575; P < 0.01); and between FRAP values and total phenolics (R2 = 0.749; P < 0.01) and ortho-diphenols (R2 = 0.475; P < 0.01). At harvest 2020, DPPH and FRAP values had significant (P < 0.01) positive correlations with ortho-diphenols and total anthocyanins. At harvest 2021, FRAP values showed a positive correlation (P < 0.01) with total phenolics and ortho-diphenols, while DPPH and ABTS•+ values showed a statistically significant (P < 0.05) positive correlation with ortho-diphenols and total phenolics, respectively.

5. Conclusion

In this study, the foliar application of ANE and GB improved the physiological and biochemical performance of cv. Touriga Franca exposed to the summer stress in the Douro Superior. The differences in agroclimatic conditions between the years, along with the analysis of berry parameters of this study, further corroborated that the weather has a key role when growing high quality grapes. The biostimulants ANE and GB sprayings have also shown to be a promising strategy in the mitigating of the effects of summer stress in the grapevine cv. Touriga Franca in this region, highlighting GB which led to higher contents of bioactive compounds (total phenolics, flavonoids, and ortho-diphenols.) However, further studies with different varieties and in different viticultural regions are needed, in order to see if the effects observed in this study remain similar under different climate conditions, and between different varieties.

Supplementary Materials

The following supporting information can be downloaded at the website of this paper posted on Preprints.org.

Author Contributions

Conceptualization: E.M., I.C. (Isabel Cortez), I.C. (Isaura Castro), and B.G. Investigation: E.M., M.B., S.P., S.C., H.F., and F.A. Writing—original draft: E.M. Writing—review and editing: E.M., M.B., S.P., S.C., H.F., I.C. (Isabel Cortez), I.C. (Isaura Castro), and B.G. Supervision: I.C. (Isabel Cortez), I.C. (Isaura Castro), and B.G. All authors have read and agreed to the published version of the manuscript.

Funding

This research was funded by the European Regional Development Fund through the INTERREG Atlantic Area Program, under the project NASPA—Natural fungicides against air & soil borne pathogens in the Atlantic Area (EAPA-451/2016).

Acknowledgments

The author Eliana Monteiro acknowledges the financial support provided by the Portuguese Foundation for Science and Technology (FCT) (UI/BD/150730/2020), under the Doctoral Program “Agricultural Production Chains—from fork to farm” (PD/00122/2012). The authors acknowledge the support of National Funds by FCT, under the project UIDB/04033/2020.

Conflicts of Interest

The authors declare no conflict of interest.

References

  1. OIV State of the world vine and wine sector 2021. Int Organ Vine Wine Intergov Organ 2022, 1–19.
  2. Fraga, H.; Malheiro, A.C.; Moutinho-Pereira, J.; Santos, J.A. An overview of climate change impacts on European viticulture. Food Energy Secur 2012, 1, 94–110. [Google Scholar] [CrossRef]
  3. Jones, G. Uma Avaliação do clima para a Região Demarcada do Douro : Uma análise das condições climáticas do passado, presente e futuro para a produção de vinho. ADVID, Portugal 2013 pp 5-80.
  4. Gutiérrez-Gamboa, G.; Zheng, W.; Martínez de Toda, F. Current viticultural techniques to mitigate the effects of global warming on grape and wine quality: A comprehensive review. Food Res Int 2021, 139. [Google Scholar] [CrossRef] [PubMed]
  5. Monteiro, E.; Gonçalves, B.; Cortez, I.; Castro, I. The role of biostimulants as alleviators of biotic and abiotic stresses in grapevine: A review. Plants 2022, 11, 396. [Google Scholar] [CrossRef] [PubMed]
  6. Jalil, O.T.J.; Sabır, A. Changes in leaf and shoot water statutes of grapevines in response to contrasting water availability and glycine betaine pulverization. Int J Agric Environ Food Sci 2017, 1, 20–26. [Google Scholar] [CrossRef]
  7. Telesiński, A.; Mikiciuk, G.; Mikiciuk, M.; Stręk, M.; Płatkowski, M.; Statkiewicz, M. Effect of preharvest use of anti-cracking preparations on changes in selected parameters of sweet cherry fruits during frozen storage. Folia Pomeranae Univ Technol Stetin Agric Aliment Piscaria Zootech 2017, 330, 179–186. [Google Scholar] [CrossRef]
  8. 8. Frioni T, Sabbatini P, Tombesi S, Norrie J, Poni S, Gatti M, et al. Effects of a biostimulant derived from the brown seaweed Ascophyllum nodosum on ripening dynamics and fruit quality of grapevines. Sci Hortic. [CrossRef]
  9. Adak, N. Effects of glycine betaine concentrations on the agronomic characteristics of strawberry grown under deficit irrigation conditions. Appl Ecol Environ Res 2019, 17, 3753–3767. [Google Scholar] [CrossRef]
  10. 10. Correia S, Queirós F, Ribeiro C, Vilela A, Aires A, Barros AI, et al. Effects of calcium and growth regulators on sweet cherry (Prunus avium L.) quality and sensory attributes at harvest. Sci Hortic. [CrossRef]
  11. 11. Salvi L, Brunetti C, Cataldo E, Niccolai A, Centritto M, Ferrini F, et al. Effects of Ascophyllum nodosum extract on Vitis vinifera: Consequences on plant physiology, grape quality and secondary metabolism. Plant Physiol Biochem. [CrossRef]
  12. Taskos, D.; Stamatiadis, S.; Yvin, J.C.; Jamois, F. Effects of an Ascophyllum nodosum (L.) Le Jol. extract on grapevine yield and berry composition of a Merlot vineyard. Sci Hortic, 2: 250. [CrossRef]
  13. Cabo S, Aires A, Carvalho R, Vilela A, Pascual-Seva N, Silva AP, et al. Kaolin, Ascophyllum nodosum and salicylic acid mitigate effects of summer stress improving hazelnut quality. J Sci Food Agric 2020, 101, 459–475. [Google Scholar] [CrossRef]
  14. Khadouri, H.K.; Kandhan, K.; Salem, M.A. Effects of glycine betaine on plant growth and performance of Medicago sativa and Vigna unguiculata under water deficit conditions. J Phytol. [CrossRef]
  15. Tisarum, R.; Theerawitaya, C.; Samphumphuang, T.; Singh, H.P.; Cha-um, S. Foliar application of glycine betaine regulates soluble sugars and modulates physiological adaptations in sweet potato (Ipomoea batatas) under water deficit. Protoplasma, 2020; 257, 197–211. [Google Scholar] [CrossRef]
  16. Frioni T, Tombesi S, Quaglia M, Calderini O, Moretti C, Poni S, et al. Metabolic and transcriptional changes associated with the use of Ascophyllum nodosum extracts as tools to improve the quality of wine grapes (Vitis vinifera cv. Sangiovese) and their tolerance to biotic stress. J Sci Food Agric 2019, 99, 6350–6363. [Google Scholar] [CrossRef]
  17. Baltazar, M.; Correia, S.; Guinan, K.J.; Sujeeth, N.; Bragança, R.; Gonçalves, B. Recent advances in the molecular effects of biostimulants in plants: An overview. Biomolecules. [CrossRef]
  18. 18. Dutta T, Neelapu NRR, Wani SH, Challa S. Compatible solute engineering of crop plants for improved tolerance toward abiotic stresses. 2018. [CrossRef]
  19. Hussain Wani, S.; Brajendra Singh, N.; Haribhushan, A.; Iqbal Mir, J. Compatible solute engineering in plants for abiotic stress tolerance - role of glycine betaine. Curr Genomics 2013, 14, 157–165. [Google Scholar] [CrossRef]
  20. 20. IVV. Vinhos e Aguardentes de Portugal, 2: Lisboa, 2021.
  21. Lorenz, D.H.; Eichhorn, K.W.; Bleiholder, H.; Klose, R.; Meier, U.; Weber, E. Growth stages of the grapevine: phenological growth stages of the grapevine (Vitis vinifera L. ssp. vinifera)—Codes and descriptions according to the extended BBCH scale. Aust J Grape Wine Res 1995, 1, 100–103. [Google Scholar] [CrossRef]
  22. Coombe, B.G.; Dundon, R.J.; Short, A.W.S. Indices of sugar—acidity as ripeness criteria for winegrapes. J Sci Food Agric 1980, 31, 495–502. [Google Scholar] [CrossRef]
  23. Singleton, V.; Rossi, J. Colorometry of total phenolics with phosphomolybdic-phosphotungstic acid reagents. Am J Enol, 1: (16).
  24. Dewanto, V.; Wu, X.; Adom, K.K.; Liu, R.H. Thermal processing enhances the nutritional value of tomatoes by increasing total antioxidant activity. J Agric Food Chem, 3010. [Google Scholar]
  25. Leal, C.; Costa, C.M.; Barros, A.I.R.N.A.; Gouvinhas, I. Assessing the relationship between the phenolic content and elemental composition of grape (Vitis vinifera L. ) Stems. Waste and Biomass Valorization 2021, 12, 1313–1325. [Google Scholar] [CrossRef]
  26. Gouvinhas, I.; De Almeida, J.M.M.M.; Carvalho, T.; Machado, N.; Barros, A.I.R.N.A. Discrimination and characterisation of extra virgin olive oils from three cultivars in different maturation stages using Fourier transform infrared spectroscopy in tandem with chemometrics. Food Chem. [CrossRef]
  27. Lee J, Durst RW, Wrolstad RE, Eisele T, Giusti MM, Haché J, et al. Determination of total monomeric anthocyanin pigment content of fruit juices, beverages, natural colorants, and wines by the pH differential method: collaborative study. J AOAC Int 2005, 88, 1269–1278. [Google Scholar] [CrossRef]
  28. Meng, J.F.; Fang, Y.L.; Qin, M.Y.; Zhuang, X.F.; Zhang, Z.W. Varietal differences among the phenolic profiles and antioxidant properties of four cultivars of spine grape (Vitis davidii Foex) in Chongyi County (China). Food Chem 2012, 134, 2049–2056. [Google Scholar] [CrossRef]
  29. Ali Shehat, W.; Sohail Akh, M.; Alam, T. Extraction and estimation of anthocyanin content and antioxidant activity of some common fruits. Trends Appl Sci Res 2020, 15, 179–186. [Google Scholar]
  30. Re, R.; Pellegrini, N.; Proteggente, A.; Pannala, A.; Yang, M.; Rice-Evans, C. Antioxidant activity applying an improved ABTS radical cation decolorization assay. Free Radic Biol Med, 1231. [Google Scholar] [CrossRef]
  31. Stratil, P.; Klejdus, B.; Kubáň, V. Determination of total content of phenolic compounds and their antioxidant activity in vegetables evaluation of spectrophotometric methods. J Agric Food Chem 2006, 54, 607–616. [Google Scholar] [CrossRef]
  32. Brand-Williams, W.; Cuvelier, M.E.; Berset, C. Use of a free radical method to evaluate antioxidant activity. Lebnsm Wiss Technol.
  33. Sánchez-Moreno, C.; Larrauri, J.A.; Saura-Calixto, F. A procedure to measure the antiradical efficiency of polyphenols. J Sci Food Agric 1998, 76, 270–276. [Google Scholar] [CrossRef]
  34. Siddhraju, P.; Becker, K. Antioxidant properties of various solvents extracts of total phenolic constituents from three different agroclimatic origins of drumstick tree (Moringa oleifera Lam) leaves. J Agric Food Chem.
  35. Benzie, I.F.F.; Strain, J.J. The Ferric Reducing Ability of Plasma (FRAP) as a measure of “antioxidant power”: The FRAP assay. Anal Biochem 1996, 239, 70–76. [Google Scholar] [CrossRef]
  36. Iqbal, N.; Ashraf, M.Y.; Ashraf, M. Influence of water stress and exogenous glycine betaine on sunflower achene weight and oil percentage. Int J Environ Sci Technol 2005, 2, 155–160. [Google Scholar] [CrossRef]
  37. Metwaly, E.S.E.; Al-Yasi, H.M.; Ali, E.F.; Farouk, H.A.; Farouk, S. Deteriorating harmful effects of drought in cucumber by spraying glycinebetaine. Agriculture 2022, 12, 2166. [Google Scholar] [CrossRef]
  38. Taskin, S.; Ertan, E. Exogenous applications of kaolin and glycine betaine increased the yield and quality of olive fruit and olive oil. Erwerbs-Obstbau. [CrossRef]
  39. Campbell J, Sarkhosh A, Habibi F, Gajjar P, Ismail A, Tsolova V, et al. Evaluation of biochemical juice attributes and color-related traits in muscadine grape population. Foods 2021, 10, 1101. [Google Scholar] [CrossRef] [PubMed]
  40. Rätsep, R.; Karp, K.; Vool, E. Yield maturity parameters of hybrid grapevine (Vitis sp.) cultivar “Zilga.” In: Research for Rural Development. 2014. page 44–50.
  41. 41. ADVID. Boletim Ano Vitícola 2020, w: Real: 2020. Available from, 2020.
  42. 42. ADVID. Boletim final do ano vitícola 2021, w: Real: 2021. Available from, 2021.
  43. Borghezan, M. Formation and ripening of grape and effects on the wines: Review. Ciência e Técnica Vitivinícola 2017, 32, 126–141. [Google Scholar] [CrossRef]
  44. Jones, G.V.; White, M.A.; Cooper, O.R.; Storchmann, K. Climate change and global wine quality. Clim Change 2005, 73, 319–343. [Google Scholar] [CrossRef]
  45. van Leeuwen C, Darriet P. The impact of climate change on viticulture and wine quality. J Wine Econ 2016, 11, 150–167. [Google Scholar] [CrossRef]
  46. Awad, M.A.; Al-Qurashi, A.D.; Mohamed, S.A. Postharvest trans -resveratrol and glycine betaine treatments affect quality, antioxidant capacity, antioxidant compounds and enzymes activities of ‘El-Bayadi’ table grapes after storage and shelf life. Sci Hortic, 3: 2015, 197, 2015. [Google Scholar] [CrossRef]
  47. Shafiq, S.; Akram, N.A.; Ashraf, M.; García-Caparrós, P.; Ali, O.M.; Latef, A.A.H.A. Influence of glycine betaine (natural and synthetic) on growth, metabolism and yield production of drought-stressed maize (Zea mays L.) plants. Plants 2021, 10, 2540. [Google Scholar] [CrossRef]
  48. Safwat, G.; Abdel Salam, H.S. The effect of exogenous proline and glycine betaine on phyto-biochemical responses of salt-stressed basil plants. Egypt J Bot 2022, 0, 0–0. [Google Scholar] [CrossRef]
  49. Cabo S, Morais MC, Aires A, Carvalho R, Pascual-Seva N, Silva AP, et al. Kaolin and seaweed-based extracts can be used as middle and long-term strategy to mitigate negative effects of climate change in physiological performance of hazelnut tree. J Agron Crop Sci 2020, 206, 28–42. [CrossRef]
Figure 1. Average values of temperature (A) and precipitation (B) in the experimental vineyard during 2020 and 2021.
Preprints 82522 g001aPreprints 82522 g001b
Figure 2. Chroma (C*) of berries of cv. Touriga Franca, with different treatments at veraison and harvest of 2020 and 2021. Values are means ± SE; different letters (lowercase – veraison; uppercase – harvest; 1 – Year 2020, 2 - Year 2021) mean significant differences between treatments within each phenological stage (P < 0.05, Tukey test). ANE – seaweed extract; GB – glycine betaine.
Preprints 82522 g002
Figure 3. Maturity index (TSS*pH2) of berries of cv. Touriga Franca, with different treatments at veraison and harvest of 2020 and 2021. Values are means ± SE; no letters mean no significant differences between treatments within each phenological stage of each year (P < 0.05, Tukey test). ANE – seaweed extract; GB – glycine betaine.
Preprints 82522 g003
Figure 4. Titratable acidity (TA) of berries of cv. Touriga Franca, with different treatments at veraison and harvest of 2020 and 2021. Values are means ± SE; different letters (lowercase – veraison; uppercase – harvest; 1 – Year 2020, 2 - Year 2021) mean significant differences between treatments within each phenological stage of each year (P < 0.05, Tukey test), no letters mean no significant differences. ANE – seaweed extract; GB – glycine betaine.
Preprints 82522 g004
Figure 5. Variation on bioactive compound contents: total phenolics (A), flavonoids (B), ortho-diphenols (C), and total anthocyanins (D), in berries with different treatments in two consecutive years (2020 and 2021). Values are means ± SE; different letters (lowercase – veraison; uppercase – harvest; 1 – Year 2020, 2 - Year 2021) mean significant differences between treatments within each phenological stage of each year (P < 0.05, Tukey test), no letters mean no significant differences. ANE – seaweed extract; GB – glycine betaine.
Preprints 82522 g005
Figure 6. Antioxidant activity (AA): DPPH radical-scavenging activity (A), FRAP assay (B), and ABTS•+ radical-scavenging activity (C) in berries of cv. Touriga Franca, with different treatments in two consecutive years (2020 and 2021). Values are means ± SE; different letters (lowercase – veraison; uppercase – harvest; 1 – Year 2020, 2 - Year 2021) mean significant differences between treatments within each phenological stage of each year (P < 0.05, Tukey test), no letters mean no significant differences. ANE – seaweed extract; GB – glycine betaine.
Preprints 82522 g006
Table 1. Biometric parameters: weight, height, width, and thickness of 30 berries of cv. Touriga Franca, with different treatments, at veraison and harvest of 2020 and 2021. Values are means ± SE, different letters (lowercase – veraison; uppercase – harvest; 1 – Year 2020, 2 - Year 2021) mean significant differences between treatments within each phenological stage of each year (P < 0.05, Tukey test). C – control; ANE – seaweed extract; GB – glycine betaine.
Biometric parameters Growth stage/Year C ANE 0.05% ANE 0.1% GB 0.1% GB 0.2%
Weight (g) Veraison 2020 1.92±0.05b1 1.90±0.05b1 1.86±0.05ab1 1.71±0.04a1 2.02±0.04b1
Veraison 2021 2.11±0.04 1.99±0.05 2.10±0.04 2.13±0.04 2.14±0.04
Harvest 2020 2.09±0.04A1 2.09±0.04A1 2.04±0.05A1 2.09±0.05A1 2.28±0.05B1
Harvest 2021 2.14±0.04BC2 1.83±0.06A2 2.08±0.05B2 2.27±0.04C2 2.23±0.04BC2
Height (mm) Veraison 2020 14.15±0.14a1 14.21±0.13a1 14.63±0.17ab1 14.18±0.12a1 15.07±0.11b1
Veraison 2021 15.41±0.10c2 14.78±0.13a2 15.36±0.15bc2 14.94±0.08ab2 15.70±0.14c2
Harvest 2020 14.83±0.13A1 14.71±0.13A1 15.00±0.16AB1 15.03±0.15AB1 15.39±0.12B1
Harvest 2021 16.51±0.13B2 15.47±0.20A2 16.44±0.17B2 16.62±0.14B2 16.91±0.12B2
Width (mm) Veraison 2020 13.91±0.12a1 14.06±0.12ab1 14.11±0.13ab1 13.72±0.12a1 14.43±0.10b1
Veraison 2021 14.73±0.10 14.58±0.12 14.88±0.11 14.90±0.10 14.83±0.11
Harvest 2020 14.20±0.11AB1 14.12±0.11AB1 13.81±0.14A1 13.86±0.12A1 14.33±0.12B1
Harvest 2021 14.13±0.12B2 13.29±0.18A2 13.87±0.13B2 14.73±0.12C2 14.36±0.11BC2
Thickness (mm) Veraison 2020 13.45±0.12a1 13.58±0.12ab1 13.61±0.13ab1 13.25±0.12a1 13.99±0.10b1
Veraison 2021 14.20±0.09 14.22±0.12 14.47±0.11 14.43±0.10 14.32±0.12
Harvest 2020 13.71±0.10AB1 13.59±0.10AB1 13.28±0.14A1 13.45±0.13AB1 13.84±0.13B1
Harvest 2021 13.49±0.14BC2 12.82±0.17A2 13.26±0.14AB2 13.92±0.11C2 13.60±0.12BC2
Disclaimer/Publisher’s Note: The statements, opinions and data contained in all publications are solely those of the individual author(s) and contributor(s) and not of MDPI and/or the editor(s). MDPI and/or the editor(s) disclaim responsibility for any injury to people or property resulting from any ideas, methods, instructions or products referred to in the content.
Copyright: This open access article is published under a Creative Commons CC BY 4.0 license, which permit the free download, distribution, and reuse, provided that the author and preprint are cited in any reuse.
Prerpints.org logo

Preprints.org is a free preprint server supported by MDPI in Basel, Switzerland.

Subscribe

© 2024 MDPI (Basel, Switzerland) unless otherwise stated