1. Introduction
Linear sweep cyclic voltammetry has been conventionally made at scan rates
v ranging 0.01 <
v < 0.2 V s
–1. The slowest scan has been used on the assumption of the steady state for hydrodynamic voltammetry [
1] and microelectrode voltammetry [
2]. It often provides a well-defined voltammogram but takes a long period of a few minutes. An advantage of the slow scan rates is to distinguish faradaic, diffusion-controlled currents from background currents by a double layer capacitance (DLC). For example, the diffusion current at concentration 0.5 mM (M = mol dm
–3) redox species is roughly
Id = 3
v1/2 μA at a 1 mm
2 planar electrode for
v in the unit of V s
–1. In contrast, a DLC of a platinum electrode in aqueous solutions, being
C = 30 μF cm
–2, provides the capacitive current
Ic = 0.3
v μA. Since the ratio is
Ic/
Id = 0.1
v1/2, the diffusion currents at
v = 0.2 V s
–1 can be distinguished from the background with 5 % errors. A disadvantage is a time-consumed measurement, during which redox species might be altered through chemical complications. If faradaic reactions occur under an adsorbed state, the advantage is not perceptive because the background current has the same
v-dependence as
Ic. Slow responses fail to detect kinetic properties.
Study on homogeneous and heterogeneous kinetics requires such a wide range of
v that reaction rates can be covered. A range of the kinetics is often much wider than the conventional scan rates (0.01 – 0.2 V s
–1), and hence fast scan voltammetry is desirable for kinetic work principally [
3,
4,
5,
6,
7,
8,
9,
10] and practically [
11,
12,
13,
14] for applications to neurotransmitter detection. Unfortunately, the increase in scan rates is associated with at least five problems to be considered. (A)
IR-drop, in which applied voltage is lost by solution resistance, makes voltammograms deformed and shifted in a scanned direction [
15,
16]. (B) Even if difference in
v-dependence of
Id and of
Ic enables us to evaluate
Id accurately [
17], the adsorption-controlled current,
Ia, prohibits the extraction of
Ia from the observed current because of the same
v-dependence as
Ic. (C) A delay of a potentiostat underestimates true currents at short time [
7,
8,
17]. (D) Heterogeneous kinetics represented by the Butler-Volmer equation makes the peak potential shifted and the peak current deviated lower than the predicted diffusion-controlled peak current [
18] with an increase in
v. (E) Fast scans more than 0.5 V s
–1 generate the negatively capacitive current, which is caused by formation of dipoles of a reaction product with counterions at an electrode [
19,
20,
21,
22,
23].
A level of these problems depends on magnitude of
v. We suggest three classes;
v < 0.2 V s
–1,
v < 5 V s
–1 and
v < 500 V s
–1. Advantages and possible risks for each class are listed in
Table 1.
The usage of fast scan rates prevents clear distinction of faradaic reactions from backgrounds. The difficulty in the distinction in class III has been overcome with efforts of trial and error, as exemplified with the rapid detection of neurotransmitters,[11–13]. The developed techniques are specific to given redox species under limited conditions. In contrast, those in class II have been carried out on the theoretical base of the difference in the v-dependence when faradaic reactions proceed in diffusion-control. If problems (A)-(E) are intertwined complicatedly, corrections are not enough sufficient for finding expected behavior of the faradaic waves. For class I, the intertwinement is largely solved except for adsorption in the v-dependence.
We examine here subjects (A)-(E) carefully. Since no stereotyped redox species has been found for the Butler-Volmer kinetics yet [
24], (D) may be excluded from the present work on ferrocenyl derivatives [
25,
26,
27]. If we pay attention only to diffusion-controlled currents under category (II), subjects (B) and (C) have been automatically resolved. Both (A) and (E), being necessarily involved in fast scan voltammetry, exhibit similar behavior in spite of different concepts. We examine in this work how voltammetric peak potentials and currents belonging to class (II) are varied with controlling parameters for (A) and (E) by use of fast scan voltammetry of a ferrocenyl derivative. Unfortunately, effects of
IR-drop (A) have not been discussed systematically yet. Thus, we present here the experimental results and the theory.
3. Results
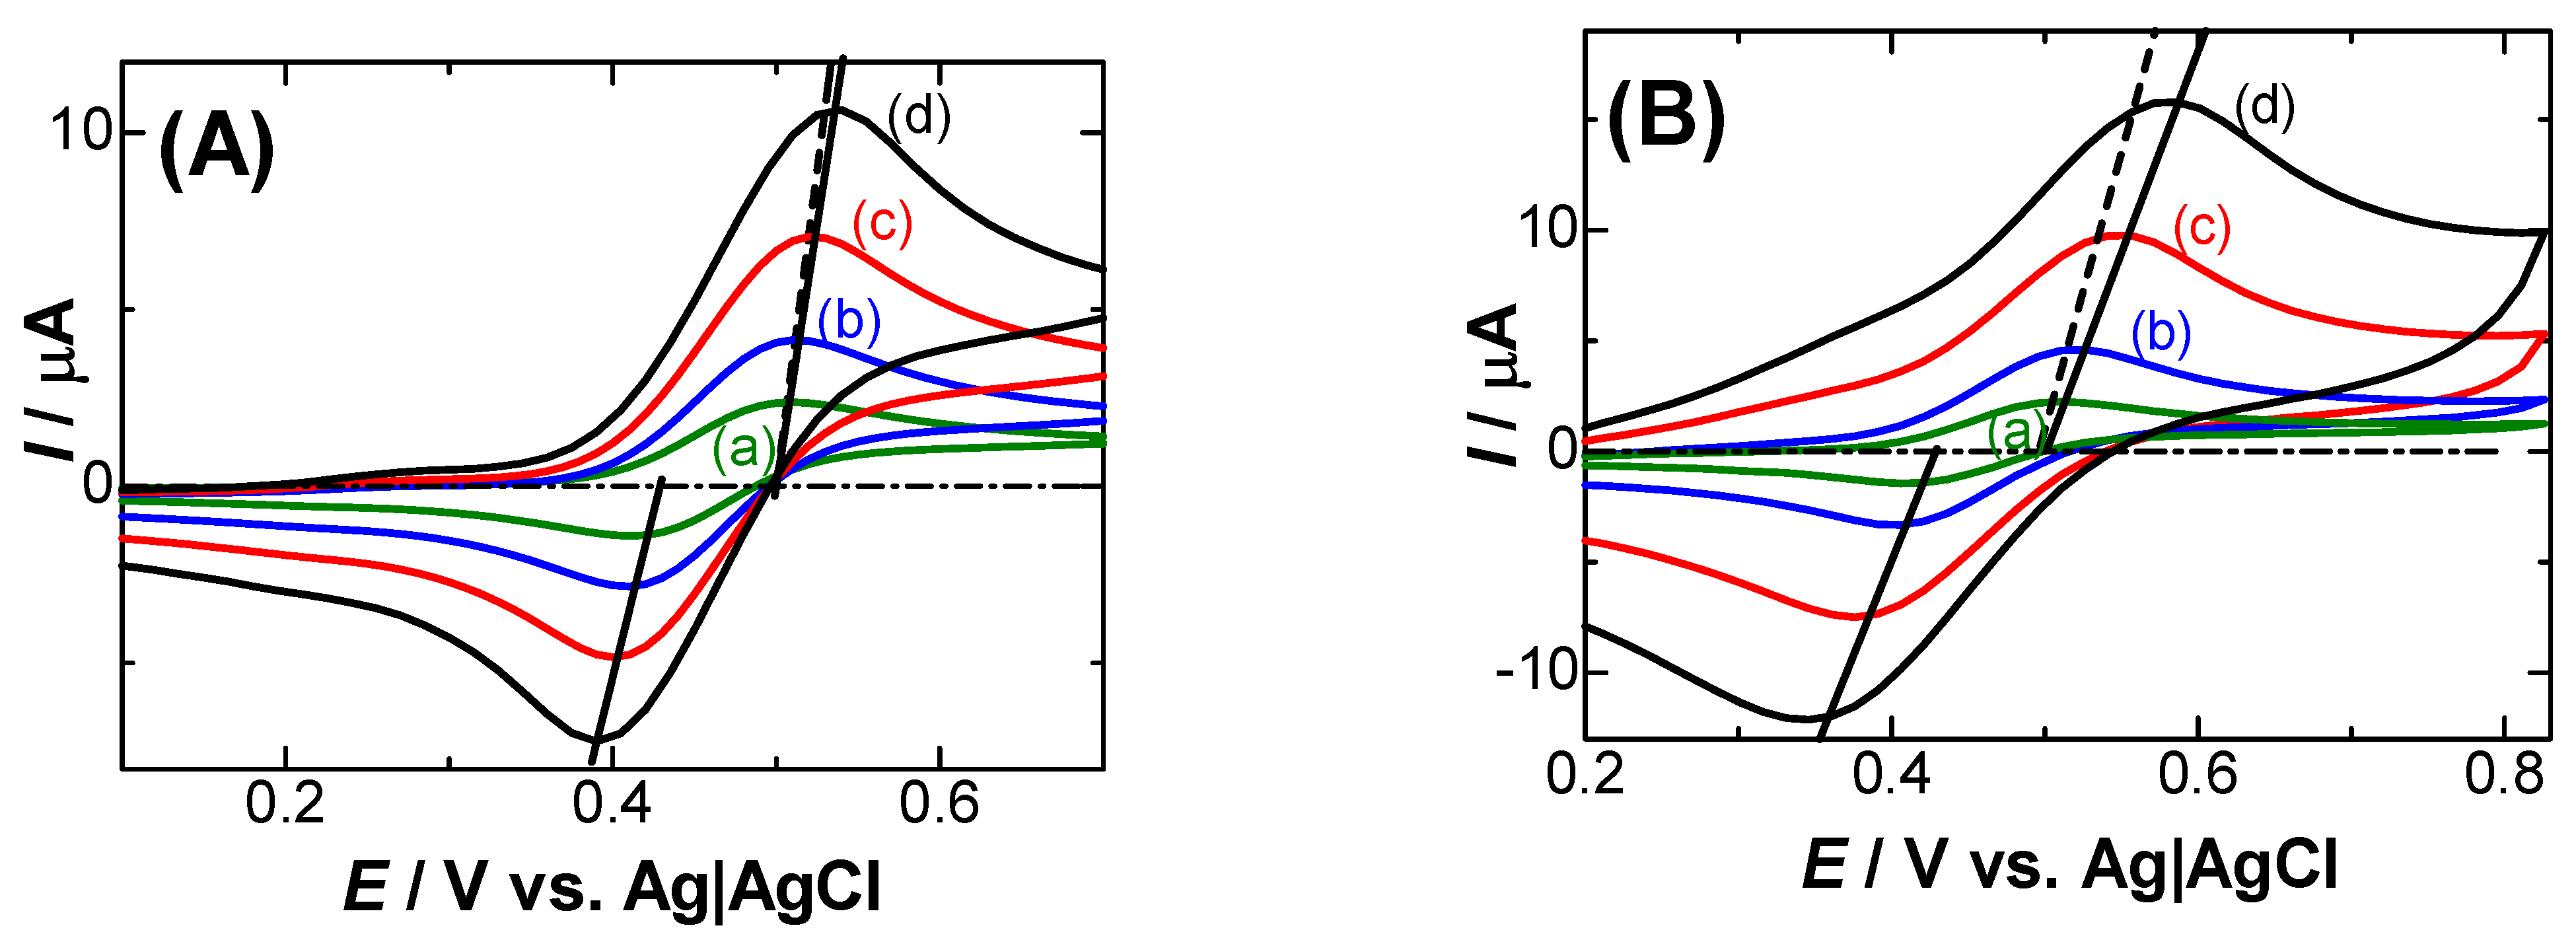
Figure 1A shows voltammograms at the 0.5 mm platinum wire electrode inserted in 1 mm length in the solution of 1.0 mM FcTMA + 5 mM KCl for several scan rates. FcTMA or related ferrocenyl derivatives have been recognized as such fast charge transfer reacting species that voltammetric peak potentials,
Ep, may be independent of voltammetric scan rates [
19,
24,
28,
29,
30]. However, the peak potential in
Figure 1A shifted in the forward direction at the fast scan rates. The potential shift has often been attributed to the
IR-drop. The resistance values were estimated from the inverse slope of the line connecting the peaks (solid lines) [
18,
28]. The slope for the anodic waves was the same as that for the cathodic one. This equality partially supports the effect of
IR-drop on the potential shift. The inverse slope was close to the resistance (2.7 kΩ) obtained through Nyquist plots by ac-impedance. The potential at which the lines are extrapolated to zero current can be regarded as the peak potential without
IR-drop. The difference between the extrapolated anodic potential and the cathodic one was 60 mV, indicating the diffusion- controlled behavior [
18]. The voltammograms in
Figure 1B at the disk electrode 1.6 mm in diameter were drawn out to exhibit the peak-connecting line with the inverse slope of 5.5 kΩ, which was larger than the resistance value of 4.2 kΩ by ac-impedance. Except for this point, the behavior was almost the same as in (A).
There may be a reason for the larger values of the slopes of voltammetric peaks than the
Rs-values by ac-impedance.
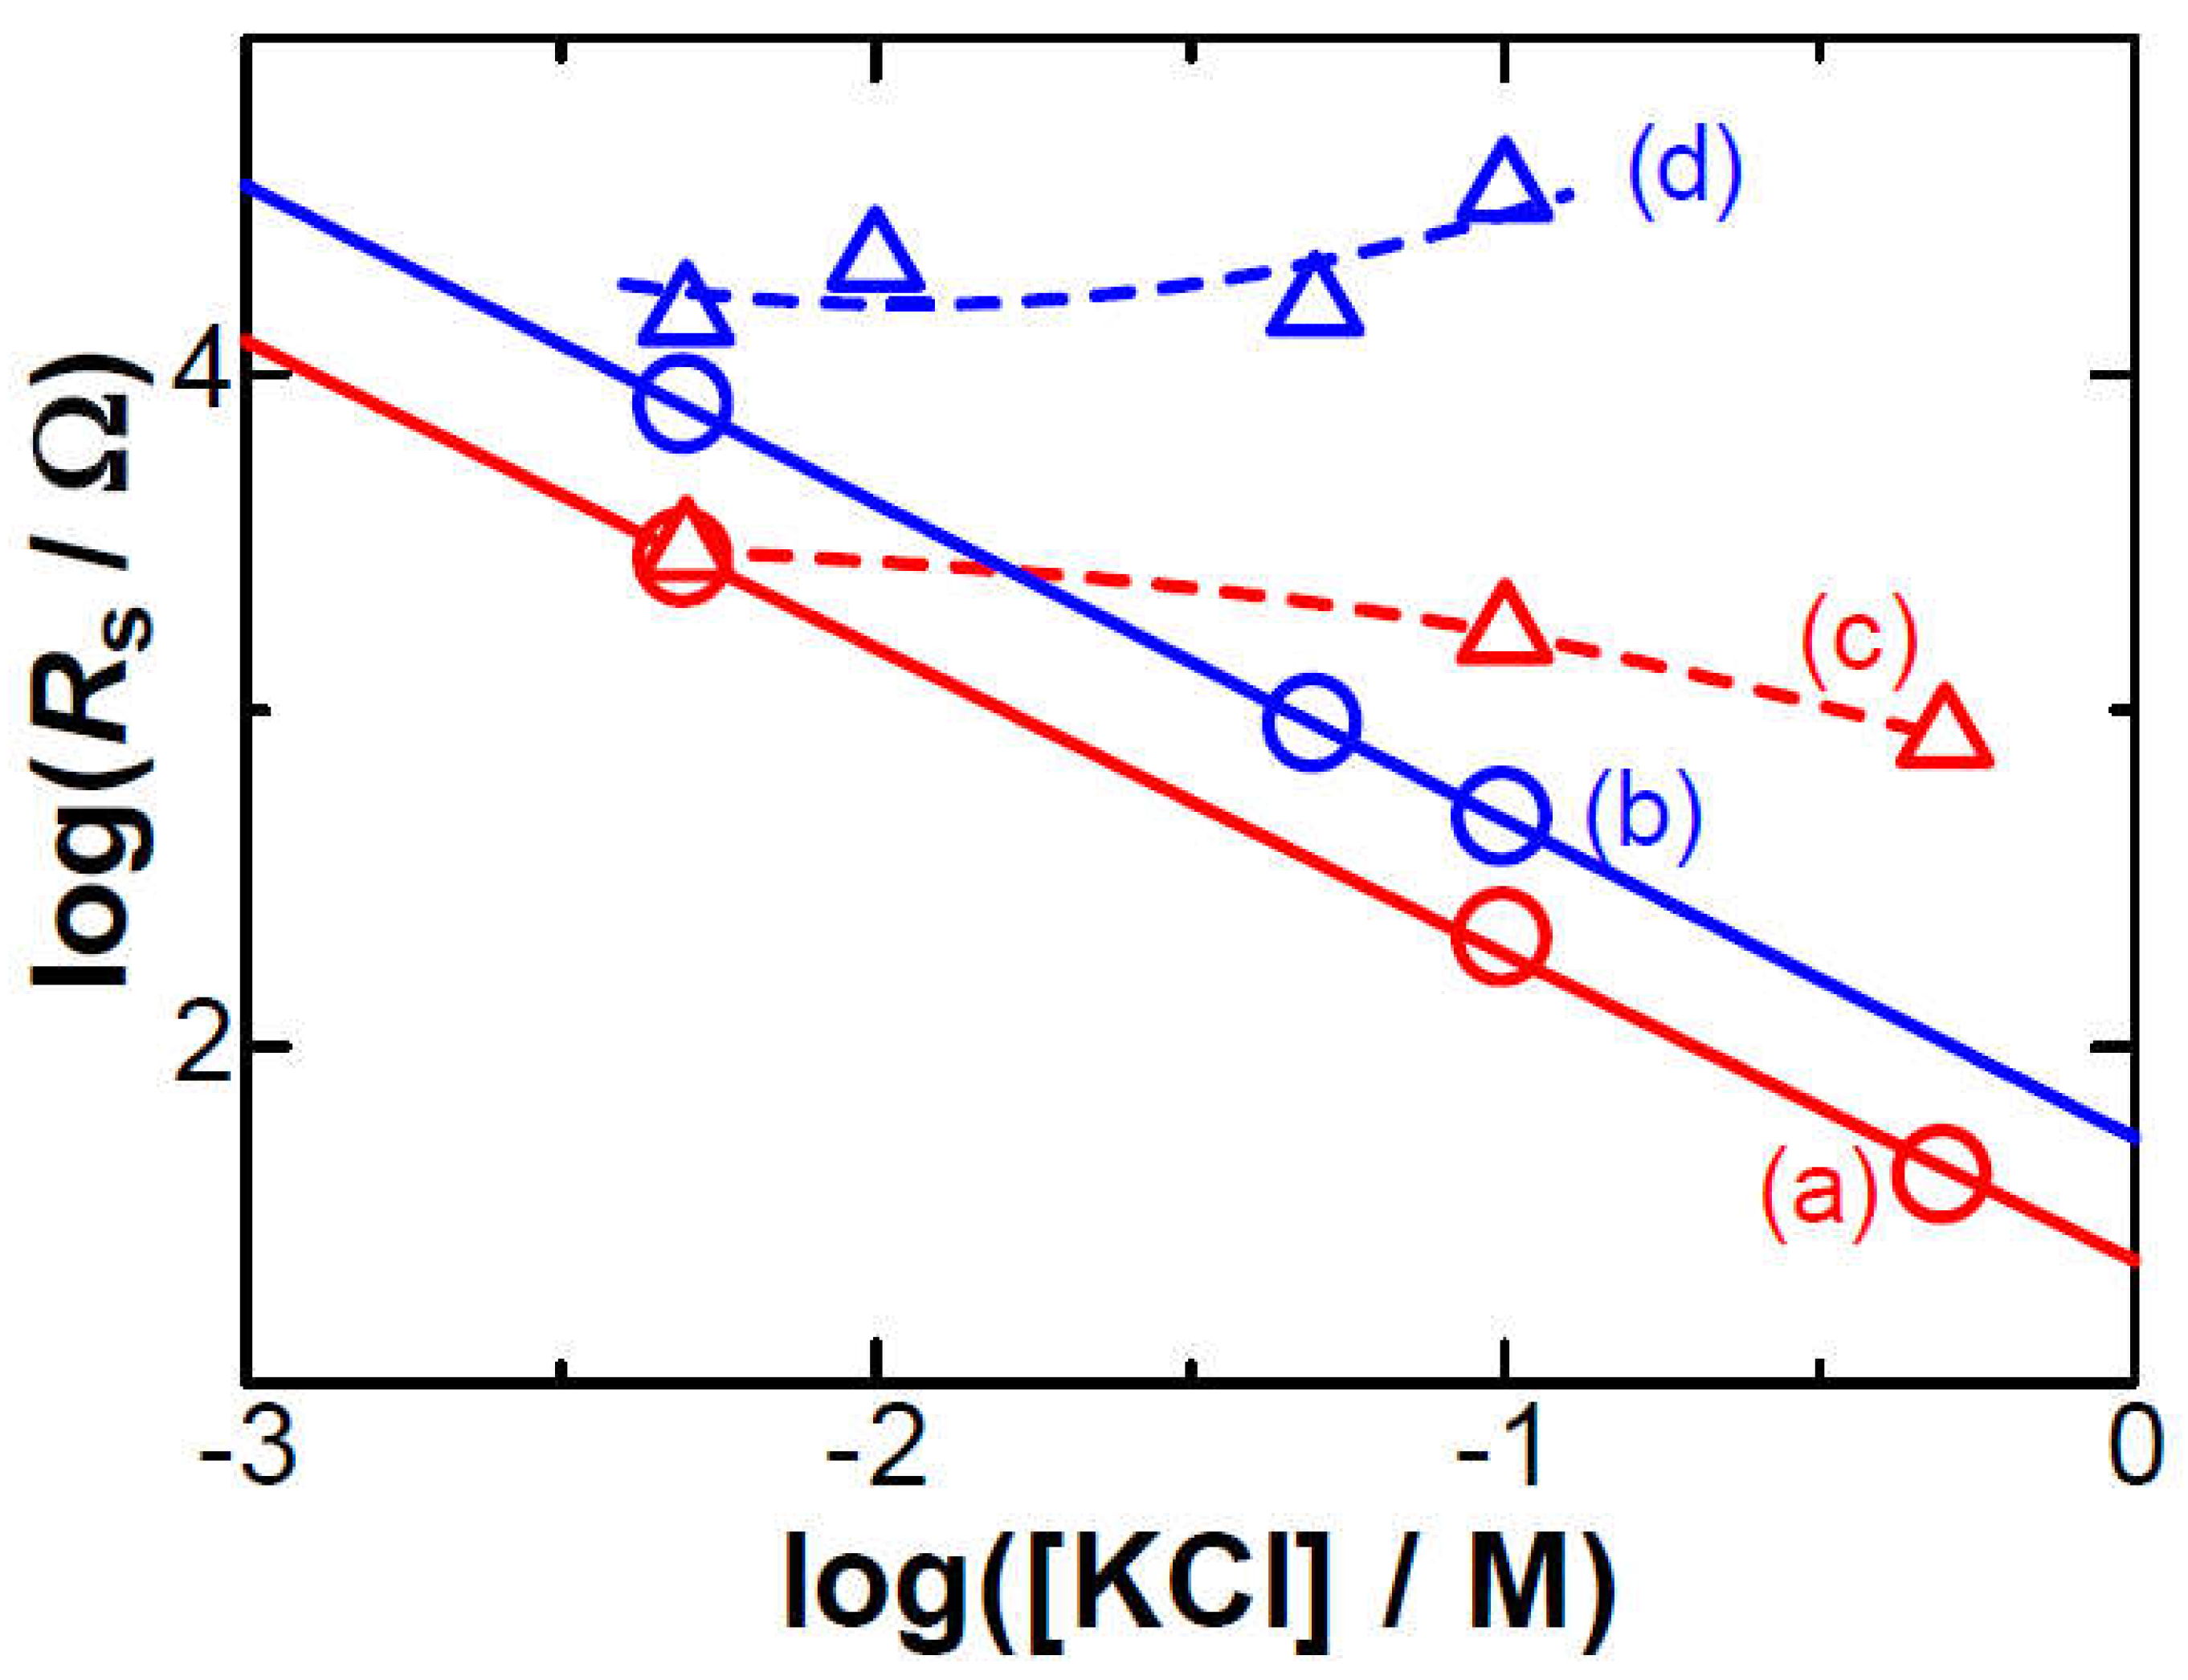
Figure 2 shows logarithmic plots of two kinds of the resistance against concentrations of KCl.
Rs-values (a, b) by ac-impedance were linear with the logarithmic form of [KCl] with the slope –0.91, independent of the electrode geometry. The approximately inverse proportion of
Rs to [KCl] agrees with the concept of ionic mobility by electric field [
31]. The deviation of the slope (–0.91) from the ideal one (–1.0) can be attributed to the frequency dispersion of the double layer capacitance, of which values increase slightly with salt concentrations [
23,
32,
33]. It can be understood in terms of an upward shift of Nyquist plots with an increase in salt concentrations [
33]. It is noteworthy to pay attention to the invalidity of simple
RC-relaxation of the double layer capacitances [
8,
9]. In contrast, the resistances evaluated from voltammetric peaks (c, d) were kept almost constant for the low salt concentrations. They are provided through the oxidation current of FcTMA rather than the capacitive currents of the electric double layer. The potential-shifts only caused by faradaic reactions can be attributed to effects of (i) electric migration [
34,
35,
36], (ii) the heterogeneous kinetics for the charge transfer reaction [
18], (iii) following chemical reactions [
37,
38], and (iv) the negative capacitance associated with the charge transfer reaction [
19,
20,
21,
22,
23]. We attempt to estimate these effects briefly here.
(i) The flux of a uni-valent cationic redox species controlled both with diffusion and electric migration is expressed by the Nernst-Planck equation,
j/
F = –
Dd
c/d
x – (
DF/
RT)
c(d
φ/d
x) [
39], where
c is its concentration,
D is the diffusion coefficient, and
φ is the potential in solution at a distance from the electrode
x. It can be approximated to be
j/
F = –
Dc*/
δ – (
DF/
RT)
c*(Δ
φ/
δ), on the basis of a concept of diffusion layer [
40]. Here, its thickness at the peak current,
Ip, is given by
δ =
Dc*
FA/
Ip, where
A is the electrode area. The ratio of the current component of the migration to that of diffusion is (
F/
RT)Δ
φ. When Δ
φ is replaced by
RsIp, the ratio becomes less than 0.5 % under our experimental conditions. Therefore, migration has no contribution to the potential shift in our case.
(ii) The electrode kinetics has often caused potential shifts. A quantitatively accessible kinetics is represented by the Butler-Volmer equation. The theoretical peak currents and potentials for different scan rates can be obtained from the analytical equation at a given transfer coefficient
α and a heterogeneous rate constant
k0 [
18].
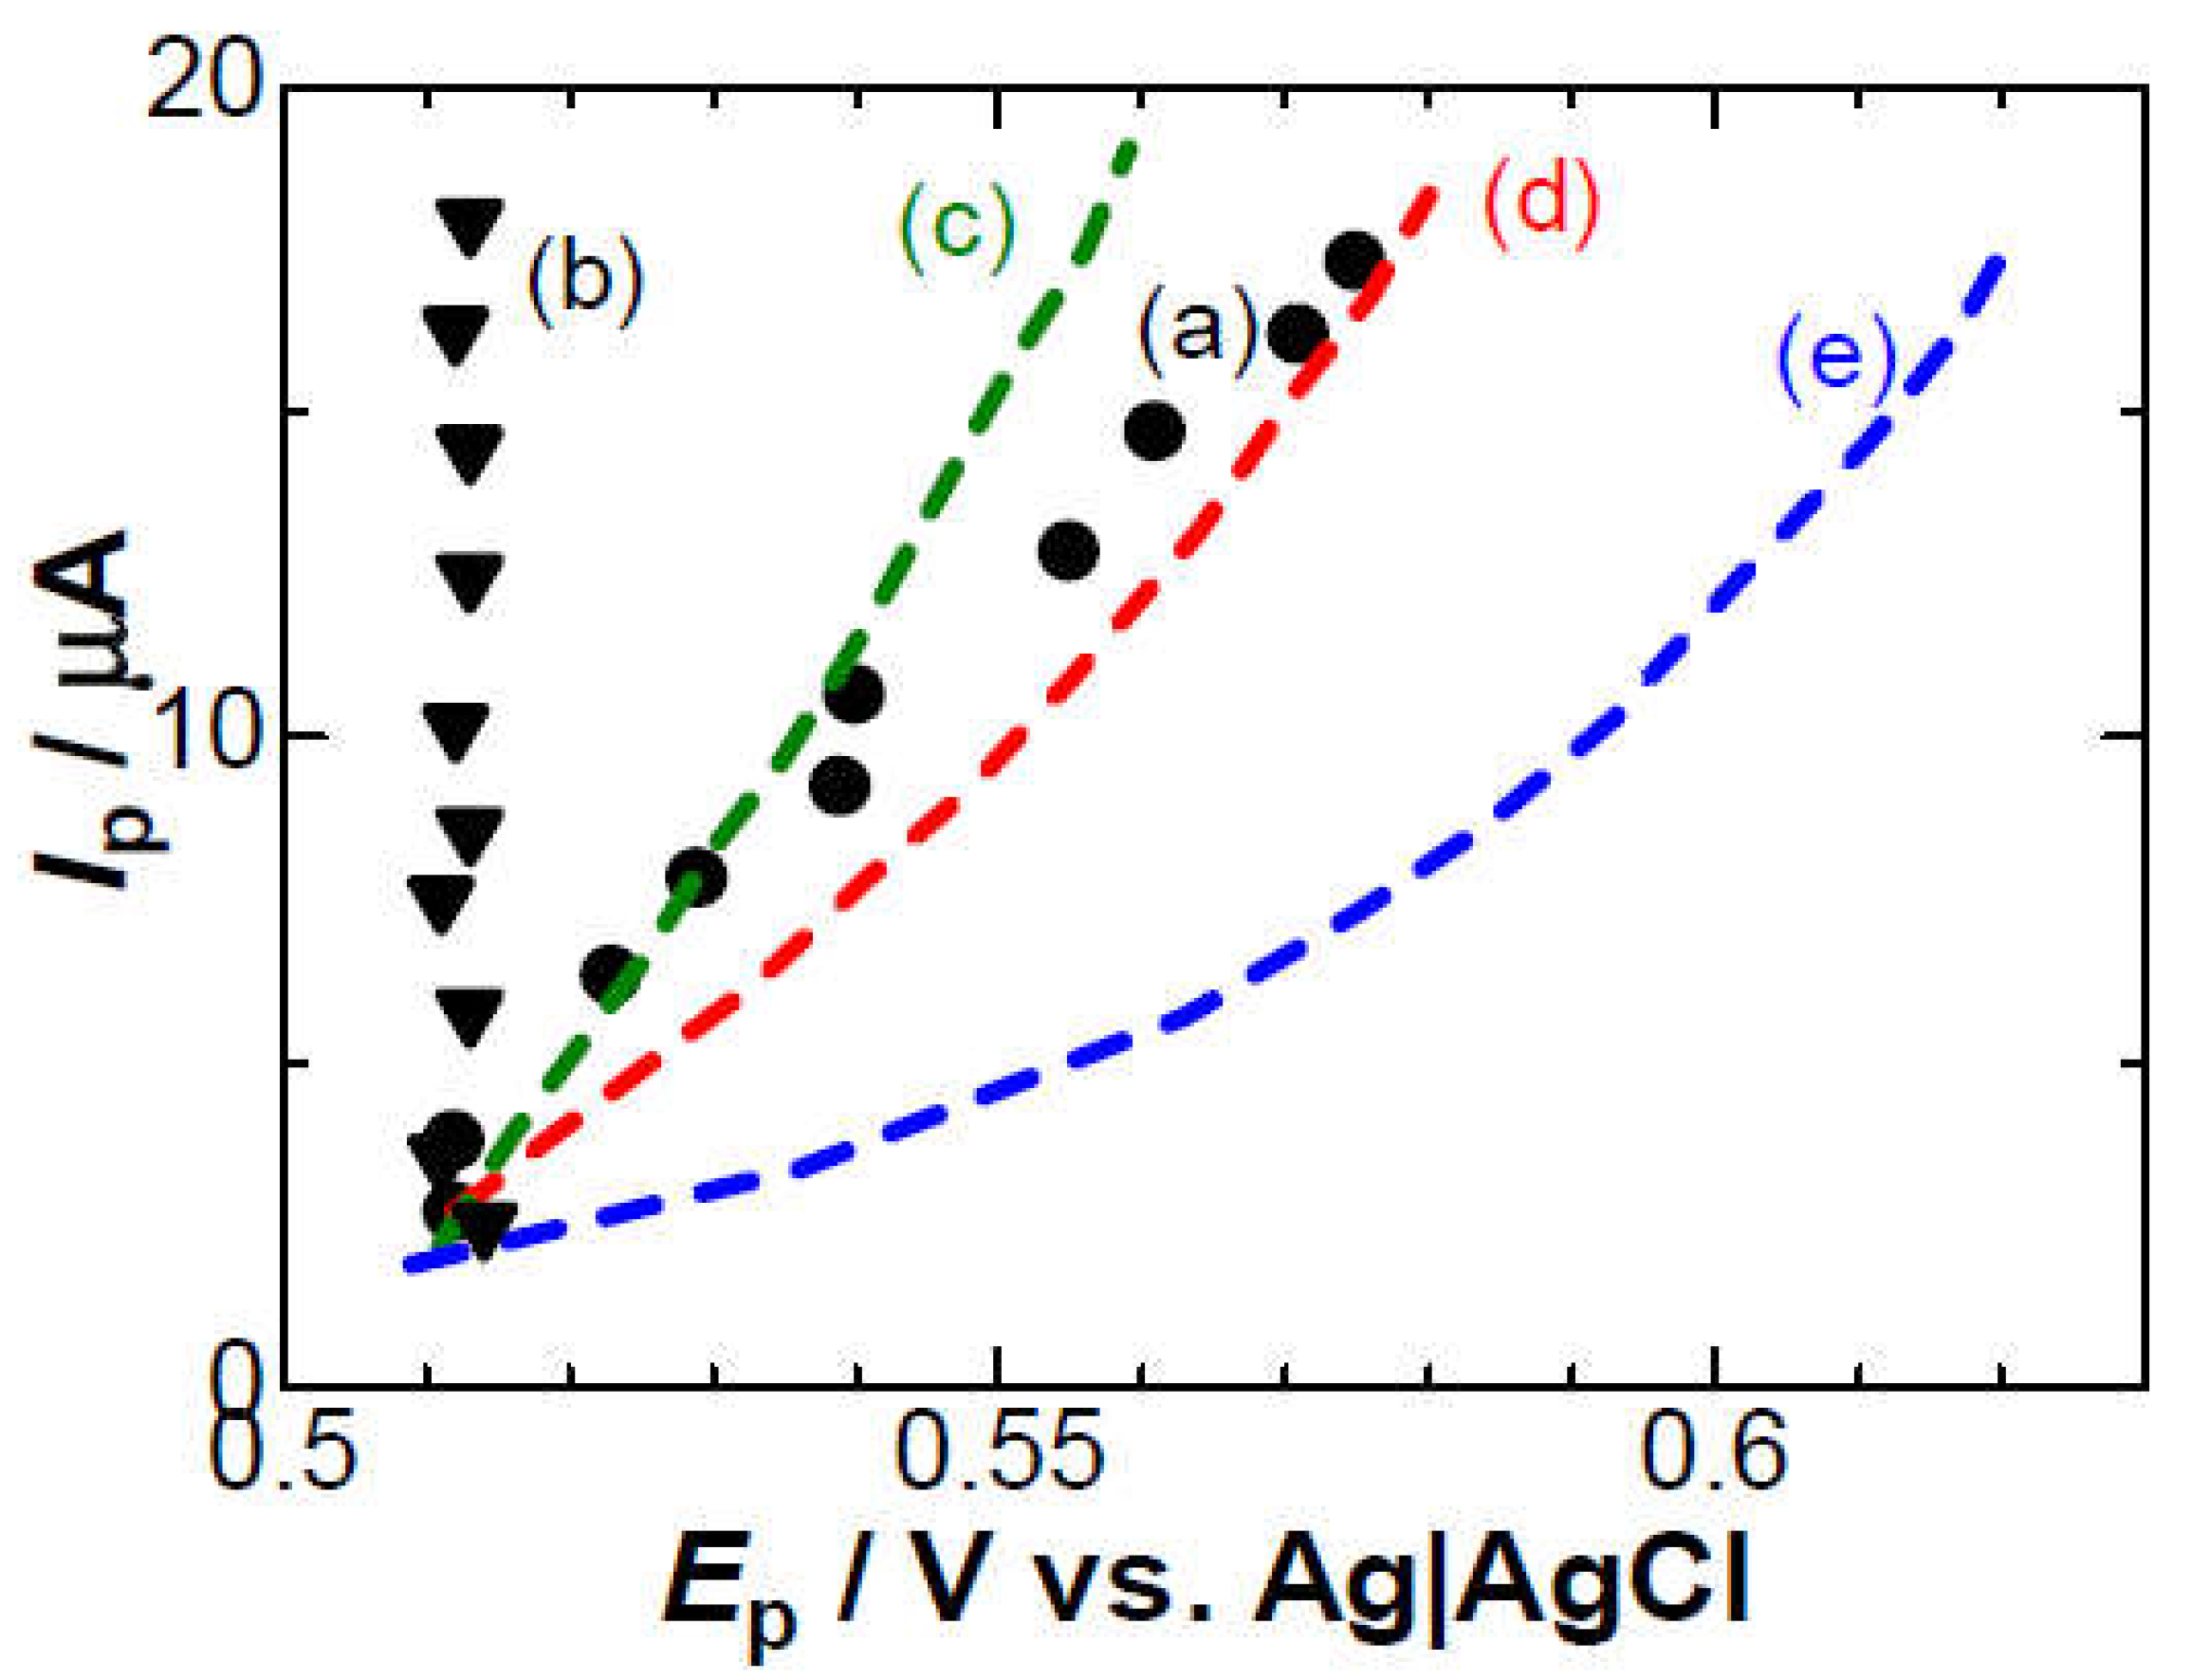
Figure 3c–e shows the variation of
Ip with
Ep for several scan rates at the
α = 0.5 and some values of
k0 by use of our software of the kinetics so that
Ip vs.
Ep were close to the experimental ones (a). However, the experimental plots (a) is different from theoretical variations for any different values of
k0. The inconsistency was also applied to other values of
Rs (b). Since no potential shift was found in 0.1 M KCl solution (b), it is not reasonable to explain the shift in terms of the heterogeneous kinetics. However, the explanation only by the kinetics has often been reported [
3,[3–,4,5,6,7,8,9,10].
(iii) A following chemical reaction causes a potential shift, as can be understood from the Nernst equation for reaction rates faster than voltammetric rates. Ferrocenyl compounds, however, are not satisfied with the condition of the rates, and hence, item (iii) is unsuitable of explaining the present potential shifts.
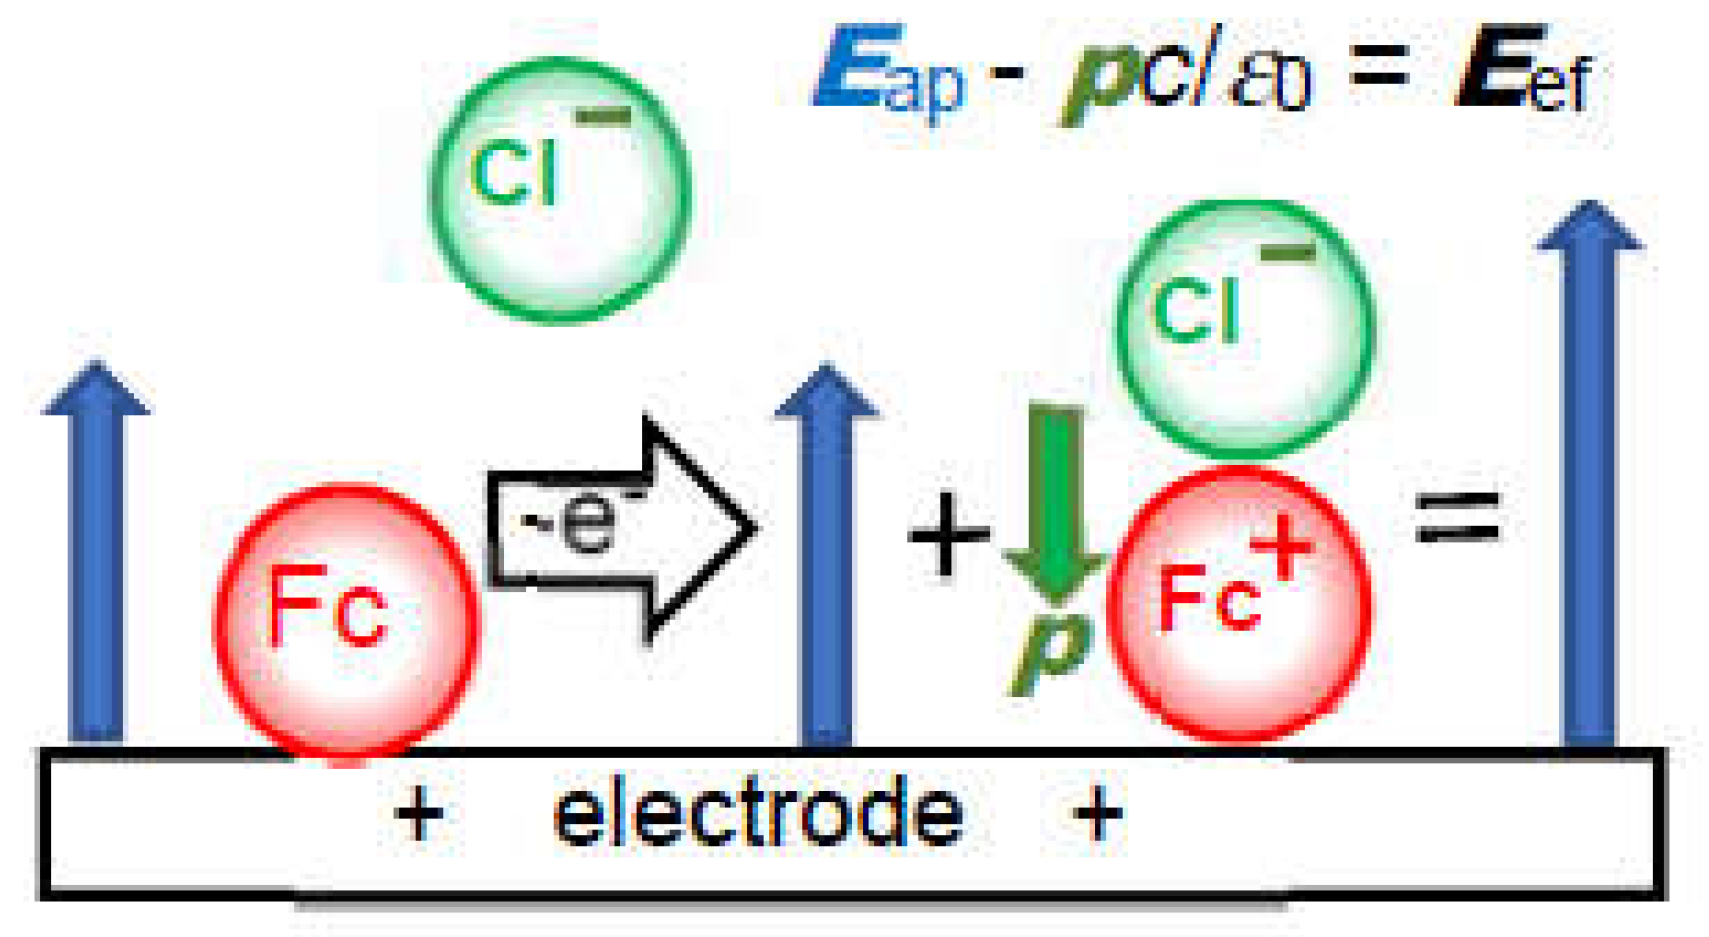
(iv) The negative capacitance is brought about through the following steps in
Figure 4: a charge transferred redox species (Fc) is coupled with a counterion (Cl
–) for electric neutrality by responding to the externally applied field
Eap to yield an electric dipole(Fc
+-Cl
–); the dipole with the dipole moment
p is oriented in the direction for enhancing the external field by -
pc/
ε0 to yield the effective field
Eef, which generates a capacitance with a sign opposite to a double-layer capacitance [
17,
41]. The negative capacitance has been obtained for ferrocenyl derivative [
19,
20], ruthenium complex, iridium complex [
20] and hemin [
41] by ac-impedance. Since the voltammetric current from the negative capacitance is proportional to the scan rate, it depresses the diffusion tail to cause the potential shift [
17]. The negative capacitance varies with electrode areas and scan rates, as the
IR-drop does. The similarity in the properties stimulates us to distinguish their properties theoretically.
4. Theory of effects of IR-drop
The electrode reaction here is a simple Nernstian charge-transfer reaction with the mass transfer controlled by
x-directional diffusion. The diffusion coefficient of the reduced species,
D, is assumed to have a common value to the oxidized species. Letting the solution resistance between a working electrode and a reference one be
Rs, the scan rate be
v and the initial potential be
Ein, we can express the linearly scanned potential participating efficiently in the oxidation for the current
I as
E(
t) =
Ein +
vt –
I(
t)
Rs at the time
t. The common value of
D implies that the sum of concentrations of both species is equal to the bulk concentration,
c*, in any time and any location. Thus, the Nernst equation for the reduced species tends to
On the other hand, the surface concentration is given by a solution of the diffusion equation [
18] as a function of the current density
j
Inserting this equation into Equation (1) and extracting
j by the technique previously described [
42] yields
Application of Leibniz's theorem [
43] makes the combination of the integral and the differentiation be reduced to
where
A is the area of the electrode.
We replace the time by the potential through
y = (
Ein +
vu)
F/RT, and define the dimensionless current as
where
Ip0 is the peak current without solution resistance, given by
Ip0 =0.446
Ac*F(
FDv /
RT)
1/2. The current has the dimensionless parameter for the resistance
and can be rewritten as
where g(
x) = (1/4)sech
2(
x/2), and
ζin and
ζap are the dimensionless initial voltage
EinF/
RT and the dimensionless applied voltage (
Ein+
vt)
F/
RT, respectively. Function
f was evaluated by numerical computation by discretization of
ζap –
ζin =
nh for a small value of
h, as was described in the supporting information.
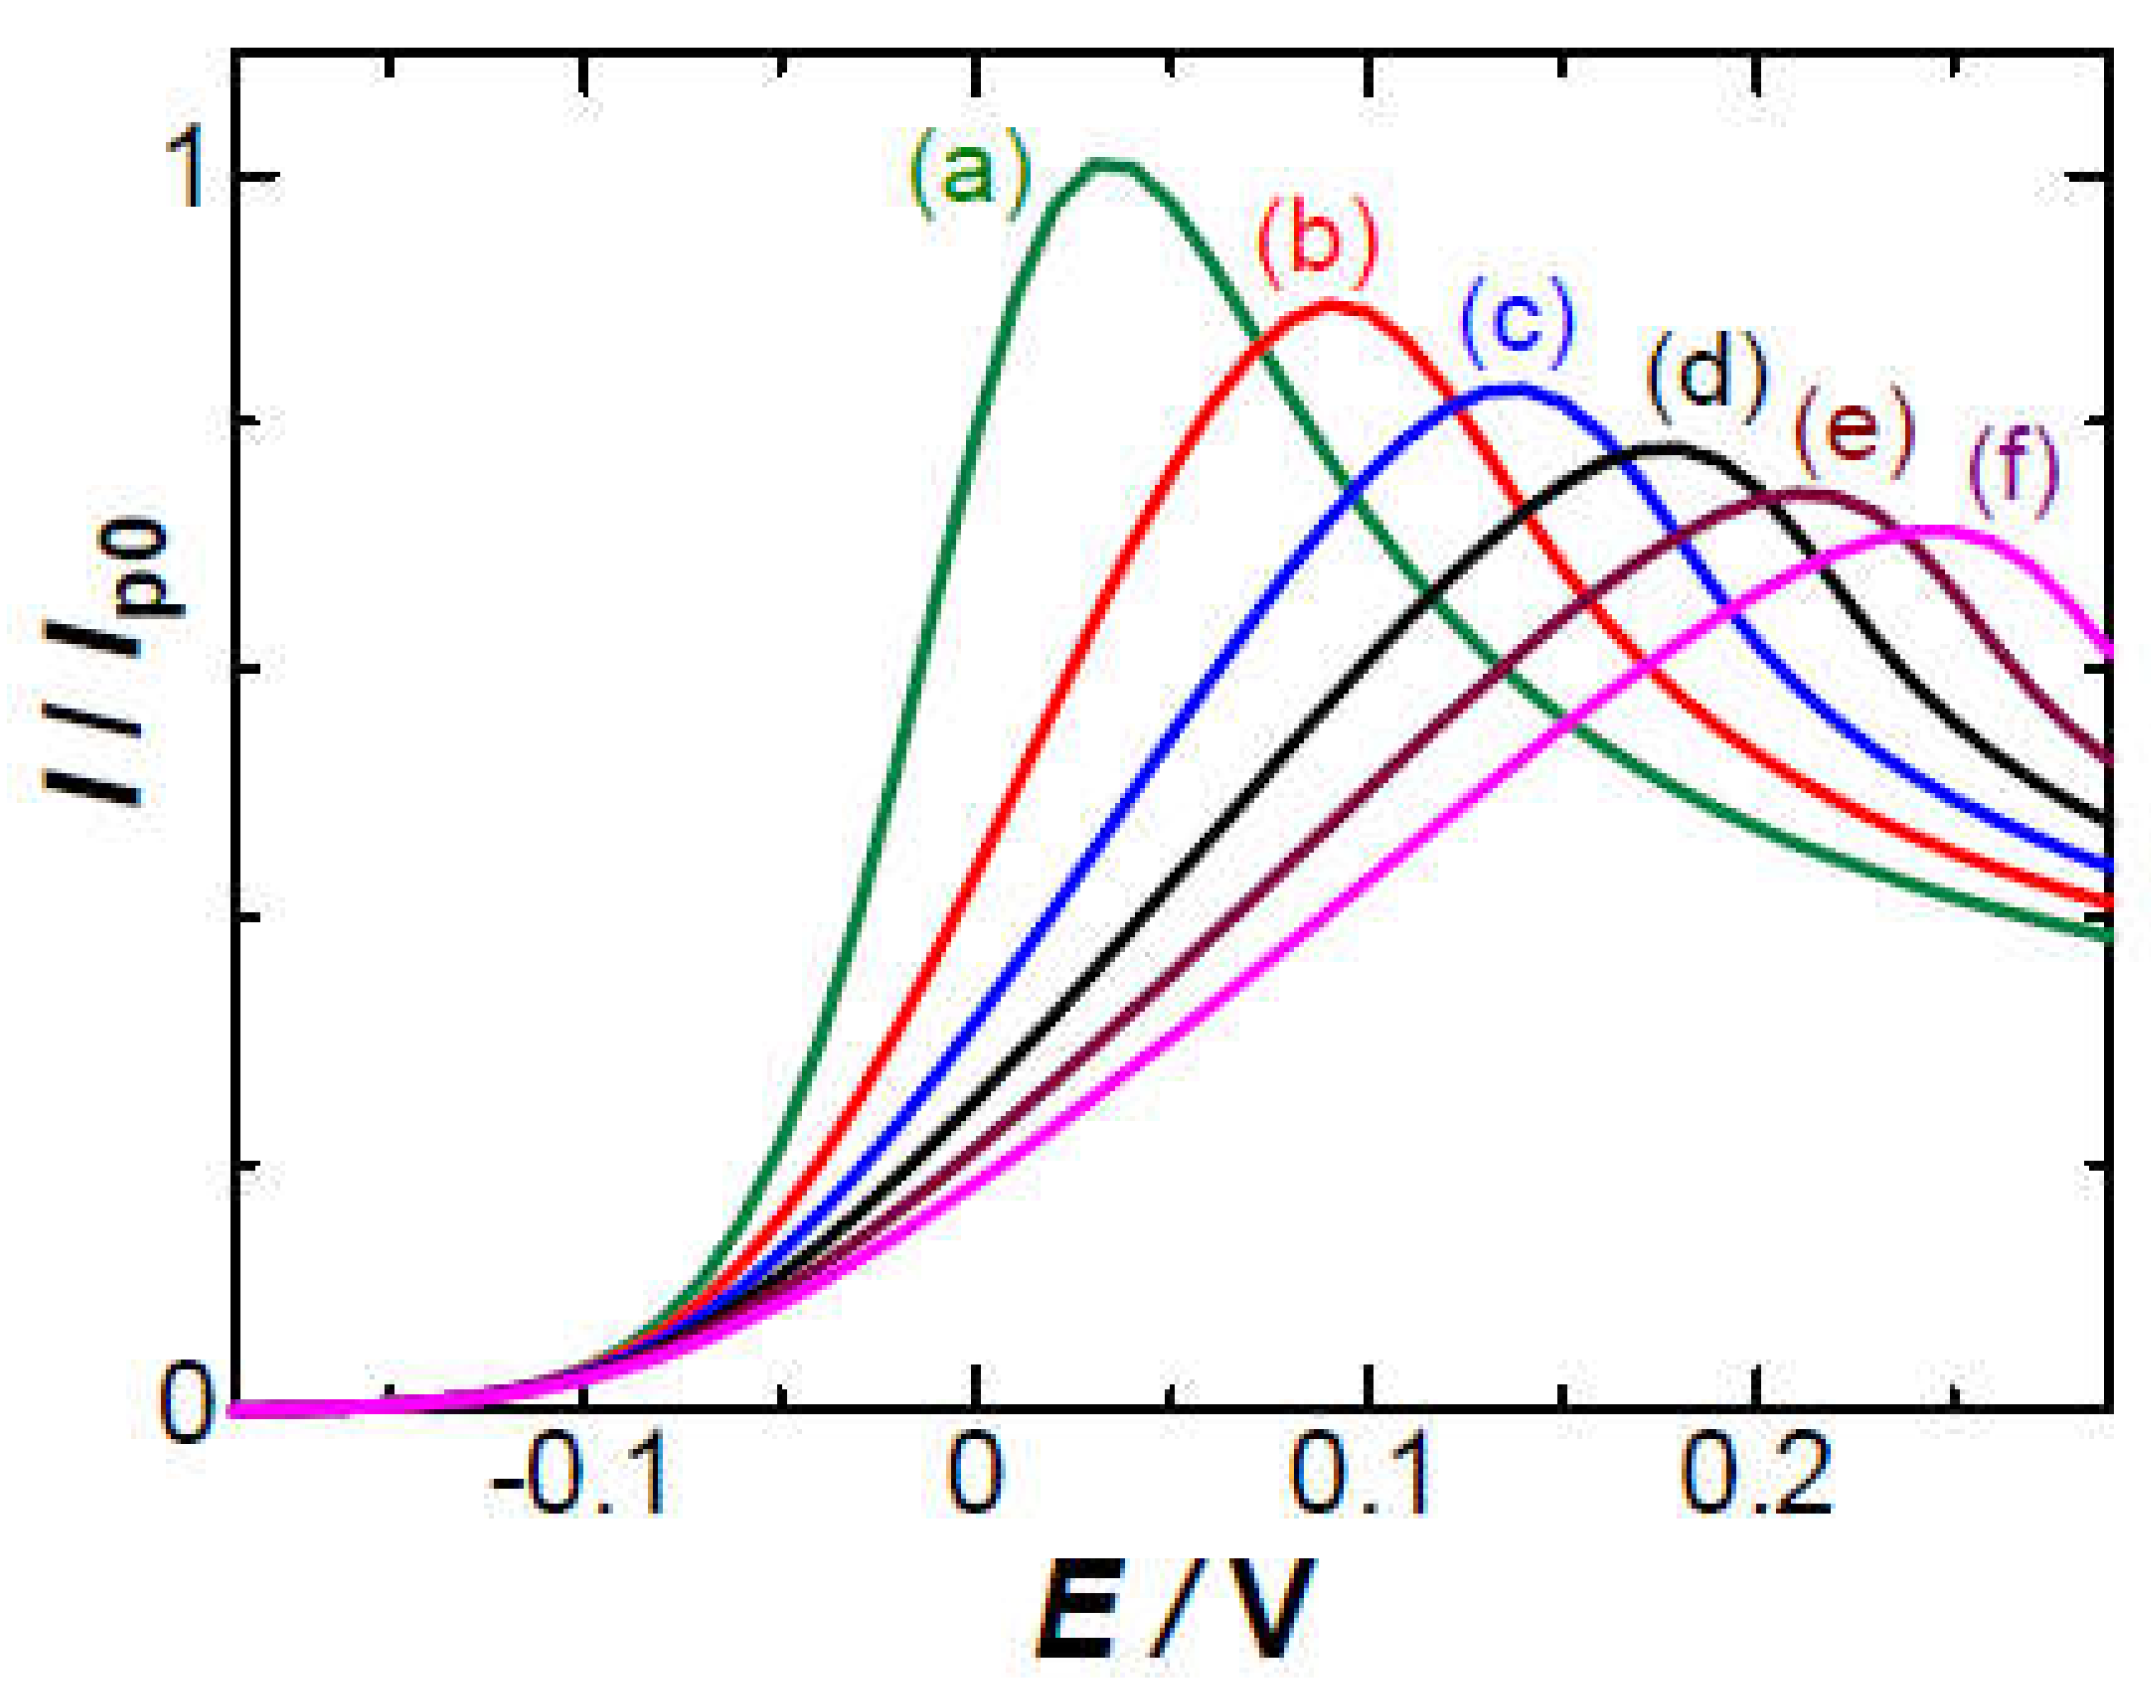
Figure 5 shows dimensionless voltammograms for several values of resistance parameter
ρ (Equation (4)). With an increase in the values of
ρ, voltammograms shift in the positive direction accompanied with a decrease in the peak currents. An exemplified value of
ρ = 4 corresponds to
Ip0 = 0.1 mA,
Rs = 1 kΩ.
Peaks were calculated for various values of
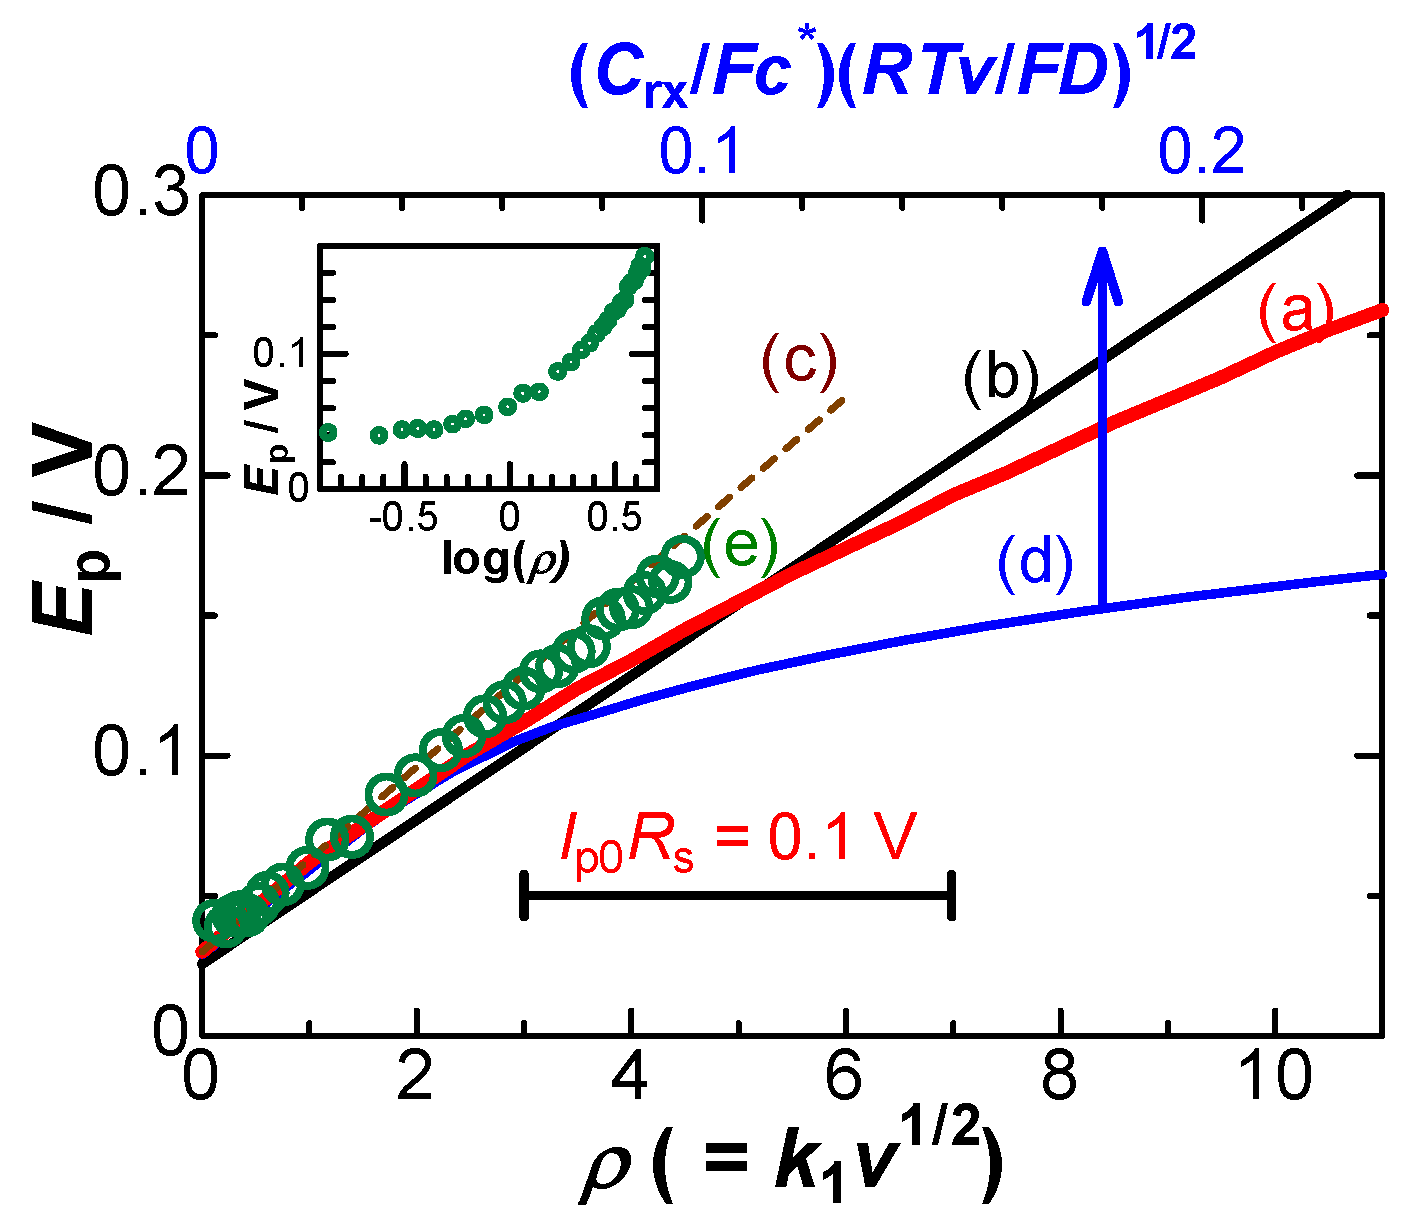
ρ. The
Ep increased from 0.029 V convexly with
ρ, as shown in
Figure 6a. The intuitively predicted increase in
Ep is
Ip0Rs or (26 mV)
ρ,
as shown in the line of
Figure 6b. The tangent line at
ρ = 0 has the slope, 33 mV (
Figure 6c). The slight shift from 26 mV is ascribed to the smaller decrease in the current for
E >
Ep than that for
E <
Ep (see
Figure 5) owing to the diffusion tail. Consequently, the
Ep-values calculated from Equation (5) for
ρ < 3 are larger than the line (Equation (6)). Since the variable
ρ is proportional to
v1/2 through
Ip0, the effect of
IR-drop on the voltammograms is approximately exhibited in the form of the linearity of
Ep to
v1/2 rather than log
v.
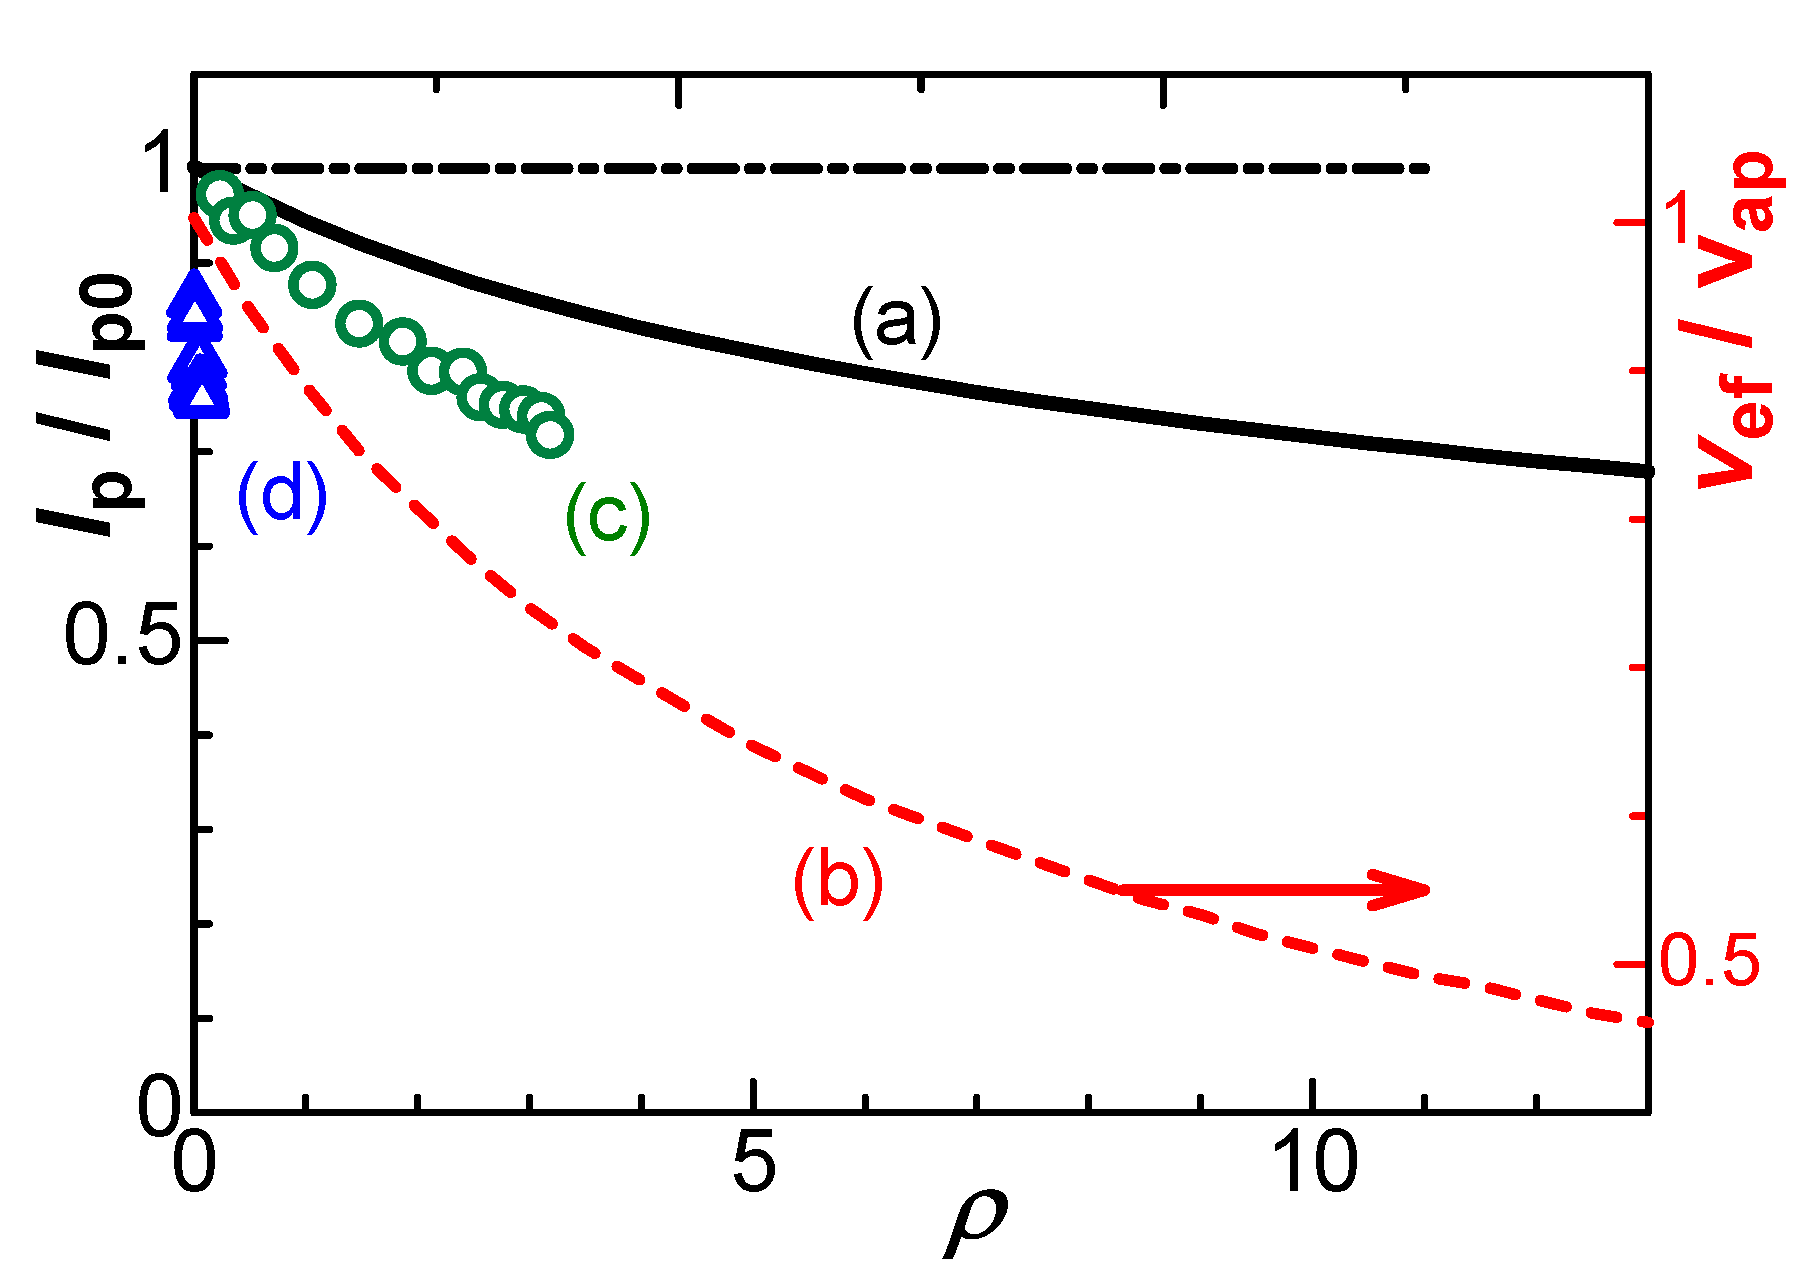
The peak current normalized with the theoretically diffusion-controlled one decreased with an increase in the resistance, as shown in
Figure 7. The decrease can be explained in terms of the following reasons: the shift of the peak potential delays the arrival at the peak; the delay is equivalent to a substantial decrease in the applied scan rate,
vap, which leads a decrease in
Ip so that
Ip <
Ip0 =
k1vap1/2, where
k1 = 0.446
Ac*F(
FD/
RT)
1/2. By letting the effective scan rate,
vef, be
Ip =
kvef1/2,
vef decreases with
ρ, as shown on the right ordinate in
Figure 7b. It varies linearly with
ρ1/2. The effective rate becomes less than a half for
ρ > 10 or
Ip0Rs > 0.25 V. The difference, 0.446– (
Ip/
Ac*F)(
RT/
FDvap)
1/2, was approximately proportional to
ρ1/2. As a result, the peak current at any value of
Rs can be approximated as
This is a new insight for the
IR-drop effect that has not been reported yet [
8,
9]. Since
ρ is proportional to
v1/2 through
Ip0 (Equation (4)), the peak current for the
IR-drop can be approximated as
Ip =
kv1/2 –
k1v3/4.
It is interesting to compare the effects of
IR-drop on
Ip and
Ep with those of the negative capacitance (NC),
Crx. The
Ep due to
Crx has varied linearly with log[(
σ*/
c*)
2(
v/
FRTD)] [
17] for
Ep –
Eo > 0.06 V, where
σ* is the sum of the surface charge density of the oxidized and the reduced species, and
c* is the bulk concentration of FcTMA. In contrast, its variation for
Ep –
Eo < 0.1 V is linear with (
σ*/
c*)(
v/
FRTD)
1/2, as shown in
Figure 6 on the upper abscissa, which was scaled so that the line may be overlapped with the line for the
IR-drop. The line can be approximated as 0.0217(
σ*/
c*)(
v/
FRTD)
1/2 + 0.03 in the unit of V for
Ep –
Eo > 0.06 V. The empirical equality,
Crx = 0.16(
F/
RT)
σ*, in Equation (13) of ref. 17 can substitute
Crx for
σ* to give
When potential shift is small, the observed shift is the sum of the shifts for the
IR-drop and the negative capacitance,
Rs varies with geometry of electrodes at given conductivity of solution. A disk electrode makes
Rs be 1/4
Λ[KCl]
a = (π/
A)
1/2/4
Λ[KCl] [
44] for the molar conductivity
Λ of KCl.
Rs at a wire electrode, on the other hand, is inversely proportional to
A. Some variables that control
Ep are summarized in
Table 2 for comparing these two effects.
The
IR-drop contribution normalized with
Ip0 is
On the other hand, the negatively capacitive peak current is given by
INC =
Ip0 –
ACrxv. The normalized contribution is given by
Eliminating
Ip0 from Equations (10) and (11) yields
Especially, the relation for the disk is given by
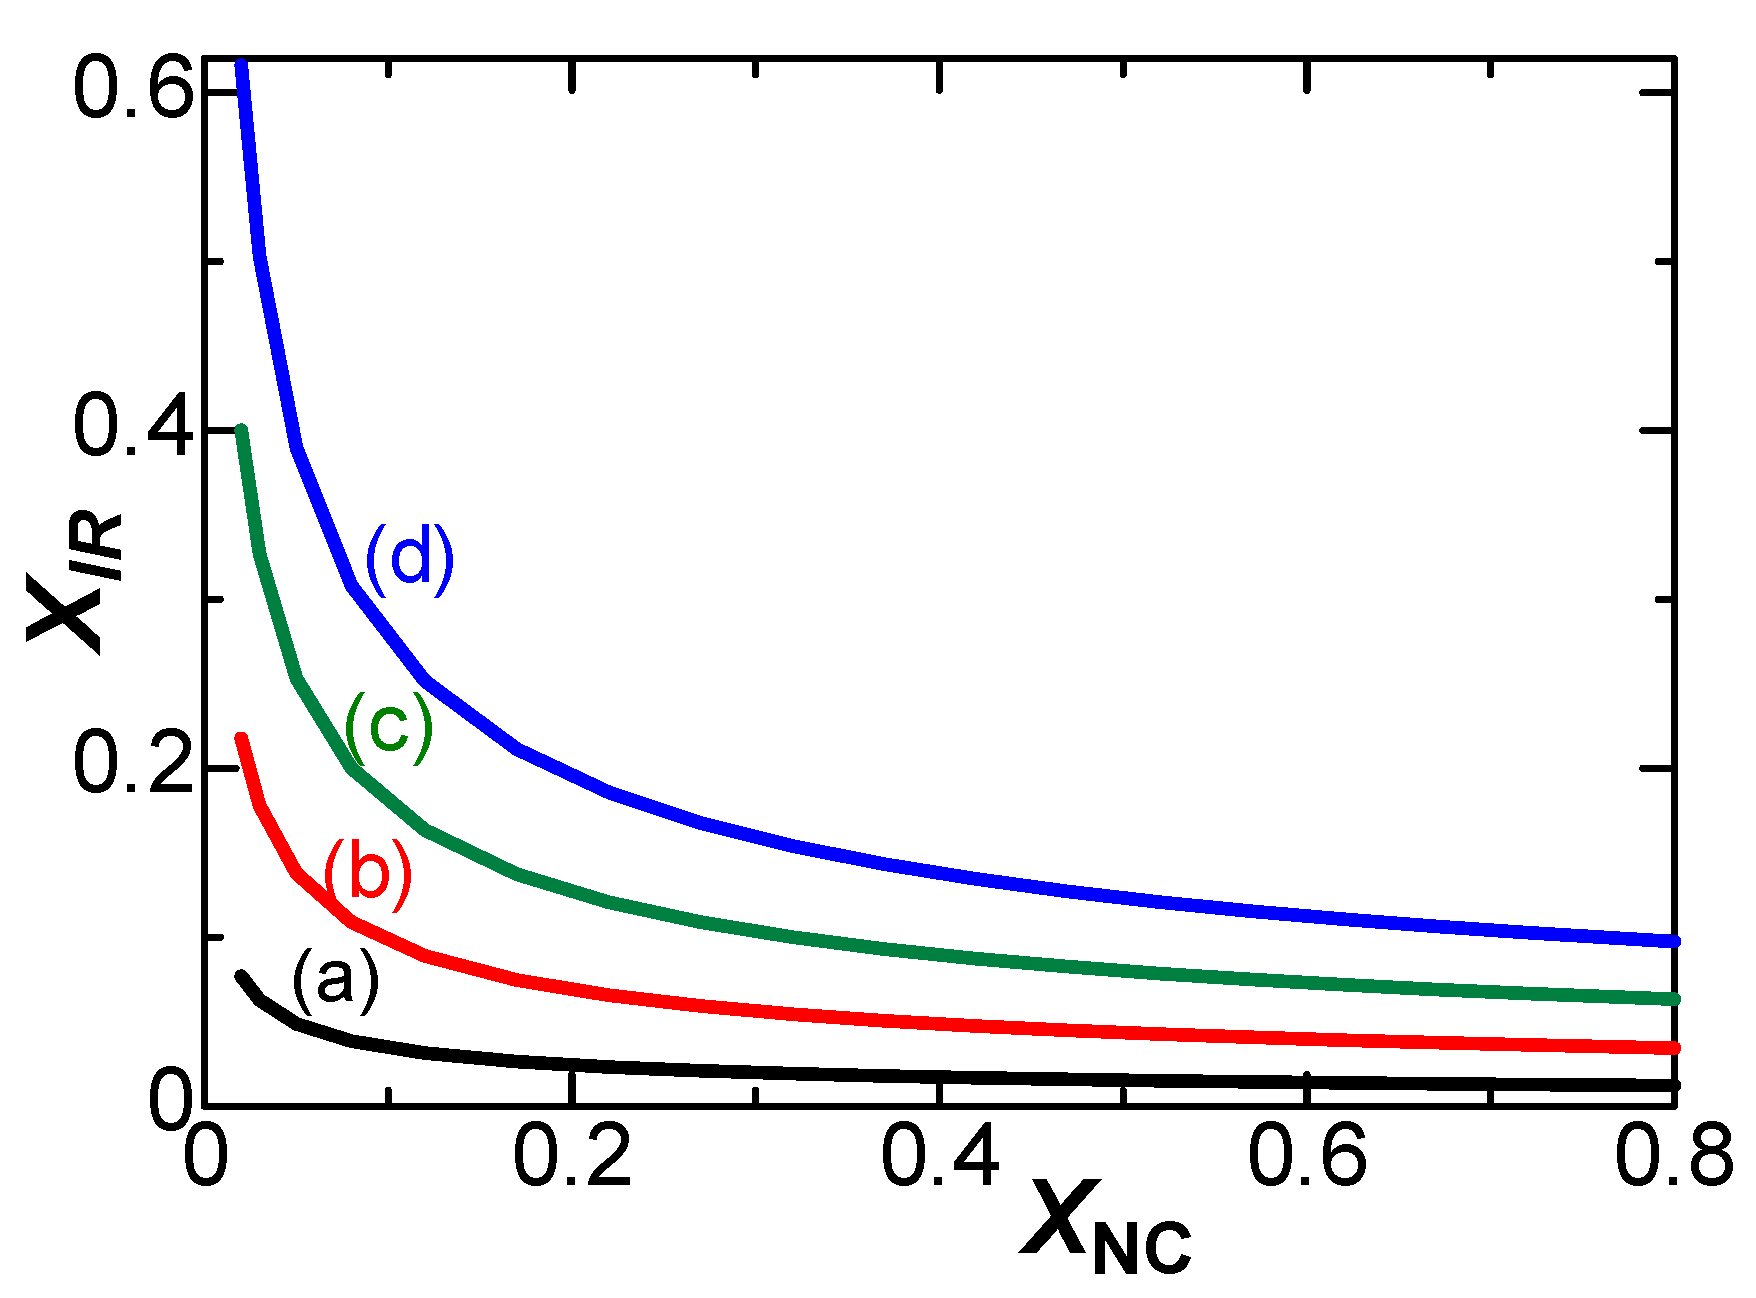
Figure 8 shows variations of (
XIR)
disk with
XNC for some electrode areas at conventionally experimental conditions of
v,
κ (=
Λ[KCl]) and
Crx. The constant of
XIR2XNC indicates that the effect of the negative capacitance is predominant to that of the
IR-drop. Furthermore, high scan rates at large electrodes in low salt concentration should enhance both the
IR-drop and the negative capacitance.
5. Discussion
Experimental values of
Ep in the solution of 1 mM FcTMA + 5 mM KCl were plotted against
ρ (=
IpRsF/
RT) in
Figure 6e, where the value of
Rs for
ρ was obtained from the Nyquist plot. They were on a line, deviated upward from the theoretical curve
Figure 6a of the
IR-drop, and hence the potential shift cannot be ascribed only to the
IR-drop. The plot of the experimental
Ep vs. log
v is shown in the inset of
Figure 6, as is often plotted. The non-linearity indicates that the conventionally observed linearity should not explain any
IR-drop effect. Addition of voltages does not agree with that of processes because of non-linear relation to voltages in electrochemical processes. The experimentally obtained ratio,
Ip/
Ip0, decreased with an increase in
v, as shown in
Figure 7c,d at two values of
Rs. The variation of the triangular marks is close to that of the circles if
ρ-axis is expanded. The experimental values (c,d) lower than the theory (a) were caused by the effect of the negative capacitance.
It is current that can make arithmetic operations possible through an addition of current at a parallel process or of inverse currents at a series one. In order to confirm the dependence of the
IR-drop contribution on the scan rates, we plotted
Ip0–
Ip in solution of 1 mM FcTMA + 5 mM KCl against
v logarithmically in
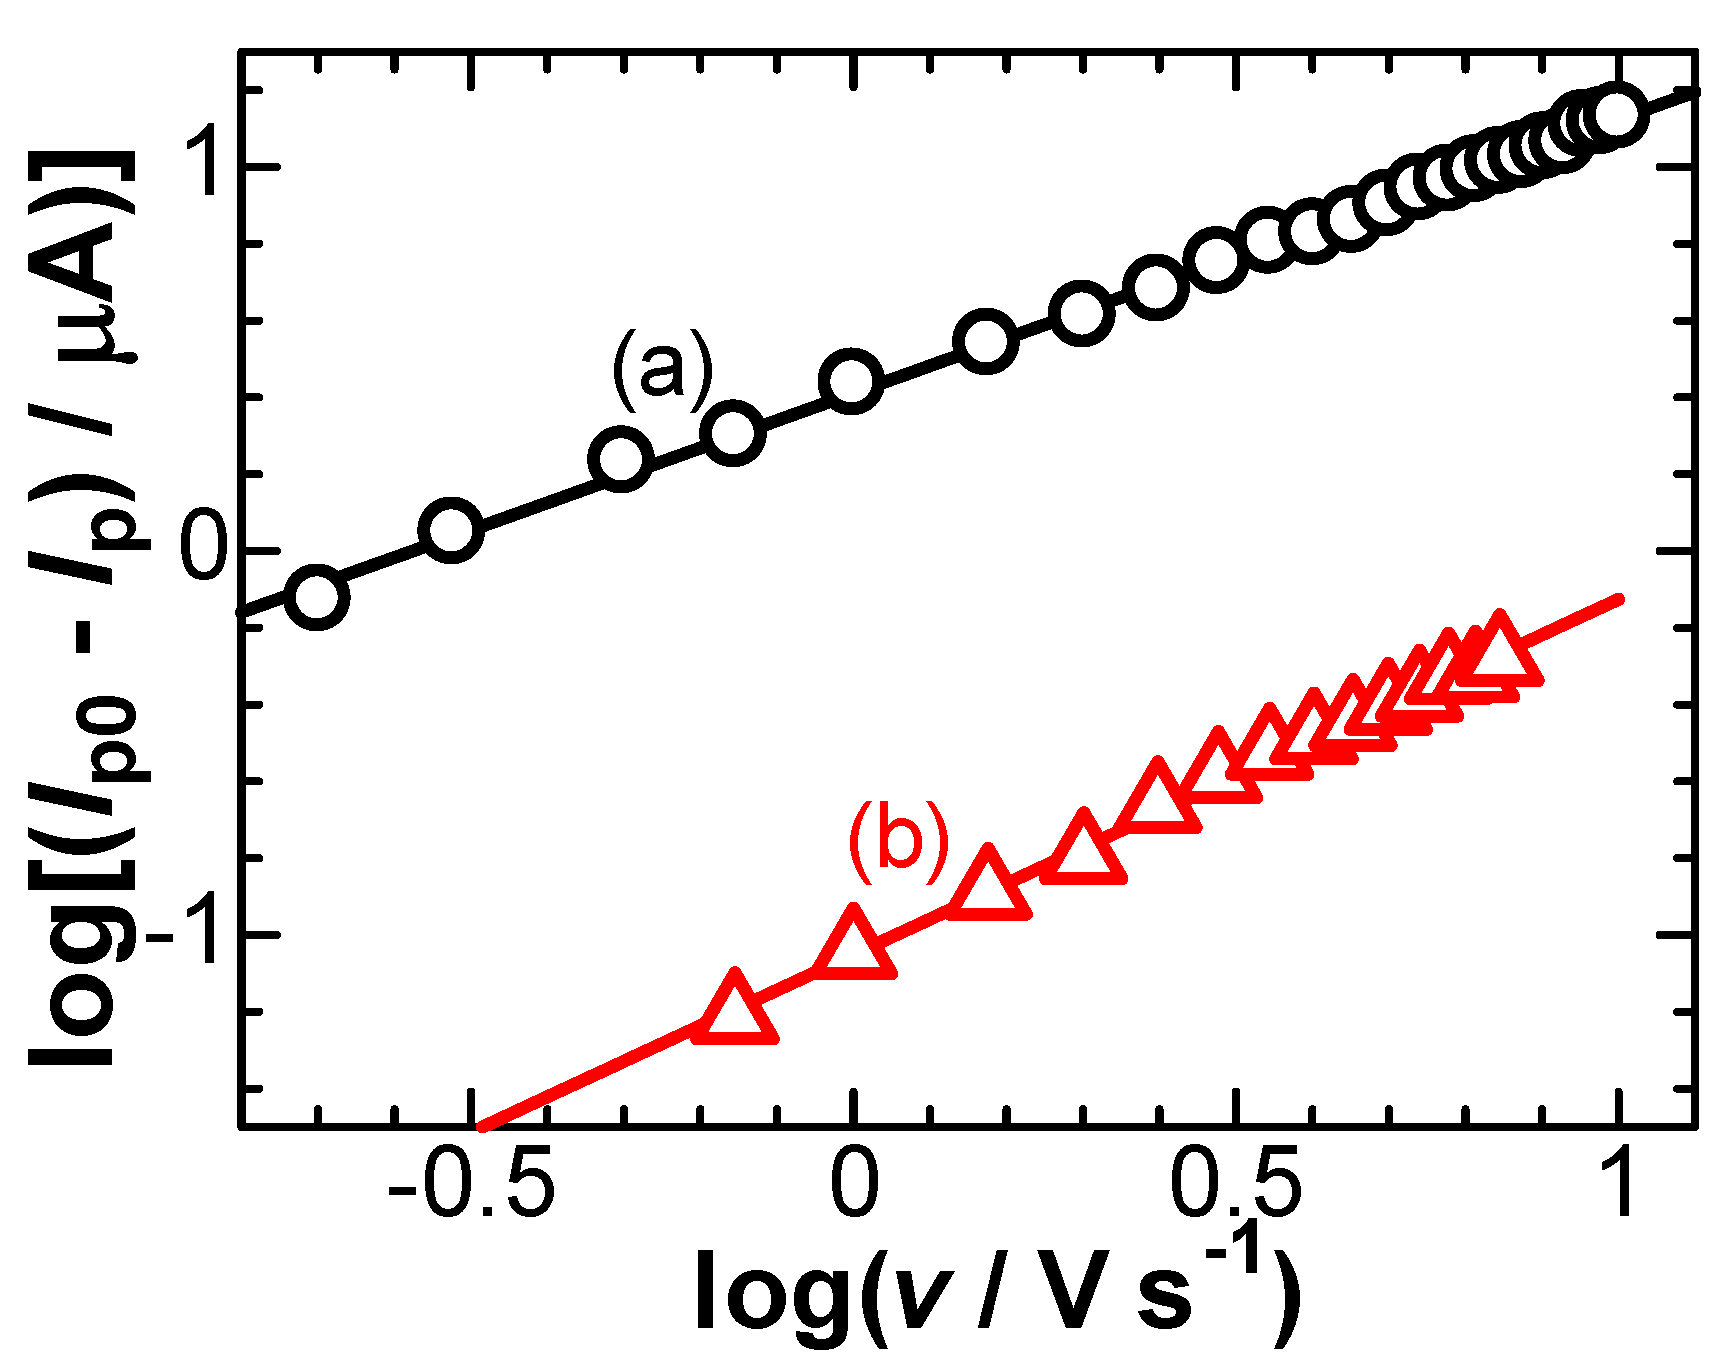
Figure 9a. The plot shows a line with the slope, 0.71, which is close to the theoretical value, 3/4, in
Table 2. The value of the slope suggests the control of the
IR-drop. On the other hand, the currents at the 0.03 mm wire in 0.1 M KCl (in
Figure 2d) did not contain any
IR-drop effect, as demonstrated in
Figure 3b. The logarithmic plots of
Ip0–
Ip vs.
v shows a line with slope of 0.92 in
Figure 9b. The value of the slope is close to unity, and hence it should belong to the negative capacitance.
Figure 1.
Voltammograms in 1.0 mM FcTMA + 5 mM KCl at the (A) Pt wire 0.5 mm in diameter and 1 mm long, (B) 1.6 mm disk Pt for v = (a) 0.03, (b) 0.1, (c) 0.3 and (d) 0.7 V s –1. The solid lines are connecting lines on the peaks, while the dashed lines are drawn from the solution resistance by ac-impedance.
Figure 2.
Logarithmic dependence of the solution resistance,
Rs on [KCl] at Pt wires (a, c) 0.5 mm and (b, d) 0.03 mm in diameter 1 mm in length.
Rs (a, b) were obtained by ac-impedance at the polarized potential, whereas (c, d) were obtained from slopes of lines connecting voltammetric peaks in
Figure 1.
Figure 3.
Variations of Ip against Ep at the 0.5 mm Pt wire electrode 1 mm long in the solution of 1.0 mM FcTMA + (a) 0.005 M and (b) 0.1 M KCl at 0.03 < v < 3 V s–1. The other plots were calculated from the Butler-Volmer typed kinetic equation for the k0 = (c) 0.01, (d) 0.005 and (e) 0.001 cm s-1 and α = 0.5.
Figure 4.
Illustration of generation of a dipole with Cl- just after the oxidation of the ferrocenyl molecule.
Figure 4.
Illustration of generation of a dipole with Cl- just after the oxidation of the ferrocenyl molecule.
Figure 5.
Voltammograms computed from Equation (5) for ρ = (a) 0, (b) 2, (c) 4, (d) 6, (e) 8 and (f) 10.
Figure 5.
Voltammograms computed from Equation (5) for ρ = (a) 0, (b) 2, (c) 4, (d) 6, (e) 8 and (f) 10.
Figure 6.
Variations of the peak potential by (a) the IR-drop with the resistance parameter, (b) the intuitive IR-drop by Ip0Rs, (c) the tangent line of (a) at ρ = 0, (d) the negative capacitance with (Crx/c*)(v/RTFD)1/2, and (e) experimental variations of Ep with ρ where Rs = 2.7 kΩ in 1mM FcTMA + 5 mM KCl at the 0.5 mm wire electrode.
Figure 7.
Variations of (a) the peak current (b) the ratio of effective scan rate and (c) the experimental peak current with the dimensionless resistance ρ at (circles) Rs=2.7 kΩ and (triangles) Rs= 80 Ω.
Figure 7.
Variations of (a) the peak current (b) the ratio of effective scan rate and (c) the experimental peak current with the dimensionless resistance ρ at (circles) Rs=2.7 kΩ and (triangles) Rs= 80 Ω.
Figure 8.
Variations of the fraction of the IR-drop, XIR (= (Ip0 – Ip)/Ip0), with that of the negative capacitance, XNC, for A = (a) 0.01, (b) 0.04, (c) 0.09 and (d) 0.16 mm2 at v = 0.1 V s–1, κ = 0.133 S m–1 corresponding to [KCl] = 10 mM, and Crx = 50 μF cm–2.
Figure 8.
Variations of the fraction of the IR-drop, XIR (= (Ip0 – Ip)/Ip0), with that of the negative capacitance, XNC, for A = (a) 0.01, (b) 0.04, (c) 0.09 and (d) 0.16 mm2 at v = 0.1 V s–1, κ = 0.133 S m–1 corresponding to [KCl] = 10 mM, and Crx = 50 μF cm–2.
Figure 9.
Logarithmic variation of Ip0-Ip with v in the solution of (a) 1 mM FcTMA + 0.005 M KCl at the 0.5 mm wire electrode (b) 1 mM FcTMA + 0.1 M KCl at the 0.03 mm wire electrode.
Figure 9.
Logarithmic variation of Ip0-Ip with v in the solution of (a) 1 mM FcTMA + 0.005 M KCl at the 0.5 mm wire electrode (b) 1 mM FcTMA + 0.1 M KCl at the 0.03 mm wire electrode.
Table 1.
Advantages and risks for three classes for the levels
Table 1.
Advantages and risks for three classes for the levels
| Range of v
|
Advantages |
Risks |
(I)
< 0.2 V s-1
|
Small background currents
Easy extraction of diffusion currents
Usage of low-cost potentiostats
Possibility of theoretical analysis |
Misleading kinetic reaction mechanisms
Time consumption |
(II)
< 5 V s-1
|
Possibility of subtraction of IR-drop
Possibility of determining reaction mechanisms
Evaluation of heterogeneous kinetics
Comparison of the results with those by other rapid electrochemical methods
Commercially available potentiostats |
Discussion required for peak shifts
Deformation of waveform
Limitation to microelectrodes in order to prevent large currents |
(III)
< 500 V s-1
|
Detection of kinetics with milli-second orders such as neurotransmitters |
Empirical search for detecting conditions
A loss of theoretical support |
Table 2.
Variations of Ep and Ip0- Ip with four variables.
Table 2.
Variations of Ep and Ip0- Ip with four variables.
| variables |
Ep
|
Ip0- Ip
|
| |
IR |
NC |
IR |
NC |
|
c* |
c* |
1 |
c*3/2
|
c* |
|
A(disk) |
A1/2
|
1 |
A5/4
|
A |
| v |
v1/2
|
v1/2
|
v3/4
|
v |
|
Rs
|
Rs
|
1 |
Rs1/2
|
1 |
