Submitted:
19 August 2023
Posted:
22 August 2023
You are already at the latest version
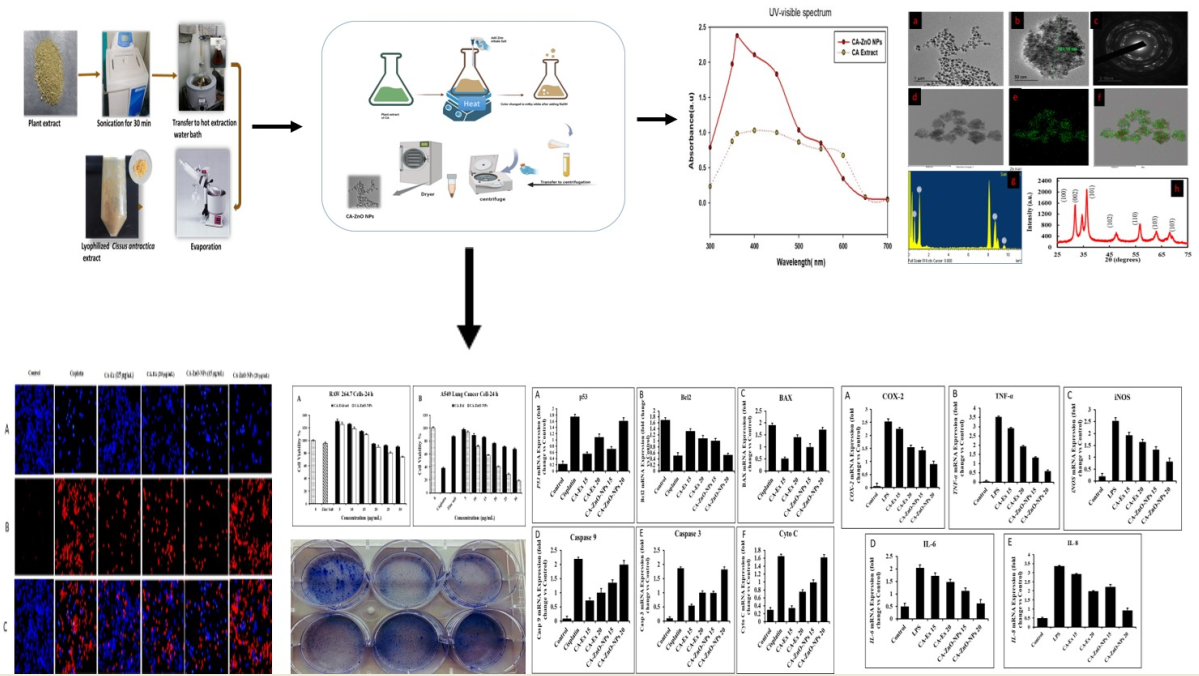
Abstract
Keywords:
1. Introduction
2. Materials and Methods
2.1. Chemicals
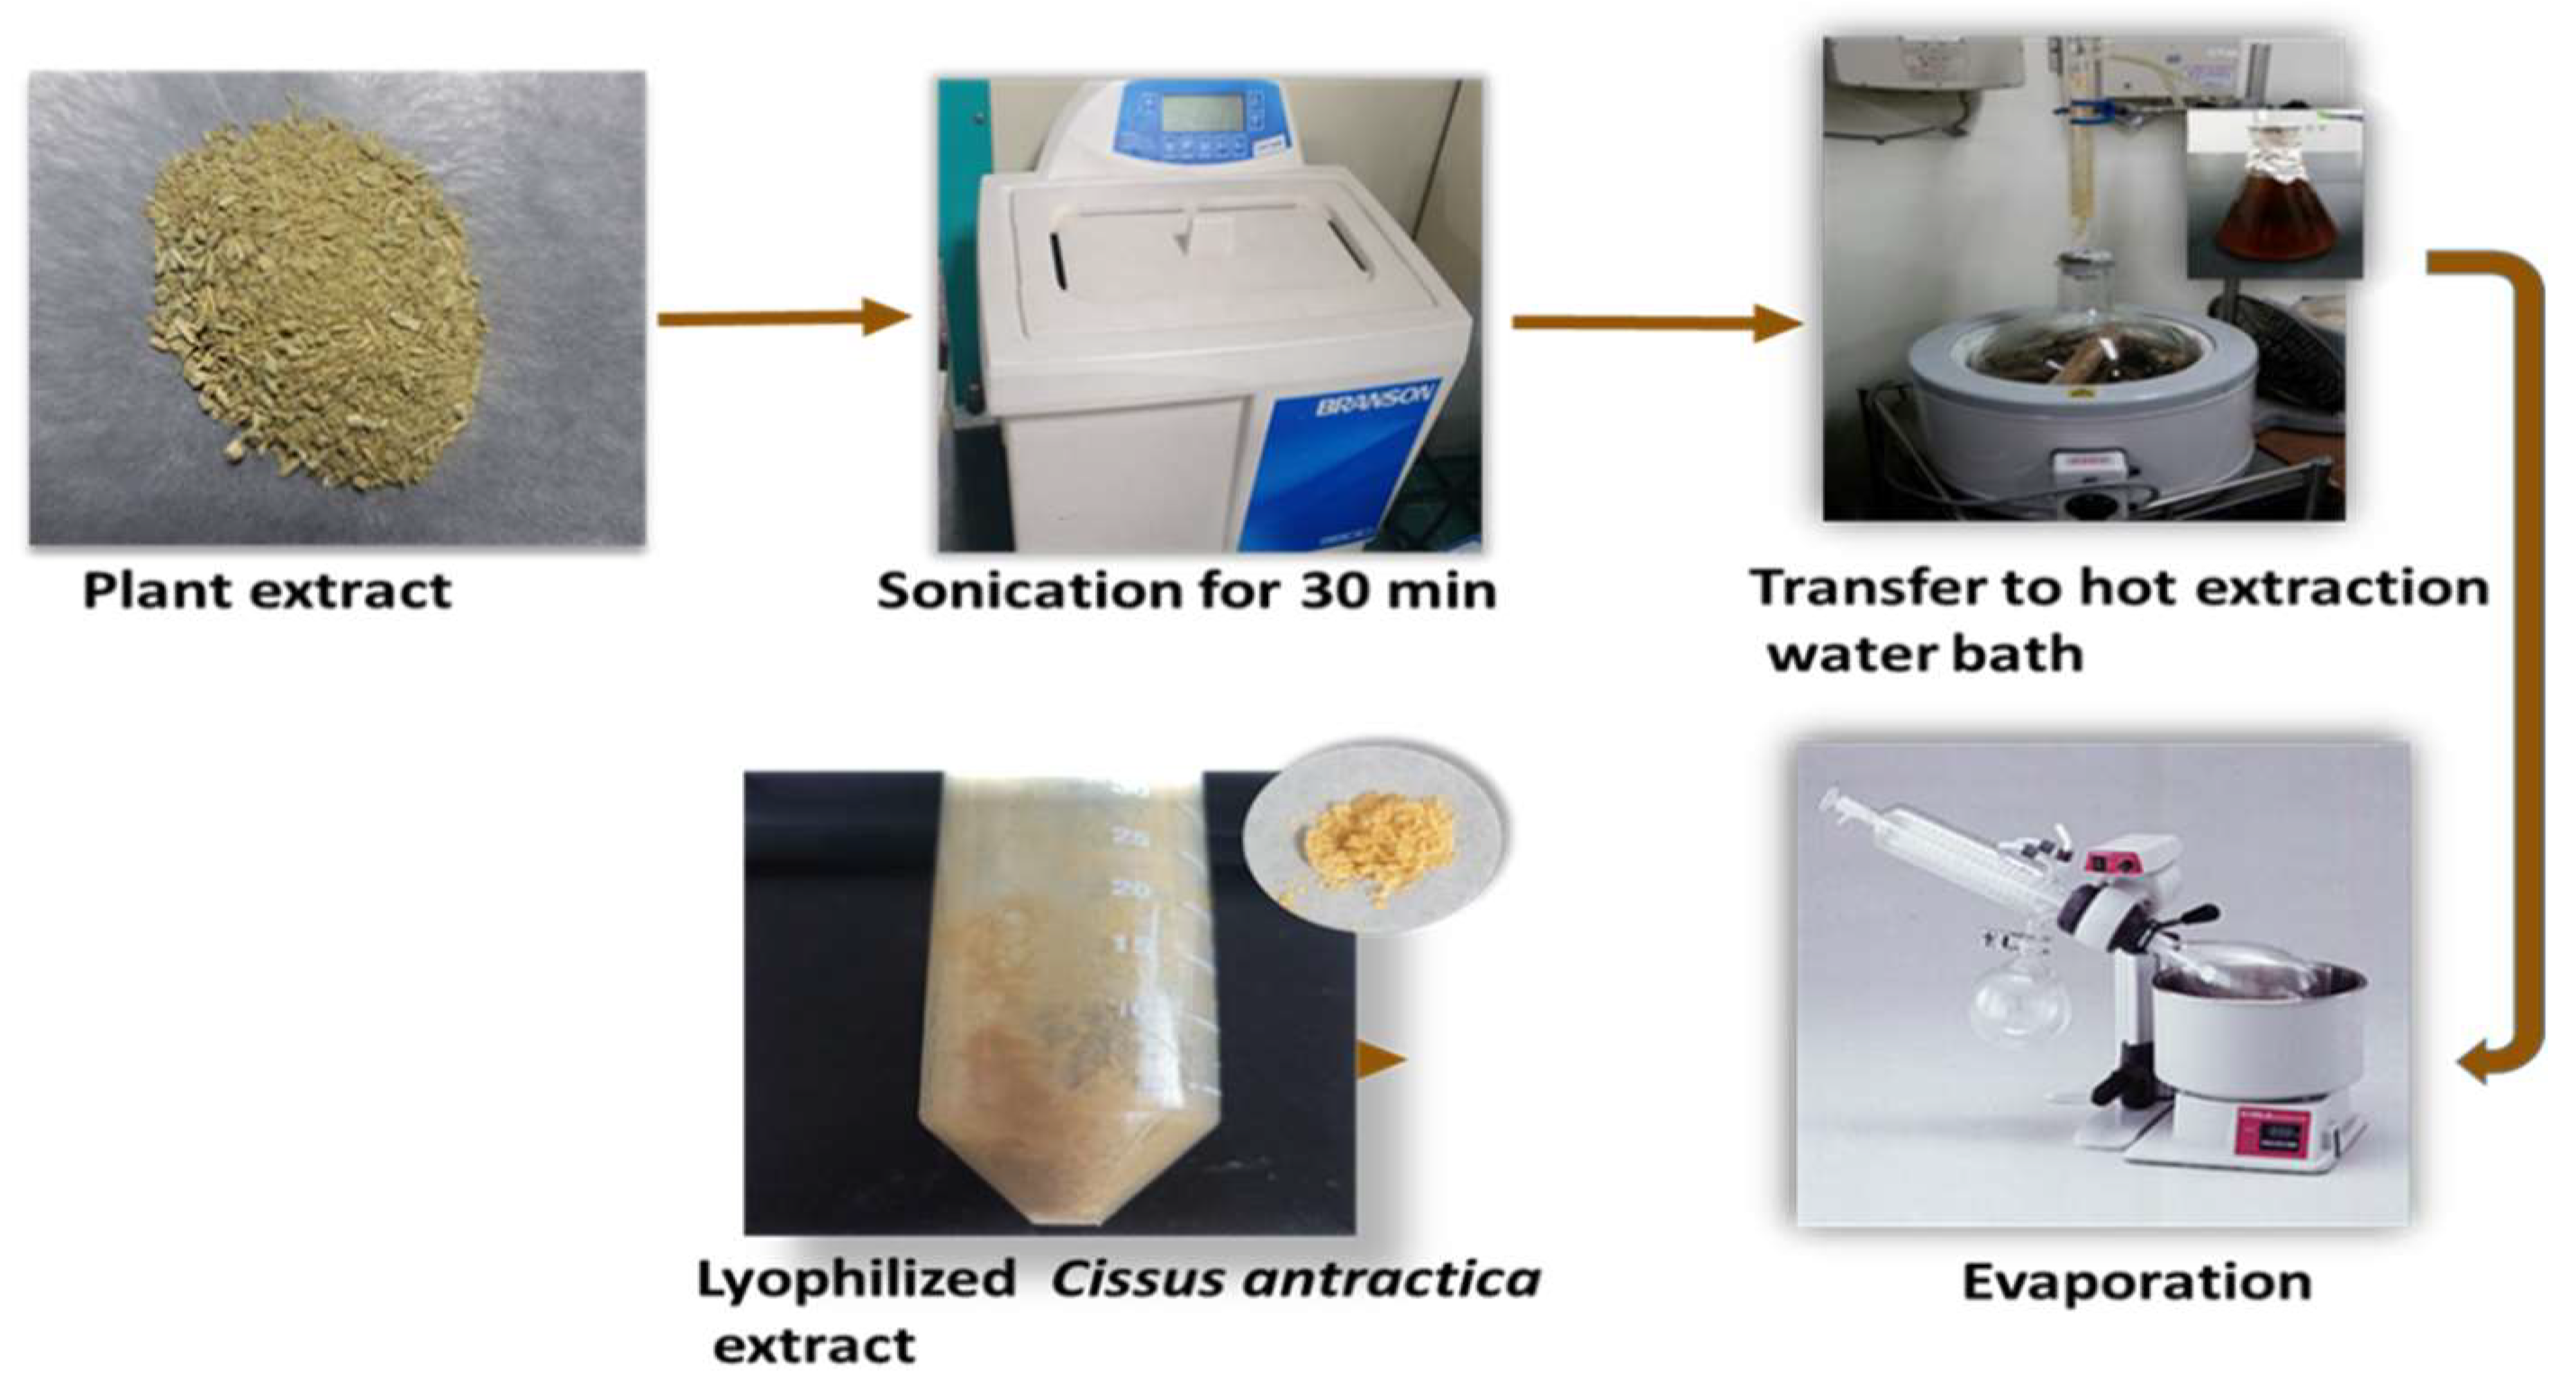
2.2. Preparation of Cissus antractica water extract
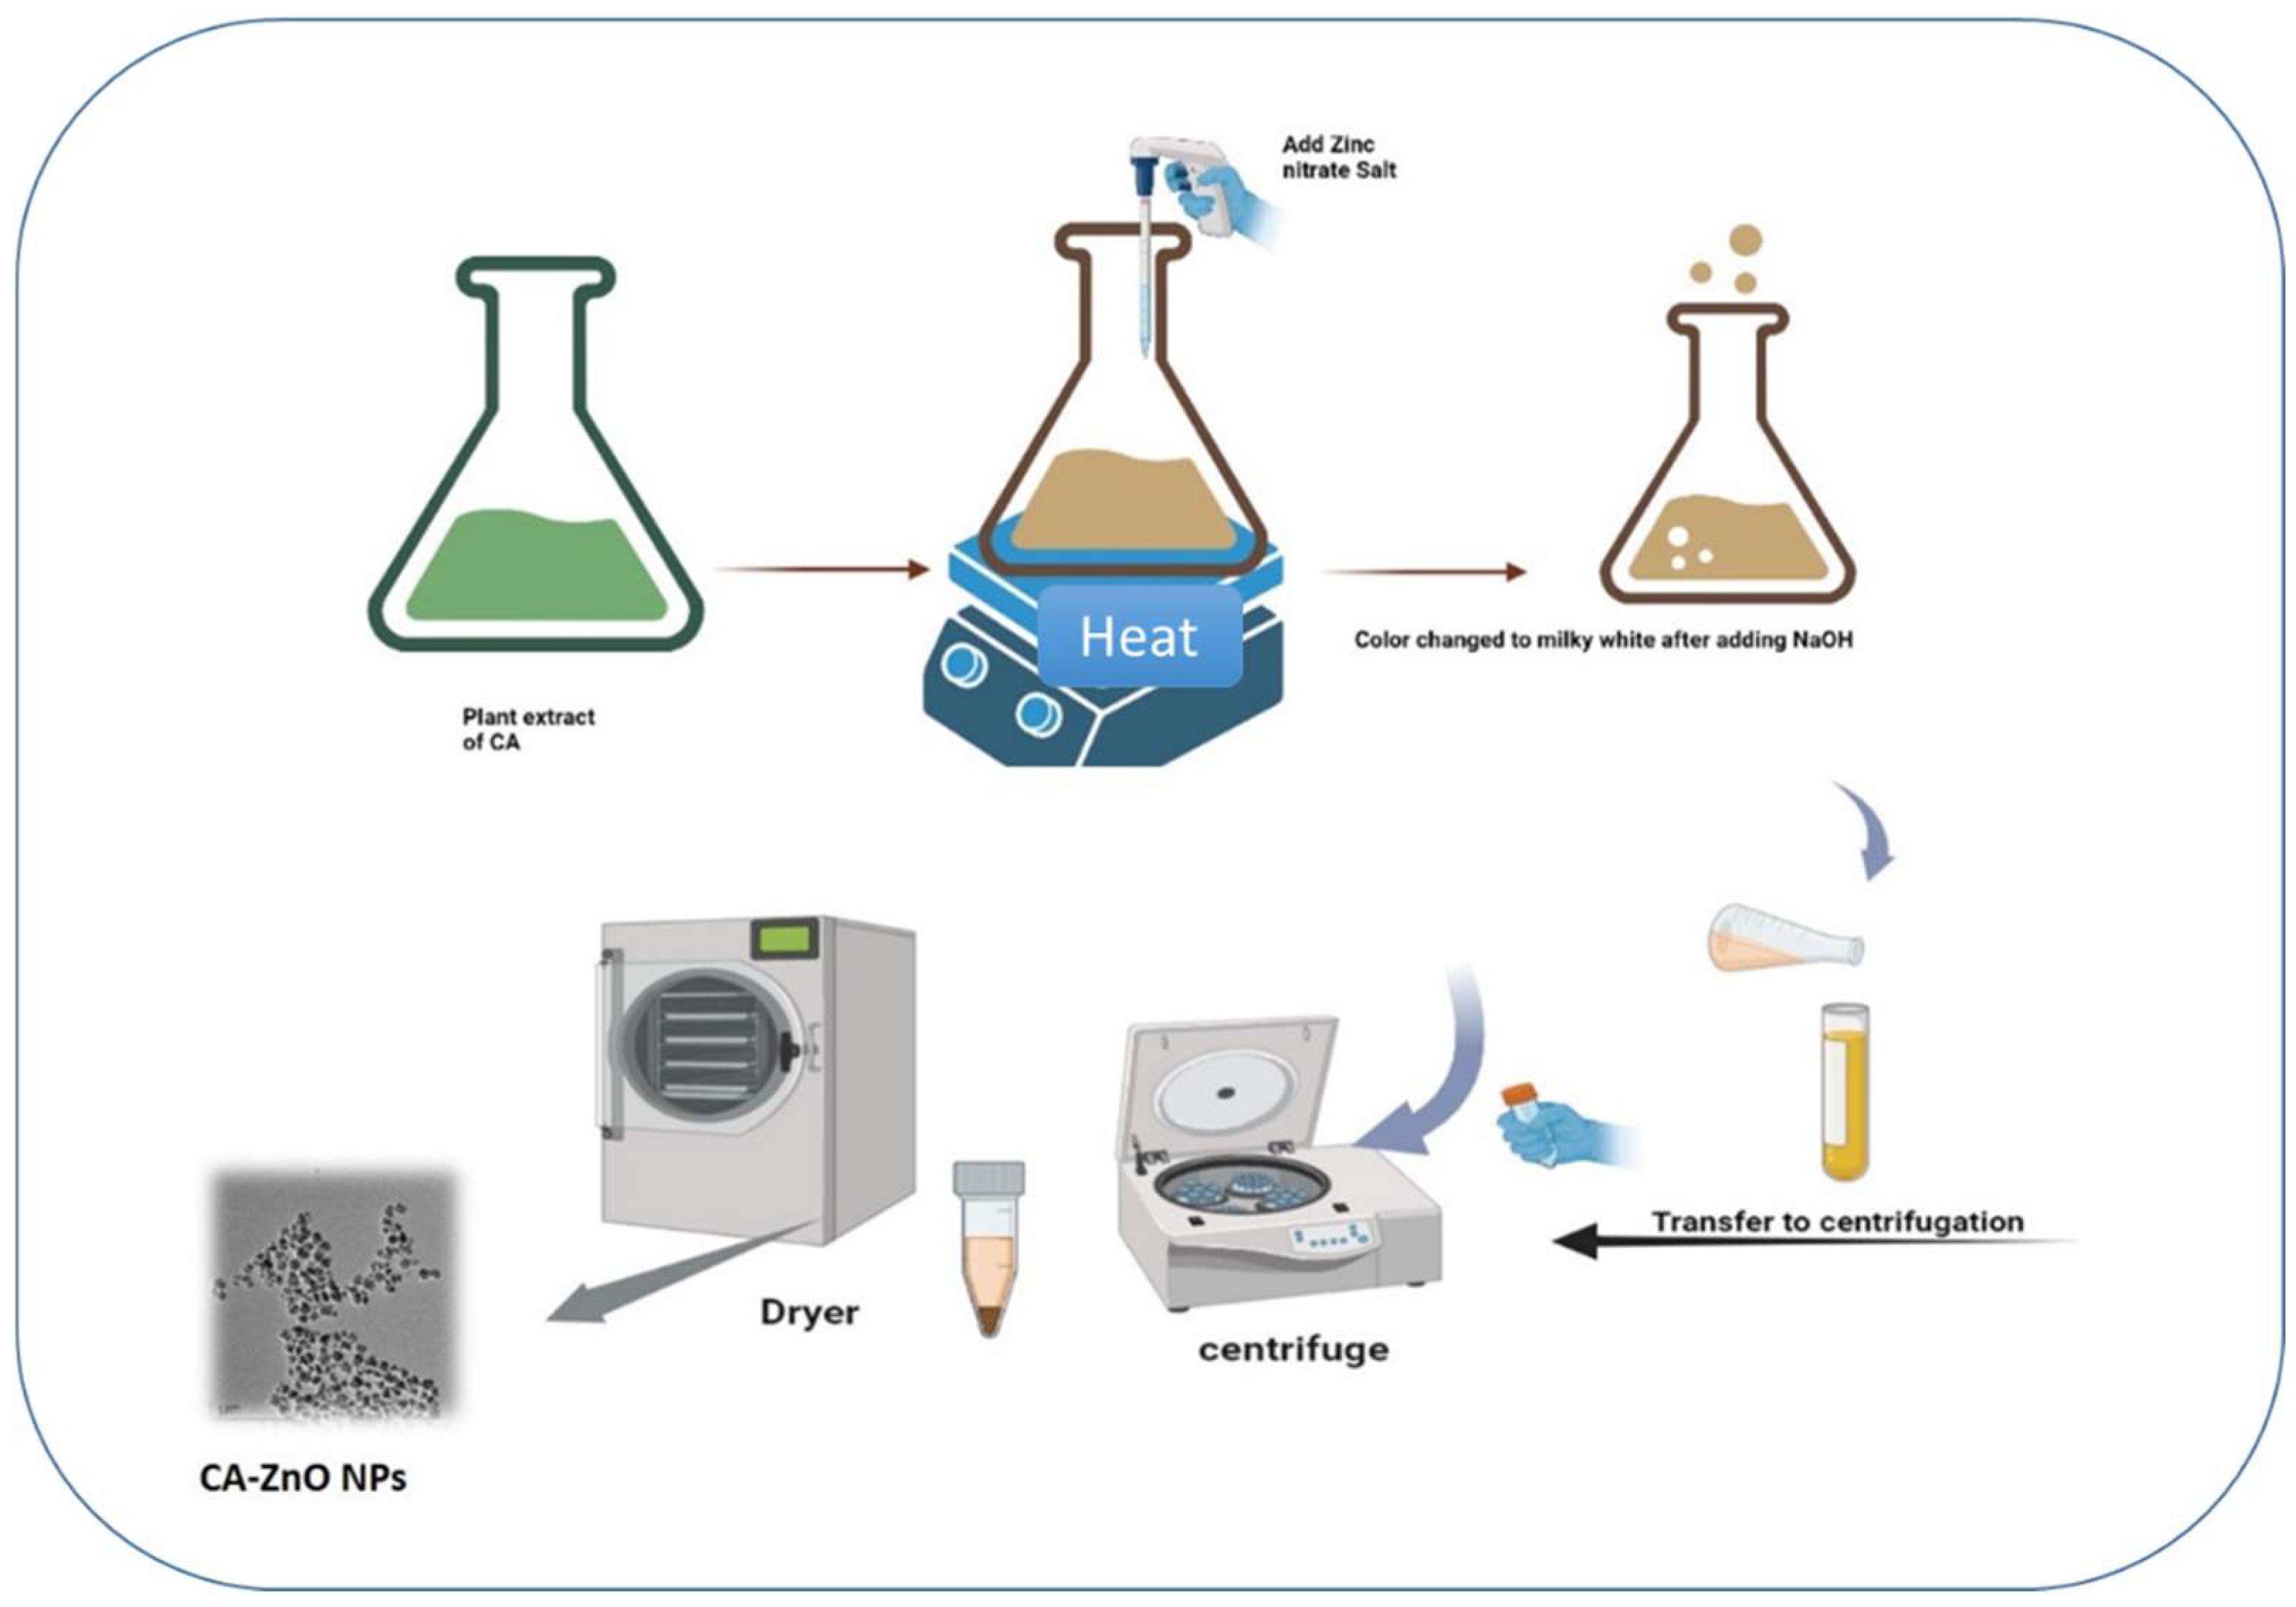
2.3. ZnO NPs using co-precipitation method
2.4. Cell culture
2.5. Cytotoxicity Assay
2.6. Reactive Oxygen Species (ROS) Assay
2.7. Wound-Healing Assay
2.8. Hoechst staining
2.9. PI staining
2.10. Quantitative Reverse Transcription (qRT-PCR)
3. Results and Discussion
3.1. Synthesis of CA-ZnNps
3.2. Characterization of CA-ZnONps
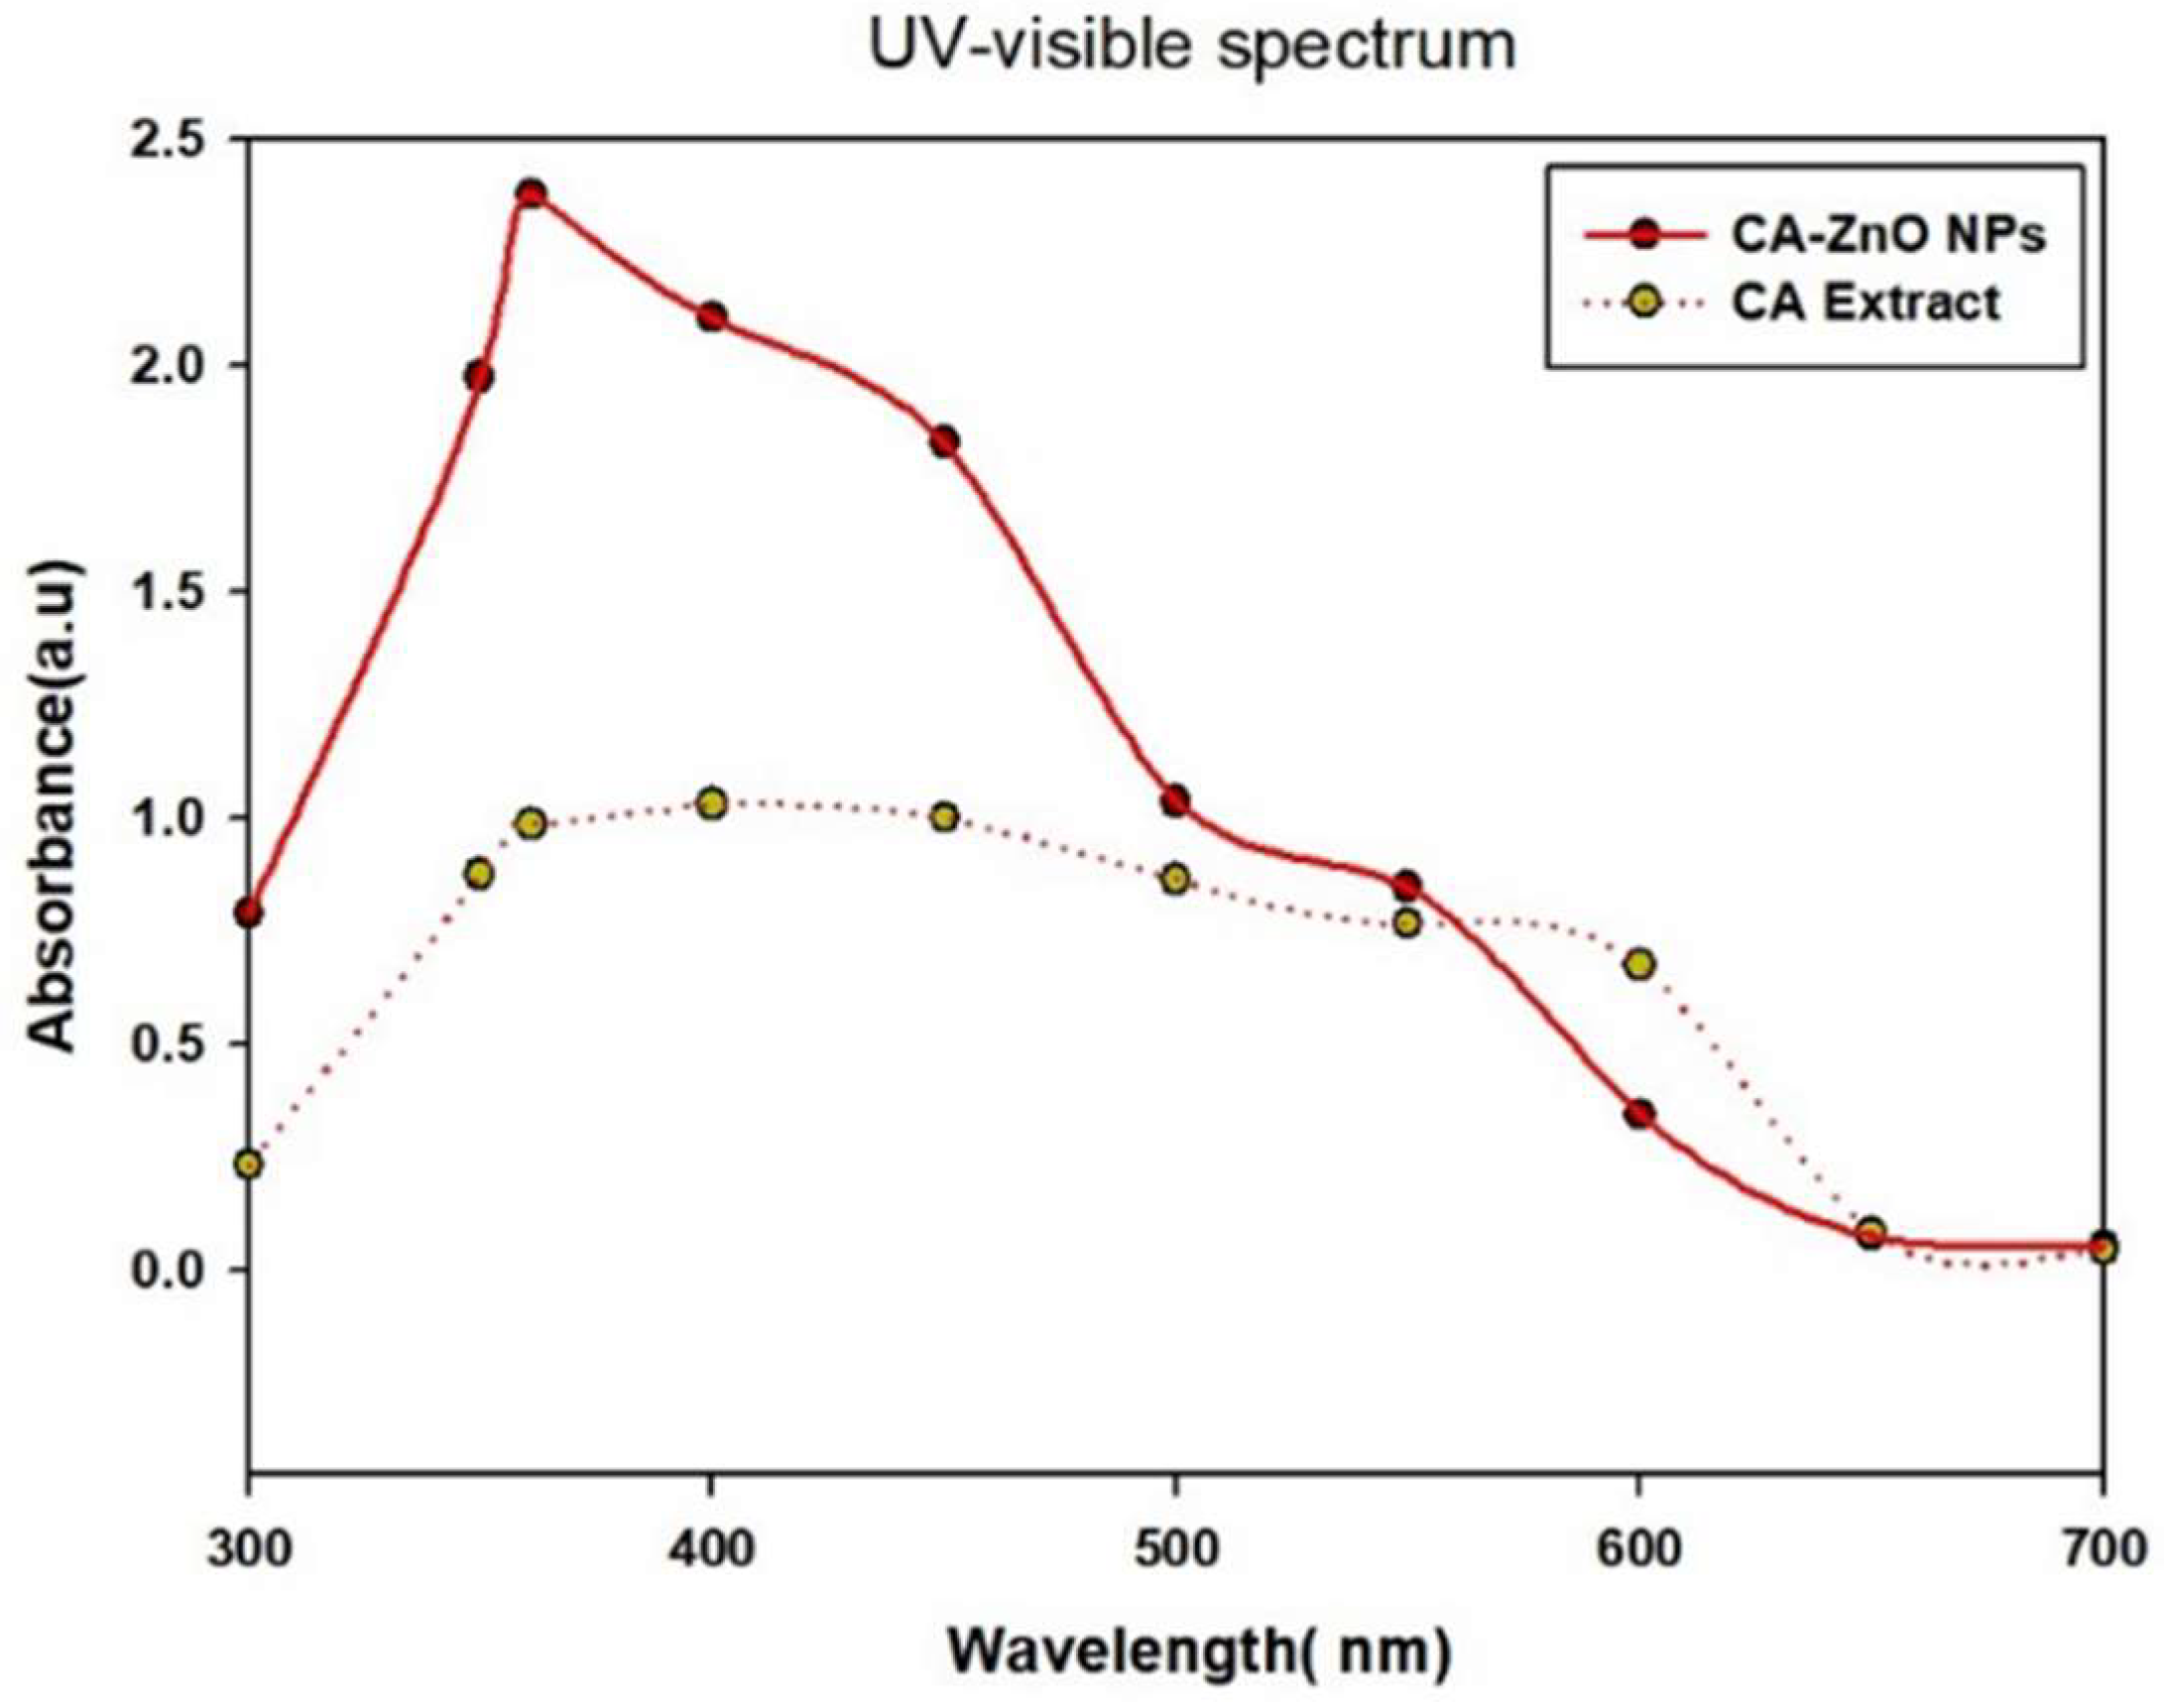
3.3. UV-Vis spectral analysis
3.4. FE-TEM and EDX analysis
3.5. Fourier Transform-Infrared (FT-IR) spectroscopy analysis
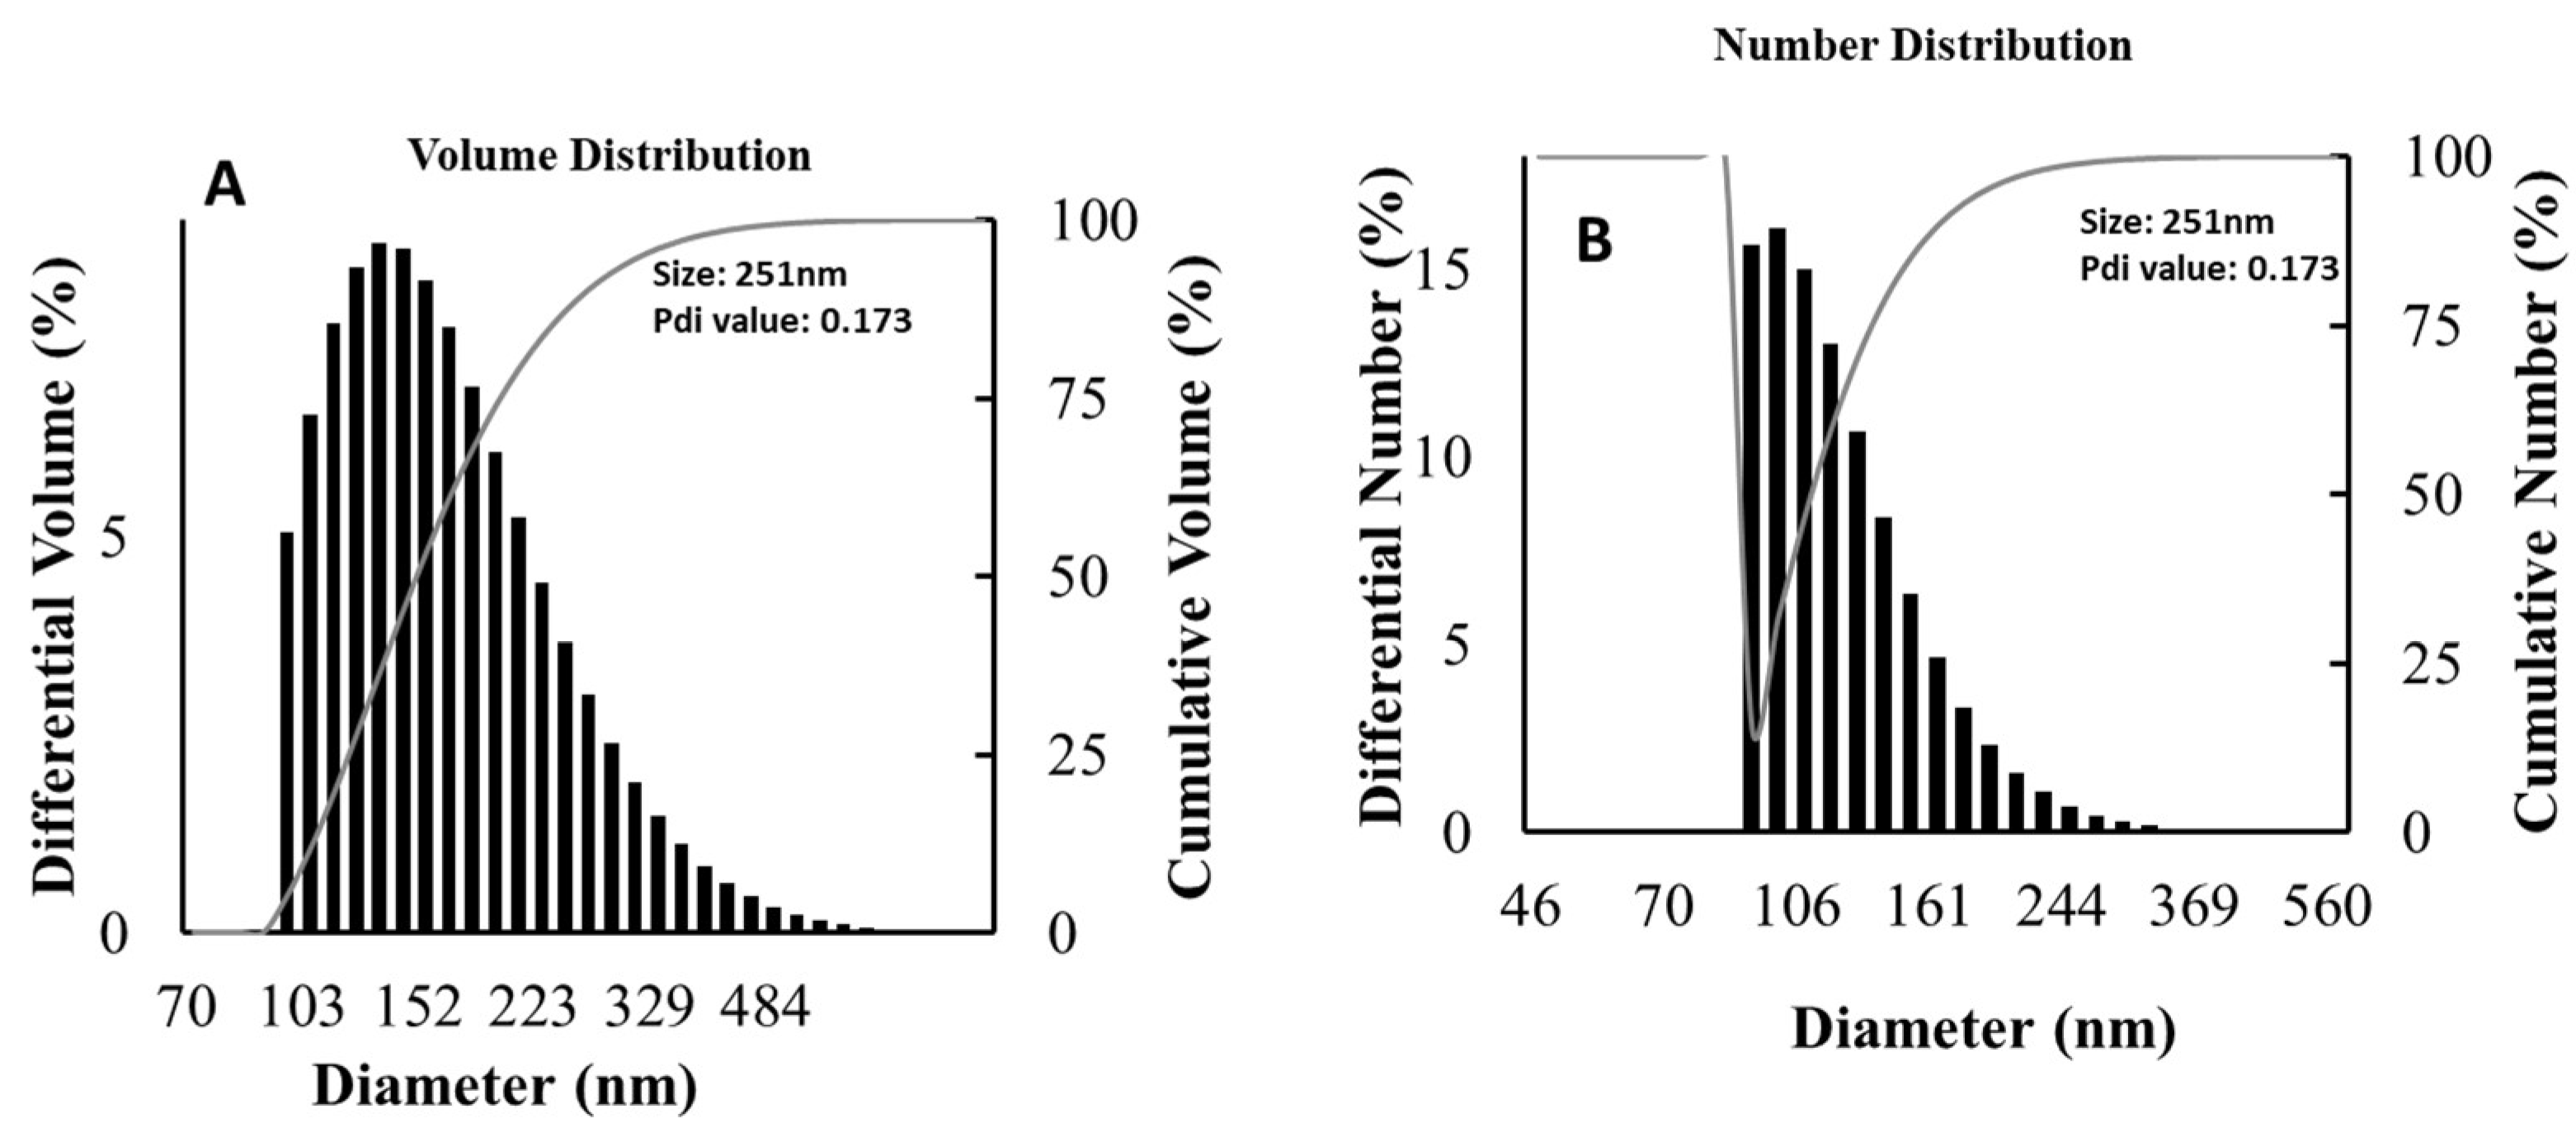
3.6. Particle Size Distribution Analysis
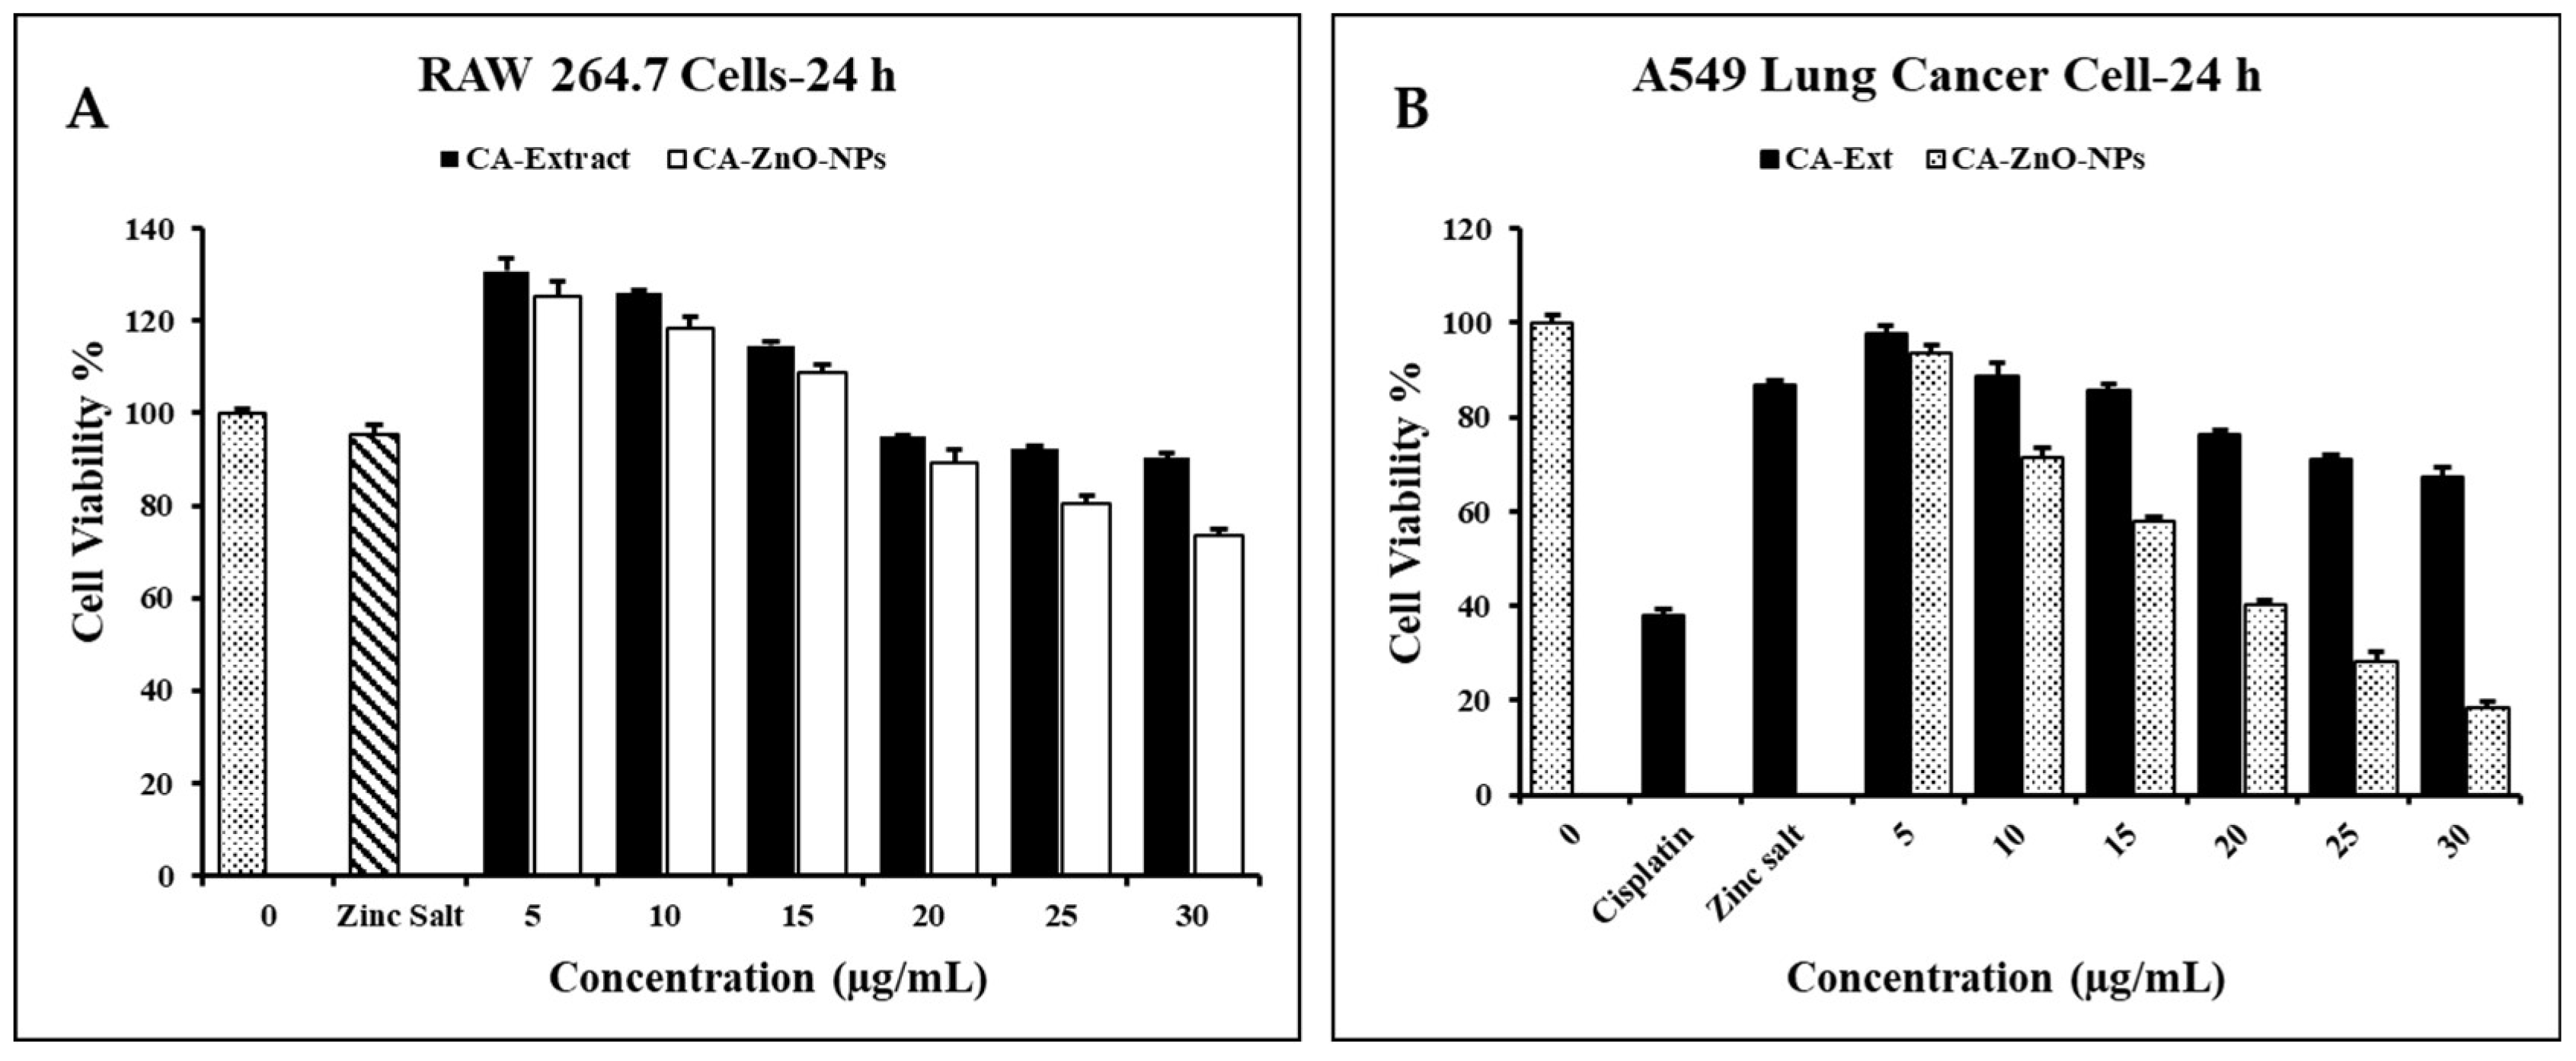
3.7. Evaluation of Cell Cytotoxicity
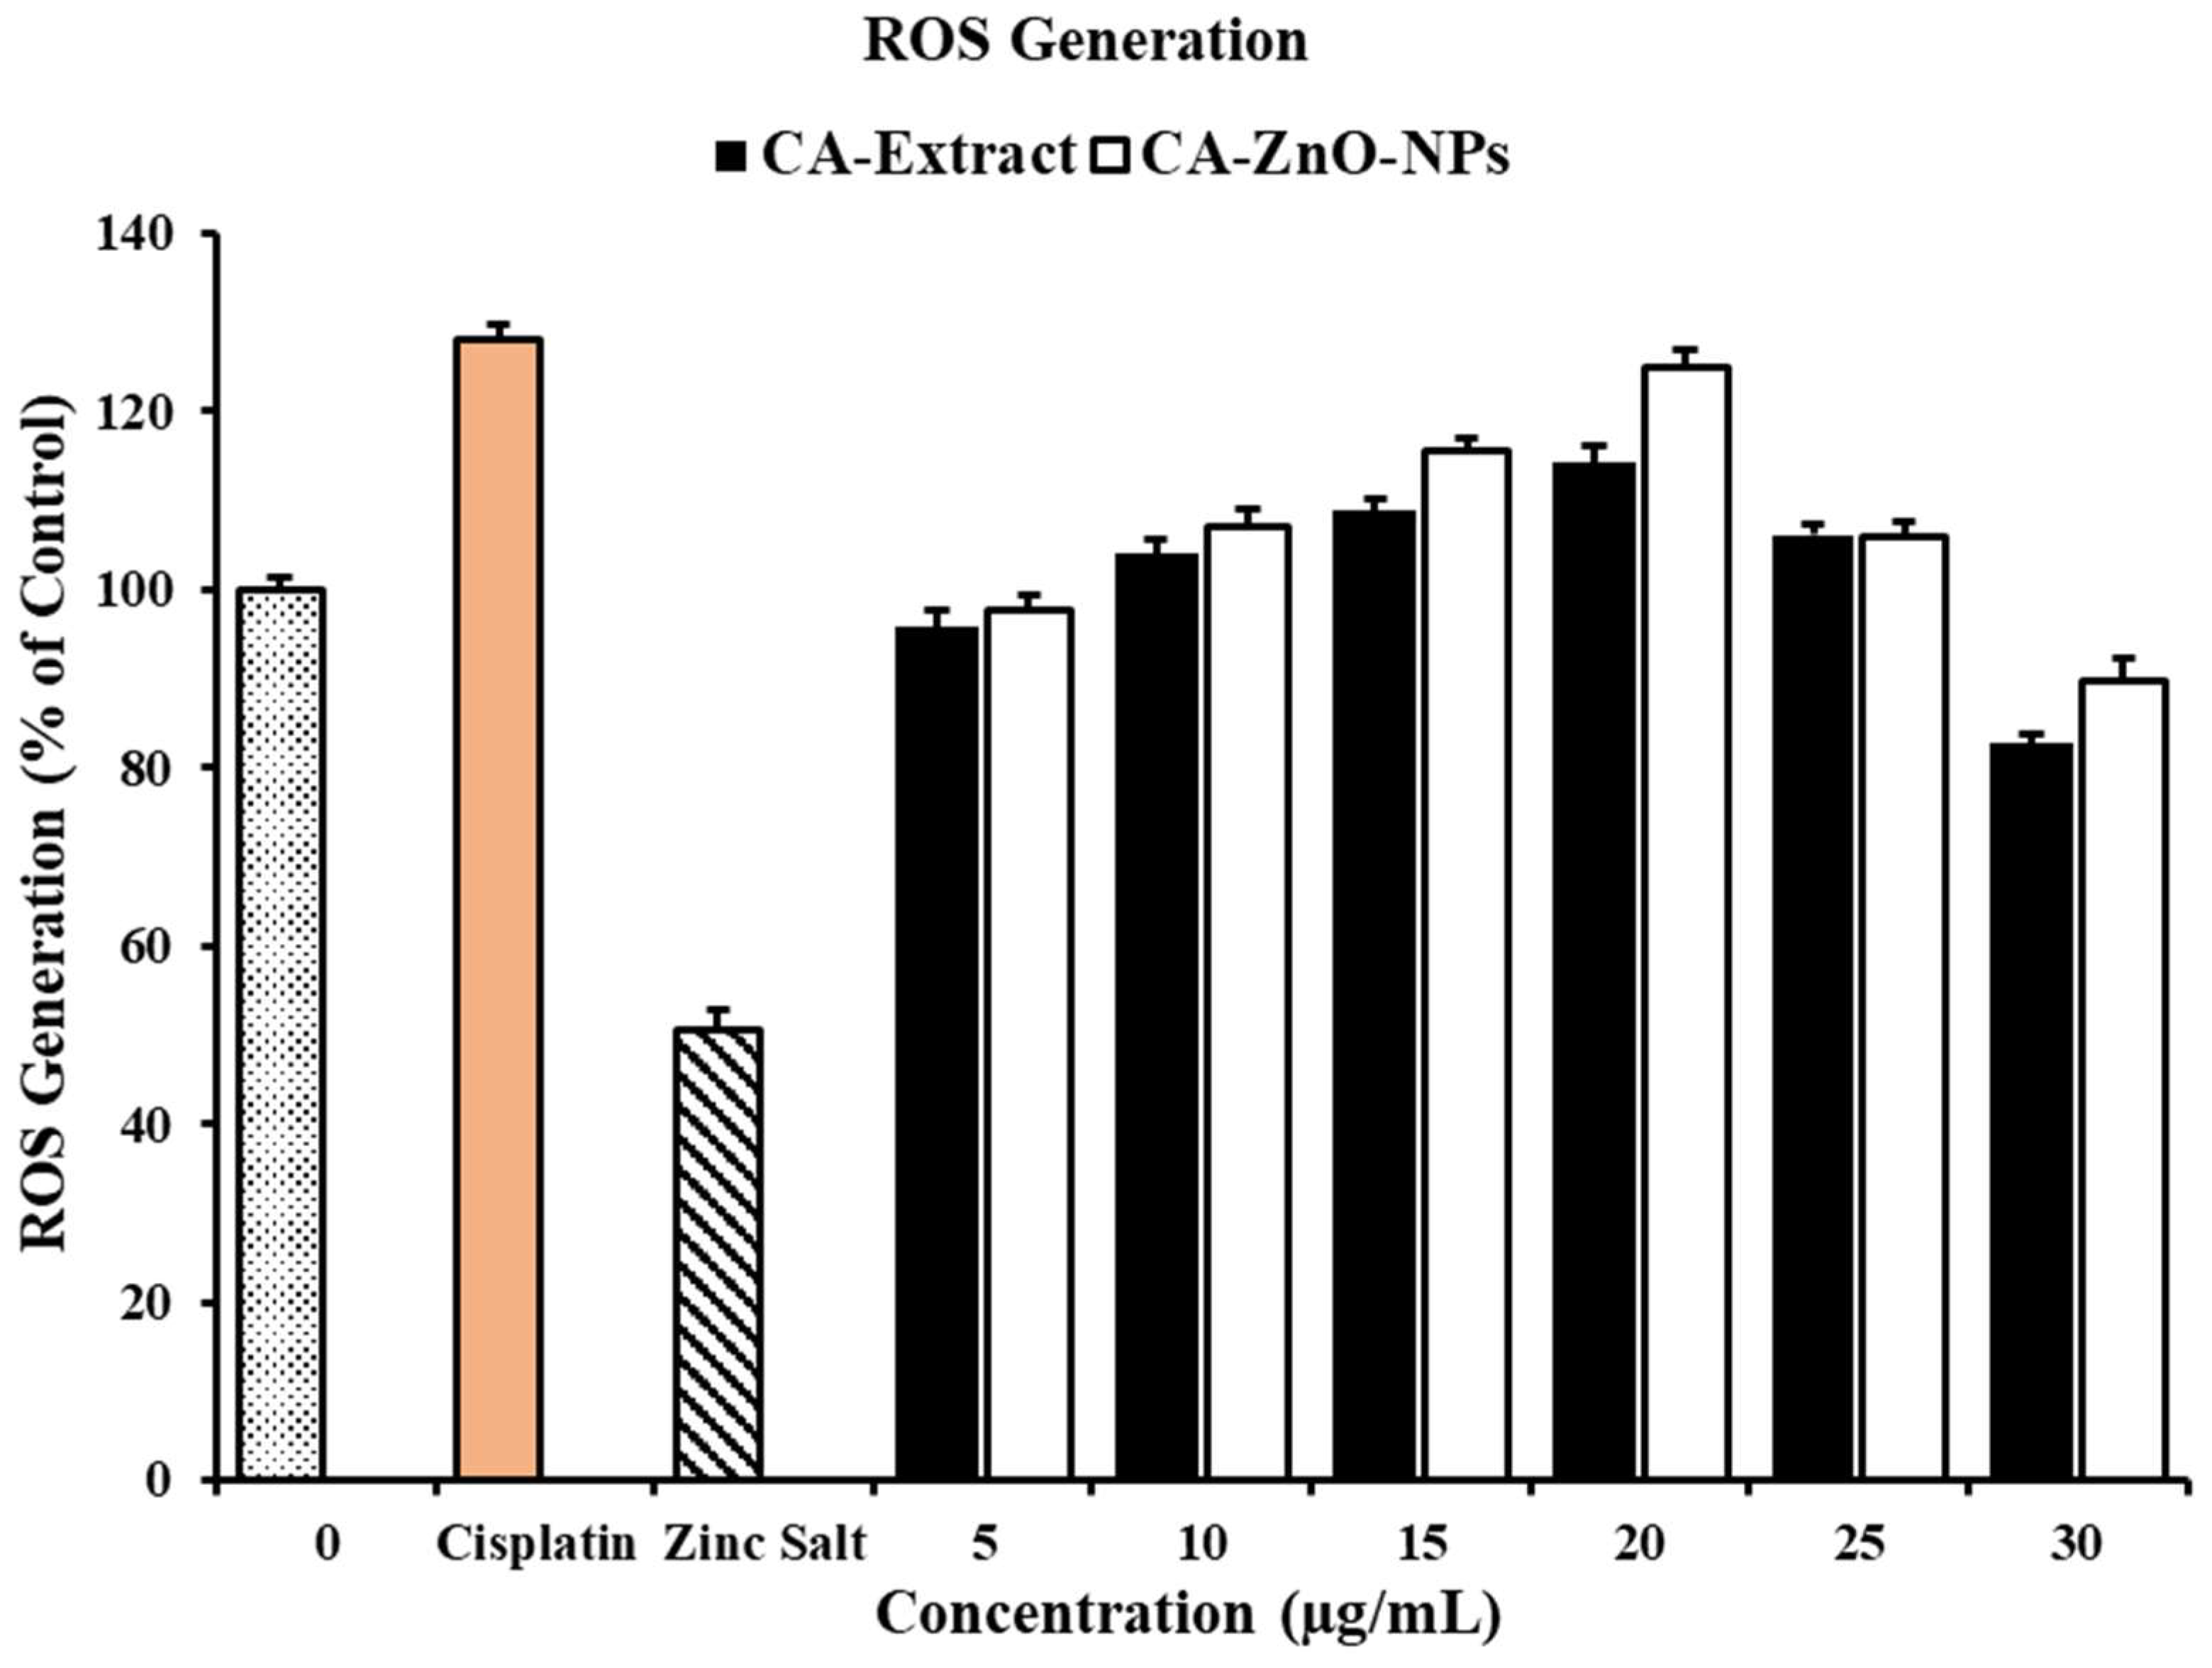
3.8. In Vitro ROS Induced by on CA-ZnO-NPs Cancer Cells
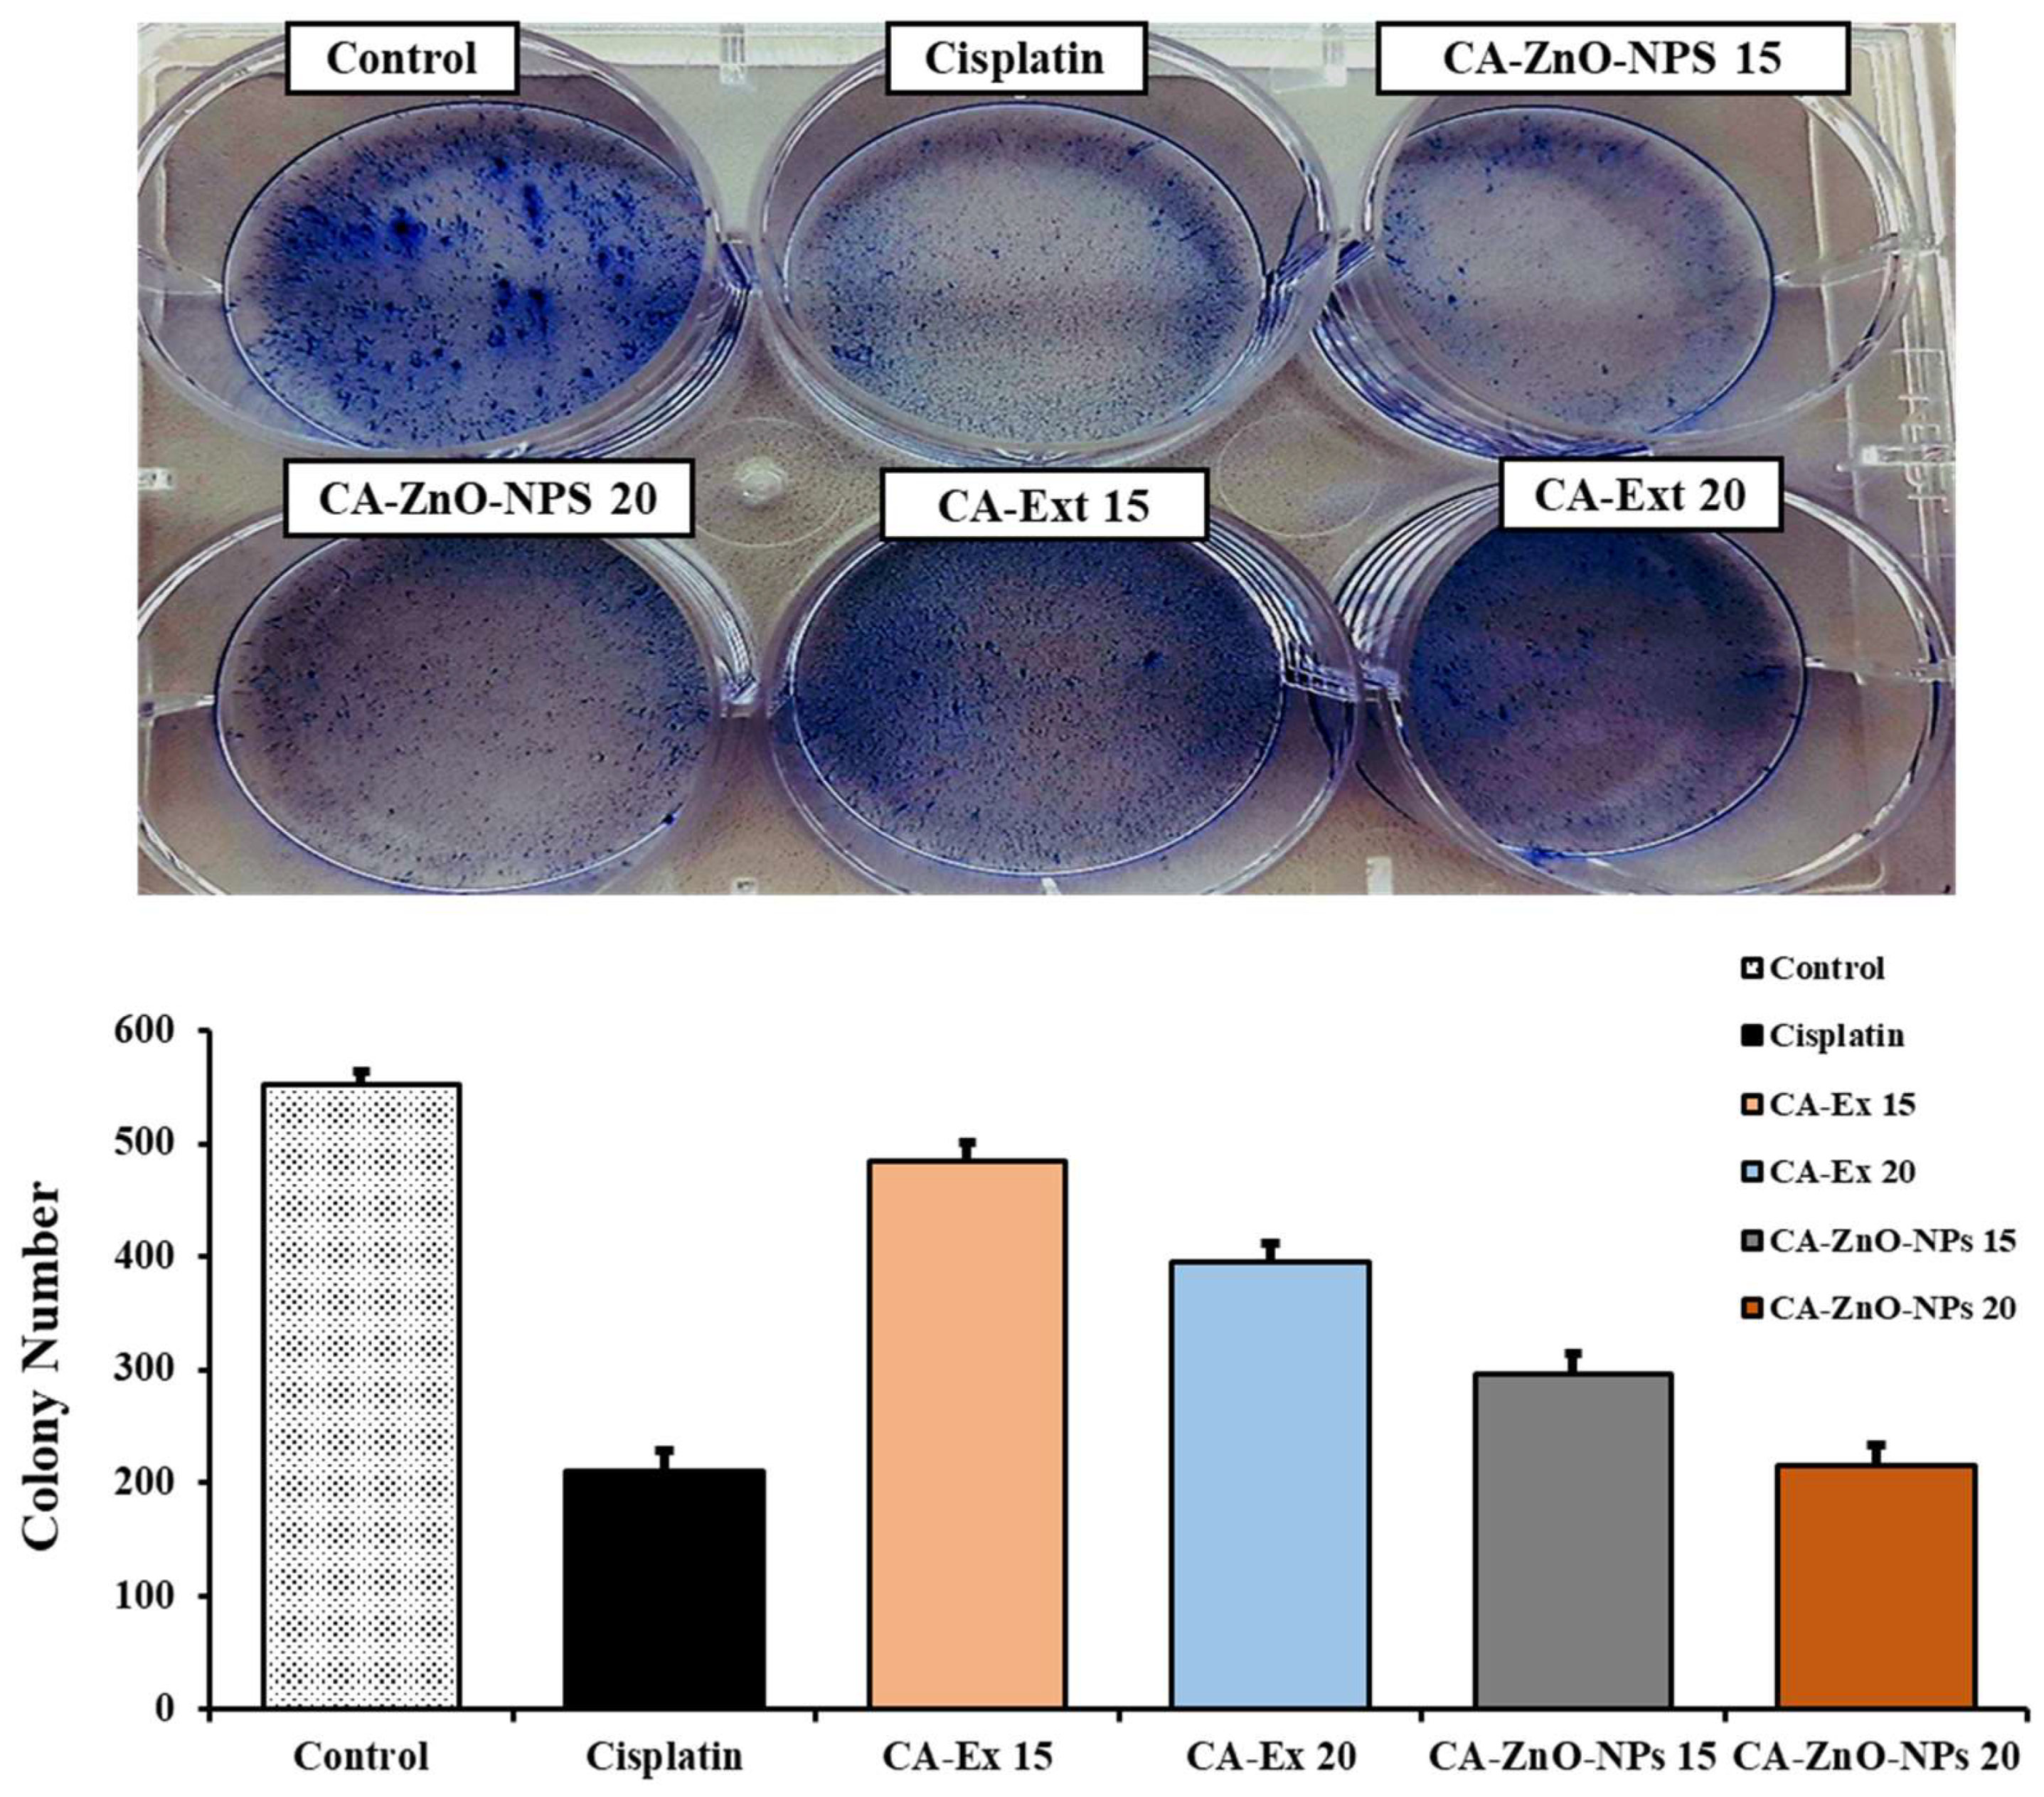
3.9. Inhibition of Colony Formation on cancer cells
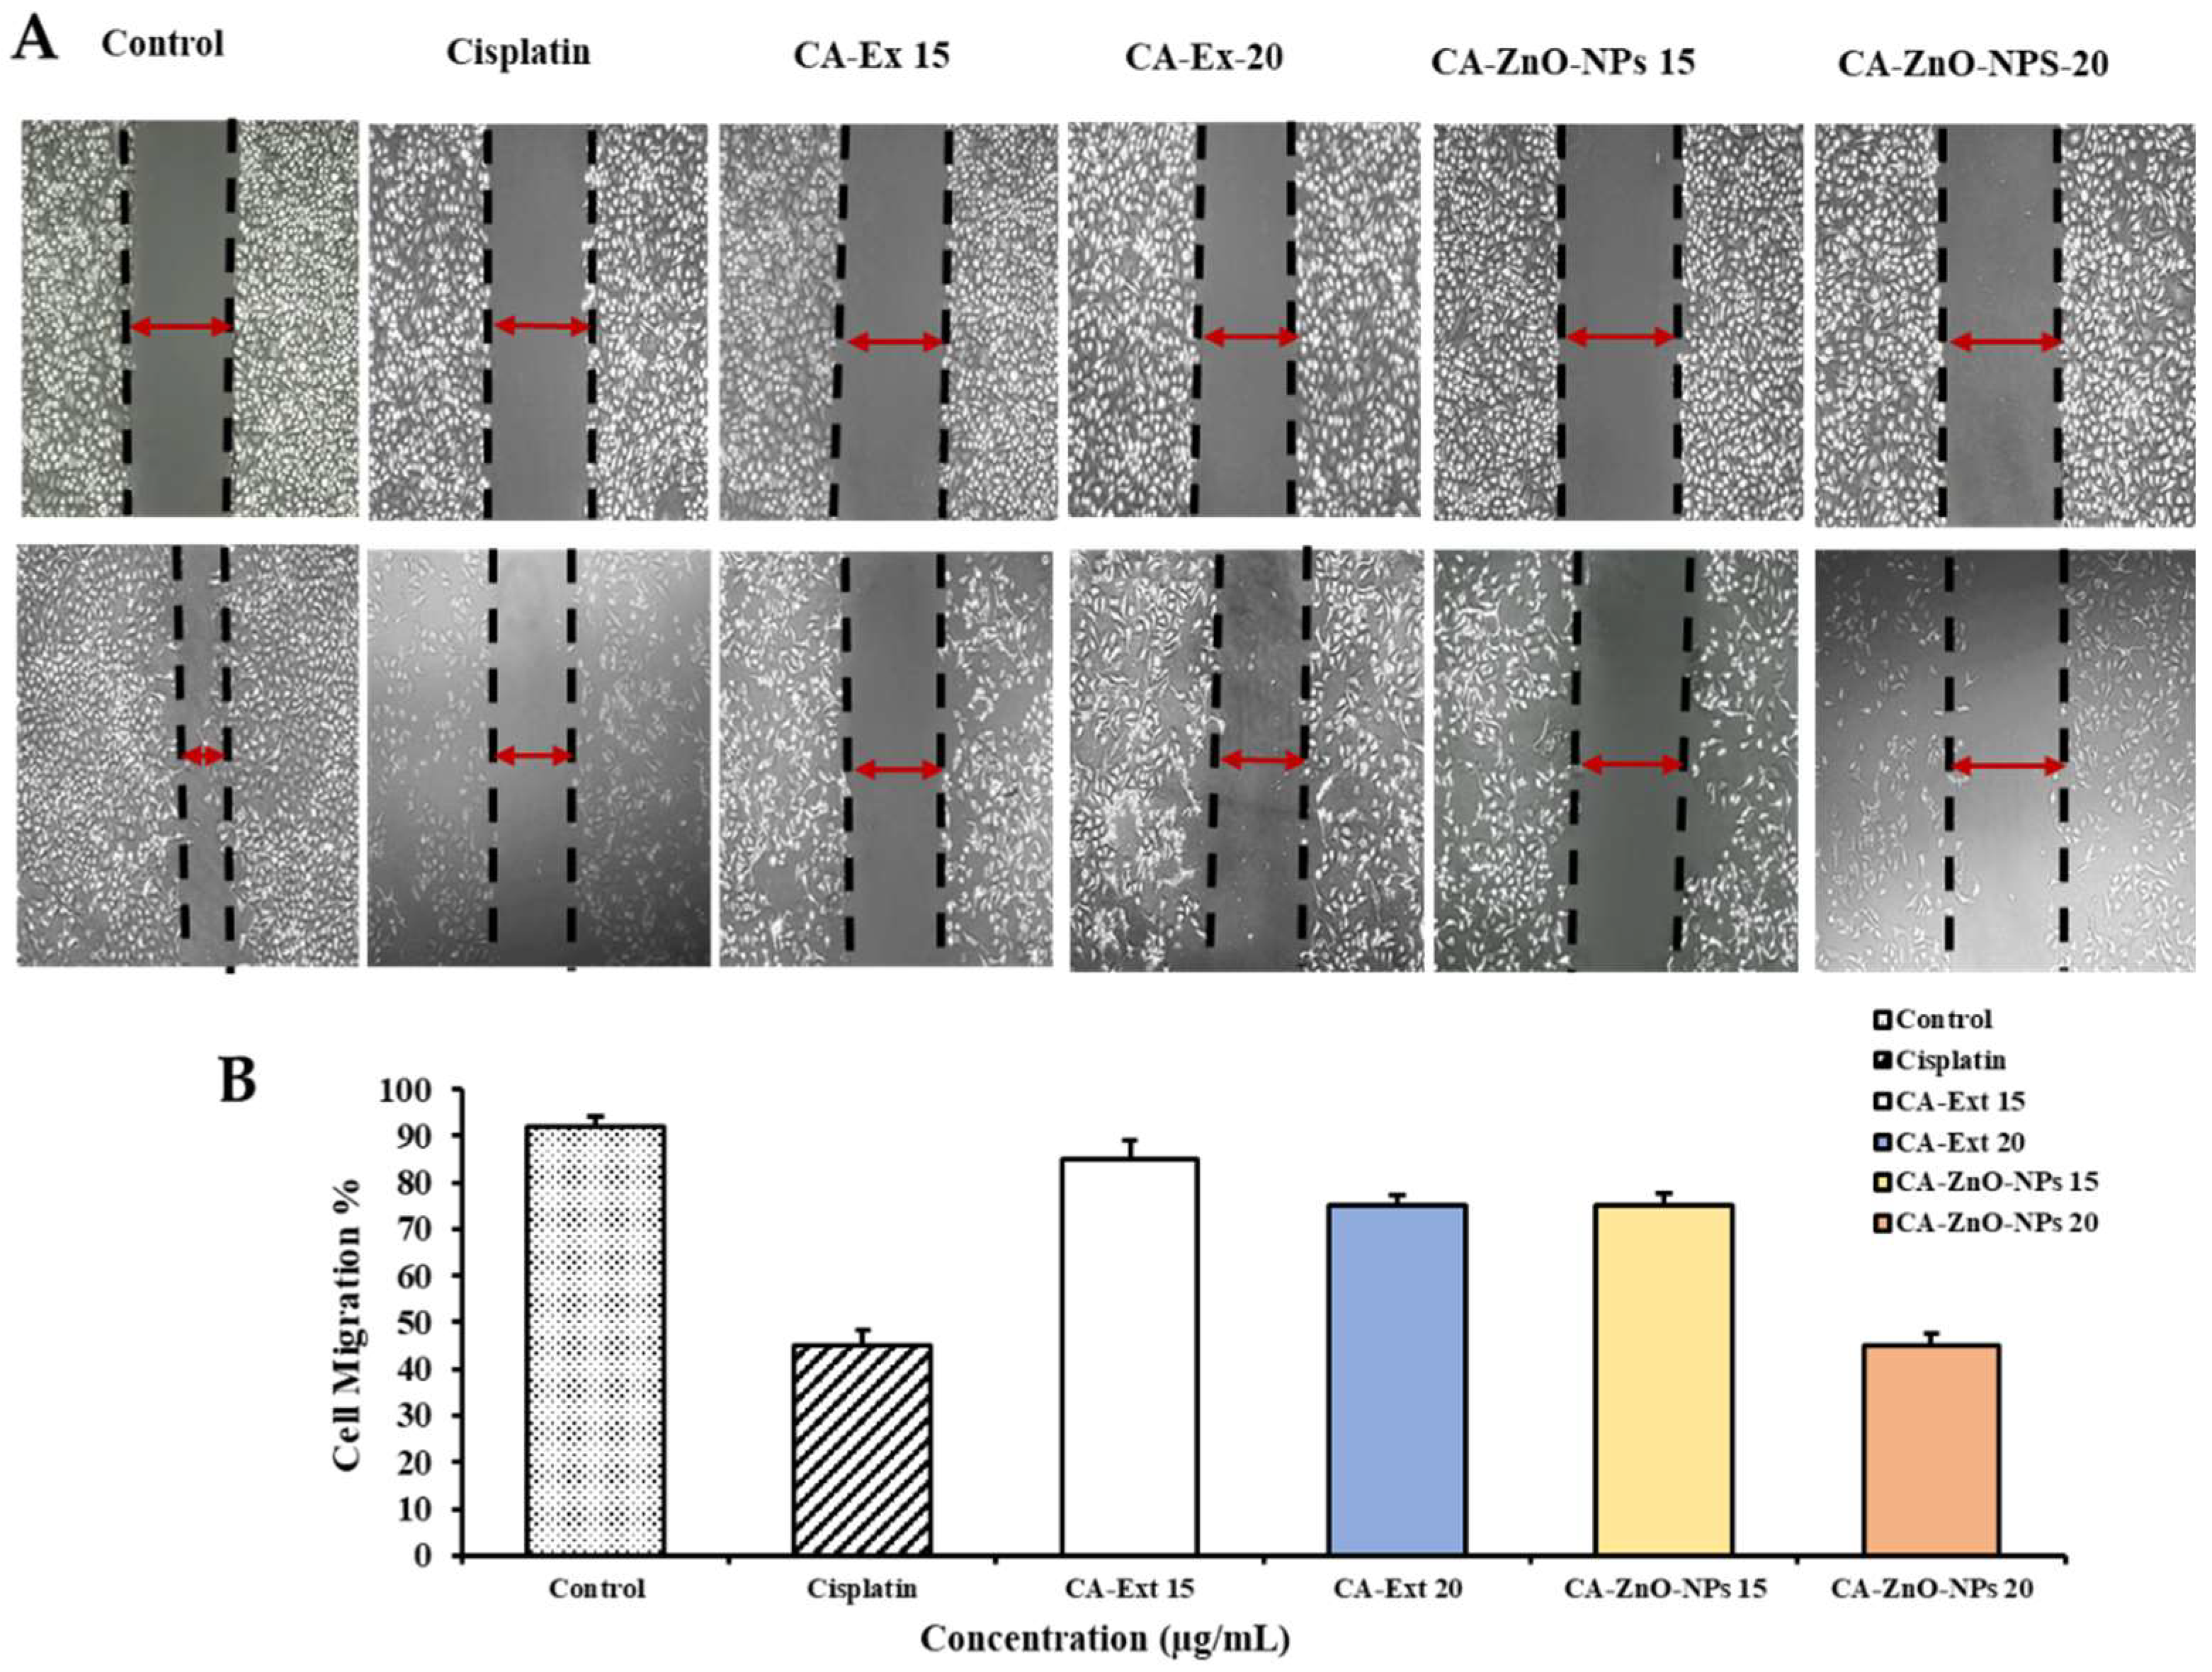
3.10. CA-ZnO-NPs Inhibit Migration of Cancer Cells
3.11. Detection of HGRCm-ZnO NP-Induced Apoptosis by Hoechst-33342/PI Dye Staining
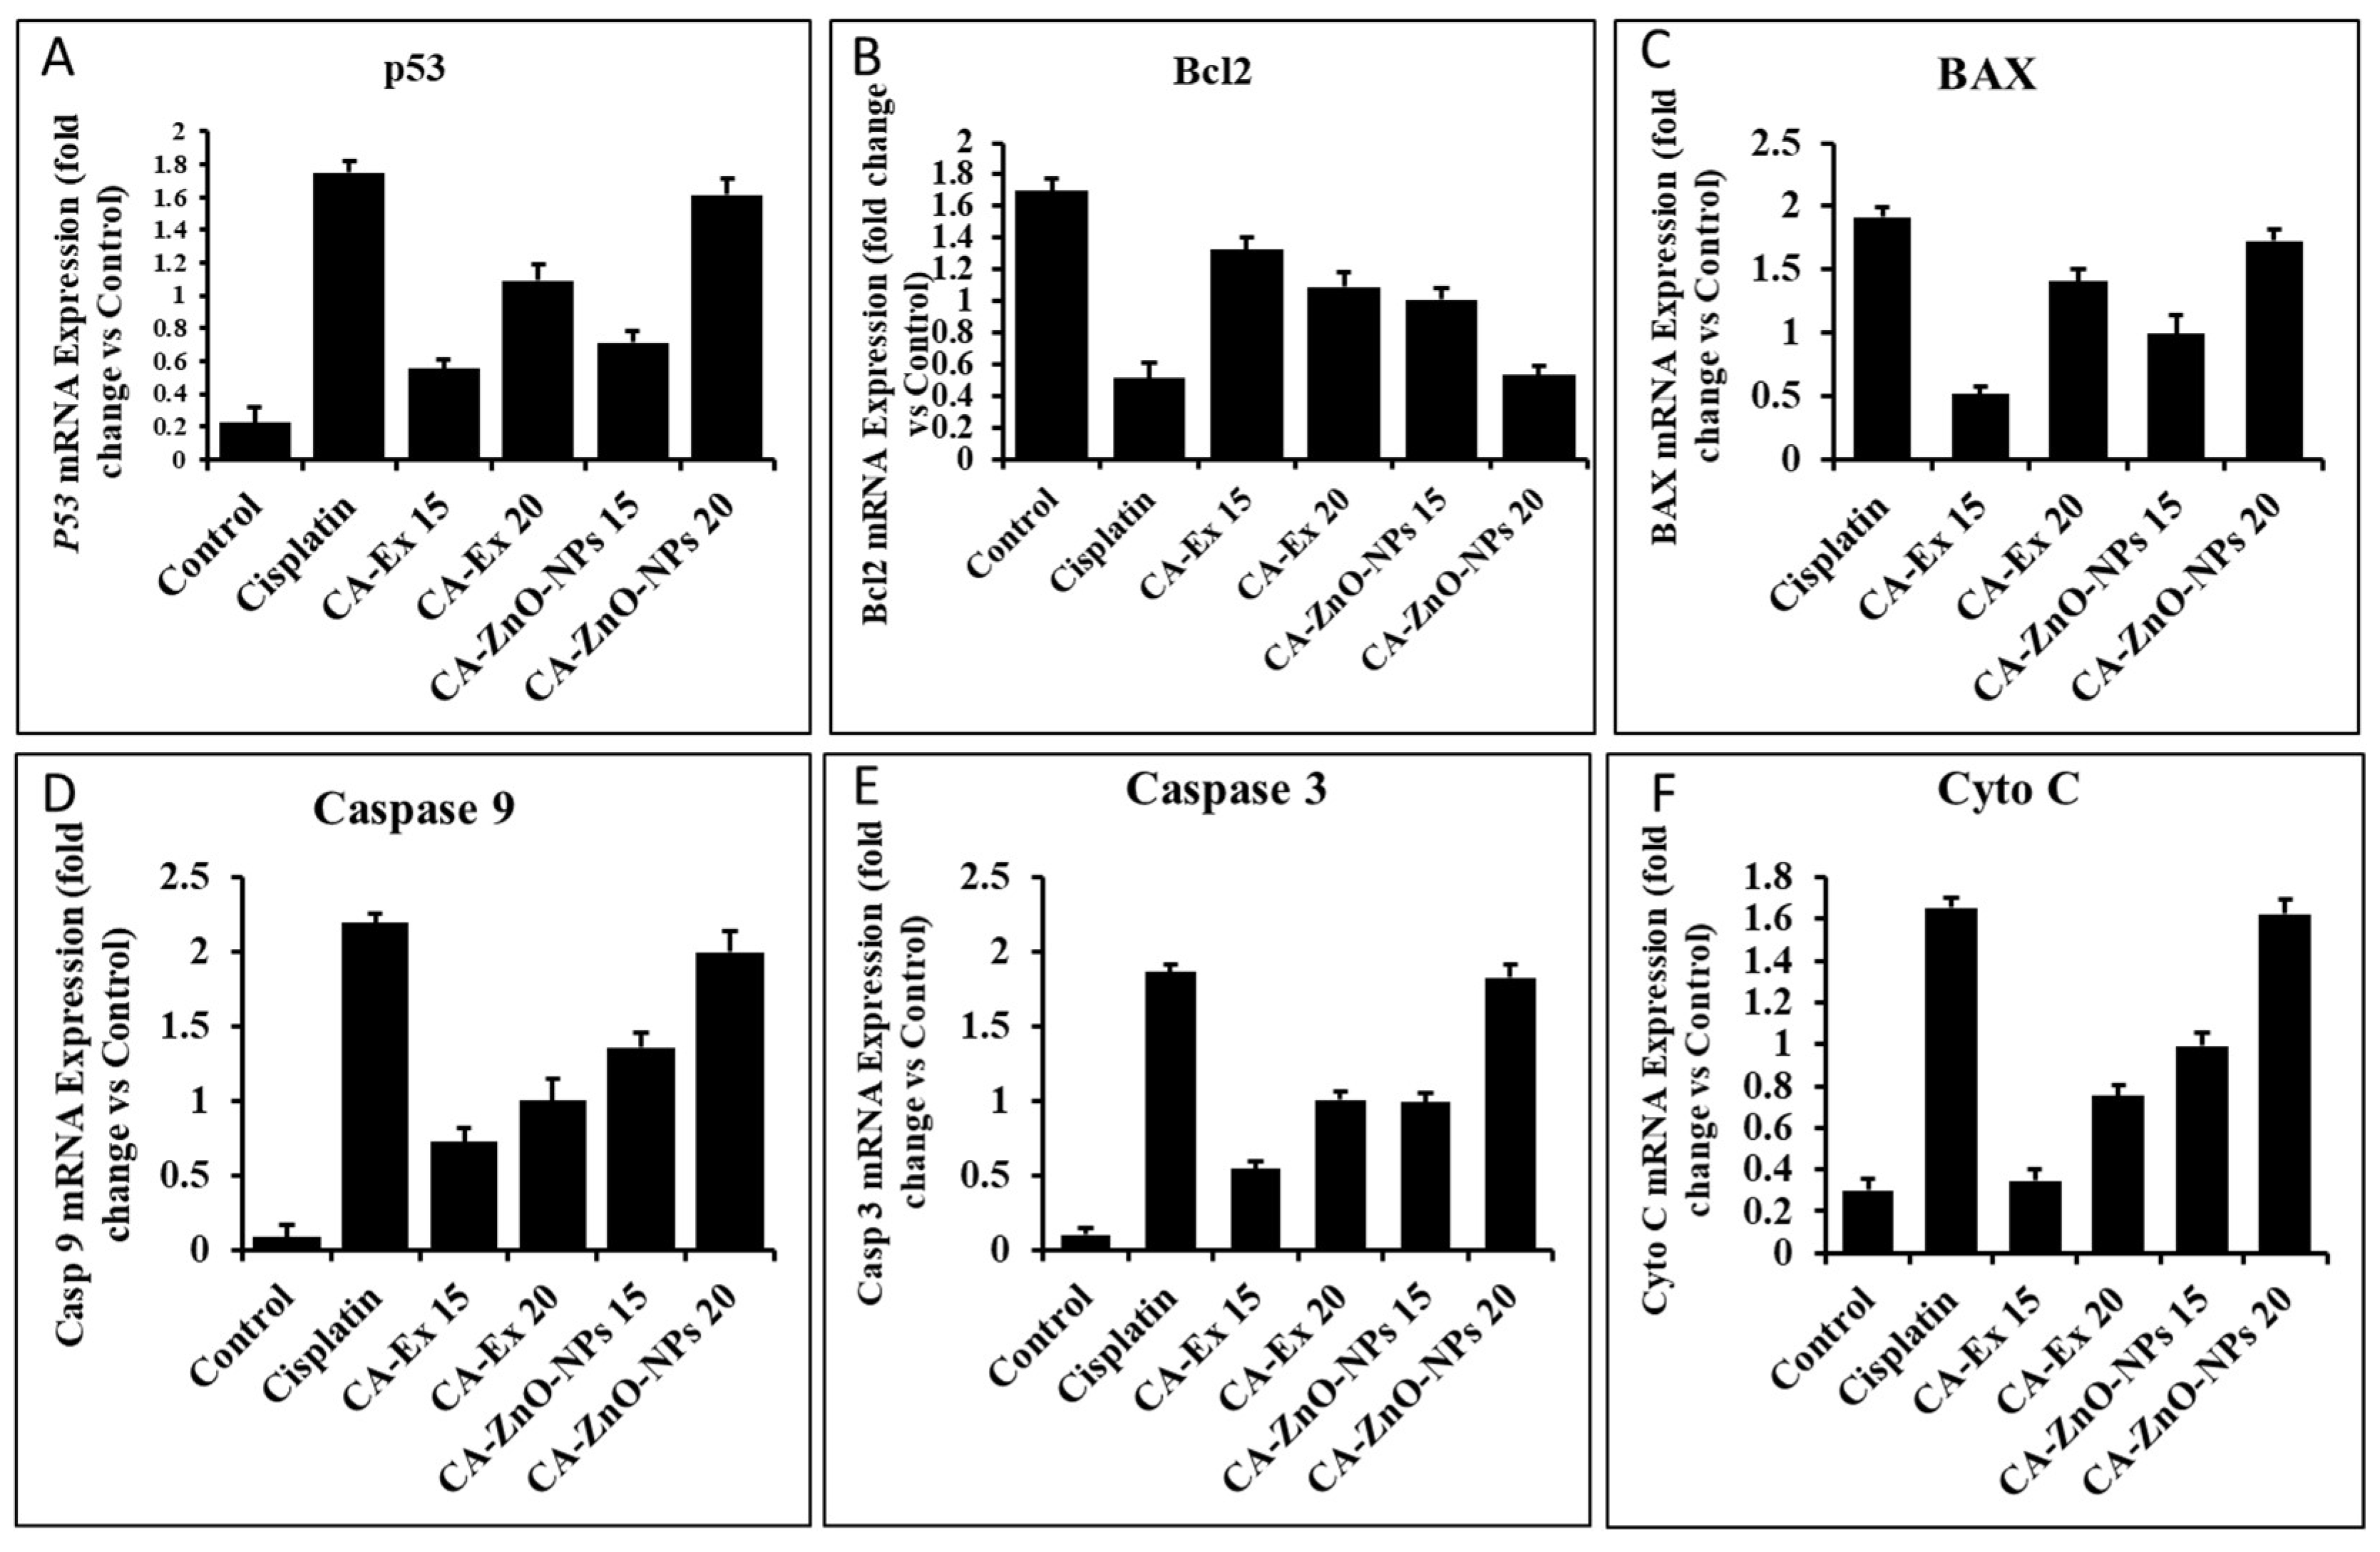
3.12. By Controlling Apoptotic Gene Expression, CA-ZnO-NPs Induced Apoptosis
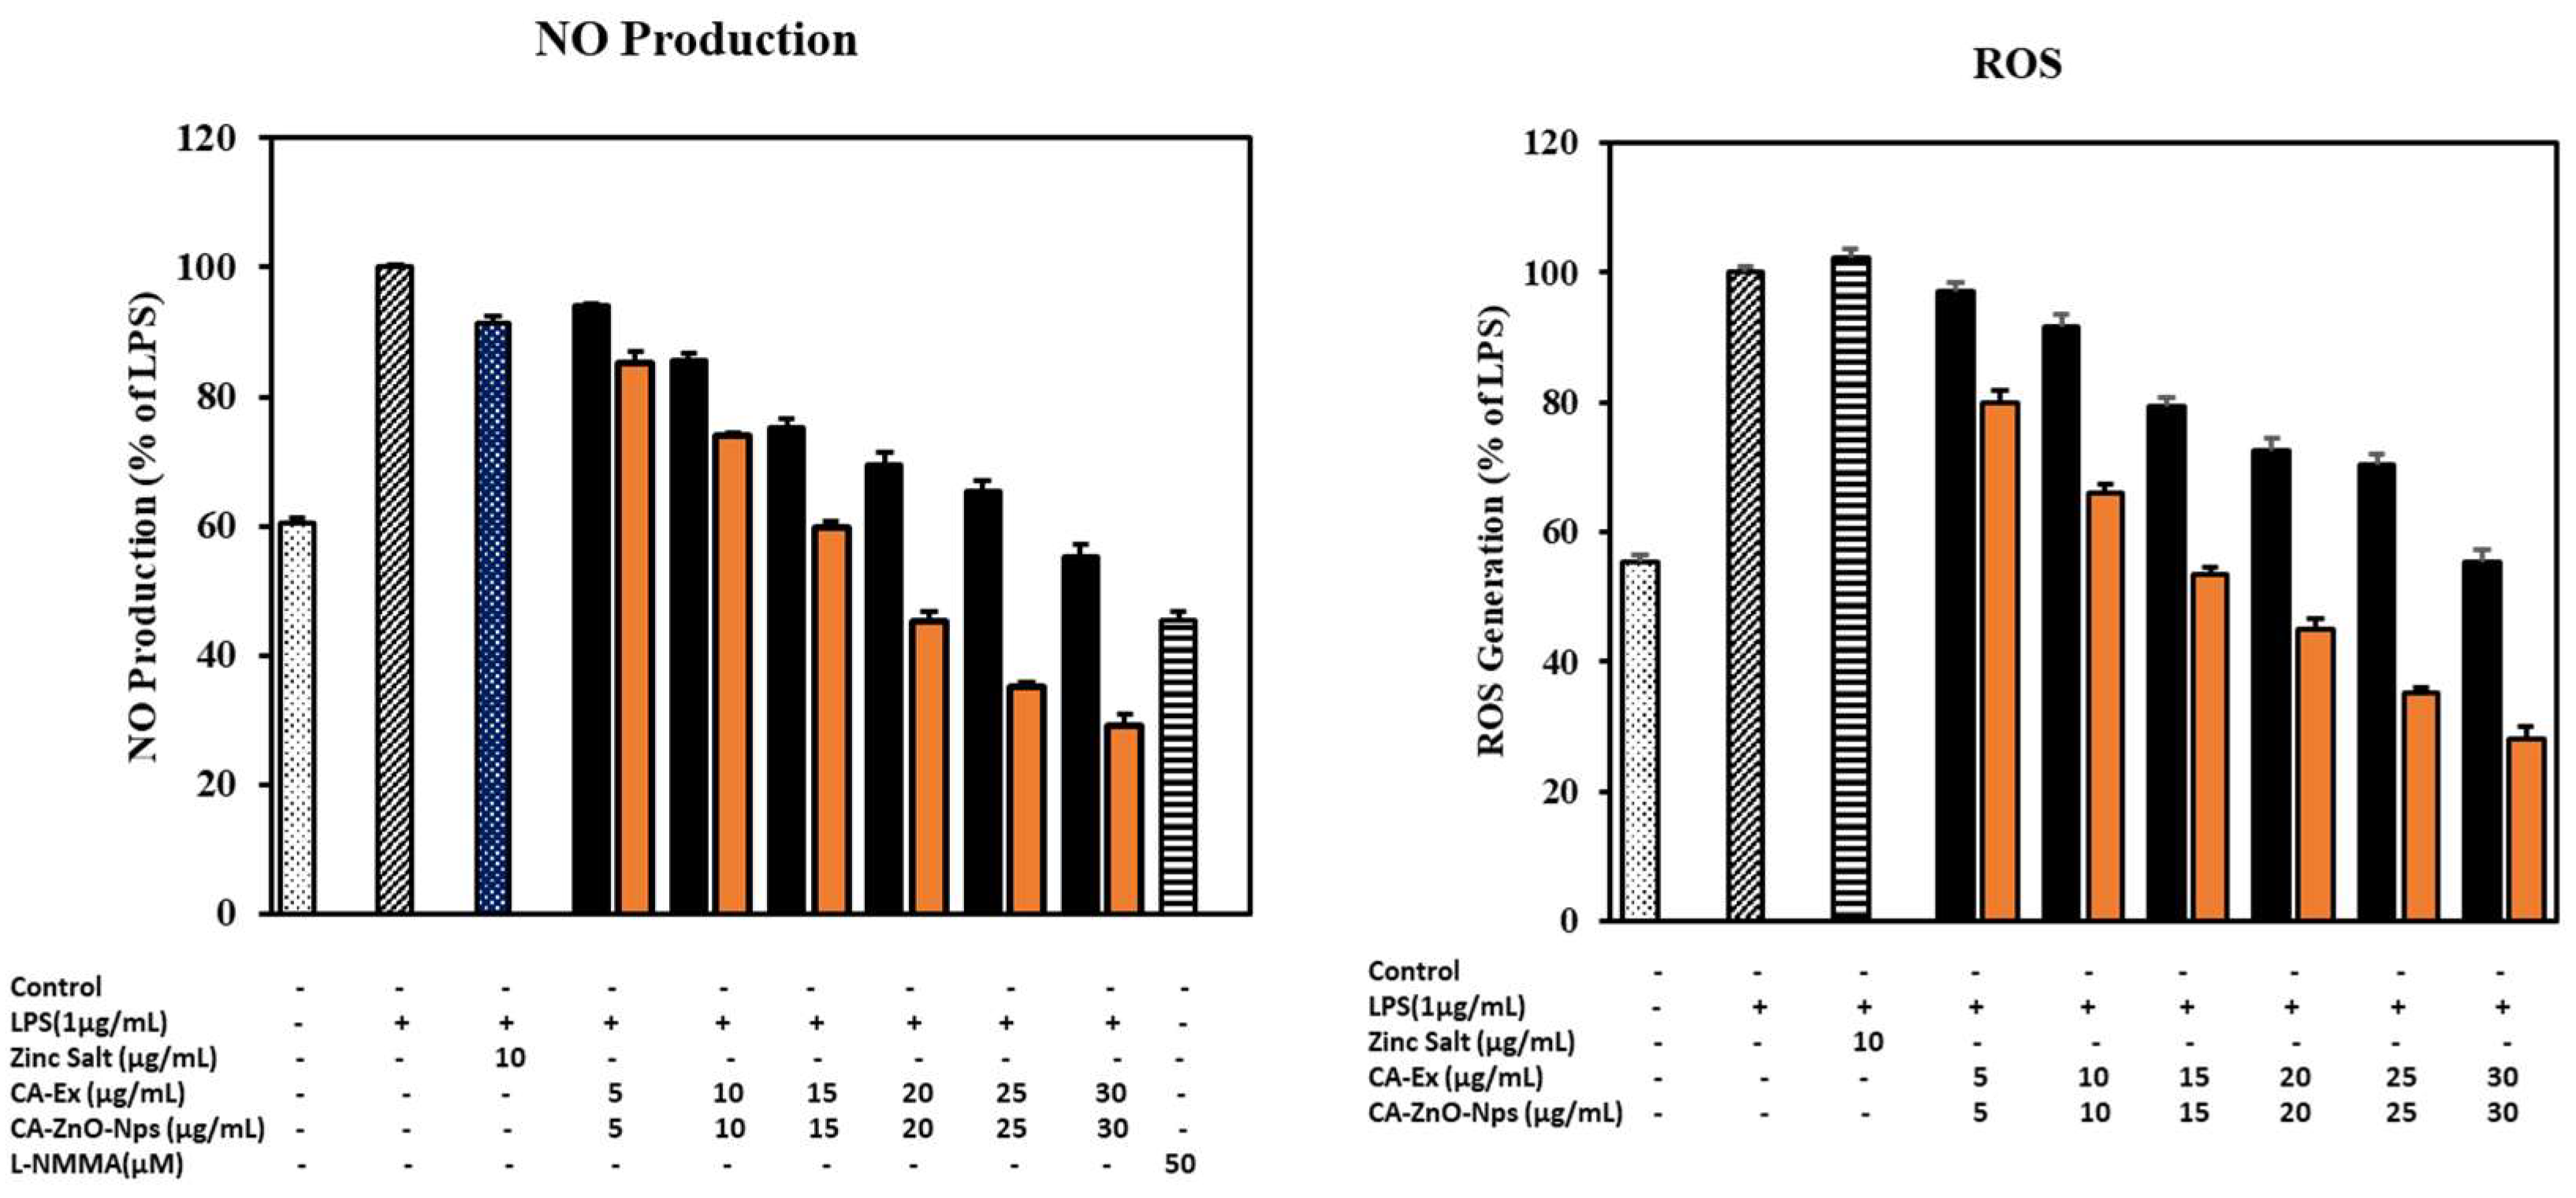
3.13. CA-ZnO-NPs Extract Increased NO Production and Inhibited ROS Generation Induced by LPS
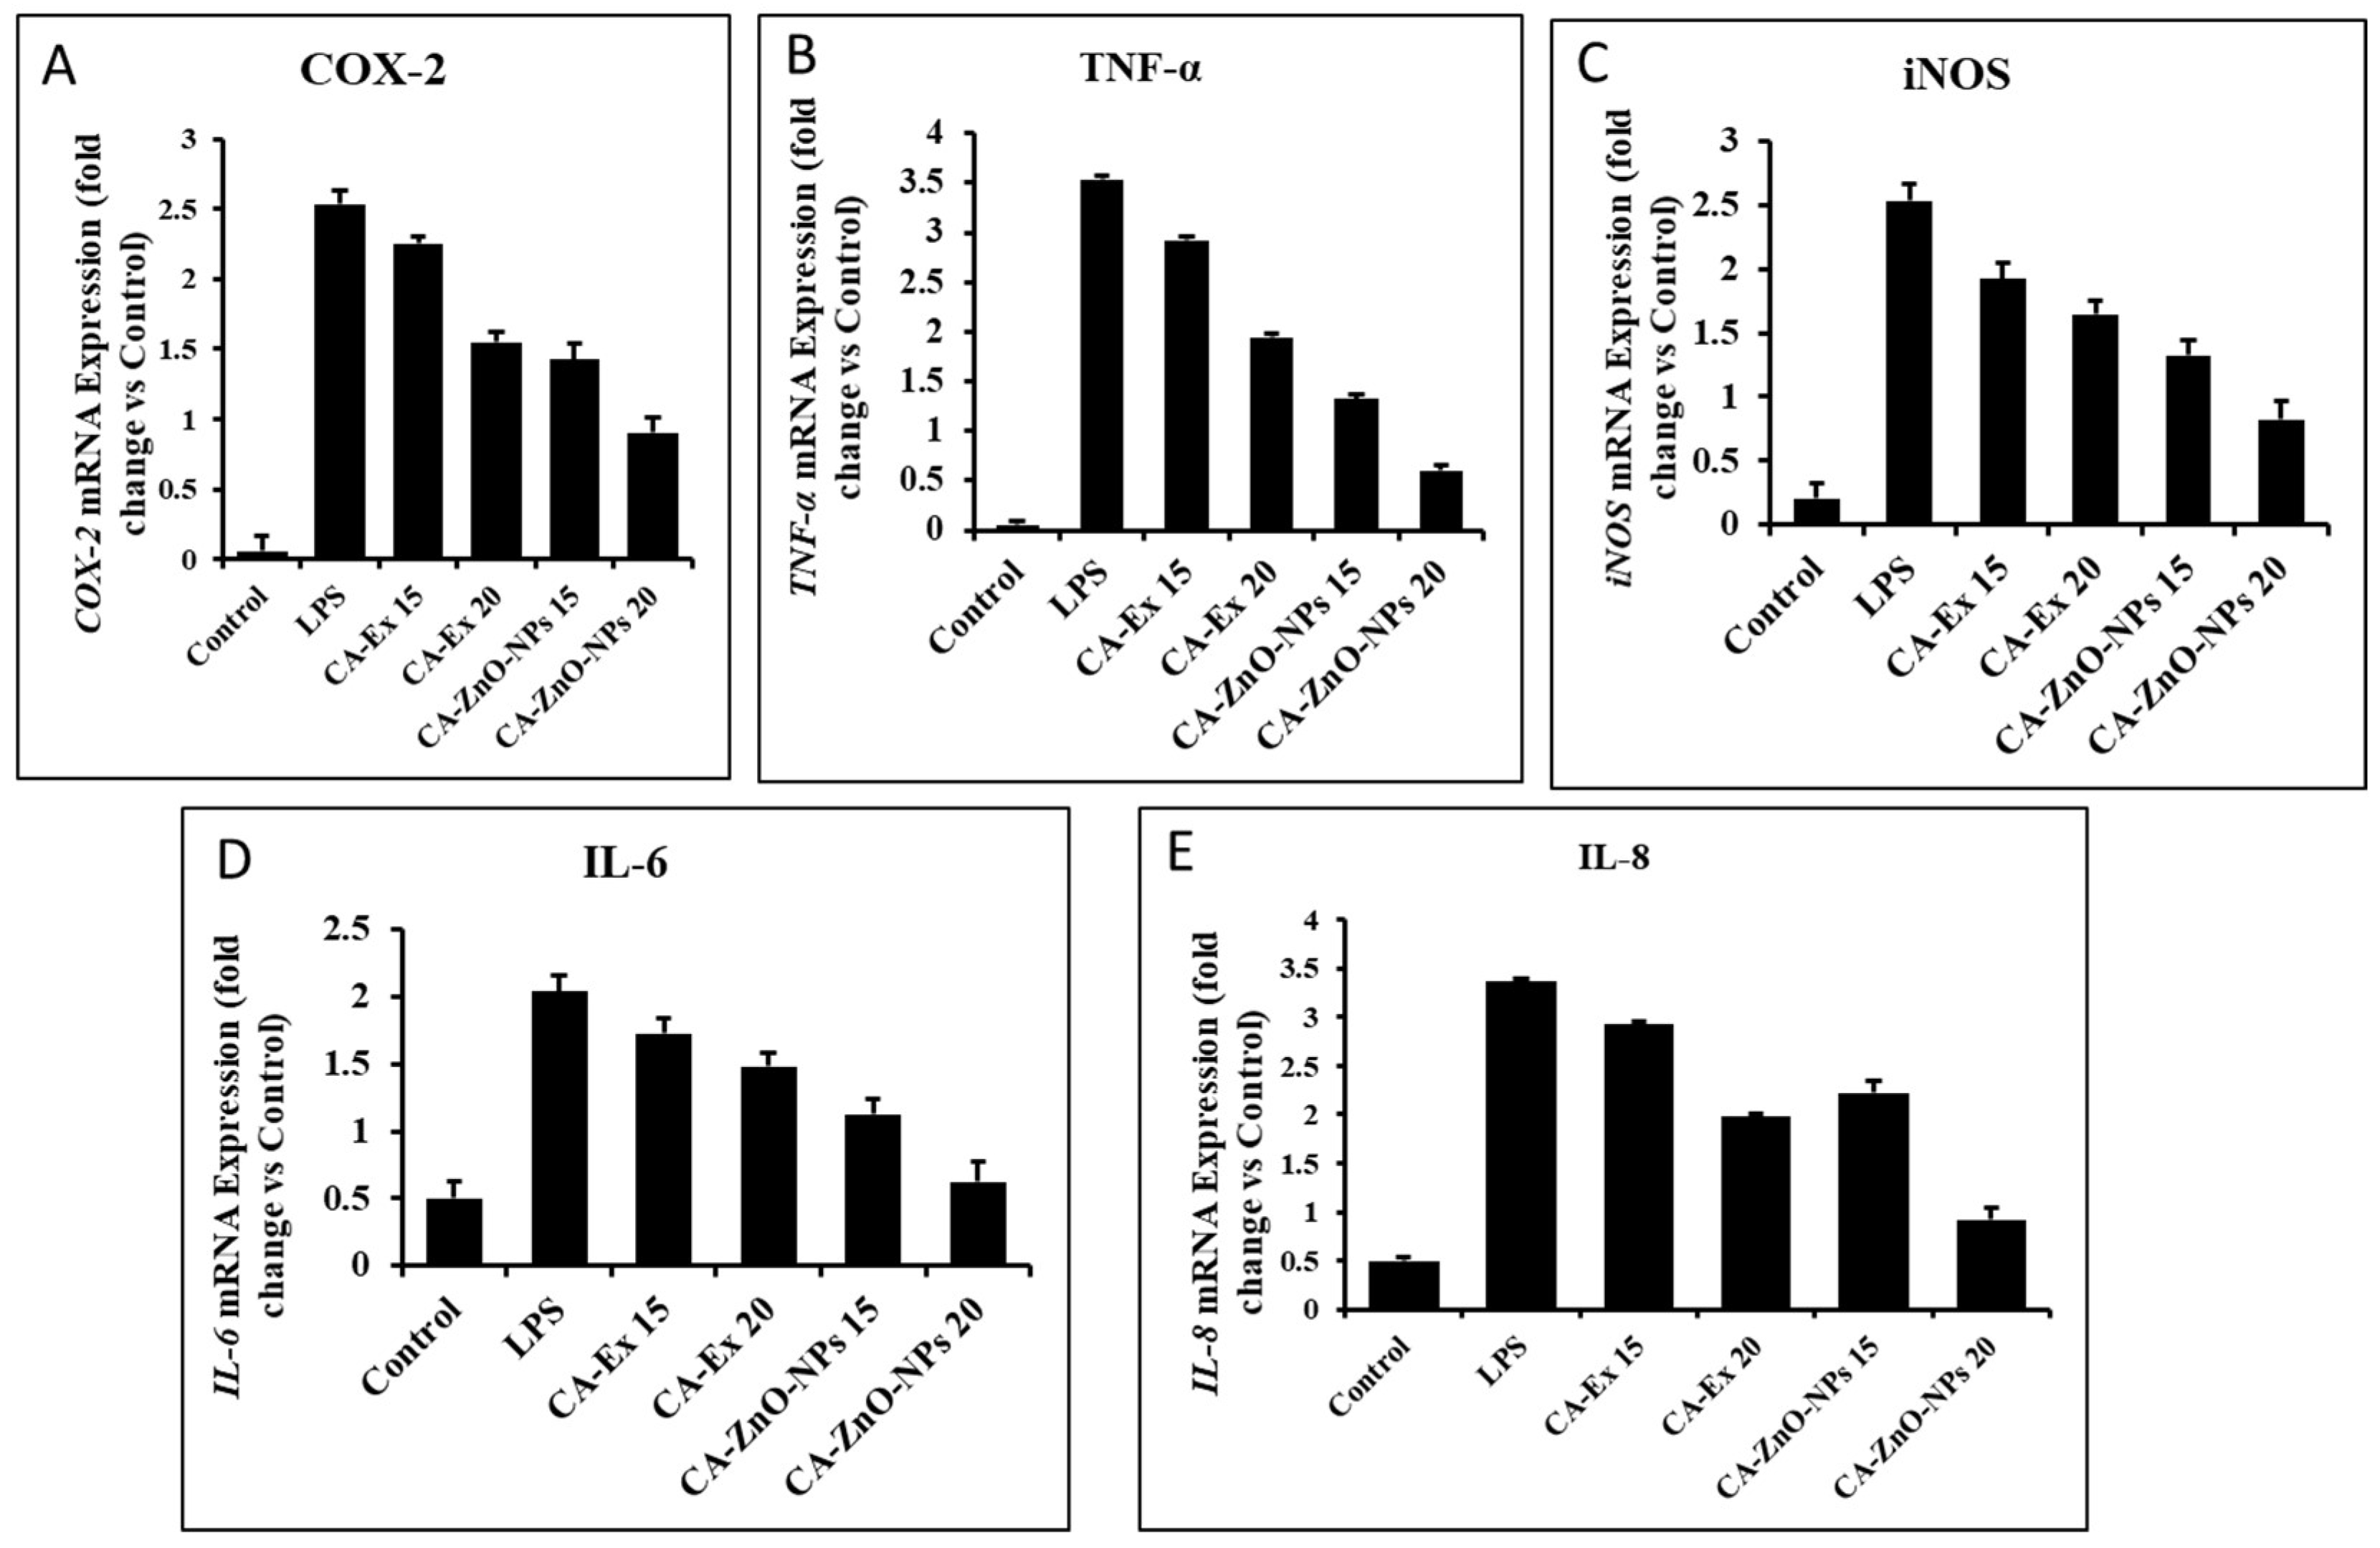
3.14. Outcome of CA-ZnO-NPs on inflammatory cytokines
4. Conclusions
Author Contributions
Funding
Institutional Review Board Statement
Informed Consent Statement
Conflicts of Interest
References
- Medzhitov, R.J.C. Inflammation 2010: New adventures of an old flame. 2010, 140, 771–776. [Google Scholar] [CrossRef] [PubMed]
- Ferrero-Miliani, L.;et al., Chronic inflammation: Importance of NOD2 and NALP3 in interleukin-1β generation. 2007, 147, 227–235.
- Nathan, C. and A.J.C. Ding, Nonresolving inflammation. 2010, 140, 871–882. [CrossRef]
- Takeuchi, O. and S.J.C. Akira, Pattern recognition receptors and inflammation. 2010, 140, 805–820. [CrossRef]
- Kumar, D.; et al., Antiallergic and anti-inflammatory properties of methanolic extract of stem bark of Ailanthus excelsa Roxb. 2010. 29.
- Kumar, V.; et al. Evaluation of anti-inflammatory potential of leaf extracts of Skimmia anquetilia. 2012, 2, 627–630. [CrossRef]
- Reddy, D.B., P.J.B. Reddanna, and B.R. Communications, Chebulagic acid (CA) attenuates LPS-induced inflammation by suppressing NF-κB and MAPK activation in RAW 264.7 macrophages. 2009, 381, 112–117.
- Lavanya, R.; et al. Investigation of in-vitro anti-inflammatory, anti-platelet and anti-arthritic activities in the leaves of Anisomeles malabarica Linn. 2010, 1, 745–752.
- Ginwala, R.; et al. Potential role of flavonoids in treating chronic inflammatory diseases with a special focus on the anti-inflammatory activity of apigenin. 2019, 8, 35. [CrossRef]
- Siegel, R.L., K.D. Miller, and A.J.C.a.c.j.f.c. Jemal, Cancer statistics. 2018, 68, 7–30.
- Bray, F.; et al. Global cancer statistics 2018: GLOBOCAN estimates of incidence and mortality worldwide for 36 cancers in 185 countries. 2018, 68, 394–424. [CrossRef]
- Krist, A.H.; et al. Screening for lung cancer: US Preventive Services Task Force recommendation statement. 2021, 325, 962–970.
- Sung, H.; et al. Global cancer statistics 2020: GLOBOCAN estimates of incidence and mortality worldwide for 36 cancers in 185 countries. 2021, 71, 209–249. [CrossRef]
- Tan, D.; et al. Management of B-cell non-Hodgkin lymphoma in Asia: Resource-stratified guidelines. 2013, 14, e548–e561. [CrossRef]
- Alsharairi, N.A.J.N. The effects of dietary supplements on asthma and lung cancer risk in smokers and non-smokers: A review of the literature. 2019, 11, 725. [CrossRef]
- Kalaivani, T.; et al. Free radical scavenging, cytotoxic and hemolytic activities from leaves of Acacia nilotica (L.) Wild. ex. Delile subsp. indica (Benth.) Brenan. 2011, 2011.
- Ko, E.C., D. Raben, and S.C.J.C.C.R. Formenti, The integration of radiotherapy with immunotherapy for the treatment of non–small cell lung cancer. 2018, 24, 5792–5806. [CrossRef]
- Jamkhande, P.G.; et al. Metal nanoparticles synthesis: An overview on methods of preparation, advantages and disadvantages, and applications. 2019, 53, 101174. [CrossRef]
- Thakkar, K.N.; et al. Biological synthesis of metallic nanoparticles. 2010, 6, 257–262. [CrossRef]
- Zhang, D.; et al. Green synthesis of metallic nanoparticles and their potential applications to treat cancer. 2020, 8, 799. [CrossRef]
- Hashemi, S.F., N. Tasharrofi, and M.M.J.J.o.M.s. Saber, Green synthesis of silver nanoparticles using Teucrium polium leaf extract and assessment of their antitumor effects against MNK45 human gastric cancer cell line. 2020, 1208, 127889. [CrossRef]
- Xie, B.; et al. Enantioselective reduction of fluorenones in surfactant-aqueous solution by fruits and vegetables. 2009, 61, 284–288. [CrossRef]
- Hameed, S.; et al. Green synthesis of zinc nanoparticles through plant extracts: Establishing a novel era in cancer theranostics. 2019, 6, 102005. [CrossRef]
- Chandrasekaran, S., S. Anusuya, and V.J.J.o.M.S. Anbazhagan, Anticancer, anti-diabetic, antimicrobial activity of zinc oxide nanoparticles: A comparative analysis. 2022, 1263, 133139. [CrossRef]
- Velsankar, K.; et al. Green inspired synthesis of ZnO nanoparticles and its characterizations with biofilm, antioxidant, anti-inflammatory, and anti-diabetic activities. 2022, 1255, 132420. [CrossRef]
- Eswari, K.M.; et al. Green synthesis of ZnO nanoparticles using Abutilon Indicum and Tectona Grandis leaf extracts for evaluation of anti-diabetic, anti-inflammatory and in-vitro cytotoxicity activities. 2022, 48, 33624–33634. [CrossRef]
- Dey, A.; et al. Optically engineered ZnO Nanoparticles: Excitable at visible wavelength and lowered cytotoxicity towards bioimaging applications. 2022, 592, 153303. [CrossRef]
- Sathappan, S.; et al. Green synthesis of zinc oxide nanoparticles (ZnO NPs) using cissus quadrangularis: Characterization, antimicrobial and anticancer studies. 2021, 91, 289–296. [CrossRef]
- Prashanth, G.; et al. Comparison of anticancer activity of biocompatible ZnO nanoparticles prepared by solution combustion synthesis using aqueous leaf extracts of Abutilon indicum, Melia azedarach and Indigofera tinctoria as biofuels. 2018, 46, 968–979.
- Gurib-Fakim, A.J.M.a.o.M. Medicinal plants: Traditions of yesterday and drugs of tomorrow. 2006, 27, 1–93.
- Balandrin, M.F., A. D. Kinghorn, and N.R. Farnsworth, Plant-derived natural products in drug discovery and development: An overview. 1993.
- Chen, H.; et al. The anticancer activity and mechanisms of ginsenosides: An updated review. 2020, 1, 226–241. [CrossRef]
- Jung, D.-H.; et al. Focused Review on Molecular Signalling Mechanisms of Ginsenosides on Anti-lung cancer and Anti-inflammatory Activities. 2022. [CrossRef]
- Liu, X.-Q.; et al., Molecular phylogeny of Cissus L. of Vitaceae (the grape family) and evolution of its pantropical intercontinental disjunctions. 2013, 66, 43–53. [CrossRef]
- Gerrath, J.M. and U.J.C.j.o.b. Posluszny, Morphological and anatomical development in the Vitaceae. VI. Cissus antarctica. 1994, 72, 635–643. [CrossRef]
- Balasubramanian, P., A. Rajasekaran, and S.J.A.S.o.L. Prasad, Folk medicine of the Irulas of Coimbatore forests. 1997, 16, 222.
- Manokari, M. and M.S.J.W.N.o.N.S. Shekhawat, An updated review on Cissus vitiginea L.(Family: Vitaceae)-An important medicinal climber. 2019, 22.
- Chidambara Murthy, K.; et al. Antioxidant and antimicrobial activity of Cissus quadrangularis L. 2003, 6, 99–105. [CrossRef]
- Mate, G.; et al. Evaluation of anti-nociceptive activity of Cissus quadrangularis on albino mice. 2008, 2. [CrossRef]
- Vijay, P., R.J.J.o.P.S. Vijayvergia, and Technology, Analgesic, anti-inflammatory and antipyretic activity of Cissus quadrangularis. 2010, 2, 111–118.
- Nocedo-Mena, D.; et al. Antibacterial activity of Cissus incisa extracts against multidrug-resistant bacteria. 2020, 20, 318–323. [CrossRef]
- Vijayalakshmi, A.; et al. In vitro antioxidant and anticancer activity of flavonoid fraction from the aerial parts of Cissus quadrangularis Linn. against human breast carcinoma cell lines. 2013.
- Jin, Y.; et al. Ginsenoside Rh1 Prevents Migration and Invasion through Mitochondrial ROS-Mediated Inhibition of STAT3/NF-κB Signaling in MDA-MB-231 Cells. International journal of molecular sciences, 2021, 22, 10458. [Google Scholar] [CrossRef] [PubMed]
- Chakraborty, S.; et al. Restoration of p53/miR-34a regulatory axis decreases survival advantage and ensures Bax-dependent apoptosis of non-small cell lung carcinoma cells. FEBS letters, 2014, 588, 549–559. [Google Scholar] [CrossRef]
- Lu, H.-F.; et al. Apigenin induces caspase-dependent apoptosis in human lung cancer A549 cells through Bax-and Bcl-2-triggered mitochondrial pathway. International journal of oncology, 2010, 36, 1477–1484. [Google Scholar] [CrossRef]
- Wang, J.-P.; et al. Reactive oxygen species-driven mitochondrial injury induces apoptosis by teroxirone in human non-small cell lung cancer cells. Oncology Letters, 2017, 14, 3503–3509. [Google Scholar] [CrossRef]
- Fowsiya, J.; et al. Photocatalytic degradation of Congo red using Carissa edulis extract capped zinc oxide nanoparticles. 2016, 162, 395–401. [CrossRef]
- Goutam, S.P.; et al. Coriander extract mediated green synthesis of zinc oxide nanoparticles and their structural, optical and antibacterial properties. 2017, 249-252.
- Yedurkar, S.; et al. Biosynthesis of zinc oxide nanoparticles using ixora coccinea leaf extract—A green approach. 2016, 5, 1–14. [CrossRef]
- Rupa, E.J.; et al. Synthesis of a zinc oxide nanoflower photocatalyst from sea buckthorn fruit for degradation of industrial dyes in wastewater treatment. 2019, 9, 1692. [CrossRef]
- Kim, W.J.; et al. Room temperature synthesis of germanium dioxide nanorods and their in vitro photocatalytic application. 2019, 178, 664–668. [CrossRef]
- Shen, C.; et al. Relating cytotoxicity, zinc ions, and reactive oxygen in ZnO nanoparticle–exposed human immune cells. 2013, 136, 120–130.
- Mishra, P.K.; et al. Zinc oxide nanoparticles: A promising nanomaterial for biomedical applications. 2017, 22, 1825–1834. [CrossRef]
- Truong-Tran, A.Q.; et al. New insights into the role of zinc in the respiratory epithelium. 2001, 79, 170–177. [CrossRef]
- Sana, S.S.; et al. Crotalaria verrucosa leaf extract mediated synthesis of zinc oxide nanoparticles: Assessment of antimicrobial and anticancer activity. 2020, 25, 4896. [CrossRef]
- Sarmiento-Salinas, F.L.; et al. Reactive oxygen species: Role in carcinogenesis, cancer cell signaling and tumor progression. 2021, 284, 119942. [CrossRef]
- Tanino, R.; et al. Anticancer activity of ZnO nanoparticles against human small-cell lung cancer in an orthotopic mouse ModelZnO nanoparticles inhibit growth of small-cell lung cancer. 2020, 19, 502–512.
- Yi, C.; et al. Nanoscale ZnO-based photosensitizers for photodynamic therapy. 2020, 30, 101694.
- Dröse, S., U. J.M.O.P.N.-E.G. Brandt, Enzyme Regulation,, and Pathophysiology, Molecular mechanisms of superoxide production by the mitochondrial respiratory chain. 2012, 145-169. [CrossRef]
- Franken, N.A.; et al. Clonogenic assay of cells in vitro. 2006, 1, 2315–2319. [CrossRef]
- Hanahan, D. and R.A.J.c. Weinberg, Hallmarks of cancer: The next generation. 2011, 144, 646–674.
- Lambert, A.W., D.R. Pattabiraman, and R.A.J.C. Weinberg, Emerging biological principles of metastasis. 2017, 168, 670–691. [CrossRef]
- Sikdar, S.; et al. Induction of phase II enzymes glutathione-s-transferase and NADPH: Quinone oxydoreductase 1 with novel sulforaphane derivatives in human keratinocytes: Evaluation of the intracellular GSH level. 2014, 5, 937. [CrossRef]
- Yarrow, J.C.; et al. A high-throughput cell migration assay using scratch wound healing, a comparison of image-based readout methods. 2004, 4, 1–9. [CrossRef]
- Rani, N. and K. Saini. Biogenic metal and metal oxides nanoparticles as anticancer agent: A review. in IOP Conference Series: Materials Science and Engineering. 2022. IOP Publishing. [CrossRef]
- Valko, M.; et al. Free radicals, metals and antioxidants in oxidative stress-induced cancer. 2006, 160, 1–40. [CrossRef]
- Ismail, N.I.; et al. Mechanism of apoptosis induced by curcumin in colorectal cancer. 2019, 20, 2454. [CrossRef]
- George, B.P., H. J.O.m. Abrahamse, and c. longevity, Increased oxidative stress induced by rubus bioactive compounds induce apoptotic cell death in human breast cancer cells. 2019, 2019.
- Johnson, T.M.; et al. Reactive oxygen species are downstream mediators of p53-dependent apoptosis. 1996, 93, 11848–11852. [CrossRef]
- Liu, B.; et al. ROS and p53: A versatile partnership. 2008, 44, 1529–1535. [CrossRef]
- Omoyeni, O.A.; et al. Pleiocarpa pycnantha leaves and its triterpenes induce apoptotic cell death in Caco-2 cells in vitro. 2015, 15, 1–7. [CrossRef]
- Kang, M.H. and C.P.J.C.c.r. Reynolds, Bcl-2 inhibitors: Targeting mitochondrial apoptotic pathways in cancer therapy. 2009, 15, 1126–1132. [CrossRef]
- Zheng, J.H.; et al. Discoveries and controversies in BCL-2 protein-mediated apoptosis. 2016, 283, 2690–2700. [CrossRef]
- Julien, O., J.A.J.C.D. Wells, and Differentiation, Caspases and their substrates. 2017, 24, 1380–1389.
- Li, W.; et al. Trilobatin induces apoptosis and attenuates stemness phenotype of acquired gefitinib resistant lung cancer cells via suppression of NF-κB pathway. 2022, 74, 735–746.
- Li, Y.; et al. Radix tetrastigma inhibits the non-small cell lung cancer via Bax/Bcl-2/Caspase-9/Caspase-3 pathway. 2022, 74, 320–332.
- Jayappa, M.D.; et al. Green synthesis of zinc oxide nanoparticles from the leaf, stem and in vitro grown callus of Mussaenda frondosa L.: Characterization and their applications. 2020, 10, 3057–3074. [Google Scholar] [CrossRef]
- Agarwal, H. and V.J.B.c. Shanmugam, A review on anti-inflammatory activity of green synthesized zinc oxide nanoparticle: Mechanism-based approach. 2020, 94, 103423.
- Ilves, M.; et al. Topically applied ZnO nanoparticles suppress allergen induced skin inflammation but induce vigorous IgE production in the atopic dermatitis mouse model. 2014, 11, 1–12. [CrossRef]
- Rajakumar, G.; et al. Green approach for synthesis of zinc oxide nanoparticles from Andrographis paniculata leaf extract and evaluation of their antioxidant, anti-diabetic, and anti-inflammatory activities. 2018, 41, 21–30. [CrossRef]
- Mayer, B., M. John, and E.J.F.l. Böhme, Purification of a Ca2+/calmodulin-dependent nitric oxide synthase from porcine cerebellum: Cofactor-role of tetrahydrobiopterin. 1990, 277, 215–219.
- Clancy, R.M.; et al. The role of nitric oxide in inflammation and immunity. 1998, 41, 1141–1151. [CrossRef]
- Salvemini, D.J.C. and M.L.S. CMLS, Regulation of cyclooxygenase enzymes by nitric oxide. 1997, 53, 576–582.
- Wang, Z.; et al. Characterization and anti-inflammation of a polysaccharide produced by Chaetomium globosum CGMCC 6882 on LPS-induced RAW 264. 7 cells. 2021, 251, 117129. [Google Scholar] [CrossRef]
- Šoltés, L.; et al. Hyaluronan: A Harbinger of the Status and Functionality of the Joint. 2014, Apple Academic Press/Taylor & Francis Group: Canada/United States. p. 259-286.
- Cao, J.; et al. Dexamethasone phosphate-loaded folate-conjugated polymeric nanoparticles for selective delivery to activated macrophages and suppression of inflammatory responses. 2015, 23, 485–492. [CrossRef]
- Yang, M.; et al. In vitro and in vivo anti-inflammatory effects of different extracts from Epigynum auritum through down-regulation of NF-κB and MAPK signaling pathways. 2020, 261, 113105.
- Park, E.; et al. Anti-inflammatory activity of mulberry leaf extract through inhibition of NF-κB. 2013, 5, 178–186.



| Gene | Primer Sequences (5′-3′) |
| p53 | F: TCT TGGGCC TGT GTT ATC TCC R: CGC CCA TGC AGG AAC TGT TA |
| Bcl2 | F: GAA GGG CAG CCG TTA GGAAA R: GCG CCC AAT ACG ACC AAA TC |
| BAX | F: GGT TGC CCT CTT CTA CTT T R: AGC CAC CCT GGT CTT G |
| CASPASE 3 | F: GAA GGA ACA CGC CAG GAA AC R: GCA AAG TGA AAT GTA GCA CCA A |
| CASPASE 9 | F: GCC CGA GTT TGA GAG GAA AA R: CAC AGC CAG ACC AGG AC |
| COX-2 | F: CCT GAG CAT CTA CGG TTT GC R: ACT GCT CAT CAC CCC ATT CA |
| TNF-α | F: GCCAGAATGCTGCAGGACTT R: GGCCTAAGGTCCACTTGTGTCA |
| iNOS | F: CCT GAG CAT CTA CGG TTT GC R: ACT GCT CAT CAC CCC ATT CA |
| IL-6 | F: AGGGTTGCCAGATGCAATAC R: AAACCAAGGCACAGTGGAAC |
| IL-8 | F: CCGGAGAGGAGACTTCACAG R: GGAAATTGGGGTAGGAAGGA |
| GAPDH | F: CAA GGT CAT CCA TGA CAA CTT TG R: GTC CAC CAC CCT GTT GCT GTA G |
Disclaimer/Publisher’s Note: The statements, opinions and data contained in all publications are solely those of the individual author(s) and contributor(s) and not of MDPI and/or the editor(s). MDPI and/or the editor(s) disclaim responsibility for any injury to people or property resulting from any ideas, methods, instructions or products referred to in the content. |
© 2023 by the authors. Licensee MDPI, Basel, Switzerland. This article is an open access article distributed under the terms and conditions of the Creative Commons Attribution (CC BY) license (https://creativecommons.org/licenses/by/4.0/).


