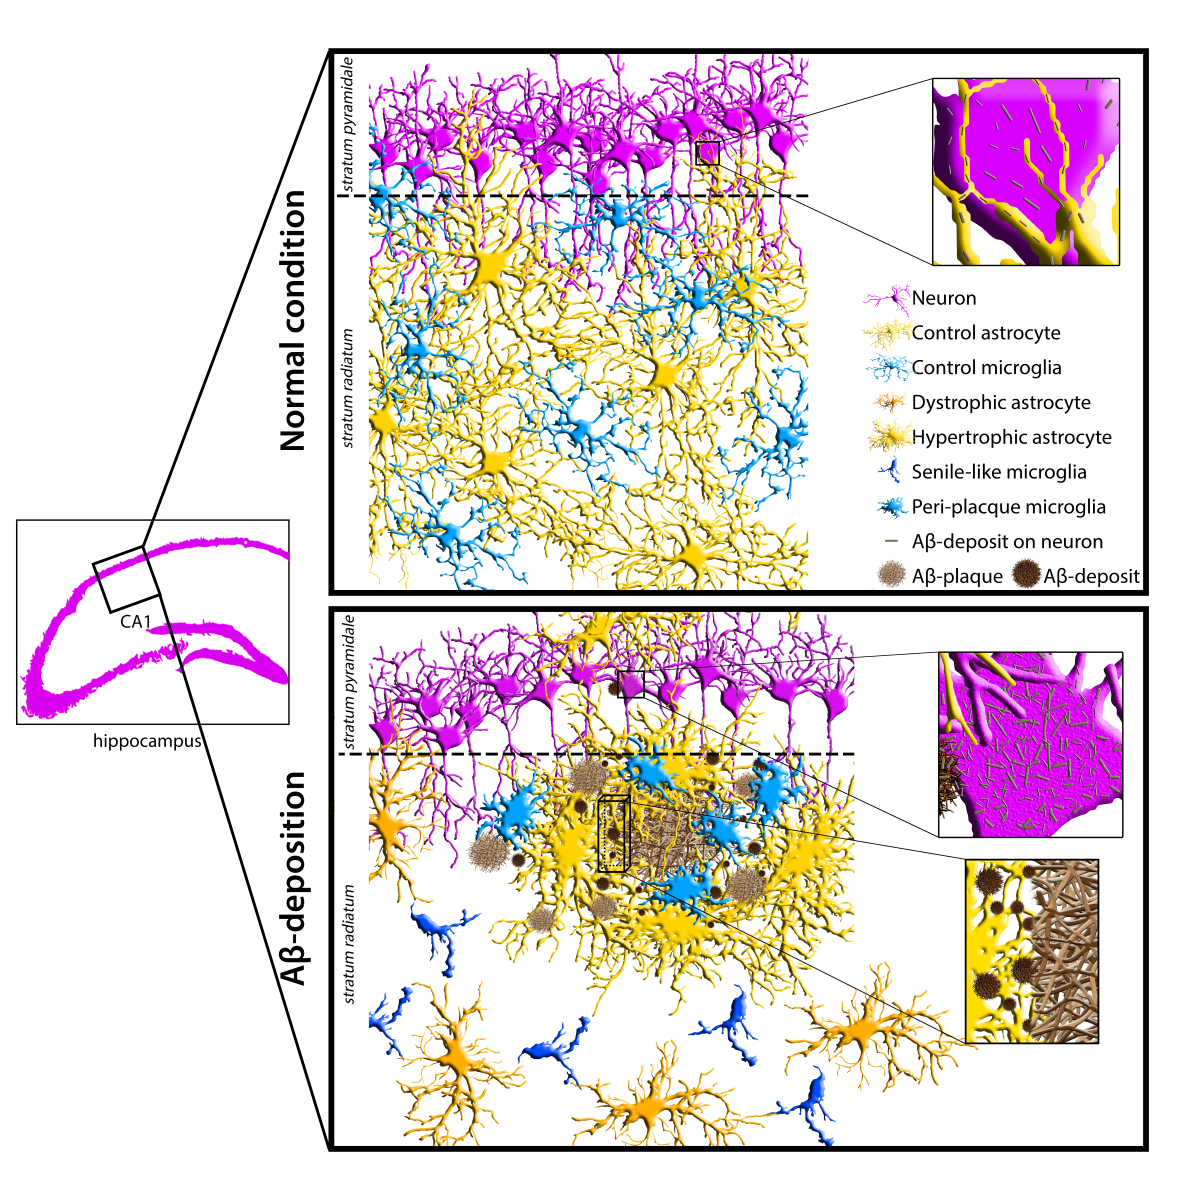
1. Introduction
The term "neuroinflammation" was originally coined to describe the accumulation of leukocytes in the degenerating white matter and blood vessels in multiple sclerosis and was later extended to the abnormal crowding of reactive microglia around amyloid plaques in AD [
1]. Microglia, while also involved in nerve tissue maintenance, represent the immunocompetent cell line of the central nervous system. In AD, the overproduction and fibrillar aggregation of denatured Aβ-peptides, and the build-up of amyloid plaques induce the release of pro-inflammatory cytokines by neurons [
2,
3], thus promoting the immune response of microglia [
4,
5]. The concept of neuroinflammation has been then applied to numerous neurodegenerative pathologies, such as Parkinson’s disease (PD), acute CNS injuries and some psychiatric disorders, and included further cell types, such as astrocytes. In AD, astrocytes are involved in Aβ-peptide clearance [
6,
7] and modulate microglial phagocytosis [
4,
8,
9,
10,
11]. Although the primary concept of neuroinflammation refers to a neuroprotective response of non-neuronal cells reacting to alterations in CNS homeostasis, its chronicity may also involve neurodegenerative aspects. In AD, this has been correlated to dysfunctional alterations in the phenotype of reactive microglia, resulting in increased production of amyloid fibrils [
12,
13,
14] and phagocytosis of healthy neurons [
15,
16,
17]. In this view, two opposite functional classifications of reactive microglia have been introduced: the M1-neurodegenerative/proinflammatory phenotype, and the M2-neuroprotective/anti-inflammatory phenotype [
18]. However, transcriptome studies in different models of neuroinflammation indicate the simultaneous expressions of both neurodegenerative and neuroprotective factors by microglia [
19]. Therefore, M1 and M2 should be proposed, more properly, as conjectural opposites in a wide range of reactivity states. Morphological traits of microglia dysfunction during neuroinflammation consist of loss of cytoplasmic processes and elongation of the cell body, resulting in the amoeboid morphology [
20]. In the normal CNS, microglial cytoplasmic processes are numerous, thin and highly branched: they extend from the cell body, acting as sensors in the surrounding microenvironment [
4]. In neuroinflammation, the branching of microglial cytoplasmic processes is oriented towards pro-inflammatory molecules, following chemotactic and mechanotactic signals, thus playing a key role in phagocytosis [
4,
10].
It is commonly accepted that reactive microglia induce reactivity of astrocytes [
21], characterized by hypertrophic morphology and increased expression of the astrocyte marker glial fibrillary acidic protein (GFAP) [
22] in astrocyte cytoplasmic projections (APJs). Reactive astrocytes may in turn undergo neurodegenerative phenotype changes in AD chronic neuroinflammation [
23,
24,
25], likely induced by pro-inflammatory microglia [
24]. However, these reciprocal induction exchanges do not clarify whether microglia, although being the first glial cell line to “react” to Aβ-peptide, is also the first one to “sense” it. Actually, this hypothesis appears questionable when considering some morphofunctional traits of protoplasmic astrocytes in gray matter. Indeed, APJs are numerous and highly ramified, forming a dense spongious meshwork throughout the gray matter. APJs express high levels of connexins, among which connexin 43 (Cx43) is the predominant one, enabling them to establish reciprocal gap junctions. By means of such connections, astrocytes behave as a functional syncytium [
26], and play structural and maintenance roles in the CNS [
12]. It is worth noting that the astrocyte endfeet of glia limitans wrap around blood vessels and need Cx43 to facilitate the entry of plasma ultrafiltrate into the neuropil. Indeed, astrocytes may also be involved in plasma ultrafiltrate diffusion throughout the parenchyma from arteries to veins, thus establishing a glymphatic circulation within the tissue [
27]. Besides, astrocytes directly interact with neurons and microglia through Cx43-mediated gap junctions [
28] and β1 integrin-mediated cell-cell contacts [
10], respectively.
These considerations suggest that contacts of APJs with Aβ-peptides are early events in the pathogenesis of AD, thus raising the question of whether Aβ may affect the activities of astrocytes prior to the onset of their reactivity. Reasonably, such an hypothesis could also affect the microglial response, due to the constitutive, mutual interactions between these two cell types [
12]. In our previous studies on animal models of CNS aging it was demonstrated that Aβ-peptide deposition induces fragmentation of APJs (clasmatodendrosis) and a consequent decrease in APJ-mediated clearance activity [
29]. In the same models, clasmatodendrosis underlay the disruption of the astrocyte meshwork, impairing branching of microglia and, in turn, their clearance activity [
10]. Actually, clasmatodendrosis involves a decrease in astrocyte expression of GFAP and can be classified as a passive, non-reactive change due to altered environmental conditions [
30] rather than a reactive response of astrocytes.
Considering that the sub-chronic inflammation frequently occurring in the aged CNS, represents a prodrome of AD [
13], a first aim of this study was to verify the presence and role of clasmatodendrosis in a transgenic mice model of Aβ-deposition (TgCRND8). Indeed, a working hypothesis of this study is that astrocytes engage in early interactions with Aβ peptides. The consequent induction of clasmatodendrosis could therefore affect astrocytes, leading to increased Aβ-loading in this AD model as well. Likewise, microglial clearance may be impaired by reduced contact interactions between APJs and microglial branches. High resolution confocal analyses were performed in mice at three stages of disease, namely: 2 months old mice (2m-Tg-m), characterized by mild cognitive impairment in the absence of amyloid plaques; 6 and 12 months-old mice (6m- and 12m-Tg-m), representing the intermediate and advanced stages of the disease, respectively.
Although the association of amyloid plaques with a distinctive peri-plaque gliosis is known, the role played by APJs involved in this reactive response has not been adequately investigated. The debate focuses on whether such association exerts neuroprotective or neurodegenerative effects [
31]. On the one hand, peri-plaque gliosis may play a barrier-like role similar to perivascular gliosis. Moreover, astrocytes express Aβ degrading enzymes [
32,
33], and can clear small deposits of Aβ fibrils [
29,
34], although it is unclear whether these enzymes are released in peri-plaque gliosis. On the other hand, it has been suggested that astrocytes express Aβ-peptide and contribute significantly to Aβ deposition [
35]. This neurodegenerative
vs. neuroprotective paradigm also involves the growth of amyloid plaques. In APP/PS1 AD mice model, a positive correlation was found between gliosis and Aβ-plaque growth by
in vivo multiphoton microscopy [
36], whereas this correlation was negative in
ex vivo investigations after attenuation of astrocyte reactivity [
37]. Finally, beside M1 and M2, a definite transcriptomic signature (A1) has been suggested to characterize neurotoxic astrocytes in AD [
23]. Supporting this hypothesis, saturated lipids contained in apolipoproteins E (APOE) and J (APOJ) were identified as probable astrocyte-derived neurotoxic factors [
38]. Moreover, the involvement of APOE4, an isoform of the APOE family, in Tau-mediated neurodegeneration [
39] and constitutive expression of the peptide Aβ [
40] has been recently suggested. However, the persistent homeostatic instability and intensification of astrocyte activity, may
per se result in the impairment of relevant functions, such as glutamate uptake [
41,
42], K+ buffering [
43], and GABA modulation [
44]. In addition, energy supply to neurons becomes inadequate [
45], entailing production of harmful fatty acid metabolites and reactive oxygen species [
46] as a further maladaptive side effect.
Given this fragmentary information, a further aim of this study was to broaden the current knowledge on the morphological and functional features of astrocytes involved in peri-plaque gliosis, in order to get new insights on their role in amyloid plaque build-up.
4. Discussion
The data in this study provided consistent support to the working hypothesis, confirming that Aβ deposition may exert early non-reactive effects on astrocytes that, in turn, impair astroglial and microglial clearance activity. The theoretical basis for this hypothesis was provided by previous studies carried out in rat models of CNS aging [
29,
10].
According to the hypothesis it was found that astrocytes early interact with Aβ-peptides, before the buildup of amyloid plaques and the consequent onset of their reactivity. The data reported here show that this interaction results in clasmatodendrosis and astrocyte meshwork disruption. Such non-reactive modifications are related to an altered Aβ clearance activity of astrocytes as well as microglia, which exhibit a contextual senile-like phenotype and deficits in key migratory processes. These patterns have also been identified in all subsequent stages of the disease, apart from areas occupied by amyloid plaques. In these plaque microdomains both microglia and astroglia show a typical reactive morphology. Contextually, our data suggest that reactive astrocytes enveloping amyloid plaques within glial scar-like formations are involved in merging processes between Aβ-deposits and, therefore, in plaque build-up.
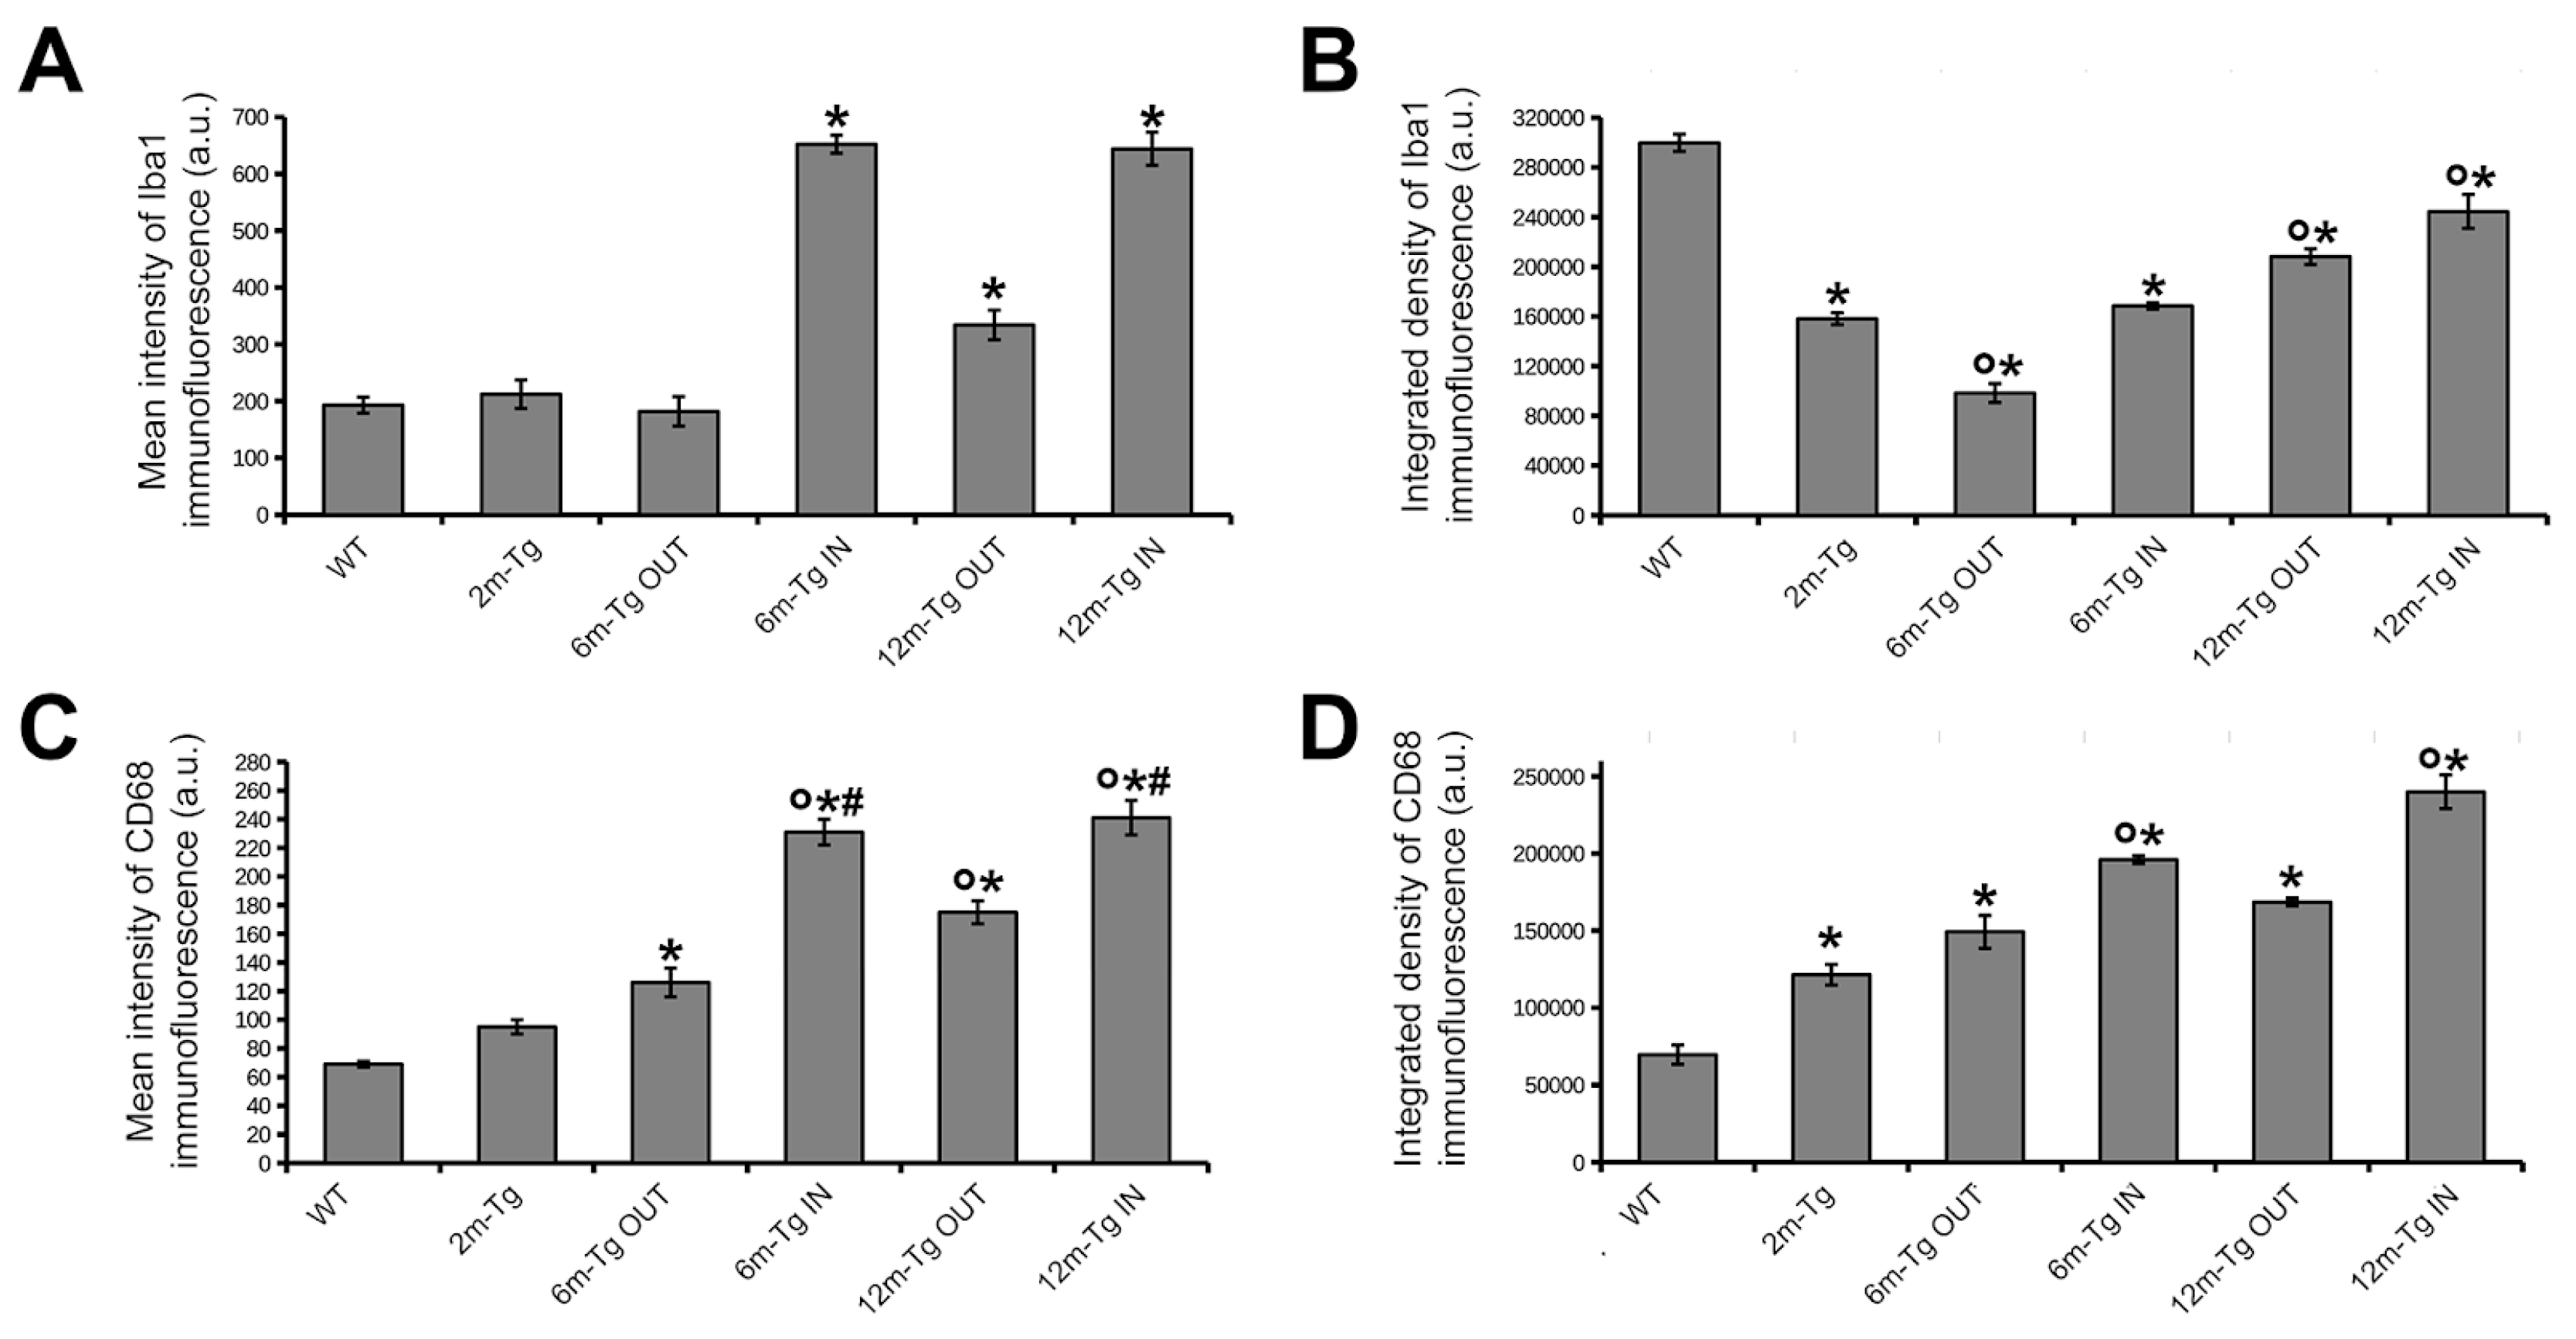
It is currently accepted that microglial phagocytosis consists of three steps: i) the “find me”, namely microglial targeting and migrating to proinflammatory molecules; ii) the “eat me”: phagocytosis of these molecules; iii) the “digest me”: endosomal-lysosomal pathway to molecular degradation. Comparison of the expression and cellular localization of two different markers of microglia reactivity (Iba1 and CD68) in transgenic mice allowed differential activation of cellular processes involved in stages (i) and (ii) to be discerned
in situ. In 2m-Tg-m, microglia were characterized by increased expression of the phagocytosis marker CD68, compared with WT-m, indicating the onset of reactivity. Numerous factors induce microglial reactivity: neuronal release of chemokines [
59,
60,
61], alarmins [
62], ATP [
63] and glutamate [
64]; metabolic and redox alterations [
65,
66]; cellular debris and misfolded proteins in the extracellular microenvironment [
3]; mechanical alterations of the ECM [
67]. On the other hand, reactive microglia of 2m-Tg-m showed low levels of Iba1 expression and branching, suggesting an impaired “find me” process in phagocytosis. It should be noted that similar features of microglial reactivity were shown in the aged CNS,
i.e. inefficient clearance activity [
68], despite considerable expression of CD68 [
69]. It is worth recalling that low levels of Iba1 and high expression of CD68 have been shown to characterize microglia in age-associated white matter lesions [
70]. Moreover, defective branching of microglia and subsequent impairment of their clearance activity are correlated with disassembly of the astrocyte meshwork in the hippocampus of aged rats [
10]. The present data indicate that in our model of Aβ deposition, the expression of a senile like phenotype by microglia, suggestive of altered migration, correlates spatially and temporally with a significant loss of astrocytic meshwork integrity since the early stages of the disease.
Regarding astrocyte functions, it could be expected that in aged rats (22 months), increased deposition of autofluorescent Aβ-peptide on neurons would induce clasmatodendrosis, APJ meshwork disassembly and consequent impairment of astrocytic clearance [
29]. However, it was not predictable that similar effects of the Aβ-peptide could be revealed in 2m-Tg-m as well, being relevant to the early increase of Aβ-load in
stratum pyramidale neurons. In both 6m- and 12m-Tg-m, the presence of amyloid plaques added further complexity, as surrounding astrocytes were characterized by hypertrophic morphology, and microglia by elevated expression of Iba1 and CD68. Nonetheless, in non-plaque microdomains both glial cell populations showed morphological traits and immunohistochemical responses similar to their counterparts in 2m-Tg-m, implying the presence of clasmatodendrosis related impairment of Aβ-clearance also in 6m- and 12m-Tg-m. As a whole, above data suggest that clasmatodendrosis and APJ meshwork disassembly in non-plaque microdomains may favor Aβ-load and, in turn, Aβ-plaque formation at all stages of disease.
It is known that plaque-microdomains are characterized by specific microenvironmental conditions, which strongly affect the phenotype of microglia [
71,
72] which releases signaling molecules,
e.g. proinflammatory cytokines, and induces astrocyte reactivity [
8,
73]. This provides a rationale for the known correlation between such induction and presence of amyloid plaques. Accordingly, the present investigation provides evidence of numerous astrocyte and neuron debris adhering to the plaques, according to a pattern of cell damage and release of proinflammatory molecules and chemoattractants. On the other hand, the present data show that at any stage of the disease, the APJs were usually in contact with amyloid accumulations, ranging from the smaller deposits in 2m-Tg-m to the larger plaques in 12m-Tg-m. Reasonably, these associations between cytotoxic amyloid bodies and related microenvironmental changes, can deeply alter astrocyte phenotype and functions in disease progression. This hypothesis is supported by the similarities described here between APJs in peri-plaque and perivascular scars. The latter were frequently observed in the CA1 hippocampus of 12m-Tg-m, and are well-known key signatures of the impairment of the blood-brain barrier [
74] leading to uncontrolled blood-tissue exchanges and to increased microperfusion dynamics and, in turn, to altered mechanical properties of the tissue. Astrocytes are affected by such environmental changes, since they express the Piezo1 mechanosensor, whose involvement in cognitive function was suggested by a recent study in mice [
75]. In injured neocortex and spinal cord of rats, atomic force microscopy measurements showed an inverse relation between stiffness of ECM and astrocyte expression of GFAP and, even more important, tissue consistency at glial scars was softer than in the surrounding area [
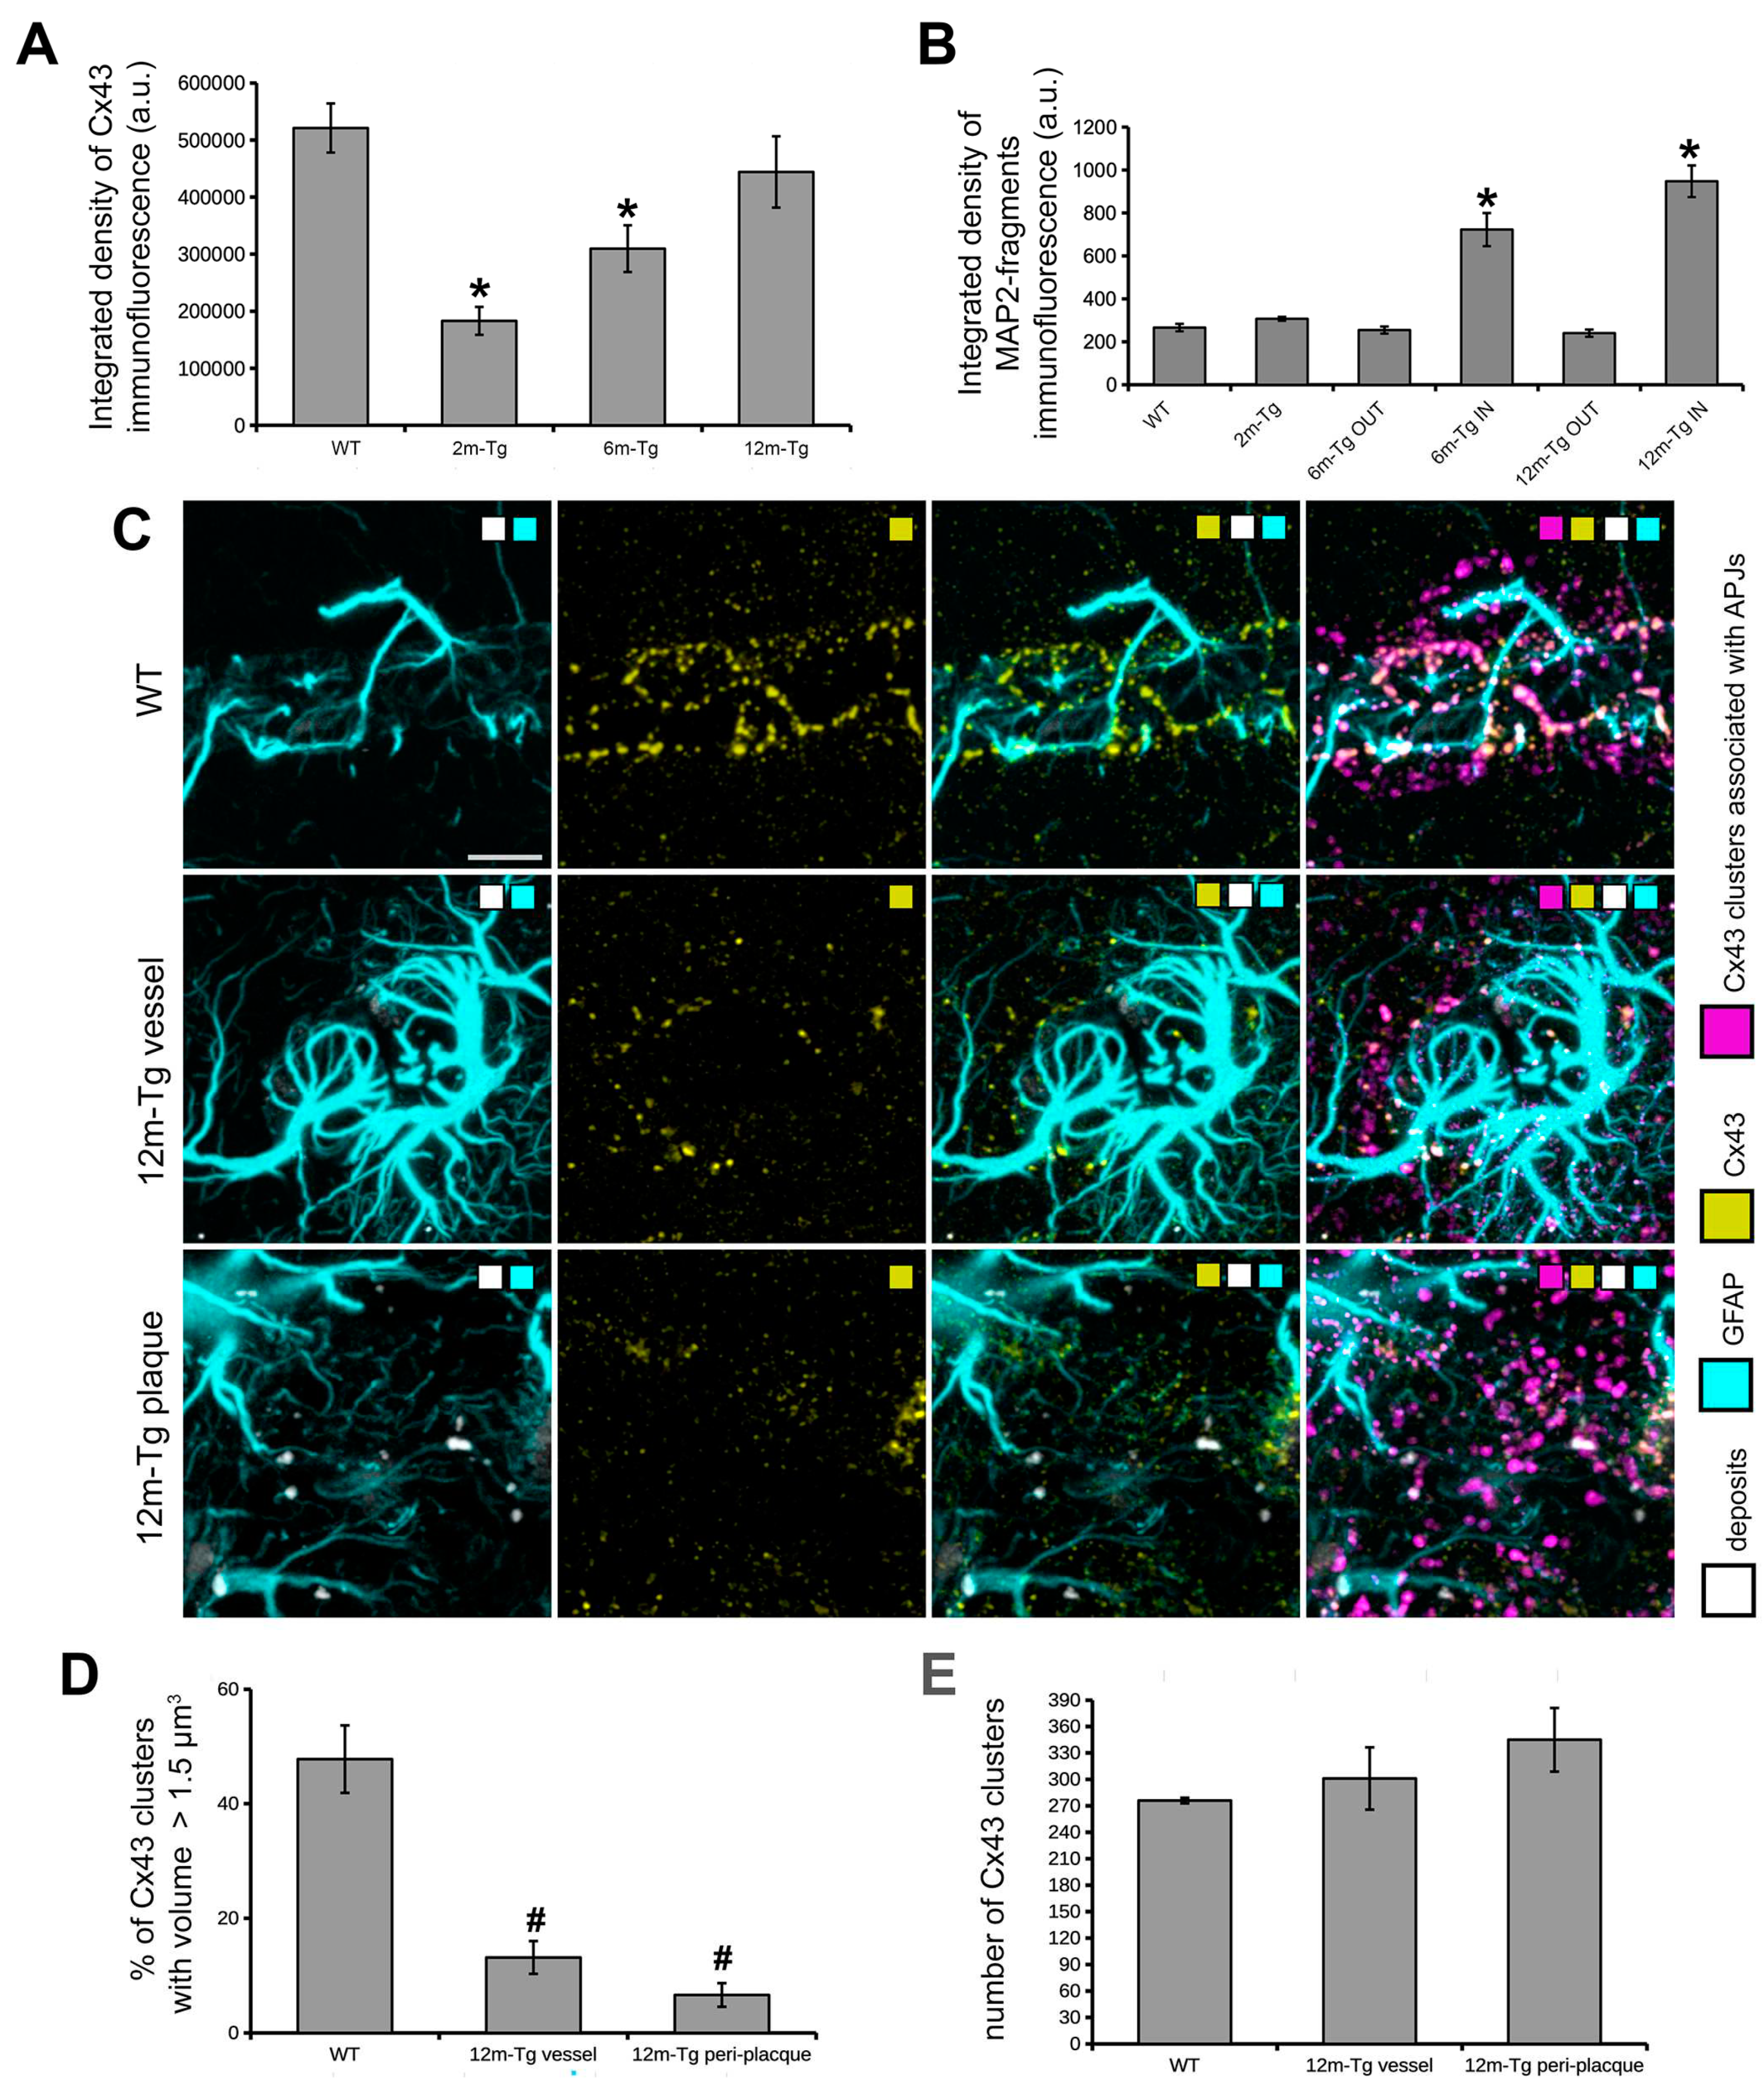
76]. In this study we observed morphological patterns of edema with concomitant recovery of branching and GFAP expression by astrocytes, in plaque microdomains of 6m- and 12m-Tg-m. Therefore, it can be proposed that local microenvironmental factors, possibly including mechanical stimuli, contribute to promoting the hypertrophic transition of plaque-associated astrocytes, similarly to what we observe at the level of perivascular glial scar. Importantly, peri-plaque and peri-vascular reactive astrocytes shared a further remarkable similarity: both showed high expression of Cx43 assembled in morphometrically comparable clusters, suggesting a similar functional role. It is known that glial scars formed by proliferating astrocytes perform a barrier function in neuropil and blood vessel repair, and in regeneration after injury [
12]. Indeed, in rat models of ischemic injury, proliferative astrocytes displayed high expression of Cx43, which was suggested to play a role relevant to tissue repair [
77]. In this view, present findings support the hypothesis that astrocyte gliosis in plaque microdomains may exert opposite effects. On the one hand, it may result in neuroprotection: peri-plaque APJs meshwork acts as a barrier between Aβ-plaques and dendrites, and possibly other tissue components. On the other hand, the recurrent patterns of APJ damage observed at these sites are indicative of the cytotoxic effects that these interactions induce on astrocytes, which may result in the exacerbation of their response, thus eliciting neurodegenerative side-effects.
Whether or not amyloid plaques are the main cause of neurodegeneration in AD remains a matter of debate. Nevertheless, clear-cut cytotoxic properties have been attributed to the major components of these plaques, i.e. the amyloid fibrils. Moreover, these accumulations of harmful Aβ-peptides and cell debris, are known to evoke major inflammatory responses from both astrocytes and microglia, being therefore expected to play a main role in the development of AD. The present data help to elucidate this issue, introducing a possible pivotal role of astrocytes in human AD. Indeed, in all stages of the disease, distinct interactions were found between APJs and autofluorescent deposits throughout the CA1 hippocampus. These deposits were obvious in the stratum pyramidale from the early stages of the disease, and in the late stages they were also clustered within the peri-plaque glial scars, closely related with the APJ meshwork. Such autofluorescent dense deposits radially surrounded the plaques or merged with them. Involvement of APJs in merging processes between deposits and plaques has also been observed. In consideration of these findings, we propose a novel aspect of astrocyte reactivity to overproduction of Aβ-peptides in AD: reactive astrocytes in the peri-plaque scar are involved in the clusterization of Aβ-deposits spread in the nervous tissue, thus contributing to amyloid plaque build up. Since a direct correlation links the surface area and the rate of exchange processes between cells and environmental components, it can be assumed that the cytotoxic interactions between Aβ peptides and CNS cells, including astrocytes, are lesser when peptides are clustered in amyloid plaques rather than dispersed throughout the nervous tissue. This hypothesis sheds light on relevant processes underlying amyloid plaque build up and proposes for these structures in AD a role of repositories for cytotoxic molecules isolated from nerve tissue by glial cells. In the interaction framework, astrocytes may partially compensate for the inefficiency of microglia to clear Aβ-peptides. Indeed, the accumulation of possible targets in microenvironmental domains characterized by high concentration of chemotactic molecules may favor microglia to complete the “find me” step of phagocytosis.
Figure 1.
A-D) Comparison between the features of microglial reactivity and astrocyte modifications, both reactive and non-reactive in the transgenic mouse hippocampus. Hippocampal sections of WT-m (A), and 2m- (B), 6m- (C) and 12m- (D) Tg-m were stained to reveal microglia Iba1 (cyan), astrocyte GFAP (yellow) and Aβ-peptides (magenta). A) Low magnification z-projections of the CA1 in WT-m; inner inset in A shows magnified details of contacts (thin arrows) between microglia branches and APJs. B) Low magnification z-projection of the CA1 in 2m-Tg-m; inner inset in B shows magnified details of contacts (thin arrows) between microglia branches and APJs. APJs involved in the formation of glia limitans perivascularis are shown in A and B (dashed box). C) Low magnification z-projection of the CA1 in 6m-Tg-m. Panels c1-c3 are representative images of astrocytes and microglia in non-plaque (c1) and in plaque- (c2, c3) microdomains. Small sized plaque is schemed in c2. Inset 1 shows magnified details of patterns of microglial phagocytosis on plaques. D) Low magnification z-projection of the CA1 in 12m-Tg-m. Panels d1 and d2 are representative images of astrocytes and microglia in non-plaque (d1) and plaque- (d2) microdomains; the arrow in panel d1 indicates hypertrophic APJs involved in the formation of a perivascular glial scar. Inset 2 shows details of patterns of microglial phagocytosis of plaques. Vertical dotted lines delimit the stratum pyramidale. Bars: A,B,c1-c3,d1,d2 = 35 µm; 1,2 = 5 µm; inner insets = 11 µm. E-G) Immunofluorescence intensity of Aβ-peptide in the stratum pyramidale (E) and GFAP in the CA region (F,G) of WT-m, and 2m-, 6m- and 12m-Tg-m. All data were obtained from 5 mice per experimental group and are expressed as mean ± SE intensity of immunofluorescence. E) Integrated density of Aβ-immunofluorescence (F(3,16) = 1683, *P < 0.05 vs WT, °P < 0.01 vs 2m-Tg, § P < 0.05 vs 6m-Tg). F, G) Mean Intensity (F) and integrated density (G) of GFAP immunofluorescence: E) F(5,19) = 43, *P < 0.05 vs WT, °P < 0.001 vs 2m-Tg; G) F(5,19) = 63.2, *P < 0.05 vs WT, °P < 0.01 vs 2m-Tg, §P < 0.001 vs 6m-Tg IN. All statistical analyses were performed by One Way ANOVA followed by Tukey post hoc tests.
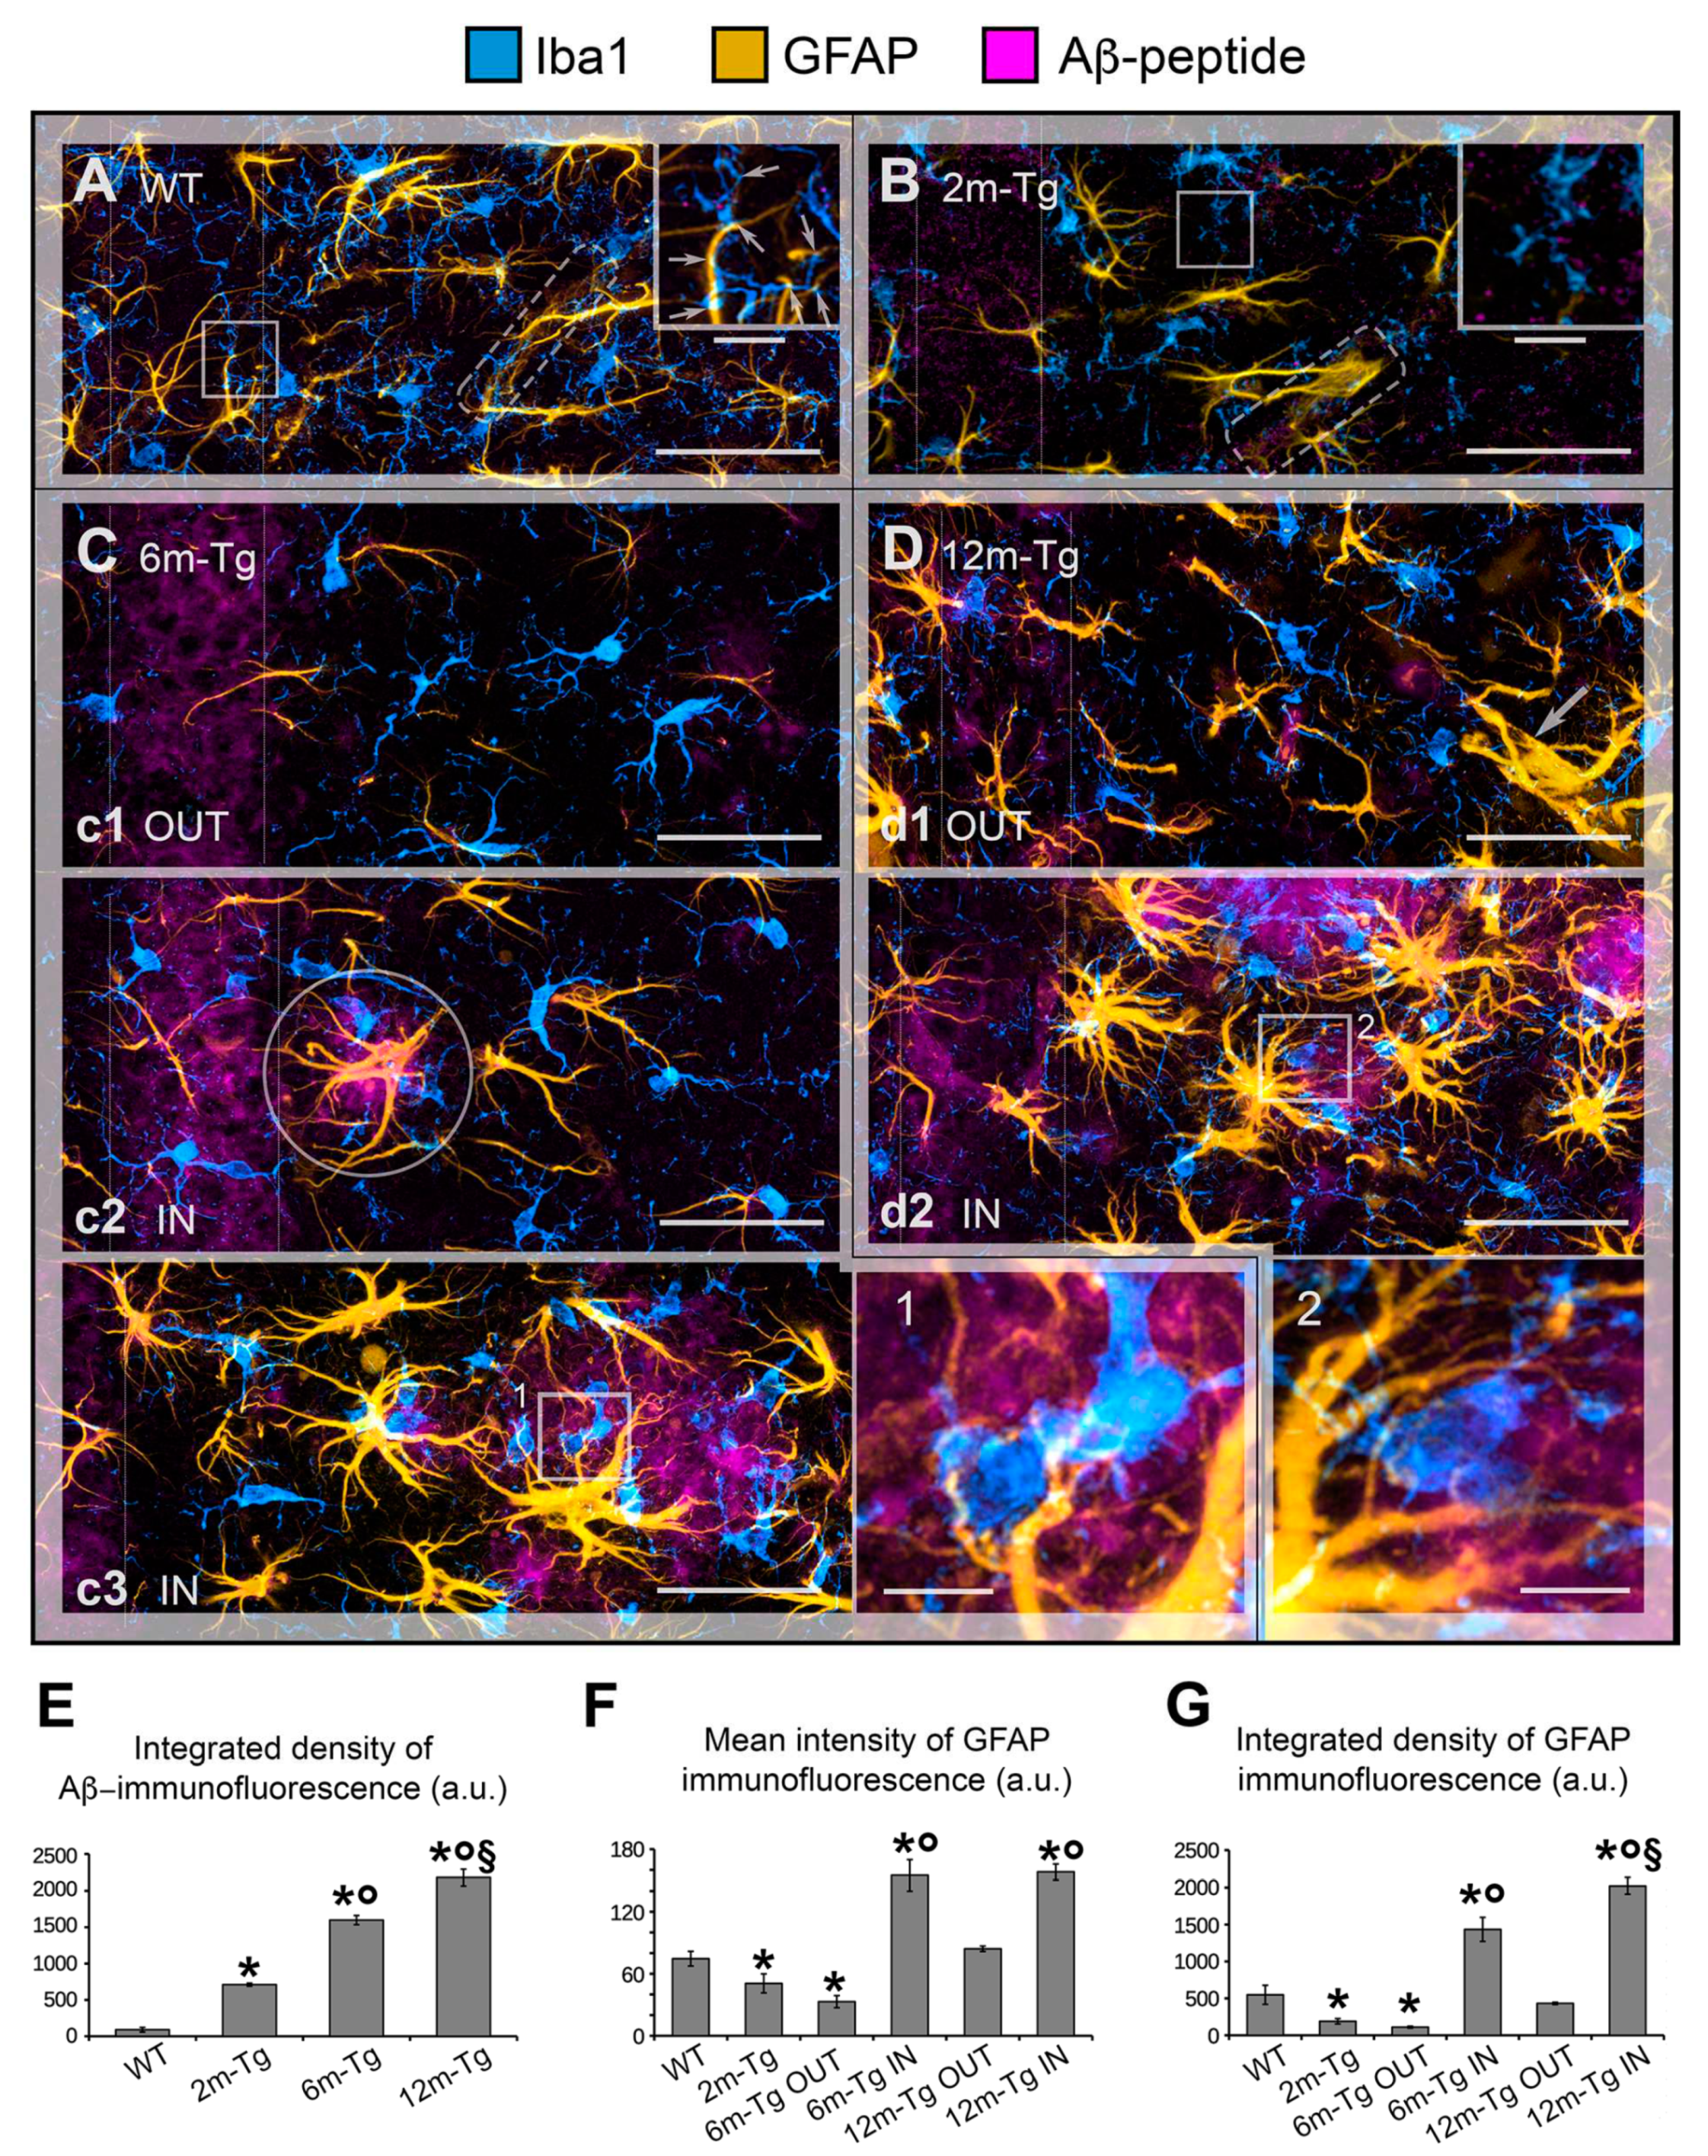
Figure 2.
Reactivity of microglia in the hippocampus of transgenic mice (TgCRND8). Microglia in CA1 hippocampus of WT-m (A), and 2m- (B), 6m- (C) and 12m- (D) Tg-m were immunostained to reveal Iba1 (cyan) and CD68 (yellow); autofluorescence from mixed lipofuscin/Aβ-peptides is also shown (denatured peptides, magenta). A) Low magnification z-projections of the CA1 in WT-m; insets 1 and 2 show details of the corresponding areas in A, inner insets in 1 and 2 show magnified details of expression of Iba1 (upper inset in 1, left inset in 2) and CD68 (lower inset in 1, right inset in 2) on microglial branches. B) Low magnification z-projections of the CA1 in 2m-Tg-m; insets 3 and 4 show details of the corresponding areas in B; inner insets in 3 and 4 show magnified details of expression of Iba1 and CD68 on the cell body (upper insets) and branches (lower insets) of microglia. C) Low magnification Z-projection of the CA1 in 6m-Tg-m. Panel c1 shows microglia crowding around large deposits of autofluorescence (IN); panel c2 shows microglia far from the autofluorescent deposit (OUT). Insets 5 and 6 show magnified details of the corresponding areas in c1 (5) and c2 (6): merged Iba1 and CD68 immunofluorescence (left panel) and CD68 immunofluorescence alone (right panel) are shown; λ, 𝛼, δ indicate three distinct microglial cells; arrows in inset 5 indicate soma-soma adhesion between microglia. D) Low magnification z-projection of the CA1 in 12m-Tg-m. Panel d1 shows microglia surrounding large deposits of autofluorescence (IN); arrows in inset 7 indicate soma-soma adhesion between microglia. Panel d2 shows microglia away from the autofluorescent deposits (OUT); arrows indicate branched microglia. Insets 7 and 9 show magnified details of the corresponding areas in d1 (7), and d2 (8,9); λ, 𝛼, δ indicate three distinct microglial cells. Inset 7a shows merged Iba1 and CD68 immunofluorescence (left panel) and CD68 immunofluorescence alone (right panel) in a single optical section of these cells; nuclei correspond to the inner circular unstained areas. Autofluorescence was omitted in all insets. Vertical dotted lines delimit the stratum pyramidale. Bars: A,B,c1,c2,d1,d2 = 35 µm; 1-9 = 10 µm; inner insets = 4 µm.
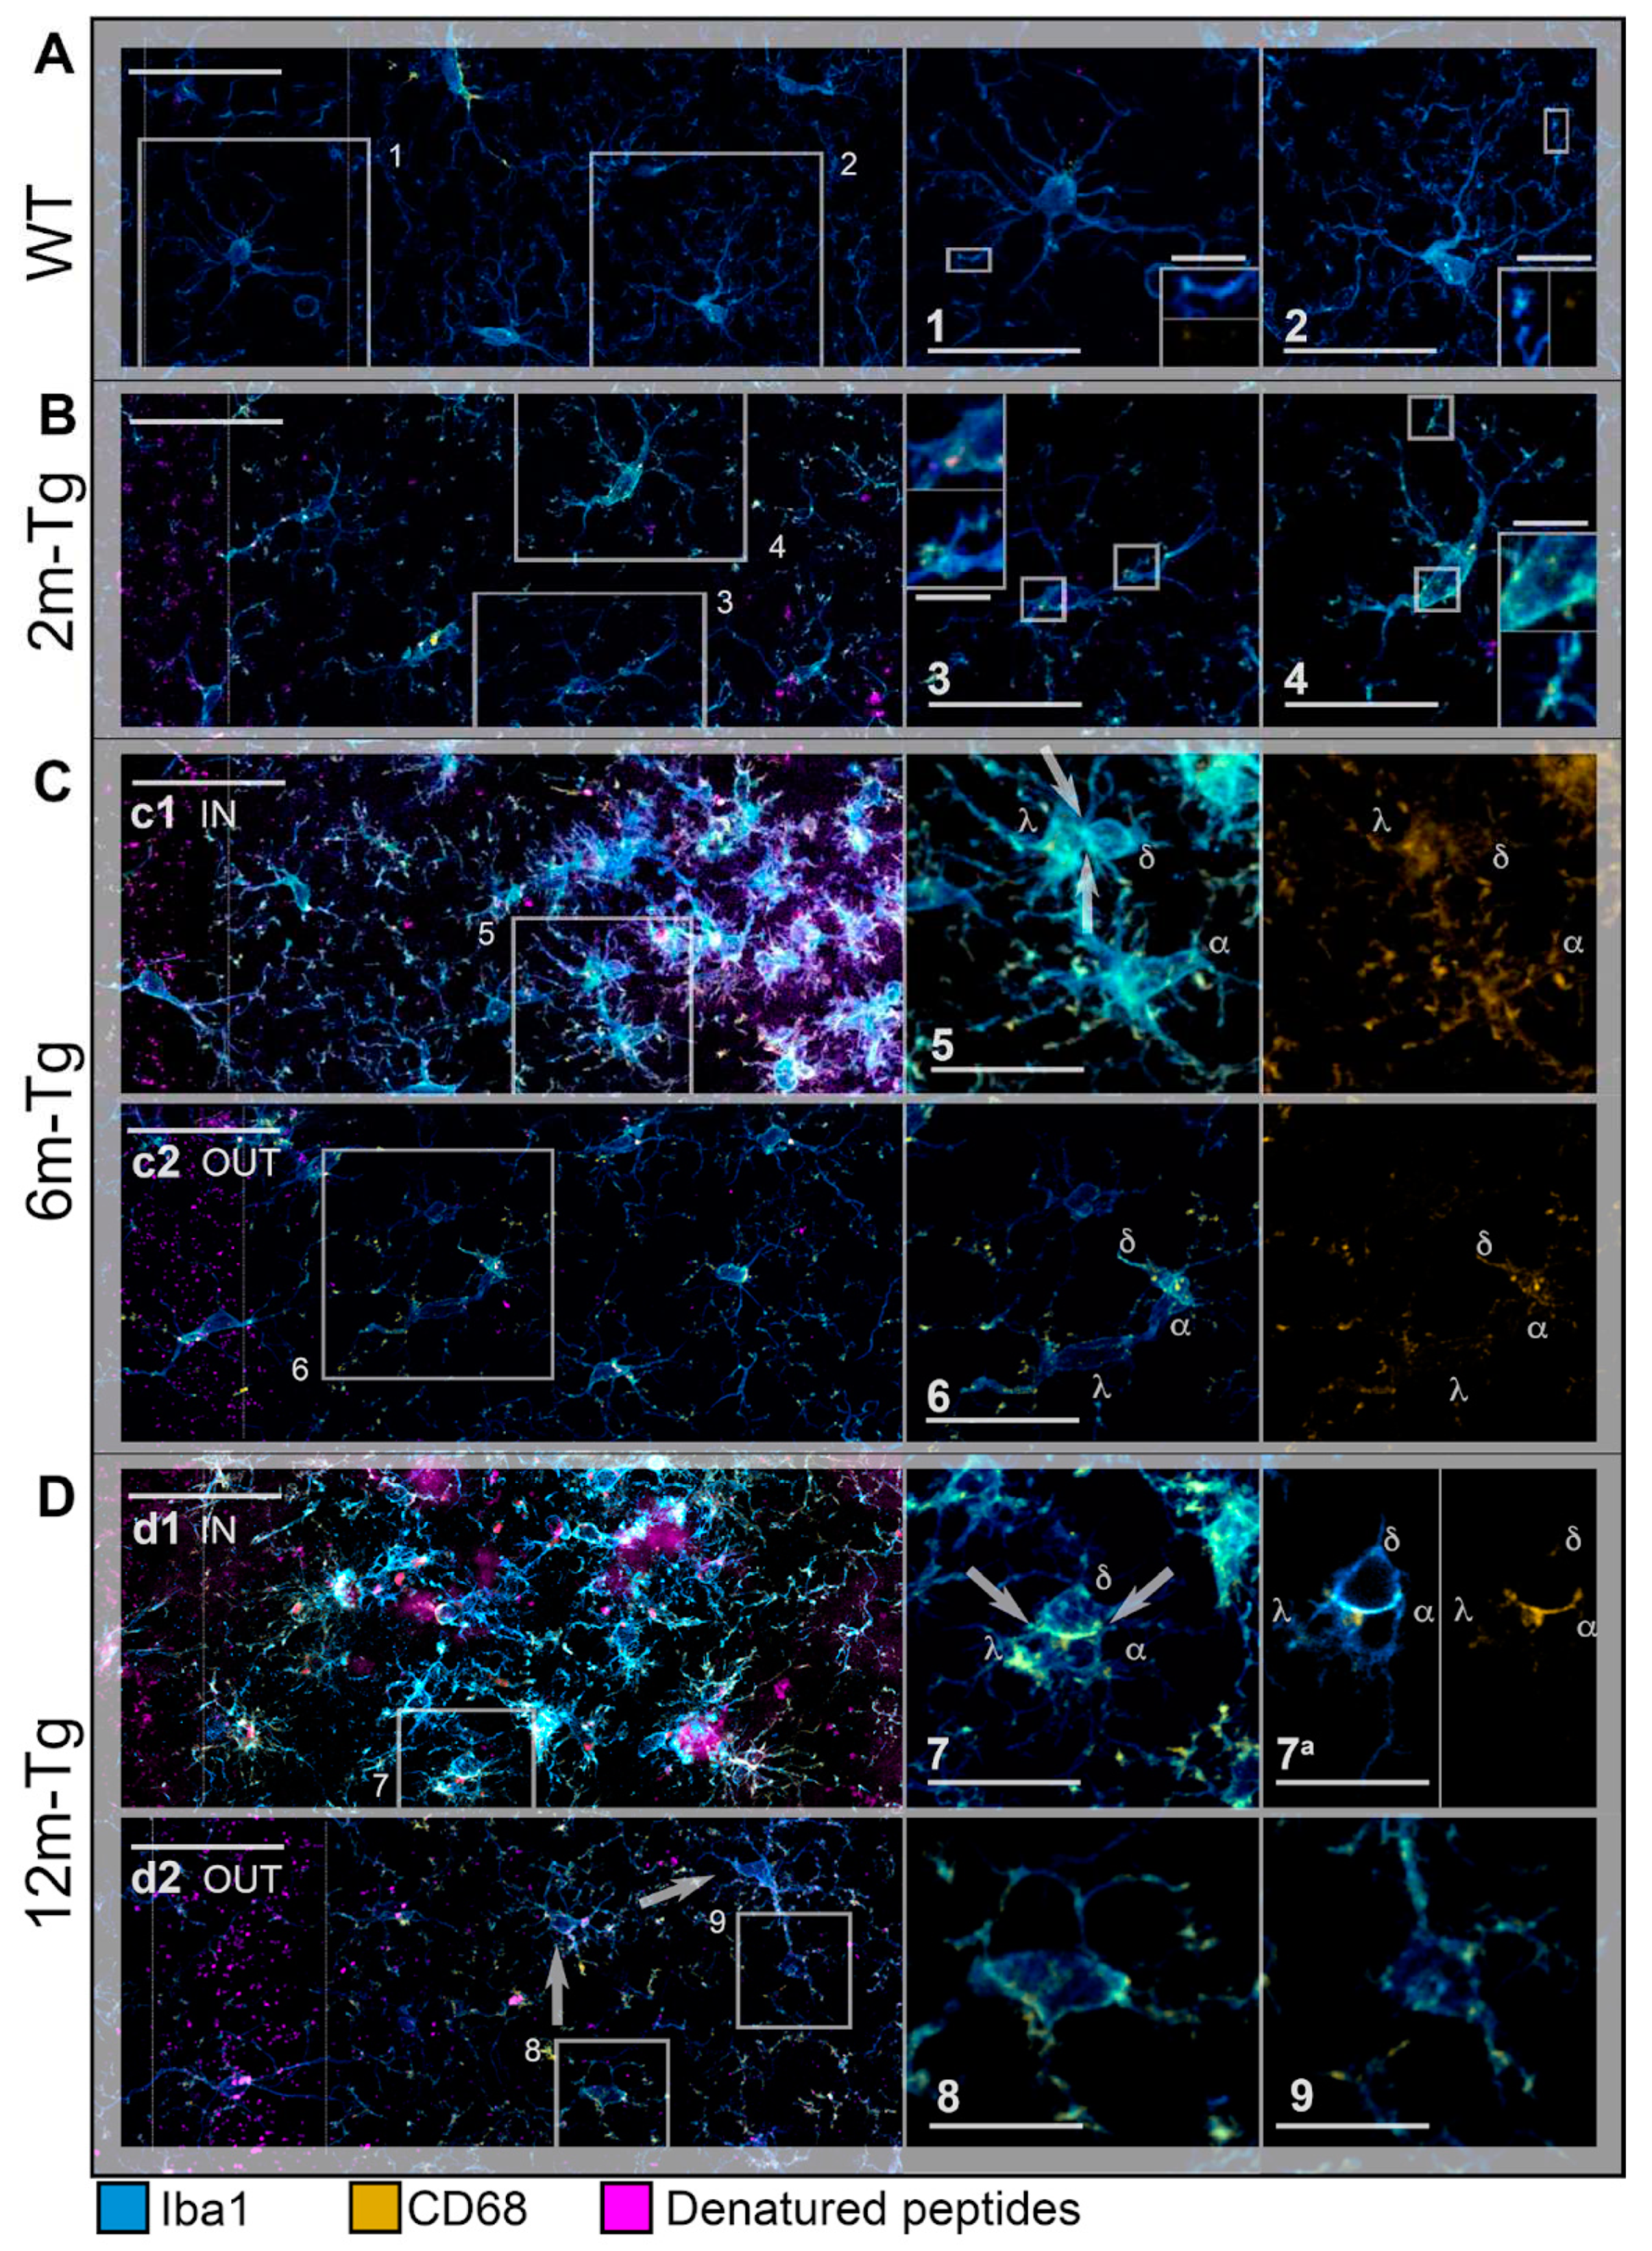
Figure 3.
Expression of Iba1 and CD68 in the hippocampus of transgenic mice. Mean intensity (A, C), and integrated density (B, D) of Iba1 and CD68 immunofluorescence were measured in the hippocampus of WT-m, and 2m-, 6m-and 12m-Tg-m. Values are expressed as mean ± SE. All statistical analyses were performed by One Way ANOVA followed by Tukey post hoc tests (n = 3): A) F(5,12) = 269, *P < 0.001 vs WT; B) F(5,12) = 69.7, *P < 0.05 vs WT, °P < 0.05 vs 2m-Tg; C) F(5,12) = 88.4, *P < 0.01 vs WT, °P < 0.001 vs 2m-Tg, #P < 0.001 vs 6m-Tg OUT; D) F(5,12) = 743, *P < 0.001 vs WT, °P < 0.001 vs 2m-Tg.
Figure 4.
Functional integrity of astrocyte meshwork in transgenic mouse hippocampus: morphological features. Astrocytes in the CA1 hippocampus of WT-m (A), and 2m- (B), 6m- (C) and 12m- (D) Tg-m were stained to reveal cytoskeletal GFAP (yellow); autofluorescence of Aβ peptides is also shown (denatured peptides, magenta). A) Low magnification z-projections of the CA1 in WT-m; insets 1 and 2 show magnified details of the corresponding areas in A (1) and 1 (2). B) Low magnification z-projection of the CA1 in 2m-Tg-m; insets 3, 4 show magnified details of the corresponding areas in B (3) and 3 (4). C) Low magnification z-projection of the CA1 in 6m-Tg-m. Panel c1 shows astrocytes in a plaque-microdomain; panel c2 shows astrocytes in a non-plaque microdomain; APJs involved in the formation of blood brain barrier are framed in c2. Insets 5-8 show magnified details of the corresponding areas in c1 (5), 5 (6), c2 (7) and 7 (8). D) Low magnification z-projection of the CA in 12m-Tg-m. Panel d1 (IN) shows astrocytes in a plaque-microdomain; panel d2 shows astrocytes in a non-plaque microdomain. Thin arrows indicate GFAP+ fragments; the thick arrow points to a spiraliform primary process. The vertical dotted lines delimit the stratum pyramidale. APJs involved in the formation of the blood brain barrier are framed in C. Insets 9-12 show magnified details of the corresponding areas in d1 (9,10), d2 (11) and 11 (12). Bars: A,B,c1,c2,d1,d2 = 33 µm; 1-12 = 4 µm.
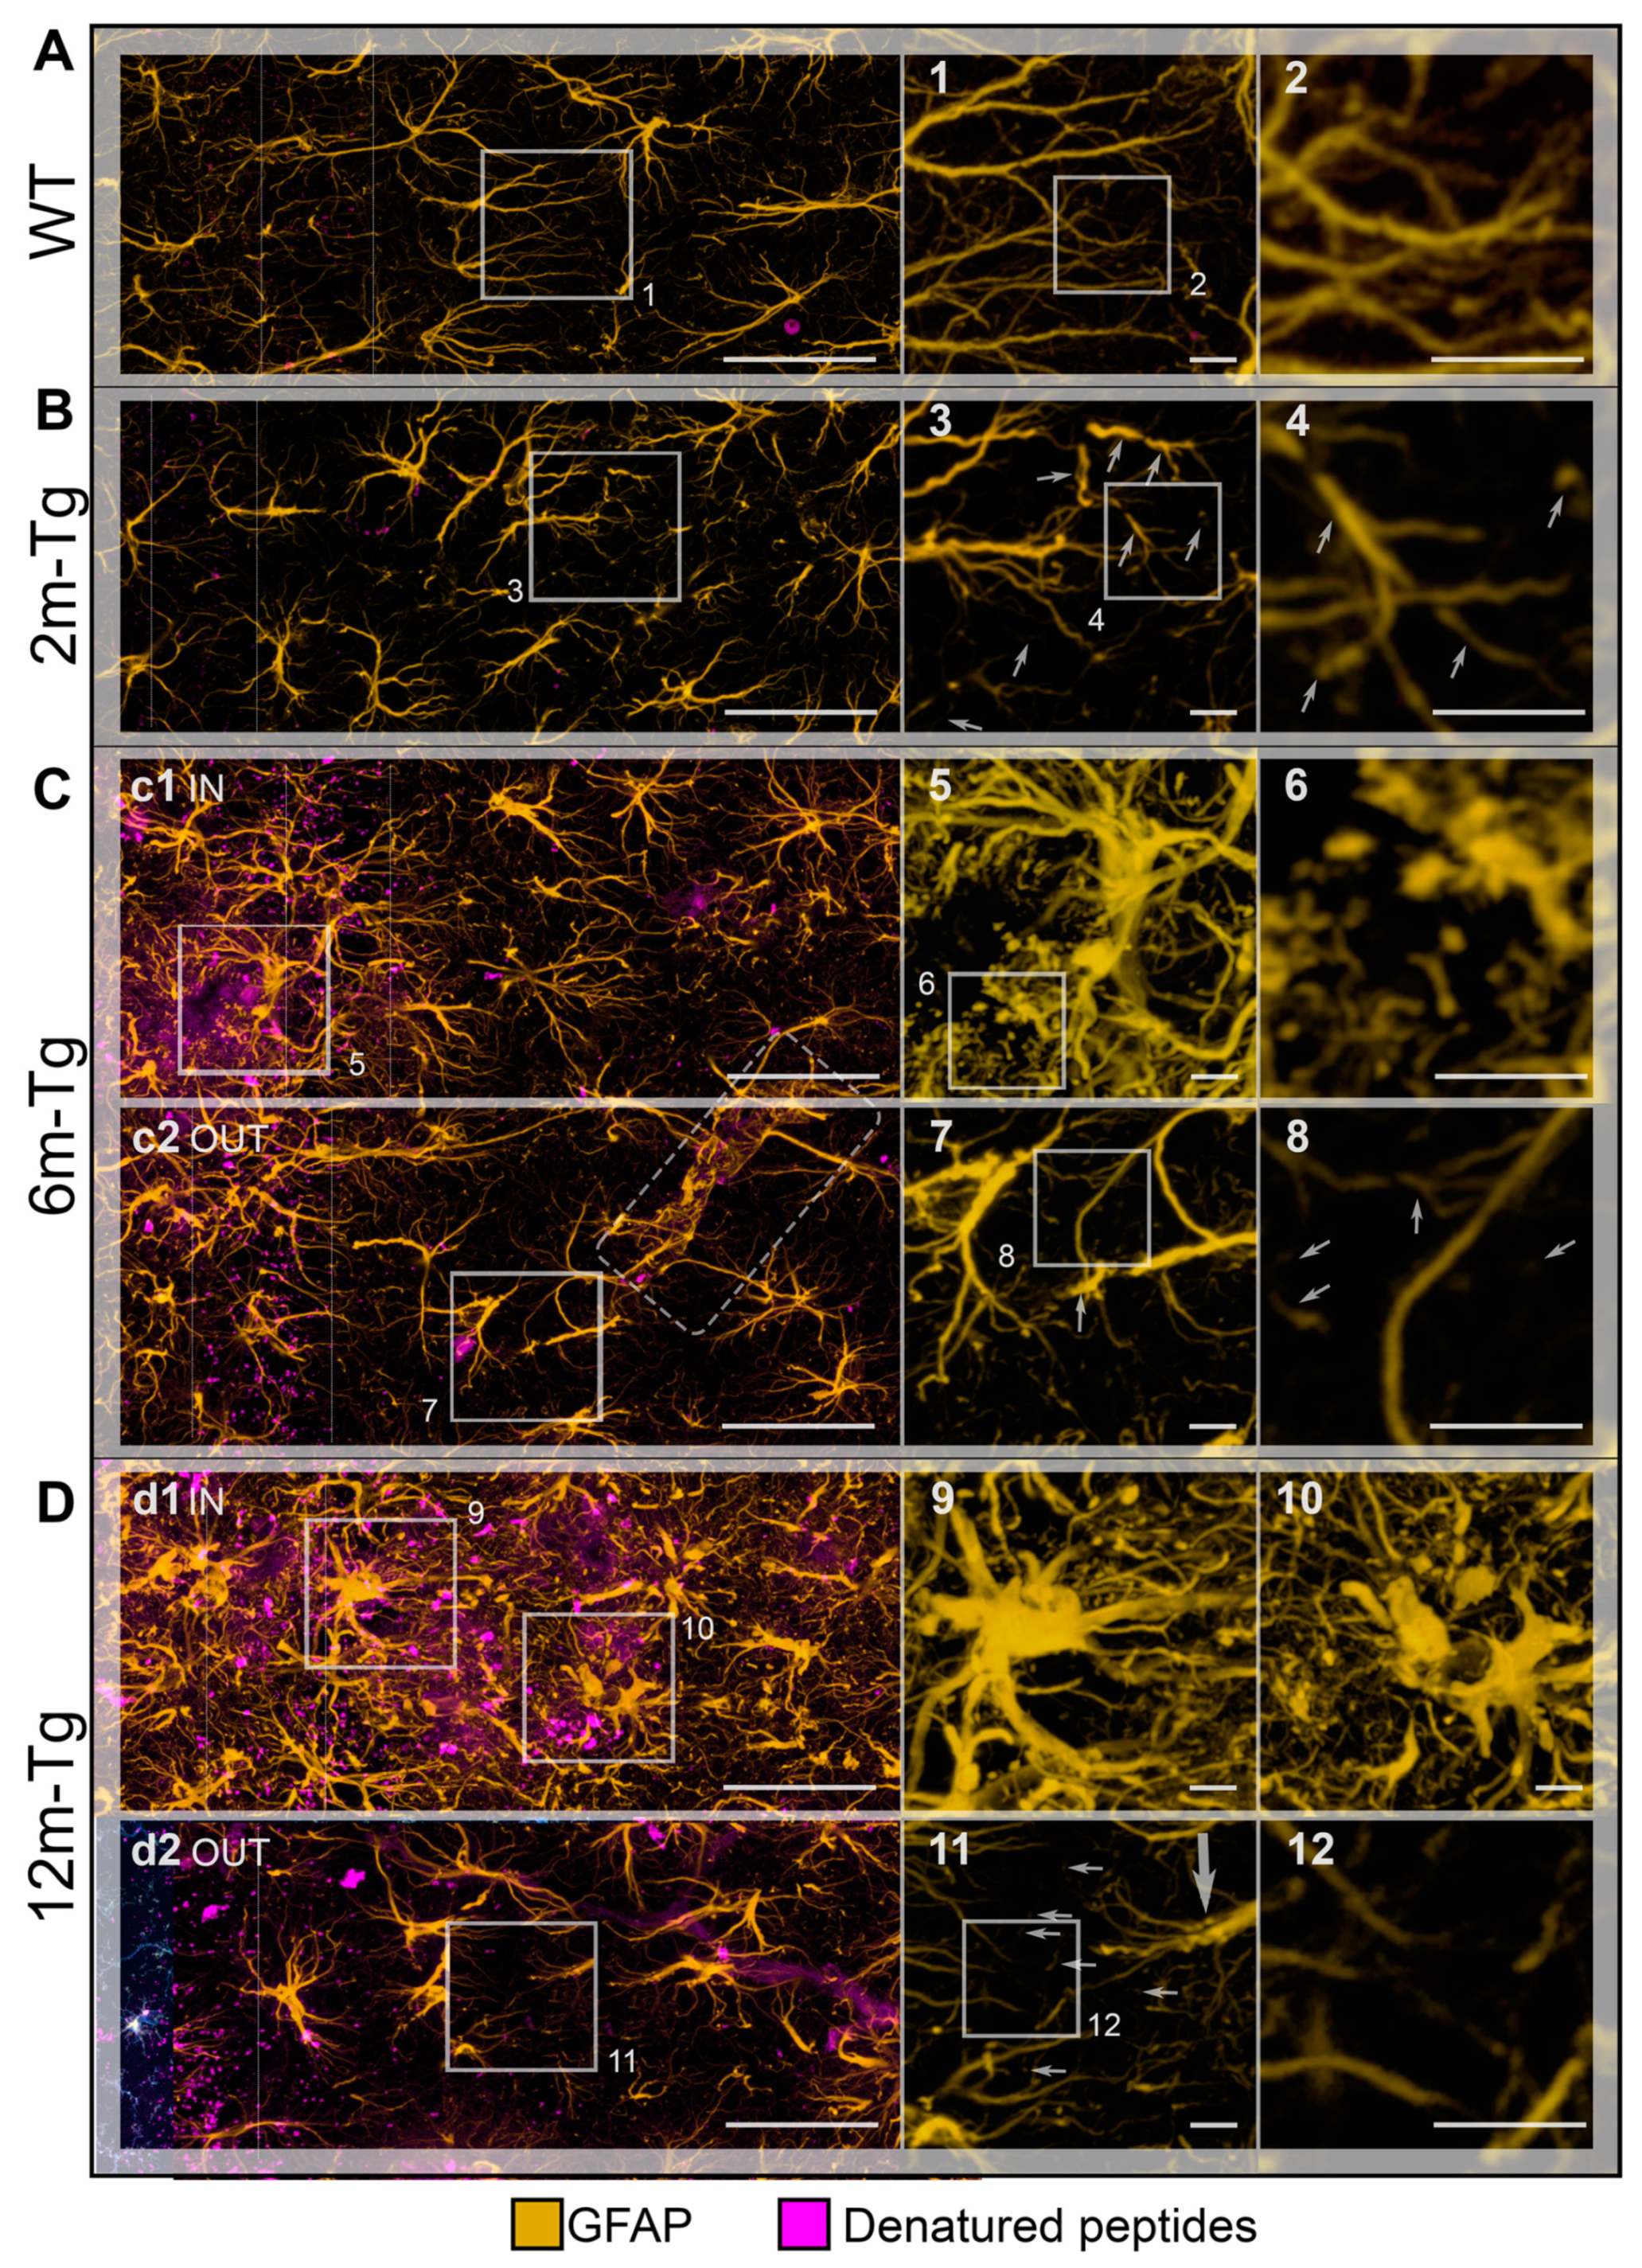
Figure 5.
Quantitative analysis of the functional integrity of the astrocyte meshwork in the hippocampus of transgenic mice. Sections of the hippocampus from WT-m, and 2m-, 6m- and 12m-Tg-m were stained for GFAP in astrocytes. APJs were traced by the ImageJ plugin “Simple Neurite Tracer” on 3D optical volumes (about 36,800 µm3). A) Total length of APJs (F(2,6) = 16.5, *P < 0.01 vs WT). B) Number of APJs that were neither engaged in connections with amyloid plaques nor in the blood brain barrier framework (F(2,6) = 31.97, *P < 0.01 vs WT, °P < 0.05 vs 12m-Tg. All statistical analyses were performed by One Way ANOVA followed by Tukey post hoc tests. C-F) The Sholl analyses were performed on representative astrocytes neither involved in amyloid plaques nor in the blood-brain barrier framework (supplementary Figure S1), from WT-m, and 2m- (D), 6m- (E) and 12m- (F) Tg-m. Linear plots show the number of intersections between APJs and Sholl’s spheres at increasing distance from the center of the cell. Inner insets show volume renderings of the analyzed APJs, the color scale provides topographic indications of the number of intersections at different distances from the center of the cell. G-J) MLA of the association of fluorescent deposits with APJs in the stratum pyramidale of transgenic mice. G). The 495-525l458 (magenta color scale) and 560-590l458 (green color scale) channels were merged to allow discrimination of APJs (white) and autofluorescent deposits (green) in the z-projections of the optical volumes (1st row) and individual optical sections (2nd row). The channel of autofluorescent deposits (magenta) obtained by MLA is shown in the 3rd row. Contacts (blue) between autofluorescent deposits and APJs (Gray) are shown in 4th row; autofluorescent deposits associated with APJs (cyan) are shown in 5th row. H-J) Quantitative evaluation of the total number of autofluorescent deposits (H), their association rate with APJs (I) and the number of non-associated deposits (J) in the CA1 stratum pyramidale of WT-m, and 2m-, 6m- and 12m-Tg-m. H) F(3, 8) = 47.1, *p < 0.01 vs WT, °p < 0.01 vs 6m-Tg OUT. I) F(3, 8) = 155, *p < 0.001 vs WT, °p < 0.01 vs 3m-Tg. J) F(3, 8) = 2032, *p < 0.01 vs WT, °p < 0.001 vs 3m-Tg, #p < 0.001 vs 6m-Tg OUT. Bars, G = 25 µm.
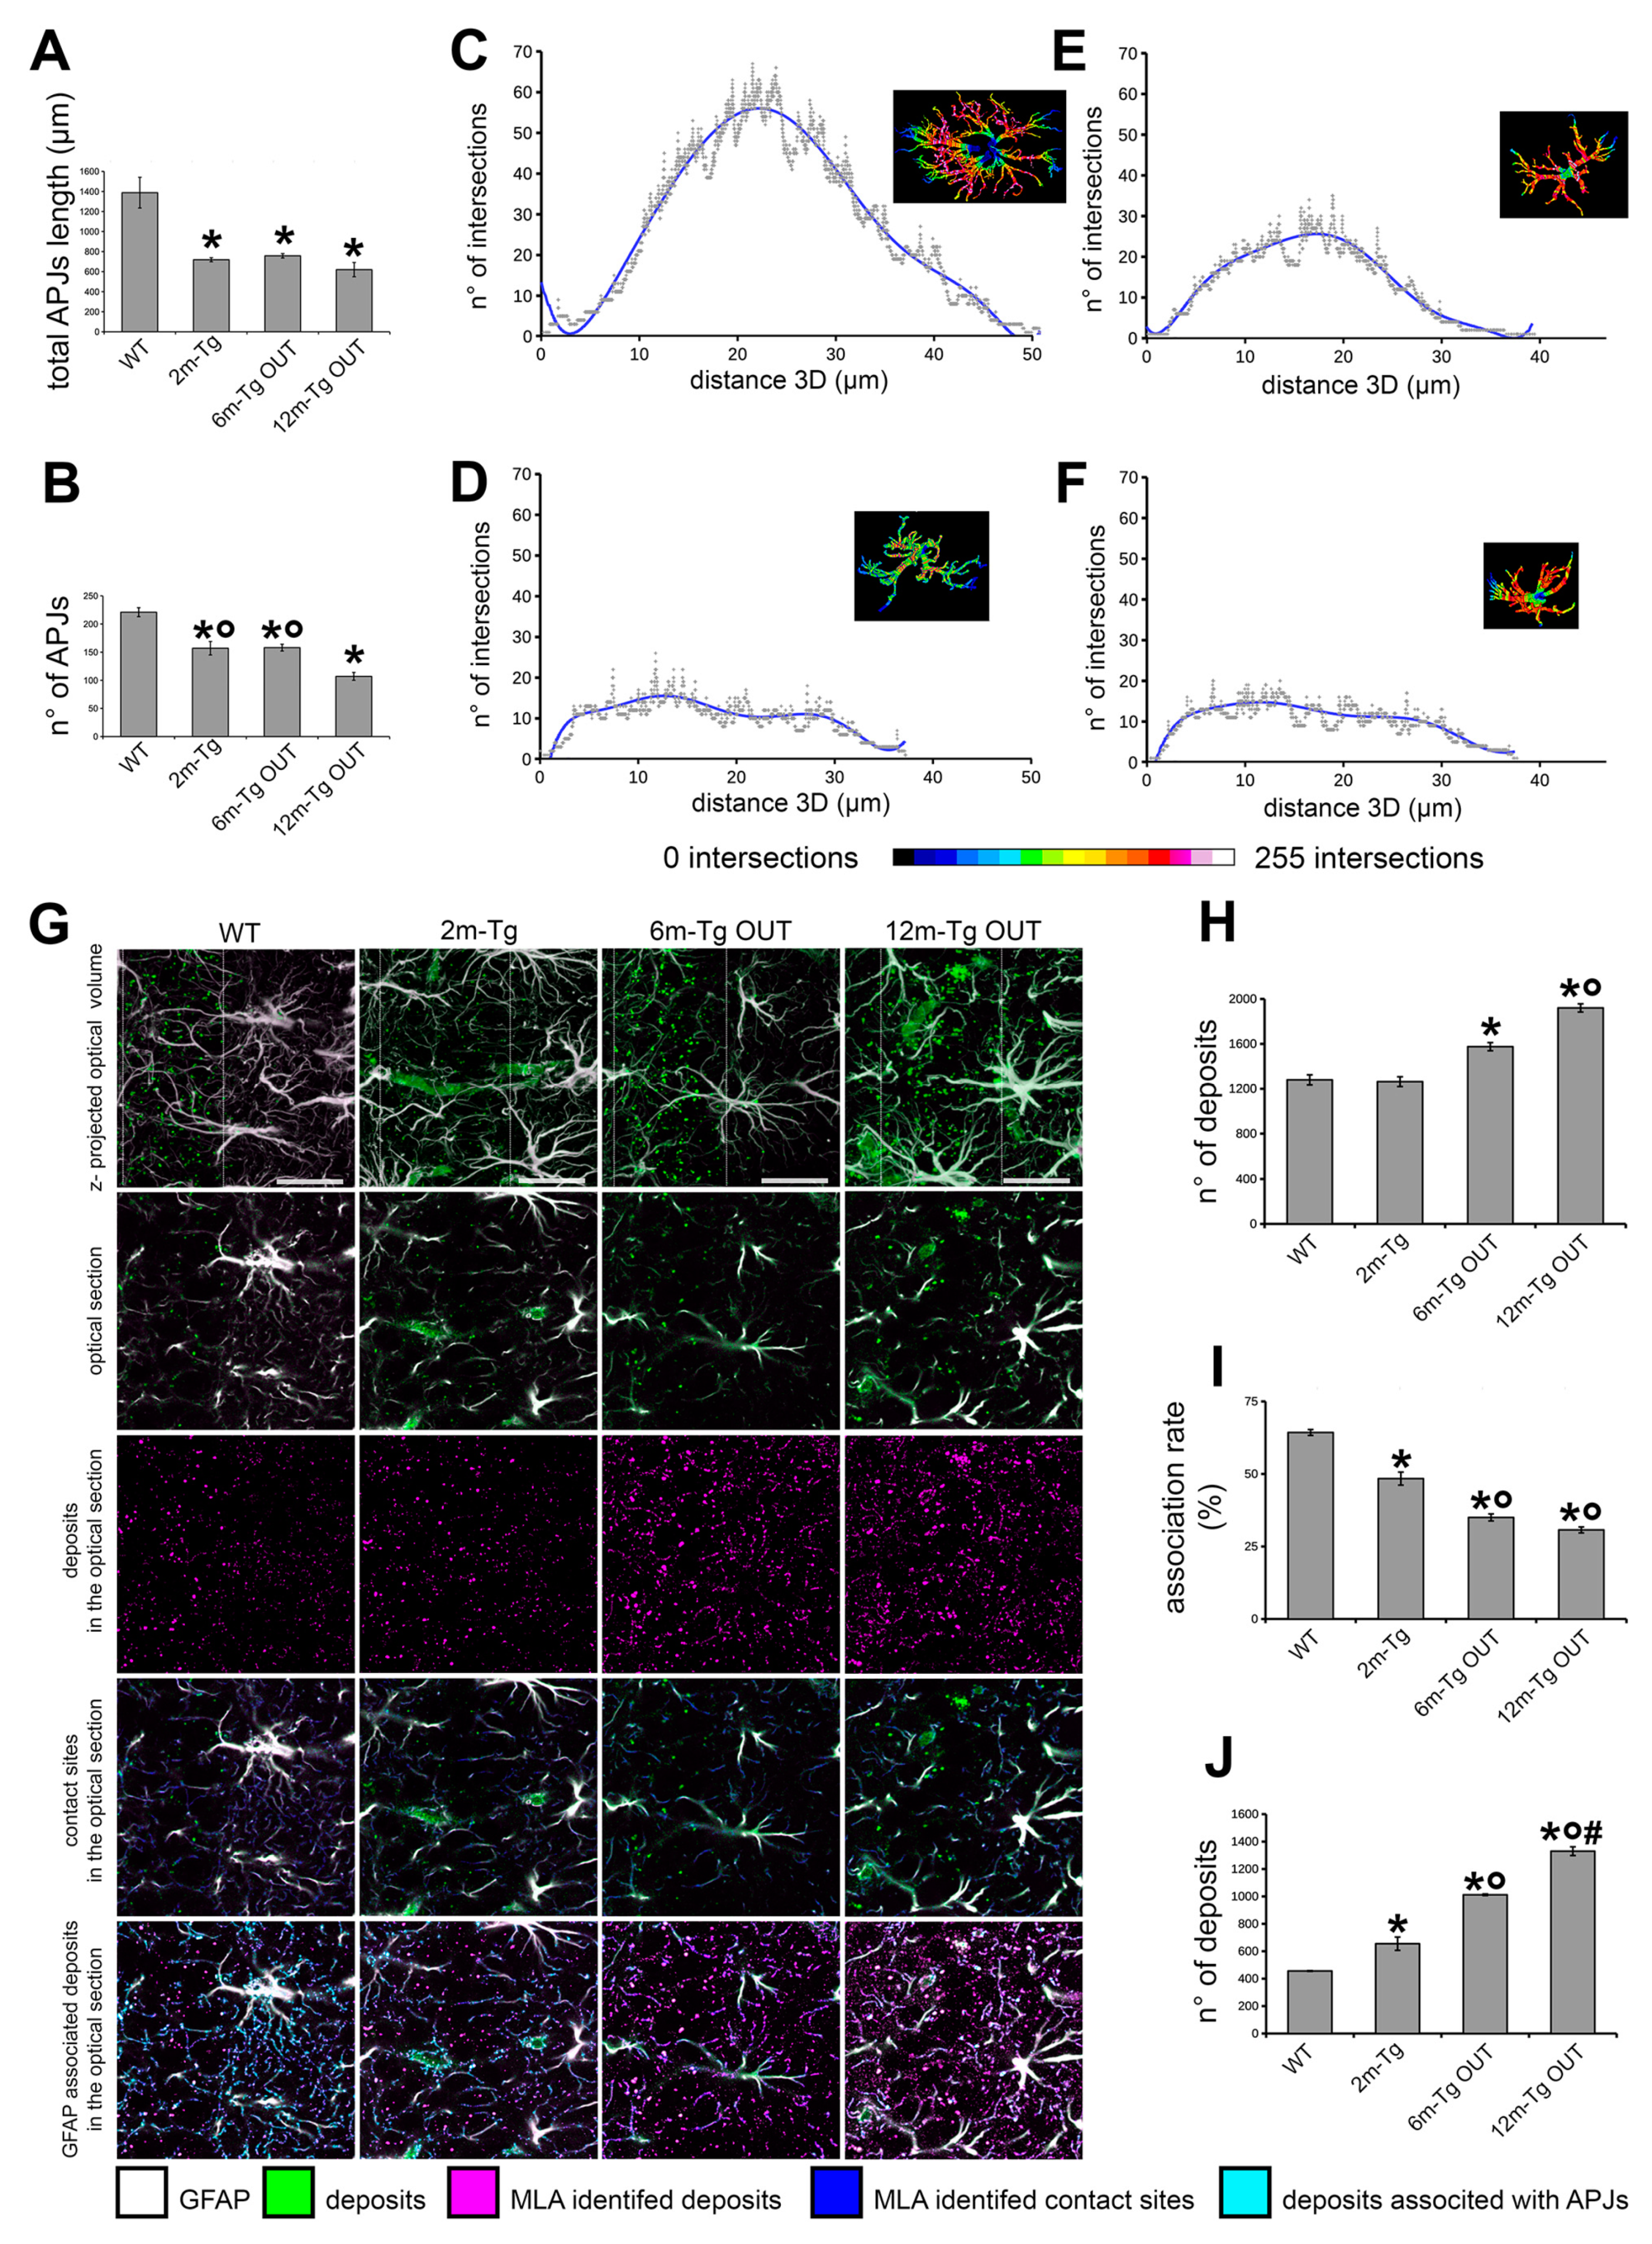
Figure 6.
Functional integrity of the astrocyte meshwork and dendrite fragmentation in transgenic mouse hippocampus. A) Quantitative estimation of integrated density of Cx43 immunofluorescence; F(3,8) = 11.8, * P < 0.01 vs WT, n = 3. B) Quantitative estimation of integrated density MAP2+ fragments; F(5,18) = 30.9, * P < 0.001 vs WT, n = 4. Values are expressed as mean ± SE. C) Astrocyte GFAP (cyan color scale) and Cx43 (yellow color scale) immunostaining, and autofluorescent deposits (gray color scale), are shown in blood vessels of WT-m (1st row), and perivascular (2nd row) and peri-plaque (3rd row) glial scars. Clusters Cx43 on APJs were identified by MLA (magenta color scale). D, E) Quantitative evaluation of the percentage of clusters showing a volume size > 1.5 µm3 (D), and the total number of Cx43 clusters (E). D) F(2, 6) = 18.5, *p < 0.01 vs WT. All statistical analyses were performed by One Way ANOVA followed by Tukey post hoc tests. Bars: C = 10 µm.
Figure 7.
Functional integrity of astrocyte meshwork in the hippocampus of transgenic mice: Cx43 localization. Astrocytes in the CA1 hippocampus of WT-m (A), and 2m- (B), 6m- (C) and 12m- (D) Tg-m were immunostained to reveal GFAP (cyan); autofluorescence of Aβ peptides (magenta). A) Low magnification z-projections of the CA1 in WT-m; insets 1 and 2 show details of the corresponding areas in A (1) and 1 (2). B) Low magnification z-projections of the CA1 in 2m-Tg; insets 3 and 4 show details of the corresponding areas in B (3) and 3 (4). C) Low magnification z-projections of the CA1 in 6m-Tg-m. Panels c1 and c2 show astrocytes in peri-plaque (c1) and non-plaque (c2) microdomains. Insets 5-8 show details of the corresponding areas in c1 (5), 5 (6), c2 (7) and 7 (8); in inset 6 only Cx43 and GFAP immunofluorescence are shown. D) Low magnification z-projections of the CA1 in 12m-Tg-m. Panels d1 and d2 show astrocytes in peri-plaque (d1) and non-plaque (d2) microdomains. The inner inset in d1 is a magnified detail of the small-framed area showing merging of small deposits and amyloid plaques (magenta channel, upper) and their interactions with APJs (magenta and cyan channels, lower). Elliptical frame in d1 delimits a peri vascular glial scar, in both tangential view and transversal section. Insets 9-11 show details of the corresponding areas in d1 (9) and d2 (10, 11); inset 9 shows immunofluorescence of GFAP and Cx43 merged-with (9) or without (9a) the autofluorescent signal; arrows point at spiraliform APJs. Vertical dotted lines delimit the stratum pyramidale. Bars: A,B,c1,c2,d1,d2 = 33 µm; 1-11 = 4 µm; inner insets = 5 µm.
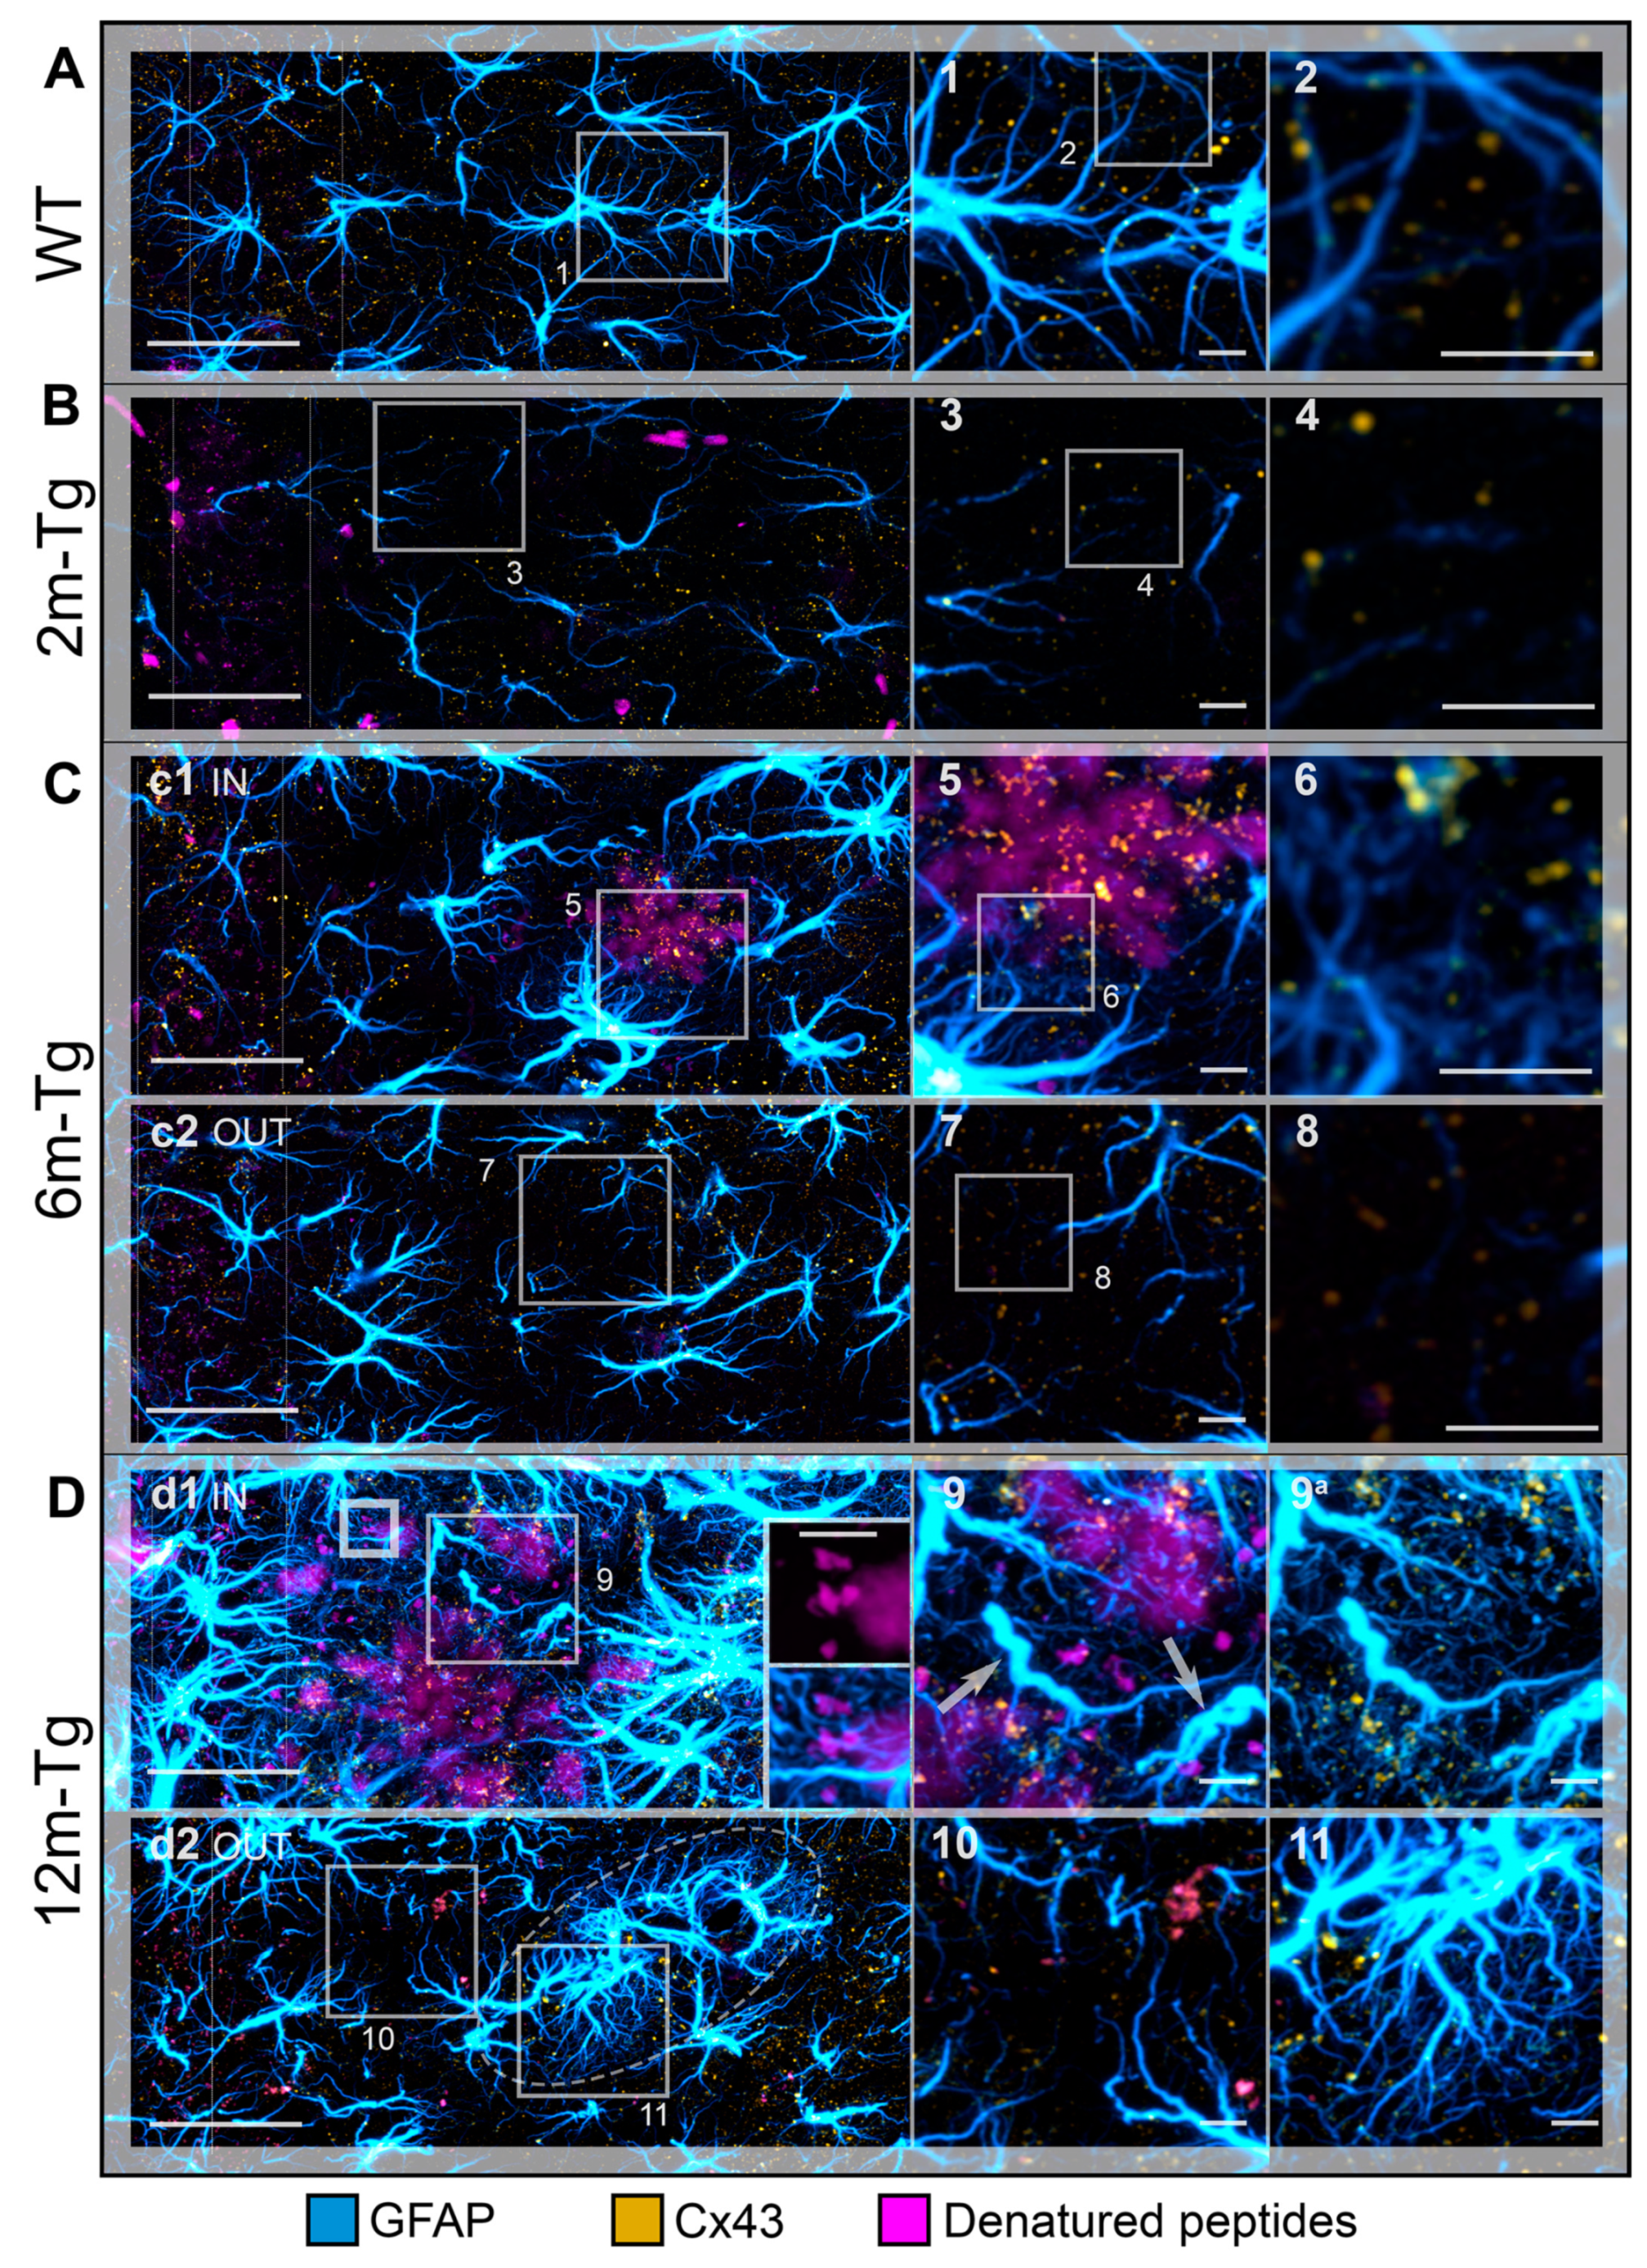
Figure 8.
Interactions of the APJ meshwork with denatured peptides in the hippocampus of transgenic mice: effects on hippocampal neurons. Hippocampal sections of WT-m (A), and 2m- (B), 6m- (C) and 12m- (D) Tg-m were immunostained to reveal astrocyte GFAP (yellow), neuron MAP2 (magenta); the nuclei were counterstained with DAPI (blue); autofluorescence from mixed lipofuscin/Aβ-peptides is also shown (gray). A) Low magnification z-projections of the CA1 in WT-m. Insets 1 and 1a show details of the corresponding areas in A, with (1) and without (1a) MAP2 and DAPI; arrowheads indicate autofluorescent deposits. B) Low magnification z-projections of the CA1 in 2m-Tg-m. Insets 2 and 2a show details of the corresponding areas in B, with (2) and without (2a) MAP2 and DAPI. C, D) Low magnification z-projections of the CA1 in 6m-Tg-m (C) and 12m-Tg-m (D); APJs and dendrites are shown in microdomains near (panels c1 and d1), and far from the plaques (panels c2 and d2). Inset 3/3a is a 3D volume rendering of a small plaque highlighted in panel c1: upper (3) and lower (3a) surfaces of the plaque are shown; insets 4-8 show details of the corresponding areas in c2 (4, 4a), d1 (5), 5 (6, 7) and d2 (8, 8a); inset 6 is a Y-projection of the XZ planes obtained by a reslice of the original optical volume. Small arrows indicate patterns of APJ fragmentation. Bars: A,B,c1,c2,d1,d2 = 25 µm; 1-8 = 6 µm.

Table 1.
List of the primary antibodies used in this study.
Table 1.
List of the primary antibodies used in this study.
| Antibody |
Specificity |
Supplier, source, dilution |
Iba1
Ionized calcium binding adaptor molecule 1 |
A calcium-binding protein with actin-bundling activity that participates in branching, membrane ruffling and phagocytosis in reactive microglia |
WAKO (Osaka, Japan)
Code #016-20001
rabbit, 1:300 |
CD68
Cluster of Differentiation 68 |
This marker plays a role in phagocytic activity of tissue macrophages, both in intracellular lysosomal pathways and in extracellular cell-cell and cell-pathogen interactions. It mediates the homing of macrophage subsets to particular tissue sites |
AbCam (Cambridge, UK) Code #Ab955
rabbit, 1:100 |
Cx43
Connexin 43 |
Structural protein of gap junctional connexons allowing ion and small molecule transit between neighboring cells. It is involved in the onset and maintenance of astroglial functional syncytium |
Cell Signaling (Danvers, MA, USA) Code #3512
rabbit, 1:50 |
GFAP
Glial Fibrillary Acidic Protein |
A class-III intermediate filament and astrocyte-specific marker expressed mainly in APJs |
DakoCytomation (Glostrup, Denmark) Code #Z0334
mouse, 1:500 |
Aβ
Beta-amyloid |
A 36–43 amino acid peptide, the main component of amyloid plaques found in the CNS of AD people and related animal models |
Covance (Emeryville, CA, USA) Code #SIG-39320, mouse, 1:400 |
MAP2
Microtubule-associated protein 2 |
Neuron-specific proteins of the neuro-tubular cytoskeleton, widely used to identify neuronal cells and trace their processes |
Cell Signaling (Danvers, MA, USA) Code #4542
rabbit, 1:100 |
