Submitted:
15 August 2023
Posted:
17 August 2023
You are already at the latest version
Abstract
Keywords:
1. Introduction
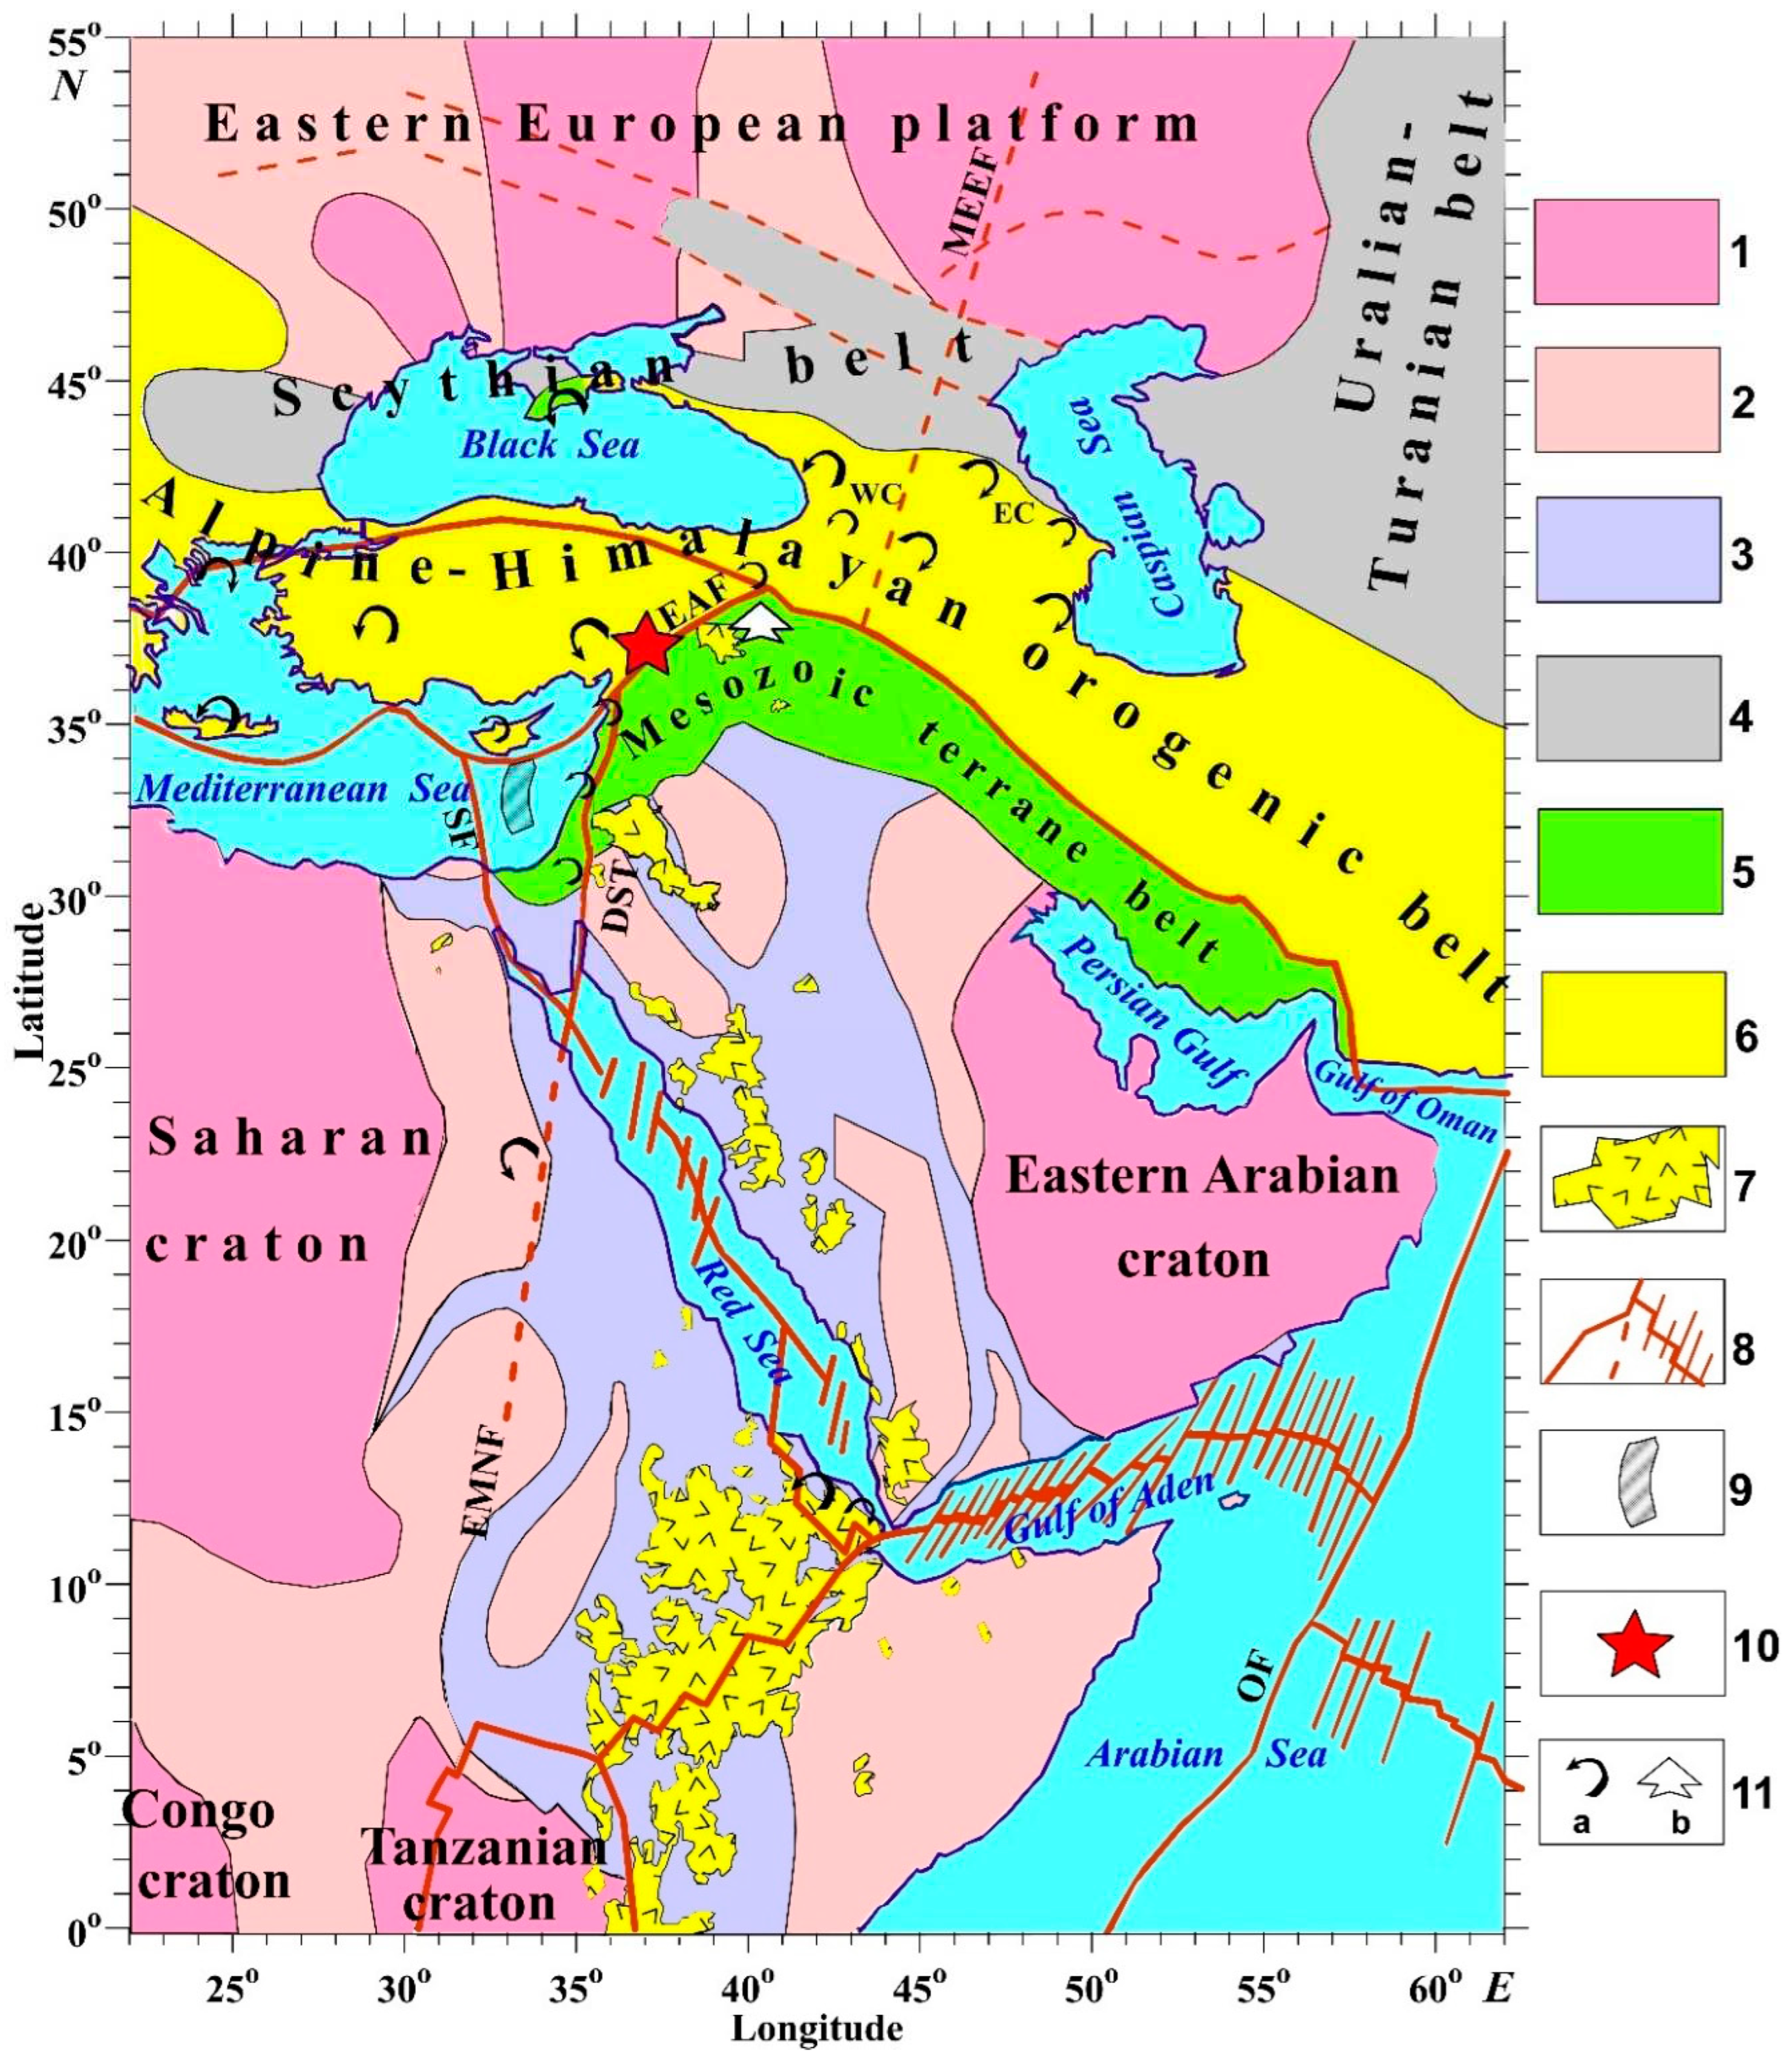
2. Brief Geological-Geophysical Background
3. Applied Geophysical-Geological Methods
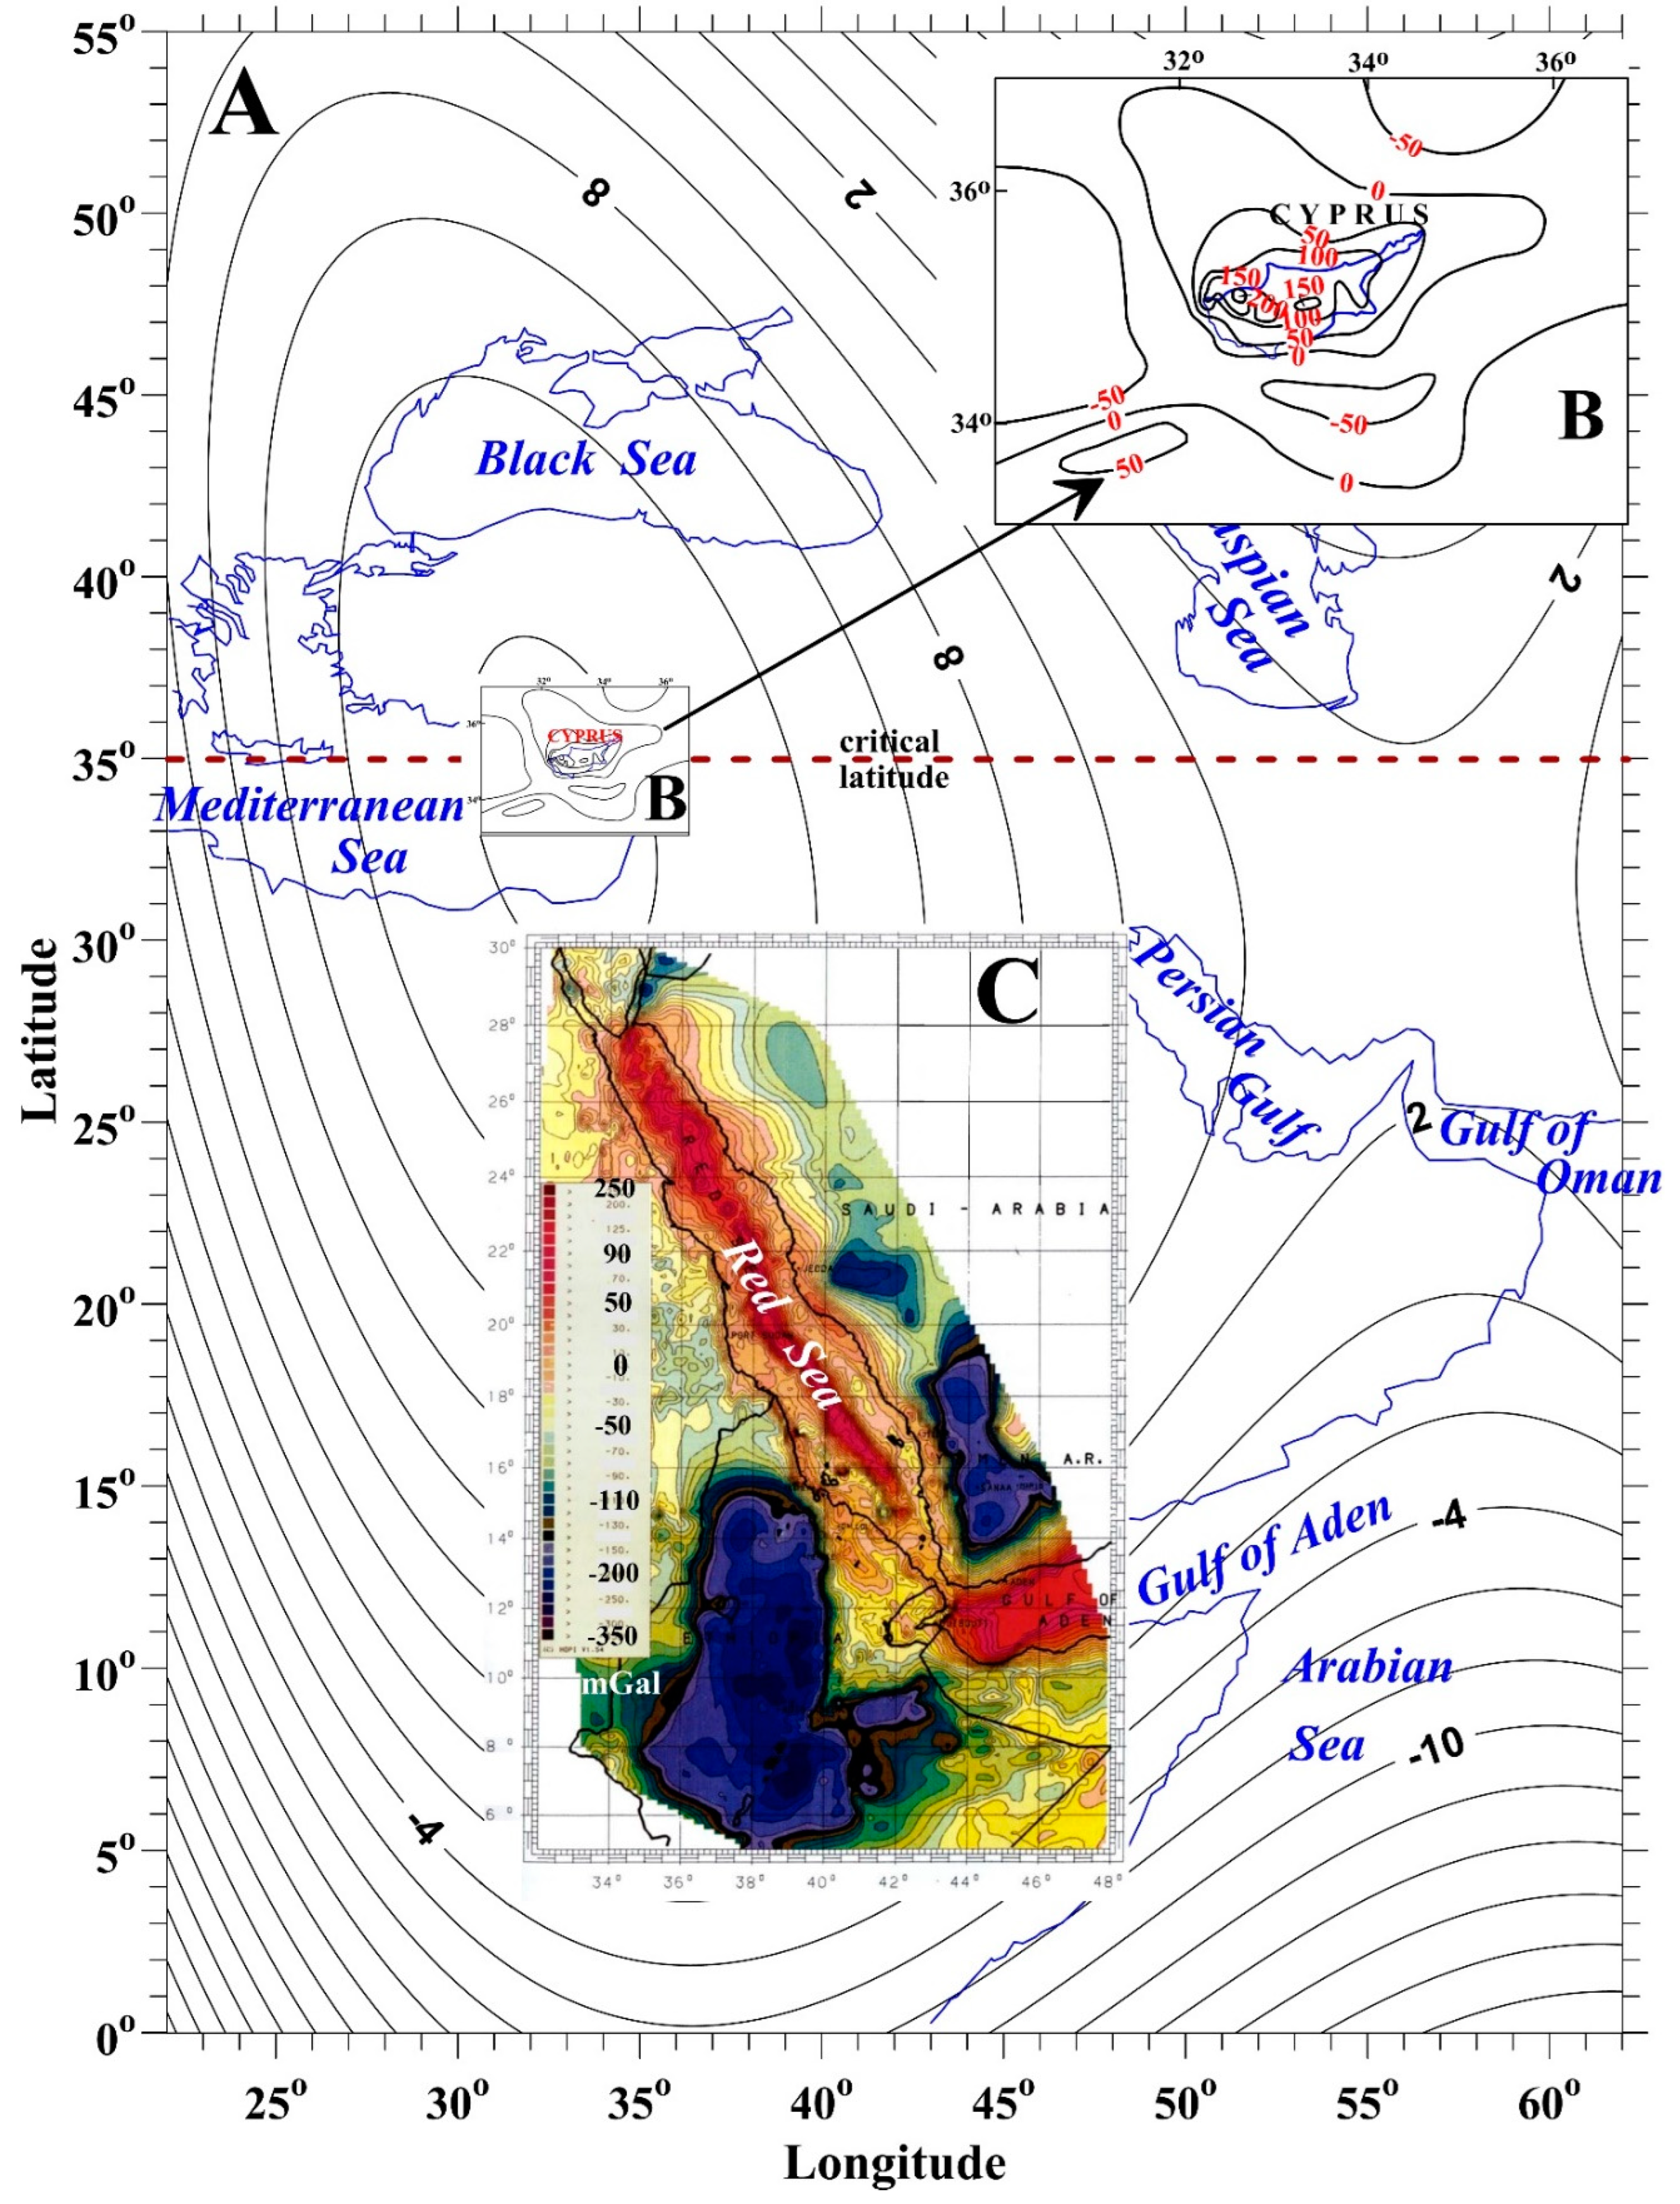
3.1. Satellite-derived gravity field analysis
3.2. Land/marine gravity field analysis
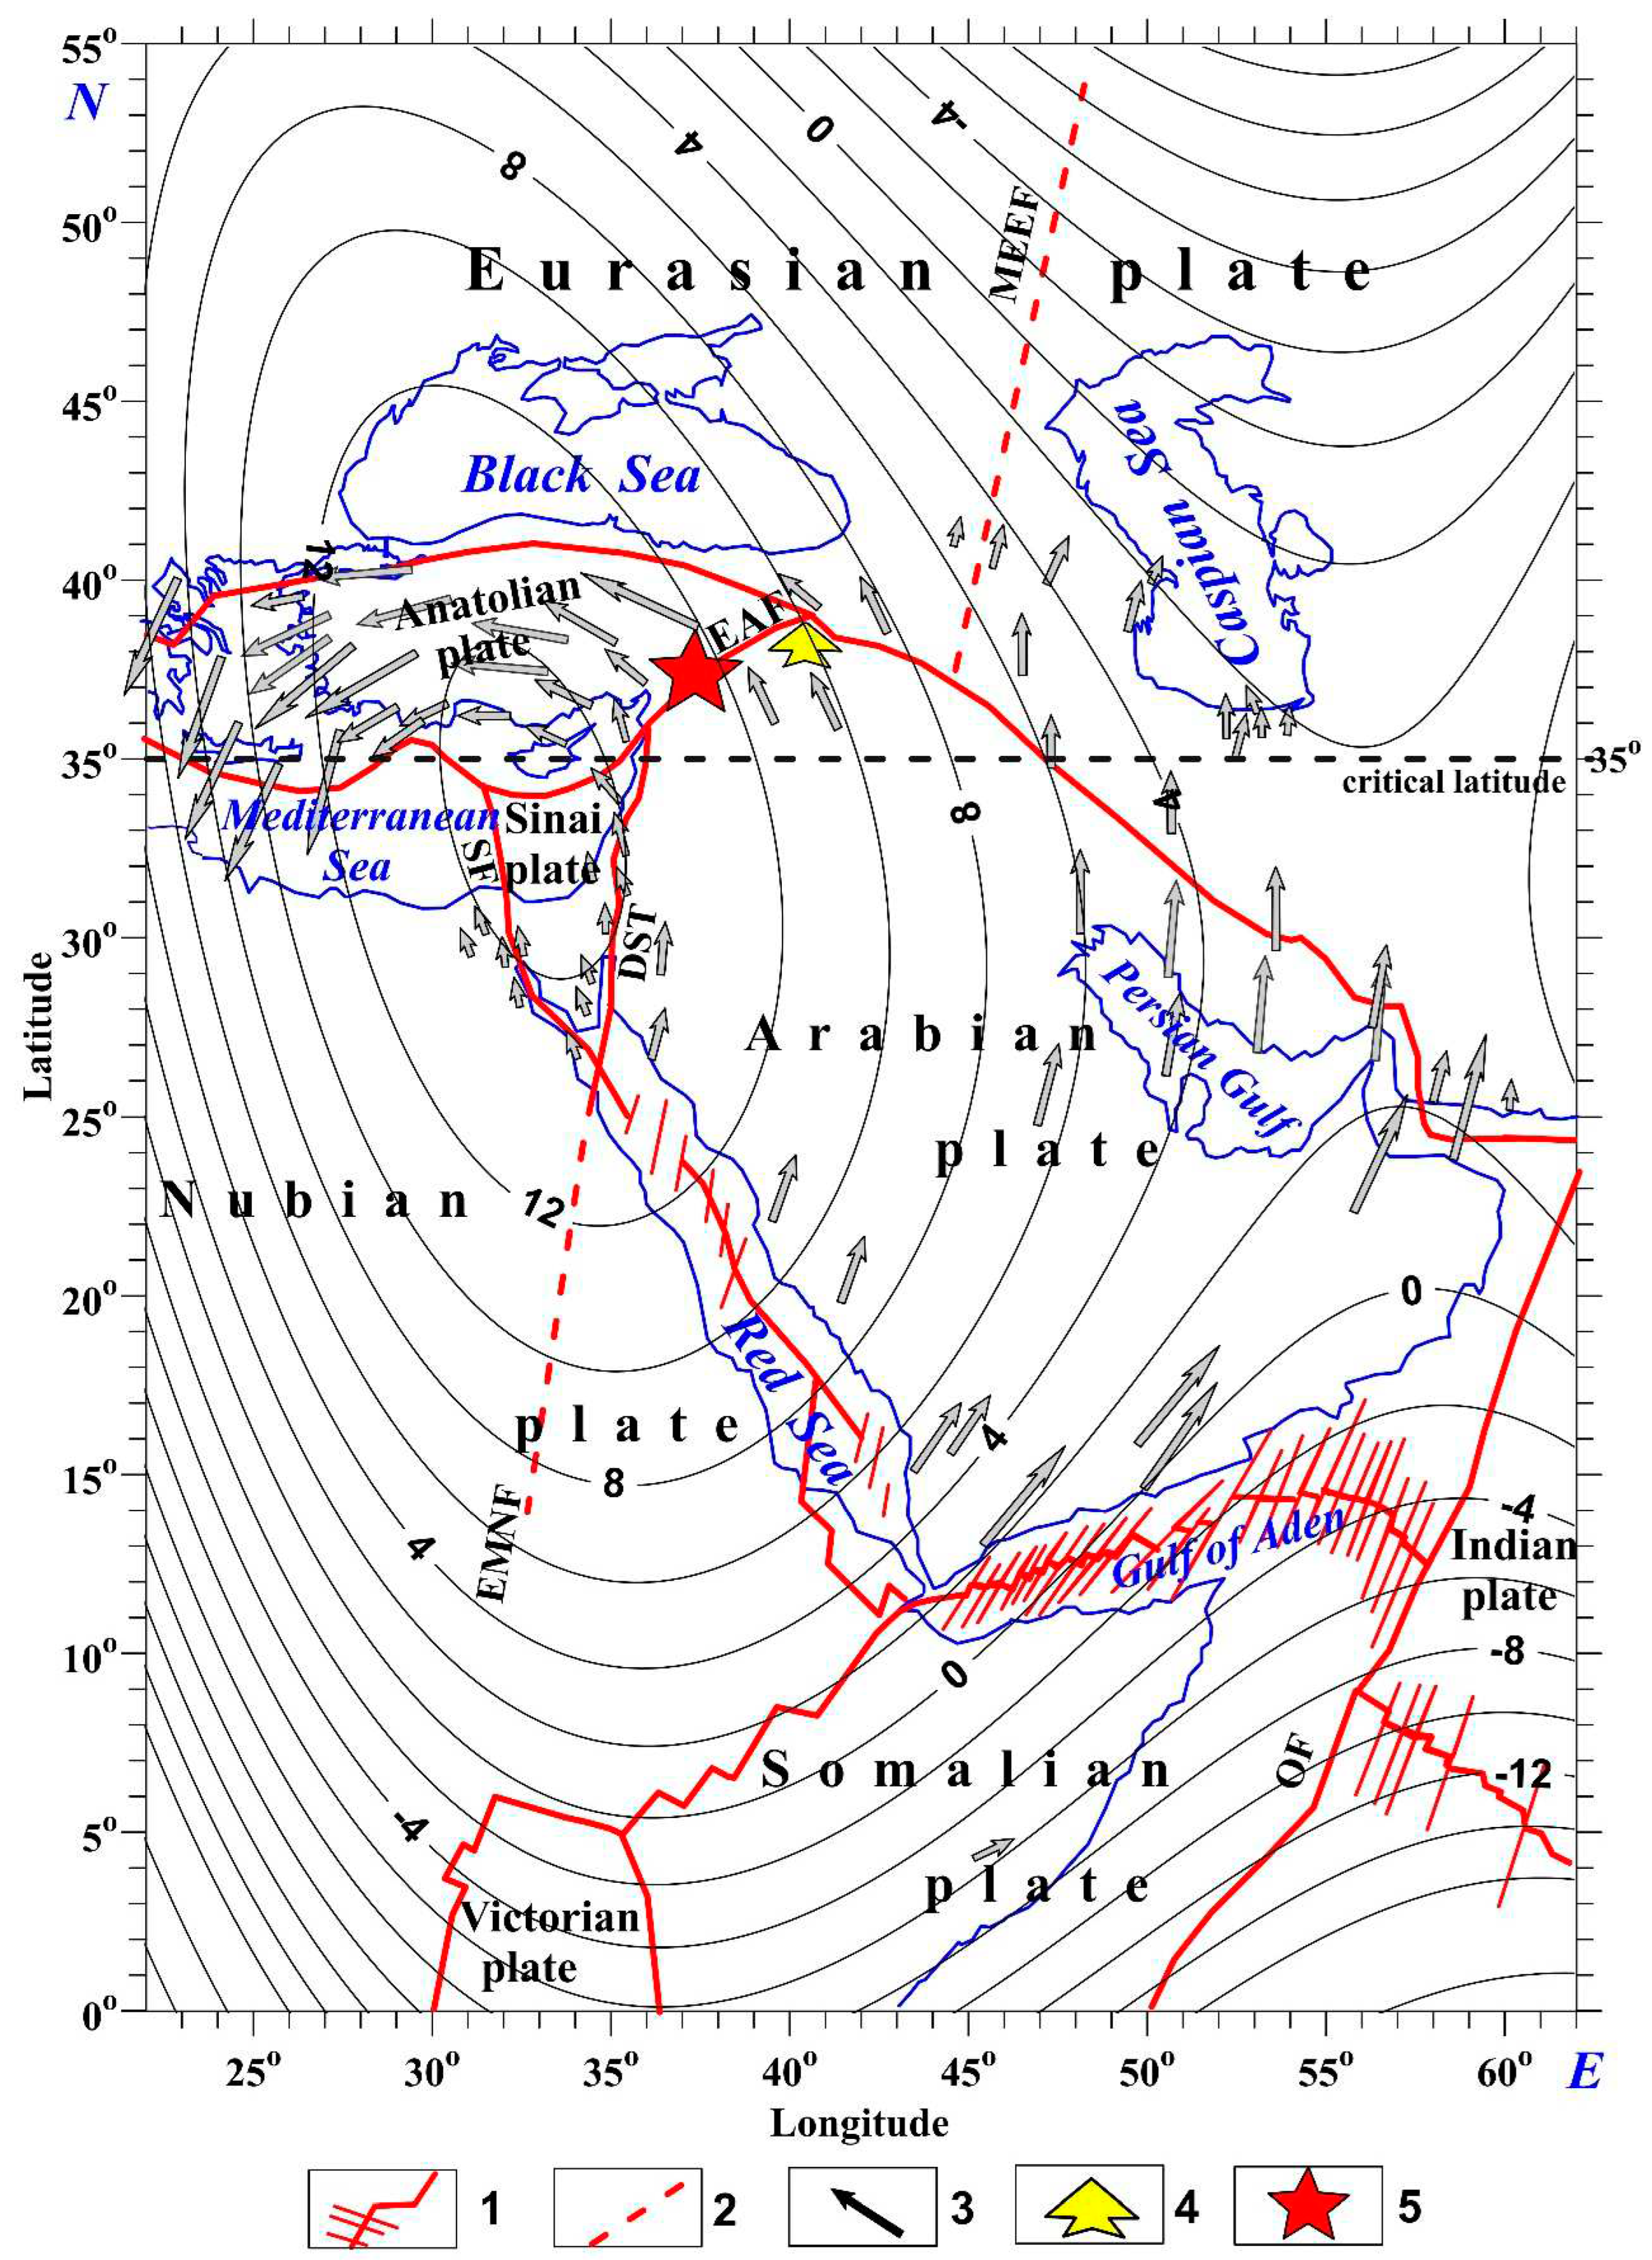
3.3. GPS vectors behavior
3.4. Map of geoid isolines evaluation
3.5. Paleomagnetic data generalization
3.5.1. Cyprus area
3.5.2. Makhtesh Ramon area (Southern Israel)
3.5.3. Hermon area (Northern Israel)
3.6. Critical latitude of the Earth
3.7. Results of regional seismic tomography studies
3.8. Study of paleobiogeographical data
3.9. Mineral-petrological analysis
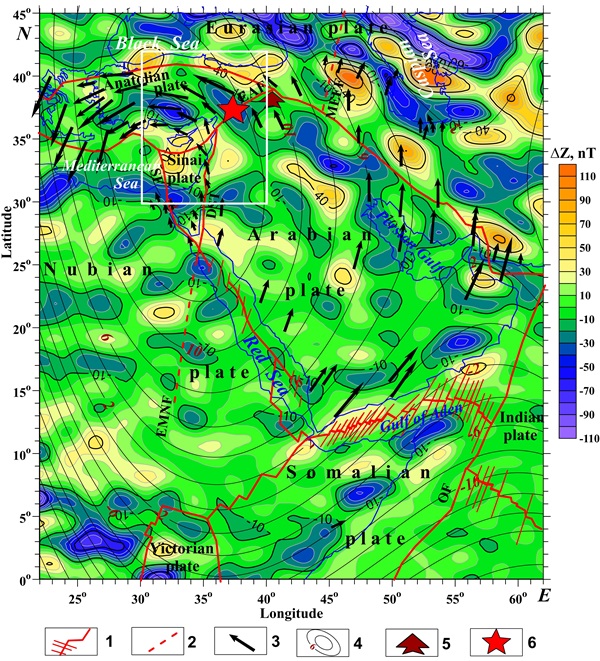
3.10. Magnetic field analysis
3.11. Asymmetry of sedimentary basins
3.12. Explanation of the oceanic crust block origin relating to the Kiama paleomagnetic zone
4. Brief description of the catastrophic seismic events on 06.02.2023 in Eastern Turkey
4.1. Short seismological-tectonic sketch
4.2. First event of M = 7.8, 06.02.2023
4.3. Second event of M = 7.7, 06.02.2023
4.4. Main tectonic consequences
5. Discussion
6. Conclusions
References
- Aldanmaz, E.; van Hinsbergen, D.J.; Yıldız-Yüksekol. ; Schmidt, M.W.; McPhee, P.J.; Meisel, T.; Güçtekin, A.; Mason, P.R. Effects of reactive dissolution of orthopyroxene in producing incompatible element depleted melts and refractory mantle residues during early fore-arc spreading: constraints from ophiolites in eastern Mediterranean. Lithos 2020, 360-361, 105438. [Google Scholar] [CrossRef]
- Aleinikov, A.L. , Belikov, V.T. and Eppelbaum, L.V., 2001. Some Physical Foundations of Geodynamics (in Russian, contents, and summary in English). Kedem Printing-House, Tel Aviv, Israel.
- Alpyürür, M.; Lav, M.A. An assessment of probabilistic seismic hazard for the cities in Southwest Turkey using historical and instrumental earthquake catalogs. Nat. Hazards 2022, 114, 335–365. [Google Scholar] [CrossRef]
- Ambraseys, N.N. and Finkel, C.F., 1995. Seismicity of Turkey and adjacent areas: a historical review, 1500–1800. Eren Yayinlari Publ., 240 p.
- Andersson, D.L. , 2007. New Theory of the Earth, 2nd ed. Cambridge Univ. Press, Cambridge.
- Artemieva, I.M.; Thybo, H.; Kaban, M.K. Deep Europe today: Geophysical synthesis of the upper mantle structure and lithospheric processes over 3.5 By. In European Lithosphere Dynamics; Gee, D., Stephenson, R., Eds.; Geological Society London Memoirs: London, UK, 2006; Volume 32, pp. 11–41. [Google Scholar]
- Ash, R.B. , 2008. Basic Probability Theory. Dover Publications, Inc. Mineola, N. Y., 350 p.
- Avni, Y. , 2001. Har Loz, Sheet 21-III. Geological Map of Israel 1:50,000, Geol. Survey of Israel, Jerusalem.
- Avni, Y. , Bartov, Y. and Shen, A., 2016. Har Ardon, Sheet 22-I. Geological Map of Israel 1:50,000, Geol. Survey of Israel, Jerusalem.
- Avni, Y. , Beker, A. and Zilberman, E., 2017. Be’erot Oded, Sheet 21-IV. Geological Map of Israel 1:50,000, Geol. Survey of Israel, Jerusalem.
- Baer, G. Flow directions in sills and dikes and formation of cauldrons in eastern Makhtesh Ramon. Israel Jour. of Earth Sci. 1993, 42, 133–148. [Google Scholar]
- Baer, G. , Heimann, A., Eshet, Y., Weinberger, R., Mussett, A. and Sherwood, G., The Saharonim Basalt: A Late Triassic – Early Jurassic intrusion in southeastern Makhtesh Ramon, Israel. Israel Jour. of Earth Sci. 1995, 44, 1–10. [Google Scholar]
- Baer, G.; Reches, Z. Mechanics of emplacement and tectonic implications of the Ramon Dike Systems, Israel. J. Geophys. Res. Atmos. 1991, 96, 11895–11910. [Google Scholar] [CrossRef]
- Baer, Y. , Soudry, D., Bar, O. and Shen, A., 2017. Zofar, Sheet 22-III, IV. Geological Map of Israel 1:50,000, Geol. Survey of Israel, Jerusalem.
- Baptie, B. and Segou, M., 2023. The Kahmaran Maras earthquake sequence, Turkey/Syria. British Geological Survey (14 Febr. 2023). Retrieved. 18 July.
- Barakat, A.A.S. and Kandil, M.R., 2019. Diamond in the newly discovered kimberlite and related rocks, Central Eastern Desert, Egypt. Proceed. of the XXXVI Intern. Conf. “Magmatism of the Earth and Related Strategic Metal Deposits”, St. Petersburg, Russia, 36–42.
- Barbeau, E.J. , 2003. Polynomials. Springer, New York.
- Barka, A.; Reilinger, R. Active tectonics of the Eastern Mediterranean region: deduced from GPS, neotectonic and seismicity data. Ann. Geophys. 1997, 40. [Google Scholar] [CrossRef]
- Bazhenov, M.L.; Burtman, V.S. Eocene paleomagnetism of the Caucasus (southwest Georgia): oroclinal bending in the Arabian syntaxis. Tectonophysics 2002, 344, 247–259. [Google Scholar] [CrossRef]
- Behar, N.; Shaar, R.; Tauxe, L.; Asefaw, H.; Ebert, Y.; Heimann, A.; Koppers, A.A.P.; Ron, H. Paleomagnetism and Paleosecular Variations From the Plio-Pleistocene Golan Heights Volcanic Plateau, Israel. Geochem. Geophys. Geosystems 2019, 20, 4319–4335. [Google Scholar] [CrossRef]
- Ben-Avraham, Z. Development of asymmetric basins along continental transform faults. Tectonophysics 1992, 215, 209–220. [Google Scholar] [CrossRef]
- Ben-Avraham, Z.; Schattner, U.; Lazar, M.; Hall, J.K.; Ben-Gai, Y.; Neev, D.; Reshef, M. Segmentation of the Levant continental margin, eastern Mediterranean. Tectonics 2006, 25. [Google Scholar] [CrossRef]
- Borradaile, G.J.; Lagroix, F.; Hamilton, T.D.; Trebilcock, D.-A. Ophiolite Tectonics, Rock Magnetism and Palaeomagnetism, Cyprus. Surv. Geophys. 2009, 31, 285–359. [Google Scholar] [CrossRef]
- Boschi, L.; Faccenna, C.; Becker, T.W. Mantle structure and dynamic topography in the Mediterranean Basin. Geophys. Res. Lett. 2010, 37. [Google Scholar] [CrossRef]
- Bosworth, W.; Huchon, P.; McClay, K. The Red Sea and Gulf of Aden Basins. J. Afr. Earth Sci. 2005, 43, 334–378. [Google Scholar] [CrossRef]
- Çabuk, B.S.; Cengiz, M. Paleomagnetic rotations in the circum-Marmara region, northwestern Turkey since the Late Cretaceous. J. Asian Earth Sci. 2021, 213, 104748. [Google Scholar] [CrossRef]
- en, K.Ö., Bray, J.D., Frost, J.D., Hortacsu, A., Miranda, E., Moss, R.E.S. and Stewart, J.P., 2023. February 6, 2023 Türkiye Earthquakes: Report on Geoscience and Engineering Impacts. (GEER Association Report 082 ed., ). Earthquake Engin. Research Inst. 6 May. [CrossRef]
- Chan, G.-N.; Malpas, J.; Xenophontos, C.; Lo, C.-H. Magmatism associated with Gondwanaland rifting and Neo-Tethyan oceanic basin development: evidence from the Mamonia Complex, SW Cyprus. J. Geol. Soc. 2007, 165, 699–709. [Google Scholar] [CrossRef]
- Cloetingh, S.; Willett, S.D. Linking Deep Earth and Surface Processes. Eos 2013, 94, 53–54. [Google Scholar] [CrossRef]
- Cloetingh, S. , Tibaldi, A., Dobrzhi netskaya, L., Matenco, L., Nader, F. and de Vries, B. v. W. From the deep Earth to the surface: A multiscale approach. Global Planet. Change 2018, 171, 1–322. [Google Scholar] [CrossRef]
- Dobrzhinetskaya, L.; Mukhin, P.; Wang, Q.; Wirth, R.; O'Bannon, E.; Zhao, W.; Eppelbaum, L.; Sokhonchuk, T. Moissanite (SiC) with metal-silicide and silicon inclusions from tuff of Israel: Raman spectroscopy and electron microscope studies. Lithos 2018, 310-311, 355–368. [Google Scholar] [CrossRef]
- Doubre, C.; Déprez, A.; Masson, F.; Socquet, A.; Lewi, E.; Grandin, R.; Nercessian, A.; Ulrich, P.; De Chabalier, J.-B.; Saad, I.; et al. Current deformation in Central Afar and triple junction kinematics deduced from GPS and InSAR measurements. Geophys. J. Int. 2016, 208, 936–953. [Google Scholar] [CrossRef]
- Duermeijer, C.; Krijgsman, W.; Langereis, C.; Veen, J.T. Post-early Messinian counterclockwise rotations on Crete: implications for Late Miocene to Recent kinematics of the southern Hellenic arc. Tectonophysics 1998, 298, 177–189. [Google Scholar] [CrossRef]
- ElGabry, M.N.; Panza, G.F.; Badawy, A.A.; Korrat, I.M. Imaging a relic of complex tectonics: the lithosphere-asthenosphere structure in the Eastern Mediterranean. Terra Nova 2012, 25, 102–109. [Google Scholar] [CrossRef]
- Eppelbaum, L.V. , Katz, Y.I. and Ben-Avraham, Z., 2012. Israel – Petroleum Geology and Prospective Provinces. AAPG European Newsletter, No. 4, 4-9.
- Eppelbaum, L.; Ben-Avraham, Z.; Katz, Y.; Cloetingh, S.; Kaban, M. Combined Multifactor Evidence of a Giant Lower-Mantle Ring Structure below the Eastern Mediterranean. Positioning 2020, 11, 11–32. [Google Scholar] [CrossRef]
- Eppelbaum, L.V.; Ben-Avraham, Z.; Katz, Y.I.; Cloetingh, S.; Kaban, M.K. Giant Quasi-Ring Mantle Structure in the African–Arabian Junction: Results Derived from the Geological–Geophysical Data Integration. Geotectonics 2021, 55, 58–82. [Google Scholar] [CrossRef]
- Eppelbaum, L.V.; Nikolaev, A.V.; Katz, Y.I. Spatial position of the Kiama inverse magnetization zone in the oceanic crust of the Eastern Mediterranean. Dokl. Earth Sci. 2014, 457, 1034–1038. [Google Scholar] [CrossRef]
- Eppelbaum, L.V. and Katz, Y.I. Key features of seismo-neotectonic pattern of the Eastern Mediterranean. Izvestiya, Acad. Sci. Azerb. Rep., Ser.: Earth Sci. 2012, 3, 29–40. [Google Scholar]
- Eppelbaum, L.; Katz, Y. Eastern Mediterranean: Combined geological–geophysical zonation and paleogeodynamics of the Mesozoic and Cenozoic structural-sedimentation stages. Mar. Pet. Geol. 2015, 65, 198–216. [Google Scholar] [CrossRef]
- Eppelbaum, L.; Katz, Y. A new regard on the tectonic map of the Arabian–African region inferred from the satellite gravity analysis. Acta Geophys. 2017, 65, 607–626. [Google Scholar] [CrossRef]
- Eppelbaum, L.V.; Katz, Y.I. Significant Tectono-Geophysical Features of the African-Arabian Tectonic Region: An Overview. Geotectonics 2020, 54, 266–283. [Google Scholar] [CrossRef]
- Eppelbaum, L.V.; Katz, Y.I. Paleomagnetic-Geodynamic Mapping of the Transition Zone from Ocean to the Continent: A Review. Appl. Sci. 2022, 12, 5419. [Google Scholar] [CrossRef]
- Eppelbaum, L.; Katz, Y.; Ben-Avraham, Z. Advanced Combined Geophysical-Geological Mapping of the Sea of Galilee and Its Vicinity. 2022; 553–579. [Google Scholar] [CrossRef]
- Eppelbaum, L.; Katz, Y.; Klokočník, J.; Kostelecký, J.; Zheludev, V.; Ben-Avraham, Z. Tectonic insights into the Arabian-African region inferred from a comprehensive examination of satellite gravity big data. Glob. Planet. Chang. 2018, 171, 65–87. [Google Scholar] [CrossRef]
- Eppelbaum, L.; Khesin, B. Geophysical Studies in the Caucasus. 2012. [Google Scholar] [CrossRef]
- Eppelbaum, L.V. and Pilchin, A.N., 2005. Quick subsidence of a crustal block in SW Aegean Sea as a possible cause of the end of ancient civilization in the 17th century BC. Trans. of the Intern. Conf. “Atlantis Hypothesis: Searching for a Lost Land”, Milos Island, Greece.
- Makhtesh Ramon Complex Deposit (Southern Israel) – A Window to the Upper Mantle. Int. J. Min. Sci. 2017, 3. [CrossRef]
- Eppelbaum, L.V.; Vaksman, V.L.; Kuznetsov, S.V.; Sazonova, L.V.; Smirnov, S.A.; Surkov, A.V.; Bezlepkin, B.M.; Katz, Y.I.; Korotaeva, N.N.; Belovitskaya, G.I. Discovery of microdiamonds and associated minerals in the Makhtesh Ramon Canyon (Negev Desert, Israel). Dokl. Earth Sci. 2006, 407, 202–204. [Google Scholar] [CrossRef]
- Esperança, S.; Garfunkel, Z. Ultramafic xenoliths from the Mt. Carmel area (Karem Maharal Volcano), Israel. Lithos 1986, 19, 43–49. [Google Scholar] [CrossRef]
- Faccenna, C.; Becker, T.W.; Auer, L.; Billi, A.; Boschi, L.; Brun, J.P.; Capitanio, F.A.; Funiciello, F.; Horvàth, F.; Jolivet, L.; et al. Mantle dynamics in the Mediterranean. Rev. Geophys. 2014, 52, 283–332. [Google Scholar] [CrossRef]
- Faccenna, C. , Bellier, O. , Martinod, J., Piromallo, C. and Regard, V. Slab detachment beneath eastern Anatolia: A 10 possible cause for the formation of the North Anatolian fault. Earth Planet. Sci. Lett. 2006, 242, 85–97. [Google Scholar] [CrossRef]
- Faccenna, C.; Jolivet, L.; Piromallo, C.; Morelli, A. Subduction and the depth of convection in the Mediterranean mantle. J. Geophys. Res. Solid Earth 2003, 108. [Google Scholar] [CrossRef]
- Frank, U.; Schwab, M.J.; Negendank, J. A lacustrine record of paleomagnetic secular variations from Birkat Ram, Golan Heights (Israel) for the last 4400 years. Phys. Earth Planet. Inter. 2002, 133, 21–34. [Google Scholar] [CrossRef]
- Garfunkel, Z.; Ben-Avraham, Z. The structure of the Dead Sea basin. Tectonophysics 1996, 266, 155–176. [Google Scholar] [CrossRef]
- Garfunkel, Z.; Katz, A. New Magmatic Features in Makhtesh Ramon, Southern Israel. Geol. Mag. 1967, 104, 608–629. [Google Scholar] [CrossRef]
- Garini, E. and Gazeras, G., 2023. The 2 earthquakes of th, 2023, in Turkey. Preliminary Report. NTUA, Greece. 6 February.
- The geology and gravity anomalies of the troodos massif, cyprus. Philos. Trans. R. Soc. London. Ser. A, Math. Phys. Sci. 1963, 255, 417–467. [CrossRef]
- George, R.P. Structural petrology of the Olympus ultramafic complex in the Troodos ophiolite, Cyprus. GSA Bull. 1978, 89. [Google Scholar] [CrossRef]
- Griffin, W.; Gain, S.; Adams, D.; Huang, J.-X.; Saunders, M.; Toledo, V.; Pearson, N.; O’reilly, S. First terrestrial occurrence of tistarite (Ti2O3): Ultra-low oxygen fugacity in the upper mantle beneath Mount Carmel, Israel. Geology 2016, 44, 815–818. [Google Scholar] [CrossRef]
- Griffin, W.; Gain, S.; Huang, J.-X.; Belousova, E.; Toledo, V.; O'Reilly, S. Permian to quaternary magmatism beneath the Mt Carmel area, Israel: Zircons from volcanic rocks and associated alluvial deposits. Lithos 2018, 314-315, 307–322. [Google Scholar] [CrossRef]
- Gvirtzman, G.; Weissbrod, T.; Baer, G.; Brenner, G. The age of the Aptian Stage and its magnetic events: new Ar–Ar ages and palaeomagnetic data from the Negev, Israel. Cretac. Res. 1996, 17, 293–310. [Google Scholar] [CrossRef]
- Gürer, D.; van Hinsbergen, D.J.J.; Özkaptan, M.; Creton, I.; Koymans, M.R.; Cascella, A.; Langereis, C.G. Paleomagnetic constraints on the timing and distribution of Cenozoic rotations in Central and Eastern Anatolia. Solid Earth 2018, 9, 295–322. [Google Scholar] [CrossRef]
- et al. (2023). Kahramanmaraş - Gaziantep Türkiye M7.7 Earthquake, . Strong Ground Motion and Building Damage Estimations. Preliminary Report. Dept. of Earthquake Engineering, Bogazici University, Turkey. 6 February.
- Hall, J.K. , Krasheninnikov, V.A., Hirsch, F., Benjamini, C. and Flexer, A., 2005. Geological Framework of the Levant, Vol. 2: The Levantine Basin and Israel. Historical Productions-Hall, Jerusalem, Israel.
- Henry, B.; Homberg, C.; Mroueh, M.; Hamdan, W.; Higazi, F. Rotations in Lebanon inferred from new palaeomagnetic data and implications for the evolution of the Dead Sea Transform system. Geol. Soc. London, Spéc. Publ. 2010, 341, 269–285. [Google Scholar] [CrossRef]
- Hisarlı, Z.M. New paleomagnetic constraints on the late Cretaceous and early Cenozoic tectonic history of the Eastern Pontides. J. Geodyn. 2011, 52, 114–128. [Google Scholar] [CrossRef]
- Jolivet, L.; Faccenna, C.; Agard, P.; De Lamotte, D.F.; Menant, A.; Sternai, P.; Guillocheau, F. Neo-Tethys geodynamics and mantle convection: from extension to compression in Africa and a conceptual model for obduction. Can. J. Earth Sci. 2016, 53, 1190–1204. [Google Scholar] [CrossRef]
- Jiang, X.; Song, X.; Li, T.; Wu, K. Moment magnitudes of two large Turkish earthquakes on , 2023 from long-period coda. 36, 6 February. [CrossRef]
- Kaban, M.K.; El Khrepy, S.; Al-Arifi, N.; Tesauro, M.; Stolk, W. Three-dimensional density model of the upper mantle in the Middle East: Interaction of diverse tectonic processes. J. Geophys. Res. Solid Earth 2016, 121, 5349–5364. [Google Scholar] [CrossRef]
- Karabulut, H.; Güvercin, S.E.; Hollingsworth, J.; Konca, A. . Long silence on the East Anatolian Fault Zone (Southern Turkey) ends with devastating double earthquakes (6 February 2023) over a seismic gap: implications for the seismic potential in the Eastern Mediterranean region. J. Geol. Soc. 2023, 180. [Google Scholar] [CrossRef]
- KeAi, 2023. The magnitude of the 2023 Turkish earthquake matches the largest in the country’s history, according to new study (). Phys.org. Retrieved 18 July 2023. 11 April.
- Khain, V.E. , 2001. Tectonics of Continents and Oceans. Nauchnyi Mir, Moscow (in Russian).
- Khain, V.E. and Koronovskii, N.V., 2007. Planet Earth: From the Core to The Ionosphere. Moscow. State. Univ., Moscow (in Russian).
- Khalafly, A.A. , 2006. Paleomagnetism of the Lesser Caucasus. Takhsil, Baku (n Russian).
- Khesin, B.E. , Alexeyev, V.V. and Eppelbaum, L.V., 1996. Interpretation of Geophysical Fields in Complicated Environments. Modern Approaches in Geophysics, Vol. 14, Kluwer, Dordrecht, 368 p.
- Khramov, A.N. , 1984. Paleomagnetic Directions and Pole Positions: Data for the USSR (Catalogue), No. 1 of World Data Center, Ser. B, Geophys. Comm. Acad. Sci. SSSR, Moscow.
- Kissel, C. and Laj, C., 1988. Paleomagnetic Rotations and Continental Deformation. NATO ASI Series: Mathematical and Physical Sciences. Kluwer Academic Publishers: Dordrecht, The Netherlands; Boston, USA; London, UK, 530 p.
- Kissel, C.; Laj, C.; Poisson, A.; Görür, N. Paleomagnetic reconstruction of the Cenozoic evolution of the Eastern Mediterranean. Tectonophysics 2003, 362, 199–217. [Google Scholar] [CrossRef]
- Lang, B.; Mimran, Y. An Early Cretaceous Volcanic Sequence in Central Israel and Its Significance to the Absolute Date of the Base of the Cretaceous. J. Geol. 1985, 93, 179–184. [Google Scholar] [CrossRef]
- Lang, B. and Shimron, A.E., 1991. New K-Ar data of the Mount Hermon Mesozoic magmatic rocks. Ministry of Energy and Infrastructure, Geol. Surv. Israel, Min. Energy Resources Division, Report GSI/26/91.
- Lang, B. and Steinitz, G., 1989. K-Ar dating of Mesozoic magmatic rocks in Israel: A review. Isr. Jour. of Earth Sci., 38, 89-103.
- Lazos, I.; Sboras, S.; Chousianitis, K.; Kondopoulou, D.; Pikridas, C.; Bitharis, S.; Pavlides, S. Temporal evolution of crustal rotation in the Aegean region based on primary geodetically-derived results and palaeomagnetism. Acta Geod. et Geophys. 2022. [Google Scholar] [CrossRef]
- Le Pichon, X.; Chamot-Rooke, N.; Lallemant, S.; Noomen, R.; Veis, G. Geodetic determination of the kinematics of central Greece with respect to Europe: Implications for eastern Mediterranean tectonics. J. Geophys. Res. Solid Earth 1995, 100, 12675–12690. [Google Scholar] [CrossRef]
- Lotfi, H.I. , 2015. Early Cretaceous counterclockwise rotation of Northeast Africa within the equatorial zone: Paleomagnetic study on Mansouri ring complex, Southeastern Desert, Egypt. NRIAG J. Astron. Geophys., 4(1), 1-15.
- Lu, J.-G.; Griffin, W.L.; Huang, J.-X.; Dai, H.-K.; Castillo-Oliver, M.; O’reilly, S.Y. Structure and composition of the lithosphere beneath Mount Carmel, North Israel. Contrib. Miner. Pet. 2022, 177, 1–16. [Google Scholar] [CrossRef]
- McElhinny, M.W. , 1989. Paleomagnetism and Plate Tectonics. Cambridge Univ. Press, 235 p.
- Makris, J.; Henke, C.H.; Egloff, F.; Akamaluk, T. The gravity field of the Red Sea and East Africa. Tectonophysics 1991, 198, 369–381. [Google Scholar] [CrossRef]
- Mao, W. and Zhong, S., 2021. Constraints on mantle viscosity from intermediate-wavelength geoid anomalies in mantle convection models with plate motion history. Jour. of Geoph. Research: Solid Earth, 126, e2020JB021561, 1-25. [CrossRef]
- Marchev, P.; Raicheva, R.; Downes, H.; Vaselli, O.; Chiaradia, M.; Moritz, R. Compositional diversity of Eocene–Oligocene basaltic magmatism in the Eastern Rhodopes, SE Bulgaria: implications for genesis and tectonic setting. Tectonophysics 2004, 393, 301–328. [Google Scholar] [CrossRef]
- McClusky, S.; Balassanian, S.; Barka, A.; Demir, C.; Ergintav, S.; Georgiev, I.; Gurkan, O.; Hamburger, M.; Hurst, K.; Kahle, H.; et al. Global Positioning System constraints on plate kinematics and dynamics in the eastern Mediterranean and Caucasus. J. Geophys. Res. Solid Earth 2000, 105, 5695–5719. [Google Scholar] [CrossRef]
- Molostovskii, E.A.; Pechersky, D.M.; Frolov, I.Y. Magnetostratigraphic timescale of the Phanerozoic and its description using a cumulative distribution function. Izv. Phys. Solid Earth 2007, 43, 811–818. [Google Scholar] [CrossRef]
- Mor, D. , Mihelson, H., Druckman, Y., Mimran, Y., Heimann, A., Goldberg, M. and Sneh, A., 1997. Notes on the geology of Golan Heights. Report GSI/15/97, Jerusalem, 1-18.
- Morris, A.; Anderson, M.W.; Robertson, A.H.; Al-Riyami, K. Extreme tectonic rotations within an eastern Mediterranean ophiolite (Baër–Bassit, Syria). Earth Planet. Sci. Lett. 2002, 202, 247–261. [Google Scholar] [CrossRef]
- Muttoni, G.; Kent, D.V.; Garzanti, E.; Brack, P.; Abrahamsen, N.; Gaetani, M. Early Permian Pangea ‘B’ to Late Permian Pangea ‘A’. Earth Planet. Sci. Lett. 2003, 215, 379–394. [Google Scholar] [CrossRef]
- Nalbant, S.S.; McCloskey, J.; Steacy, S.; A Barka, A. Stress accumulation and increased seismic risk in eastern Turkey. Earth Planet. Sci. Lett. 2002, 195, 291–298. [Google Scholar] [CrossRef]
- National Earthquake Information Center (). M 7.8 - Kahramanmaras Earthquake Sequence I. United States Geological Survey. Archived from the original on . Retrieved 15 July 2023. 6 February.
- National Earthquake Information Center. M 7.5 – Kahramanmaras Earthquake Sequence II. United States Geological Survey. Archived from the original on . Retrieved 15 July 2023. 6 February.
- Nur, A. , Ron, H. and Scott, O., 1989. Mechanics of distributed fault and block rotation. In: (C. Kissel and C. Laj, Eds.), Paleomagnetic Rotations and Continental Deformation, Kluwer Academic Publ., 209-228. [CrossRef]
- Öztürk, S. Earthquake hazard potential in the Eastern Anatolian Region of Turkey: seismotectonic b and Dc-values and precursory quiescence Z-value. Front. Earth Sci. 2017, 12, 215–236. [Google Scholar] [CrossRef]
- Pechersky, D.M.; Lyubushin, A.A.; Sharonova, Z.V. On the synchronism in the events within the core and on the surface of the earth: the changes in the organic world and in the polarity of the geomagnetic field in the phanerozoic. Izv. Phys. Solid Earth 2010, 46, 613–623. [Google Scholar] [CrossRef]
- Reilinger, R.; McClusky, S.; Vernant, P.; Lawrence, S.; Ergintav, S.; Cakmak, R.; Ozener, H.; Kadirov, F.; Guliev, I.; Stepanyan, R.; et al. GPS constraints on continental deformation in the Africa-Arabia-Eurasia continental collision zone and implications for the dynamics of plate interactions. J. Geophys. Res. Solid Earth 2006, 111. [Google Scholar] [CrossRef]
- Ricard, Y.; Vigny, C.; Froidevaux, C. Mantle heterogeneities, geoid, and plate motion: A Monte Carlo inversion. J. Geophys. Res. Solid Earth 1989, 94, 13739–13754. [Google Scholar] [CrossRef]
- Richards, M.A.; Hager, B.H. Geoid anomalies in a dynamic Earth. J. Geophys. Res. Atmos. 1984, 89, 5987–6002. [Google Scholar] [CrossRef]
- Rolland, Y. Caucasus collisional history: Review of data from East Anatolia to West Iran. Gondwana Res. 2017, 49, 130–146. [Google Scholar] [CrossRef]
- Rolland, Y.; Hässig, M.; Bosch, D.; Bruguier, O.; Melis, R.; Galoyan, G.; Topuz, G.; Sahakyan, L.; Avagyan, A.; Sosson, M. The East Anatolia–Lesser Caucasus ophiolite: An exceptional case of large-scale obduction, synthesis of data and numerical modelling. Geosci. Front. 2019, 11, 83–108. [Google Scholar] [CrossRef]
- Ron, H. and Baer, G. Paleomagnetism of Early Cretaceous rocks from southern Israel. Israel Jour. of Earth Sci. 1988, 37, 73–81. [Google Scholar]
- Ron, H.; Freund, R.; Garfunkel, Z.; Nur, A. Block rotation by strike-slip faulting: Structural and paleomagnetic evidence. J. Geophys. Res. Solid Earth 1984, 89, 6256–6270. [Google Scholar] [CrossRef]
- Sandwell, D.T.; Smith, W.H.F. Global marine gravity from retracked Geosat and ERS-1 altimetry: Ridge segmentation versus spreading rate. J. Geophys. Res. Atmos. 2009, 114. [Google Scholar] [CrossRef]
- Schmid, C.; van der Lee, S.; VanDecar, J.C.; Engdahl, E.R.; Giardini, D. Three-dimensionalSvelocity of the mantle in the Africa-Eurasia plate boundary region from phase arrival times and regional waveforms. J. Geophys. Res. Atmos. 2008, 113. [Google Scholar] [CrossRef]
- Skobelin, E.A. , Sharapov, I.P. and Bugayov, A.F., 1990. Deliberations of state and ways of perestroika in geology (Has plate tectonics resulted in a revolution in geology?). In: Critical Aspects of the Plate Tectonics Theory. Theophrastus Publ., Athens, Greece, Vol. 1, 17-37.
- Segev, A. Synchronous magmatic cycles during the fragmentation of Gondwana: radiometric ages from the Levant and other provinces. Tectonophysics 2000, 325, 257–277. [Google Scholar] [CrossRef]
- Segev, A. 40Ar/39Ar and K–Ar geochronology of Berriasian–Hauterivian and Cenomanian tectonomagmatic events in northern Israel: implications for regional stratigraphy. Cretac. Res. 2009, 30, 810–828. [Google Scholar] [CrossRef]
- Segev, A. and Lang, B., 2002. 40Ar/39Ar dating of Valanginian top Tayasir Volcanics in the Mount Hermon area, northern Israel. Israel Geological Survey, Current Research, 13, 100-104.
- Segev, A. and Sass, E., 2009. The geology of the Carmel region, Albian-Turonian volcano-sedimentary cycles on the northwestern edge of the Arabian platform. Rep. of the Israel Geol. Soc., Jerusalem, 1-77.
- Segev, A.; Weissbrod, T.; Lang, B. 40Ar/39Ar dating of the Aptian–Albian igneous rocks in Makhtesh Ramon (Negev, Israel) and its stratigraphic implications. Cretac. Res. 2005, 26, 633–656. [Google Scholar] [CrossRef]
- Şengör, A.; Tüysüz, O.; İmren, C.; Sakınç, M.; Eyidoğan, H.; Görür, N.; Le Pichon, X.; Rangin, C. THE NORTH ANATOLIAN FAULT: A NEW LOOK. Annu. Rev. Earth Planet. Sci. 2005, 33, 37–112. [Google Scholar] [CrossRef]
- Sharkov, E.V. and Khanna, S. Evolution of the upper mantle material in regions of intraplate magmatism: Case study of western Syria. Doklady Acad. Sci. SSSR 1987, 297, 684–686. [Google Scholar]
- Shaliv, G. , 1991. Stages in the tectonics and volcanic history of the Neogene basin in the Lower Galilee and the valleys. PhD Thesis, Hebrew Univ., Jerusalem (in Hebrew.
- Sharon, M.; Sagy, A.; Kurzon, I.; Marco, S.; Rosensaft, M. Assessment of seismic sources and capable faults through hierarchic tectonic criteria: implications for seismic hazard in the Levant. Nat. Hazards Earth Syst. Sci. 2020, 20, 125–148. [Google Scholar] [CrossRef]
- Shimron, A.E. , 1998. Tectonic evolution of the southern Mount Hermon. Report Geol. Surv Israel Rep. GSI/10/98.
- Shimron, A.E. and Lang, B., 1989. New geological data and K-Ar geochronology of the magmatic rocks on the southeast flanks of Mount Hermon. Geol. Surv. Israel Rep. GSI/41/88.
- Shimron, A.E. and Peltz, S., 1993. Early Cretaceous pyroclastic volcanism on the Hermon Range. Geol. Surv. Israel Bull., 84, p. 43.
- Smit, J.; Brun, J.-P.; Cloetingh, S.; Ben-Avraham, Z. The rift-like structure and asymmetry of the Dead Sea Fault. Earth Planet. Sci. Lett. 2010, 290, 74–82. [Google Scholar] [CrossRef]
- Sneh, A. , Bartov, Y. and Rozensaft, M., 1998. Geological Map of Israel, Scale 1:200,000. Geol. Surv. of Israel, Min. of Nation. Infrastructure, Jerusalem.
- Stampfli, G.; Hochard, C.; Vérard, C.; Wilhem, C.; Vonraumer, J. The formation of Pangea. Tectonophysics 2013, 593, 1–19. [Google Scholar] [CrossRef]
- Stein, R.S.; Barka, A.A.; Dieterich, J.H. Progressive failure on the North Anatolian fault since 1939 by earthquake stress triggering. Geophys. J. Int. 1997, 128, 594–604. [Google Scholar] [CrossRef]
- Stern, R.J.; Johnson, P. Continental lithosphere of the Arabian Plate: A geologic, petrologic, and geophysical synthesis. Earth-Science Rev. 2010, 101, 29–67. [Google Scholar] [CrossRef]
- Su, W.-J.; Woodward, R.L.; Dziewonski, A.M. Degree 12 model of shear velocity heterogeneity in the mantle. J. Geophys. Res. Atmos. 1994, 99, 6945–6980. [Google Scholar] [CrossRef]
- Tatar, O.; Piper, J.; Gürsoy, H.; Heimann, A.; Koçbulut, F. Neotectonic deformation in the transition zone between the Dead Sea Transform and the East Anatolian Fault Zone, Southern Turkey: a palaeomagnetic study of the Karasu Rift Volcanism. Tectonophysics 2004, 385, 17–43. [Google Scholar] [CrossRef]
- Tauxe, L. , 2002. Paleomagnetic Principles and Practice. Kluwer Acad. Publishers, N.Y. – Boston – Dordrecht, 299 p.
- Taylor, R.N.; Nesbitt, R.W. Light rare-earth enrichment of supra subduction-zone mantle: Evidence from the Troodos ophiolite, Cyprus. Geology 1988, 16. [Google Scholar] [CrossRef]
- Telford, W.M. , Geldart, L.R. and Sheriff, R.E., 1991. Applied Geophysics. Cambridge Univ. Press, Cambridge, 760 p.
- Trubitsyn, V.P. The nature of the boundary between the upper and the lower mantle and its influence on convection. Izv. Phys. Solid Earth 2010, 46, 461–476. [Google Scholar] [CrossRef]
- Trubitsyn, V.P. , 2012. Propagation of oceanic plates through the boundary between the upper and lower mantle. Doklady Earth Sci., 446, 1220-1222. [CrossRef]
- Tselentis, G.-A.; Drakopoulos, J. Stress transfer and nonlinear stress accumulation at the North Anatolian fault, Turkey. Pure Appl. Geophys. 1990, 132, 699–710. [Google Scholar] [CrossRef]
- Uzel, B.; Langereis, C.G.; Kaymakci, N.; Sözbilir, H.; Özkaymak. ; Özkaptan, M. Paleomagnetic evidence for an inverse rotation history of Western Anatolia during the exhumation of Menderes core complex. Earth Planet. Sci. Lett. 2015, 414, 108–125. [Google Scholar] [CrossRef]
- Yudalevich, Z.A. , Fershtater, G.B. and Eyal, M., 2014. Magmatism of Makhtesh-Ramon: Geology, geochemistry, petrogenesis (Conservation area Har Ha-Negev, Israel). Lithosphere, No. 3, 70-92 (in Russian).
- Yudalevich, Z. and Vapnik, E., 2018. Xenocrysts and megacrysts of alkali-olivine-basalt-basanite-nephelinite association of Makhtesh Ramon (Israel): Interaction with transporting magmas and morphological adjustment. Lithosphere, 18, No. 5, 70-92 (in Russian).
- van der Hilst, R.D.; Widiyantoro, S.; Engdahl, E.R. Evidence for deep mantle circulation from global tomography. Nature 1997, 386, 578–584. [Google Scholar] [CrossRef]
- van der Meer, D.G.; van Hinsbergen, D.J.; Spakman, W. Atlas of the underworld: Slab remnants in the mantle, their sinking history, and a new outlook on lower mantle viscosity. Tectonophysics 2018, 723, 309–448. [Google Scholar] [CrossRef]
- Vapnik, Y.; Sharygin, V.V.; Samoilov, V.; Yudalevich, Z. The petrogenesis of basic and ultrabasic alkaline rocks of western Makhtesh Ramon, Israel: geochemistry, melt and fluid inclusion study. Int. J. Earth Sci. 2006, 96, 663–684. [Google Scholar] [CrossRef]
- Véronnet, A. , 1912. Rotation de l’Ellipsoide Hétérogène et Figure Exacte de la Terre. J. Math. Pures et Appl., 8, Ser. 6, 331‒463.
- Wen, L.; Helmberger, D.V. Ultra-Low Velocity Zones Near the Core-Mantle Boundary from Broadband PKP Precursors. Science 1998, 279, 1701–1703. [Google Scholar] [CrossRef]
- Wilson, M.; Shimron, A.E.; Preston, J.; Rosenbaum, J.M. Early Cretaceous magmatism of Mount Hermon, Northern Israel. Contrib. Miner. Pet. 2000, 139, 54–67. [Google Scholar] [CrossRef]
- Zak, I. , 1968. Geological Map of Israel (1:20,000). Makhtesh Ramon, Har Gevanim. Israel Geol. Survey.
- Zilberman, E. and Avni, Y., 2004a. The geological map of Israel, 1:50,000. Sheet 21-I, Har Hamran. Israel Geol. Surv., Jerusalem.
- Zilberman, E. and Avni, Y., 2004b. The geological map of Israel, 1: 50,000. Sheet 21-II: Mizpe Ramon. Israel Geol. Surv., Jerusalem.
Disclaimer/Publisher’s Note: The statements, opinions and data contained in all publications are solely those of the individual author(s) and contributor(s) and not of MDPI and/or the editor(s). MDPI and/or the editor(s) disclaim responsibility for any injury to people or property resulting from any ideas, methods, instructions or products referred to in the content. |
© 2023 by the authors. Licensee MDPI, Basel, Switzerland. This article is an open access article distributed under the terms and conditions of the Creative Commons Attribution (CC BY) license (http://creativecommons.org/licenses/by/4.0/).


