Preprint
Article

Association of Polymeric Immunoglobulin Receptor Gene’s Single Nucleotide Polymorphisms with the Growth and Disease-Resistant in Chicken F2 Resource Population

Altmetrics

Downloads

123

Views

59

Comments

0

Submitted:

17 August 2023

Posted:

21 August 2023

You are already at the latest version

Alerts
Abstract
Polymeric immunoglobulin receptor (pIgR) plays an important role in mediating mucosal defenses, but the association between its single nucleotide polymorphisms (SNPs) and traits (such as growth and disease-resistant) in birds is scarcely known. In this research, we aimed to detect the single nucleotide polymorphisms of the pIgR gene in the chicken F2 resource population and discern the possible associations between pIgR SNPs and chicken growth, disease-resistant, respectively. Six-SNPs (3, 9, 15, 16, 19, and 21) in chicken (Gallus gallus) were significantly associated with disease-resistant in the pIgR gene (P < 0.05). The major allele genotype with SNP 9 and SNP 19 occurred more frequently with high Newcastle Disease Virus (NDV) antibody rates; the major allele genotype with the SNP 3 was predominant in those with significantly lower NDV antibody rates (P < 0.05); heterozygous with the SNP 15 and SNP 21 occurred more frequently with high avian leukemia virus (ALV) antibody rates; the TT genotypes with the SNP 16 was predominant in those with low infectious bursal disease (IBD) antibody rates (P < 0.05). Besides, SNP 12 showed significant associations with body weights (BW) and shank lengths (SL) (P < 0.05). Genotyping revealed that the C allele occurred more frequently in breeds with high growth rates and the T allele was predominant in those with low growth rates at 8, 10, and 12w of age (P < 0.05). This polymorphic site may serve as a useful target for the marker assisted selection of growth and disease-resistant traits in chicken.
Keywords: 
Subject: Biology and Life Sciences  -   Animal Science, Veterinary Science and Zoology

1. Introdution

Polymeric immunoglobulin receptor (pIgR), a kind of type Ⅰ trans-membrane glycoprotein, also known as an integral membrane protein located at the basolateral surface of secretory epithelial cells. As a key component of the mucosal immune system, pIgR is critical for the protective function of secretory immunoglobulins (SIgs) and mediates epithelial transcytosis of polymeric immunoglobulin A or polymeric immunoglobulin M (IgA or IgM) [3,35]. IgA class forms the first line of antigen-specific immune protection against inhaled, ingested, and sexually transmitted pathogens and antigens at mucosal surfaces [12].
In past decades, studies on pIgR increased significantly in various vertebrate species, including human, mouse, and fish. Single nucleotide polymorphism studies have found that the human pIgR gene was significantly associated with IgA nephropathy [23,25], and 4 SNPs in the pIgR gene were susceptible cause for nosopharyngeal cancer [10]. Moreover, the pIgR gene had a role in the protection of mycobacterial disease which was demonstrated by mice gene-targeting knockout [32]. The possible role of pIgR’s associations with body weight and disease efficiency in fish has been widely investigated by researchers [20]. Therefore, the analysis of pIgR subunit polymorphisms is beneficial for understanding the potential variants which affect disease-resistant. However, there are poor studies of pIgR’s polymorphisms and their related functions in poultry.
The objective of this study is to investigate the pIgR gene’s polymorphisms and elucidate the association between single nucleotide polymorphisms and growth in chickens. Furthermore, in order to clearly reveal the function of the pIgR gene, we also analyzed the associations of its polymorphisms with disease-resistant traits and their significance levels. These polymorphic sites (SNP 3, 9, 12, 15, 16, 19 and 21) could be used to improve breeding method on body weights, shank lengths, and disease-resistant in broiler breeders.

2. Materials and Methods

2.1. Experimental Animals

The F2 resource population was built from full-sib intercrosses of two distinct chicken lines with different genetic background and varying growth performance, catering to typical Chinese taste preferences. The first line is the fast-growing High Quality chicken Line A (HQLA), which has undergone selective breeding for a high growth rate for more than ten generations. (Lingnan, Guangdong Wiz Agricultural Science & Technology Co. Ltd., Guangzhou, China). The second line is the slow-growing Huiyang Beard chicken (HB), which is an unimproved local Chinese meat-type breed. The HQLA × HB F2 individuals were generated following previously conducted studies [30,34]. After purification from leukemia and diseases, a total of 644 individuals (329 males, 315 females) from 6 hatches were comprised for the association analysis. We discarded 156 chicks because of their incomplete phenotype or genotypic data. Until 5 weeks of age, each hatch was kept in a group cage. From 5 to 13 weeks, each chicken was individually housed in a cage with its own feed trough under standard farming conditions. The breeding facility provided continuous lighting and had a water curtain system in place to regulate the temperature. All birds had access to ample water and were fed ad libitum throughout the entire experiment period.

2.2. Phenotypic Data and Sample Collection

Venous blood was collected from the wing vein with ethylene diaminetetraacetic acid (EDTA) anticoagulant tubes and 1.5 ml centrifuge tubes, respectively. All blood samples were transferred to a laboratory. The standard phenol-chloroform method was performed to isolate chicken genomic DNA from the blood samples following the manufacturer’s protocols (Solarbio, BeiJing, China). Blood samples in 1.5 ml centrifuge tubes were divided into serum samples after being stored at room temperature for 12 hours. Then, DNA and serum samples were kept immediately at -80℃until the analysis.
Body weights and shank lengths were measured every 2 weeks beginning at 8 weeks of age and continuing until 12 weeks of age. (eg. BW8, BW10, BW12, SL8, SL10, SL12). All animals used in the current study were cared for and used according to the requirements of the Institute of Animal Science, Guangdong Academy of Agricultural Sciences.

2.3. Screening of SNPs and Genotyping

A total of 644 DNA samples were genotyped to determine the allele frequencies. 18 primer pairs based on the gallus pIgR gene sequences (GRCg6a, GenBank NO.NC_052557.1) were designed using the NCBI GenBank database (Table 1). PCR amplification was performed in a 25 μl reaction volume on a PCR system T100 Thermal Cycler (Bio-rad, CA, USA). The PCR reaction mixture contained 200 ng of chicken genomic DNA as a template, primers at 10 μM each (Sangon, Guangzhou, China), 2×PCR Taq Master mix (Accurate Biology, GuangZhou, China). Thermal cycling consisted of initial denaturation at 95℃ for 5 min, followed by 32 cycles consisting of denaturation at 95℃ for 30 s, annealing temperature for 30s, and extension at 72℃ for 45 s, with a final extension step of 7 min at 72℃. All amplified products were separated on 1.2% agarose gels, and then sequenced in sanger both directions by Sangon Biological Engineering Technology Company. The sequencing results were analyzed and aligned the potential polymorphic sites using the UCSC SNP database and DNAstar software (DNAstar Inc., Madison, WI, USA) [11,17]. Following the discovery of the candidate SNPs, the birds were genotyped utilizing on sequencing data. SNPs genotyping information was gathered using the SPSS 23.0 (IBM Corp, USA).

2.4. The Poultry Diseases Antibody Detection

On week 13 serum samples were collected from the blood samples of brachial vein in birds. A total of 644 serum samples were investigated with an available enzyme linked immunosorbent assay (ELISA) test for the detection of 5 poultry disease antibodies (Biochek, CA, USA). There are newcastle disease virus (NDV), avian leukemia virus (ALV), avian influenza (AI), infectious bursal disease (IBD), and infectious bronchitis virus (IBV). Sera were tested for each group's levels of particular antibodies in accordance with the ELISA kit's manufacturer's recommendations. The optical density data was read at 405 nm using a microplate reader (BioTek, Vermont, USA). For antibody titers, a logarithmic transformation was expressed as log10 and thus used before analysis the homogeneity of variance [27]. Afterwards, the mean antibody titers were calculated using the Excel program of BioChek (Microsoft Office2019, USA).

2.5. Statistical Analysis

2.6.1. Descriptive Statistics

Descriptive statistics for growth and disease-resistant traits were derived, including arithmetic means and standard error of the mean (SEM). Calculations of phenotypic and genotype data were made using the Excel application (Microsoft Office2019, USA). Then, The Pearson’s rank coefficient correlation was performed between growth and disease-resistant traits by SPSS 23.0 (IBM Corp, USA).

2.6.2. Polymorphism Evaluation

Starting the analyses of the data, a normal distribution of all data was considered with a significance level of 0.05. Each candidate gene's genotypic and allelic frequencies and Hardy-Weinberg equilibrium (HWE) testing, were assessed and calculated for each SNPs on chicken pIgR by Haploview software (Version 4.2; Broad Institute of MIT and Harvard, Cambridge, MA) [2].

2.6.3. Association Analysis

Associations between single SNP in the pIgR gene and traits (BW、SL and antibody titer) were analyzed with the GLM procedure in the F2 resource population. A general linear model was as below:
Yijklm = μ+Gm+Si+Hj+Fk+Mkl+eijklm
where Yij was the phenotypic value of traits; μ was the overall mean; Gm was the fixed effect of SNP genotype or haplotype m; Si was the fixed effect of sex i (male or female); Hj was the fixed effect of hatch j; Fk was the effect of sire k; Mkl was the effect of dam l within sire k; eijklm was the residual effect. Multiple comparisons between genotypes of significant SNP and all traits count were carried out in all chicken populations [18,34]. The single SNP’s a significance level of P < 0.05 were used to compare SNP genotyping in F2 chicken using Graph Pad Software Prism5 (San Diego, CA USA). All statistical analyses were carried out with the program SPSS 23.0 (IBM Corp, USA).

3. Results

3.1. Descriptive Statistics

According to the descriptive data in this study, the average body weight increased from 8 weeks to 12 weeks of age (e.g., 8W, 10W, and 12W BWs = 1232.43 ± 207.11 g , 1655.41 ± 284.49 g, and 2016.96 ± 351.44 g). During the study period, the average shank lengths of F2 chicken increased numerically (e.g.,8W, 10W, and 12W SLs = 80.70 ± 6.16 mm , 88.89 ± 8.20 mm, and 92.23 ± 10.30 mm). It is worth noting that the sera antibody titers for each chicken disease varied significantly, as shown in Table 2.

3.2. Identification of SNPs in the pIgR Gene

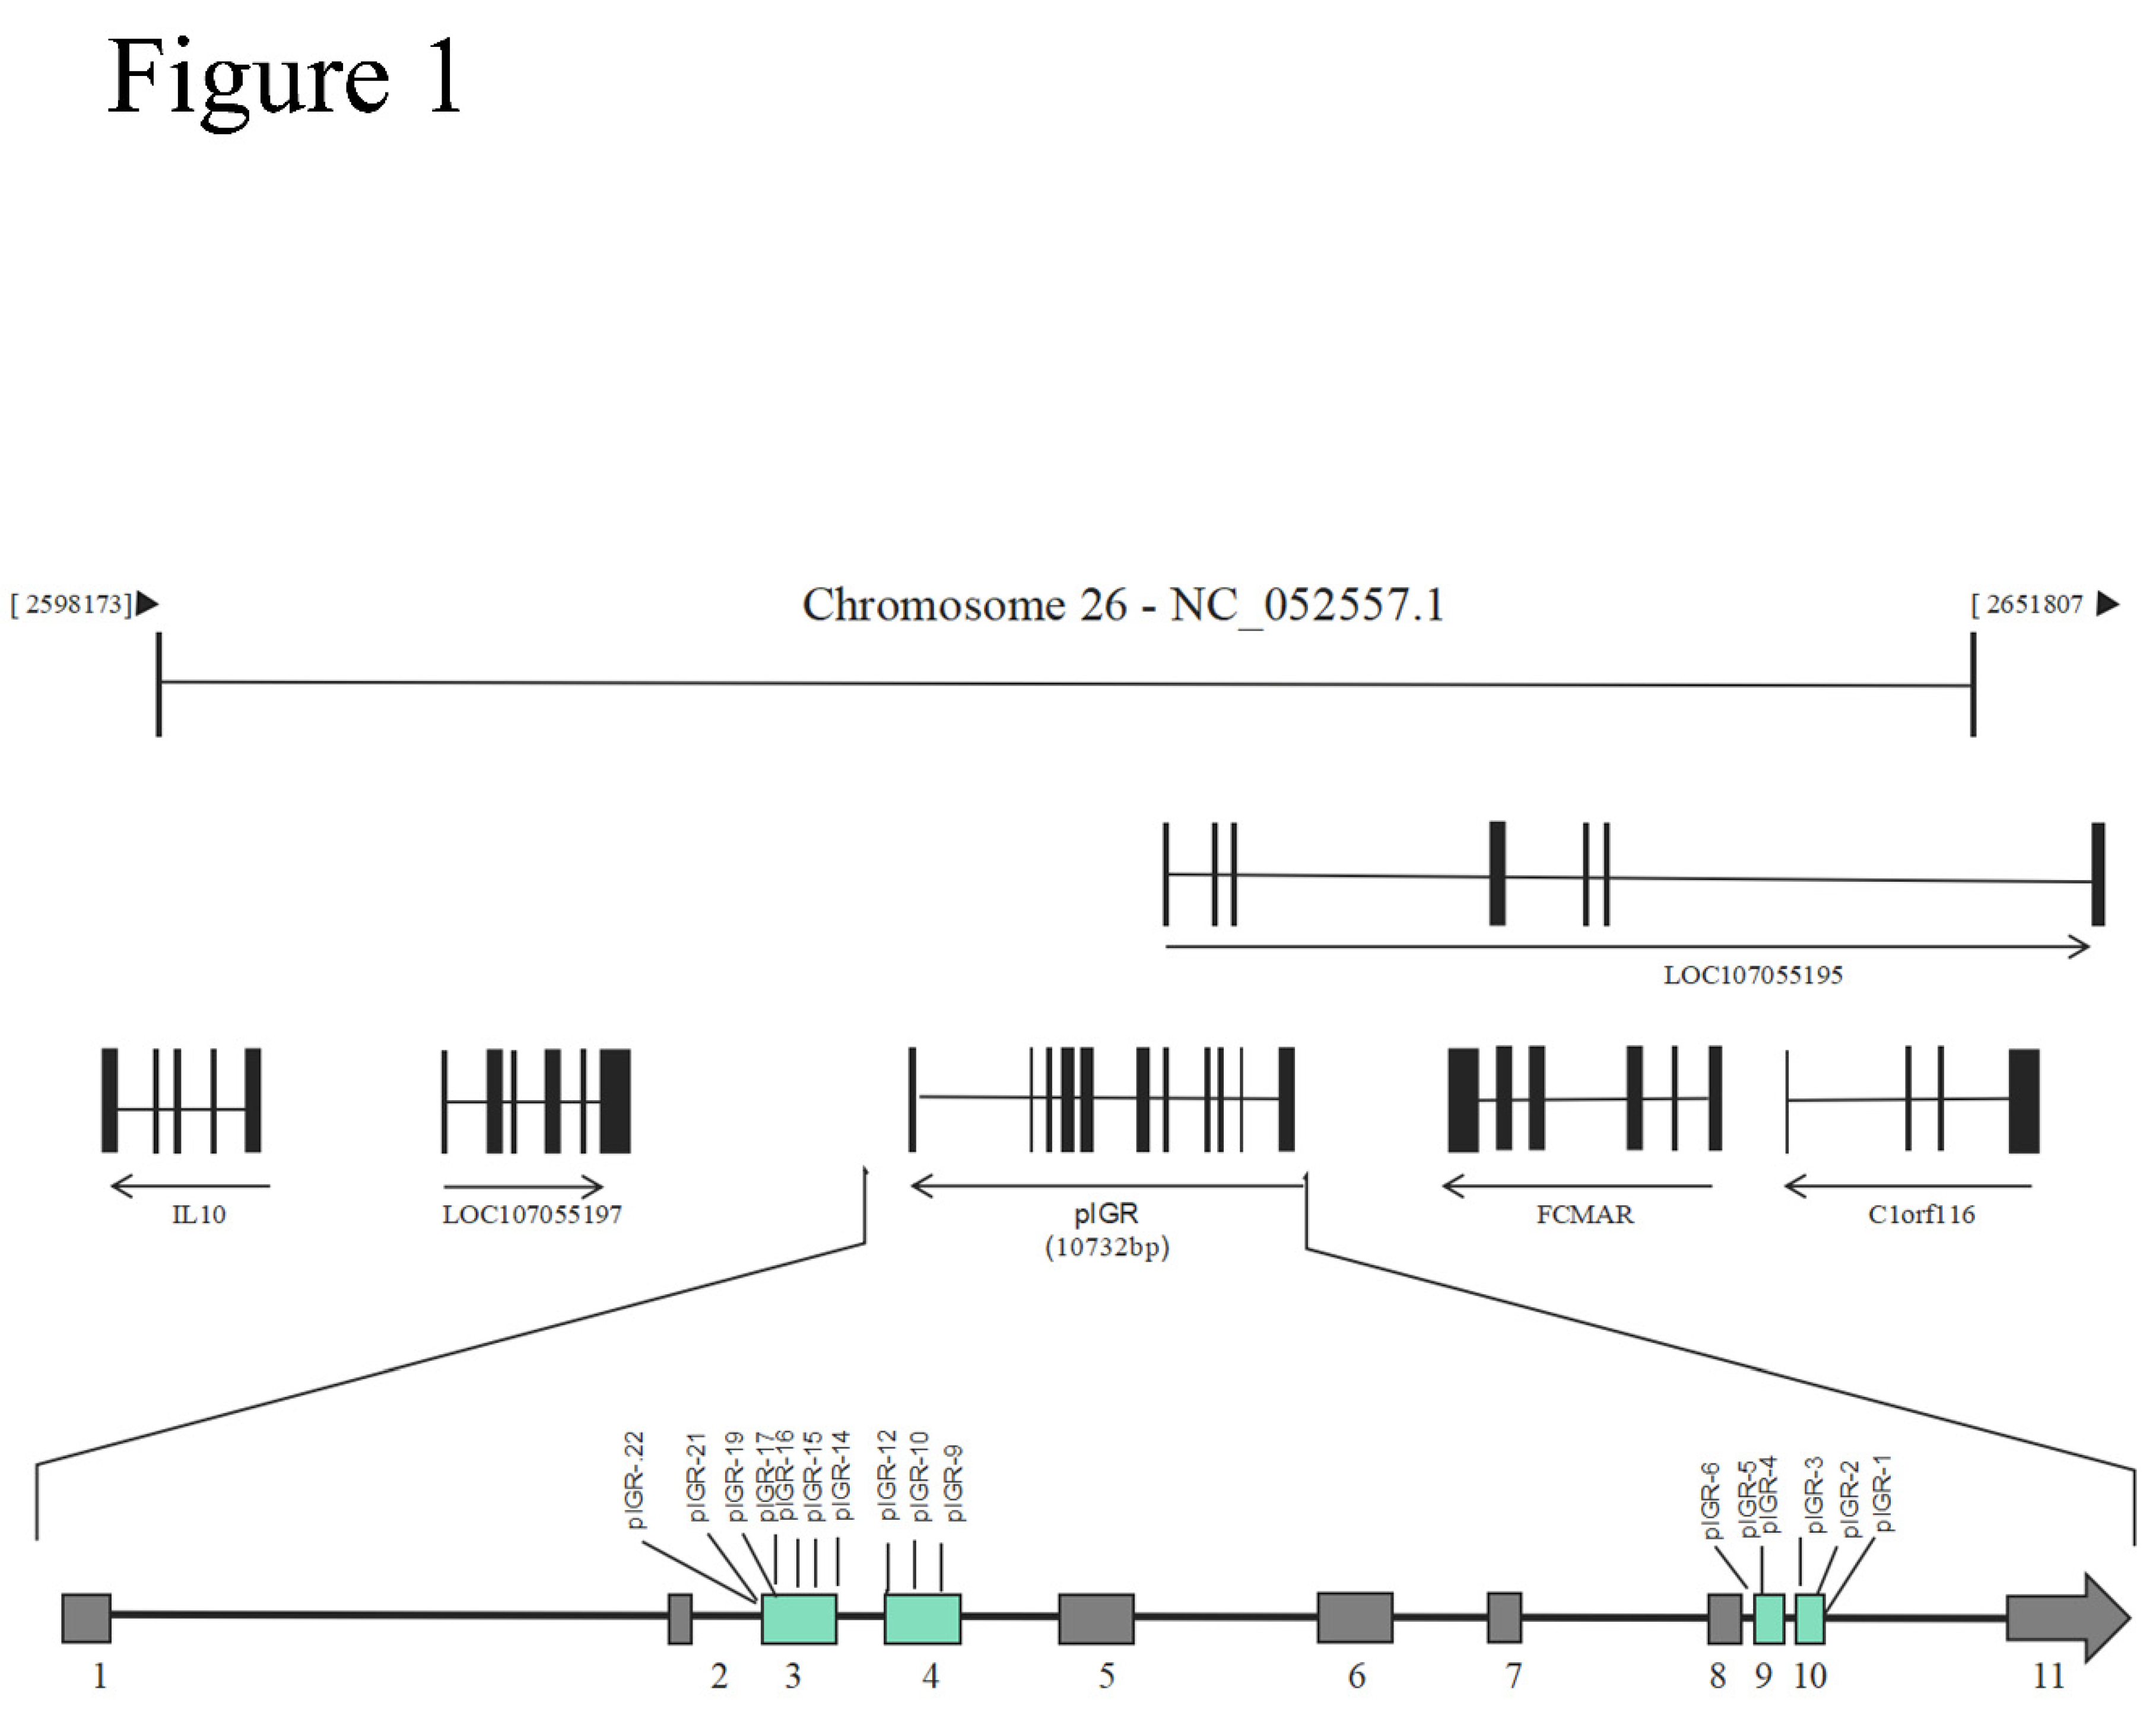
Eighteen primer pairs were created to find single nucleotide polymorphisms (SNPs) in the chicken pIGR, covering 99.43% of the gene. Sixteen SNPs in all exons of the pIgR gene were identified by comparative sequencing. They were discovered in sequence analysis of PCR-amplified genomic DNA from an F2 resource population of 644 chickens (Figure 1). We found the followings: 535 bp PCR product with 7 SNPs in exon 3; 484 bp PCR product with 3 SNPs in exon 4; 707 bp PCR product with 3 SNPs in exon 9; and 3 SNPs in exon 10 with pIgR gene of chromosome 26 (GenBank accession No.NC_052557.1). Eight SNPs with insignificant P values were discarded in data filtering. Eight remaining single nucleotide polymorphisms were candidate SNPs and proceeded with data analysis in pIgR gene.
Genes, numbers, positions, allele frequencies, and genotype frequencies were shown in Table 3. According to the data, all identified SNPs were nucleotide substitutions, and located in coding exons. Of these, SNP 12 in exon 4, SNP 14, and 15 in exon 3 were observed with results of an amino acid change, whereas SNP 3, 9, 16, 19, and 21 were observed with no change at the single SNP locus. Additionally, the amino acid SNP 12 turns serine to isoleucine, whereas the missense mutation SNP 15 transforms glycine into arginine. In chicken F2 resource population, the frequencies of heterozygous ranged from 0.50 to 0.52 were more prevalent than those of homozygous ranged from 0.18 to 0.30 in SNP 9 and 16. The total SNPs were further investigated as polymorphisms with minor allele frequency > 12% and minor genotype frequency > 2% at Hardy-Weinberg equilibrium (P > 0.01).

3.3. Association Analysis Between pIgR SNP and Growth Trait in Chicken

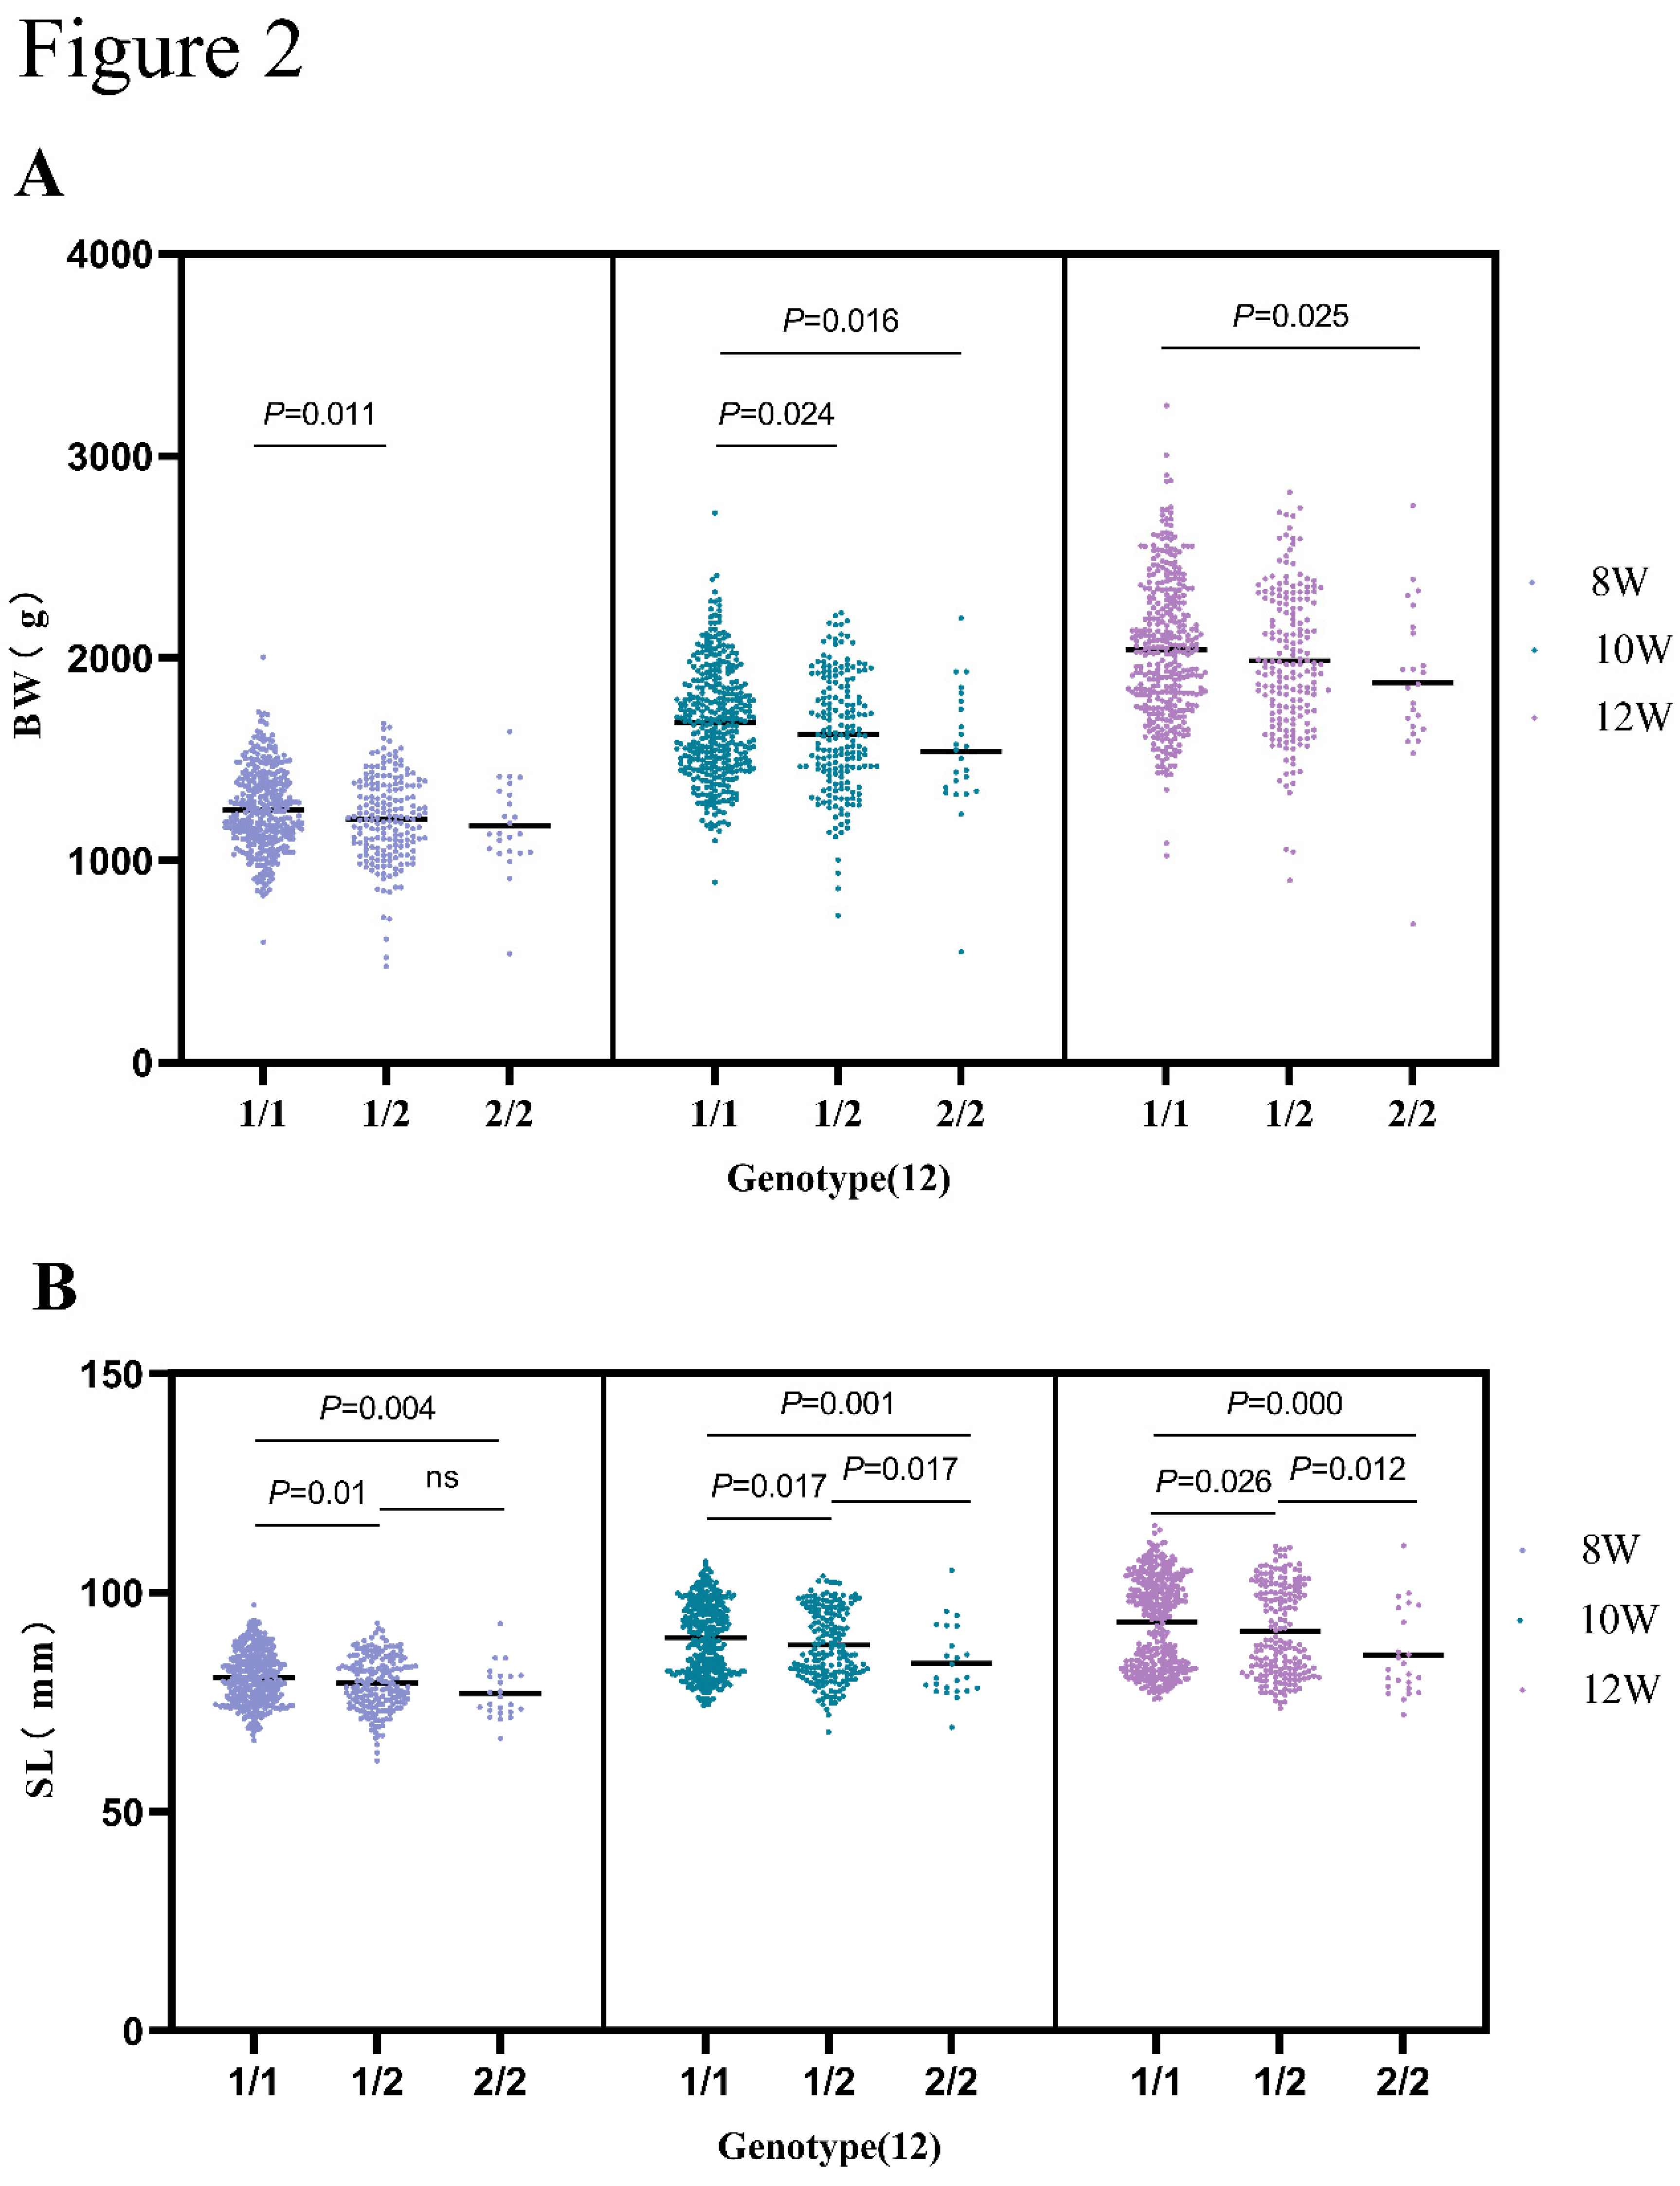
Strong associations between this SNP and body weight and shank lengths were found. As shown in Table 4, association studies observed that the SNP 12 was significantly associated with the BW at 8, 10, and 12w (P < 0.05), as well as SL at 8, 10, and 12w in F2 (P < 0.01). For BW traits, birds with the CC genotype were significantly higher than those with the CT genotype (P < 0.05) at 8 and 10w of age, but non-significantly BW at 12w of age. Furthermore, The major allele genotype (CC) were significantly higher than TT genotype at 10 and 12 w of age (P < 0.05). For SL traits, birds with the CC genotype were significantly higher than those with the CT and TT genotype (P < 0.05) at 8, 10, and 12w of age. Then, birds with the TT genotype had the significantly lowest SL at 8, 10, and 12 w of age among the population (P < 0.05) (Figure 2).

3.4. Correlation between Growth and Disease Resistance Triats

As shown in Table 5, highly significant and negative correlations between body weight, shank length and SE, AI, NDV were found at 8, 10, and 12w of age (r > -0.11011; P < 0.001), but non-significantly correlated between BW, SL and ALV, ST, IBV (P > 0.05). Correlation coefficients of BW and IBD were highly significant and positive (r > 0.09111; P < 0.001). But the same significance pattern did not appear to SL (P > 0.05). On the other hand, the correlations between BW and SL were highly significant and positive in the whole population of F2 chicken (r > 0.74911; P < 0.001).

3.5. Association Analysis of pIgR SNPs with Disease Resistance Traits in Chickens

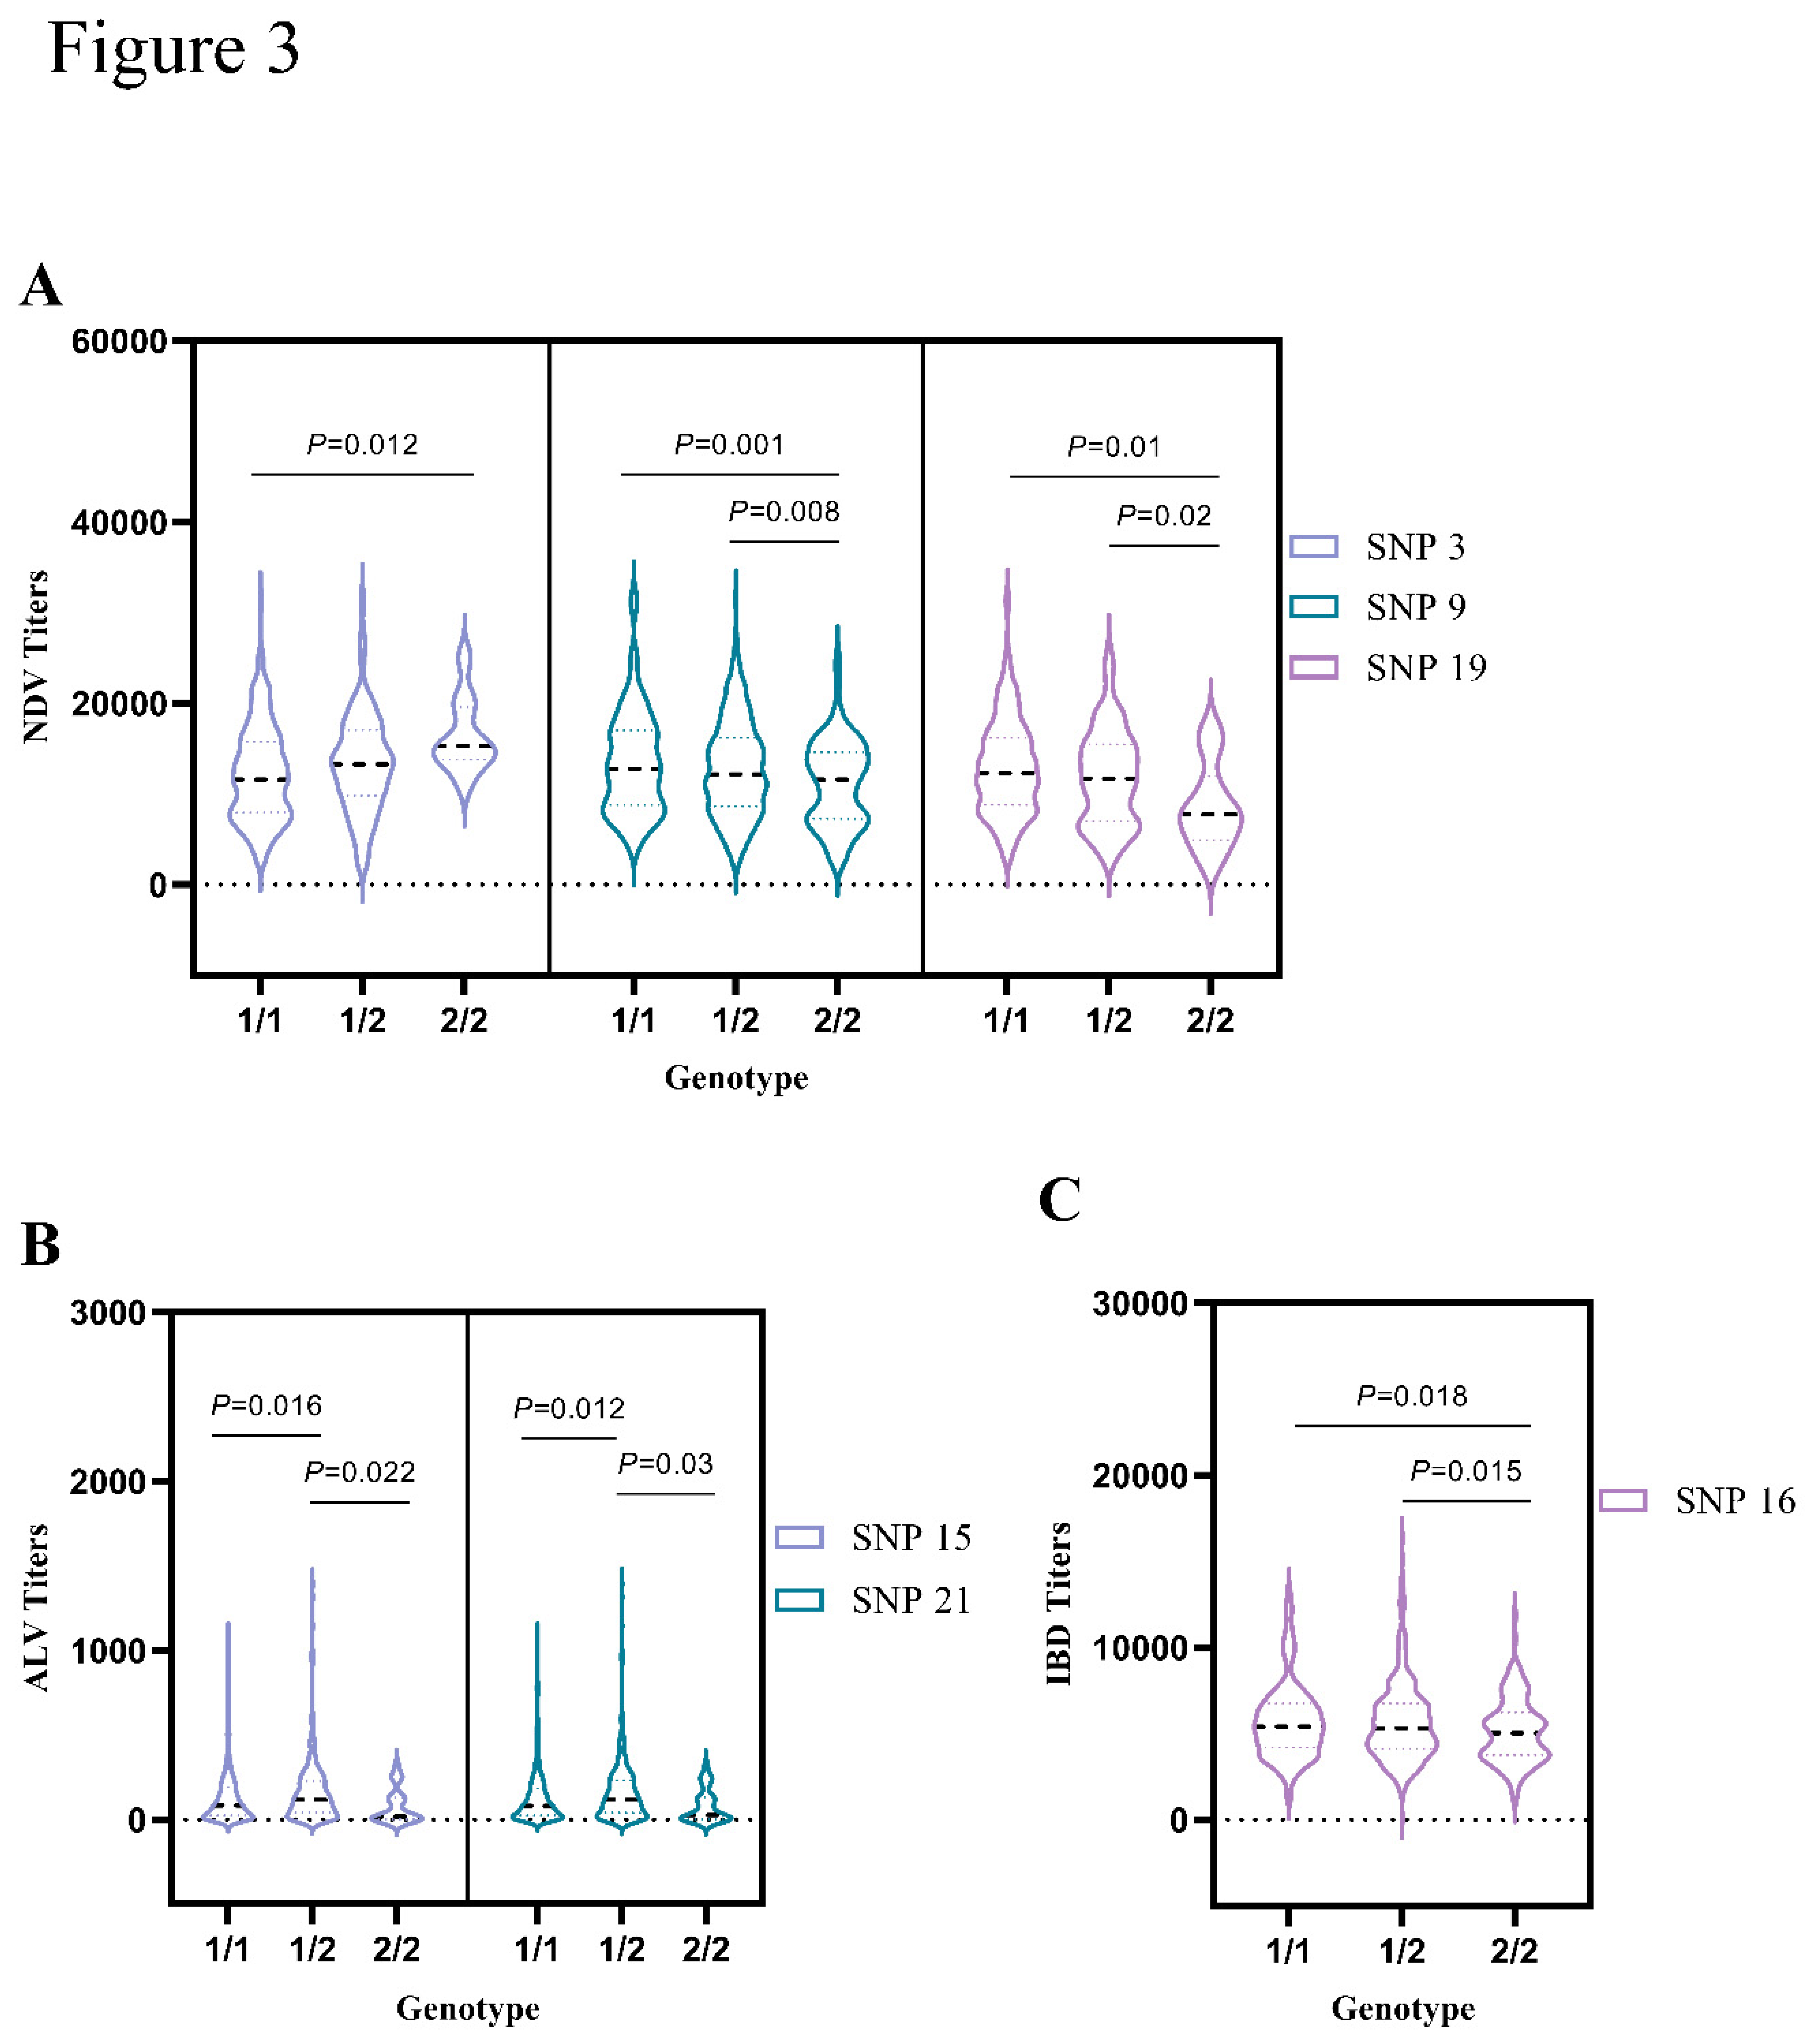
As shown in Table 6, three SNPs, such as 3, 9, and 19, were more significantly associated with NDV disease resistance traits (P < 0.05). Two SNPs, including SNP 15 and SNP 21, were significantly associated with ALV-AB disease resistance traits (P < 0.05). The SNP 16 was significantly associated with IBD disease resistance traits (P < 0.05). But IBV and AI disease resistance traits were insignificantly associated with SNPs in the pIgR gene (P > 0.05).
In our analysis of significant association between pIgR SNP and disease resistance traits, this study we also evaluated the associations between pIgR SNPs and NDV, ALV-AB, and IBD disease-resistance traits. The major allele genotype (AA/CC) with SNP 9 and SNP 19 occurred more frequently in birds with significantly higher NDV antibody rates (P < 0.05). On the other hand, the major allele genotype (CC) with SNP 3 was predominant in those with significantly lower NDV antibody rates (P < 0.05). The ALV-AB disease resistance traits show the heterosis with SNP 15 and SNP 21. Birds with heterozygous (AG/CT) were significantly higher than those with homozygous (P < 0.05). Besides, the IBD disease resistance traits for birds with the TT genotypes were significantly lower than those with CC and CT (P < 0.05)(Figure 3).

4. Discussion

Polymeric immunoglobulin receptors play an important role in cellular immunity in chickens. It has a critical role in the maintenance of barrier and intestinal homeostasis by transporting polymeric IgA antibodies across intestinal epithelial cells (IECs) into gut secretions [13,24]. In this study, the association analysis was evaluated between the pIgR SNPs and disease resistance traits (NDV, ALV, and IBD) as well as growth traits in chickens.
Newcastle disease is caused by a single-stranded RNA virus. In this disease, the viral protein is translated through the transcription of the negative-sense RNA genome. The viral protein of the single-stranded RNA virus known as Newcastle disease. It’s translated by reading the genome of the virus's negative-sense RNA [19]. It is a highly contagious and infectious disease which occurs frequently in poultry flocks. Historically, the outcome of polymorphisms for chicken has been demonstrated in a number of studies. Major histocompatibility complex (MHC) class II genetic polymorphisms were found to have substantial effects on NDV titer and body weight for the SNPs 209 and SNP 254 [21]. Seven genes (TLR7, MX, IFI27L2, SLC5A1, HSPA2, IFRD1, IL1R1) were significantly affected after being exposed to a lentogenic strain of NDV [28]. The chicken Myxovirus (Mx) gene promoter’s polymorphisms were demonstrated, which illustrated the SNP4 G > A mutation was associated with chicken embryos’ susceptibility to the virulent NDV challenge [22]. In this study, we detected a significant association between NDV and pIgR SNPs (P < 0.05). Three SNPs, such as SNP 3, SNP 9, and SNP 19, were first demonstrated. The combination of those SNPs may increase the resistant effect on NDV infected chicken. The pIgR polymorphisms associated with NDV resistance may predispose the host of the group (TT/AA/CC) to resist preferentially. Thus, NDV resistance related gene has a great potential to affect the immune system and conduct seed selection in chickens.
Avian Leukosis Virus, a single-stranded RNA retrovirus, is composed of six closely related envelope subgroups, which are identified as A, B, C, D, E, and J [1,37]. It mostly affects primarily chickens and can not only cause tumors but also immunosuppression, decreased productivity, and other production issues in infected flocks [8,9]. Previous studies demonstrated significant associations between three highly pathogenic receptor genes (NHE1, tva, and tvb) and conferring resistance to ALV [4,16]. Here, our results also indicated that the resistance of ALV was significantly associated with two SNPs (SNP 15 and 21) in chickens pIGR gene. The heterozygous (AG/CT) SNPs mentioned in the previous text have exhibited higher antibody titers in response to the ALV challenge. Thus, provided complementary tools of this gene may reveal the potential of two genotypes with hybridization dominance resistance to ALV in chickens.
Infectious bursal disease (IBD) is an immunosuppressive virus of double-stranded RNA, which primarily not only infects B-cells in the bursa follicles, but also activates T cells and macrophages in peripheral lymphoid organs [29]. After IBD virus exposure, the levels of total serum and spleen IgA, IgG, and IgM were not affected by the reduction of B cell in the bursa [26]. From an immunological standpoint, previous studies demonstrated that the BF2121 alleles of MHC gene’s exhibition were highly associated with the resistance to IBD infection [7]. Knockdown of the ribosomal protein L18 (RPL18) gene by RNA interference was significantly associated with affecting viral replication [33]. However, for the polymeric immunoglobulin receptor gene, our results also indicated its C allele had a resistant effect on chicken infected by germs IBD. Its implication will have great potential for progressing animal breeding, and can be used as a diagnostic tool for specificity and sensitivity, and provides effective protection.
Growth traits are the most essential and economic trait in poultry breeding, especially body weight and shank lengths. Historically, DNA polymorphisms have been widely concerned to affect growth traits [6,14,15]. In Amakusa Daioh cross chickens, significant associations were found between a CCKAR SNP and growth traits [31]. Recently, the SNPs of growth-related genes, including GH, IGF2, and TSHB, were associated with traits that influence body size and were potentially involved in bone growth [36]. It is well known that growth traits are microeffect polygene regulated. By Genome-wide association studies, 113 quantitative trait nucleotides were discovered with significant effects on chicken growth traits, including nucleotides on chromosome 26 [5]. Interestingly, another gene that is chosen for this study, SNP 12 in the pIgR gene, was found on chromosome 26 too. Although the effect of pIgR on growth in chickens remains unclear, our findings discovered new associated SNPs and enriched the information on existing SNPs. Moreover, our results indicated pIgR could be used as a genetic marker. By doing that, new polymorphisms could integrate into the breeding program to increase growth performance and the disease-resistance of populations.
This variant may alter the efficiency of pIgR to release IgA complex and consequently increase the disease resistance for the chicken population. This might supplement antibody-mediated defense because pIgR polymorphisms may affect disease occurrence by modifying IgA immune selection. There was a new and valuable discovery about associations of the pIgR gene polymorphisms with disease resistance traits in chickens. However, we assessed that there was a statistical correlation between inhere five viruses' genetic resistance and other economic growth traits. In further studies, the relevant genetic functions of these SNPs are required to confirm by gene editing technology of poultry. In addition, the majority need is to verify the mechanism of chicken pIgR genes related to disease-resistant and economic traits in large populations with different chicken lines. The trade-off issue between disease resistance and growth performance could be resolved with a fuller understanding of this inheritance mechanism. Achieving this genetic equilibrium gets us breeds with satisfactory commercial traits in both disease resistance and growth.
5. Conclusions

In sum, this study revealed the association of the pIgR on disease resistance traits and growth traits at different weeks in F2 chicken. The significant associations of pIgR were detected between genotype and BW, SL, NDV, ALV, and IBD, respectively.

Author Contributions

J.J. and D.S. planned and designed the study. J.H. completed the all experiments, data collection and analysis, and manuscript writing. L.X., X.X., and Y.Y. completed the animal sample and lab procedures. C.L. and H.Q. supplied laboratory facilities for immunoomics and molecular genetic procedures in China. L.X. assisted in sequencing and genotyping the samples. Q.L., C.L., and T.L. offered directions for the study and assisted in revision of the manuscript. J.J. revised and corrected the manuscript. All the authors contributed to, read, and approved the final manuscript.

Funding

This study was supported by the Special fund for National Natural Science Foundation of China (31872385), the Science and Technology Program of Guangdong Province, P. R. China (2022B0202160009), Scientific Innovation Strategy-Construction of High Level Academy of Agriculture Science (R2020PY-JX006, 202107TD), and supported by the earmarked fund for China Agriculture Research System-Meat-type Chicken (CARS-41).

Institutional Review Board Statement

Care of laboratory animals and experimentations were done in accordance with animal ethics guidelines and approved protocols. The animal study was reviewed and approved by the Animal Care Committee of the Institute of Animal Science, Guangdong Academy of Agricultural Sciences (Guangzhou, China) and Use Committee (Permission Number WZ2023001). Written informed consent was obtained from the owners for the participation of their animals in this study.

Informed Consent Statement

Not applicable.

Data Availability Statement

Data is contained within the article

Conflicts of Interest

The authors declare no potential conflict of interest in any commercial or financial relationships.

Abbreviations

PIgR Polymeric immunoglobulin receptor;
BW Body weight;
SL shank lengths;
SNP Single nucleotide polymorphisms;
ALV avian leukosis viral;
AI Avian influenza;
NDV Newcastle Disease Virus;
IBD Infectious bursal disease;
IBV Infectious Bronchitis Virus;
SIgs secretory immunoglobulins;
IgA polymeric immunoglobulin A;
IgM polymeric immunoglobulin M;
ELISA Enzyme Linked Immunosorbent Assay.

References

  1. Adkins, H.B.; Blacklow, S.C.; Young, J.A. Two functionally distinct forms of a retroviral receptor explain the nonreciprocal receptor interference among subgroups B, D, and E avian leukosis viruses. J. Virol. 2001, 75, 3520–3526. [Google Scholar] [CrossRef] [PubMed]
  2. Alam, M.B.B.; Omar, A.I.; Faruque, O.; Notter, D.R.; Periasamy, K.; Mondal, M.H.; Sarder, J.U.; Shamsuddin; Cao, J. ; Du, X.; et al. Single nucleotide polymorphisms in candidate genes are significantly associated with resistance to Haemonchus contortus infection in goats. J. Anim. Sci. Biotechnol. 2019, 10, 30. [Google Scholar] [CrossRef] [PubMed]
  3. Brandtzaeg, P.; Prydz, H. Direct evidence for an integrated function of J chain and secretory component in epithelial transport of immunoglobulins. Nature 1984, 311, 71–73. [Google Scholar] [CrossRef] [PubMed]
  4. Chen, B.; Pan, W.; Zhang, L.; Liu, J.; Ouyang, H.; Nie, Q.; Zhang, X. NHE1 gene associated with avian leukosis virus subgroup J infection in chicken. Mol. Biol. Rep. 2014, 41, 6519–6524. [Google Scholar] [CrossRef]
  5. Dou, D.; Shen, L.; Zhou, J.; Cao, Z.; Luan, P.; Li, Y.; Xiao, F.; Guo, H.; Li, H.; Zhang, H. Genome-wide association studies for growth traits in broilers. BMC Genet. 2022, 23, 1–9. [Google Scholar] [CrossRef]
  6. Dushyanth, K.; Shukla, R.; Chatterjee, R.N.; Bhattacharya, T.K. Expression and polymorphism of Follistatin (FST) gene and its association with growth traits in native and exotic chicken. Anim. Biotechnol. 2020, 33, 824–834. [Google Scholar] [CrossRef]
  7. Ewald, S.J.; Ye, X.; Avendano, S.; McLeod, S.; Lamont, S.J.; Dekkers, J.C.M. SHORT COMMUNICATION: Associations of BF2 alleles with antibody titres and production traits in commercial pure line broiler chickens. Anim. Genet. 2007, 38, 174–176. [Google Scholar] [CrossRef]
  8. Fadly, A.M. Avian retroviruses. Vet. Clin. N. Am Food Anim Pract. 1997, 13, 71–85. [Google Scholar] [CrossRef]
  9. Feng, M.; Zhang, X. Immunity to Avian Leukosis Virus: Where Are We Now and What Should We Do? Front. Immunol. 2016, 7, 624. [Google Scholar] [CrossRef]
  10. Hirunsatit, R.; Kongruttanachok, N.; Shotelersuk, K.; Supiyaphun, P.; Voravud, N.; Sakuntabhai, A.; Mutirangura, A. Polymeric immunoglobulin receptor polymorphisms and risk of nasopharyngeal cancer. BMC Genet. 2003, 4, 3. [Google Scholar] [CrossRef]
  11. Jin, S.; El Moujahid, E.M.; Duan, Z.; Zheng, J.; Qu, L.; Xu, G.; Yang, N.; Chen, S. Association of AMPK subunit gene polymorphisms with growth, feed intake, and feed efficiency in meat-type chickens. Poult. Sci. 2016, 95, 1492–1497. [Google Scholar] [CrossRef]
  12. Johansen, F.-E.; Kaetzel, C.S. Regulation of the polymeric immunoglobulin receptor and IgA transport: New advances in environmental factors that stimulate pIgR expression and its role in mucosal immunity. Mucosal Immunol. 2011, 4, 598–602. [Google Scholar] [CrossRef] [PubMed]
  13. Kaetzel, C.S.; Robinson, J.K.; Chintalacharuvu, K.R.; Vaerman, J.P.; E Lamm, M. The polymeric immunoglobulin receptor (secretory component) mediates transport of immune complexes across epithelial cells: A local defense function for IgA. Proc. Natl. Acad. Sci. USA 1991, 88, 8796–8800. [Google Scholar] [CrossRef]
  14. Kubota, S.; Vandee, A.; Keawnakient, P.; Molee, W.; Yongsawatdikul, J.; Molee, A. Effects of the MC4R, CAPN1, and ADSL genes on body weight and purine content in slow-growing chickens. Poult. Sci. 2019, 98, 4327–4337. [Google Scholar] [CrossRef]
  15. Li, K.; Huang, W.; Wang, Z.; Chen, Y.; Cai, D.; Nie, Q. circTAF8 Regulates Myoblast Development and Associated Carcass Traits in Chicken. Front. Genet. 2022, 12, 743757. [Google Scholar] [CrossRef]
  16. Liao, C.T.; Chen, S.Y.; Chen, W.G.; Liu, Y.; Sun, B.L.; Li, H.X.; Zhang, H.M.; Qu, H.; Wang, J.; Shu, D.M.; et al. Single nucleotide polymorphism variants within tva and tvb receptor genes in Chinese chickens. Poult. Sci. 2014, 93, 2482–2489. [Google Scholar] [CrossRef]
  17. Liu, K.; Wen, Y.; Liu, H.; Cao, H.; Dong, X.; Mao, H.; Yin, Z. POMC gene expression, polymorphism, and the association with reproduction traits in chickens. Poult. Sci. 2020, 99, 2895–2901. [Google Scholar] [CrossRef]
  18. Luo, C.; Sun, L.; Ma, J.; Wang, J.; Qu, H.; Shu, D. Association of single nucleotide polymorphisms in the microRNA miR-1596 locus with residual feed intake in chickens. Anim. Genet. 2015, 46, 265–271. [Google Scholar] [CrossRef] [PubMed]
  19. Mao, Q.; Ma, S.; Schrickel, P.L.; Zhao, P.; Wang, J.; Zhang, Y.; Li, S.; Wang, C. Review detection of Newcastle disease virus. Front. Veter- Sci. 2022, 9, 936251. [Google Scholar] [CrossRef]
  20. Xu, G.; Meng, Q.; Li, Z.; Tian, G.; Wang, C.; Gong, J.; Zhang, J. Characteristics of the polymeric immunoglobulin receptor (pIgR) of commercial grass carp and the immune response of pIgR and immunoglobulin to Flavobacterium columnare. Fish. Sci. 2018, 85, 101–112. [Google Scholar] [CrossRef]
  21. Molee, A.; Kongroi, K.; Kuadsantia, P.; Poompramun, C.; Likitdecharote, B. Association between Single Nucleotide Polymorphisms of the Major Histocompatibility Complex Class II Gene and Newcastle Disease Virus Titre and Body Weight in Leung Hang Khao Chickens. Asian-Australasian J. Anim. Sci. 2015, 29, 29–35. [Google Scholar] [CrossRef]
  22. Mpenda, F.N.; Keambou, C.T.; Kyallo, M.; Pelle, R.; Lyantagaye, S.L.; Buza, J. Polymorphisms of the Chicken Mx Gene Promoter and Association with Chicken Embryos’ Susceptibility to Virulent Newcastle Disease Virus Challenge. BioMed Res. Int. 2019, 2019, 1–6. [Google Scholar] [CrossRef]
  23. Narita, I.; Kondo, D.; Goto, S.; Saito, N.; Watanabe, Y.; Yamazaki, H.; Sakatsume, M.; Saito, A.; Gejyo, F. Association of Gene Polymorphism of Polymeric Immunoglobulin Receptor and IgA Nephropathy. Intern. Med. 2001, 40, 867–872. [Google Scholar] [CrossRef] [PubMed]
  24. Johansen, F.-E.; Schjerven, H.; Norderhaug, I.N.; Brandtzaeg, P. Regulation of the Formation and External Transport of Secretory Immunoglobulins. Crit. Rev. Immunol. 1999, 19, 28. [Google Scholar] [CrossRef]
  25. Obara, W.; Iida, A.; Suzuki, Y.; Tanaka, T.; Akiyama, F.; Maeda, S.; Ohnishi, Y.; Yamada, R.; Tsunoda, T.; Takei, T.; et al. Association of single-nucleotide polymorphisms in the polymeric immunoglobulin receptor gene with immunoglobulin A nephropathy (IgAN) in Japanese patients. J. Hum. Genet. 2003, 48, 293–299. [Google Scholar] [CrossRef]
  26. Petkov, D.I.; Linnemann, E.G.; Kapczynski, D.R.; Sellers, H.S. Identification and Characterization of Two Distinct Bursal B-Cell Subpopulations Following Infectious Bursal Disease Virus Infection of White Leghorn Chickens. Avian Dis. 2009, 53, 347–355. [Google Scholar] [CrossRef]
  27. Pourhossein, Z.; Qotbi, A.A.; Seidavi, A.; Laudadio, V.; Centoducati, G.; Tufarelli, V. Effect of different levels of dietary sweet orange (Citrus sinensis) peel extract on humoral immune system responses in broiler chickens. Anim. Sci. J. 2015, 86, 105–110. [Google Scholar] [CrossRef] [PubMed]
  28. Rowland, K.; Saelao, P.; Wang, Y.; Fulton, J.E.; Liebe, G.N.; McCarron, A.M.; Wolc, A.; Gallardo, R.A.; Kelly, T.; Zhou, H.; et al. Association of Candidate Genes with Response to Heat and Newcastle Disease Virus. Genes 2018, 9, 560. [Google Scholar] [CrossRef] [PubMed]
  29. Sharma, J.M.; Kim, I.-J.; Rautenschlein, S.; Yeh, H.-Y. Infectious bursal disease virus of chickens: Pathogenesis and immunosuppression. Dev. Comp. Immunol. 2000, 24, 223–235. [Google Scholar] [CrossRef]
  30. Sheng, Z.; Pettersson, M.E.; Hu, X.; Luo, C.; Qu, H.; Shu, D.; Shen, X.; Carlborg, O.; Li, N. Genetic dissection of growth traits in a Chinese indigenous x commercial broiler chicken cross. BMC Genomics 2013, 14, 151. [Google Scholar] [CrossRef]
  31. Takahashi, H.; Katayama, M.; Michishita, K.; Yamashita, H. The A Allele of the Cholecystokinin Type A Receptor Gene g. 420 C > A Polymorphism Improves Growth Traits in Amakusa Daioh Cross Chicken. J. Poult. Sci. 2019, 56, 91–95. [Google Scholar]
  32. Tjärnlund, A.; Rodríguez, A.; Cardona, P.-J.; Guirado, E.; Ivanyi, J.; Singh, M.; Troye-Blomberg, M.; Fernández, C.; Duan, X.; Hisaeda, H.; et al. Polymeric IgR knockout mice are more susceptible to mycobacterial infections in the respiratory tract than wild-type mice. Int. Immunol. 2006, 18, 807–816. [Google Scholar] [CrossRef] [PubMed]
  33. Wang, B.; Duan, X.; Fu, M.; Liu, Y.; Wang, Y.; Li, X.; Cao, H.; Zheng, S.J. The association of ribosomal protein L18 (RPL18) with infectious bursal disease virus viral protein VP3 enhances viral replication. Virus Res. 2017, 245, 69–79. [Google Scholar] [CrossRef]
  34. Wang, Y.; Guo, F.; Qu, H.; Luo, C.; Wang, J.; Shu, D. Associations between variants of bone morphogenetic protein 7 gene and growth traits in chickens. Br. Poult. Sci. 2018, 59, 264–269. [Google Scholar] [CrossRef] [PubMed]
  35. Wei, H.; Wang, J.-Y. Role of Polymeric Immunoglobulin Receptor in IgA and IgM Transcytosis. Int. J. Mol. Sci. 2021, 22, 2284. [Google Scholar] [CrossRef]
  36. Yang, C.; Teng, J.; Ning, C.; Wang, W.; Liu, S.; Zhang, Q.; Wang, D.; Tang, H. Effects of Growth-Related Genes on Body Measurement Traits in Wenshang Barred Chickens. J. Poult. Sci. 2022, 59, 323–327. [Google Scholar] [CrossRef] [PubMed]
  37. Yu, H.; Xu, H.; Yan, C.; Zhu, S.; Lan, X.; Lu, Y.; He, Q.; Yin, H.; Zhu, Q.; Zhao, X.; Li, D.; Liu, Y.; Wang, Y. 2020. gga-miR-148a-5p-Targeting PDPK1 Inhibits Proliferation and Cell Cycle Progression of Avain Leukosis Virus Subgroup J (ALV-J)-Infected Cells. Front. Cell Dev. Biol. 2020, 8, 587889. [Google Scholar] [CrossRef]
Figure 1. Genomic organization of the chicken polymeric immunoglobulin receptor (pIgR) gene at chromosome 26 (rectangles exons, horizontal lines introns).
Preprints 82672 g001
Figure 2. Scatter plot analysis comparing the distribution of various growth traits with genotypes of pIgR SNPs in F2 chicken strains. A the distribution of BW. B the distribution of SL. (1 = Major allele C, 2 = Minor allele T).
Preprints 82672 g002
Figure 3. Violin plot analysis comparing the distribution of various disease resistance traits with genotypes of pIgR SNPs in F2 chicken strains. A the distribution of NDV titers. B the distribution of ALV titers. C the distribution of IBD titers. (1 = Major allele, 2 = Minor allele).
Preprints 82672 g003
Table 1. Primers used to study pIgR gene in chicken.
Primer names Primer sequences(5′-3′) Binding regions Annealing temperature(℃) Product sizes(bp)
pIgR-1F TCACTTGGGCTTGGATGCTG Exon1 56 293
pIgR-1R GGCTGTACAAAGCTGCTACT
pIgR-2F TGGACACATTTCAGGGGGTG Exon2 54 1014
pIgR-2R TCTCTCCCTTAGGAGTGCGT
pIgR-3F TTCACGCTCACCACTATGGG Exon3 58 535
pIgR-3R AGAACGCCCTGAGTTCTTGG
pIgR-4F GGGAACACACTGACTGCTCT Exon4 58 484
pIgR-4R GGCCCCTCTGCTAATGAAAGA
pIgR-5F CCTGGGGGTCAATTCTGACA Exon5 56 502
pIgR-5R TTGTTTGTATCGAGGGGGTGG
pIgR-6F CGTTGGGTACCAATCCCACT Exon6 56 472
pIgR-6R ATTTCTGTTTCGAGGTGCTGC
pIgR-7F ATTCACACAAAGGGCTGCGT Exon7 56 349
pIgR-7R ATACATGAGAGAGGGTGGGGA
pIgR-8F GATTGCATCACACTTGCCCA Exon8-10 58 707
pIgR-8R CTGCAGGTCAGTGTTCTCTC
pIgR-11F TCCAAGGAGGATGCTGACCT Exon11 56 627
pIgR-11R CCGCTGGTGCCTATTTTCTG
pIgR-12F GGGATTCTTAGCTGGGGTGG Intron1 54 1334
pIgR-12R GGGTGTCCTAGTTCTTGCCC
pIgR-13F AGCACCAGAATTTGGCCTGA Intron1 54 848
pIgR-13R ACTCGGGTTCCTTTGTGCTT
pIgR-14F GCTCAGAGTGATTCTCCCCC Intron1 54 1098
pIgR-14R GCTCACCCCCTGAAATGTGT
pIgR-15F GTGCCTTTTCCAGGGAATGC Intron2-3 54 961
pIgR-15R TGGACCTGCGAAATCAGAGAG
pIgR-16F TCGCAGGTCCAAACATACCC Intron4 54 1119
pIgR-16R AGATCTGCTCCATTGTGGCG
pIgR-17F CCACCCCCTCGATACAAACA Intron5 54 1007
pIgR-17R AGGCTGAACCATTTCAAGCGA
pIgR-18F CTGGTATTGGTGTGGGGTGA Intron6-7 54 1409
pIgR-18R TCTGTGCAGGAGAAGCATTCAT
pIgR-19F TGAAGGAAGCATGCTCGCAG Intron8-10/3'UTR 54 1374
pIgR-19R TTATTGGACATGAGCACCCCC
pIgR-20F GGTGGAAATGCAGGGCTAGTA 5'UTR 54 1097
pIgR-20R TACAATGAGCAGAGGCAGCTA
Table 2. Arithmetic means and standard errors for body weight, shank lengths, and disease antibody titers in chicken F2 resource population.
Trait Mean ± SEM Min. Max.
8W BW (g) 1232.43±207.11 475.50 2005.50
10W BW (g) 1655.41±284.49 547.50 2719.50
12W BW (g) 2016.96±351.44 684.50 3250.00
8W SL (mm) 80.70±6.16 61.64 97.15
10W SL (mm) 88.89±8.20 68.14 107.08
12W SL (mm) 92.23±10.30 72.14 115.26
NDV Titer (log10) 12493.03±5324.01 2202 31888
AI Titer (log10) 2054.35±1984.61 95 20063
ALV Titer (log10) 145.25±182.88 0 1394
IBD Titer (log10) 5587.00±2233.40 122 16362
IBV Titer (log10) 2328.68±2631.32 17 22140
Table 3. Single nucleotide polymorphisms identified in the pIgR gene1.
Exon SNPs ID Position1 Allele 12 Allele 22 Amino acid change Genotype frequency MAF3 HWE P-value
1/1 1/2 2/2
Exon10 3 2581217 C T T/T 0.79 0.19 0.02 0.12 0.201
Exon3 9 2584371 A G A/A 0.30 0.52 0.18 0.44 0.158
12 2584522 C T V/A 0.63 0.33 0.04 0.21 1.00
Exon4 14 2584922 G T I/S 0.65 0.32 0.03 0.19 0.634
15 2584941 G A R/G 0.61 0.35 0.04 0.21 0.282
16 2584945 C T G/G 0.30 0.50 0.21 0.46 0.983
19 2585053 C G G/G 0.71 0.27 0.02 0.15 0.206
21 2585104 T C S/S 0.54 0.42 0.05 0.26 0.025
1Position: Mar.2018 (GRCg6a). 21 = Major allele ;2 = Minor allele; Amino acid symbols: A = alanine, G = glycine, I = isoleucine, R = Arginine, S = serine, T = threonine, V = valine. 3MAF = minor allele frequency.
Table 4. Single marker association effects with selected growth traits.
SNPs ID Association P-value
8W BW 10W BW 12W BW 8WSL 10W SL
3 0.357 0.408 0.379 0.228 0.417
9 0.897 0.754 0.728 0.020* 0.049*
12 0.014* 0.010* 0.028* 0.002** 0.001**
14 0.296 0.219 0.307 0.195 0.890
15 0.173 0.163 0.221 0.147 0.560
16 0.250 0.018* 0.050 0.167 0.187
19 0.487 0.513 0.735 0.815 0.821
21 0.112 0.130 0.168 0.168 0.180
* P < 0.05, ** P < 0.01.
Table 5. Correlation coefficients among SL, BW, and disease resistance traits for chicken.
Measurement 8W BW 10W BW 12W BW 8W SL 10W SL 12W SL
ALV 0.076 0.053 0.038 0.05 0.024 0.005
AI -0.152** -0.179** -0.169** -0.112** -0.177** -0.180**
NDV -0.200** -0.225** -0.201** -0.140** -0.197** -0.214**
IBD 0.172** 0.110** 0.091* 0.138** 0.074 0.036
IBV -0.086* -0.038 -0.03 -0.07 -0.004 0.013
The Pearson’s rank coefficient correlation was performed; * P < 0.05, ** P < 0.01.
Table 6. Single marker association effects with disease resistance traits.
SNPs ID Association P-value
NDV AI ALV IBD IBV
3 0.011* 0.272 0.700 0.532 0.187
9 0.004** 0.481 0.639 0.366 0.661
12 0.462 0.766 0.936 0.158 0.334
14 0.131 0.226 0.740 0.395 0.628
15 0.070 0.395 0.012* 0.440 0.802
16 0.147 0.580 0.155 0.031* 0.275
19 0.040* 0.100 0.606 0.265 0.935
21 0.670 0.299 0.011* 0.051 0.641
* P < 0.05, ** P < 0.01.
Disclaimer/Publisher’s Note: The statements, opinions and data contained in all publications are solely those of the individual author(s) and contributor(s) and not of MDPI and/or the editor(s). MDPI and/or the editor(s) disclaim responsibility for any injury to people or property resulting from any ideas, methods, instructions or products referred to in the content.
Copyright: This open access article is published under a Creative Commons CC BY 4.0 license, which permit the free download, distribution, and reuse, provided that the author and preprint are cited in any reuse.
Prerpints.org logo

Preprints.org is a free preprint server supported by MDPI in Basel, Switzerland.

Subscribe

© 2024 MDPI (Basel, Switzerland) unless otherwise stated