
Submitted:
17 August 2023
Posted:
21 August 2023
You are already at the latest version
Abstract
We found out main regularities of surface waters pollution by diesters of о-phthalic acid (PAEs) at the background level of concentrations. Lake Baikal was selected as a model for our studies. The composition of PAEs in Baicalins waters is represented by dimethyl phthalate (DMP), diethyl phthalate (DEP), di-n-butyl phthalate (DnBP), and di-(2-ethylhexyl) phthalate (DEHP). Their concentrations are assessed in statistically valuable average values and ranges: 0.02 (0.01 – 0.02), 0.07 (0.06 – 0.09), 0.55 (0.47 – 0.66), 0.30 (0.26 – 0.34), µg/L, respectively. Main factors determining PAEs concentration are found out: year and season of sampling. The distribution of PAEs in the water body meets their hydrophobicity and is characterized by: i) even distribution of minor hydrophilic congeners DMP and DEP in the whole water area; ii) maximal concentrations of hydrophobic congeners DnBP and DEHP in the upper and near-bottom layers of the water column; iii) decrease of concentration of hydrophobic congeners in the near-shore zone. The contribution of near-shore sources of PAEs into the pelagic site is minimal, the main pollutants source is atmospheric transfer. A valuable contribution of DEHP from biogenic sources into the background level of PAEs is shown. Within RQ coefficients, we assessed the environmental risk for Baicalins biota.
Keywords:
priority PAEs
; surface waters
; concentrations levels
; anthropogenic and biogenic sources
; environmental risk
; Lake Baikal
1. Introduction
Diesters of o-phthalic acid (PAEs) are of particular importance among organic micropollutants in the environment as they income from both biotic and abiotic sources. The PAEs are used as plasticizers and added to polymer materials in order to obtain required characteristics of plastics. Absence of chemical links between a polymer mesh and a plasticizer results in gradual migration of PAEs from plastic things into the environment at their exploitation and utilization. Traces of PAEs are found in the atmospheric aerosol and surrounding air, in drinking, marine, lacustrine waters and in bottom sediments [1,2,3,4,5,6,7,8]. Recent studies suggest a probable biosynthesis of PAEs by different plants, freshwater algae, cyanobacteria and fungi [9]. Therefore, PAEs found in surface water at trace levels are evidently not to be related exclusively to anthropogenic pollutants as they can income both from biogenic and abiogenic sources, the contributions of which may be comparable by their amount.
PAEs are biologically active and manifest hepo-, neuro-, cytotoxicity. Toxic effect of PAEs, such as disturbance of endocrine and reproductive functions is found out not only at humans but also at on various types of wildlife – mollusks, crustaceans, fishes and invertebrates [10,11,12]. Taking into account biological properties of PAEs and polymer materials production volume – up to 390 million tons per year [13], PAEs, as industrial pollutants, are included into the list of permanent organic pollutants (POPs) [14]. Six PAEs: di-methyl phthalate (DMP), di-ethyl phthalate (DEP), di-n-butyl phthalate (DnBP), benzyl butyl phthalate (BBP), di-(2-ethylhexyl) phthalate (DEHP) and di-n-octyl phthalate (DOP) are considered as priority ones and are to be permanently controlled in the environment. It is shown at the same time that PAEs possess an allopathic activity, antimicrobial and insecticide properties, which increase competitiveness of plants, algae and microorganisms [15].
PAEs income from stationary sources (waste waters from urban agglomerations purification facilities, emissions of industrial enterprises, areas of stock and treatment of industrial wastes and household plastic) determines a high level of these pollutants in surface and underground waters at local sites. The amount of found PAEs can reach 15-16 congeners, their ratio and concentration depend on sampling area and sources nature. In Lake Taihu, China 16 PAEs congeners in the range of summary concentration (Ʃ16PAEs) from 0.02 to 16 µg/L were found, dominant among them were DnBP, DEHP and di-i-butyl phthalate (DiBP) [16]; in the water of Kaveri River, India six PAEs congeners in the range of summary concentration (Ʃ6PAEs) from 0.31 to 4.6 µg/L were found, dominant congeners were DEHP, DEP and DnBP [4].
Water bodies pollution with household plastic is considered as one of probable PAEs sources in aquatic environment. However, as it was shown in model experiments [15], colonies of microorganisms, which recycle PAEs incoming from plastic develop in water bodies on plastic surfaces. As rates of PAEs diffusion and biodegradation are comparable, only a part of their amount diffuses into water.
Atmospheric transfer of polluted air masses and POPs precipitation from the atmosphere is main PAEs source in background areas including waters in Central Arctic and near Norwegian shore [17], high mountains in China [18]. In the atmosphere, PAEs congeners are distributed among aerosol particles and gas phase of surrounding air, the gas phase includes congeners with short alkyl chains, while congeners with long ones are adsorbed on solid aerosol particles. From the atmosphere, PAEs income onto a spreading surface – land or water by dry precipitation, or with atmospheric precipitations including aerosols particles with adsorbed hydrophobic substances [6]. In surface waters, at background level of pollution in PAEs fraction, DnBP and DEHP congeners determine a dominant group of PAEs, and change of their source influence drastically both its composition and its concentration.
In the present paper, we chose Lake Baikal as a model for studies of PAEs in surface waters with background pollution level. Choice of Lake Baikal is due to a huge volume of its water mass – up to 23600 km3, to water surface area of 31700 km2, to the depth up to 1642 m, to sharply continental climate of East Siberia and to availability of potential POPs sources on the shore. The studies tasks included: i) identification and assessment of PAEs concentration level in Lake Baikal water at present; ii) revealing of main factors influencing PAEs concentrations level; iii) distribution of PAEs in the water area and in Lake Baikal deep horizons; iv) identification of sources of PAEs in the water of Lake Baikal; v) assessment of environmental risk of PAEs in the surface waters with background pollution. In order to resolve these tasks, we monitored PAEs during 2015-2022 in the upper water layer in the pelagic site, at deep horizons, in near-shore zone and in bays of the lake, in water of South Baikal tributaries and performed a comparative statistical analysis of monitoring results.
2. Materials and Methods
2.1. Reagents and standards
Extraction of PAEs congeners from samples of water and preparation of standard solutions for GC-MS analyses were done using n-hexane (HPLC grade, Cryochrom, Russia) and acetone (reagent grade, EKOS-1, Russia). The content of PAEs in organic solvents was controlled by GC-MS prior analysis according to the signal-to-noise ratio (S/N) of the analytes, when S/N ≥ 3, the solvents were distilled before use. Glassware was sequentially washed with a solution of K2Cr2O7 in anhydrous sulfuric acid, then with distilled water, hermetically sealed with aluminum foil stoppers. EPA 606-M Phthalate Esters Mix (Supelco, Germany) were used as reference standards, deuterated phthalates: dimethyl phthalate (DMP-d4), dipropyl phthalate (DPP-d4) and dihexyl phthalate (DHP-d4) (Witega, Germany) – as surrogate internal standards.
2.2. Sampling
Water samples were collected after disappearance of ice cover on the lake (late May – early June) and after summer season (September) in 2015-2022. From pelagic site and deep horizons of the lake (Figure 1), samples were collected using an SBE-32 cassette sampler (Carousel Water Sampler, Sea-Bird Electronics, Bellevue, WA, USA). Water samples from lake tributaries were collected in river mouths of South Baikal, upper water layer (0 m). In near-shore zone, water samples were collected from upper water layer (0 m) at the distance of at least 50 m from a shore and at the depth of water layer not more than 20 m. At each station, two samples (1 L water) were taken in 1 L glass bottles, and to which 0.5 mL of a 1 M aqueous solution of sodium azide (Merck, Germany) was added as a preserving agent. Water bottles were closed using a lid with an aluminium foil gasket and stored at 5 °C until laboratory analysis.
2.3. Sample Processing
The content of PAEs in water samples was estimated by a method [19] including LLE of PAEs into n-hexane and direct analysis of extract aliquots by GC-MS-SIM. Taking into account minimal content of suspended organic matter and POPs in Baicalein water [20,21,22], in order to decrease prepare stage while determining PAEs and in order to assess biota habitat, we analyzed non-filtered water. Before extraction deuterated phthalates: DMP-d4, DPP-d4 and DHP-d4 were added in water samples for quantitation.
2.4. GC-MS-SIM Analysis
Aliquots of extract samples were analyzed using an Agilent Technologies 7890B GC System 7000C GC–MS Triple Quad chromatography–mass spectrometer with an HT- 8, SCE Analytical Science capillary column (30 m × 0.25 mm × 0.25 μm). The program for the GC oven was initiated at 50 °C, increased to 300 °C at a rate of 25 °C/min, and finally held for 5 min. The sample injector was set at 280 °C, 2.0 μL of sample solution was injected using spitless mode. The temperatures of the ion source and quadrupole were maintained at 230 °C and 150 °C, respectively. The electron impact ionization energy was 70 eV. A constant pressure at 25 psi of ultra-pure helium (99.999%) was used for a carrier gas.
PAE peaks were recorded using the SIM mode and references ions с m/z: 149, 153, 163, 167 and identified by relative retention times. PAE congeners were quantitated by the method of internal standards. The GC-MS was calibrated in the range of expected PAEs concentrations in water from 0.01 to 10 µg/L. Taking into account a simple matrix of the samples (surface waters in the background regions), causing no matrix effect, the calibration was carried out using calibration solutions prepared in a solvent used as an extractant. The solutions were prepared twice by mixing corresponding volumes of the certified reference standards PAEs mixture and surrogate standards. The reliability of approximation of calibration dependences Sa/Sst = k(ma/mst) were corresponded to the condition R2 ≥ 0.99. The concentration of PAEs in water samples was measured as the average value of the results for two parallel samples. The secondary contamination of the analyzed samples by PAE congeners from the laboratory background was evaluated by the procedure of a blank experiment, the obtained concentrations were subtracted from the results of analyses. The limit of determination of PAE congeners was estimated as 0.07 – 0.10 µg/L, relative standard deviation (RSDRl) for the determination procedure was 10-16 % for individual congeners.
2.5. HPLC-HRMS-TOF Analysis
The ratio of stable carbon isotopes 13С/12С in the composition of DEHP from surface water at a trace concentration level was estimated by a method proposed in [23]. It is based on the concentration of hydrophobic components of water using an analytical reversed phase HPLC column followed by their gradient separation and detection of eluted PAEs using a high-resolution time-of-flight mass spectrometer (HRMS-TOF) in the form of molecular ions. The ratio of stable carbon isotopes 13С/12C in DEHP congener is calculated as a ratio of the peak areas of the monoisotopic masses [M+1+H]+ and [M+H]+. Ratio values of 12C/13C (Δ13C value1) are calculated relatively to the 13C/12C ratio in commercial DEHP congener. Borderline values in the scale of Δ13C were established on the base of Δ13С values in DEHP of deliberately biogenic or anthropogenic genesis. DEHP found in Baicalein phytoplankton (Δ13С –46‰), in cells of biomass of Aconitum baicalense Turcz ex Rapaics 1907 (Δ13С –50‰) is assessed as a congener of biogenic origin. DEHP present in just fallen snow on an urban territory (Δ13С +5.2‰), in waste waters after their purification at purification facilities (Δ13С +0.2‰) is estimated as a congener incoming from anthropogenic sources. The minimal concentration of congener DEHP in water required for a reliable determination of 13С/12C value is estimated at the level of ca. 0.2 µg/L.
2.6. Environmental risk assessment
In order to assess a potential environmental risk from PAEs found in Lake Baikal water, we used a method of risk quotient (RQ), according to the European technical guidance document on risk assessment [24]. Values of RQ were calculated from the average concentration of PAE congeners in the water (CPAE, µg/L) and the predicted no effect concentration (PNEC), as in Equation (1):
RQ = CPAE / PNEC
2.7. Statistical Methods
Pairwise correlations between two replicates of measurements and the average concentration of PAEs over the entire concentration range for priority congeners in samples of Baikal water were estimated with Spearman’s r correlation coefficient. P values for the correlation coefficients were calculated using Spearman’s «W» statistics. Unreliable values of correlation coefficients (P values > 0.05) were replaced with 0 values. Pairwise correlations were visualized with a heat map generated using «gplots» in R [27]. Lines and columns in the correlation matrix were clustered and grouped in order of similarity (i.e., Euclidean distance metric and the complete-link clustering method).
For further analysis, these missing data were replaced with averages for these congeners according to the recommendations [28]. Water samples that contained concentrations of congeners (at least one congener) outside the limits of three differences between the first (Q1) and third (Q3) quartiles from the median concentration values were considered outliers and excluded from the analysis. PERMANOVA used Euclidean distance metric and 1000 permutations for P values calculations. Before PERMANOVA analysis, all concentration values в were transformed to eliminate the physical dimensions by ranging from 0 to 1.
Confidence intervals for the mean values of the concentrations PAEs, grouped according to the explanatory parameter (year, season (spring, autumn), ecotope (pelagic, сoastal, bay, river, sampling site (pelagic or other), basin (southern, central, northern), sample points), were estimated using the bootstrap method in the «boot» package and the R programming language (1000 bootstrap replicas).
3. Results and Discussion
3.1. Identification and assessment of PAEs concentration level in Lake Baikal waters at actual stage
In Lake Baikal water (in pelagic site; deep horizons; near-shore zone; Chivyrkuy and Barguzin Bays, Stations (St.) 20, 21; Maloye Morye strait, St. 19), four PAEs congeners were found: DEP, DMP, DnBP and DEHP, they are among priority ones in the system of POPs control in surface waters and a congener DiBP not included into this list. A congener DOP from priority series was not found in Baicalins water at the level of > 0.01 µg/L, and congener BBP was identified in single samples (Figure 2).
Concentration level of PAEs priority congeners in Lake Baikal was assessed with the following statistically valuable average values and concentration ranges, µg/L: 0.02 (0.01 – 0.02), 0.07 (0.06 – 0.09), 0.55 (0.47 – 0.66), 0.30 (0.26 – 0.34); for DMP, DEP, DnBP and DEHP, respectively, at dominant contribution into summary concentration (Ʃ4PAEs) of congeners DnBP and DEHP, it was up to 90% (Table S1). Data of correlational analysis (Figure 3) suggest a high convergence of results of determination of PAEs concentrations in parallel samples collected at the same station with calculated average value, therefore a subsequent analysis of monitoring data was performed using average values of PAEs concentrations. We have to notice absence of statistically valuable correlation between concentrations of DMP congener and concentrations of other priority PAEs, moderately positive correlational links between concentrations of DEP, DnBP and DEHP (P value oт 0.47 дo 0.51).
3.2. Revealing of main factors effecting PAEs concentrations level
The analysis of PAEs monitoring results in Baicalins waters using PERMANOVA method showed that concentration of this group of POPs is reliably related to a sampling year (the most valuable factor among considered ones) and to sampling season, spring or autumn (second factor by its validity) (Table 1). Average concentrations of congeners DMP and DEP are minimal and do not depend practically on a season and on lake basin. Concentrations of congeners DnBP and DEHP are higher by one order of magnitude, their seasonal variability is drastic (Figure -D), they are individual for different monitoring years and correlational links between concentrations of priority PAEs are not available or are moderately positive (Figure 4a-b, Figure 3). For example, increase of congener DMP concentration was found in 2021 and 2022, one of congener DEP in 2017, for congener DnBP maximal concentration level was found in 2017 and 2020, for congener DEHP in 2015 and 2018.
It is revealed that two groups of results of determination of PAEs concentration such as: i) central zone of lake pelagic site (St.: 3, 6, 10, 13, 17); ii) near-shore zone, big bays of Lake Baikal, rivers mouths are separately reliably related with a sampling station and (this is important) PAEs concentration in central zone of pelagic site is not reliably related to PAEs concentrations in other ecotopes (Figure 4c). We have to notice that a lake basin and a sampling point in any ecotope are not factors effecting PAEs concentrations level.
If P value ≤ 0.05, the factor influences reliably the level of PAEs concentrations in Lake Baikal water.
3.3. Distribution of PAEs in the water area and in deep horizons of Lake Baikal
Along the water area and deep horizons, the PAEs congeners are distributed according to their hydrophobicity, the constants log Kow of priority congeners are estimated with the range from 1.60 to 8.10 [29]. Congeners DMP and DEP characterized by maximal hydrophily are conserves in aquatic phase and are evenly distributed in the whole water area in range of average concentrations from 0.01 to 0.09 µg/L. Hydrophobic congeners are concentrated on suspended particles of water column and are transferred into bottom sediments. In particular, due to this fact, in near-shore zone (higher suspended particles content, more intensive stirring and thinner water layer), congeners DnBP and DEHP are characterized by lower average concentrations than in central zone of pelagic site (Figure 4c). Concentrations of congeners DnBP and DEHP in central zone is assessed by statistically valuable average values equal to 0.78 and 0.36 µg/L, respectively, which are up to two times higher than in near-shore zone (Table S1). This result is rather unexpected taking into account PAEs income from sources on the shore and, consequently, increase of PAEs concentration at some near-shore zone sites. For example, at the St. 29 (2017, spring), St. 28 (2017, autumn), we registered concentrations Ʃ4PAEs reaching 7.4–9.0 µg/L. On the other hand, data of statistical analysis such as lower average concentrations of congeners DnBP and DEHP in the near-shore zone suggest absence of near-shore zone effect onto PAEs concentration level in the central zone of the lake
In water of large bays and in Maloye Morye strait (St., 19), priority congeners are found in concentration range Ʃ4PAEs from 0.58 to 1.8 µg/L, and of maximal values is up to three times higher than average concentration Ʃ4PAEs in baicalein waters. In Chivyrkuy Bay (St., 20) no dependence of average concentrations Ʃ4PAEs on a season (0.82-0.77 µg/L, spring-autumn) was found, while in Barguzin Bay (St., 21) like in pelagic site of lake central basin (St. 21, 10), concentration Ʃ4PAEs is characterized by decrease of the level up to three times in autumn.
The situation with PAEs in water column is best presented by congeners distribution in Lake Baikal central basin with depth up to 1600 m (Figure 5). Maximal concentrations Ʃ4PAEs are found in upper and near-bottom water layers at dominant contribution of hydrophobic congeners DnBP and DEHP. In autumn, concentrations of priority PAE and their summary values Ʃ4PAEs do not depend on water sampling depth and reflect a background level of pollution of Lake Baikal waters with this class of POPs.
3.4. Sources of PAEs in the water of Lake Baikal
3.4.1. Anthropogenic sources
Atmospheric transfer of POPs and the feature of air masses circulation above Lake Baikal water area [30,31] favor PAEs transfer from the atmosphere to lake waters. Dominance of hydrophobic congeners DnBP and DEHP in upper water layer of lake pelagic site suggests their income from the atmosphere with aerosol particles. When the lake is covered with ice, atmospheric way of POPs income into lake waters is closed and in water samples collected from under ice area there are drastic variations in PAEs composition. Concentration Ʃ4PAEs is found in the range from 1.8 to 6.1 µg/L, congeners DEP, DMP and DnBP are characterized by minimal contribution into summary concentration, not exceeding 0.33 µg/L, and DEHP fraction reaches an extreme level – up to 5.8 µg/L.
Income of POPs from the atmosphere in winter and their accumulation in the snow cover in tributaries water catchment basins, on the shore, in lake ice and their subsequent drainage into the lake in spring with thaw waters2 are evidently related to one of PAEs sources determining a drastic seasonal variability of DnBP and DEHP concentration. Monitoring of PAEs in the water of South Baikal tributaries having water catchment basins on natural reserves territory confirms this assumption. Concentration of Ʃ4PAEs increases in tributaries water in spring, during some seasons – by one order of magnitude compared to concentrations of Ʃ4PAEs revealed in autumn. Average concentrations of Ʃ4PAEs in tributaries mouths are assesses at the level of 0.79 µg/L and in the range from 0.56 to 1.1 µg/L (autumn-spring); we have to notice that contributions of congeners DnBP and DEHP are comparable (ratio DnBP/DEHP is not out the interval from 0.99 to 1.1), this suggests presence of other PAEs sources while comparing with central lake zone, where value of ratio DnBP/DEHP is equal to 2.2.
Lake tributaries receiving waste waters from purification facilities in cities and settlements on the shore are potential anthropogenic sources of PAEs. For example, in water mouth of the Pokhabikha R. (Slyudyanka City, St. 34) and the Mysovka R. (Babushkin town, St. 31), concentration of Ʃ4PAEs reaches 2.6 µg/L with increase of fraction of hydrophilic congeners DMP and DEP, up to 7.0-20 % of the sum Ʃ4PAEs, respectively, as a part of priority PAEs. Similar ratio of priority congeners is typical for purified waste waters, in particular, after Slyudyanka City purification facilities, concentration of Ʃ4PAEs in the drainage waters is within the range from 21 to 29 µg/L, fraction of congeners DMP and DEP is 20 and 46 %, respectively. In the area of Selenga shallow water (St. 24) – part of Lake Baikal, opposite to the Selenga R. delta with depth ≤ 400 m – concentration of Ʃ4PAEs did not exceed 0.77 µg/L (St. 24, 2021, autumn), but we found in PAEs fraction the increase of fraction of congener DEP (20 % of Ʃ4PAEs), evidently, due to its income with waste waters drained into the Selenga R.
Besides waste waters from purification facilities, household wastes on tourist centers territory consisting mainly of plastic (bottles, containers, package material) are also related to anthropogenic sources of PAEs. In water samples from the shore where there is a recreation center (St. 28, 2017, September), concentration of Ʃ4PAEs was 7.4 µg/L with dominant congener DEP, 78 % of Ʃ4PAEs. It is to notice that a high concentration of DEP may result from biodegradation of PAEs with long alkyl substituents [32] or from direct income from package for cosmetics and personal hygiene ware [33].
3.4.2. Biogenic sources of PAEs
PAEs can be synthesized naturally, therefore ones found in surface water at trace level can income as well from biogenic sources. For example, in water samples collected under the ice in March, 2016 at St. 5 [19] and in March, 2022 at St. 3 and 6, we registered DEHP concentrations from 4.8 to 5.8 µg/L comparable with the level of maximum allowable concentration (MAC) established for this congener (8 µg/L). In phytoplankton samples collected together with water samples, DEHP content reached 60–170 µg/g of dry biomass. Identification of freshwater diatom alga Synedra acus subsp. Radians (Küts) as a main component of phytoplankton and congener DEHP in it allowed to link the increase of DEHP concentration in the water under ice with the period of under ice bloom of this alga, and measuring of the ratio of carbon stable isotope 13С3/12С in DEHP [23] – to confirm the dominant contribution of a biogenic source in this congener.
Change in the ratio 13С3/12С (Δ13С) in DEHP allowed to reveal the contribution of biogenic sources into the background level of PAEs in open Baikal surface waters. Thus, at comparable concentrations of Ʃ4PAEs (0.21 µg/L) in two lake basins, northern one (St. 17) was dominated by biogenic sources of DEHP (Δ13С = –30 ‰), while southern one (St. 3) – by anthropogenic sources of DEHP (Δ13С = –16 ‰). In spring of 2022, in water samples from lake tributaries the Snezhnaya R. and the Solzan R. (St. 32 and 33) PAEs were found with concentrations of Ʃ4PAEs 0.31 and 0.43 µg/L, respectively, DEHP congener dominated. Measurement of isotopic composition in this congener on the scale of Δ13С showed the presence of a valuable contribution of biogenic sources of DEHP (Δ13С –20 ‰) in waters of the Solzan R. and dominance of anthropogenic sources of DEHP (Δ13С +5.6 ‰) in the Snezhnaya R. In water samples collected near the lake shore (St. 22, 35 – popular recreation sites), at concentrations of Ʃ4PAEs as much as 0.32 and 0.78 µg/L and at maximal contribution of congener DEHP, the value of Δ13С equal to –37 ‰ at the dominant congener suggested a main contribution of biogenic sources at the St. 5, while at the St. 35, value of Δ13С equal to –10 ‰ confirmed a large contribution of anthropogenic sources of congener DEHP.
3.5. Ecological rick assessment of the PAEs in the surface waters
Concentration of priority PAEs in baicalein water is comparable or less than in water of freshwater lakes and rivers worldwide (Table 2). Concentration of congener DEHP is more than one order of magnitude lower than MAC: 8 µg/L in drinking water [34], 1.3 µg/L in fresh and marine water [35], 8 µg/L in Russian water bodies [36]. At such standards established for the congener DEHP, a risk for humans while drinking baicalein water is absent.
A potential environmental risk for Baicalein biota from PAEs was assessed by RQ coefficients calculated using average concentrations of priority PAEs in Baicalein waters (Table S2). It is found out that congeners DMP and DEP in lake pelagic area do not represent or represent a very low risk for lake hydrobionts: fishes, crustaceans and algae as calculated values of RQ are < 0.01. Concentrations of dominant congeners DnBP and DEHP represent a low risk level for crustaceans and fishes and a high one for algae at DEHP concentration reaching 0.30 µg/L. Increase of PAEs concentration in lake pelagic site in spring at some sites of near-shore zone and accumulation of hydrophobic congeners at deep horizons increase the environmental risk up to average and high one for algae (Table S3). Presence of congener DnBP in tributaries water is assessed as a very low risk level, and presence of congener DEHP – as average and high ones.
Extreme DEHP concentration in water under ice (RQ ˃˃ 1.0) bothers. Measurement of carbon stable isotopes 13С/12С in DEHP explains a phenomenon of high concentrations of this congener by its income from biotic sources [23]. Due to this fact, we have to notice the following: i) congener DEHP is related to potential carcinogens [37] and MAC for it is “the severest”; ii) DEHP structure is presented by two stereoisomers but only one optically active bis-2R(-)ethylhexyl phthalate is extracted from environmental objects, for example, from a biomass of culturable cells of Aconitum baicalense (Turcz ex Rapaics 1907) and from brown sugar [38,39]; iii) toxicological studies of DEHP were done at a synthetic racemic product, and a natural stereoisomer of DEHP has not to possess mandatory the same physiological properties [40]; iv) while revealing extreme concentrations of congener DEHP, before taking due environment protection measures, it is necessary to identify a DEHP source – biogenic or anthropogenic one.
In the environment, congeners PAEs are slowly degraded by various physico-chemical processes, in particular, at hydrolysis, value of half-lives (t½) reaches 100 years and more. Biodegradation can be the most important process for the removal of PAEs from water and under aerobic conditions, it runs with a high rate, t½ value is as much as from 1 to 14 days [6,11,41]. Decrease of Ʃ4PAEs concentration in Lake Baikal surface water during a summer is due both to decrease of intensity of their sources and to degradation of PAEs, which in came into the lake in spring. Thus, a dynamic equilibrium between PAEs income from different sources, efficiency of biodegradation processes and transfer of dominant hydrophobic congeners into bottom sediments are to be considered as main processes determining a background level of PAEs.

Table 2.
Concentrations of PAEs in surface water of recent studies, µg/L.
| Area | DMP | DEP | DnBP | BBP | DEHP | DnOP | ƩPAEs | Reference |
| Lakes in Hanoi metropolitan area, Vietnam | 0.11 – 2.9 | 0.64 – 14 | 0.78 –34 | 0.18 – 21 | 1.0 – 49 | ˂ 0.02 – 7.3 | Ʃ10 19 – 130 | [42] |
| Lake Victoria (Uganda) | 0.006 – 0.40 | 0.04 – 1.1 | 0.35 – 16 | - | 0.21 – 23 | – | Ʃ4 0.67 – 50 | [43] |
| Yangtze River, China | ˂ 0.01 | ˂ 0.01 | 0.22 – 20 | ˂ 0.01 – 0.02 | 0.02 – 7.0 | ˂ 0.01 | Ʃ16 0.44 – 20 | [44] |
| Lake Taihu, China | ˂ 0.02 – 0.80 | ˂ 0.02 – 0.12 | ˂ 0.02 – 0.19 | ˂ 0.02 – 1.3 | ˂ 0.02 – 3.3 | ˂ 0.02 – 0.65 | Ʃ16 0.02 – 16 | [16] |
| Kaveri River, India | ˂ 0.01 – 0.01 | 0.04 – 0.52 | ˂ 0.01 – 0.37 | ˂ 0.01 – 0.14 | ˂ 0.01 – 0.82 | ˂ 0.01 – 0.08 | Ʃ6 0.04 – 4.6 | [4] |
| Lake Large Xingkai, China | 0.003 – 0.026 | 0.003 – 0.018 | 0.11 – 0.52 | 0.11 – 0.52 | 0.22–3.4 | nd –0.007 | Ʃ8 0.35 – 3.8 | [45] |
| Lake Asan, Korea | ˂ 0.02 –0.18 | ˂ 0.02 – 0.05 | ˂ 0.02 – 0.34 | ˂ 0.02 | ˂ 0.02 – 1.3 | ˂ 0.02 – 0.02 | Ʃ14 0.02 – 1.9 | [46] |
| Lakes in Summer Palace, China | 0.04 – 0.08 | ˂ 0.01 – 0.01 | 0.03 – 0.04 | ˂ 0.01 – 0.01 | 0.14 – 0.39 | ˂ 0.01 – 0.02 | Ʃ15 0.58 –1.4 | [47] |
| Changjiang River Estuary, China | 0.04 – 0.28 | 0.02 – 0.18 | 0.03 – 2.4 | ˂ 0.01 | ˂ 0.01 – 0.01 | ˂ 0.01 – 0.01 | Ʃ16 0.27 – 1.3 | [48] |
| Mediterranean Sea, Bay of Marseilles, France | ˂ 0.01 | ˂ 0.01 – 0.05 | 0.06 – 0.46 | ˂ 0.01 | 0.10 – 0.30 | ˂ 0.01 | Ʃ8 0.24 – 1.2 | [7] |
| Lakes Baikal, Russia | 0.01 – 0.02 | 0.06 – 0.08 | 0.47 – 0.66 | ˂ 0.01 | 0.26– 0.34 | ˂ 0.01 | Ʃ4 0.66 – 0.87 1 | This study |
Note: 1 – for Lake Baikal waters the mean value for Ʃ4PAEs is assessed as equal 0.76 µg/L and confidence interval of 0.66 – 0.87 µg/L (Р 0.95).
4. Conclusions
Having studied PAEs in Lake Baikal waters as a model, we established a series of regularities in surface waters pollution on the background level with this class of POPs. Qualitatively, PAEs composition is represented by a minimal congeners amount. Concentration of PAEs available at trace level is reliably linked to a sampling year and does not depend on any sampling point in an ecotope, may it be pelagic site, large gulfs or a near-shore zone. Under the conditions of harsh continental climate, concentration of hydrophobic dominant congeners is characterized by a drastic seasonal variability – it increases in spring and decreases up to background level by end of summer. The latter is determined by a dynamic equilibrium between PAEs income from different sources and efficiency of biodegradation processes and a possibility of transfer into bottom sediments. PAEs distribution in a water body meets their hydrophobicity and is characterized by: i) an even distribution of minor hydrophilic congeners around the whole water area of a water body; ii) maximal concentrations of hydrophobic congeners in upper and near-bottom layers of a water column; iii) decrease of hydrophobic congeners concentrations in a near-shore zone. The contribution of PAEs near-shore sources into pelagic site is minimal, and the latter reflects adequately PAEs concentration in surface waters at the background level due to atmospheric transfer as a main pollutants source. Biogenic sources can contribute considerably both into PAEs background level and into concentration increase up to extreme values. Congeners with short alkyl substitutes in the structure do not represent or represent a very low risk for hydrobionts at background concentrations level. While assessing environmental risk for biota from dominant hydrophobic congeners, it is necessary to take into account their maximal adsorption on suspended particles of aquatic environment, probability of their transfer into bottom sediments and income from biogenic sources as well as their role in any aquatic ecosystem.
Supplementary Materials
The following supporting information can be downloaded at the website of this paper posted on Preprints.org. Table S1: Average values (confidence intervals, P=0.95) for different groups of results of PAEs monitoring in LAKE Baikal waters. Table S2: Assessment of environmental risk for hydrobionts by average concentrations of priority congeners PAEs. Table S3: Assessment of environmental risk (RQ) for dominant congeners of PAEs at increase of their concentrations level (C, µg/L) in Lake Baikal waters and in the lake tributaries mouths.
Author Contributions
A.G. original idea, writing, and preparation of the original draft; T.G. sample preparation for analysis, GC-MS analysis; Y.B. statistical analysis; A.K. HPLC-HRMS-TOF analysis. All authors have read and agreed to the published version of the manuscript.
Funding
This research received no external funding.
Institutional Review Board Statement
Not applicable.
Informed Consent Statement
Not applicable.
Data Availability Statement
The datasets obtained and analyzed in the current study are available from the corresponding author on reasonable request.
Acknowledgments
The authors thank I.V. Khanaev for water sampling under the ice, O.V. Kustova and Senior Research Scientist O.N. Izosimova for help in analysis using GC-MS method. GC-MS analysis was carried out in the Shared Research Facilities for Physical and Chemical Ultramicroanalysis LIN SB RAS. This study was carried out within the framework of the State Task of Limnological Institute SB RAS, project 0279-2021-0005 (State Registration No 121032300224-8).
Conflicts of Interest
The authors declare that they have no known competing financial interests or personal relationships that could have appeared to influence the work reported in this paper.
| 1 | It is not to be confused with value of δ13С, which is calculated by the international VPDB scale. |
| 2 | Concentration of priority PAEs in the snow cover of Lake Baikal southern shore is found out in the range from 0.46 to 3.9 µg/L. |
References
- Wang, P.; Wang, S.L.; Fan, C.Q. Atmospheric distribution of particulate- and gas-phase phthalic esters (PAEs) in a Metropolitan City, Nanjing, East China. Chemosphere 2008, 72, 1567–1572. [Google Scholar] [CrossRef]
- Pei, X.Q.; Song, M.; Guo, M.; Mo, F.F.; Shen, X.Y. Concentration and risk assessment of phthalates present in indoor air from newly decorated apartments. Atmos. Environ. 2013, 68, 17–23. [Google Scholar] [CrossRef]
- Gao, D.-W.; Wen, Z.-D. Phthalate esters in the environment: A critical review of their occurrence, biodegradation, and removal during wastewater treatment processes. Sci. Total Environ. 2016, 541, 15–986. [Google Scholar] [CrossRef]
- Selvaraj, K.K.; Sundaramoorthy, G.; Ravichandran, P.K.; Girijan, G.K.; Sampath, S.; Ramaswamy, B.R. Phthalate esters in water and sediments of the Kaveri River, India: Environmental levels and ecotoxicological evaluations. Environ. Geochem. Health 2015, 37, 83–96. [Google Scholar] [CrossRef]
- Li, T.; Yin, P.; Zhao, L.; Wang, G.; Yu, Q.J.; Li, H.; Duan, S. Spatial-temporal distribution of phthalate esters from riverine outlets of Pearl River Delta in China. Water Sci. Technol. 2015, 71, 183–190. [Google Scholar] [CrossRef]
- Net, S.; Sempéré, R.; Delmont, A.; Palusell, A.; Ouddane, B. Occurrence, fate, behavior and ecotoxicological state of phthalates in different environmental matrices. Environ. Sci. Technol. 2015, 49, 4019–4035. [Google Scholar] [CrossRef]
- Paluselli, A.; Aminot, Y.; Galgani, F.; Net, S.; Sempéré, R. Occurrence of phthalate acid esters (PAEs) in the northwestern Mediterranean Sea and the Rhone River. Prog. Oceanogr. 2018, 163, 221–231. [Google Scholar] [CrossRef]
- Cao, Y.; Lin, H.; Wang, Q.; Li, J.; Liu, M.; Zhang, K.; Xu, S.; Huang, G.; Ruan, Y.; Wu, J.; Leung, K.M.Y.; Lam, P.K.S. Significant riverine inputs of typical plastic additives-phthalate esters from the Pearl River Delta to the northern South China Sea. Sci Total Environ. 2022, 25, 157744. [Google Scholar] [CrossRef] [PubMed]
- Huang, L.; Zhu, X.; Zhou, S.; Cheng, Z.; Shi, K.; Zhang, C.; Shao, H. Phthalic Acid Esters: Natural Sources and Biological Activities. Toxins 2021, 13, 495. [Google Scholar] [CrossRef] [PubMed]
- Heudorf, U.; Mersch-Sundermann, V.; Angerer, J. Phthalates: Toxicology and exposure. Inter. J. Hygiene Environ. Health 2007, 210, 5–623. [Google Scholar] [CrossRef]
- Benjamin, S.; Pradeep, S.; Josh, M.S.; Kumar, S.; Masai, E. A monograph on the remediation of hazardous phthalates. J. Hazardous Materials 2015, 298, 58–72. [Google Scholar] [CrossRef] [PubMed]
- Rowdhwal, S.S.S.; Chen, J. Toxic effects of di-2-ethylhexyl phthalate: An overview. BioMed Res. Inter. 2018, 1750368. [Google Scholar] [CrossRef] [PubMed]
- Annual production of plastics worldwide. Available online: https://www.statista.com/statistics/282732/global-production-of-plastics-since-1950 (accessed on 08 June 2023).
- Priority Pollutant List EPA USA, 2015. Available online: https://www.epa.gov/sites/default/files/2015-09/documents/priority-pollutant-list-epa.pdf (accessed on 8 June 2023).
- Maksimova, L.A.; Shafikova, T.N. Endogenous phthalates as a potent regulator of interspecific relationships in biocenoses. Proc. Universities. Appl. Chem. Biotechnol. 2022, 12, 424–437. [Google Scholar] [CrossRef]
- Luo, X.; Shu, S.; Feng, H.; Zou, H.; Zhang, Y. Seasonal distribution and ecological risks of phthalic acid esters in surface water of Taihu Lake, China. Sci. Total Environ. 2021, 768, 144517. [Google Scholar] [CrossRef] [PubMed]
- Xie, Z.; Ebinghaus, R.; Temme, C.; Lohmann, R.; Caba, A.; Ruck, W. Occurrence and air-sea exchange of phthalates in the Arctic. Environ Sci Technol. 2007, 41, 4555–4560. [Google Scholar] [CrossRef]
- Li, P.-H.; Jia, H.-Y.; Wang, Y.; Li, T.; Wang, L.; Li, Q.-Q.; Yang, M.-M.; Yue, J.-J.; Yi, X.-L.; Guo, L.-Q. Characterization of PM2.5-bound phthalic acid esters (PAEs) at regional background site in northern China: Long-range transport and risk assessment. Sci Total Environ. 2019, 659, 140–149. [Google Scholar] [CrossRef]
- Gorshkov, A.G.; Babenko, T.A.; Kustova, O.N.; Izosimova, O.N.; Shishlyannikov, S.M. Priority phthalates in the Lake Baikal pelagic zone and coastal area. Chem. Sustainable Develop. 2017, 25, 375–383. [Google Scholar] [CrossRef]
- Yoshioka, N.; Ueda, S.; Khodzher, T.; Bashenkaeva, N.; Korovyakova, I.; Sorokovikova, L.; Gorbunova, L. Distribution of dis- solved organic carbon in Lake Baikal and its watershed. Limnology 2002, 3, 159–168. [Google Scholar] [CrossRef]
- Samsonov, D.P.; Kochetkov, A.I.; Pasynkova, E.M.; Zapevalov, M.A. Levels of Persistent Organic Pollutants in the Components of the Lake Baikal Unique Ecosystem. Russ. Meteorol. Hydrol. 2017, 42, 345–352. [Google Scholar] [CrossRef]
- Gorshkov, A.G.; Kustova, O.V.; Izosimova, O.N.; Babenko, T.A. POPs Monitoring System in Lake Baikal—Impact of Time or the First Need? Limnol. Freshwater Biol. 2018, 1, 43–48. [Google Scholar] [CrossRef]
- Kuzmin, A.; Grigorieva, T.; Gorshkov, A. Assessment of stable carbon isotopes 13С/12С ratio in phthalates from surface waters using HPLC-HRMS-TOF approach. Environ. Sci. Pollut. Res. 2023, 30, 87734–87742. [Google Scholar] [CrossRef] [PubMed]
- European Commission Technical Guidance Document in Support of Commission Directive 93/67/EEC on Risk Assessment for New Notified Substances and Commission Regulation (EC) No. 1488/94 on Risk Assessment for Existing Substance, Part II. Brussels, Belgium, 1996.
- Bazarsadueva, S.V.; Taraskin, V.V.; Budaeva, O.D.; Nikitina, E.P.; Zhigzhitzhapova, S.V.; Shiretorova, V.G.; Bazarzhapov, T.Z.; Radnaeva, L.D. First Data on PAE Levels in Surface Water in Lakes of the Eastern Coast of Baikal. Int. J. Environ. Res. Public Health 2023, 20, 1173. [Google Scholar] [CrossRef]
- Li, R.; Liang, J.; Gong, Z.; Zhang, N.; Duan, H. Occurrence, spatial distribution, historical trend and ecological risk of phthalate esters in the Jiulong River, Southeast China. Sci. Total Environ. 2017, 580, 15–388. [Google Scholar] [CrossRef] [PubMed]
- Warnes, G.R.; Bolker, B.; Bonebakker, L.; Gentleman, R.; Liaw, W.H.A.; Lumley, T.; Maechler, M.; Magnusson, A.; Moeller, S.; Schwartz, M.; et al. Package “gplots”: Various R Programming Tools for Plotting Data, R Package Version 2.17.0; Science Open: Berlin, Germany, 2015; Available online: https://cran.r-project.org/web/packages/gplots/index.html (accessed on 24 June 2022).
- Grzymala-Busse, J.W.; Goodwin, L.K.; Grzymala-Busse, W.J.; Zheng, X. Handling missing attribute values in preterm birth data sets. In International Workshop on Rough Sets, Fuzzy Sets, Data Mining, and Granular-Soft Computing, Regina, SK, Canada, 31 August–3 September 2005; Springer: Berlin/Heidelberg, Germany, 2005; Available online: https://sci2s.ugr.es/keel/pdf/specific/congreso/grzymala_busse_goodwin05.pdf (accessed on 23 January 2022).
- Mondal, T.; Mondal, S.; Ghosh, S.-K.; Pal, P.; Soren, T.; Pandey, S.; Maiti, T.-K. Phthalates - A family of plasticizers, their health risks, phytotoxic effects, and microbial bioaugmentation approaches. Environ. Res. 2022, 214, 114059. [Google Scholar] [CrossRef] [PubMed]
- Zuev, V.Y.; Antonovich, V.V.; Belan, B.D.; Zhbanov, E.F.; Mikushev, M.K.; Panchenko, M.V.; Podanev, A.V.; Tolmachev, G.N.; Shcherbatova, A.V. The phenomenon of air circulation along the Baikal Lake depression contour. Dokl. Akad. Nauk. 1992, 325, 1146–1150. [Google Scholar]
- Argunchintseva, A.V.; Vologzhina, S.Z. Pollution of atmospheric air in the Baikal depression. Bull. Irkutsk State Univ. 2011, 4, 28–41. (in Russian). [Google Scholar]
- Cartwright, C. D, Owen, S.A.; Thompson, I.P., Burns, R.G. Biodegradation of diethyl phthalate in soil by a novel pathway. Microbiol Lett. 2000, 1, 27–34. [Google Scholar] [CrossRef]
- Guo, Y.; Kannan, K.A. Survey of Phthalates and Parabens in Personal Care Products from the United States and Its Implications for Human Exposure. Environ. Sci. Technol. 2013, 47, 14442–14449. [Google Scholar] [CrossRef]
- WHO (World Health Organization), 2004. 3rd ed. Guidelines for Drinking-water Quality vol. 1 (Geneva).21.
- Directive 2008/105/EC of the European Parliament and of the Council of 16 December 2008 on Environmental Quality Standards in the Field of Water Policy, Official Journal of the European Union.
- SanPiN, 2021, 1.2.3685-21. Hygienic Standards and Requirements to Ensure Safety and (or) Harmful for Human Environmental Factors. Available online: https://faolex.fao.org/docs/pdf/taj183394.pdf (accessed on 08 June 2023).
- IARC. Agents Classified by the IARC Monographs, Volumes 1–102; IARC: Geneva, Switzerland, 2011. [Google Scholar]
- Chernykh, E.A.; Semenov, A.A. Chemical structure of brown sugar. Separation bis-2(R)-ethylhexylphthalate. Chem. Nat. Compd. 1980, 2, 247–248. (in Russian). [Google Scholar]
- Semenov, A.A.; Enikeev, A.G.; Snetkova, L.V.; Permyakov, A.V.; Sokolova, L.A.; Dudareva, L.V. Ortophthalic acid esters in lipophilic extract from the cell culture of Aconitum baicalense Turcz ex Rapaics 1907. Doklady Biochem. Biophys. 2016, 471, 421–422. [Google Scholar] [CrossRef]
- Semenov, A.A.; Enikeev, A.G.; Babenko, T.A.; Shafikova, T.N.; Gorshkov, A.G. Phthalates – a strange delusion of ecologists. Their. Appl. Ecology. 2021, 1, 16–21. [Google Scholar] [CrossRef]
- Lertsirisopon, R.; Soda, S.; Sei, K.; Ike, M. Abiotic degradation of four phthalic acid esters in aqueous phase under natural sunlight irradiation. J. Environ. Sci. 2009, 21, 285–290. [Google Scholar] [CrossRef]
- Le, T.M.; Nguyen, H.M.N.; Nguyen, V.K.; Nguyen, A.V.; Vu, N.D.; Yen, N.T.H.; Hoang, A.Q.; Minh, T.B.; Kannan, K.; Tran, T.M. Profiles of phthalic acid esters (PAEs) in bottled water, tap water, lake water, and wastewater samples collected from Hanoi, Vietnam. Sci. Total Environ. 2021, 788, 147831. [Google Scholar] [CrossRef]
- Nantaba, F.; Pa, W.-U.; Wassw, J.; Bouwman, H.; Kylin, H.; Kümmerer, K. Temporal dynamics and ecotoxicological risk assessment of personal care products, phthalate ester plasticizers, and organophosphorus flame retardants in water from Lake Victoria, Uganda. Chemosphere 2021, 262, 127716. [Google Scholar] [CrossRef] [PubMed]
- Ren, J.-N.; Zhu, N.-Z.; Meng, X.-Z.; Gao, C.-J.; Li, K.; Jin, L.-M.; Shang, T.-T.; Ai, F.-T.; Cai, M.-H.; Zhao, J.-F. Occurrence and ecological risk assessment of 16 phthalates in surface water of the mainstream of the Yangtze River, China. Environ. Sci. Pollut. Res. 2023, 30, 66936–66946. [Google Scholar] [CrossRef] [PubMed]
- Yang, Q.; Huang, X.; Wen, Z.; Shang, Y.; Wang, X.; Fang, C.; Song, K. Evaluating the spatial distribution and source of phthalate esters in the surface water of Xingkai Lake, China during summer. J. Great Lakes Res. 2021, 47, 437–446. [Google Scholar] [CrossRef]
- Lee, Y.-M.; Lee, J.-E.; Choe, W.; Kim, T..; Lee, J.-Y.; Kho, Y.; Choi, K.; Zoh, K.-D. Distribution of phthalate esters in air, water, sediments, and fish in the Asan Lake of Korea. Environ. Intern. 2019, 126, 635–643. [Google Scholar] [CrossRef] [PubMed]
- Zheng, X.; Zhang, B.-T.; Teng, Y. Distribution of phthalate acid esters in lakes of Beijing and its relationship with anthropogenic activities. Sci Total Environ. 2014, 476–477, 107–113. [Google Scholar] [CrossRef]
- Zhang, Z.-M.; Zhang, H.-H.; Li, J.-L.; Yang, G.-P. Determination of Phthalic Acid Esters in Seawater and Sediment by Solid-phase Microextraction and Gas Chromatography-Mass Spectrometry. Chin J Anal Chem. 2017, 45, 348–356. [Google Scholar] [CrossRef]
Figure 1.
Map of Lake Baikal and sampling sites. ● – Pelagic zone, at the stations 1, 2, 4, 5, 7, 8, 9, 11, 12, 14, 15, 16, and 18, sampling was carried out from the upper water layer (5 m) at a distance of up to 3 km from the coast; at the station 3, 6, 8, 10, 13, and 17 at reference central stations; at the station 6 from the water column at depths of 5 to 1200 m; at the station 10 from the water column at depths of 5 to 1600 m; at the station 17 – from the water column at depths of 5 to 800 m; ♦ - Coastal zone, at the stations 22-29, 35; ▲ - Rivers mouths, at the stations: 30 (Tompuda R.), 31 (Mysovka R), 32 (Snezhnaya R.), 33 (Solzan R.), 34 (Pokhabikha R).

Figure 2.
Mass fragmentograms: (a) Analytes Mix 3 (Dr. Ehrenstorfer Reference Material); (b) Extract of the upper layer of Baikal water (5 m). Peaks Nos (m/z): 1 – DMP (163); 2 – DEP (149); 3 – benzoic acid benzyl ester (105); 4 – DiBP (149); 5 – DnBP (149); 6 – di-methyl glycol ester (59); 7 – di-4-methyl-2-pentyl ester, 2 isomers (149); 8 – di-2-ethoxyethyl ester (72); 9 – di-n-pentyl ester (149); 10 – di-hexyl ester (149); 11 – BBP (149); 12 – hexyl-2-ethylhexyl ester (149); 13 – di-2-n-butoxyethyl ester (57); 14 – di-cyclohexyl ester (149); 15 – DEHP (149); 16 – DOP (149); 17 – di-nonyl ester (149).
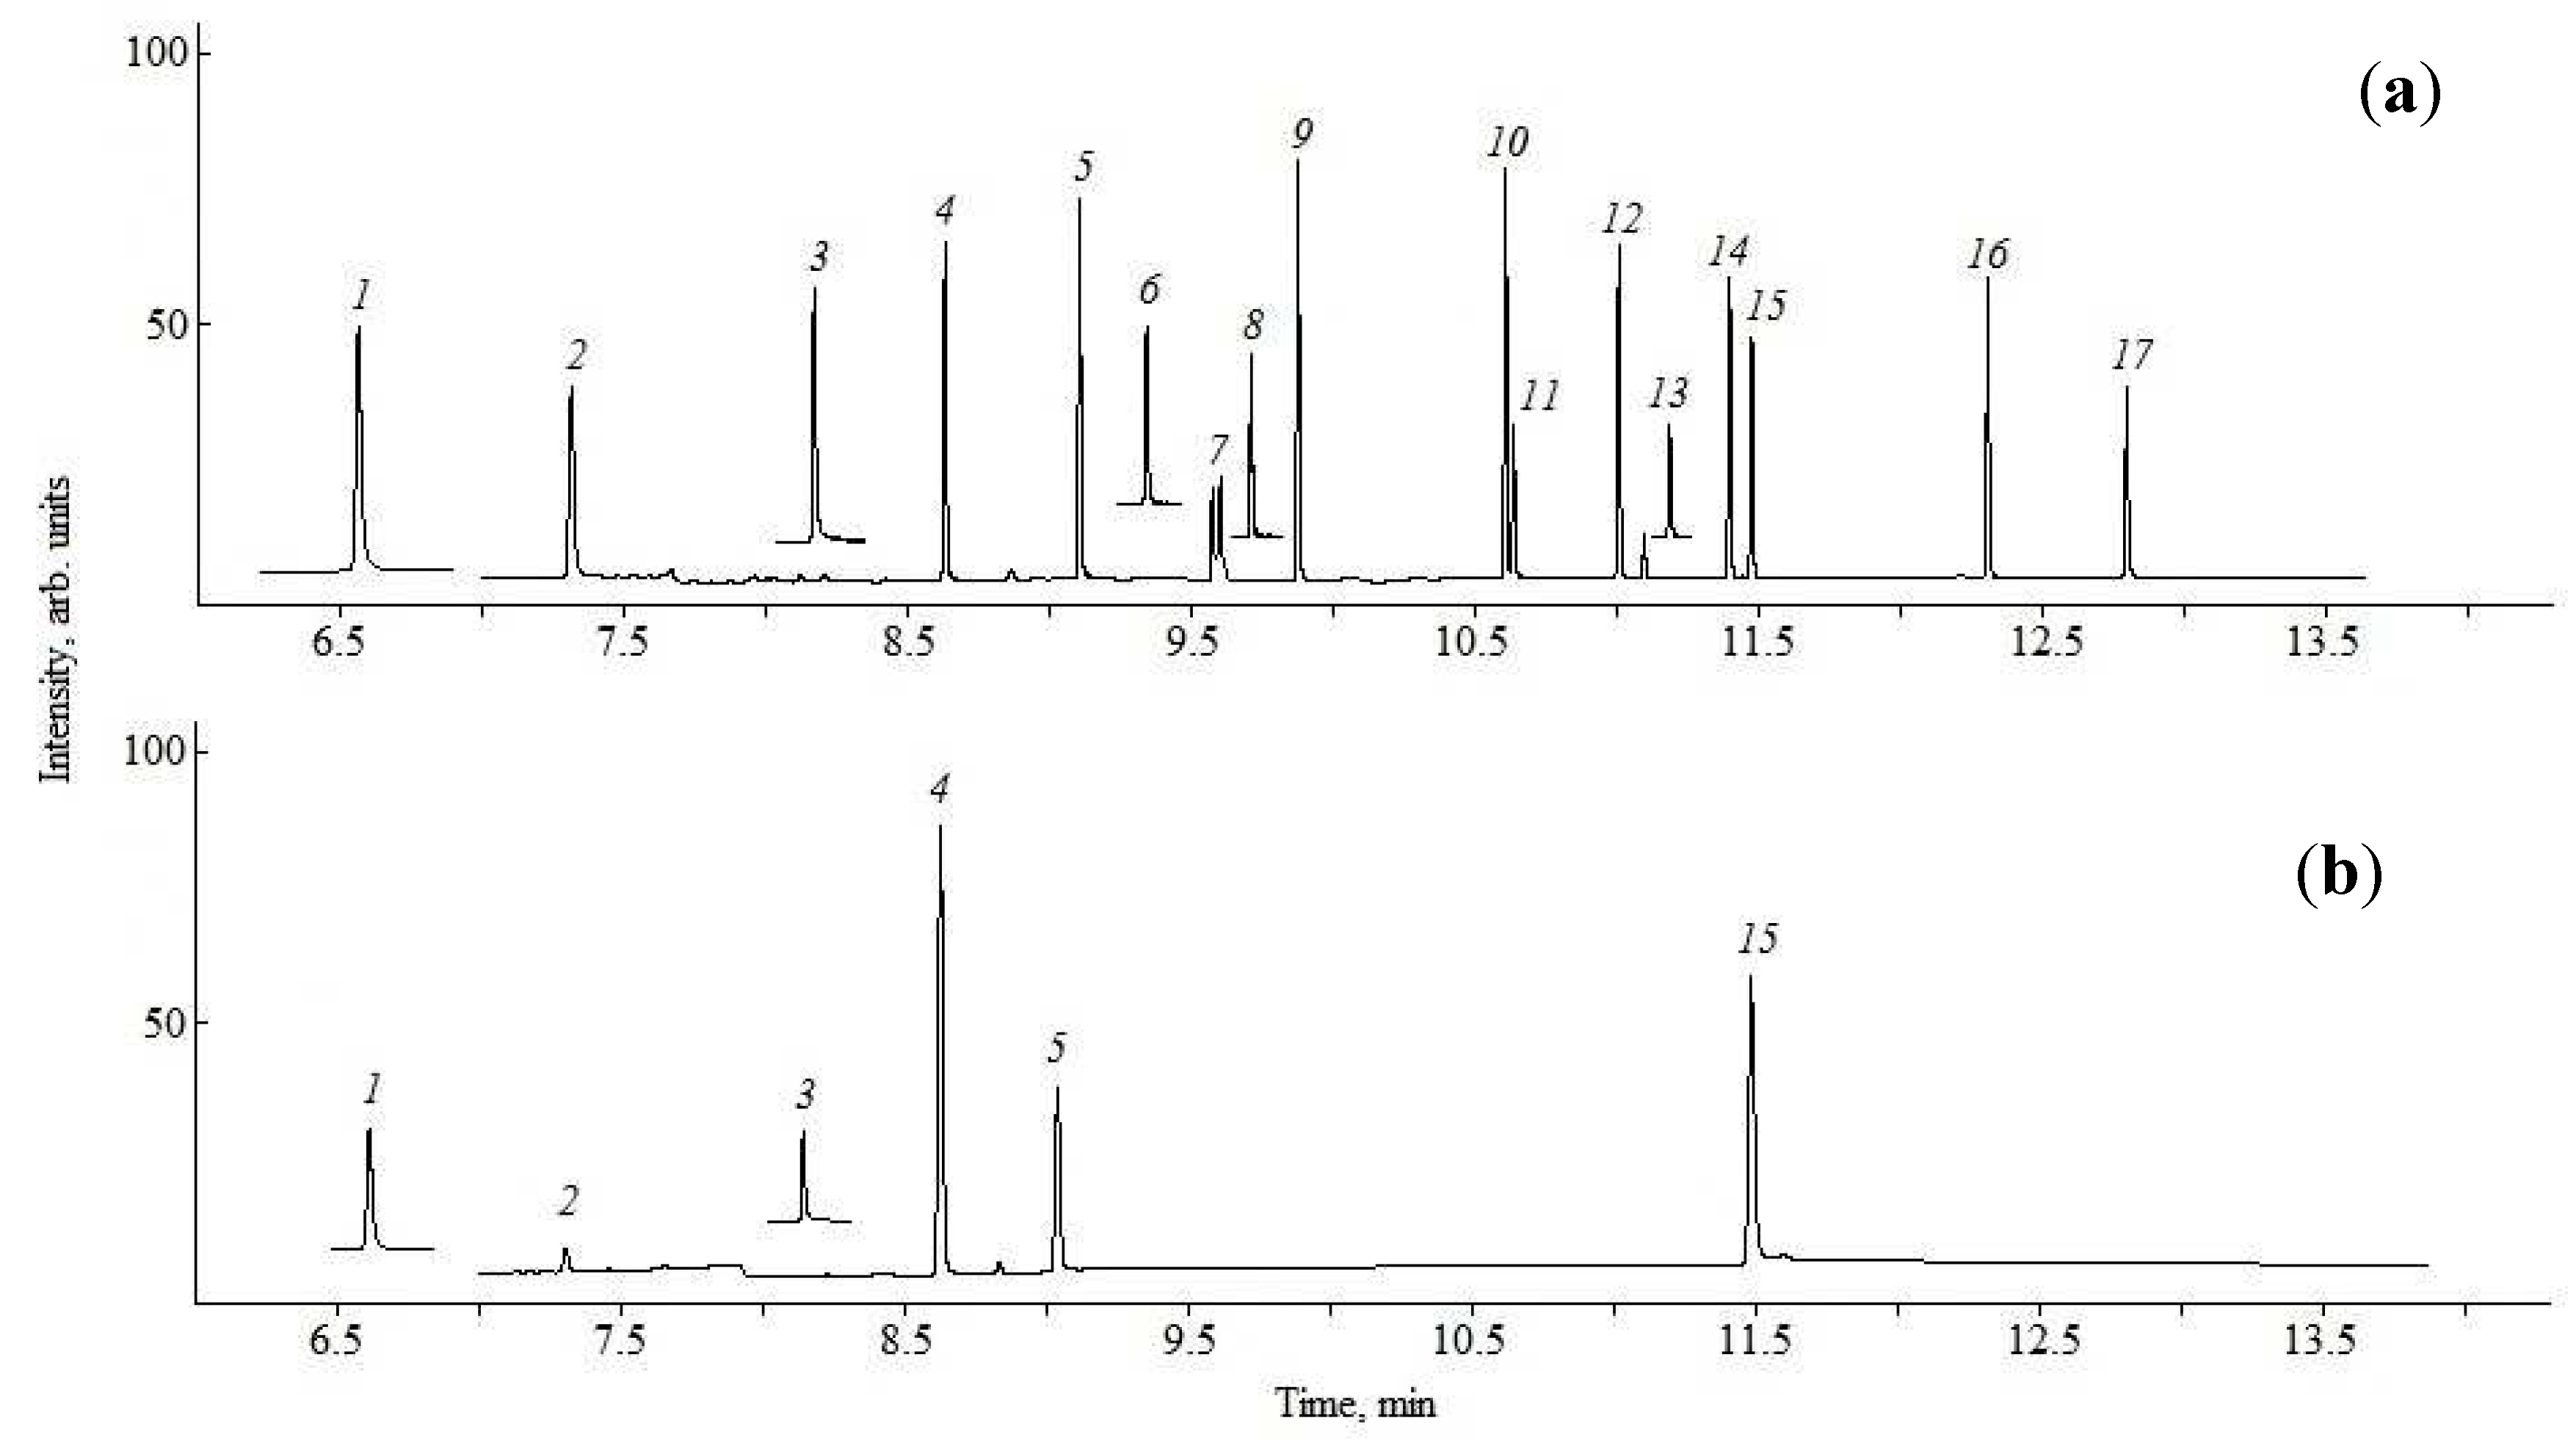
Figure 3.
Heatmaps reflecting values of correlation coefficients between the results of determination of PAEs concentrations in parallel samples (PAE1, PAE2) collected at the same station and calculated average value (PAEm).
Figure 3.
Heatmaps reflecting values of correlation coefficients between the results of determination of PAEs concentrations in parallel samples (PAE1, PAE2) collected at the same station and calculated average value (PAEm).
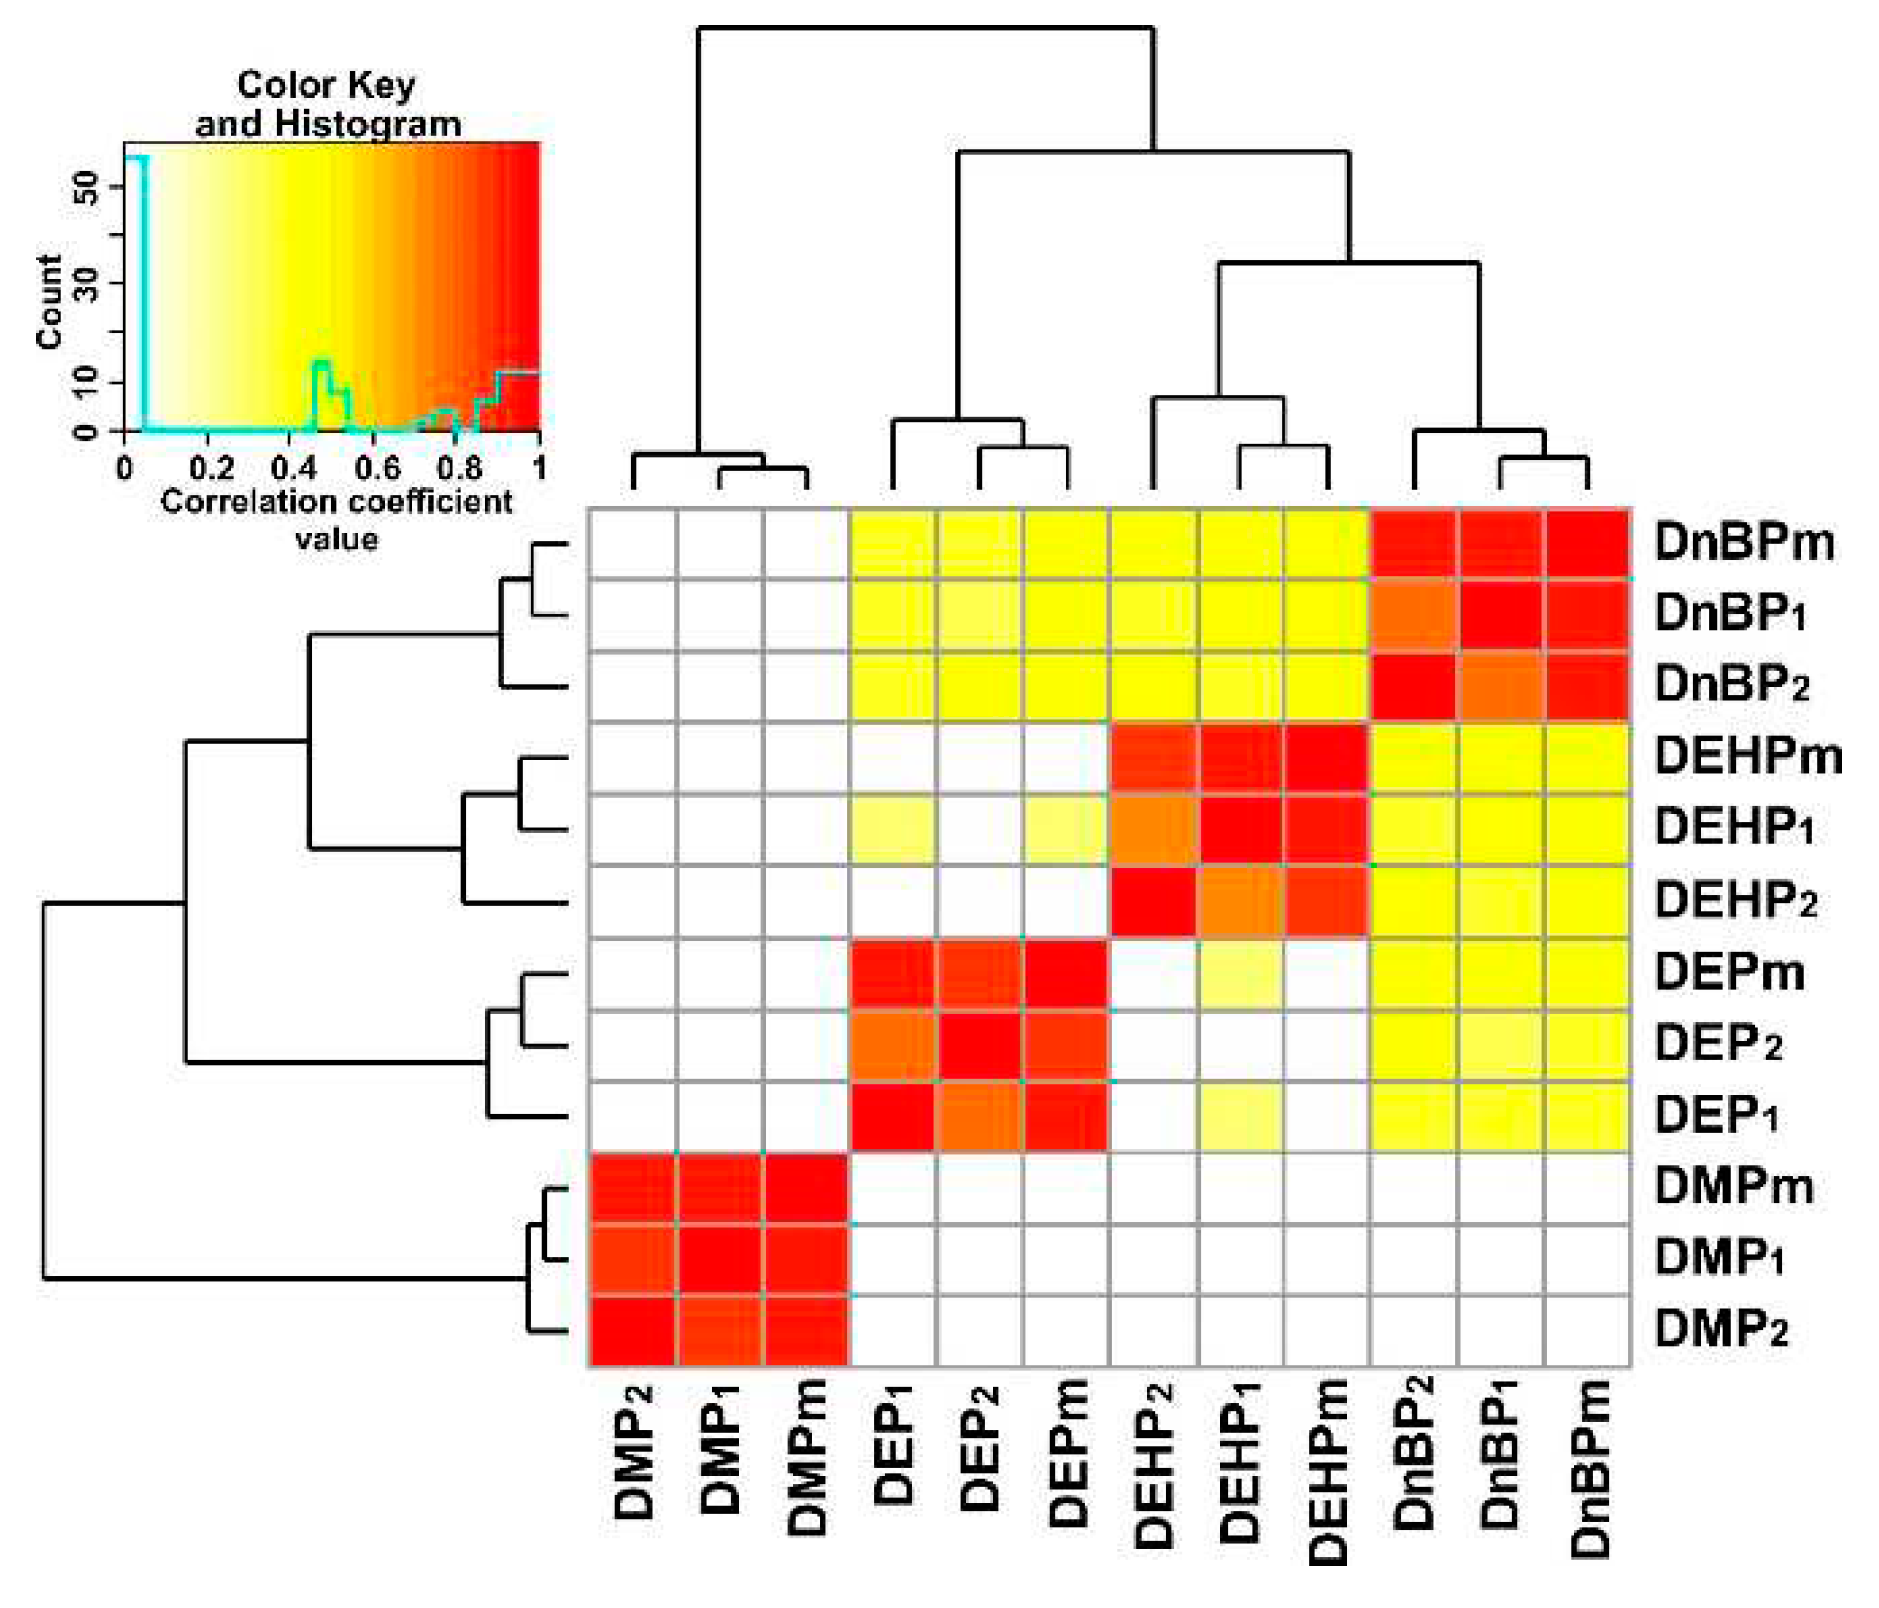
Figure 4.
Average concentration levels of priority PAEs for the period of their monitoring in Lake Baikal in 2015-2022: (a) – Seasonal distribution of concentrations of PAEs:  - spring,
  - autumn; (b) – Interannual distribution of concentrations of PAEs:
  – DMP;
  – DEP;
  – DnBP;
  – – DEHP; (c) – Distribution of concentrations of PAEs, central zone – other areas:
  – centrale zone;
  – other areas. Confidence intervals for average values are calculated using bootstrap method..
- spring, - autumn; (b) – Interannual distribution of concentrations of PAEs: – DMP; – DEP; – DnBP; – – DEHP; (c) – Distribution of concentrations of PAEs, central zone – other areas: – centrale zone; – other areas. Confidence intervals for average values are calculated using bootstrap method..
Figure 4.
Average concentration levels of priority PAEs for the period of their monitoring in Lake Baikal in 2015-2022: (a) – Seasonal distribution of concentrations of PAEs: - spring, - autumn; (b) – Interannual distribution of concentrations of PAEs: – DMP; – DEP; – DnBP; – – DEHP; (c) – Distribution of concentrations of PAEs, central zone – other areas: – centrale zone; – other areas. Confidence intervals for average values are calculated using bootstrap method..
- spring, - autumn; (b) – Interannual distribution of concentrations of PAEs: – DMP; – DEP; – DnBP; – – DEHP; (c) – Distribution of concentrations of PAEs, central zone – other areas: – centrale zone; – other areas. Confidence intervals for average values are calculated using bootstrap method..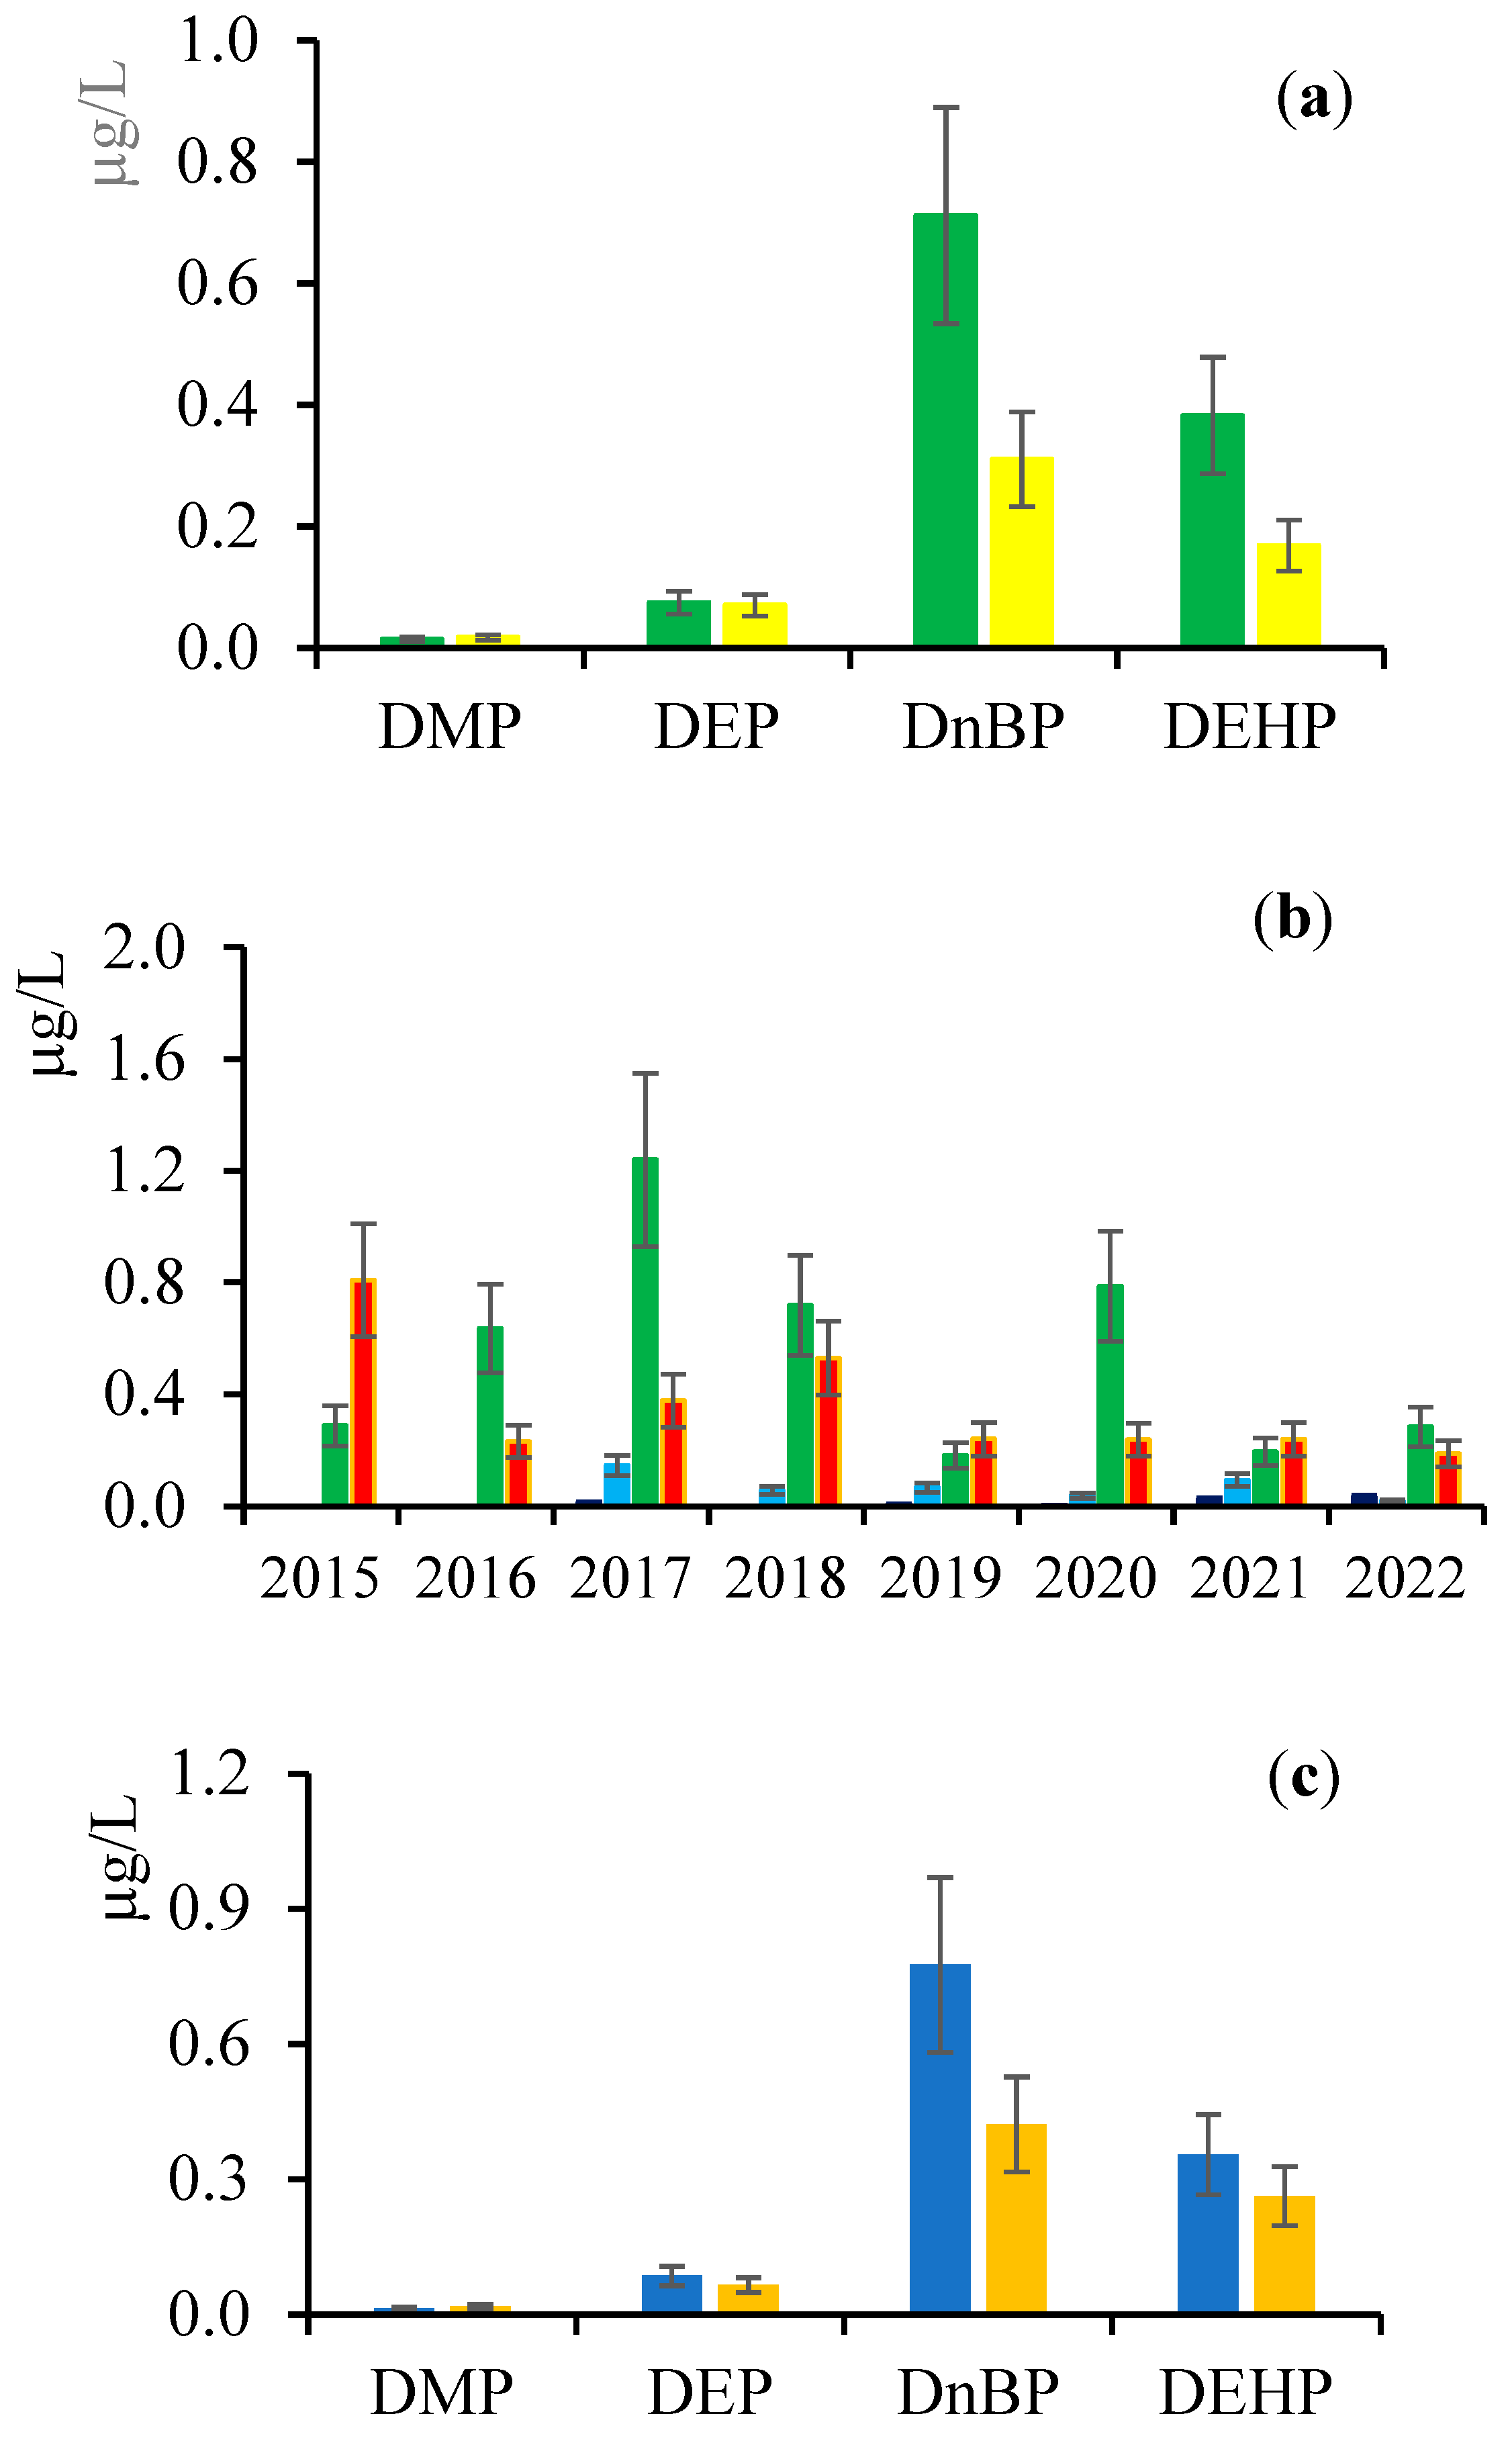
Figure 5.
Mean concentrations of PAEs at deep horizons of Central Baikal water column, St. 10: (a) spring; (b) autumn.  – Ʃ4PAEs,
  - DEP,
  – DnBP,
  –DEHP.
– Ʃ4PAEs, - DEP, – DnBP, –DEHP.
Figure 5.
Mean concentrations of PAEs at deep horizons of Central Baikal water column, St. 10: (a) spring; (b) autumn. – Ʃ4PAEs, - DEP, – DnBP, –DEHP.
– Ʃ4PAEs, - DEP, – DnBP, –DEHP.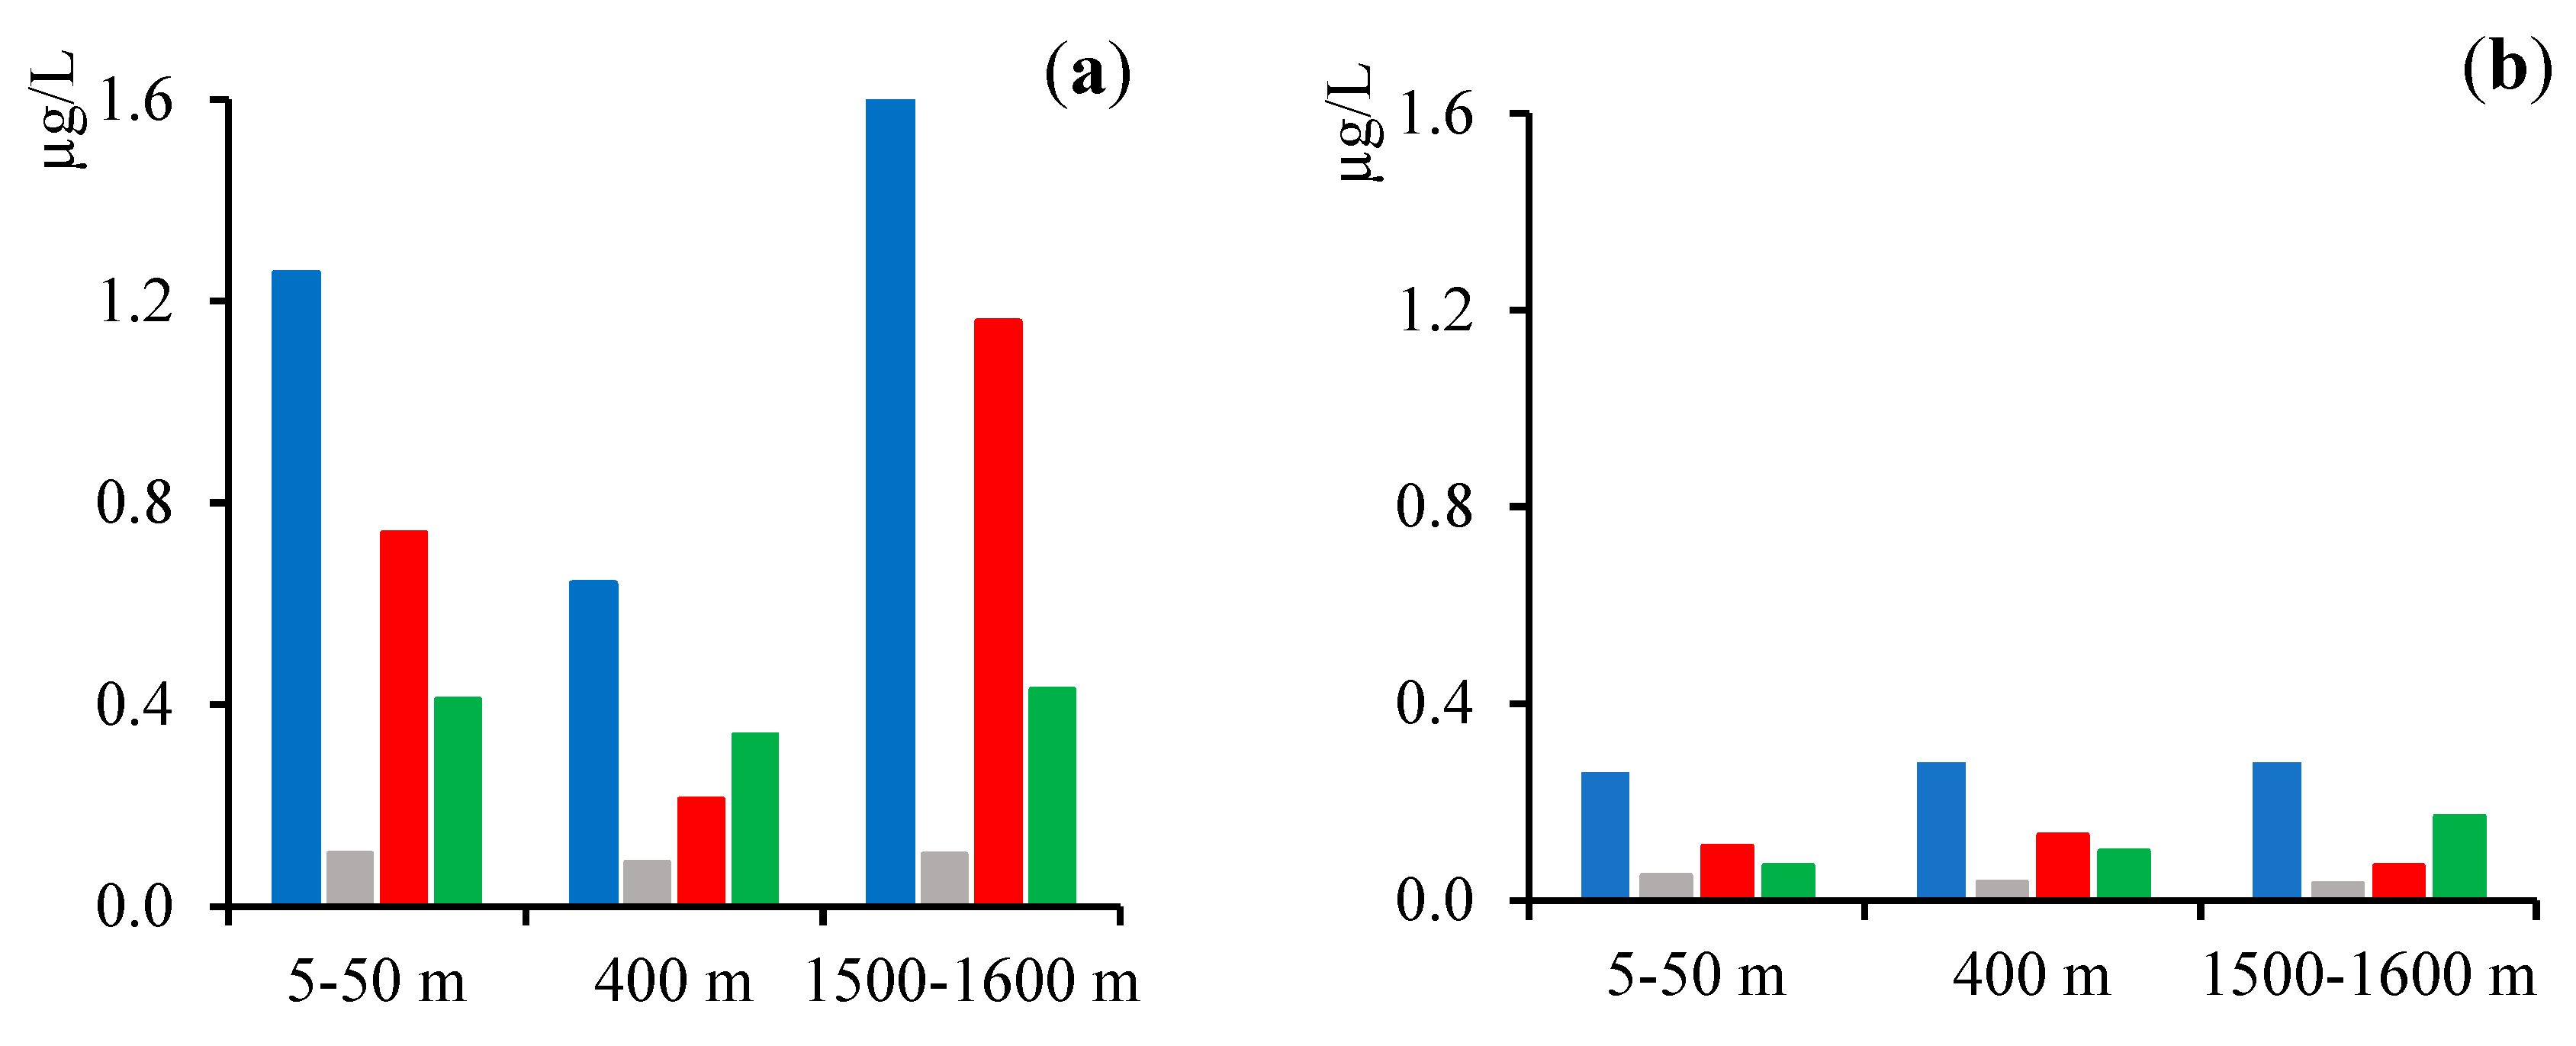
Table 1.
Results of statistical analysis of data of PAEs monitoring in Lake Baikal, PERMANOVA method.
Table 1.
Results of statistical analysis of data of PAEs monitoring in Lake Baikal, PERMANOVA method.
| Factor | R2 value | P value |
| Year (2015 - 2022) | 0.0428 | 0.0009 |
| Season (spring, autumn) | 0.0348 | 0.0009 |
| Ecotope (pelagic, сoastal, bay, river) | 0.0237 | 0.0049 |
| Sampling site (central zone or other) | 0.0224 | 0.0009 |
| Basin (southern, central, northern) | 0.0067 | 0.2297 |
| Sample points | 0.0024 | 0.2437 |
Disclaimer/Publisher’s Note: The statements, opinions and data contained in all publications are solely those of the individual author(s) and contributor(s) and not of MDPI and/or the editor(s). MDPI and/or the editor(s) disclaim responsibility for any injury to people or property resulting from any ideas, methods, instructions or products referred to in the content. |
© 2023 by the authors. Licensee MDPI, Basel, Switzerland. This article is an open access article distributed under the terms and conditions of the Creative Commons Attribution (CC BY) license (http://creativecommons.org/licenses/by/4.0/).
Copyright: This open access article is published under a Creative Commons CC BY 4.0 license, which permit the free download, distribution, and reuse, provided that the author and preprint are cited in any reuse.


